Embed Size (px)
Citation preview
This document was prepared by Axon Consulting for the use of the client to whom it is addressed. No part of it may be copied or reused in any way without our prior written consent.
Assessment of the cost of providing wholesale roaming services and mobile voice termination in the EU/EEA countries – SMART 2017/0091
Presentation of the model’s results
28 May 2019
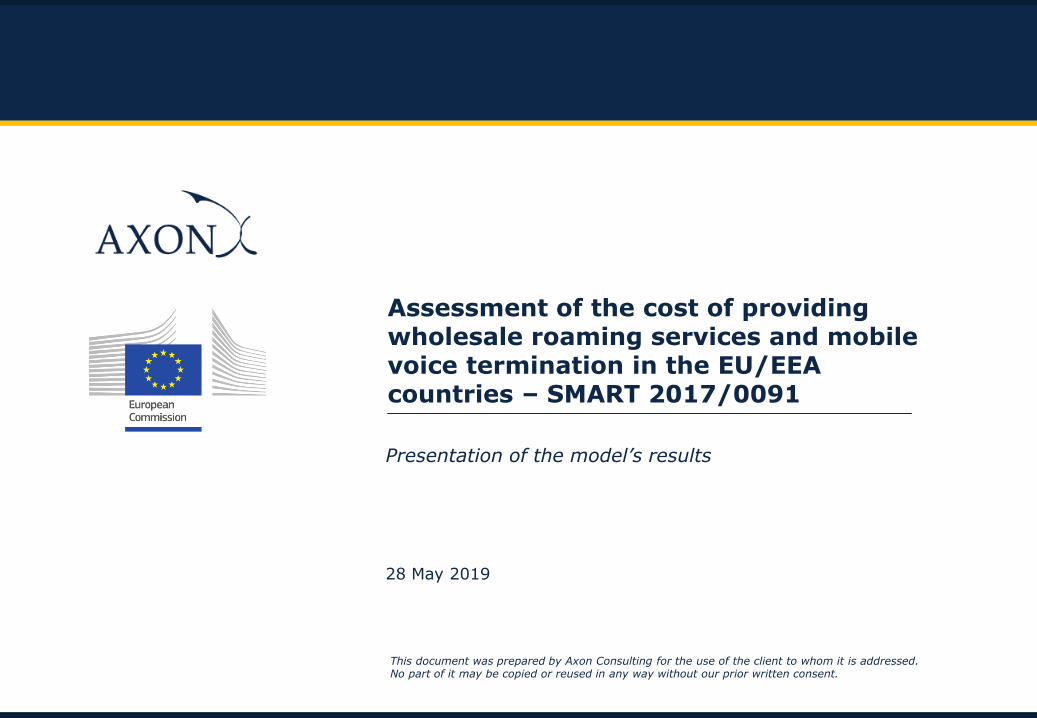
A Bottom-Up model is a techno-economic tool that calculates service provisioning costs under a given methodology
2
Bottom-Up model architecture
LRIC Calculation Module
Cost Annualization Module
Resources Costing (CAPEX & OPEX)
DIMENSIONING MODULE
Geotype Dependent Geotype Independent
RAN GSM
RAN UMTS
RAN LTE
Sites and Backhaul
Dimensioning
Core Network&
Backbone
DIMENSIONING DRIVERS
Results: Network costs by service
Bottom-Up LRICModel
architecture
Geo
grap
hic
al
Data
, C
overag
e a
nd
Sp
ectr
um
Demand
Calculation of Joint and Common costs
A Bottom-Up model does:
✓ Produce a reasonable approximation to the
network a reference operator would need to
satisfy its coverage and capacity constraints.
✓ Produce a reasonable approximation of the
costs such an operator would bear.
✓ Provide service-level results under different
scenarios.
A Bottom-Up model does not:
×Replace MNOs radio-access engineering
models
×Aim at replicating the operational or financial
realities of any given operator
×Compare with other models developed under
different methodological frameworks
2nd Consultation Round
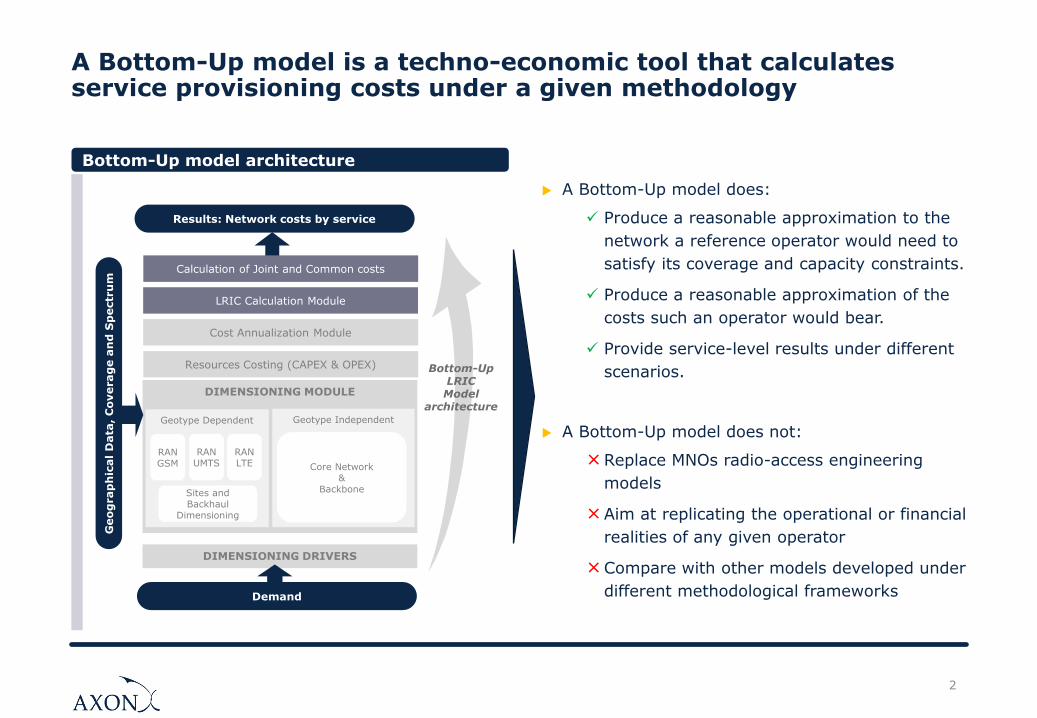
All the figures presented in this session are the result of the 3rd
version of the model, fine-tuned thanks to stakeholders’ feedback
3
October ’18
December ’18
November ’18
January ’19
February ’19
March ’19
1st Consultation Round
April ’19
May ’19
1st version of the model
2nd version of the model
3rd version of the model
The model has been subject to two public
consultation rounds with the industry.
Broad participation was registered in both
consultations, with valuable feedback
received that helped us to further improve
the accuracy of the results achieved.
The results presented in this session have
been extracted from the 3rd (and final)
version of the model, which incorporates a
number of improvements based on the
feedback received in the second consultation
round.
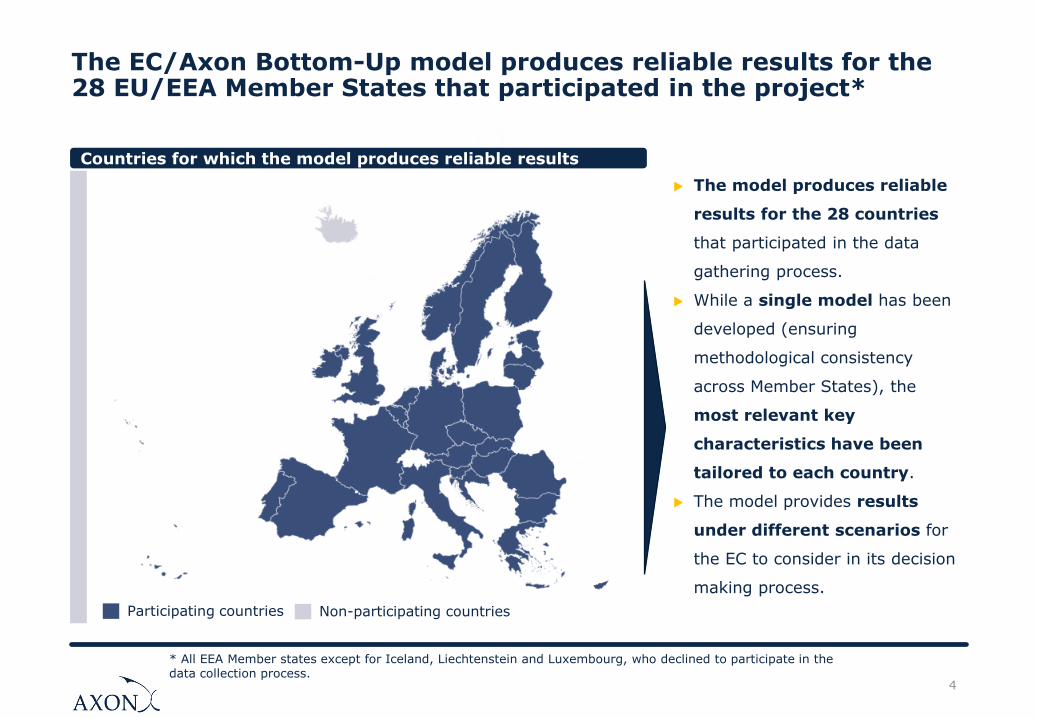
The EC/Axon Bottom-Up model produces reliable results for the28 EU/EEA Member States that participated in the project*
4
* All EEA Member states except for Iceland, Liechtenstein and Luxembourg, who declined to participate in the data collection process.
Countries for which the model produces reliable results
The model produces reliable
results for the 28 countries
that participated in the data
gathering process.
While a single model has been
developed (ensuring
methodological consistency
across Member States), the
most relevant key
characteristics have been
tailored to each country.
The model provides results
under different scenarios for
the EC to consider in its decision
making process.
Participating countries Non-participating countries
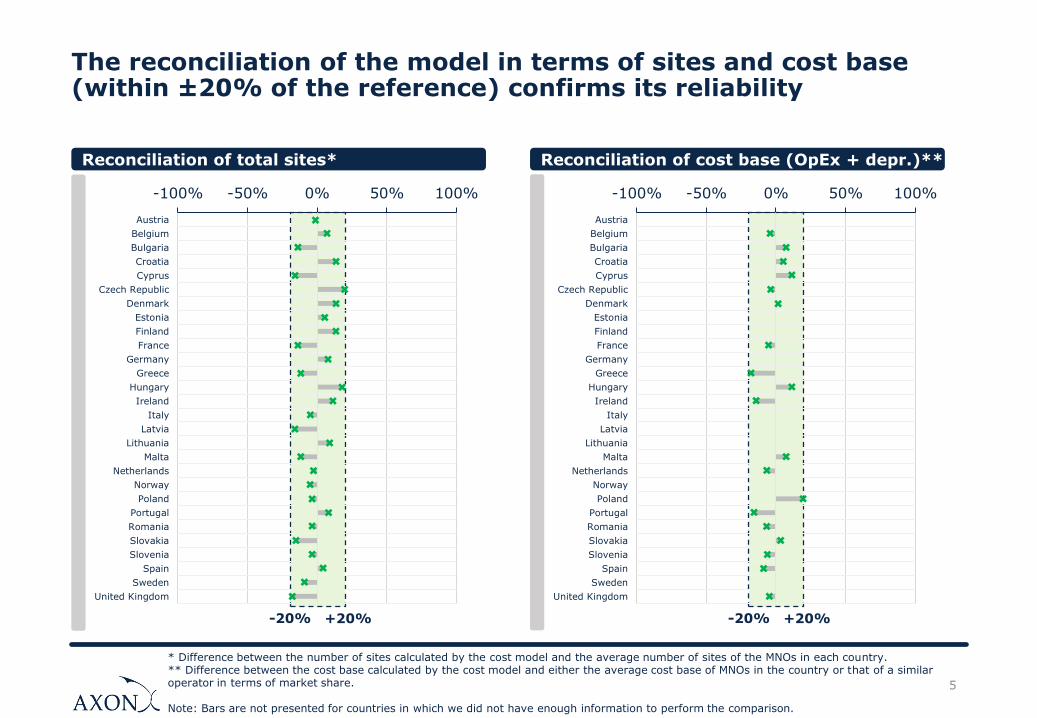
The reconciliation of the model in terms of sites and cost base (within ±20% of the reference) confirms its reliability
5
-100% -50% 0% 50% 100%
Austria
Belgium
Bulgaria
Croatia
Cyprus
Czech Republic
Denmark
Estonia
Finland
France
Germany
Greece
Hungary
Ireland
Italy
Latvia
Lithuania
Malta
Netherlands
Norway
Poland
Portugal
Romania
Slovakia
Slovenia
Spain
Sweden
United Kingdom
Reconciliation of total sites*
+20%-20%
-100% -50% 0% 50% 100%
Austria
Belgium
Bulgaria
Croatia
Cyprus
Czech Republic
Denmark
Estonia
Finland
France
Germany
Greece
Hungary
Ireland
Italy
Latvia
Lithuania
Malta
Netherlands
Norway
Poland
Portugal
Romania
Slovakia
Slovenia
Spain
Sweden
United Kingdom
Reconciliation of cost base (OpEx + depr.)**
+20%-20%
* Difference between the number of sites calculated by the cost model and the average number of sites of the MNOs in each country.** Difference between the cost base calculated by the cost model and either the average cost base of MNOs in the country or that of a similar operator in terms of market share.
Note: Bars are not presented for countries in which we did not have enough information to perform the comparison.
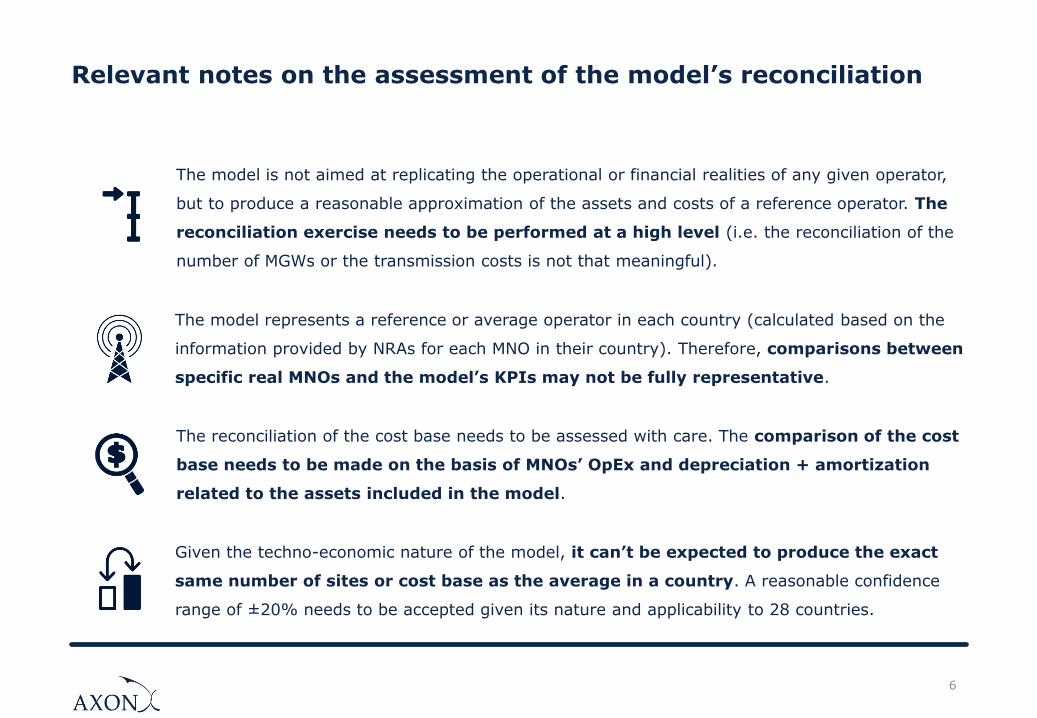
Relevant notes on the assessment of the model’s reconciliation
6
The model is not aimed at replicating the operational or financial realities of any given operator,
but to produce a reasonable approximation of the assets and costs of a reference operator. The
reconciliation exercise needs to be performed at a high level (i.e. the reconciliation of the
number of MGWs or the transmission costs is not that meaningful).
The model represents a reference or average operator in each country (calculated based on the
information provided by NRAs for each MNO in their country). Therefore, comparisons between
specific real MNOs and the model’s KPIs may not be fully representative.
The reconciliation of the cost base needs to be assessed with care. The comparison of the cost
base needs to be made on the basis of MNOs’ OpEx and depreciation + amortization
related to the assets included in the model.
Given the techno-economic nature of the model, it can’t be expected to produce the exact
same number of sites or cost base as the average in a country. A reasonable confidence
range of ±20% needs to be accepted given its nature and applicability to 28 countries.
7
2. Results for Data Roaming services
3. Results for Voice Roaming services
4. Results for Voice Call Termination services
1. Definition of scenarios
5. Results for SMS roaming services
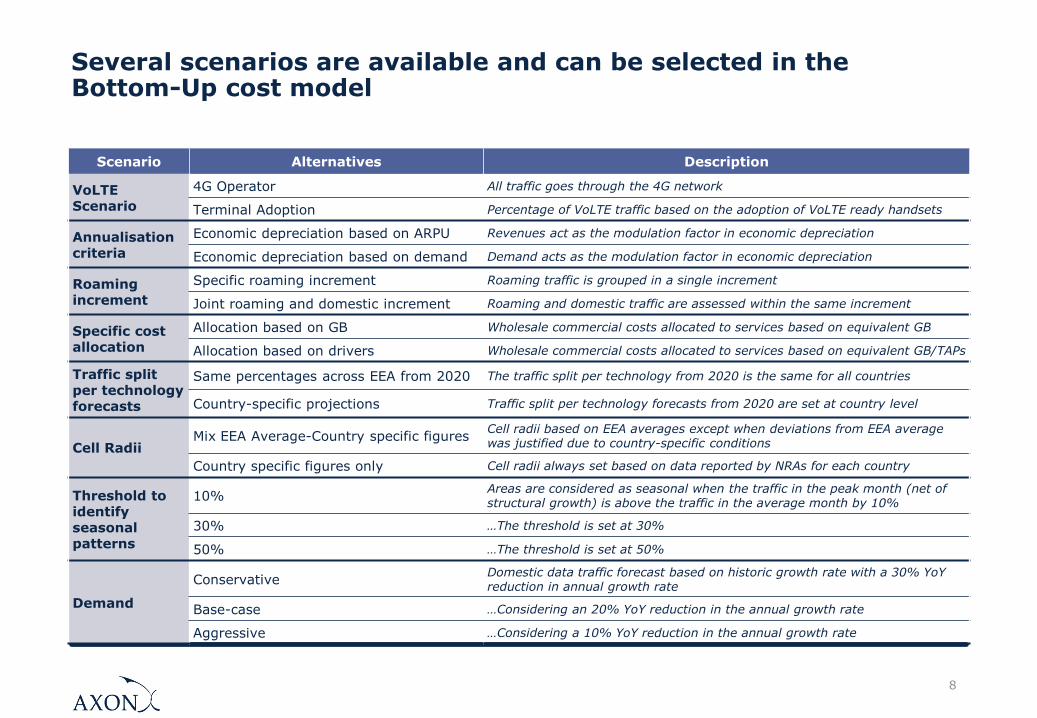
Several scenarios are available and can be selected in the Bottom-Up cost model
8
Scenario Alternatives Description
VoLTE Scenario
4G Operator All traffic goes through the 4G network
Terminal Adoption Percentage of VoLTE traffic based on the adoption of VoLTE ready handsets
Annualisationcriteria
Economic depreciation based on ARPU Revenues act as the modulation factor in economic depreciation
Economic depreciation based on demand Demand acts as the modulation factor in economic depreciation
Roaming increment
Specific roaming increment Roaming traffic is grouped in a single increment
Joint roaming and domestic increment Roaming and domestic traffic are assessed within the same increment
Specific cost allocation
Allocation based on GB Wholesale commercial costs allocated to services based on equivalent GB
Allocation based on drivers Wholesale commercial costs allocated to services based on equivalent GB/TAPs
Traffic split per technology forecasts
Same percentages across EEA from 2020 The traffic split per technology from 2020 is the same for all countries
Country-specific projections Traffic split per technology forecasts from 2020 are set at country level
Cell RadiiMix EEA Average-Country specific figures
Cell radii based on EEA averages except when deviations from EEA average was justified due to country-specific conditions
Country specific figures only Cell radii always set based on data reported by NRAs for each country
Threshold to identify seasonal patterns
10%Areas are considered as seasonal when the traffic in the peak month (net of structural growth) is above the traffic in the average month by 10%
30% …The threshold is set at 30%
50% …The threshold is set at 50%
Demand
ConservativeDomestic data traffic forecast based on historic growth rate with a 30% YoY reduction in annual growth rate
Base-case …Considering an 20% YoY reduction in the annual growth rate
Aggressive …Considering a 10% YoY reduction in the annual growth rate
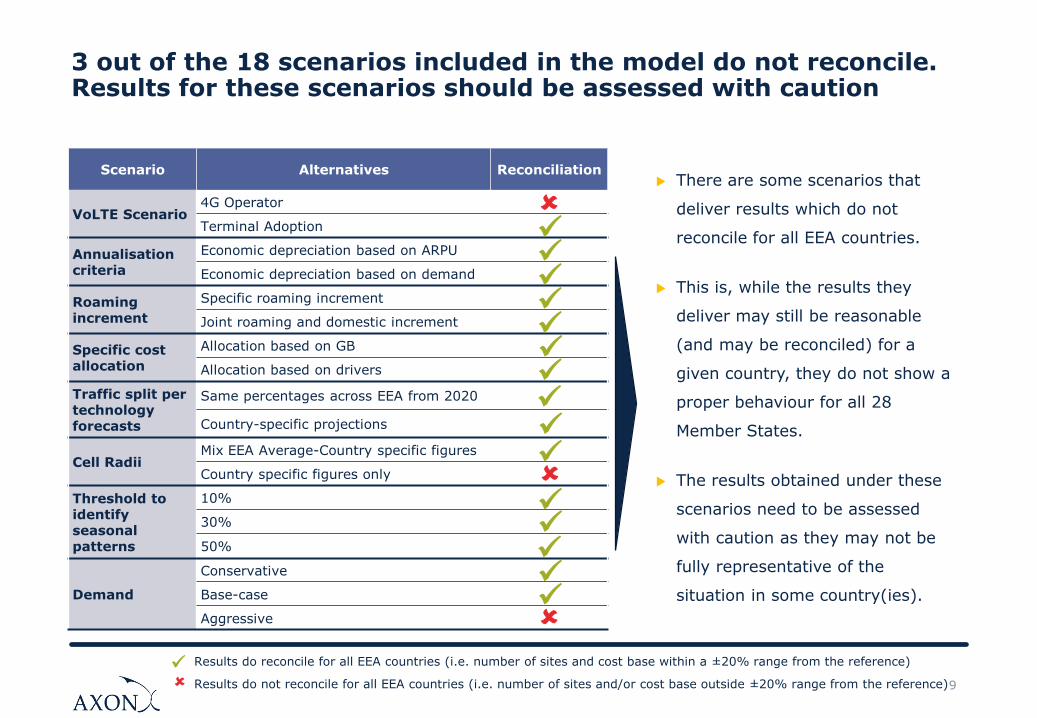
3 out of the 18 scenarios included in the model do not reconcile. Results for these scenarios should be assessed with caution
9
Scenario Alternatives Reconciliation
VoLTE Scenario4G Operator
Terminal Adoption
Annualisationcriteria
Economic depreciation based on ARPU
Economic depreciation based on demand
Roaming increment
Specific roaming increment
Joint roaming and domestic increment
Specific cost allocation
Allocation based on GB
Allocation based on drivers
Traffic split per technology forecasts
Same percentages across EEA from 2020
Country-specific projections
Cell RadiiMix EEA Average-Country specific figures
Country specific figures only
Threshold to identify seasonal patterns
10%
30%
50%
Demand
Conservative
Base-case
Aggressive
✓
✓
✓
✓
✓
✓
✓
✓
✓
✓
✓✓
✓
✓
✓
✓ Results do reconcile for all EEA countries (i.e. number of sites and cost base within a ±20% range from the reference)
Results do not reconcile for all EEA countries (i.e. number of sites and/or cost base outside ±20% range from the reference)
There are some scenarios that
deliver results which do not
reconcile for all EEA countries.
This is, while the results they
deliver may still be reasonable
(and may be reconciled) for a
given country, they do not show a
proper behaviour for all 28
Member States.
The results obtained under these
scenarios need to be assessed
with caution as they may not be
fully representative of the
situation in some country(ies).
10
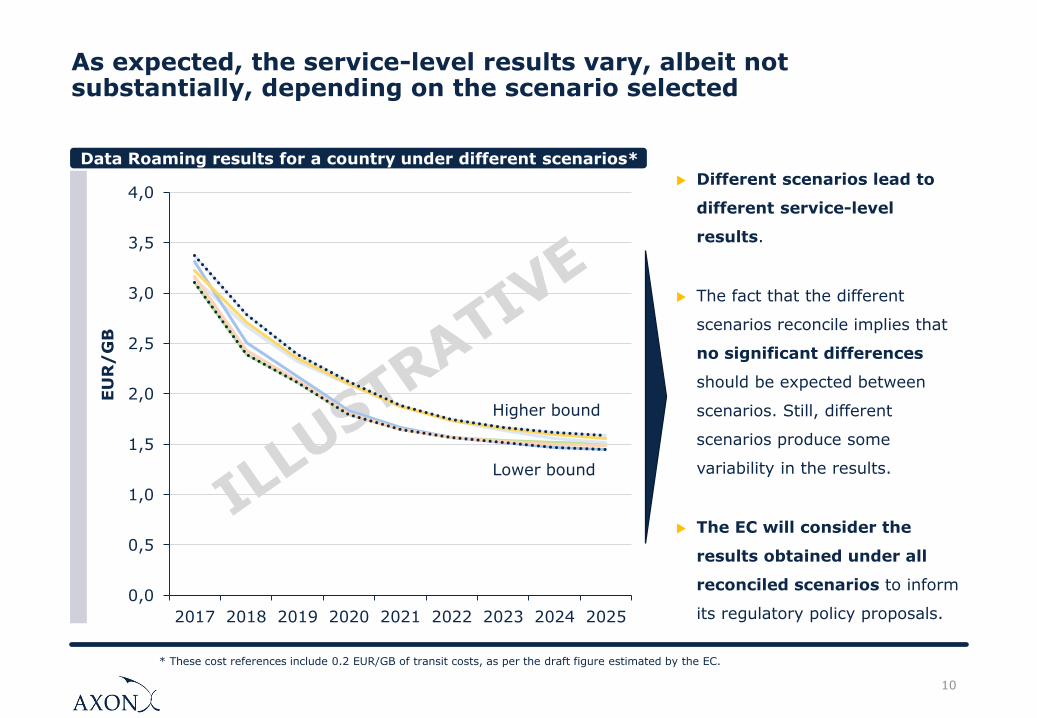
As expected, the service-level results vary, albeit not substantially, depending on the scenario selected
Data Roaming results for a country under different scenarios*
Different scenarios lead to
different service-level
results.
The fact that the different
scenarios reconcile implies that
no significant differences
should be expected between
scenarios. Still, different
scenarios produce some
variability in the results.
The EC will consider the
results obtained under all
reconciled scenarios to inform
its regulatory policy proposals.0,0
0,5
1,0
1,5
2,0
2,5
3,0
3,5
4,0
2017 2018 2019 2020 2021 2022 2023 2024 2025
EU
R/
GB
Higher bound
Lower bound
* These cost references include 0.2 EUR/GB of transit costs, as per the draft figure estimated by the EC.
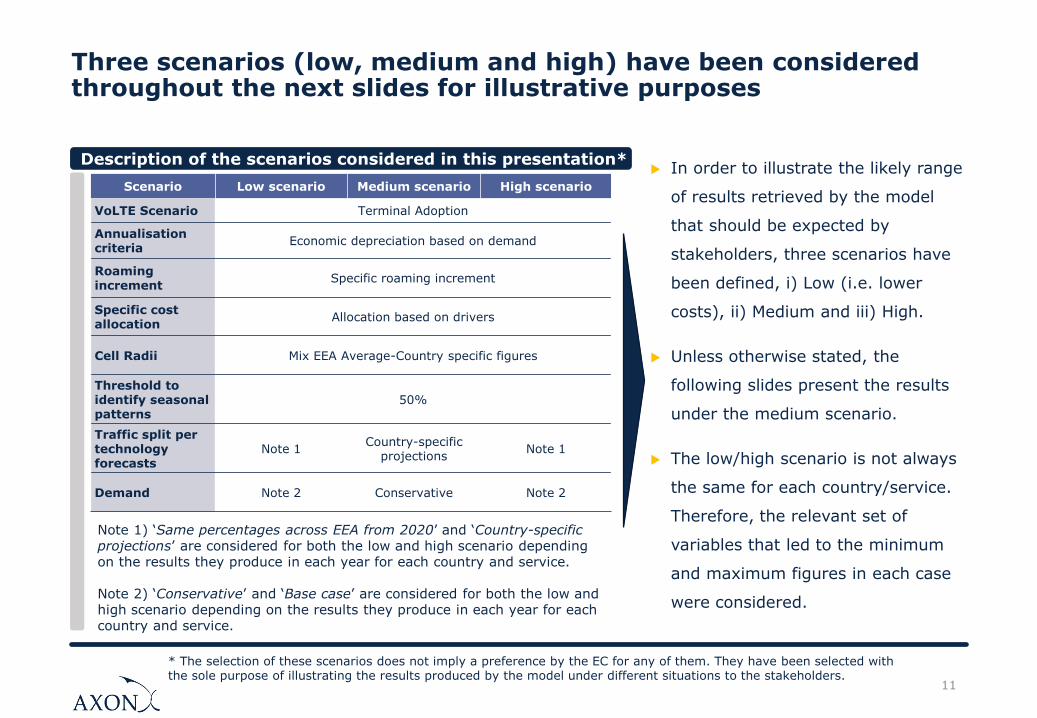
Three scenarios (low, medium and high) have been considered throughout the next slides for illustrative purposes
In order to illustrate the likely range
of results retrieved by the model
that should be expected by
stakeholders, three scenarios have
been defined, i) Low (i.e. lower
costs), ii) Medium and iii) High.
Unless otherwise stated, the
following slides present the results
under the medium scenario.
The low/high scenario is not always
the same for each country/service.
Therefore, the relevant set of
variables that led to the minimum
and maximum figures in each case
were considered.
Scenario Low scenario Medium scenario High scenario
VoLTE Scenario Terminal Adoption
Annualisationcriteria
Economic depreciation based on demand
Roaming increment
Specific roaming increment
Specific cost allocation
Allocation based on drivers
Cell Radii Mix EEA Average-Country specific figures
Threshold to identify seasonal patterns
50%
Traffic split per technology forecasts
Note 1Country-specific
projectionsNote 1
Demand Note 2 Conservative Note 2
Description of the scenarios considered in this presentation*
* The selection of these scenarios does not imply a preference by the EC for any of them. They have been selected with the sole purpose of illustrating the results produced by the model under different situations to the stakeholders.
11
Note 1) ‘Same percentages across EEA from 2020’ and ‘Country-specific projections’ are considered for both the low and high scenario depending on the results they produce in each year for each country and service.
Note 2) ‘Conservative’ and ‘Base case’ are considered for both the low and high scenario depending on the results they produce in each year for each country and service.
12
2. Results for Data Roaming services
3. Results for Voice Roaming services
4. Results for Voice Call Termination services
1. Definition of scenarios
5. Results for SMS roaming services
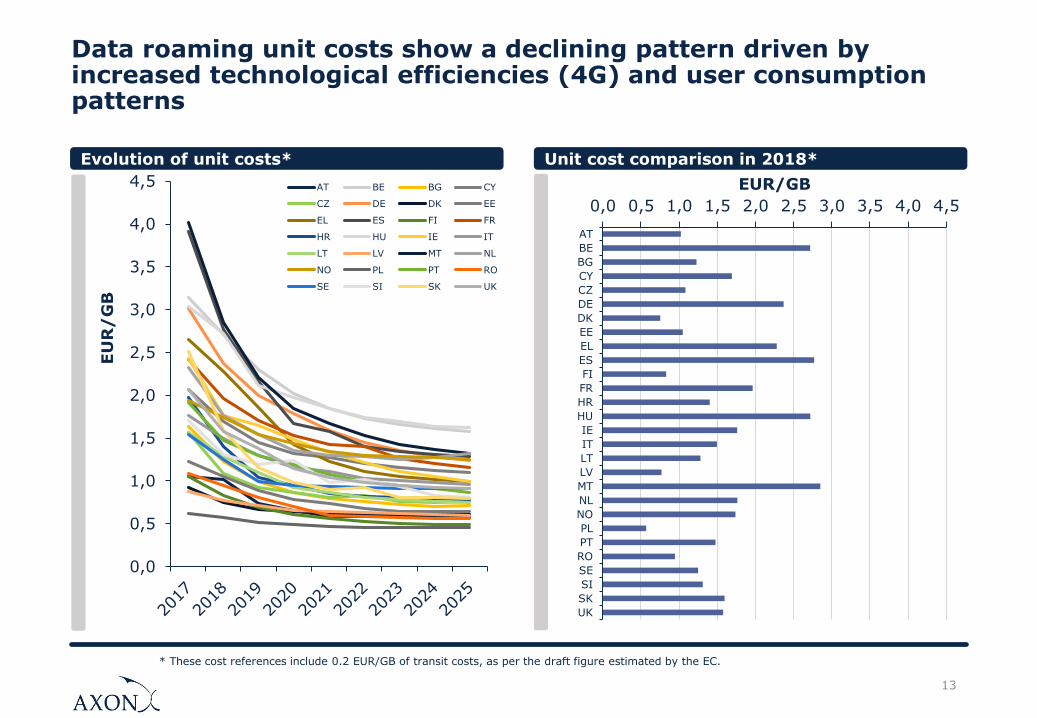
Data roaming unit costs show a declining pattern driven by increased technological efficiencies (4G) and user consumption patterns
13
0,0
0,5
1,0
1,5
2,0
2,5
3,0
3,5
4,0
4,5
EU
R/
GB
AT BE BG CY
CZ DE DK EE
EL ES FI FR
HR HU IE IT
LT LV MT NL
NO PL PT RO
SE SI SK UK
Evolution of unit costs* Unit cost comparison in 2018*
0,0 0,5 1,0 1,5 2,0 2,5 3,0 3,5 4,0 4,5
AT
BE
BG
CY
CZ
DE
DK
EE
EL
ES
FI
FR
HR
HU
IE
IT
LT
LV
MT
NL
NO
PL
PT
RO
SE
SI
SK
UK
EUR/GB
* These cost references include 0.2 EUR/GB of transit costs, as per the draft figure estimated by the EC.
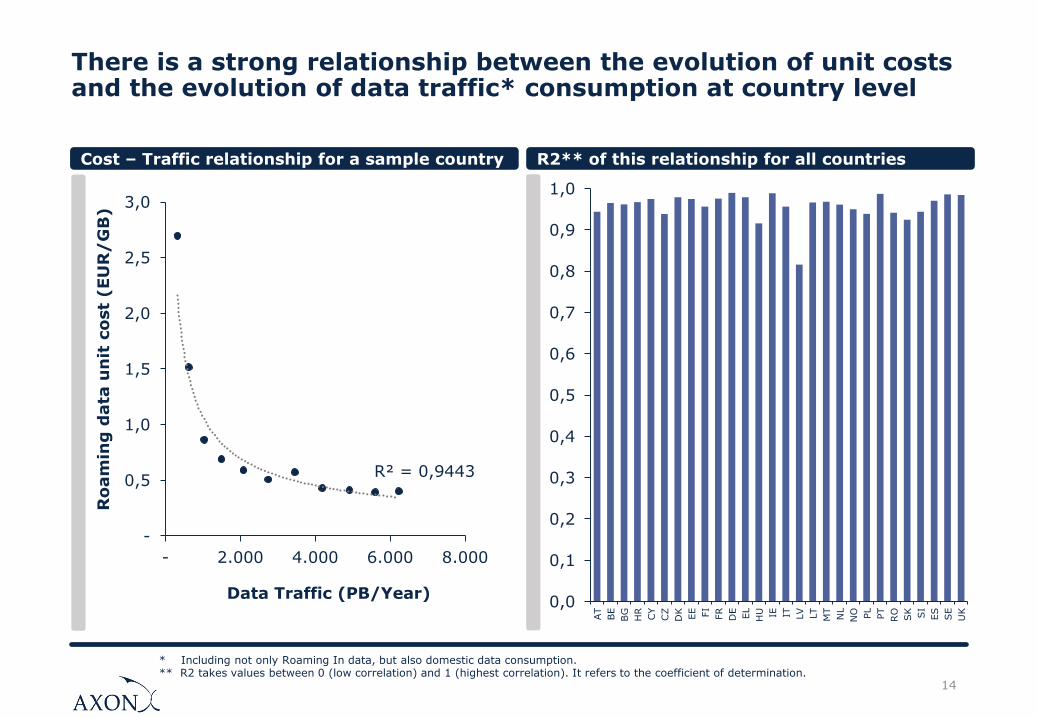
There is a strong relationship between the evolution of unit costs and the evolution of data traffic* consumption at country level
14
* Including not only Roaming In data, but also domestic data consumption.** R2 takes values between 0 (low correlation) and 1 (highest correlation). It refers to the coefficient of determination.
Cost – Traffic relationship for a sample country R2** of this relationship for all countries
R² = 0,9443
-
0,5
1,0
1,5
2,0
2,5
3,0
- 2.000 4.000 6.000 8.000
Ro
am
ing
data
un
it c
ost
(EU
R/
GB
)
Data Traffic (PB/Year)0,0
0,1
0,2
0,3
0,4
0,5
0,6
0,7
0,8
0,9
1,0
AT
BE
BG
HR
CY
CZ
DK
EE FI
FR
DE
EL
HU IE IT LV
LT
MT
NL
NO PL
PT
RO
SK SI
ES
SE
UK
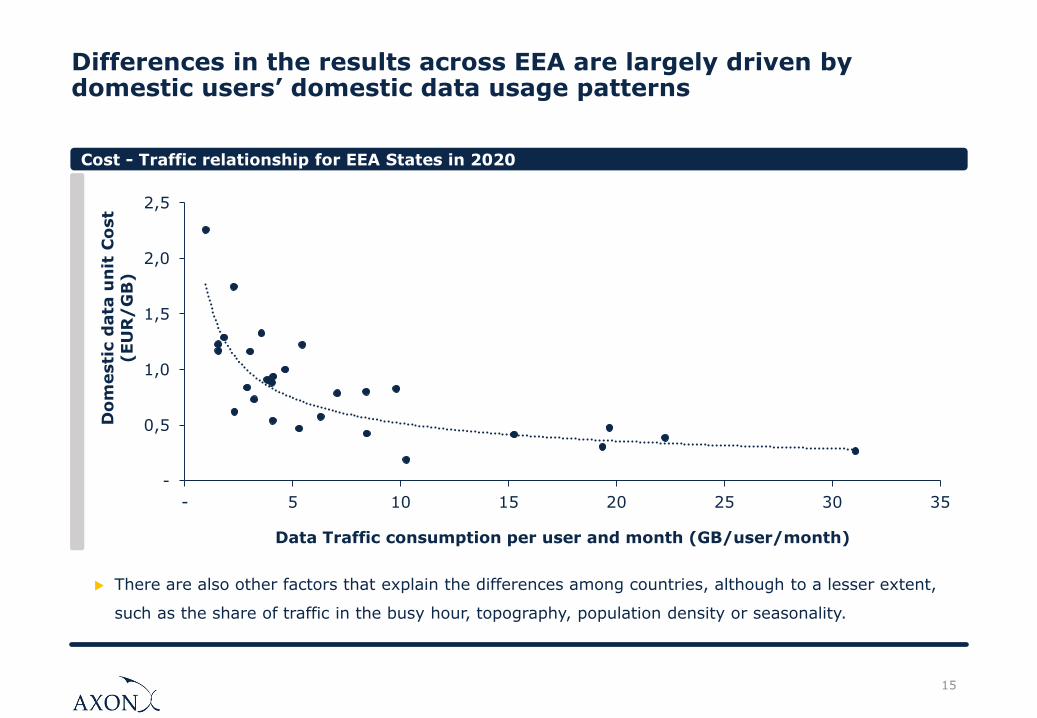
Differences in the results across EEA are largely driven by domestic users’ domestic data usage patterns
15
Cost - Traffic relationship for EEA States in 2020
There are also other factors that explain the differences among countries, although to a lesser extent,
such as the share of traffic in the busy hour, topography, population density or seasonality.
-
0,5
1,0
1,5
2,0
2,5
- 5 10 15 20 25 30 35
Do
mesti
c d
ata
un
it C
ost
(EU
R/
GB
)
Data Traffic consumption per user and month (GB/user/month)
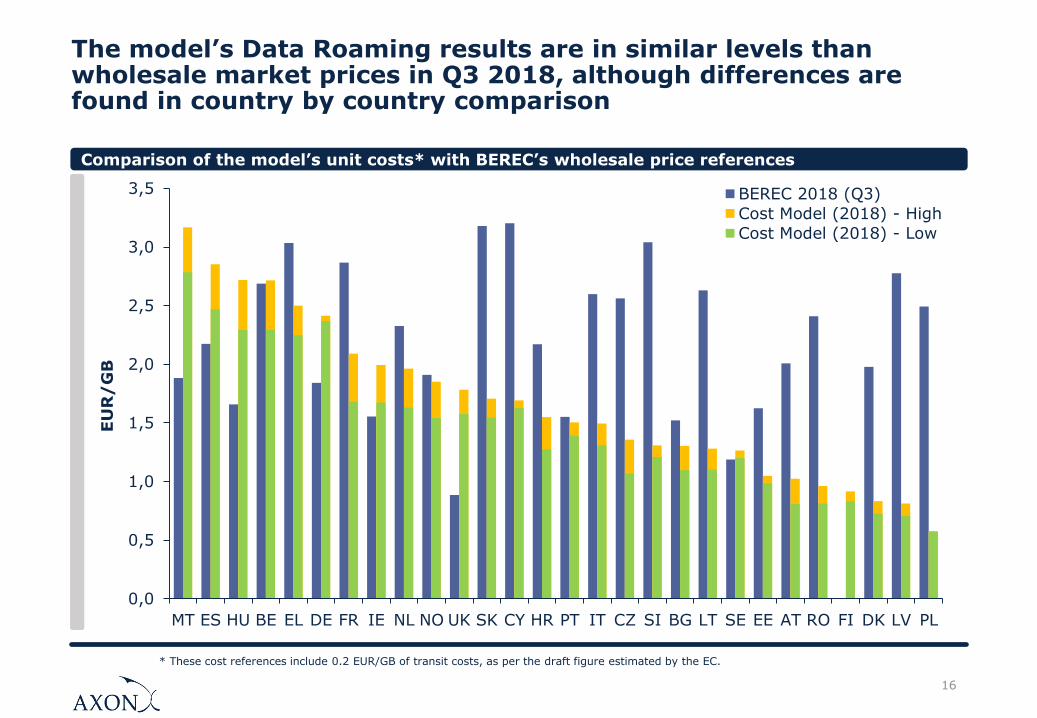
The model’s Data Roaming results are in similar levels than wholesale market prices in Q3 2018, although differences are found in country by country comparison
16
0,0
0,5
1,0
1,5
2,0
2,5
3,0
3,5
MT ES HU BE EL DE FR IE NL NO UK SK CY HR PT IT CZ SI BG LT SE EE AT RO FI DK LV PL
EU
R/
GB
BEREC 2018 (Q3)
Cost Model (2018) - High
Cost Model (2018) - Low
* These cost references include 0.2 EUR/GB of transit costs, as per the draft figure estimated by the EC.
Comparison of the model’s unit costs* with BEREC’s wholesale price references
17
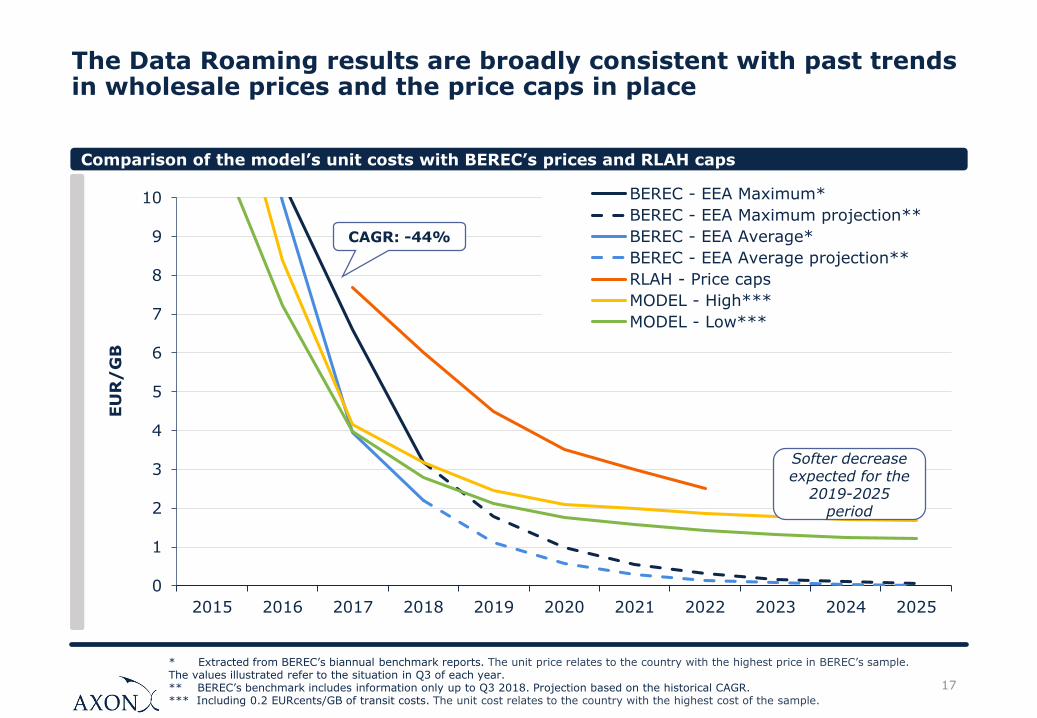
The Data Roaming results are broadly consistent with past trends in wholesale prices and the price caps in place
0
1
2
3
4
5
6
7
8
9
10
2015 2016 2017 2018 2019 2020 2021 2022 2023 2024 2025
EU
R/
GB
BEREC - EEA Maximum*
BEREC - EEA Maximum projection**
BEREC - EEA Average*
BEREC - EEA Average projection**
RLAH - Price caps
MODEL - High***
MODEL - Low***
CAGR: -44%
Softer decrease expected for the
2019-2025 period
* Extracted from BEREC’s biannual benchmark reports. The unit price relates to the country with the highest price in BEREC’s sample. The values illustrated refer to the situation in Q3 of each year.** BEREC’s benchmark includes information only up to Q3 2018. Projection based on the historical CAGR.*** Including 0.2 EURcents/GB of transit costs. The unit cost relates to the country with the highest cost of the sample.
Comparison of the model’s unit costs with BEREC’s prices and RLAH caps
18
2. Results for Data Roaming services
3. Results for Voice Roaming services
4. Results for Voice Call Termination services
1. Definition of scenarios
5. Results for SMS roaming services
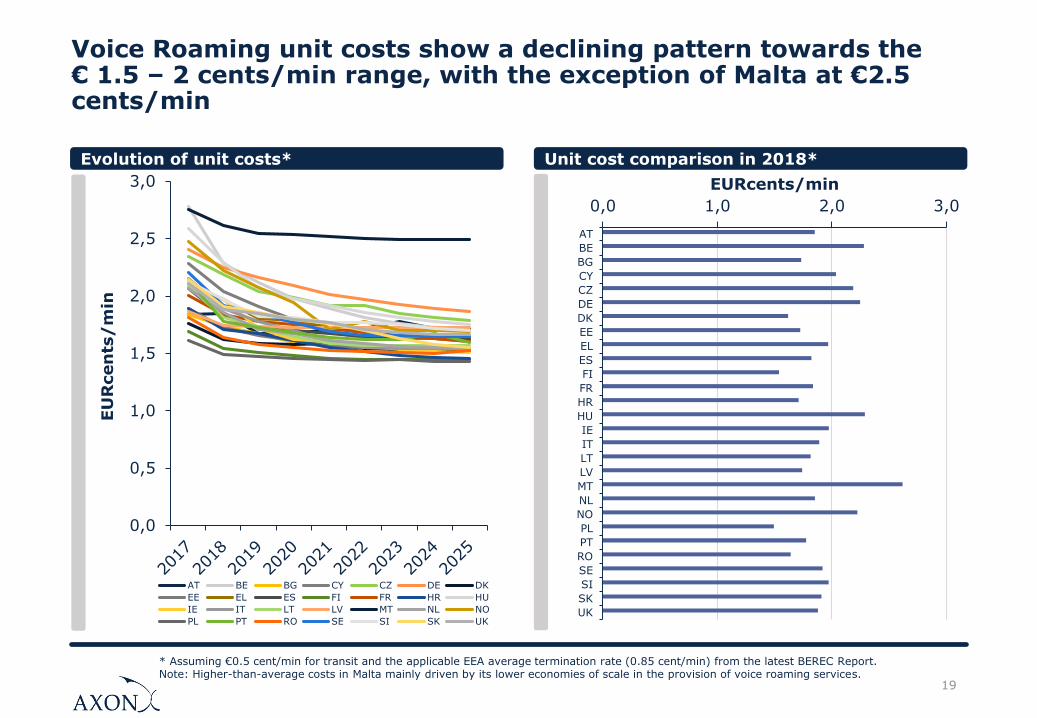
Voice Roaming unit costs show a declining pattern towards the € 1.5 – 2 cents/min range, with the exception of Malta at €2.5 cents/min
19
Evolution of unit costs* Unit cost comparison in 2018*
0,0 1,0 2,0 3,0
AT
BE
BG
CY
CZ
DE
DK
EE
EL
ES
FI
FR
HR
HU
IE
IT
LT
LV
MT
NL
NO
PL
PT
RO
SE
SI
SK
UK
EURcents/min
* Assuming €0.5 cent/min for transit and the applicable EEA average termination rate (0.85 cent/min) from the latest BEREC Report.Note: Higher-than-average costs in Malta mainly driven by its lower economies of scale in the provision of voice roaming services.
0,0
0,5
1,0
1,5
2,0
2,5
3,0
EU
Rcen
ts/
min
AT BE BG CY CZ DE DK
EE EL ES FI FR HR HU
IE IT LT LV MT NL NO
PL PT RO SE SI SK UK
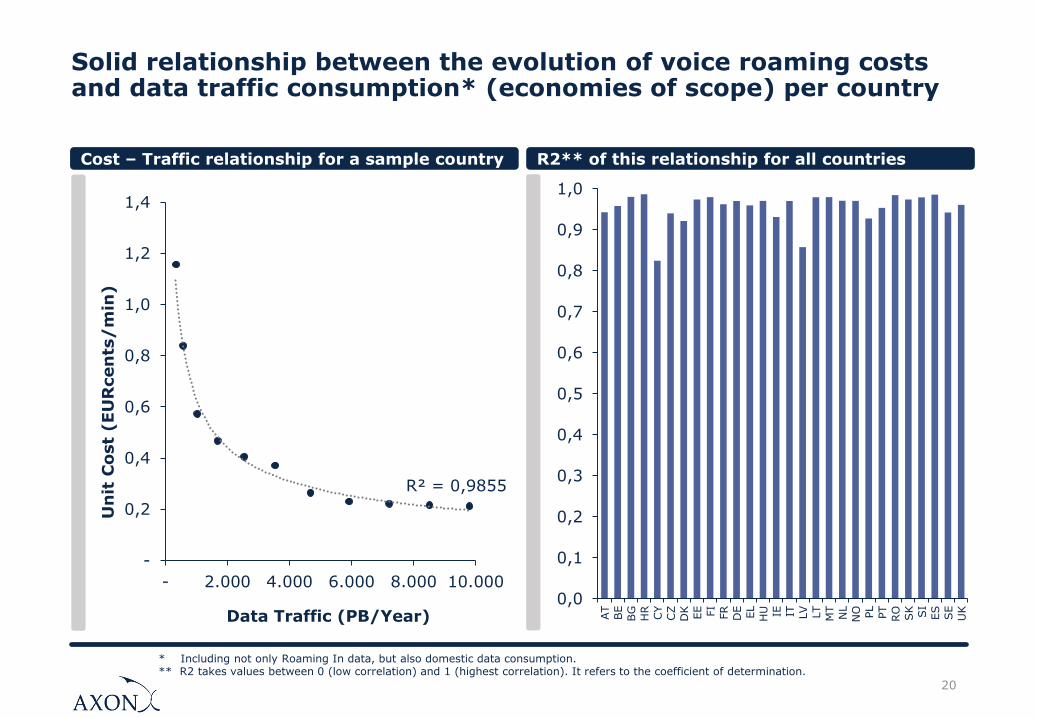
Solid relationship between the evolution of voice roaming costs and data traffic consumption* (economies of scope) per country
20
Cost – Traffic relationship for a sample country R2** of this relationship for all countries
R² = 0,9855
-
0,2
0,4
0,6
0,8
1,0
1,2
1,4
- 2.000 4.000 6.000 8.000 10.000
Un
it C
ost
(EU
Rcen
ts/
min
)
Data Traffic (PB/Year)0,0
0,1
0,2
0,3
0,4
0,5
0,6
0,7
0,8
0,9
1,0
AT
BE
BG
HR
CY
CZ
DK
EE FI
FR
DE
EL
HU IE IT LV
LT
MT
NL
NO PL
PT
RO
SK SI
ES
SE
UK
* Including not only Roaming In data, but also domestic data consumption.** R2 takes values between 0 (low correlation) and 1 (highest correlation). It refers to the coefficient of determination.
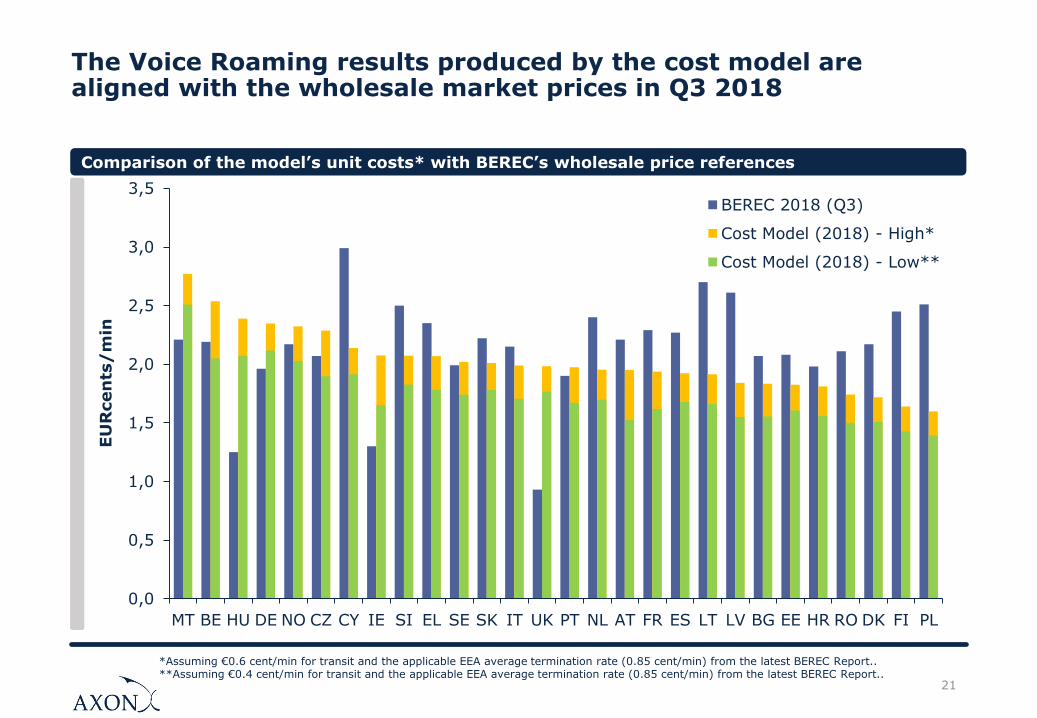
The Voice Roaming results produced by the cost model are aligned with the wholesale market prices in Q3 2018
21
Comparison of the model’s unit costs* with BEREC’s wholesale price references
*Assuming €0.6 cent/min for transit and the applicable EEA average termination rate (0.85 cent/min) from the latest BEREC Report.. **Assuming €0.4 cent/min for transit and the applicable EEA average termination rate (0.85 cent/min) from the latest BEREC Report..
0,0
0,5
1,0
1,5
2,0
2,5
3,0
3,5
MT BE HU DE NO CZ CY IE SI EL SE SK IT UK PT NL AT FR ES LT LV BG EE HR RO DK FI PL
EU
Rcen
ts/
min
BEREC 2018 (Q3)
Cost Model (2018) - High*
Cost Model (2018) - Low**
22
* Extracted from BEREC’s biannual benchmark reports. The unit price relates to the country with the highest price in BEREC’s sample. ** BEREC’s benchmark includes information only up to Q3 2018. Projection based on the historical CAGR. *** Considering 0.6-0.4 EURcents/min of transit costs for the high/low alternatives respectively, and 0.85 EURcents/min of mobile termination. The unit cost relates to the country with the highest cost of the sample.
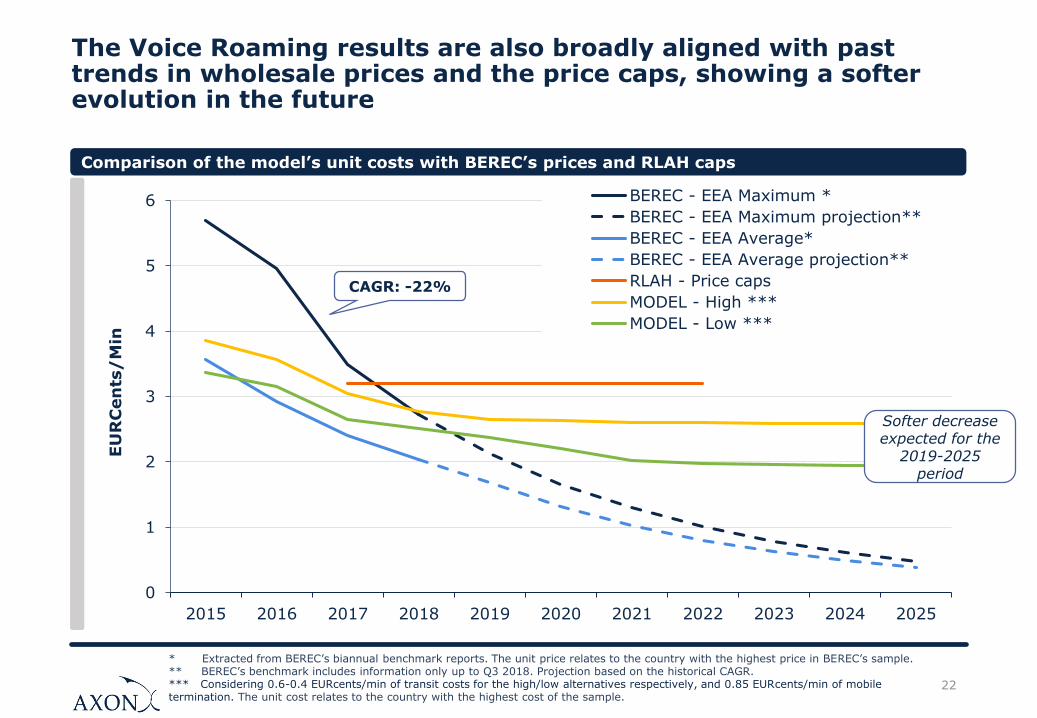
The Voice Roaming results are also broadly aligned with past trends in wholesale prices and the price caps, showing a softer evolution in the future
0
1
2
3
4
5
6
2015 2016 2017 2018 2019 2020 2021 2022 2023 2024 2025
EU
RC
en
ts/
Min
BEREC - EEA Maximum *
BEREC - EEA Maximum projection**
BEREC - EEA Average*
BEREC - EEA Average projection**
RLAH - Price caps
MODEL - High ***
MODEL - Low ***
CAGR: -22%
Softer decrease expected for the
2019-2025 period
Comparison of the model’s unit costs with BEREC’s prices and RLAH caps
23
2. Results for Data Roaming services
3. Results for Voice Roaming services
4. Results for Voice Call Termination services
1. Definition of scenarios
5. Results for SMS roaming services
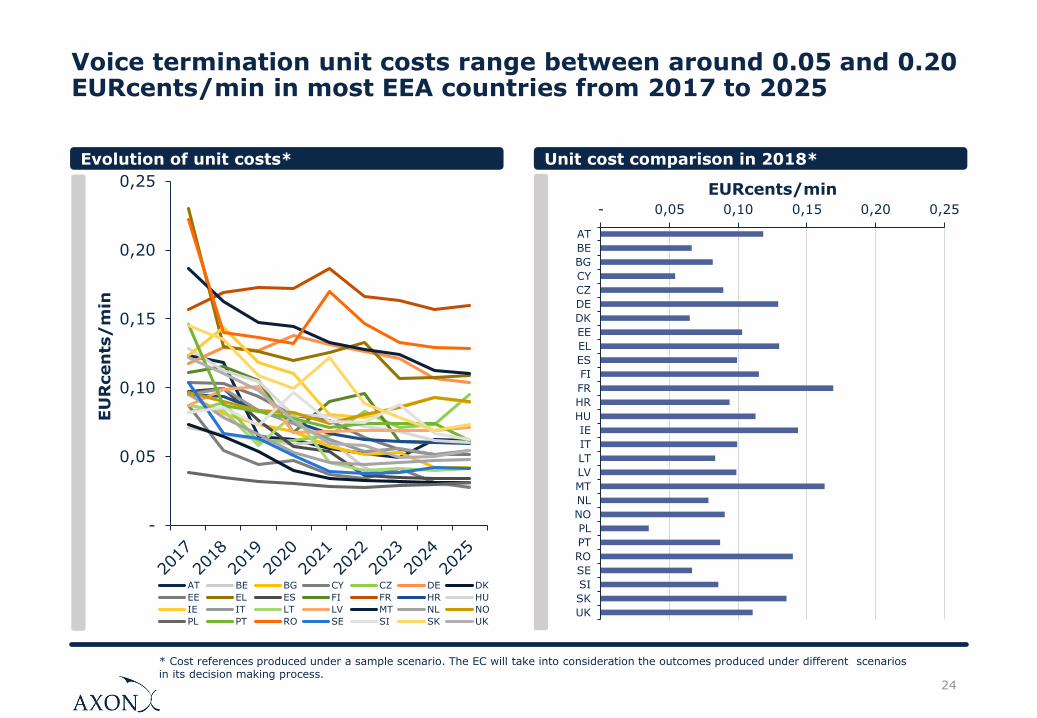
Voice termination unit costs range between around 0.05 and 0.20 EURcents/min in most EEA countries from 2017 to 2025
24
Evolution of unit costs* Unit cost comparison in 2018*
- 0,05 0,10 0,15 0,20 0,25
AT
BE
BG
CY
CZ
DE
DK
EE
EL
ES
FI
FR
HR
HU
IE
IT
LT
LV
MT
NL
NO
PL
PT
RO
SE
SI
SK
UK
EURcents/min
* Cost references produced under a sample scenario. The EC will take into consideration the outcomes produced under different scenarios in its decision making process.
-
0,05
0,10
0,15
0,20
0,25
EU
Rcen
ts/
min
AT BE BG CY CZ DE DK
EE EL ES FI FR HR HU
IE IT LT LV MT NL NO
PL PT RO SE SI SK UK
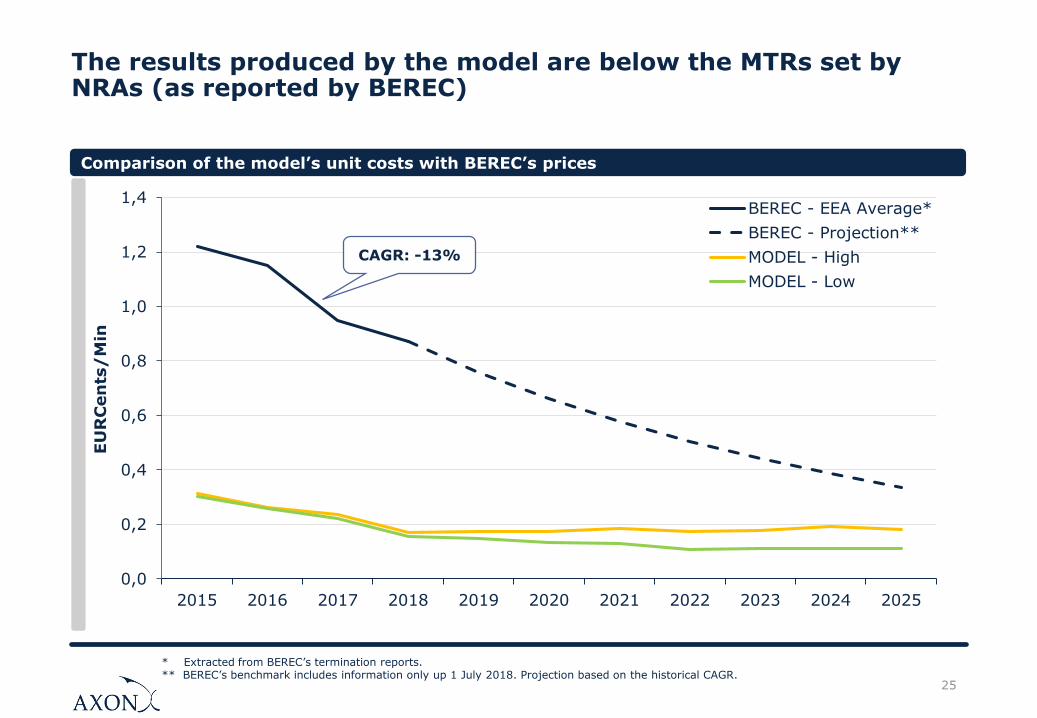
The results produced by the model are below the MTRs set by NRAs (as reported by BEREC)
25
0,0
0,2
0,4
0,6
0,8
1,0
1,2
1,4
2015 2016 2017 2018 2019 2020 2021 2022 2023 2024 2025
EU
RC
en
ts/
Min
BEREC - EEA Average*
BEREC - Projection**
MODEL - High
MODEL - Low
Comparison of the model’s unit costs with BEREC’s prices
* Extracted from BEREC’s termination reports. ** BEREC’s benchmark includes information only up 1 July 2018. Projection based on the historical CAGR.
CAGR: -13%
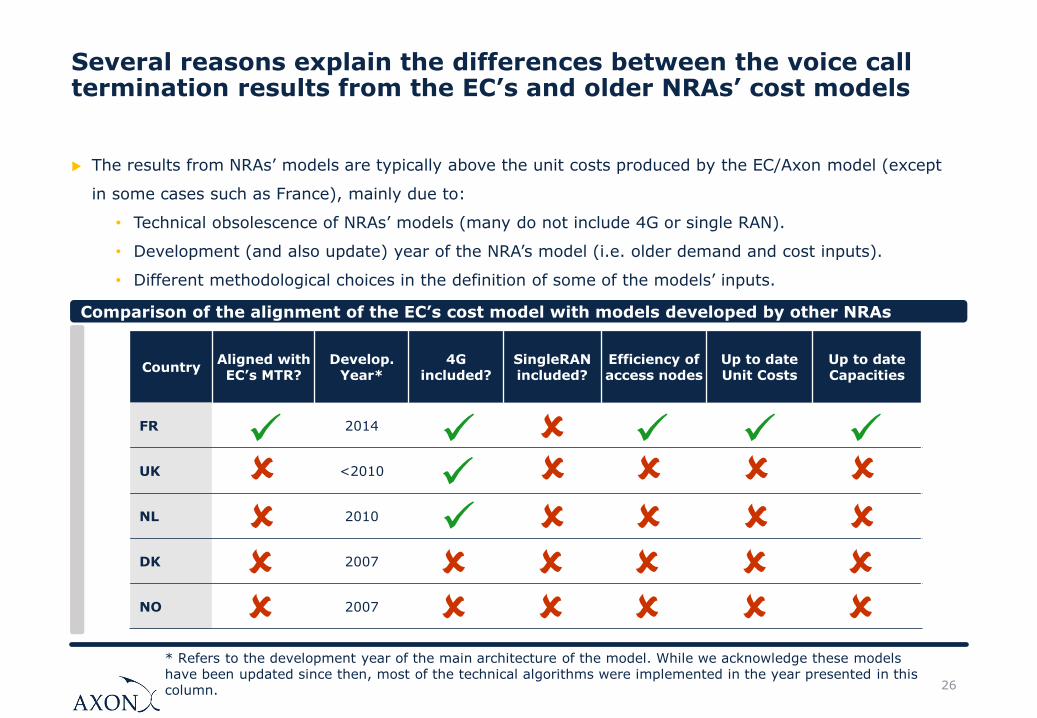
Several reasons explain the differences between the voice call termination results from the EC’s and older NRAs’ cost models
26
CountryAligned with EC’s MTR?
Develop. Year*
4G included?
SingleRAN included?
Efficiency of access nodes
Up to date Unit Costs
Up to date Capacities
FR 2014
UK <2010
NL 2010
DK 2007
NO 2007
Comparison of the alignment of the EC’s cost model with models developed by other NRAs
The results from NRAs’ models are typically above the unit costs produced by the EC/Axon model (except
in some cases such as France), mainly due to:
• Technical obsolescence of NRAs’ models (many do not include 4G or single RAN).
• Development (and also update) year of the NRA’s model (i.e. older demand and cost inputs).
• Different methodological choices in the definition of some of the models’ inputs.
* Refers to the development year of the main architecture of the model. While we acknowledge these models have been updated since then, most of the technical algorithms were implemented in the year presented in this column.
27
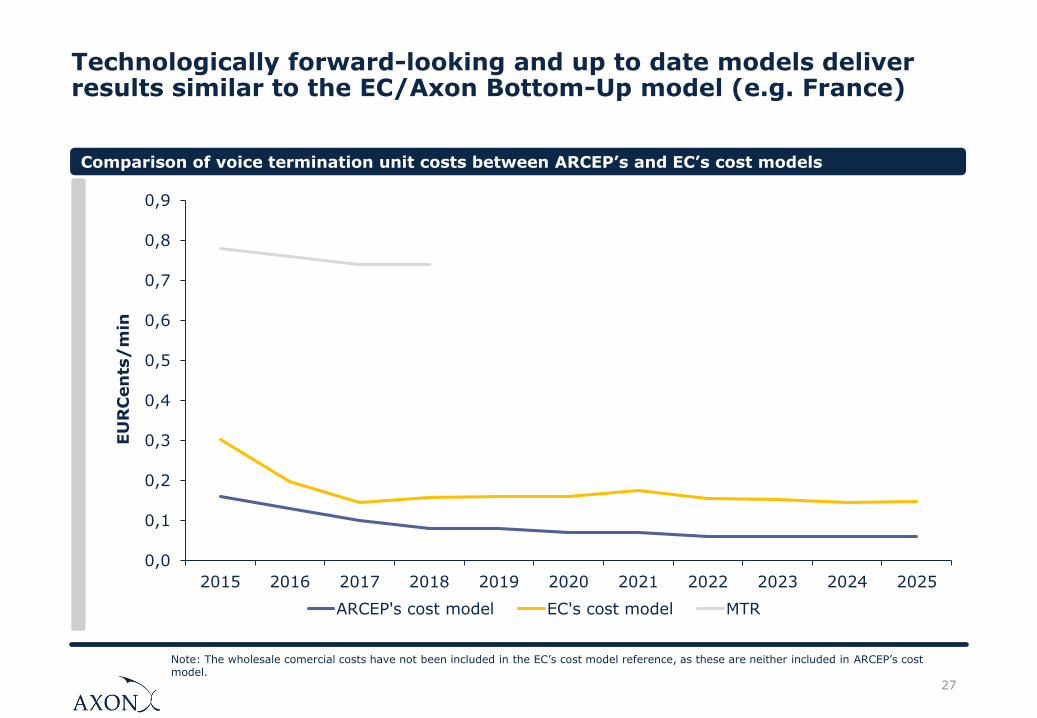
Technologically forward-looking and up to date models deliver results similar to the EC/Axon Bottom-Up model (e.g. France)
0,0
0,1
0,2
0,3
0,4
0,5
0,6
0,7
0,8
0,9
2015 2016 2017 2018 2019 2020 2021 2022 2023 2024 2025
EU
RC
en
ts/
min
ARCEP's cost model EC's cost model MTR
Note: The wholesale comercial costs have not been included in the EC’s cost model reference, as these are neither included in ARCEP’s cost model.
Comparison of voice termination unit costs between ARCEP’s and EC’s cost models
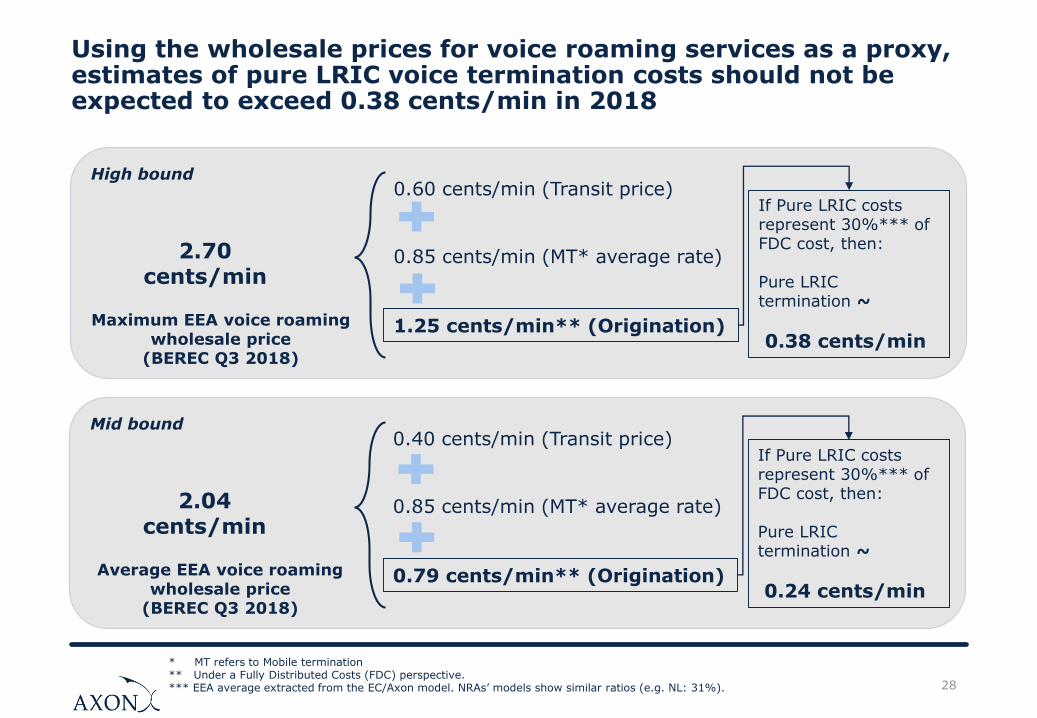
Using the wholesale prices for voice roaming services as a proxy, estimates of pure LRIC voice termination costs should not be expected to exceed 0.38 cents/min in 2018
28
* MT refers to Mobile termination** Under a Fully Distributed Costs (FDC) perspective.*** EEA average extracted from the EC/Axon model. NRAs’ models show similar ratios (e.g. NL: 31%).
High bound
Maximum EEA voice roaming wholesale price
(BEREC Q3 2018)
2.70 cents/min
0.60 cents/min (Transit price)
0.85 cents/min (MT* average rate)
1.25 cents/min** (Origination)
If Pure LRIC costs represent 30%*** of FDC cost, then:
Pure LRIC termination ~
0.38 cents/min
Mid bound
Average EEA voice roaming wholesale price
(BEREC Q3 2018)
2.04 cents/min
0.40 cents/min (Transit price)
0.85 cents/min (MT* average rate)
0.79 cents/min** (Origination)
If Pure LRIC costs represent 30%*** of FDC cost, then:
Pure LRIC termination ~
0.24 cents/min
29
2. Results for Data Roaming services
3. Results for Voice Roaming services
4. Results for Voice Call Termination services
1. Definition of scenarios
5. Results for SMS roaming services
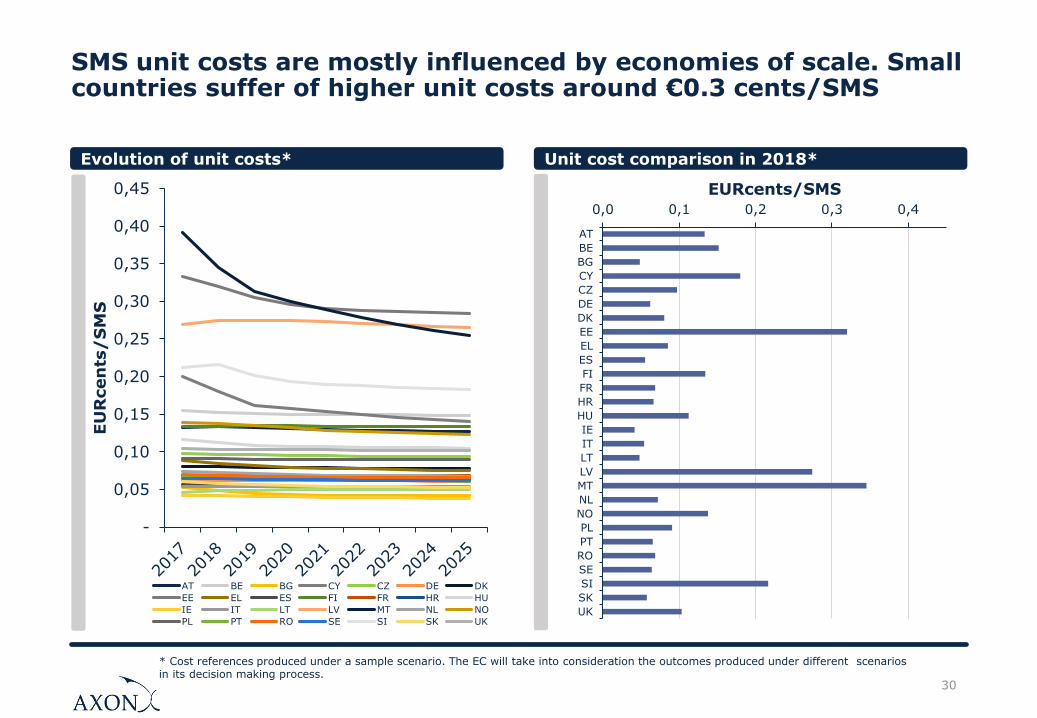
SMS unit costs are mostly influenced by economies of scale. Small countries suffer of higher unit costs around €0.3 cents/SMS
30
Evolution of unit costs* Unit cost comparison in 2018*
0,0 0,1 0,2 0,3 0,4
AT
BE
BG
CY
CZ
DE
DK
EE
EL
ES
FI
FR
HR
HU
IE
IT
LT
LV
MT
NL
NO
PL
PT
RO
SE
SI
SK
UK
EURcents/SMS
* Cost references produced under a sample scenario. The EC will take into consideration the outcomes produced under different scenarios in its decision making process.
-
0,05
0,10
0,15
0,20
0,25
0,30
0,35
0,40
0,45
EU
Rcen
ts/
SM
S
AT BE BG CY CZ DE DK
EE EL ES FI FR HR HU
IE IT LT LV MT NL NO
PL PT RO SE SI SK UK
31
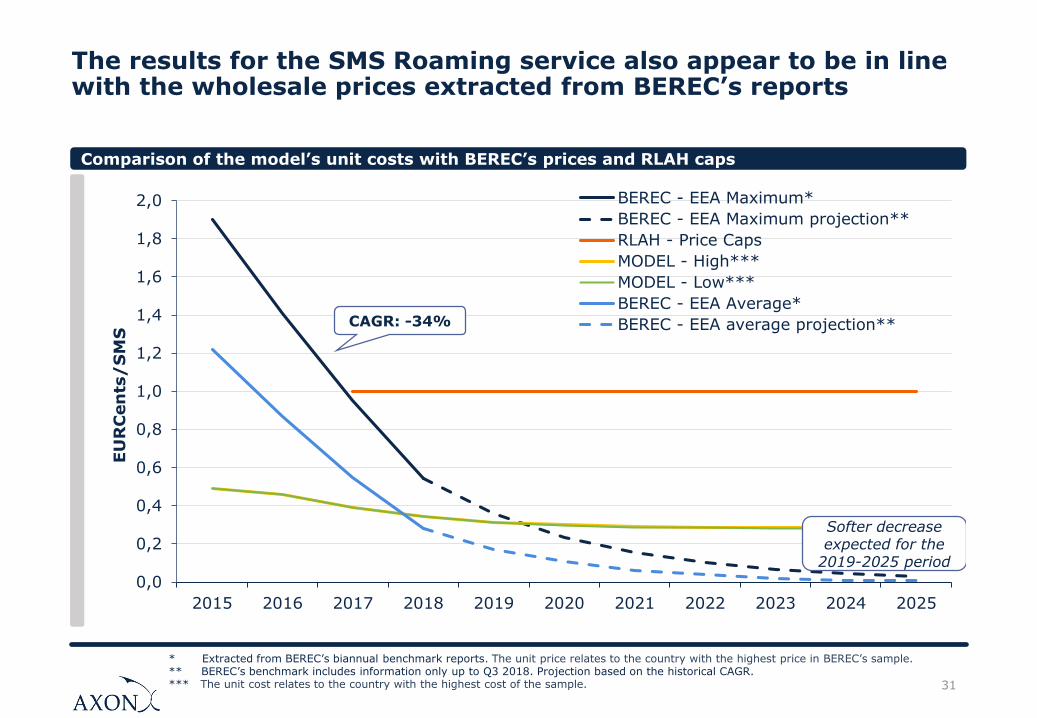
The results for the SMS Roaming service also appear to be in line with the wholesale prices extracted from BEREC’s reports
0,0
0,2
0,4
0,6
0,8
1,0
1,2
1,4
1,6
1,8
2,0
2015 2016 2017 2018 2019 2020 2021 2022 2023 2024 2025
EU
RC
en
ts/
SM
S
BEREC - EEA Maximum*
BEREC - EEA Maximum projection**
RLAH - Price Caps
MODEL - High***
MODEL - Low***
BEREC - EEA Average*
BEREC - EEA average projection**
Softer decrease expected for the
2019-2025 period
CAGR: -34%
Comparison of the model’s unit costs with BEREC’s prices and RLAH caps
* Extracted from BEREC’s biannual benchmark reports. The unit price relates to the country with the highest price in BEREC’s sample. ** BEREC’s benchmark includes information only up to Q3 2018. Projection based on the historical CAGR.*** The unit cost relates to the country with the highest cost of the sample.

Any questions? Please, contact:
Principal
Jorge Martínez
Principal
Alfons Oliver
Axon Partners Group
Calle Sagasta 18, 3rd
28004 Madrid (Spain)
Tel: +34 91 310 28 94