Embed Size (px)
Citation preview
Assessment of the Climate Change Scenario of North Central Nigeria Using
Rainfall
By
Dr. (Mrs) Rhoda Moji Olanrewaju and Mr. Oluwatobi Adeola Fayemi
Department of Geography and Environmental Management,
University of Ilorin
Ilorin, Nigeria.
Email: rodamoji@gmail. com
Abstract
In this study assessment of the climate change scenario of North central Nigeria is
attempted using rainfall as an index. North Central of Nigeria consists of eight (8) states of
which five (5) namely Kogi, Kwara, Kaduna, Plateau and Abuja were randomly sampled for
this study. Rainfall data was collected for a period of fifty one (51) years which spanned
between 1962 and 2012. However for Abuja it covered thirty one (31) years period for which
data was available. The data collected on monthly basis was later partitioned on annual
basis. Time series and correlation analyses were used to identify trends and the vulnerability
levels of each state and hence the North Central region of Nigeria to rainfall vagaries. The
results showed increasing trends of 0.22mm per annum for Lokoja and 3.38mm per annum
for Abuja stations while Ilorin, Jos and Kaduna stations each exhibited a decline of 0.18mm,
0.23mm and 0.44mm per annum respectively. However for the whole North central region of
Nigeria, a positively significant trend in rainfall with a predicted increase of 0.58mm of
rainfall per annum was observed. Based on the prediction, rainfall increase of 14.49% from

what was observed in 2013 (the base year) is expected by 2042. Various adaptation
strategies that can be put in place to safeguard the region from extreme weather events
that can emanate from such climatic scenario were suggested.
Key words: Climate change, Drought, Flood, Rainfall, Crop.
Background
Climatic variability is a term used to explain the variations in climatic conditions on various
spatio-temporal scales and it include fluctuations, trends and cycles which constitutes a
‘noise’ in the climatic series as man could easily adapt to such minor differentials (Ayoade
2003). However when these fluctuations and changes in climate becomes persistent such that
significant changes in the climate scenario are overwhelmingly obvious a new climate is said
to have emerged (Olaniran, 2002). Similarly IPCC, (2007) defined Climate change as a
significant change in the state of the climate of a place that can be identified by changes in
the mean and/or in the variability of its properties that persist over a long period of time. Thus
it can be said that climate change connotes any form of long-term climatic inconsistency.
One thing that should be the utmost concern of any nation of the world is knowing the
vulnerability level of its socio-economic activities to climate change and measures that can be
adopted in either coping or mitigating such impacts. Nigeria is an agrarian country and the
most populous in African with an estimated population of 173 billion people. It is thus
imperative for a country such as Nigeria to have a sustainable agriculture in order to meet the
need of her ever growing population. This has been a mirage because economic downturn
between population growth and food requirement exists in Nigeria due to unpredictable
climate changes (Adefolalu, 2006).
Rainfall the major index of climate change in the tropics (Ayoade 2004) is a vital climatic
factor that determines vulnerability level of crop production in Nigeria (Oguntoyinbo, 1981,
Olaniran, 2002 and Ayoade, 2004). Extreme of it often results in flooding or drought. The
country though bless with an impressive size of arable land has poor agricultural production
that results in food shortage. Climate affects crop yield directly by irregularity in rainfall
pattern. The four components of food security as highlighted by FAO (2008) are food

availability, food access, food utilization and food stabilization. All these are climate
determined in Nigeria.
The North Central Nigeria which is the food basket of the nation has suffered flood episodes
of diverse magnitudes of recent. These includes the Lokoja flood of 2012 as reported by the
National Emergency Management Agency (NEMA, 2013), the Ilorin flood of 2014 (Jimoh,
2014) and the Kaduna flood of 2014 (Alabelewe, 2014). These have resulted in the loss of
lives, farm lands and other properties worth of several amount of money. Thus to safeguard
future losses mentioned above assessment of the climate change scenario of North Central
Nigeria is attempted in this study.
The Study Area
The study area is the North Central Nigeria. It covers latitude 70 00’-11
0 30’ North of the
equator and longitude 4000’-11
000’ East of the Greenwich meridian (see figures 1 and 2). It
enjoys the tropical continental climate characterized by wet and dry seasons. Wet season is
synonymous to planting season since agriculture in the area is rain-fed. Mean annual rainfall
ranges between 1,200mm and 1500mm while temperature is high almost throughout the year
except during hamattan period which begins in November and lasts until February. The
weather is cold and dry during the period coupled with hazy atmosphere and dust particles
flowing around. The vegetation of the North Central Nigeria cut across the three savannah
belts (Guinea, Sudan and Sahel) and this is one of the reasons why both roots and cereals

cropping are very popular in these ecological zones.s
Figure 1: Map of Nigeria showing the North-Central Zone of Nigeria.
Source: National Space Research Development Agency,(NASRDA,2013).

Figure 2: Map of North-Central Nigeria showing the study area.
Source: National Space Research Development Agency,(NASRDA,2013).
METHOD OF STUDY
North Central of Nigeria consists of eight (8) states of which five (5) namely Kogi, Kwara,
Kaduna, Plateau and Abuja were randomly sampled for the study (See Figure 2 above).
Monthly rainfall data was collected for a period of fifty one (51) years which spanned
between 1962 and 2012. However for Abuja the data covered thirty one (31) years period for

which data was available. The data collected on monthly basis was later partitioned on annual
basis.
In order to assess the climate change scenario of the study area, time series analysis was used
to model the trend(s) in the rainfall data for the selected stations of the North Central Region
of Nigeria. It was also used to derive the trend line equation that helped to predict future
rainfall amount in the study area and hence the vulnerability level. Correlation analysis was
carried out to study the strength in relationship between rainfall and time (years).
RESULTS AND DISCUSSION.
Figures 3-6 reflect the normal mean distribution of rainfall over the fifty (50) years for Kwara
(Ilorin), Jos Plateau, Kaduna and Kogi States ( Lokoja ).
Figure 3: Normal Mean Distribution of Rainfall in Ilorin Kwara State (1962-2012).
Source: Author’s Computation 2014.
Figure 3 above reflects the normal mean distribution of rainfall in Kwara State. Rainfall
distribution is highly variable. The highest rainfall amount was observed in 1967 while the
least was reported during year 2001.

Figure 4: Normal Mean Distribution of Rainfall for Jos (1962-2012).
Source: Author’s Computation 2014
Normal mean rainfall distribution for Jos Plateau is variable as well however, the degree of
its variability is not as high as that of Kwara State. The peak rainfall similarly occurred in
1967 as in Kwara State but the least rainfall was observed during the year1995 (see figure 4).
Figure 5: Normal Mean Distribution of Rainfall for Kaduna (1962-2012).
Source: Author’s Computation 2014
Figure 5 reflects the normal mean rainfall distribution for Kaduna State during the period
between 1962 and 2012. Rainfall fluctuated as in other states discussed above. The highest
rainfall amount occurred in 1974 and year 2008 observed the lowest amount.

Figure 6: Normal Mean Distribution of Rainfall for Lokoja, Kogi State (1962-2012).
Source: Author’s Computation 2014
Kogi State was also witnessed fluctuation in rainfall during the period of study. The peak
period of coincided with the year 2008 while the lowest occurred in 1983.
Generally fluctuations characterised rainfall distribution throughout the study period over all
states considered. Similarly each station reflects different periods of peak and least rainfall
throughout the period of study. The exception of this is Kwara State and Jos Plateau State
that recorded similar period of peak rainfall.
RESULTS OF TREND ANALYSES FOR THE STUDTY AREA.
Table I: Result of Trend Analyses for Ilorin Station.
Variable Ilorin
Included Observation 51
Linear Trend Equation Yt = 105.23 -0.18661*t
R 0.144811
R-Squared 0.020970
R-Square Adjusted 0.992696
Sum Square Error (SSE) 17964.390479
Mean Squared Error (MSE) 366.620214
Source: Author’s Computation 2014

Figure 7: Linear Trend of Annual Rainfall at Ilorin Kwara State
The chart Source: Author’s Computation 2014
Figure 7 above indicates that rainfall in Ilorin is characterized by a slight downward trend and
the rate is about 0.2mm per annum as shown in the trend equation (table 1).
Table II: Result of Trend Analyses for Jos Station.
Variable Jos
Included Observation 51
Linear Trend Equation Yt = 115.37 -0.23237*t
R 0.204436
R-Squared 0.041794
R-Square Adjusted 0.991807
Sum Square Error (SSE) 13679.078433
Mean Squared Error (MSE) 279.164866

Figure 8: Linear Trend of Annual Rainfall at Jos
Source: Author’s Computation 2014
Rainfall trend in Jos is towards a decline as well and the rate is not significant. Just like Ilorin
station the rate is about 0.2mm per annum . However a weak positive relationship of 0.2
exists between rainfall and year (table II). For instance years 2011 and 2012 received more
than normal rainfall. Again fluctuation around the mean is not as pronounced as what was
observed in Kwara State and about twenty seven (27) years out of fifty years considered
received above average rainfall and the tendency is towards more than normal rainfall in the
area (figure 8). This is not surprising because the terrain of the area is characterized by
plateau that gives it orographic rainfall.
Table III: Result of Trend Analyses for Kaduna Station.
Variable Kaduna
Included Observation 51
Linear Trend Equation Yt = 112.37 -0.37809*t
R 0.335732
R-Squared 0.112716
R-Square Adjusted 0.992043
Sum Square Error (SSE) 12434.665817
Mean Squared Error (MSE) 253.768690
Source: Author’s Computation 2014

Figure 9: Linear Trend of Annual Rainfall at Kaduna
Source: Author’s Computation 2014
Fluctuation of mean annual rainfall in Kaduna as revealed in figure 9 above showed a
downward trend and the rate of decline is about 0.4mm of rain per annum (tale III). Rainfall
is below normal for most years under consideration. The reason might not be unconnected
with the fact that Kaduna State is closer to the southern fringe of Sahara desert than any other
stations in the study area..
Table IV: Result of Trend Analyses for Lokoja Station.
Variable Lokoja
Included Observation 51
Linear Trend Equation Yt = 96.965 +0.224*t
R 0.170989
R-Squared 0.029237
R-Square Adjusted 0.992845
Sum Square Error (SSE) 18409.099578
Mean Squared Error (MSE) 375.695910
Source: Author’s Computation 2014

Figure 10: Linear Trend of Annual Rainfall at Lokoja
Source: Author’s Computation 2014
Fluctuation of rainfall also occurred in Lokoja, Kogi State but it was above normal. The trend
as depicted in table IV and by figure 10 above showed a rise of 0.22mm of rainfall per
annum. Increase in rainfall observed might be linked with the fact that Lokoja being a
confluence station is surrounded by water.
Table V: Result of Trend Analyses for Abuja Station.
Variable Abuja
Included Observation 31
Linear Trend Equation Yt = -13.945 +3.3823*t
R 0.813358
R-Squared 0.661551
R-Square Adjusted 0.998669
Sum Square Error (SSE) 64671.276952
Mean Squared Error (MSE) 1319.821979
Source: Author’s Computation 2014
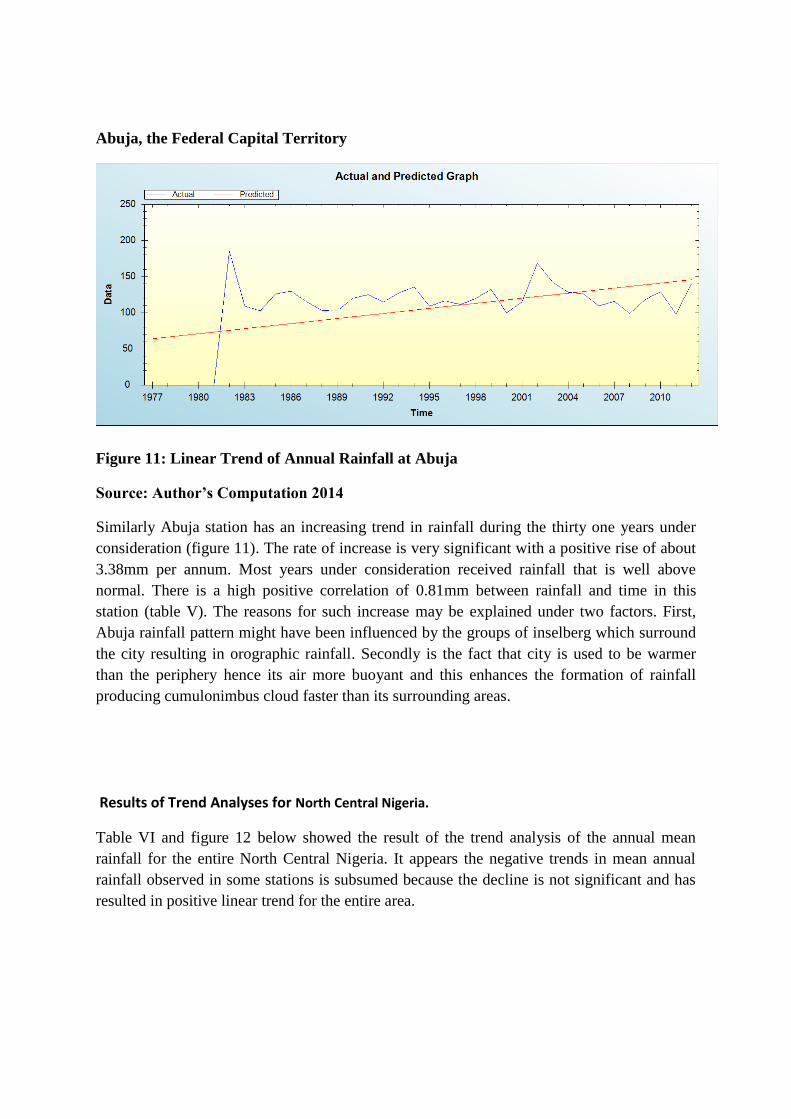
Abuja, the Federal Capital Territory
Figure 11: Linear Trend of Annual Rainfall at Abuja
Source: Author’s Computation 2014
Similarly Abuja station has an increasing trend in rainfall during the thirty one years under
consideration (figure 11). The rate of increase is very significant with a positive rise of about
3.38mm per annum. Most years under consideration received rainfall that is well above
normal. There is a high positive correlation of 0.81mm between rainfall and time in this
station (table V). The reasons for such increase may be explained under two factors. First,
Abuja rainfall pattern might have been influenced by the groups of inselberg which surround
the city resulting in orographic rainfall. Secondly is the fact that city is used to be warmer
than the periphery hence its air more buoyant and this enhances the formation of rainfall
producing cumulonimbus cloud faster than its surrounding areas.
Results of Trend Analyses for North Central Nigeria.
Table VI and figure 12 below showed the result of the trend analysis of the annual mean
rainfall for the entire North Central Nigeria. It appears the negative trends in mean annual
rainfall observed in some stations is subsumed because the decline is not significant and has
resulted in positive linear trend for the entire area.

Table VI: Summary of the Results of Trend Analyses of North Central Nigeria.
Variable MeanNC
Included Observation 51
Linear Trend Equation Yt = 83.199 +0.56184*t
R 0.636306
R-Squared 0.404885
R-Square Adjusted 0.991689
Sum Square Error (SSE) 5126.969262
Mean Squared Error (MSE) 104.632026
Source: Author’s Computation 2014
There is a positive relationship between rainfall and time (r = 0.63) and a sharp increase of
0.56mm rainfall per annum during the period of study in the area.
Figure 12: Linear Trend of Annual Rainfall in the North Central Nigeria.
Source: Author’s Computation 2014
PREDICTION OF FUTURE CLIMATE GHANGE SCENARIO USING RAINFALL
Table VII below reflects the predicted future climate change scenario of the study area using
rainfall trends of the selected stations. The period of prediction spanned between years 2013
– 2042.
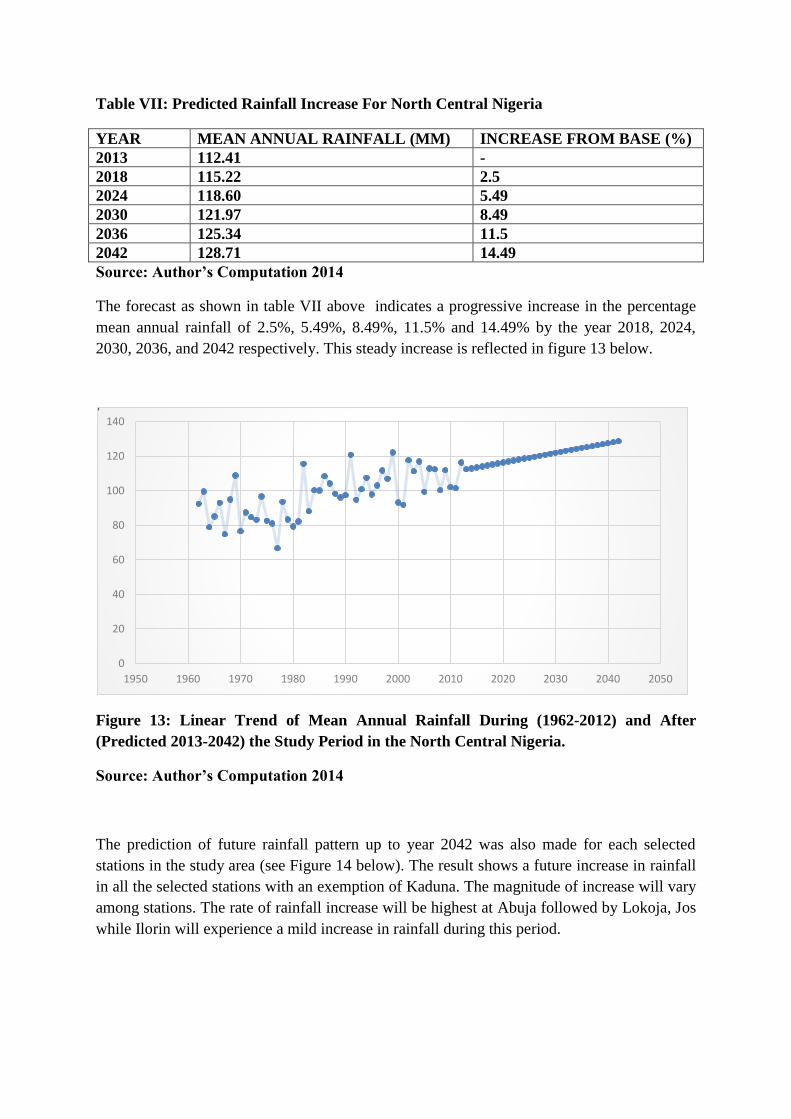
Table VII: Predicted Rainfall Increase For North Central Nigeria
YEAR MEAN ANNUAL RAINFALL (MM) INCREASE FROM BASE (%)
2013 112.41 -
2018 115.22 2.5
2024 118.60 5.49
2030 121.97 8.49
2036 125.34 11.5
2042 128.71 14.49
Source: Author’s Computation 2014
The forecast as shown in table VII above indicates a progressive increase in the percentage
mean annual rainfall of 2.5%, 5.49%, 8.49%, 11.5% and 14.49% by the year 2018, 2024,
2030, 2036, and 2042 respectively. This steady increase is reflected in figure 13 below.
Figure 13: Linear Trend of Mean Annual Rainfall During (1962-2012) and After
(Predicted 2013-2042) the Study Period in the North Central Nigeria.
Source: Author’s Computation 2014
The prediction of future rainfall pattern up to year 2042 was also made for each selected
stations in the study area (see Figure 14 below). The result shows a future increase in rainfall
in all the selected stations with an exemption of Kaduna. The magnitude of increase will vary
among stations. The rate of rainfall increase will be highest at Abuja followed by Lokoja, Jos
while Ilorin will experience a mild increase in rainfall during this period.
0
20
40
60
80
100
120
140
1950 1960 1970 1980 1990 2000 2010 2020 2030 2040 2050

Figure 14: Prediction of Rainfall Trend in North Central Nigeria (2013-2042)
Source: Author’s Computation 2014
IMPLICATION OF FINDINGS
The implication of the above findings for the North Central Region of Nigeria is future
occurrences of flood episodes of diverse magnitudes. What makes this region more
vulnerable is the fact that Nigeria major Rivers (Niger, Benue and Kaduna Rivers) cut across
these areas.
SUGGESTED ADAPTATION STRATEGIES
In area where increase in rainfall is envisaged farmers are encouraged not to engage in
the cultivation of flood plain area but limit their farming activities to upland areas.
Where flood plain agriculture farming practice is going to be adopted, farmers should
concentrate more on the cultivation of water loving crop such as swamp rice and at
the same time put every effort in place to combat flood.
The State Government of where surplus rain is envisaged should put all measures in
place towards harvesting and storing excess rain water for future use.
However in area where drought is envisaged such as Kaduna State, farmers are
advised to focus on the planting of drought resistant crops such as cassava and guinea
corn and at the same time get all arrangements ready for irrigation farming practices.
0
50
100
150
200
250
20
13
20
15
20
17
20
19
20
21
20
23
20
25
20
27
20
29
20
31
20
33
20
35
20
37
20
39
20
41
Pre
dic
ted
Rai
nfa
ll (m
m)
Year
Kaduna
Lokoja
Jos
Ilorin
Abuja

More dams could be constructed on the major rivers to accommodate excess water
during its peak discharge and this could be put to use in various forms e.g. Hydro
Electric Power generation, irrigation, domestic uses etc.
REFERENCES
Adefolalu, D.O. (2006) Project Documentation 2: Identification and Delineation of level of
vulnerability of states prone to flood, erosion and drought and quantification of the severity
of disasters.
Alabelewe, A.(2014), ‘Flood Kills Seven Old Girl in Kaduna’ in the ‘The Nation’s August 22nd
2014
Ayoade, J.O. (2003), Climate change: A Synopsis of Its Nature, Causes, Effects and
Management, Ibadan: Vantage Publishers, PP. 5- 6.
Ayoade, J.O. (2004) Introduction to Climatology for the Tropics. Spectrum Books Limited,
Ibadan, PP 258.
IPCC, (2007), Adopts Major Assessment of Climate Science,
http;//www.ipcc.ch/press/prwg2feb07htm.
FAO (2008), Climate Change and Food Security: A Framework Document, FAO, Rome,
Italy (http://www.fao.org/docrep/010/k2595e00.htm)
IPCC (Intergovernmental Panel on Climate Change, 2001): The Scientific Basis.
Contribution of Working Group 1 on the Third Assessment Report of the IPPC, Cambridge
University Press.
Jimoh, A.(2014), ‘ Saraki Blames Federal Government Over Ilorin Flood’ in ‘The Nation’
posted in news October 6th
, 2014.
NEMA (2012), ‘ Lokoja Flood’ A release by Nigeria National Emergency Management
Agency (NEMA) on September 25th
, 2012.
Olaniran, O.J. (2002). Rainfall Anomalies in Nigeria: The Contemporary Understanding The
Fifty-Fifth Inaugural Lecture of the University of Ilorin.

APPENDICES
Appendix I: Rainfall Prediction for the North Central Nigeria (2013 – 2042)
Year Forecasted
2013 112.4146
2014 112.9765
2015 113.5383
2016 114.1002
2017 114.6620
2018 115.2238
2019 115.7857
2020 116.3475
2021 116.9094
2022 117.4712
2023 118.0331
2024 118.5949
2025 119.1567
2026 119.7186
2027 120.2804
2028 120.8423
2029 121.4041
2030 121.9660
2031 122.5278
2032 123.0896
2033 123.6515
2034 124.2133
2035 124.7752
2036 125.3370
2037 125.8989
2038 126.4607
2039 127.0225
2040 127.5844
2041 128.1462
2042 128.7081

Appendix II: Forecast of Annual Rainfall in Selected Stations of North Central Nigeria
(2013-2042).
Year Kaduna Lokoja Jos Ilorin Abuja
2013 95.8933 114.5965 112.2645 100.0811 148.0224
2014 95.7548 115.2171 112.6628 100.1852 150.3573
2015 95.6163 115.8378 113.061 100.2893 152.6923
2016 95.4777 116.4584 113.4593 100.3935 155.0273
2017 95.3392 117.079 113.8576 100.4976 157.3623
2018 95.2006 117.6997 114.2558 100.6017 159.6972
2019 95.0621 118.3203 114.6541 100.7058 162.0322
2020 94.9235 118.9409 115.0524 100.8099 164.3672
2021 94.785 119.5615 115.4506 100.914 166.7022
2022 94.6464 120.1822 115.8489 101.0181 169.0371
2023 94.5079 120.8028 116.2472 101.1222 171.3721
2024 94.3693 121.4234 116.6454 101.2263 173.7071
2025 94.2308 122.0441 117.0437 101.3304 176.0421
2026 94.0922 122.6647 117.442 101.4346 178.377
2027 93.9537 123.2853 117.8402 101.5387 180.712
2028 93.8151 123.9059 118.2385 101.6428 183.047
2029 93.6766 124.5266 118.6368 101.7469 185.382
2030 93.538 125.1472 119.035 101.851 187.7169
2031 93.3995 125.7678 119.4333 101.9551 190.0519
2032 93.2609 126.3885 119.8316 102.0592 192.3869
2033 93.1224 127.0091 120.2298 102.1633 194.7219
2034 92.9838 127.6297 120.6281 102.2674 197.0568
2035 92.8453 128.2504 121.0264 102.3715 199.3918
2036 92.7067 128.871 121.4246 102.4757 201.7268
2037 92.5682 129.4916 121.8229 102.5798 204.0617
2038 92.4297 130.1122 122.2212 102.6839 206.3967
2039 92.2911 130.7329 122.6194 102.788 208.7317
2040 92.1526 131.3535 123.0177 102.8921 211.0667
2041 92.014 131.9741 123.416 102.9962 213.4016
2042 91.8755 132.5948 123.8143 103.1003 215.7366