Embed Size (px)
Citation preview
List of Papers
This thesis is based on the following papers, which are referred to in the text by their Roman numerals.
I Mörtberg E, Cumming P, Wiklund L, Wall A, Rubertsson S. A
PET study of regional cerebral blood flow after experimen-tal cardiopulmonary resuscitation. Resuscitation. 2007;75:98-104
II Mörtberg E, Cumming P, Wiklund L, Rubertsson S. Cerebral metabolic rate of oxygen (CMRO2) in pig brain determined by PET after resuscitation from cardiac arrest. Resuscita-tion. 2009;80:701-706
III Mörtberg, E., Zetterberg, H., Nordmark, J., Blennow, K., Ro-sengren, L., and Rubertsson, S. S-100B is superior to NSE, BDNF and GFAP in predicting outcome of resuscitation from cardiac arrest with hypothermia treatment. Resuscita-tion. In press.
IV Mörtberg, E., Zetterberg, H., Nordmark, J., Blennow, K., Catry, C., Decreamer H., Vanmechelen, E. and Rubertsson, S. Plasma tau-protein analysis after resuscitation from cardiac arrest and hypothermia treatment-a pilot study. Submitted.
Reprints were made with permission from the respective publishers.

Contents
Introduction ..................................................................................................... 9
Background ................................................................................................... 10 Cerebral injury after cardiac arrest ........................................................... 10
Ischemia ............................................................................................... 10 Reperfusion .......................................................................................... 10 Selective neuronal vulnerability .......................................................... 11
Cerebral blood flow (CBF) measurements after cardiac arrest ................ 11 Laser Doppler technique ...................................................................... 11 Microspheres ....................................................................................... 12 Xenon-washout .................................................................................... 12 Magnetic resonance imaging (MRI) .................................................... 12 Xenon computed tomography method ................................................. 13
Autoregulation .......................................................................................... 13 Cerebral metabolic rate of oxygen (CMRO2) measurements after cardiac arrest ......................................................................................................... 14
A-V difference ..................................................................................... 14 Near infrared spectroscopy (NIRS) ..................................................... 14 Positron emission tomography (PET) .................................................. 15
Cerebral blood volume (CBV) after cardiac arrest ................................... 15 Cerebral hemodynamics, metabolism and outcome ................................. 15 Positron emission tomography (PET) ...................................................... 16 Cardiac arrest and prediction of the neurological outcome ...................... 17
Biomarkers ........................................................................................... 18 Hypothermia ............................................................................................. 20
Neuroprotective mechanisms ............................................................... 20
Study aims ..................................................................................................... 22 Study I ...................................................................................................... 22 Study II ..................................................................................................... 22 Study III ................................................................................................... 22 Study IV ................................................................................................... 22
Materials and Methods .................................................................................. 23 Study I and study II .................................................................................. 23
Animal preparation .............................................................................. 23 Measurements ...................................................................................... 24
Experimental protocol ......................................................................... 24 PET methods ........................................................................................ 25 PET data analysis ................................................................................. 26
Study III and study IV .............................................................................. 26 Inclusion criteria and management protocol ........................................ 26 Monitoring ........................................................................................... 27 Outcome assessment ............................................................................ 28 Analysis of biomarkers ........................................................................ 28
Statistical analysis .................................................................................... 29 Study I and study II.............................................................................. 29 Study III and study IV ......................................................................... 29
Results ........................................................................................................... 30 Study I and study II .................................................................................. 30
Mean arterial pressure (MAP) ............................................................. 30 Cerebral blood flow ............................................................................. 31 Autoregulation ..................................................................................... 34 CMRO2 ................................................................................................ 35 OEF ...................................................................................................... 38 CBV ..................................................................................................... 39
Study III and study IV .............................................................................. 40 Patient characteristics .......................................................................... 41 BDNF ................................................................................................... 43 GFAP ................................................................................................... 43 NSE ...................................................................................................... 44 S-100B ................................................................................................. 46 Tau ....................................................................................................... 48
Discussion ..................................................................................................... 50 Cerebral blood flow, metabolism and blood volume ............................... 50 Autoregulation .......................................................................................... 53 Cooling time ............................................................................................. 53 Biomarkers ............................................................................................... 54 Outcome ................................................................................................... 56
Future perspectives ....................................................................................... 57
Conclusions ................................................................................................... 58
Acknowledgements ....................................................................................... 59
References ..................................................................................................... 61
Abbreviations
aEEG amplitude-integrated electroencephalogram BBB blood brain barrier BDNF brain derived neurotrophic factor CA cardiac arrest CBF cerebral blood flow CBV cerebral blood volume CCD crossed cerebellar diaschisis CMRO2 cerebral metabolic rate of oxygen CPC cerebral performance category CPR cardiopulmonary resuscitation CSF cerebrospinal fluid ECG electrocardiogram ELISA enzyme-linked immunosorbent assay FiO2 inspired fraction of oxygen FWHM full width at half maximum g global GCS Glasgow coma scale GFAP glial fibrillary acidic protein ICU intensive care unit IL-1 interleukin 1 IV intravenous, intravenously J joule MAP mean arterial pressure MB methylene blue MBq mega Becquerel MCAO middle cerebral artery occlusion MRI magnetic resonance imaging NDS neurological deficit score NIRS near infrared spectroscopy NSE neuron specific enolase OEF oxygen extraction fraction OHCA out of hospital cardiac arrest PEA pulseless electrical activity
PEEP positive end expiratory pressure PET r
positron emission tomography regional
ROC receiver operated characteristic ROI region of interest ROS radical oxygen species ROSC return of spontaneous circulation SSEP somatosensory evoked potentials TOI tissue oxygenation index TNFα tumor necrosis factor alfa V volt VF ventricular fibrillation VOI volume of interest voxel volume element

9
Introduction
The outcome after resuscitation from cardiac arrest is poor; in Sweden only 7-8% of out-of-hospital cardiac arrest victims survive more than 30 days [1]. Among in-hospital cardiac arrests, 18%-30% survive to hospital discharge [2, 3]. For patients admitted to the intensive care unit after CA, the mortality rate is in the range of 65%-71% [4]. This poor outcome is in large part attributable to cerebral injury after resuscitation from cardiac arrest, which is thought to arise from ischemia and also as a consequence of reperfusion injury [5, 6]. It is the degree of the anoxic/reperfusion cerebral injury that determines survival among those resuscitated [7]. The long-term neurologi-cal outcome after cardiac arrest is difficult to predict earlier than three days after ROSC [8]. Since the introduction of hypothermia treatment, even three days could be too short a period to determine the severity of the cerebral injury and the long-term neurological outcome [9]. These findings call atten-tion to the need to identify the factors resulting in permanent brain injury after resuscitation as well as highlighting the need for improved methods for an early and accurate prediction of the neurological outcome.
This thesis will focus on different methods to assess the cerebral damage after cardiac arrest and to compare these findings to the long-term neurologi-cal outcome.
10
Background
Cerebral injury after cardiac arrest The human brain tolerates 10 to 20 seconds of circulatory arrest before un-consciousness occurs due to loss of oxygen stores [10]. For complete re-versibility of the cerebral insult, a maximum of four to five minutes of cere-bral ischemia can be tolerated in adults [11].
Ischemia The biochemical cascades during and after brain ischemia are very complex and partially a matter of conjecture. During acute ischemia, energy stores in the brain become entirely depleted within five minutes. This causes mem-brane pump failure which is permissive to membrane depolarization with a subsequent rise in cytoplasmic calcium ion. The continuation of anaerobic glycolytic metabolism leads to lactate formation and cellular acidification [12, 13]. The acidification activates acid-sensing ion channels which results in a further influx of calcium [14].
Ischemia also results in a release of neuronal glutamate pools [15] which in itself is neurotoxic by an excitatory mechanism [16, 17] and also still fur-ther increases the intracellular calcium. The increase of intracellular calcium concentration due to ischemia can be 300-fold [18]. This level of intracellu-lar calcium activates lipases, endonucleases and proteases [19] which leads to irreversible breakdown of the membrane phospholipids and disruption of the cytoskeleton [20] as well as free radical generation [21].
Reperfusion During reperfusion, the most important mechanism for neuronal damage and death is thought to be the formation of radical oxygen species (ROS). During ischemia, the elevated levels of intracellular calcium activate the phospholi-pase A2 [22] which leads to a breakdown of cell membrane phospholipids into arachidonic acid [23]. Arachidonic acid is a polyunsaturated fatty acid, which, after reperfusion, is metabolised by cyclooxygenase to produce cyto-toxic levels of superoxide (O2
-) [24]. The elevated calcium concentration also activates a protease that converts the enzyme xanthine dehydrogenase to xanthine oxygenase, which further catalyzes the formation of superoxide
11
[25]. When the reperfusion is initiated, molecular oxygen, which is the sub-strate needed for superoxide formation, is supplied in abundance. The ROS are deleterious in several ways: they contribute to synaptic damage [26] and they can impair capillary endothelial cell mechanisms [27]. ROS can also damage cellular lipids, proteins and nucleic acids [20].
During reperfusion, the arachidonic acid, which is accumulated during ischemia, is metabolized by cyclooxygenase to produce prostaglandins and thromboxanes [28]. There is also a release of other pro-inflammatory media-tors such as tumor necrosis factor alpha (TNFα) [29] and interleukin-1 (IL-1) [30]. Both TNFα and IL-1 appear to exacerbate cerebral injury and prostag-landine and thromboxane release leads to cerebral edema and leakage in the blood brain barrier [31].
One of the late manifestations of ischemia is the occurrence of neuronal apoptosis which develops over days after the ischemic insult [32]. The apop-tosis after ischemia is mediated via the activation of caspases, which are a type of proteases [33].
Selective neuronal vulnerability Not all parts of the brain are equally vulnerable to an ischemic insult. His-tologically, the hippocampus, cerebellum and thalamus have been found to be selectively vulnerable to an ischemic insult [34, 35]. Furthermore, the neurons of layers 3, 5 and 6 of the neocortex are particularly vulnerable to an ischemic insult [36, 37]. Neuronal death in the neocortex and hippocampus was found to be more widespread among patients who had remained comatose after car-diac arrest, compared to those who regained consciousness [34]. Horstmann et al [38] found that patients resuscitated from cardiac arrest with subsequently persisting neuropsychological impairment were suffering from grey matter reduction in the vulnerable thalamus, hippocampus and cortical regions.
Cerebral blood flow (CBF) measurements after cardiac arrest The cerebral blood flow after resuscitation from cardiac arrest has been measured with several different methods:
Laser Doppler technique The laser Doppler technique has been extensively used in our research group. This procedure shows an initial hyperperfusion followed by a period of hypoperfusion at 30-60 minutes after ROSC and then a recovery to or above typical baseline values [39-41].This method was originally described
12
by Carter et al [42] as a technique for estimating CBF. It presents an advan-tage over other methods in that it continuously measures the CBF, but suf-fers from the disadvantage that it only estimates the CBF in the most super-ficial layers of cortex. Furthermore, Doppler methods do not measure the absolute value of CBF, but provide only an arbitrary index which cannot be compared between individuals.
Microspheres The microsphere method has been widely used for estimating CBF in ex-perimental animals during CPR [43, 44] and after ROSC [45]. The method is based upon the entrapment of minute plastic spheres within the arterioles following an intravenous bolus injection. The CBF measured with micro-spheres after ROSC displays a hypoperfusion at 20 min after ROSC and then a slight recovery in CBF at 240 min after ROSC. With microspheres, one can measure absolute regional CBF (rCBF) as well as global CBF (gCBF). However, there is a risk of non-homogenous mixing of the microspheres as well as shunting of the microspheres [46]. The microsphere technique does not measure CBF continuously but measures CBF at selected time points. It cannot be used in a clinical setting since the content of microspheres must be measured with autoradiography ex vivo, or by extracting the microspheres from brain samples.
Xenon-washout The xenon-washout method was first described by Obrist et al. more than three decades ago [47]. It has been used in measuring CBF after resuscitation from cardiac arrest [48]. However, the simple form of the method is based on measuring arterio-venous differences in the Xenon gas concentration, such that only the gCBF is calculated. Furthermore, the measurement of gCBF was done at least six hours after resuscitation from cardiac arrest. In this study [48], the gCBF was higher in patients not regaining consciousness after cardiac arrest, compared to that seen in patients who ultimately re-gained consciousness, but this difference was first seen at 15 hours after cardiac arrest.
Magnetic resonance imaging (MRI) The MRI technique for CBF measurement was described by Williams et al in 1992 [49]. This technique yields estimates of rCBF as well as gCBF. In a recent implementation of this method there was seen a hyperperfusion after ROSC, especially in cortex and hippocampus [50]. There is also a MRI study of CBF in patients, in which those patients with a hyperperfusion at four days after CA had complete morbidity [51].
13
Xenon computed tomography method The early Xenon method for measuring gCBF was extended for the tomo-graphic mapping of rCBF [52]. As employed in a study of resuscitation fol-lowing cardiac arrest [53], it revealed an initial hyperperfusion followed by a late (one to four hours post ROSC) hypoperfusion.
The acute CBF pattern after cardiac arrest shows an initial hyperperfusion after resuscitation, followed by a hypoperfusion lasting several hours, often with a slow return towards putative pre-arrest levels. However, these longi-tudinal studies showed that ROSC does not always establish reperfusion: The no-reflow phenomenon can occur due to impaired vascular patency [54]. In general, the longer the time of ischemia, the more pronounced is the no-reflow phenomenon.
Although the Xenon mapping of CBF after cardiac arrest is indeed an in-dex of cerebral perfusion, it is not known whether the alterations in CBF are associated with concomitant changes in global and regional cerebral oxygen metabolism, or a return of perfusion to tissue with a severe metabolic im-pairment. Indeed, it is an assumption that CBF is directly coupled to cerebral metabolism, which can be more properly determined in imaging studies measuring the cerebral metabolic rate of glucose (CMRglc), or in the present context, that of oxygen (CMRO2), which provides a direct indication of the rate of aerobic respiration by neurons.
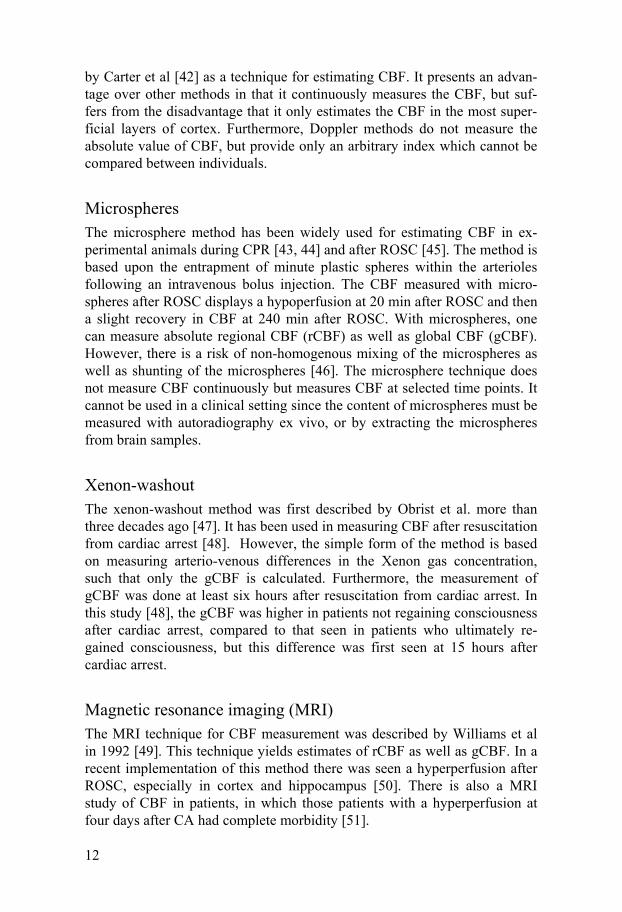
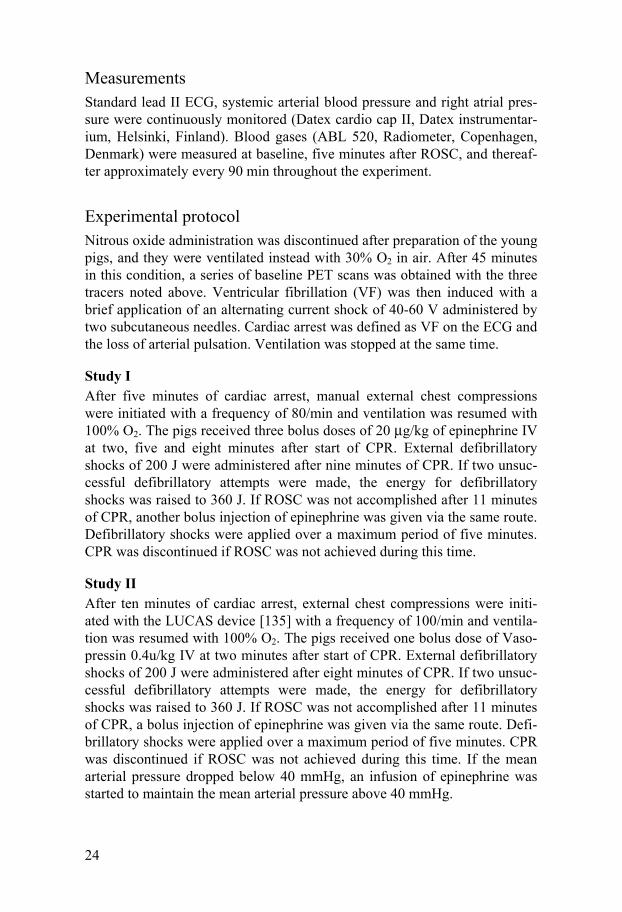
Autoregulation Normally, the cerebral blood flow remains constant through a wide range of arterial pressure by the action of precapillary sphincters (Figure 1) [55]. The autoregulation seems to be impaired after cardiac arrest [56, 57]. A disturbed autoregulation after cardiac arrest further stresses the importance of a suffi-cient MAP since an excessive decrease in MAP could impair cerebral blood flow.
14
Figure 1. Cerebral blood flow as a function of mean arterial pressure (MAP).
Cerebral metabolic rate of oxygen (CMRO2) measurements after cardiac arrest The CMRO2 after cardiac arrest has been measured by a variety of tech-niques:
A-V difference Global CMRO2 (gCMRO2) is derived by measurements of the A-V differ-ence in oxyhemoglobin concentration [58] [53]. In studies using this tech-nique, the magnitude of gCMRO2 decreases after ROSC. The magnitude of the gCMRO2 was low during the early hyperperfusion phase, and increased somewhat during the hypoperfusion period [53], which was thought to be indicative of ischemia or inadequate perfusion. However, this method cannot reveal regional changes in metabolism (rCMRO2).
Near infrared spectroscopy (NIRS) This is a non-invasive method measuring the fraction of oxygenated haemo-globin relative to the total haemoglobin content, which yields the tissue oxy-genating index (TOI). In contrast to a pulse oximetry, NIRS measures the oxygenation ratio in the composite of arterial, capillary and venous blood in the vicinity of the probe. NIRS after resuscitation from cardiac arrest showed a decrease in TOI compared to baseline, with a return towards baseline val-ues during the first hour after ROSC [59].
15
Positron emission tomography (PET) As will be described in more detail below, PET can be used for mapping the regional CBF and CMRO2 in brain with high spatial resolution. Hitherto there have been two such applications for studies of ROSC in patients [60, 61]. These studies did not investigate the acute phase after cardiac arrest, but were conducted at 24 hours or more after ROSC, due to the logistics of con-ducting such studies in acute cases. In a preclinical study of focal ischemia, low levels of CMRO2 were found to correlate well with the extent and posi-tion of histologically-verified infarction [62].
Cerebral blood volume (CBV) after cardiac arrest The cerebral blood volume (CBV) during cardiac arrest has been measured with MRI [63]. It has also been measured with a photoelectric method [64], which revealed a transient hyperemia shortly after ROSC and then a gradual decrease during three hours.
Cerebral hemodynamics, metabolism and outcome The correlation between CBF after cardiac arrest and outcome has been stud-ied in experimental models and clinical cases, giving disparate results. One study found a correlation between the gCBF during the first 15 minutes after ROSC and outcome, where the rats with higher CBF had a better outcome [50]. Inoue et al also found a positive correlation between CBF after 48 hours and outcome in patients [65]. In a PET study by Edgren et al, there was no obvious difference in CBF between those patients regaining con-sciousness and those with persisting coma [61]. However, Cohan et al [48] found a higher gCBF in the patients who did not survive cardiac arrest than in those who survived. Likewise, the patients studied by Järnum et al [51] with a high CBF did not survive.
In a pig study, the animals with the best neurological outcome 24 hours after ROSC showed a lower oxygen extraction ratio five minutes after ROSC [66]. In summary, a variety of methods have been used to study haemodynamics and energy metabolism following ROSC. Non-tomographic methods do not provide information about the entire pattern of these changes. CBF changes must be interpreted with caution, since the coupling between CBF and CMRO2 is not always certain. An important index of this coupling is pro-vided from the oxygen extraction fraction (OEF), which equals the fraction of the available oxygen in blood that is utilized by the brain tissue. In some
16
earlier studies, the magnitudes of gCMRO2 and gCBF were used to evaluate the global extent of coupling. This approach revealed uncoupling of CBF and CMRO2 early after ROSC [67, 68], and at three hours after ROSC fol-lowing 20 minutes of global cerebral ischemia [68]. Also Beckstead et al noted an uncoupling in patients 24-60 hours after ROSC [69].The return of normal OEF following reperfusion is expected to be a more direct indicator of neuronal survival than is provided by CBF measurements. However, the spatial pattern of the relationship between CBF and CMRO2 after ROSC following cardiac arrest is not known.
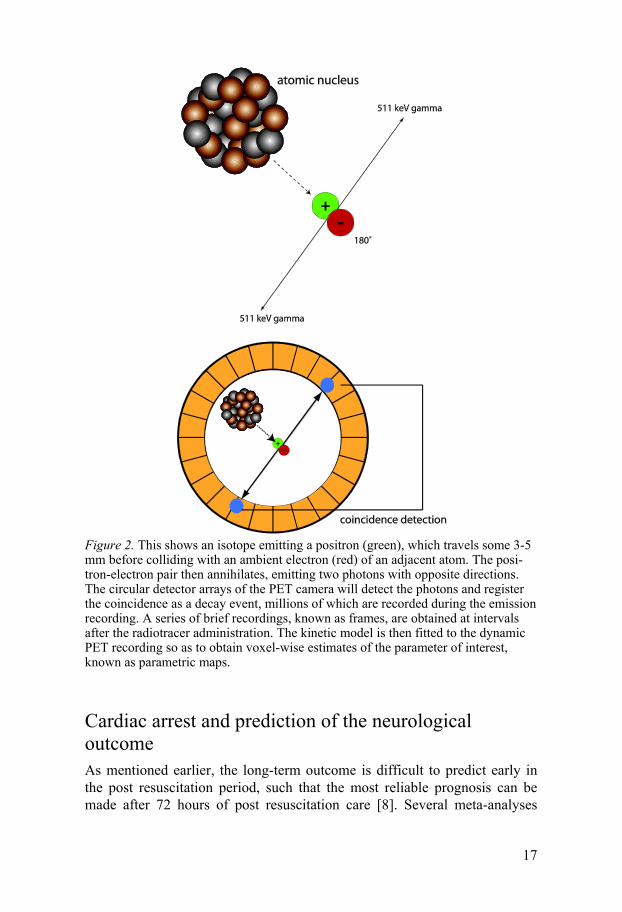
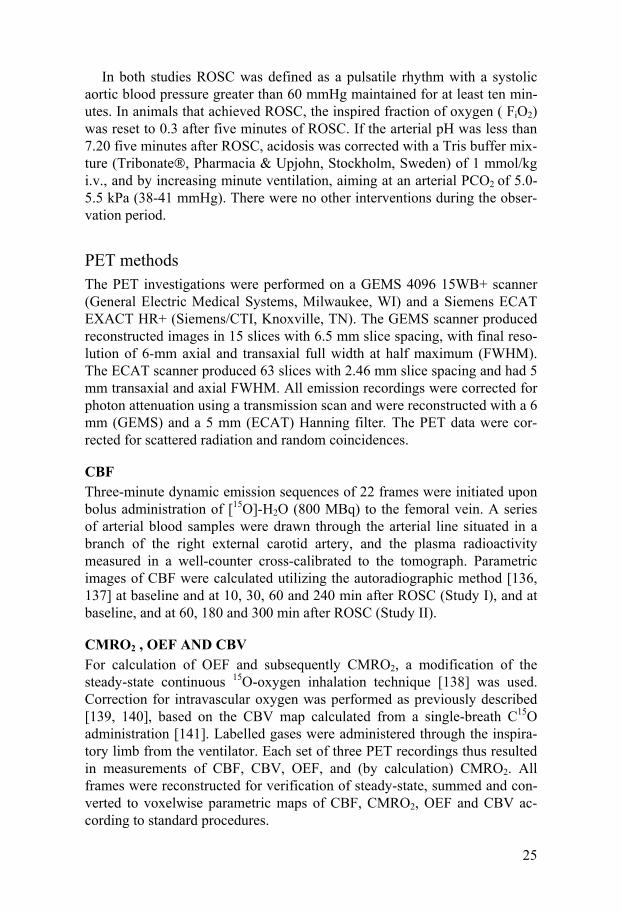
Positron emission tomography (PET) PET is a non invasive method that measures radioactive tracer concentra-tions regionally in a tissue, as a function of time after tracer administration. Certain isotopes decay by a mode in which a positron is emitted. After trav-elling a distance of a few millimetres, the positron collides with an electron from the tissue. The collision of matter and antimatter particles is followed by annihilation, with the emission of two gamma photons in nearly opposite directions (Figure 2), each with 512 keV energy corresponding to the rest mass energy of the positron-electron pair. These photons are detected by a pair of detectors in the PET camera as a coincidence event, the rate of which corresponds to the radioactivity concentration in a volume element (voxel). Depending on the physiological characteristics of the tracer, the time-dependent radioactivity will support the calculation of physiological parame-ters such as CBF or CMRO2. All three tracers used in this thesis contain 15Oxygen (15O), which has a half-life of 123 seconds. Molecular oxygen (15O2) was used for measuring CMRO2, water (H2
15O) for measuring CBF, and carbon monoxide (C15O), which is bound to haemoglobin, was used for measuring CBV, as required for the constrained calculation of CMRO2. The mathematical methods for calculating these parameters are based upon the convolution integral. For example, the cerebral blood flow is calculated ac-cording to this equation:
where Ct is the calculated tissue activity concentration at time T, Ca is the arterial activity concentration at time T, and λ is the blood-brain partition coefficient and CBF is the parameter to be calculated.
−==2
1
2
1
)/()()(T
T
tCBFa
T
T
t dtetCCBFdttCC λ
17
Figure 2. This shows an isotope emitting a positron (green), which travels some 3-5 mm before colliding with an ambient electron (red) of an adjacent atom. The posi-tron-electron pair then annihilates, emitting two photons with opposite directions. The circular detector arrays of the PET camera will detect the photons and register the coincidence as a decay event, millions of which are recorded during the emission recording. A series of brief recordings, known as frames, are obtained at intervals after the radiotracer administration. The kinetic model is then fitted to the dynamic PET recording so as to obtain voxel-wise estimates of the parameter of interest, known as parametric maps.
Cardiac arrest and prediction of the neurological outcome As mentioned earlier, the long-term outcome is difficult to predict early in the post resuscitation period, such that the most reliable prognosis can be made after 72 hours of post resuscitation care [8]. Several meta-analyses
18
have investigated available data on methods for predicting the long-term neurological outcome after cardiac arrest [70-75]. All of these are based on data collected before the advent of hypothermia treatment. The adoption of hypothermia treatment may present alternative prognostic indicators. For example, motor response with extensor posturing on day three after CA was associated with poor outcome before the introduction of hypothermia treat-ment, although some patients with extensor posturing on day three regained consciousness [9] after the hypothermia treatment implemented.
The induction of mild hypothermia requires the patient to be sedated for the 24 hours of hypothermia treatment and eight hours of rewarming; this 32 hour interval of sedation delays the time point at which a prognostic clinical investigation can be made by at least 24 hours. The metabolism of sedative and paralyzing drugs is also prolonged during hypothermia [76]. Indeed, the length of stay at the ICU was prolonged with two days for patients with hy-pothermia treatment [77]. Subsequently, somatosensory evoked potentials (SSEP) and amplitude-integrated electroencephalogram (aEEG) have proven to predict outcome [78, 79] when administered under normothermia [78, 80] and after 24-48 hours after resuscitation [79]. In addition, Glasgow coma scale (GCS) can predict outcome [81].
Biomarkers To facilitate the prediction of the neurological outcome after cardiac arrest, several different biochemical markers have been tested. An ideal marker for prediction of outcome would have the following properties:
• It should be able to predict outcome at an early stage • It should have a high sensitivity in predicting outcome • It should have a high specificity in predicting outcome • It should be analyzed from a easily available medium (blood,
plasma or serum) • The analysis should be fast, commonly available and reliable
Hitherto no such marker has been identified. Many different markers have been evaluated, and more are being tested. This thesis does not entail a com-plete description of markers for neuronal injury, but will focus on some of the more promising markers.
BDNF Brain-derived neurotrophic factor (BDNF), is a neurotrophin [82] with a molecular weight of 14 kDa [83]. Its plasma concentration is increased in rats treated with mild hypothermia after cardiac arrest, compared to nor-mothermic animals [84]. An intraventricular infusion of BDNF reduces in-farct size and improves neurological deficit score (NDS) after middle cere-
19
bral artery occlusion (MCAO) in rats [85]. However, after cardiac arrest in rats, no beneficial effects were seen after BDNF administration [86, 87].
GFAP Glial fibrillary acidic protein (GFAP), is a structural protein expressed in astrocytes [88]. Plasma levels of GFAP increase after stroke [89], traumatic brain injury [90], subarachnoid haemorrhage [91], and cardiac arrest [92, 93]; the extent of the increase was predictive of outcome in all these conditions.
NSE Neuron specific enolase (NSE) is a dimer protein of identical 39 kDa units. NSE is a glycolytic protein expressed exclusively in neurons [94] and neuro-endocrine cells [95]. Brain ischaemia releases NSE into the circulation, where it has a half-life of about 30 hours [96]. NSE was first described as an outcome predictor in 1989 [97] and has been studied after cardiac arrest [98-100]. However, all these studies were done before the advent of hypothermia treatment after cardiac arrest. With hypothermia treatment, prediction of outcome by NSE is not as accurate as with normothermia, but a decrease in NSE values between 24 and 48 hours, has been found to be associated with a good outcome in patients treated with mild hypothermia following ROSC [101]. In two other studies, NSE was also a good predictor of outcome after hypothermia treatment [102, 103]. Recent data question the prognostic value of NSE after hypothermia treatment after cardiac arrest [80].
S-100B S-100B is an acidic protein with a molecular weight of 21 kDa containing a calcium binding motif. Its name refers to its unique solubility in saturated ammonium sulphate solution, at neutral pH [104]. S-100 is a family of pro-teins, consisting of about 16 isoforms [105]. It is expressed in brain astro-cytes and in peripheral adipocytes, but can also be detected in serum, where it has a half-life of approximately 25 minutes [106]. As for NSE, several studies have investigated the properties of S-100B after cardiac arrest [73, 107, 108]. However, the majority of patients included in these studies were not treated with hypothermia. After the advent of hypothermia treatment, two studies assessed the predictive value of S-100B which proved to be sub-stantially predictive of the neurological outcome [101, 103].
Tau Tau (τ) protein was first described in 1975 [109] as a microtubule protein localized in neuronal axons [110]. Its presence in blood or CSF is as a marker for axonal loss of grey matter axons [111], with particular impor-tance in the investigation of Alzheimer disease [112]. Two independent stud-ies implementing ELISA for the assay of tau in plasma suggest a prognostic value in acute ischemic stroke, [111, 113] , closed head injury and mild
20
traumatic brain injury [114, 115], and biluribin-induced neurotoxicity [116]. Tau levels after cardiac arrest have not hitherto been studied.
Hypothermia The use of hypothermia as a clinical treatment after cardiac arrest was first used in 1958 [117]. The treatment was never generally adopted, maybe be-cause of the adverse effects of moderate to severe hypothermia (below 30°C) which was most commonly used. In 1990, a study of hypothermia treatment after cardiac arrest in dogs demonstrated a better outcome in the animals with this treatment [118]. In 2002 there appeared two randomized controlled studies where hypothermia improved neurological outcome [119, 120] and survival [120] of comatose patients after cardiac arrest. In addition, cross-sectional studies of hypothermia treatment compared to historical controls reported beneficial effects of hypothermia treatment [121, 122]. Hypother-mia treatment is now recommended both by the European Resuscitation Council [123] and American Heart Association [124].
Neuroprotective mechanisms The mechanisms of the neuroprotective effect of hypothermia are com-
plex and not fully understood, but are believed to include several factors such as suppression of the neuroexcitatory cascade and decrease of the amounts of free radicals [125].
Cerebral metabolism Cerebral metabolism decreases with a reduction in temperature. For every degree Celsius between 37 and 27°C, cerebral metabolism is decreased with approximately 8% [126]. However, the beneficial effects of mild hypother-mia could not be due to a decrease in metabolism alone [127].
ROS formation Hypothermia attenuates the formation of ROS during reperfusion after glob-al ischemia [128, 129]. There is also a decrease in the lipid peroxidation during hypothermia compared to normothermia, which is obtained through higher levels of free radical scavengers [130].
Excitatory amino acids Glutamate production is decreased during hypothermia after MCAO [131]. There is also a decerease of glutamate production after global ischemia in hypothermic rabbits compared to normothermic rabbits [132].
21
Apoptosis Induced apoptosis in neurons in vitro is suppressed by hypothermia [133]. After ischemia, caspase activity, which mediates apoptosis, was decreased by hypothermia treatment in rats [134].
Although beneficial for survival and outcome, hypothermia treatment has made the early prediction of outcome more difficult. Neither the biomarkers S-100B and NSE [101] nor clinical signs [9] can be used in the same manner as for patients not treated with hypothermia. Data on outcome prediction after hypothermia treatment are also sparse.
22
Study aims
Study I To assess the rCBF as a function of time after ROSC, so as to reveal changes in the spatial pattern of CBF the first hours after resuscitation from cardiac arrest.
Study II To extend these findings for the study of rCBF as well as the rCMRO2 in the hours after ROSC from cardiac arrest, so as to calculate maps of rOEF for the identification of regions with a perfusion/metabolism mismatch. To assess the global cerebral blood volume.
Study III To evaluate the biomarkers S-100B and NSE for cerebral damage and out-come prediction after hypothermia treatment after cardiac arrest and to com-pare them with the plausible markers BDNF and GFAP. To compare the cooling time (the time from the start of cooling to target temperature) in patient groups with a good and poor neurological outcome.
Study IV To evaluate tau protein as a marker for cerebral damage after hypothermia treatment after cardiac arrest.
23
Materials and Methods
Study I and study II The design of the two studies, and the care and handling of the animals, were reviewed and approved by the Institutional Review Board for Animal Ex-perimentation in Uppsala, Sweden.
Nine (study I) and four (study II) young pigs of Swedish country breed of both genders were included in the study. They were 10-12 weeks old and had a mean weight of 25.6 ± 2.3 kg (study I) and 25.1 ± 2.6 kg (study II).
Animal preparation All animals were fasting with free access to water during the night before the experiment. They were delivered directly to the laboratory by the same sup-plier on the morning of the experiment. Anesthesia was induced with an intramuscular injection of tiletamine and zolazepam 6 mg/kg, xylazine 2 mg/kg, and atropine 0.04 mg/kg. A peripheral ear vein was cannulated for induction and maintenance of anesthesia, and for fluid administration. Mor-phine 1 mg/kg and ketamine 100 mg were given IV as a single bolus injec-tion. Anesthesia was maintained by continuous intravenous infusion of 8 mg/kg/h of pentobarbital, 0.25 mg/kg/h of pancuronium bromide and 0.5 mg/kg/h of morphine. Water losses were corrected with a bolus IV infusion of 30 ml/kg of acetated Ringers solution during one hour before the experi-ment, followed by a continuous IV infusion of 2.5% glucose at a rate of 10 ml/kg/h during the whole experiment. The pigs were tracheostomised and mechanically ventilated (Servo Ventilator 900C, Siemens-Elema, Solna, Sweden) with a 70/30 mixture of N2O/O2 during preparation. Volume-controlled ventilation was continuously adjusted to maintain the arterial PCO2 within a range of 5.0-5.5 kPa (38-41 mmHg). A positive end-expiratory pressure (PEEP) of 5 cm H2O was applied. Catheters were in-serted into the right atrium (7 French) for drug administration and pressure monitoring and into the aortic arch via a branch of the right external carotid artery (18 Gauge) for pressure monitoring and blood sampling. Another ca-theter (7 French) was inserted into the right femoral vein for tracer injection.
24
Measurements Standard lead II ECG, systemic arterial blood pressure and right atrial pres-sure were continuously monitored (Datex cardio cap II, Datex instrumentar-ium, Helsinki, Finland). Blood gases (ABL 520, Radiometer, Copenhagen, Denmark) were measured at baseline, five minutes after ROSC, and thereaf-ter approximately every 90 min throughout the experiment.
Experimental protocol Nitrous oxide administration was discontinued after preparation of the young pigs, and they were ventilated instead with 30% O2 in air. After 45 minutes in this condition, a series of baseline PET scans was obtained with the three tracers noted above. Ventricular fibrillation (VF) was then induced with a brief application of an alternating current shock of 40-60 V administered by two subcutaneous needles. Cardiac arrest was defined as VF on the ECG and the loss of arterial pulsation. Ventilation was stopped at the same time.
Study I After five minutes of cardiac arrest, manual external chest compressions were initiated with a frequency of 80/min and ventilation was resumed with 100% O2. The pigs received three bolus doses of 20 μg/kg of epinephrine IV at two, five and eight minutes after start of CPR. External defibrillatory shocks of 200 J were administered after nine minutes of CPR. If two unsuc-cessful defibrillatory attempts were made, the energy for defibrillatory shocks was raised to 360 J. If ROSC was not accomplished after 11 minutes of CPR, another bolus injection of epinephrine was given via the same route. Defibrillatory shocks were applied over a maximum period of five minutes. CPR was discontinued if ROSC was not achieved during this time.
Study II After ten minutes of cardiac arrest, external chest compressions were initi-ated with the LUCAS device [135] with a frequency of 100/min and ventila-tion was resumed with 100% O2. The pigs received one bolus dose of Vaso-pressin 0.4u/kg IV at two minutes after start of CPR. External defibrillatory shocks of 200 J were administered after eight minutes of CPR. If two unsuc-cessful defibrillatory attempts were made, the energy for defibrillatory shocks was raised to 360 J. If ROSC was not accomplished after 11 minutes of CPR, a bolus injection of epinephrine was given via the same route. Defi-brillatory shocks were applied over a maximum period of five minutes. CPR was discontinued if ROSC was not achieved during this time. If the mean arterial pressure dropped below 40 mmHg, an infusion of epinephrine was started to maintain the mean arterial pressure above 40 mmHg.
25
In both studies ROSC was defined as a pulsatile rhythm with a systolic aortic blood pressure greater than 60 mmHg maintained for at least ten min-utes. In animals that achieved ROSC, the inspired fraction of oxygen ( FiO2) was reset to 0.3 after five minutes of ROSC. If the arterial pH was less than 7.20 five minutes after ROSC, acidosis was corrected with a Tris buffer mix-ture (Tribonate®, Pharmacia & Upjohn, Stockholm, Sweden) of 1 mmol/kg i.v., and by increasing minute ventilation, aiming at an arterial PCO2 of 5.0-5.5 kPa (38-41 mmHg). There were no other interventions during the obser-vation period.
PET methods The PET investigations were performed on a GEMS 4096 15WB+ scanner (General Electric Medical Systems, Milwaukee, WI) and a Siemens ECAT EXACT HR+ (Siemens/CTI, Knoxville, TN). The GEMS scanner produced reconstructed images in 15 slices with 6.5 mm slice spacing, with final reso-lution of 6-mm axial and transaxial full width at half maximum (FWHM). The ECAT scanner produced 63 slices with 2.46 mm slice spacing and had 5 mm transaxial and axial FWHM. All emission recordings were corrected for photon attenuation using a transmission scan and were reconstructed with a 6 mm (GEMS) and a 5 mm (ECAT) Hanning filter. The PET data were cor-rected for scattered radiation and random coincidences.
CBF Three-minute dynamic emission sequences of 22 frames were initiated upon bolus administration of [15O]-H2O (800 MBq) to the femoral vein. A series of arterial blood samples were drawn through the arterial line situated in a branch of the right external carotid artery, and the plasma radioactivity measured in a well-counter cross-calibrated to the tomograph. Parametric images of CBF were calculated utilizing the autoradiographic method [136, 137] at baseline and at 10, 30, 60 and 240 min after ROSC (Study I), and at baseline, and at 60, 180 and 300 min after ROSC (Study II).
CMRO2 , OEF AND CBV For calculation of OEF and subsequently CMRO2, a modification of the steady-state continuous 15O-oxygen inhalation technique [138] was used. Correction for intravascular oxygen was performed as previously described [139, 140], based on the CBV map calculated from a single-breath C15O administration [141]. Labelled gases were administered through the inspira-tory limb from the ventilator. Each set of three PET recordings thus resulted in measurements of CBF, CBV, OEF, and (by calculation) CMRO2. All frames were reconstructed for verification of steady-state, summed and con-verted to voxelwise parametric maps of CBF, CMRO2, OEF and CBV ac-cording to standard procedures.
26
PET data analysis All individual CBF, CMRO2 and OEF maps were manually co-registered to the pig atlas in the common stereotaxic space [142] using the REGISTER (Montreal Neurological Institute) program [143] and nine degrees of free-dom. For the registration, midline tag points were placed at the frontal and occipital poles, the extreme dorsal extension of the cerebral cortex, the dor-sal-most cerebellum and the medulla oblongata. Other tag points were placed bilaterally in the frontal lobes, in the lateral cerebellar hemispheres and in the temporal cortex. After spatial normalization of the parametric maps, mean magnitudes of CBF, CMRO2 and OEF were calculated in the statisti-cally defined anatomical VOI templates [142] for the cerebellum, thalamus, striatum, frontal cortex, occipital cortex, temporal cortex, diencephalon and mesencephalon. The weighted averages for each region were then calculated in order to estimate the global CBF, CMRO2 and OEF. We also defined three larger or composite regions: the entire cerebellum, subcortical regions (the weighted mean of thalamus, striatum, diencephalon and mesencephalon) and cortical regions (weighted mean of frontal, occipital and temporal cor-tex).
Cerebral blood volume was calculated by drawing a ROI in each slice of the PET image and then aligning these ROIs to a VOI consisting of the whole brain.
Study III and study IV This study was carried out at the general intensive care unit at Uppsala Uni-versity Hospital, Sweden. The study was approved by the Human Ethics Committee of Uppsala, Sweden. Consent to participation was obtained from a legal next of kin, and later from survivors, when considered competent.
Inclusion criteria and management protocol Inclusion criteria for patients were: age >18 years; and systolic blood pres-sure > 80 mmHg for more than five minutes after ROSC and unconscious (before the use of sedatives/hypnotics), with a Glasgow Coma Scale (GCS) < 7, with inclusion less than six hours following resuscitation from cardiac arrest. Patients with a terminal disease or a primary coagulopathy were ex-cluded. Patients admitted more than 6 hours after cardiac arrest were ex-cluded.
Hypothermia treatment was started on admission, immediately after re-suscitation, with an intravenous infusion of 30 ml/kg of 4 ºC normal saline. Ice packs were placed in the groin and armpits, and along the neck. The times from cardiac arrest to target temperature and from start of cooling to
27
target temperature were recorded. The planned duration of hypothermia treatment was 24 h, based on the results by the Hypothermia Study Group [120]. It was estimated that the first two hours after the cardiac arrest would be occupied by transportation to hospital and the decision-making about hypothermia treatment. The target temperature of 32–34 °C was thus main-tained by the application of ice packs for up to 26 h after the estimated time of cardiac arrest. Thereafter the patients were passively re-warmed at 0.5 ºC/h to normothermia, defined as 36.5ºC. During hypothermia treatment, the patients were sedated with infusions of fentanyl at 0.5 – 2 µg/kg/h and pro-pofol at 0.3-4 mg/kg/h (at the lowest possible range to keep the patient an-aesthetized). The patients’ sedation was evaluated according to standard ICU care. If shivering occurred during induction of hypothermia, we administered extra bolus doses of fentanyl and transiently increased the infusion rate of propofol. If the patient still shivered, he or she received rocuronium, either at an intravenous bolus dose of 0.6 mg/kg, or as an infusion of 0.15 mg/kg/h. When normothermia was attained, the sedation was terminated, so as to al-low evaluation of the neurological status.
Mechanical ventilation was administered during the period of coma, with aims to maintaining PaO2 of ≥ 12 kPa (90 mmHg) and PaCO2 between 5.0 and 5.5 kPa (38-41 mmHg). The target MAP was 65-100 mmHg, with appli-cation of inotropic/ vasopressor support, if required, using dobutamine as the first line medication, followed by noradrenaline (norepinephrine) or adrena-line (epinephrine), if necessary. If the patient was considered euvolaemic but had a diuresis of less than 0.5 ml/kg/h, furosemide was administered. Fu-rosemide was also given if the intensive care physician considered that the patient had a fluid overload. All patients received an arterial line in the radial or femoral artery for blood pressure monitoring and blood sampling, and a central venous line in the internal jugular vein.
Monitoring Core temperature was continuously measured in the bladder and recorded every fifteen minutes (Curity temperature KAD, Coviden/Tyco). Diuresis was measured hourly. Respiratory parameters were monitored according to general practice in the intensive care unit. Haemodynamic information was obtained by measurement of arterial blood pressure and heart rate continu-ously, with recording every hour. Central venous pressure was recorded at intervals. Serial blood samples were collected, starting as soon as possible in the emergency phase (within six hours after cardiac arrest), and continuing at 1, 2, 6, 12, 24, 48, 72, 96, and 108 hours after cardiac arrest.
28
Outcome assessment The patients were assessed in accordance with the Glasgow-Pittsburgh cere-bral performance category (CPC) scale [144] at discharge from the intensive care unit and six months after cardiac arrest. The CPC scale ranges from 1 to 5, according to the following criteria: CPC 1: Good cerebral performance: conscious, alert, able to work, might
have mild neurological or psychological deficit. CPC 2: Moderate cerebral disability: conscious, sufficient cerebral function
for independent activities of daily life. CPC 3: Severe cerebral disability: conscious, dependent on others for daily
support because of impaired brain function. CPC 4: Coma or vegetative state: any degree of coma without the presence
of complete brain death criteria. Unawareness, even if appears awake (vegetative state) without interaction with the environment; may have spontaneous eye opening and sleep/awake cycles.
CPC 5: Death. A CPC of 1 or 2 was considered a good outcome and a CPC score of 3-5 a poor outcome, as described in previous studies [101, 103, 145]. For patients who died after ICU discharge, the better of the two scores was used, as rec-ommended by the Utstein templates [146].
Analysis of biomarkers BDNF, GFAP and NSE were measured in blood samples taken 1, 2, 6, 12, 24, 48, and 96 hours after cardiac arrest. Plasma concentrations of BDNF and NSE were determined by a biochip array technique (Evidence Investiga-tor: Randox, Crumlin, UK) as previously described [147]. GFAP levels in plasma were measured by a previously described ELISA [90]. The detection limit for GFAP values was 30 ng/l, and values below this limit were set to 30 ng/l. S-100B in blood samples collected 1, 2, 24, 48, 72 and 108 hours after cardiac arrest was analyzed on a Modular E170 (Roche Diagnostics, Mann-heim, Germany) with reagents from the same manufacturer. The total ana-lytical imprecision of the assay was 1.9% at 0.2 µg /l and 2.7% at 2.5 µg/l. The analysis measures the composite of homo- and heterodimers (S-100BB and S-100AB).
Tau analysis Plasma samples were collected at 2, 6, 12, 24, 48 and 96 hours after cardiac arrest. Carboxylated microsphere beads were chemically coupled with the mouse monoclonal antibody, BT2 [148, 149] according to the protocol from the manufacturer. After quality control of the antibody coupling, approxi-mately 3000 beads were put on a filterplate (Millipore Corporation, Brussels, Belgium MABVN1250) and the buffer was removed. Plasma samples were
29
diluted 1:3 in buffer containing detergent as described in for the INNO-BIA plasma Aßforms [150, 151] in duplicate, together with 25 µL of two bioti-nylated mouse anti-human tau antibodies, YT1.1 and YT1.15. Calibration standards with a concentration calibrated to the INNOTEST hTau antigen were added to some samples in order to generate a standard curve. After overnight incubation at 4°C on a plate shaker, the plates were washed three times with phosphate buffer solution (PBS) containing detergents and a solu-tion containing streptavidine-phycoerythrine (SV-PE, Moss Inc, Maryland, US) was added. Thereafter, incubation proceeded for one hour at room tem-perature on the plate shaker. Next, the beads were washed three times before resuspension in PBS and colorometric reading after excitation of the phyco-erythrine by a laser at 532 nm on a Luminex 100IS (Luminex, Austin, Texas, US). Tau concentrations in plasma samples were estimated with the calibra-tion standard curve, which was linear across a wide range of concentrations.
Statistical analysis Study I and study II All data are expressed as means ± standard deviation. Repeated measures ANOVA was used to analyze the CBF by region over time. If the changes over time were significant by ANOVA, t-tests were performed to determine at which time points there were significant differences. Bonferroni correc-tion was used to constrain the type I error at less than 5%. The Student’s t-test for independent samples was used to compare the different regions to each other at the same time point. P-values < 0.05 were considered signifi-cant. The statistical analyses were calculated using the STATISTICA pro-gram (Statsoft Scandinavia, Uppsala, Sweden).
Study III and study IV For all statistics except the ROC curve analysis, the Statistica program (Statsoft Scandinavia, Sweden) was used. Outliers were defined as values more than 1.5 times the interquartile range from the 25th or 75th percentile. Differences in frequencies between good and poor groups were tested for significance with Fischer’s exact test. The significance of differences be-tween a good and poor outcome was determined with the Mann-Whitney U test, where p<0.05 was defined as significant. ROC curve analysis was per-formed, using the Medcalc program (Medcalc Software, Belgium).
30
Results
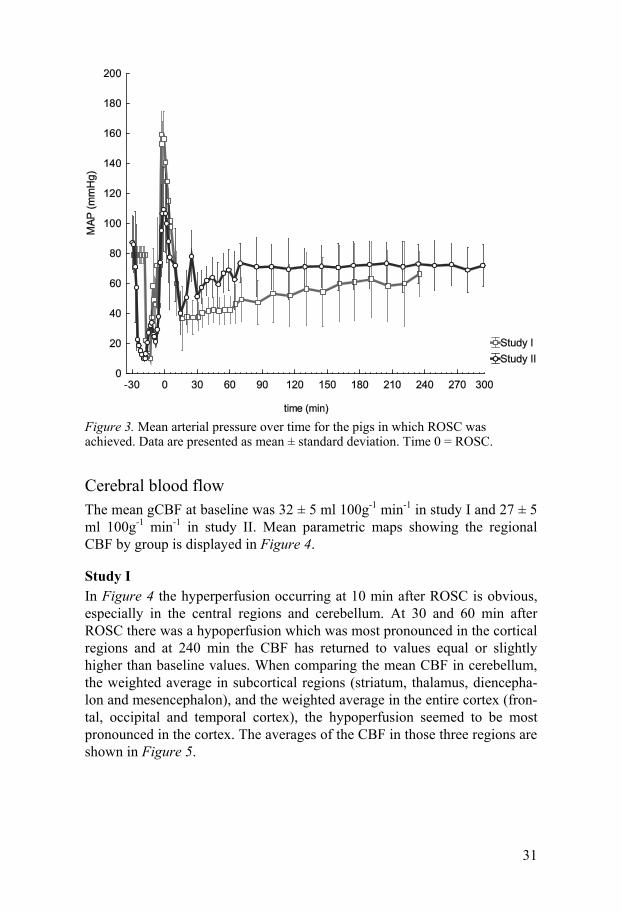
Study I and study II Of the nine pigs in study I, ROSC was achieved in six. One pig was ex-cluded due to pathologically low baseline CBF values. ROSC was achieved in all four pigs of study II. The CBF values in study I were thus obtained from five pigs. The CBF, CMRO2 and OEF values in study II were obtained from four animals.
Mean arterial pressure (MAP) The MAP showed a similar pattern over time in studies I and II. There was an initial peak shortly after ROSC, with a hypotensive period beginning at 30 min after ROSC, followed by a slow recovery. The MAP over time for studies I and II are displayed in Figure 3.
31
Figure 3. Mean arterial pressure over time for the pigs in which ROSC was achieved. Data are presented as mean ± standard deviation. Time 0 = ROSC.
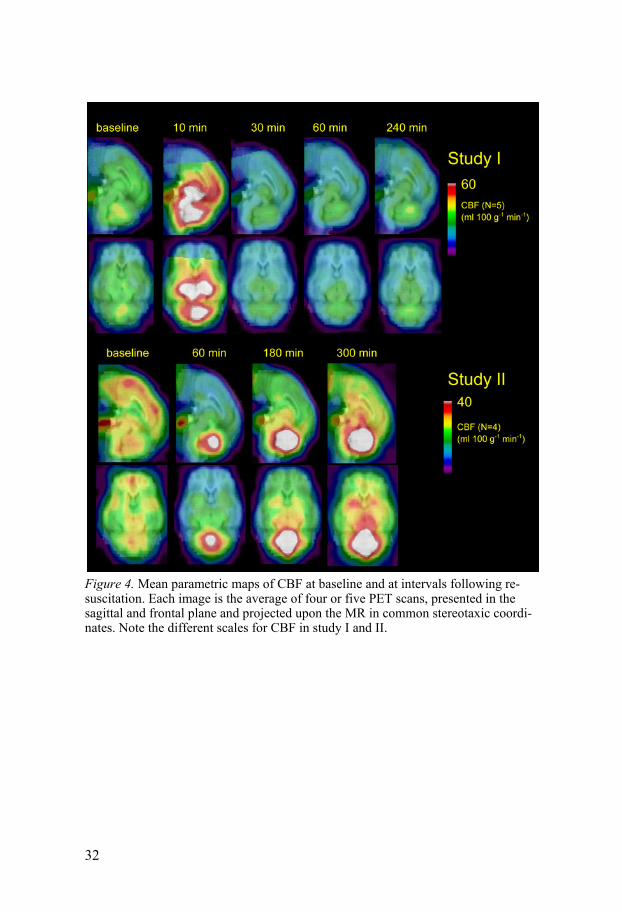
Cerebral blood flow The mean gCBF at baseline was 32 ± 5 ml 100g-1 min-1 in study I and 27 ± 5 ml 100g-1 min-1 in study II. Mean parametric maps showing the regional CBF by group is displayed in Figure 4.
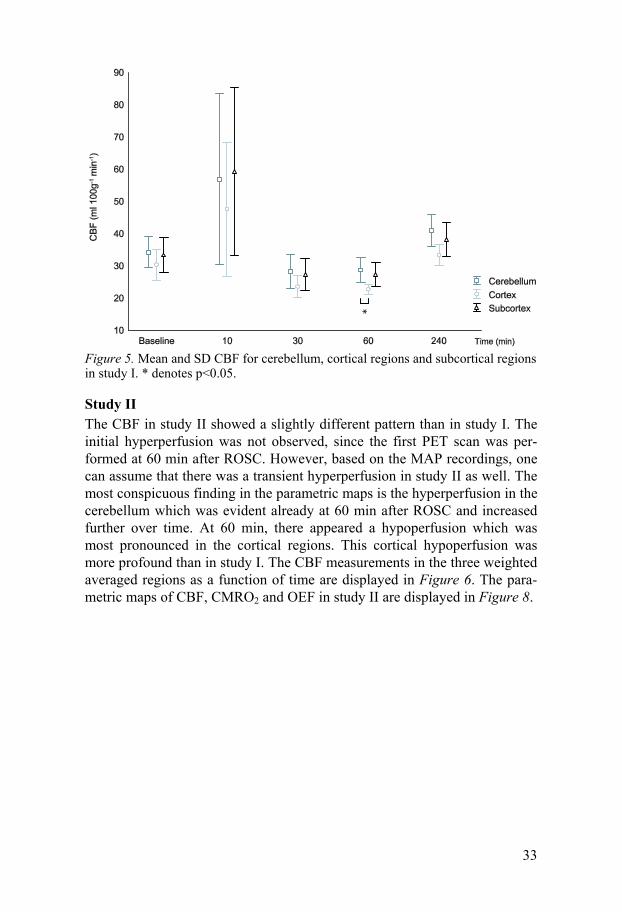
Study I In Figure 4 the hyperperfusion occurring at 10 min after ROSC is obvious, especially in the central regions and cerebellum. At 30 and 60 min after ROSC there was a hypoperfusion which was most pronounced in the cortical regions and at 240 min the CBF has returned to values equal or slightly higher than baseline values. When comparing the mean CBF in cerebellum, the weighted average in subcortical regions (striatum, thalamus, diencepha-lon and mesencephalon), and the weighted average in the entire cortex (fron-tal, occipital and temporal cortex), the hypoperfusion seemed to be most pronounced in the cortex. The averages of the CBF in those three regions are shown in Figure 5.
32
Figure 4. Mean parametric maps of CBF at baseline and at intervals following re-suscitation. Each image is the average of four or five PET scans, presented in the sagittal and frontal plane and projected upon the MR in common stereotaxic coordi-nates. Note the different scales for CBF in study I and II.
33
Figure 5. Mean and SD CBF for cerebellum, cortical regions and subcortical regions in study I. * denotes p<0.05.
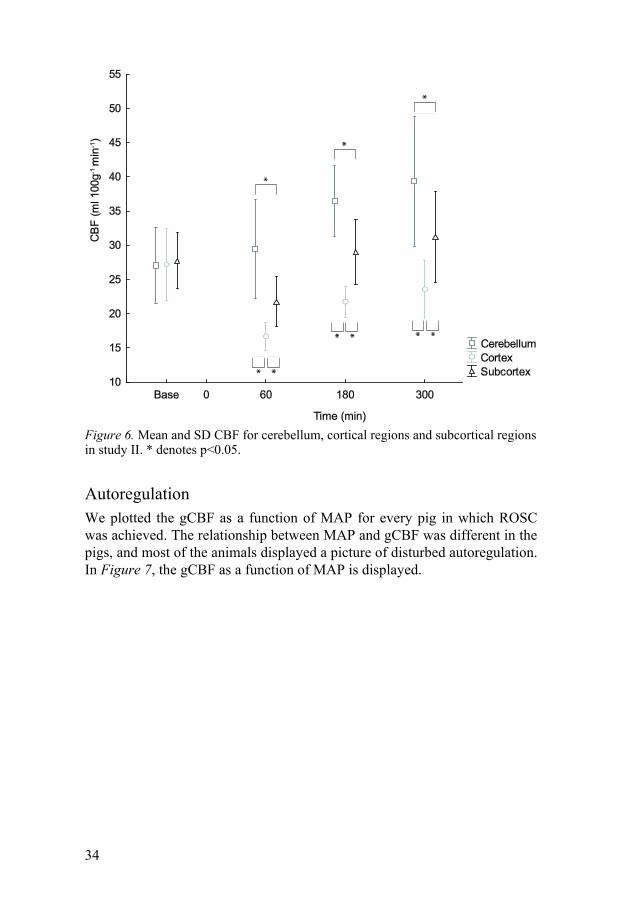
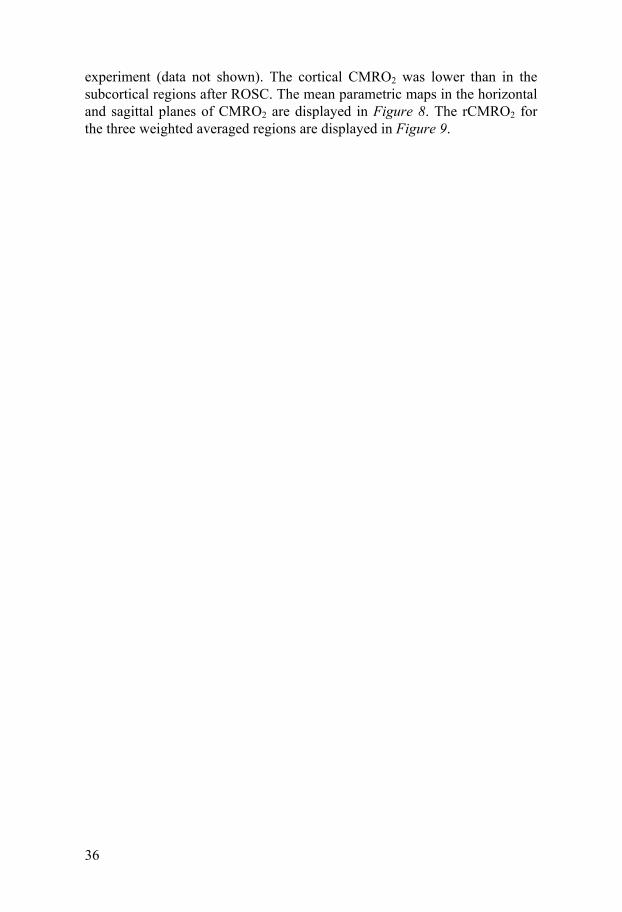
Study II The CBF in study II showed a slightly different pattern than in study I. The initial hyperperfusion was not observed, since the first PET scan was per-formed at 60 min after ROSC. However, based on the MAP recordings, one can assume that there was a transient hyperperfusion in study II as well. The most conspicuous finding in the parametric maps is the hyperperfusion in the cerebellum which was evident already at 60 min after ROSC and increased further over time. At 60 min, there appeared a hypoperfusion which was most pronounced in the cortical regions. This cortical hypoperfusion was more profound than in study I. The CBF measurements in the three weighted averaged regions as a function of time are displayed in Figure 6. The para-metric maps of CBF, CMRO2 and OEF in study II are displayed in Figure 8.
34
Figure 6. Mean and SD CBF for cerebellum, cortical regions and subcortical regions in study II. * denotes p<0.05.
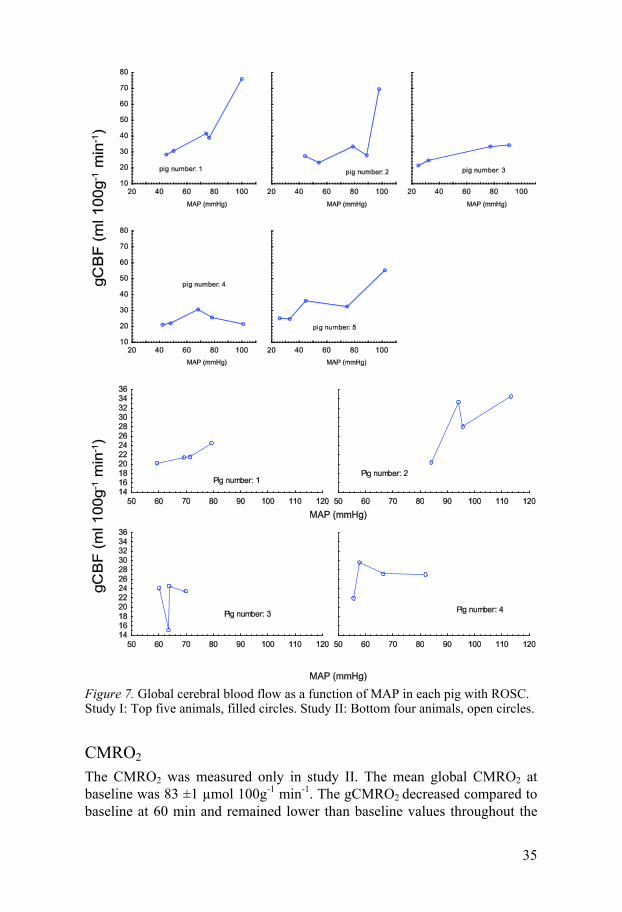
Autoregulation We plotted the gCBF as a function of MAP for every pig in which ROSC was achieved. The relationship between MAP and gCBF was different in the pigs, and most of the animals displayed a picture of disturbed autoregulation. In Figure 7, the gCBF as a function of MAP is displayed.
35
Figure 7. Global cerebral blood flow as a function of MAP in each pig with ROSC. Study I: Top five animals, filled circles. Study II: Bottom four animals, open circles.
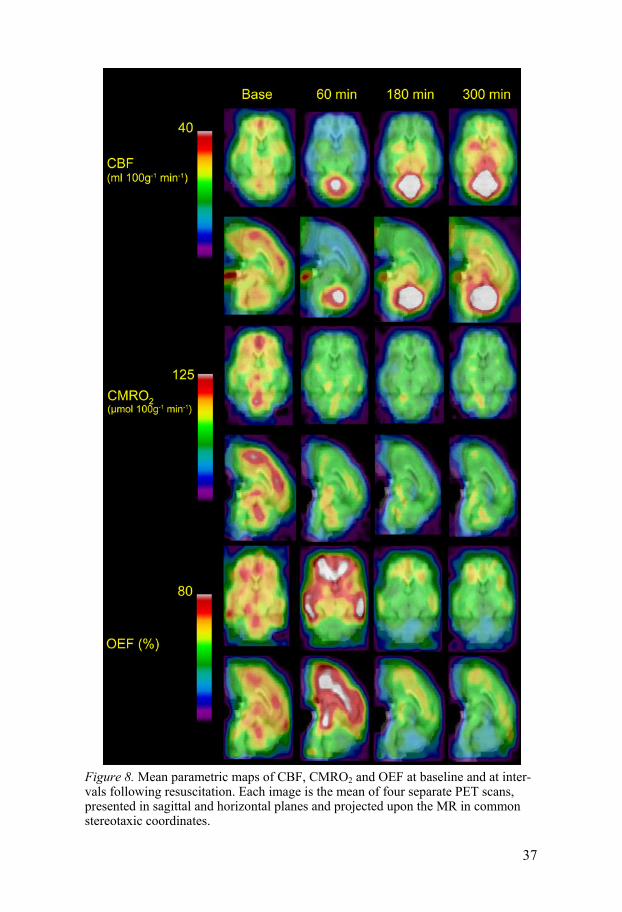
CMRO2 The CMRO2 was measured only in study II. The mean global CMRO2 at baseline was 83 ±1 µmol 100g-1 min-1. The gCMRO2 decreased compared to baseline at 60 min and remained lower than baseline values throughout the
36
experiment (data not shown). The cortical CMRO2 was lower than in the subcortical regions after ROSC. The mean parametric maps in the horizontal and sagittal planes of CMRO2 are displayed in Figure 8. The rCMRO2 for the three weighted averaged regions are displayed in Figure 9.
37
Figure 8. Mean parametric maps of CBF, CMRO2 and OEF at baseline and at inter-vals following resuscitation. Each image is the mean of four separate PET scans, presented in sagittal and horizontal planes and projected upon the MR in common stereotaxic coordinates.
38
Figure 9. Mean and SD CMRO2 for cerebellum, cortical regions and subcortical regions. * denotes p<0.05.
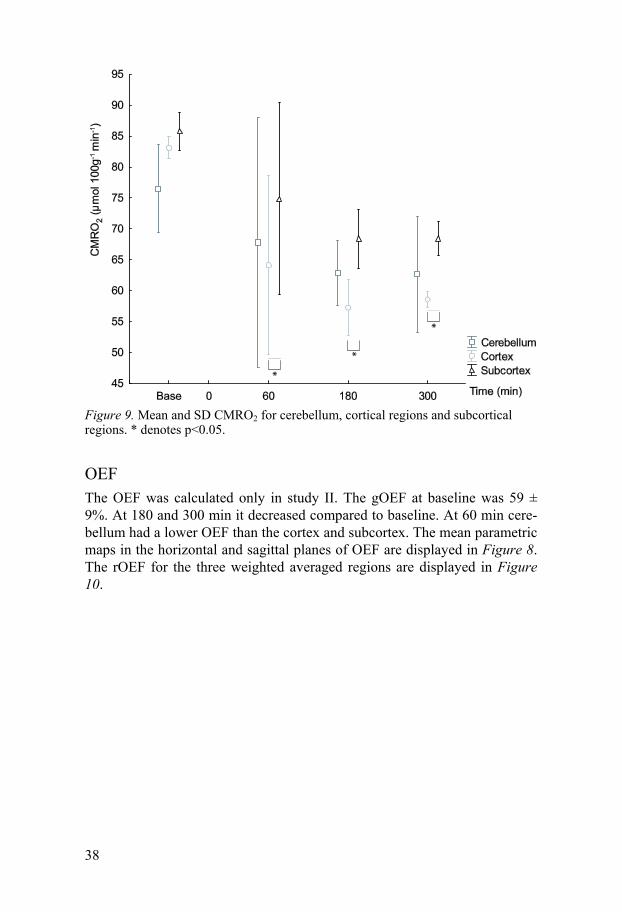
OEF The OEF was calculated only in study II. The gOEF at baseline was 59 ± 9%. At 180 and 300 min it decreased compared to baseline. At 60 min cere-bellum had a lower OEF than the cortex and subcortex. The mean parametric maps in the horizontal and sagittal planes of OEF are displayed in Figure 8. The rOEF for the three weighted averaged regions are displayed in Figure 10.
39
Figure 10. Mean and SD OEF for cerebellum, cortical regions and subcortical re-gions. * denotes p<0.05.
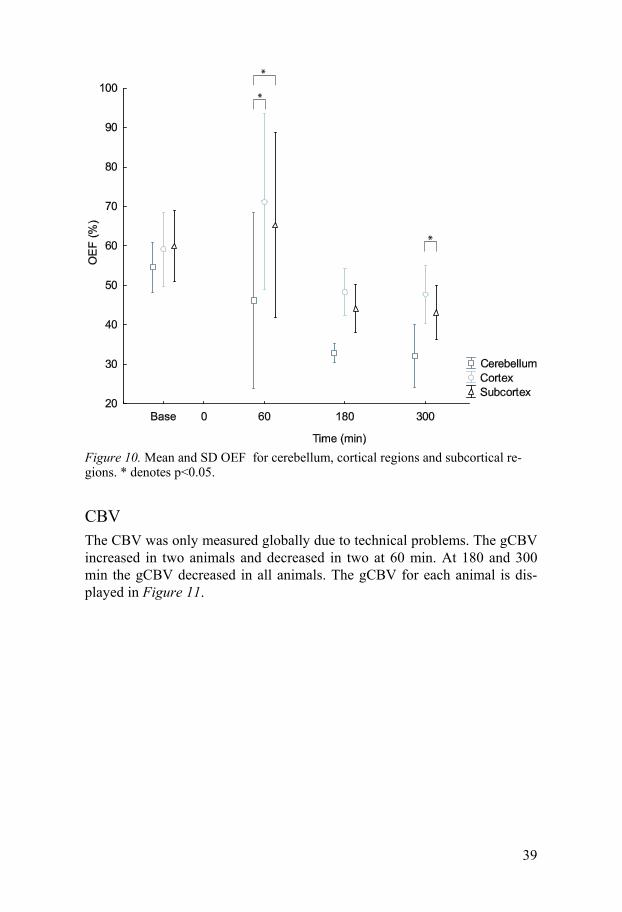
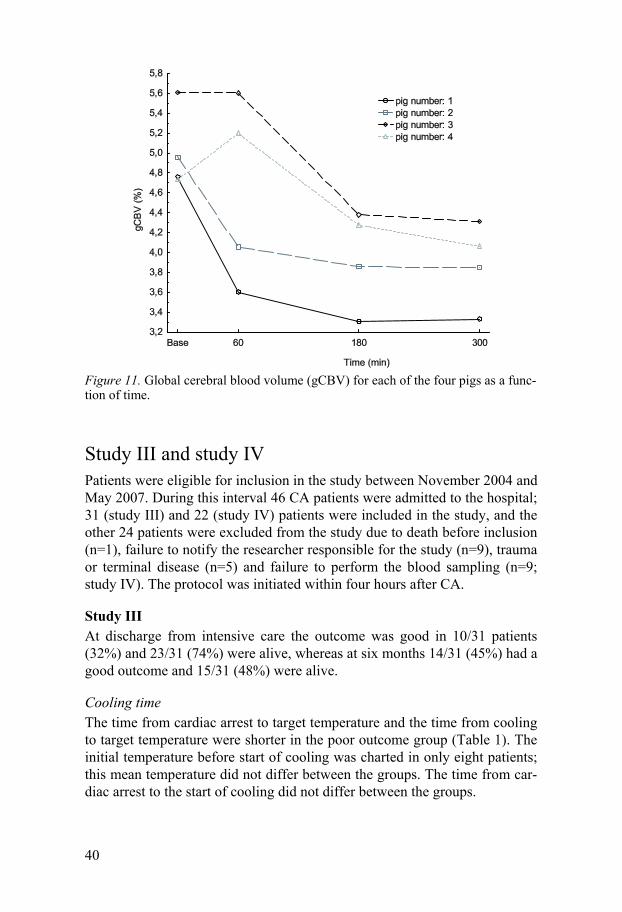
CBV The CBV was only measured globally due to technical problems. The gCBV increased in two animals and decreased in two at 60 min. At 180 and 300 min the gCBV decreased in all animals. The gCBV for each animal is dis-played in Figure 11.
40
Figure 11. Global cerebral blood volume (gCBV) for each of the four pigs as a func-tion of time.
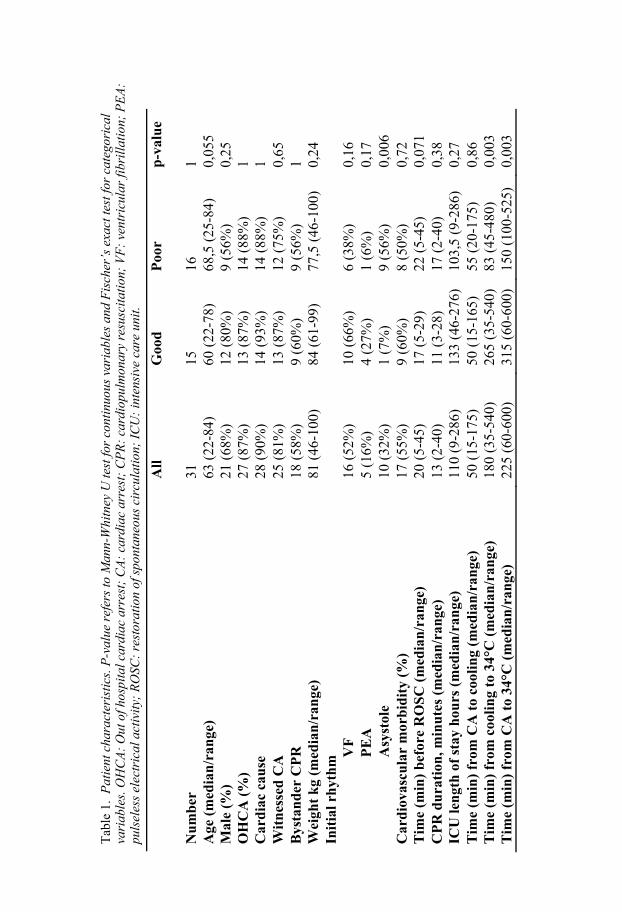
Study III and study IV Patients were eligible for inclusion in the study between November 2004 and May 2007. During this interval 46 CA patients were admitted to the hospital; 31 (study III) and 22 (study IV) patients were included in the study, and the other 24 patients were excluded from the study due to death before inclusion (n=1), failure to notify the researcher responsible for the study (n=9), trauma or terminal disease (n=5) and failure to perform the blood sampling (n=9; study IV). The protocol was initiated within four hours after CA.
Study III At discharge from intensive care the outcome was good in 10/31 patients (32%) and 23/31 (74%) were alive, whereas at six months 14/31 (45%) had a good outcome and 15/31 (48%) were alive.
Cooling time The time from cardiac arrest to target temperature and the time from cooling to target temperature were shorter in the poor outcome group (Table 1). The initial temperature before start of cooling was charted in only eight patients; this mean temperature did not differ between the groups. The time from car-diac arrest to the start of cooling did not differ between the groups.
41
Study IV At discharge from intensive care the outcome was good in 10/22 patients (45%) and 21/22 (95%) were alive, whereas at six months 14/22 (64%) had a good outcome and 15/22 (68%) were alive.
Patient characteristics Patient characteristics and cooling times for the patients in study III are dis-played in Table 1. Patient characteristics for patients in study IV are similar and are not displayed.
Tab
le 1
. P
atie
nt c
hara
cter
isti
cs. P
-val
ue r
efer
s to
Man
n-W
hitn
ey U
test
for
cont
inuo
us v
aria
bles
and
Fis
cher
’s e
xact
test
for
cate
gori
cal
vari
able
s. O
HC
A:
Out
of h
ospi
tal c
ardi
ac a
rres
t; C
A:
card
iac
arre
st;
CP
R:
card
iopu
lmon
ary
resu
scita
tion
; V
F:
vent
ricu
lar
fibr
illat
ion;
PE
A:
puls
eles
s el
ectr
ical
act
ivity
; R
OSC
: re
stor
atio
n of
spo
ntan
eous
cir
cula
tion;
IC
U:
inte
nsiv
e ca
re u
nit.
A
ll
Goo
d
Poo
r p
-val
ue
Nu
mb
er
31
15
16
1 A
ge (
med
ian
/ran
ge)
63 (
22-8
4)
60 (
22-7
8)
68,5
(25
-84)
0,
055
Mal
e (%
) 21
(68
%)
12 (
80%
) 9
(56%
) 0,
25
OH
CA
(%
) 27
(87
%)
13 (
87%
) 14
(88
%)
1 C
ard
iac
cau
se
28 (
90%
) 14
(93
%)
14 (
88%
) 1
Wit
nes
sed
CA
25
(81
%)
13 (
87%
) 12
(75
%)
0,65
B
ysta
nd
er C
PR
18
(58
%)
9 (6
0%)
9 (5
6%)
1 W
eigh
t k
g (m
edia
n/r
ange
) 81
(46
-100
) 84
(61
-99)
77
,5 (
46-1
00)
0,24
In
itia
l rh
yth
m
VF
16
(52
%)
10 (
66%
) 6
(38%
) 0,
16
PE
A
5 (1
6%)
4 (2
7%)
1 (6
%)
0,17
A
syst
ole
10 (
32%
) 1
(7%
) 9
(56%
) 0,
006
Car
dio
vasc
ula
r m
orb
idit
y (%
) 17
(55
%)
9 (6
0%)
8 (5
0%)
0,72
T
ime
(min
) b
efor
e R
OS
C (
med
ian
/ran
ge)
20 (
5-45
) 17
(5-
29)
22 (
5-45
) 0,
071
CP
R d
ura
tion
, min
ute
s (m
edia
n/r
ange
) 13
(2-
40)
11 (
3-28
) 17
(2-
40)
0,38
IC
U le
ngt
h o
f st
ay h
ours
(m
edia
n/r
ange
) 11
0 (9
-286
) 13
3 (4
6-27
6)
103,
5 (9
-286
) 0,
27
Tim
e (m
in)
from
CA
to
cool
ing
(med
ian
/ran
ge)
50 (
15-1
75)
50 (
15-1
65)
55 (
20-1
75)
0,86
T
ime
(min
) fr
om c
ooli
ng
to 3
4°C
(m
edia
n/r
ange
) 18
0 (3
5-54
0)
265
(35-
540)
83
(45
-480
) 0,
003
Tim
e (m
in)
from
CA
to
34°C
(m
edia
n/r
ange
) 22
5 (6
0-60
0)
315
(60-
600)
15
0 (1
00-5
25)
0,00
3
43
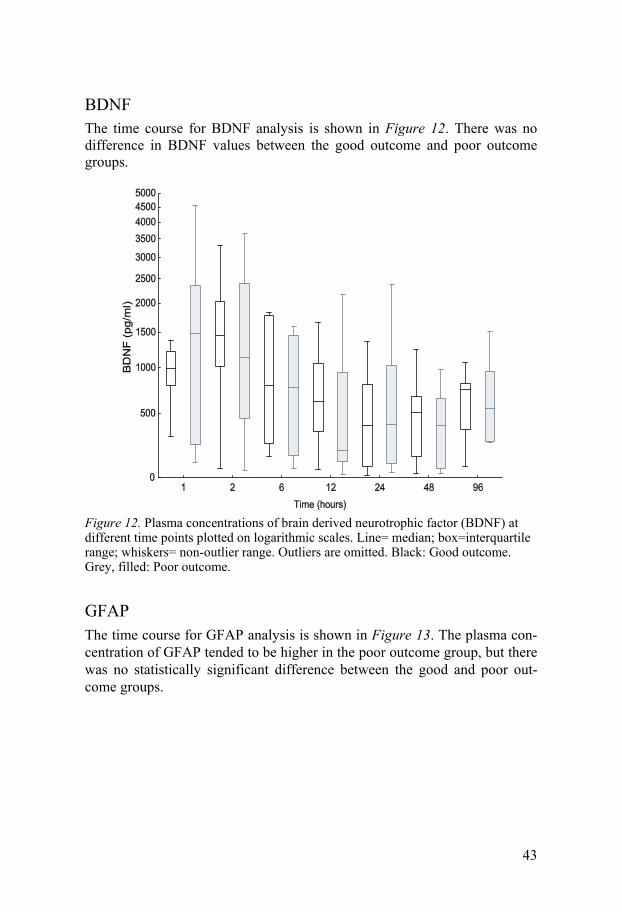
BDNF The time course for BDNF analysis is shown in Figure 12. There was no difference in BDNF values between the good outcome and poor outcome groups.
Figure 12. Plasma concentrations of brain derived neurotrophic factor (BDNF) at different time points plotted on logarithmic scales. Line= median; box=interquartile range; whiskers= non-outlier range. Outliers are omitted. Black: Good outcome. Grey, filled: Poor outcome.
GFAP The time course for GFAP analysis is shown in Figure 13. The plasma con-centration of GFAP tended to be higher in the poor outcome group, but there was no statistically significant difference between the good and poor out-come groups.
44
Figure 13. Plasma concentrations of glial fibrillary acidic protein (GFAP) at differ-ent time points plotted on logarithmic scales. Line= median; box=interquartile range; whiskers= non-outlier range. Outliers are omitted. Black: Good outcome. Grey, filled: Poor outcome.
NSE The time course for NSE analysis is shown in Figure 14. The patients in the poor outcome group tended to display an increase already at two hours, but there were no significant differences until 48 hours after ROSC, at which time the patients in the poor outcome group had a greater increase than did those in the good outcome group. At 48 and 96 hours, there was a difference in the NSE concentration between the two outcome groups, with the lowest p-value at 96 hours. The ROC curves for NSE are displayed in Figure 15. The sensitivity and specificity value for prediction of a poor outcome by NSE are listed in Table 2. The change in NSE levels between 24 and 48 h was not associated with the outcome in our patients.
45
Figure 14. Plasma concentrations of neuron specific enolase (NSE) at different time points plotted on logarithmic scales. Line= median; box=interquartile range; whisk-ers= non-outlier range. Outliers are omitted. Black: Good outcome. Grey, filled: Poor outcome.
Figure 15. ROC curve for neuron specific enolase values at 48 hours (black, solid line) and 96 hours (grey, dashed line) after ROSC.
46
S-100B The time course for S-100B analysis is shown in Figure 16. Shortly after ROSC, the S-100B level was increased in both groups. Patients with a good outcome showed a decrease in S-100B at 24 hours whereas in the poor out-come group many patients had persistently elevated levels. With the Mann-Whitney U test, the S-100B values differed between the good and poor out-come groups at all time points, with the lowest p-value at 24 hours after car-diac arrest. The ROC curves are displayed in Figure 17. The sensitivity and specificity for prediction of a poor outcome by S-100B are listed in Table 2.
Figure 16. Plasma concentrations of S-100B at different time points plotted on logarithmic scales. Line= median; box=interquartile range; whiskers= non-outlier range. Outliers are omitted. Black: Good outcome. Grey, filled: Poor outcome.
47
Figure 17. ROC curves for S-100B values at 2 hours (black, solid line) and 24 hours (grey, dashed line) after ROSC.
Table 2. ROC curve data for S-100B and NSE. AUC= Area under the ROC curve. Cut-offs in bold.
Marker Time Value Sensitivity Specificity AUC
S-100B (µg/l) 2 h 0.9 80% 87% 0.86
1 73% 93%
24 h 0.09 93% 80% 0.97
0.18 87% 100%
NSE (µg/l) 48 h 2.52 60% 87% 0.74
4.97 50% 93%
96 h 0.52 100% 53% 0.79
3.22 57% 93%
48
Tau There were only a few cases in either group in whom detectable levels of tau were present at less than 48 hours after ROSC. In the poor outcome group, median tau level was significantly elevated at 48 hours after ROSC, and increased further at 96 hours after ROSC. There was a significant difference in median tau levels between the poor and good outcome groups at both 48 and 96 hours after ROSC. The tau concentrations by outcome group as a function of time after CA are presented in Figure 18. The ROC curves for tau (pg/ml plasma) at 48 and 96 hours are displayed in Figure 19. At 96 hours, the sensitivity for predicting a poor outcome was 71% and the specificity was 93%. Specifications of the ROC curves are pre-sented in Table 3.
Figure 18. Plasma concentrations of tau as a function of time after resuscitation from CA, with concentrations plotted on a logarithmic scale. Line= median; box=interquartile range; whiskers= non-outlier range. Squares, circles: Outliers and extremes. Black, circles: Good outcome. Grey squares, filled: Poor outcome.
49
Figure 19. ROC curve for tau values at 48 hours (black, solid line) and 96 hours (grey, dashed line) after ROSC.
Table 3. ROC curve data for tau. AUC= Area under the ROC curve. Cut-offs in bold.
Time Value (pg/ml) Sensitivity Specificity AUC 48 h >5 86 87 0,84 >30 29 93 96 h >5 86 87 0,89 >27 71 93
50
Discussion
Cerebral blood flow, metabolism and blood volume There are considerable fluctuations in the CBF during the first hours after ROSC. As previously described, there is typically a brief initial period of hyperperfusion followed by a hypoperfusion which lasts for several hours [39, 41]. In the present studies, CBF changes were not uniformly distributed, but showed the most profound hypoperfusion in the cortical regions. Given the spatial resolution of our PET images, no areas with complete no-reflow phenomenon can be detected. The findings of lower CBF in the cortex and more pronounced hypoperfusion for animals with 10 min of cardiac arrest, which might indicate a higher degree of no-reflow in the cortex, are consis-tent with greater vulnerability of the cerebral cortex to an ischemic insult. Indeed, a lower cortical CBF is associated with a more severe ischemic in-sult, as expressed in terms of S-100B levels in serum [152] and plasma [153]. However, our imaging-based methods seem insufficiently sensitive to verify no-reflow under the present conditions.
Although the oxygen metabolism decreases after ROSC, with the most pronounced decrease in the cortical regions, there seems not to be any gross areas with immediate infarction since CMRO2 remained at approximately 70% of baseline values in the hours after ROSC. Although not defined as VOI templates, there was no evidence of either hypoperfusion or low CMRO2 in the watershed areas, which are known to be prone to infarction after hypotension [154, 155]. The declining CMRO2 during the first hours after ROSC could nonetheless be an early sign of the development of secon-dary brain damage. This conjecture is supported by a finding by Conroy et al that the gCMRO2 decreases more in the brain of animals subjected to nor-mothermic global ischemia compared to hypothermic global ischemia [156]. Also, S-100B in CSF was elevated in the animals subjected to normothermic global ischemia in that pig study. One could thus speculate that a decrease in CMRO2 after global ischemia reflects severe cerebral damage as expressed in increased S-100B release and a poor long term neurological outcome.
At 60 min after ROSC, the CMRO2 level was sustained by an increase in OEF. The simultaneous occurrence of low CBF and high OEF indicates an ischemic situation. Due to the small number of animals, statistical signifi-cance was not always evident. However, the parametric maps reveal spatial information when closely examined. At 60 min, the increase in OEF is evi-
51
dent, especially in the frontal cortex and temporal cortex. In some of these regions the OEF is over 80%. This very high oxygen extraction indicates severe hypoperfusion, given the oxygen demand in these regions. This high extraction is not evident at 180 and 300 min, suggesting that the CBF is suf-ficiently restored to meet the present oxygen demand. Instead, the oxygen extraction seems to have decreased compared to baseline, indicating some degree of luxury perfusion.
When looking closely at the CBF map in the sagittal plane, there seems to be some degree of hyperperfusion in the hippocampus, although hippocam-pus is not a defined VOI template, and would be difficult to resolve in pig brain given the present reconstructions at 5 or 6 mm FWHM. However, hip-pocampus is known to be one of the most vulnerable regions to ischemia [34, 35]. Hyperperfusion there could thus be a sign of more severe neuronal damage.
In study II, there was a hyperperfusion in the cerebellum starting already at 60 min and increasing throughout the subsequent five hours after ROSC. All animals had this increase in cerebellar blood flow compared to baseline. The oxygen metabolism was not increased, indicating a situation of luxury perfusion with a low OEF. This cerebellar hyperperfusion was not as evident in study I, although the CBF at 240 min is actually higher than the baseline value. At 60 min, however, the CBF in cerebellum is lower than baseline in study I, whereas in study II there is no statistical difference between 60 min and baseline, although examination of the parametric maps suggests that there is indeed some increase of CBF already at 60 min in the central parts of cerebellum. This situation, with a simultaneous hypoperfusion in the cortical regions and a hyperperfusion in cerebellum has not been described before. There is however one study also reporting a cerebellar hyperperfusion in the most damaged brains after global ischemia [156]. The observation is remi-niscent of crossed cerebellar diaschisis (CCD), which is a hypoperfusion in cerebellum following supratentorial ischemia in the contralateral side [157]. This hypoperfusion is thought to be due to a decrease of the excitatory inputs from the cerebral cortex to the cerebellar cortex [158]. In our study, the cor-tical ischemia was bilateral, and there was a bilateral hyperperfusion in the cerebellum. This hyperperfusion could be a sign of the more severe ischemic insult implied after ten minutes of cardiac arrest compared to five minutes of cardiac arrest, as in Study I. One could argue that the hyperperfusion in the cerebellum might have been due to a great increase in one or two animals. However, when studying the cerebellar flow in the individual animals all animals display an increase in cerebellar blood flow at 180 and 300 min (Figure 20).
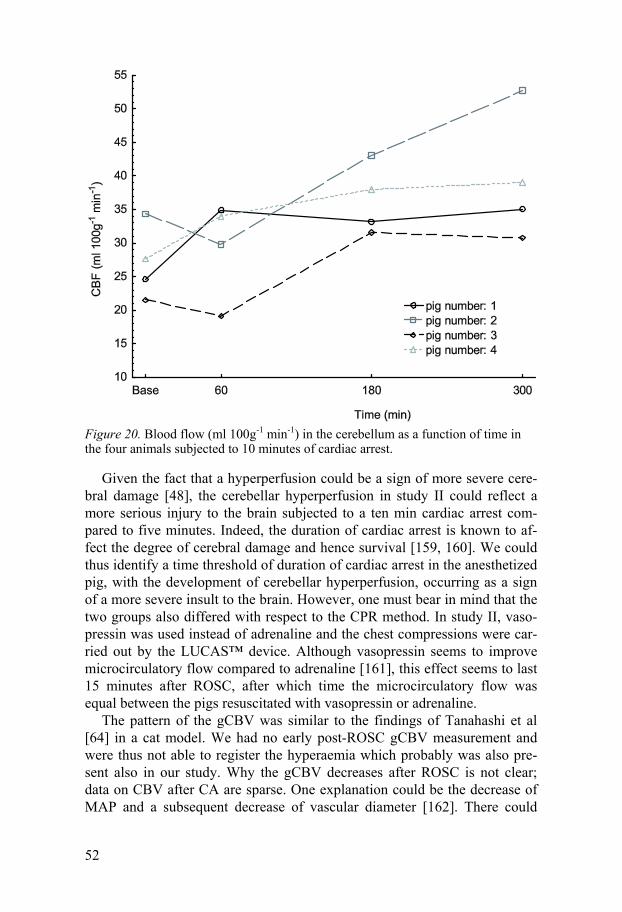
52
Figure 20. Blood flow (ml 100g-1 min-1) in the cerebellum as a function of time in the four animals subjected to 10 minutes of cardiac arrest.
Given the fact that a hyperperfusion could be a sign of more severe cere-bral damage [48], the cerebellar hyperperfusion in study II could reflect a more serious injury to the brain subjected to a ten min cardiac arrest com-pared to five minutes. Indeed, the duration of cardiac arrest is known to af-fect the degree of cerebral damage and hence survival [159, 160]. We could thus identify a time threshold of duration of cardiac arrest in the anesthetized pig, with the development of cerebellar hyperperfusion, occurring as a sign of a more severe insult to the brain. However, one must bear in mind that the two groups also differed with respect to the CPR method. In study II, vaso-pressin was used instead of adrenaline and the chest compressions were car-ried out by the LUCAS™ device. Although vasopressin seems to improve microcirculatory flow compared to adrenaline [161], this effect seems to last 15 minutes after ROSC, after which time the microcirculatory flow was equal between the pigs resuscitated with vasopressin or adrenaline.
The pattern of the gCBV was similar to the findings of Tanahashi et al [64] in a cat model. We had no early post-ROSC gCBV measurement and were thus not able to register the hyperaemia which probably was also pre-sent also in our study. Why the gCBV decreases after ROSC is not clear; data on CBV after CA are sparse. One explanation could be the decrease of MAP and a subsequent decrease of vascular diameter [162]. There could
53
also have been a fluid shift from the vascular compartment to the interstitium due to an insuffiency of the blood brain barrier (BBB) [163]. However, other studies have not reported damage to the BBB after ischemia [164, 165]. It could also be hypothesized that a cerebral oedema was beginning to form in the resuscitated pigs. Cerebral oedema has been observed after cerebral ischemia [166] and cardiac arrest [167].
The cellular ischemic lesions after global ischemia develop over days, com-pared to the lesions after focal ischemia, which can be seen after two-three hours [168]. Our study methods are thus not able to detect the expected cel-lular lesions, but our findings do indicate the locations of these lesions, since the most evident changes in CBF and CMRO2 after cardiac arrest were lo-cated in the previously known vulnerable regions [34, 35]. Naturally, histo-logical examination of the brains in our experiments would have been of interest, but was at the time of our experiments not possible.
Autoregulation Although not a primary aim in study I and II, we tested the hypothesis that the cerebral autoregulation is disturbed after cardiac arrest. There was evi-dence of disturbed autoregulation in most of the animals. Only one or two animals from study I and none from study II showed a pattern consistent with a normal autoregulation. This finding is consistenst with the expectata-tion of a greater insult to the brain of the animals in study II. One should, however bear in mind the small number of measurements of gCBF and thus the small amount of data on this topic.
Cooling time The finding that the time to target temperature was shorter in patients with a poor outcome was somewhat surprising. In a study by Wolf et al [169], those with a poor outcome took a longer time to reach target temperature. In that study they used an intravascular cooling device, whereas we used cold saline and icepacks. In a study by Nielsen et al [170], cooling time was not predic-tive of outcome. In these different studies, different cooling methods have been used which can explain the conflicting results. This is an item which should be explored more.
54
Biomarkers In our studies, the correlation of biomarkers to patient outcome in the days after ROSC was strong for S-100B, medium for tau and weak for NSE. At all time points, S-100B was superior to NSE and tau in predicting patient outcome. As early as two hours after ROSC following cardiac arrest, S-100B predicted a poor outcome with a sensitivity of 73% and a specificity of 93%, whereas S-100B had a peak sensitivity of 87% at 24 hours, when the speci-ficity was 100%. In contrast, tau predicted a poor outcome with a sensitivity of 73% and a specificity of 93% but only at 96 hours after cardiac arrest. NSE was a poor predictor, and the BDNF and GFAP concentrations did not differ between the groups, although the GFAP levels tended to be higher in the poor outcome group. S-100B was elevated at an early stage in both groups. It must be granted that the initial S-100B elevation could have been due to extracerebral release from adipocytes and chondrocytes [171], per-haps as a result of chest compressions. However, the duration of CPR did not differ between the groups (Table 1), and did not differ between the patients with asystole or VF as intial rhythm. In the good outcome group, the S-100B level had decreased after 24 hours.
Our results suggest that S-100B could be used as an early predictor of outcome, in line with the study by Shinozaki et al [145]. However, the exact number of hypothermia treated patients in their study was not stated, and hence its relevance to the present study cannot be assessed. Other studies of this type have yielded conflicting results compared with our data [101-103] , or have reported NSE to be a good predictor [102], even exceeding the pre-dictive value of S-100B [101, 103]. These diverging results could partly be a cause of the different assays for S-100B which are not interchangeable [172].
The discrepancy between our data and the findings by Tiainen and Ok-sanen [101, 102], who reported that NSE is a good predictor, might be re-lated to our decision to include cases of all forms of cardiac arrest; ventricu-lar fibrillation (VF), asystole, and pulseless electrical activity (PEA). In con-trast, only witnessed cardiac arrests with VF were included in the earlier reports [101, 102], whereas patients older than 75 years of age and with un-witnessed cardiac arrest were excluded by Tiainen et al [101]. These differ-ences in inclusion criteria could also explain the differences in survival and good outcome between our studies. In particular, 16 of our patients had VF as the initial rhythm, of which 10 patients (63%) had a good outcome after six months, whereas Tiainen reported a good outcome in 69% of the pa-tients.
Our NSE cut-off value differs from those obtained in the studies by Tiai-nen et al [101] and Rundgren et al [103]. This is a common problem when comparing results across studies, especially in the absence of an established gold standard method. Different biomarker results between studies may be
55
related to different kit formats. Certified reference materials against which different kits can be calibrated are lacking for the biomarker candidates ex-amined in the present investigation. Moreover, different kits may use differ-ent antibody combinations and thus measure isoforms of the same protein more or less well. The lack of external control programs makes it difficult to compare biomarker data across studies, also across studies in which the same kit formats were used. Cut-off values established in one study need to be verified locally before they can be used in a new study or in a prospective manner in clinical routine. The last application also necessitates careful labo-ratory work to ensure longitudinal stability in the results reported to the cli-nician. A comparison of seven different NSE assays concluded that the as-says are not interchangeable [173]. Our diverging results could also be due to the different time points at which NSE was analysed. Rundgren et al sam-pled NSE at 2, 24, 48 and 72 hours whereas we sampled at 1, 2, 6, 12, 24, 48 and 96 hours. The maximum predictive value in both studies was at the last sampling which for Rundgren et al was after 72 hours and in our study after 96 hours. Since we did not detect a fall in predictive value of NSE, the opti-mal timepoint for NSE is still not defined.
In a previous study, in which the GFAP detection limit was 0.1 ng/ml, none of the hypothermia-treated patients with a good outcome had detectable plasma levels of GFAP [92]. In study III, the detection limit was 0.03 ng/ml, and patients with both a good and a poor outcome had detectable levels, with the GFAP level correlating poorly with outcome. With inclusion of more patients in our study, GFAP might nonetheless have had a predictive value. Obviously, this topic has to be investigated further.
Study IV suggests that tau-protein has the potential to be used as a predic-tor for the neurological outcome after hypothermia treatment following re-suscitation from cardiac arrest. Tau was detectable and proved to have pre-dictive value in blood samples taken 48 hours after CA, but predictive value was greater for samples taken at 96 hours, presumably indicating the pro-gression of neuronal damage following resuscitation. This predictive value may well increase further with time, since the level of cleaved tau peaked 168 hours after traumatic brain injury [174] and increased continously dur-ing the first 120 hours after stroke [113].
In Alzheimer’s Disease (AD), there are abnormal aggregations of tau pro-tein into paired helical filaments [175]. Methylene blue (MB) can inhibit tau filament formation in vitro [176]. MB also has positive neurological and circulatory effects after cardiac arrest [177, 178]. One plausible explanation of the MB effect after CA could thus be the inhibition of tau filament forma-tion.
56
Outcome The outcome assessment at discharge from the ICU and after six months revealed that there was clinical improvement in some patients over time. At ICU discharge there were only 10 patients with a good outcome, but this number had increased to 14 six months later. The median length of stay at the ICU was 110 hours for all patients, but 199 hours (range 133-276) for those with improvement. After hypothermia treatment, it seems that some recovery is possible, even in cases presenting with a CPC score of 3 or 4 in the acute phase. Indeed, Al Thenayan et al. found that a poor motor response at day three does not necessarily predict a poor outcome; one patient re-gained motor response at six days after re-warming [9]. Although the length of ICU stay did not differ between the good and poor outcome groups, at six months all but one of those with a poor outcome had died in our study. The time point at which the possibility of improvement decreased was not identi-fied in our study. This emphasizes the need for a more precise prediction of the outcome. Further outcome studies with more frequent CPC scoring could help define better the time post CA after which improvement is unlikely; this knowledge would inform treatment decisions and potentially influence reha-bilitative interventions. Those predictions must have a high specificity, since the withdrawal of treatment in most cases will result in death and thus be a self-fulfilling prediction.
57
Future perspectives
In order to evaluate further the ischemic/reperfusion damage after cardiac arrest some complentary studies would be of interest.
Our PET studies demonstrate a low CBF after resuscitation from cardiac arrest and a low CMRO2. It is, however, not known precisely which levels of hypoperfusion or hypometabolism which give rise to permanent cerebral damage in the anaesthetized pig. Further PET studies with longer observa-tion time and post mortem histology would therefore be of interest. Blood sampling with analysis of S-100B, NSE, GFAP and tau protein from the same animals would also be of interest. It could then be possible to quantify histologically verified infarction with levels of biomarkers.
Another topic of interest is the mechanisms of the benefits derived from hypothermia. PET studies of pigs treated with hypothermia after resuscita-tion from cardiac arrest may increase our understanding of the mechanisms of hypothermia.
Although S-100B was a very good predictor of neurological outcome in our material, controversy exists regarding the most accurate biomarker. The number of patients in our study was small and the cut-off value was obtained post-hoc. A large study with a predefined cut-off value is needed in order to evaluate the biomarkers and to be able to trust the prediction. In addition, it may well be that the combination of several biomarkers in the model may prove to optimize predictive power.
58
Conclusions
• There is a hyperperfusion shortly after ROSC, followed by a hypoperfu-sion which is most profound in the cortex (Study I)
• The CBF during the early hypoperfusion decreases more than does the oxygen metabolism (Study II)
• A longer time of cardiac arrest implies a greater insult to the brain, de-tected as more profound cortical hypoperfusion (Study I and II)
• There is evidence of a disturbed autoregulation after cardiac arrest (Study I and II)
• A longer time of cardiac arrest gives rise to a cerebellar hyperperfusion, also indicating a more severe insult (Study II)
• The cerebral blood volume decreases after cardiac arrest (Study II) • S-100B and NSE are markers of the cerebral ischemic/reperfusion injury
after cardiac arrest where S-100B may be the more accurate one (Study III)
• There is detectable levels of tau in patients with a poor neurological outcome at 48 hours after cardiac arrest (Study IV)
• Tau is a new marker for cerebral ischemic/reperfusion injury (Study IV)
59
Acknowledgements
This work was carried out at the department of surgical sciences, Uppsala University. There are many who have contributed to my work. I would like to express my sincere gratitude to Sten Rubertsson, tutor and co-author. For leading me into science, for sup-porting me in my struggle and for always taking your time to read or discuss my work. For your friendship which reaches far beyond science and re-search. You have, in many ways, helped me produce and finish this work. Lars Wiklund, co-tutor and co-author. For fruitful discussions and critical and constructive comments to manuscripts and thesis. Paul Cumming, co-author of two manuscripts. For your true expertise in the Register program and your critical and insightful revisions of all four manu-scripts and the thesis. The PET images are all your work. There would not have been any regional PET data without you. Henrik Zetterberg, Eugeen Vanmechelen and Kaj Blennow, co-authors. For inviting me into the world of biomarkers and your constant enthusiasm over my questions and my work. Johanna Nordmark, co-author and former room-mate. For giving me the opportunity to participate in the hypothermia study (“studieeländet”) and for friendship outside work. Torsten Gordh, Torbjörn Karlsson, Eric Haldén and Kristiina Hersio, former and present heads of departments of Anaesthesia and Cardiothoracic anaes-thesia. For creating conditions for research and for allowing me time off from clinical work. Jakob Hedberg, for all research lunches and discussions about anything re-garding the thesis, STATISTICA and finishing the Ph.D. studies. Elisabeth Pettersson, for your invaluable help with all samples, even during night time and weekends.
60
Anders Nordgren, for skillful technical assistance in the laboratory. Gudrun Nylén, Lars Lindsjö and Anders Wall at the former Uppsala Imanet, former Uppsala University PET centre, present PET centre. For help with files of unknown format, for help with PET analysis and for help and assis-tance during the experiments. Former colleagues at the department of Anaesthesiology and Intensive Care, Uppsala for friendship and sometimes extra work with our patients. Colleagues at the department of Cardiothoracic Surgery and Anaesthesiol-ogy for friendship and extra work when I was away writing. Norrlands nation, Uppsala for the grants making this work possible. Hanna, for endless support and for pushing me through this. You are out-standing. David, Klara, Emil and Tilde. For, in your own way, being the best in the world and therefore endlessly loved.
61
References
1. Nationellt register för hjärtstopp utanför sjukhus. 2008. 2. Nationellt register för hjärtstopp på sjukhus. 2008. 3. Nadkarni, V.M., et al., First documented rhythm and clinical outcome from
in-hospital cardiac arrest among children and adults. JAMA, 2006. 295(1): p. 50-7.
4. Nolan, J.P., et al., Post-cardiac arrest syndrome: epidemiology, pathophysiology, treatment, and prognostication. A Scientific Statement from the International Liaison Committee on Resuscitation; the American Heart Association Emergency Cardiovascular Care Committee; the Council on Cardiovascular Surgery and Anesthesia; the Council on Cardiopulmonary, Perioperative, and Critical Care; the Council on Clinical Cardiology; the Council on Stroke. Resuscitation, 2008. 79(3): p. 350-79.
5. Siesjo, B.K. and P. Siesjo, Mechanisms of secondary brain injury. Eur J Anaesthesiol, 1996. 13(3): p. 247-68.
6. Grinyo, J.M., Reperfusion injury. Transplant Proc, 1997. 29(1-2): p. 59-62. 7. Nolan, J.P., et al., Outcome following admission to UK intensive care units
after cardiac arrest: a secondary analysis of the ICNARC Case Mix Programme Database. Anaesthesia, 2007. 62(12): p. 1207-16.
8. Edgren, E., et al., Assessment of neurological prognosis in comatose survivors of cardiac arrest. BRCT I Study Group. Lancet, 1994. 343(8905): p. 1055-9.
9. Al Thenayan, E., et al., Predictors of poor neurologic outcome after induced mild hypothermia following cardiac arrest. Neurology, 2008. 71(19): p. 1535-7.
10. Rossen, R., H. Cabat, and J. Anderson, Acute arrest of cerebral circulation in man. Archives of Neurology and Psychiatry, 1943. 50: p. 510-528.
11. Radovsky, A., et al., Regional prevalence and distribution of ischemic neurons in dog brains 96 hours after cardiac arrest of 0 to 20 minutes. Stroke, 1995. 26(11): p. 2127-33; discussion 2133-4.
12. Rehncrona, S., Brain acidosis. Ann Emerg Med, 1985. 14(8): p. 770-6. 13. Mabe, H., P. Blomqvist, and B.K. Siesjo, Intracellular pH in the brain
following transient ischemia. J Cereb Blood Flow Metab, 1983. 3(1): p. 109-14.
14. Xiong, Z.G., et al., Neuroprotection in ischemia: blocking calcium-permeable acid-sensing ion channels. Cell, 2004. 118(6): p. 687-98.
15. Choi, D.W. and S.M. Rothman, The role of glutamate neurotoxicity in hypoxic-ischemic neuronal death. Annu Rev Neurosci, 1990. 13: p. 171-82.
16. Novelli, A., et al., Glutamate becomes neurotoxic via the N-methyl-D-aspartate receptor when intracellular energy levels are reduced. Brain Res, 1988. 451(1-2): p. 205-12.
62
17. Olney, J.W., Glutamate-induced neuronal necrosis in the infant mouse hypothalamus. An electron microscopic study. J Neuropathol Exp Neurol, 1971. 30(1): p. 75-90.
18. Silver, I.A. and M. Erecinska, Intracellular and extracellular changes of [Ca2+] in hypoxia and ischemia in rat brain in vivo. J Gen Physiol, 1990. 95(5): p. 837-66.
19. Siesjo, B.K., et al., Calcium, excitotoxins, and neuronal death in the brain. Ann N Y Acad Sci, 1989. 568: p. 234-51.
20. Safar, P. and W. Behringer, Cerebral Resuscitation from cardiac arrest, in Textbook of neurointensive care, A.J. Layon, A. Gabrielli, and W.A. Friedman, Editors. 2003, Saunders. p. 457-498.
21. Choi, D.W., Calcium-mediated neurotoxicity: relationship to specific channel types and role in ischemic damage. Trends Neurosci, 1988. 11(10): p. 465-9.
22. Moskowitz, N., W. Schook, and S. Puszkin, Regulation of endogenous calcium-dependent synaptic membrane phospholipase A2. Brain Res, 1984. 290(2): p. 273-9.
23. Wieloch, T. and B.K. Siesjo, Ischemic brain injury: the importance of calcium, lipolytic activities, and free fatty acids. Pathol Biol (Paris), 1982. 30(5): p. 269-77.
24. Armstead, W.M., et al., Postischemic generation of superoxide anion by newborn pig brain. Am J Physiol, 1988. 255(2 Pt 2): p. H401-3.
25. McCord, J.M., Oxygen-derived free radicals in postischemic tissue injury. N Engl J Med, 1985. 312(3): p. 159-63.
26. Pellmar, T.C. and K.L. Neel, Oxidative damage in the guinea pig hippocampal slice. Free Radic Biol Med, 1989. 6(5): p. 467-72.
27. Lo, W.D. and A.L. Betz, Oxygen free-radical reduction of brain capillary rubidium uptake. J Neurochem, 1986. 46(2): p. 394-8.
28. Kempski, O., et al., Postischemic production of eicosanoids in gerbil brain. Stroke, 1987. 18(1): p. 111-9.
29. Liu, T., et al., Tumor necrosis factor-alpha expression in ischemic neurons. Stroke, 1994. 25(7): p. 1481-8.
30. Buttini, M., A. Sauter, and H.W. Boddeke, Induction of interleukin-1 beta mRNA after focal cerebral ischaemia in the rat. Brain Res Mol Brain Res, 1994. 23(1-2): p. 126-34.
31. Wang, Q., X.N. Tang, and M.A. Yenari, The inflammatory response in stroke. J Neuroimmunol, 2007. 184(1-2): p. 53-68.
32. Nitatori, T., et al., Delayed neuronal death in the CA1 pyramidal cell layer of the gerbil hippocampus following transient ischemia is apoptosis. J Neurosci, 1995. 15(2): p. 1001-11.
33. Chen, J., et al., Induction of caspase-3-like protease may mediate delayed neuronal death in the hippocampus after transient cerebral ischemia. J Neurosci, 1998. 18(13): p. 4914-28.
34. Taraszewska, A., et al., The pattern of irreversible brain changes after cardiac arrest in humans. Folia Neuropathol, 2002. 40(3): p. 133-41.
35. Kirino, T. and K. Sano, Selective vulnerability in the gerbil hippocampus following transient ischemia. Acta Neuropathol, 1984. 62(3): p. 201-8.
63
36. Pulsinelli, W.A., J.B. Brierley, and F. Plum, Temporal profile of neuronal damage in a model of transient forebrain ischemia. Ann Neurol, 1982. 11(5): p. 491-8.
37. Jenkins, L.W., et al., The role of postischemic recirculation in the development of ischemic neuronal injury following complete cerebral ischemia. Acta Neuropathol, 1981. 55(3): p. 205-20.
38. Horstmann, A., et al., Resuscitating the heart but losing the brain: brain atrophy in the aftermath of cardiac arrest. Neurology, 2010. 74(4): p. 306-12.
39. Nozari, A., et al., Maximisation of cerebral blood flow during experimental cardiopulmonary resuscitation does not ameliorate post-resuscitation hypoperfusion. Resuscitation, 1999. 40(1): p. 27-35.
40. Nozari, A., S. Rubertsson, and L. Wiklund, Differences in the pharmacodynamics of epinephrine and vasopressin during and after experimental cardiopulmonary resuscitation. Resuscitation, 2001. 49(1): p. 59-72.
41. Johansson, J., et al., Increased cortical cerebral blood flow by continuous infusion of adrenaline (epinephrine) during experimental cardiopulmonary resuscitation. Resuscitation, 2003. 57(3): p. 299-307.
42. Carter, L.P., Surface monitoring of cerebral cortical blood flow. Cerebrovasc Brain Metab Rev, 1991. 3(3): p. 246-61.
43. Brown, C.G., et al., Comparative effect of graded doses of epinephrine on regional brain blood flow during CPR in a swine model. Ann Emerg Med, 1986. 15(10): p. 1138-44.
44. Brown, C.G., et al., The comparative effects of epinephrine versus phenylephrine on regional cerebral blood flow during cardiopulmonary resuscitation. Resuscitation, 1986. 14(3): p. 171-83.
45. Krep, H., et al., Effects of hypertonic versus isotonic infusion therapy on regional cerebral blood flow after experimental cardiac arrest cardiopulmonary resuscitation in pigs. Resuscitation, 2004. 63(1): p. 73-83.
46. Heymann, M.A., et al., Blood flow measurements with radionuclide-labeled particles. Prog Cardiovasc Dis, 1977. 20(1): p. 55-79.
47. Obrist, W.D., et al., Regional cerebral blood flow estimated by 133-xenon inhalation. Stroke, 1975. 6(3): p. 245-56.
48. Cohan, S.L., et al., Cerebral blood flow in humans following resuscitation from cardiac arrest. Stroke, 1989. 20(6): p. 761-5.
49. Williams, D.S., et al., Magnetic resonance imaging of perfusion using spin inversion of arterial water. Proc Natl Acad Sci U S A, 1992. 89(1): p. 212-6.
50. Xu, Y., S. Liachenko, and P. Tang, Dependence of early cerebral reperfusion and long-term outcome on resuscitation efficiency after cardiac arrest in rats. Stroke, 2002. 33(3): p. 837-43.
51. Jarnum, H., et al., Diffusion and perfusion MRI of the brain in comatose patients treated with mild hypothermia after cardiac arrest: a prospective observational study. Resuscitation, 2009. 80(4): p. 425-30.
52. Gur, D., et al., In vivo mapping of local cerebral blood flow by xenon-enhanced computed tomography. Science, 1982. 215(4537): p. 1267-8.
53. Sterz, F., et al., Effects of U74006F on multifocal cerebral blood flow and metabolism after cardiac arrest in dogs. Stroke, 1991. 22(7): p. 889-95.
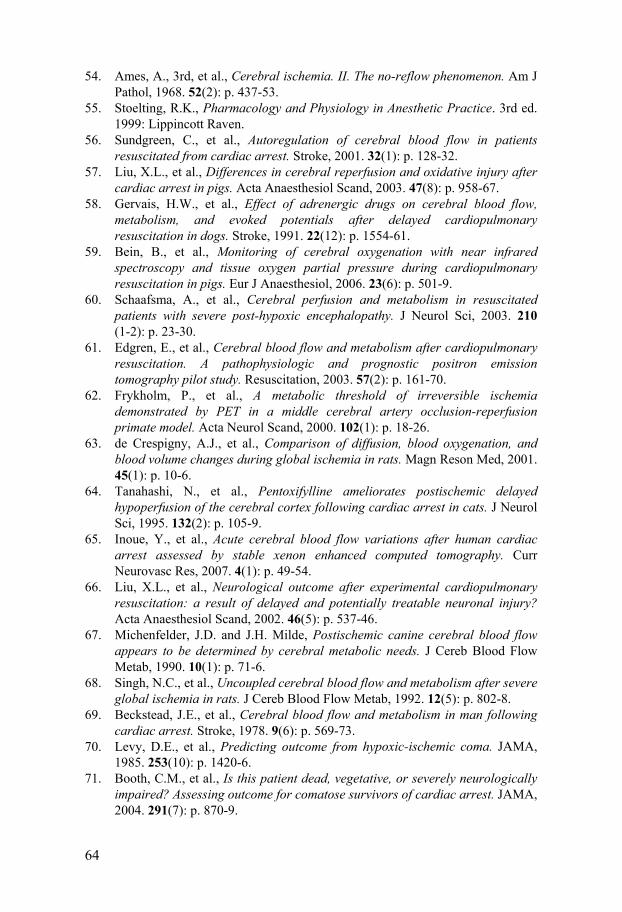
64
54. Ames, A., 3rd, et al., Cerebral ischemia. II. The no-reflow phenomenon. Am J Pathol, 1968. 52(2): p. 437-53.
55. Stoelting, R.K., Pharmacology and Physiology in Anesthetic Practice. 3rd ed. 1999: Lippincott Raven.
56. Sundgreen, C., et al., Autoregulation of cerebral blood flow in patients resuscitated from cardiac arrest. Stroke, 2001. 32(1): p. 128-32.
57. Liu, X.L., et al., Differences in cerebral reperfusion and oxidative injury after cardiac arrest in pigs. Acta Anaesthesiol Scand, 2003. 47(8): p. 958-67.
58. Gervais, H.W., et al., Effect of adrenergic drugs on cerebral blood flow, metabolism, and evoked potentials after delayed cardiopulmonary resuscitation in dogs. Stroke, 1991. 22(12): p. 1554-61.
59. Bein, B., et al., Monitoring of cerebral oxygenation with near infrared spectroscopy and tissue oxygen partial pressure during cardiopulmonary resuscitation in pigs. Eur J Anaesthesiol, 2006. 23(6): p. 501-9.
60. Schaafsma, A., et al., Cerebral perfusion and metabolism in resuscitated patients with severe post-hypoxic encephalopathy. J Neurol Sci, 2003. 210(1-2): p. 23-30.
61. Edgren, E., et al., Cerebral blood flow and metabolism after cardiopulmonary resuscitation. A pathophysiologic and prognostic positron emission tomography pilot study. Resuscitation, 2003. 57(2): p. 161-70.
62. Frykholm, P., et al., A metabolic threshold of irreversible ischemia demonstrated by PET in a middle cerebral artery occlusion-reperfusion primate model. Acta Neurol Scand, 2000. 102(1): p. 18-26.
63. de Crespigny, A.J., et al., Comparison of diffusion, blood oxygenation, and blood volume changes during global ischemia in rats. Magn Reson Med, 2001. 45(1): p. 10-6.
64. Tanahashi, N., et al., Pentoxifylline ameliorates postischemic delayed hypoperfusion of the cerebral cortex following cardiac arrest in cats. J Neurol Sci, 1995. 132(2): p. 105-9.
65. Inoue, Y., et al., Acute cerebral blood flow variations after human cardiac arrest assessed by stable xenon enhanced computed tomography. Curr Neurovasc Res, 2007. 4(1): p. 49-54.
66. Liu, X.L., et al., Neurological outcome after experimental cardiopulmonary resuscitation: a result of delayed and potentially treatable neuronal injury? Acta Anaesthesiol Scand, 2002. 46(5): p. 537-46.
67. Michenfelder, J.D. and J.H. Milde, Postischemic canine cerebral blood flow appears to be determined by cerebral metabolic needs. J Cereb Blood Flow Metab, 1990. 10(1): p. 71-6.
68. Singh, N.C., et al., Uncoupled cerebral blood flow and metabolism after severe global ischemia in rats. J Cereb Blood Flow Metab, 1992. 12(5): p. 802-8.
69. Beckstead, J.E., et al., Cerebral blood flow and metabolism in man following cardiac arrest. Stroke, 1978. 9(6): p. 569-73.
70. Levy, D.E., et al., Predicting outcome from hypoxic-ischemic coma. JAMA, 1985. 253(10): p. 1420-6.
71. Booth, C.M., et al., Is this patient dead, vegetative, or severely neurologically impaired? Assessing outcome for comatose survivors of cardiac arrest. JAMA, 2004. 291(7): p. 870-9.
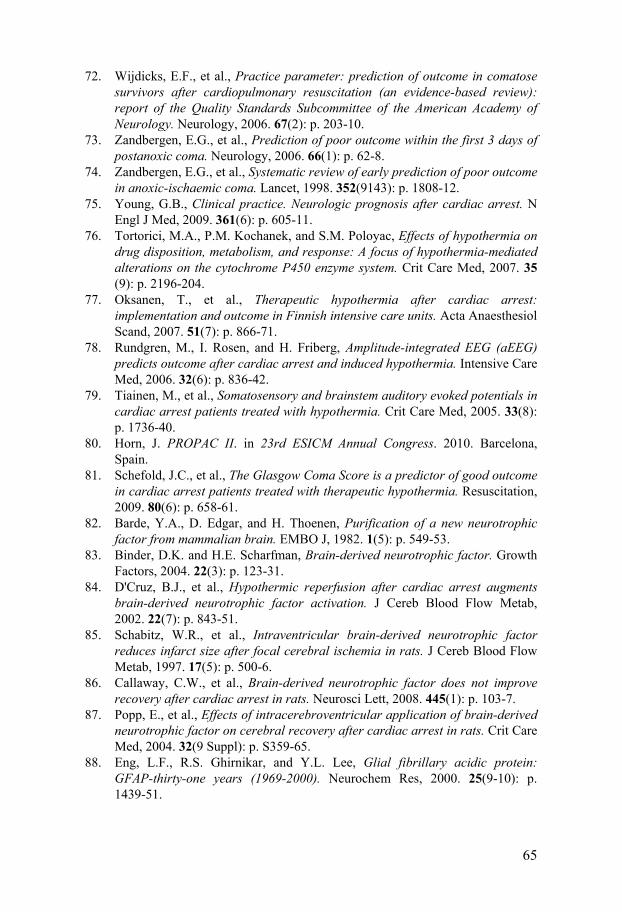
65
72. Wijdicks, E.F., et al., Practice parameter: prediction of outcome in comatose survivors after cardiopulmonary resuscitation (an evidence-based review): report of the Quality Standards Subcommittee of the American Academy of Neurology. Neurology, 2006. 67(2): p. 203-10.
73. Zandbergen, E.G., et al., Prediction of poor outcome within the first 3 days of postanoxic coma. Neurology, 2006. 66(1): p. 62-8.
74. Zandbergen, E.G., et al., Systematic review of early prediction of poor outcome in anoxic-ischaemic coma. Lancet, 1998. 352(9143): p. 1808-12.
75. Young, G.B., Clinical practice. Neurologic prognosis after cardiac arrest. N Engl J Med, 2009. 361(6): p. 605-11.
76. Tortorici, M.A., P.M. Kochanek, and S.M. Poloyac, Effects of hypothermia on drug disposition, metabolism, and response: A focus of hypothermia-mediated alterations on the cytochrome P450 enzyme system. Crit Care Med, 2007. 35(9): p. 2196-204.
77. Oksanen, T., et al., Therapeutic hypothermia after cardiac arrest: implementation and outcome in Finnish intensive care units. Acta Anaesthesiol Scand, 2007. 51(7): p. 866-71.
78. Rundgren, M., I. Rosen, and H. Friberg, Amplitude-integrated EEG (aEEG) predicts outcome after cardiac arrest and induced hypothermia. Intensive Care Med, 2006. 32(6): p. 836-42.
79. Tiainen, M., et al., Somatosensory and brainstem auditory evoked potentials in cardiac arrest patients treated with hypothermia. Crit Care Med, 2005. 33(8): p. 1736-40.
80. Horn, J. PROPAC II. in 23rd ESICM Annual Congress. 2010. Barcelona, Spain.
81. Schefold, J.C., et al., The Glasgow Coma Score is a predictor of good outcome in cardiac arrest patients treated with therapeutic hypothermia. Resuscitation, 2009. 80(6): p. 658-61.
82. Barde, Y.A., D. Edgar, and H. Thoenen, Purification of a new neurotrophic factor from mammalian brain. EMBO J, 1982. 1(5): p. 549-53.
83. Binder, D.K. and H.E. Scharfman, Brain-derived neurotrophic factor. Growth Factors, 2004. 22(3): p. 123-31.
84. D'Cruz, B.J., et al., Hypothermic reperfusion after cardiac arrest augments brain-derived neurotrophic factor activation. J Cereb Blood Flow Metab, 2002. 22(7): p. 843-51.
85. Schabitz, W.R., et al., Intraventricular brain-derived neurotrophic factor reduces infarct size after focal cerebral ischemia in rats. J Cereb Blood Flow Metab, 1997. 17(5): p. 500-6.
86. Callaway, C.W., et al., Brain-derived neurotrophic factor does not improve recovery after cardiac arrest in rats. Neurosci Lett, 2008. 445(1): p. 103-7.
87. Popp, E., et al., Effects of intracerebroventricular application of brain-derived neurotrophic factor on cerebral recovery after cardiac arrest in rats. Crit Care Med, 2004. 32(9 Suppl): p. S359-65.
88. Eng, L.F., R.S. Ghirnikar, and Y.L. Lee, Glial fibrillary acidic protein: GFAP-thirty-one years (1969-2000). Neurochem Res, 2000. 25(9-10): p. 1439-51.
66
89. Herrmann, M., et al., Release of glial tissue-specific proteins after acute stroke: A comparative analysis of serum concentrations of protein S-100B and glial fibrillary acidic protein. Stroke, 2000. 31(11): p. 2670-7.
90. Nylen, K., et al., Increased serum-GFAP in patients with severe traumatic brain injury is related to outcome. J Neurol Sci, 2006. 240(1-2): p. 85-91.
91. Nylen, K., et al., Serum glial fibrillary acidic protein is related to focal brain injury and outcome after aneurysmal subarachnoid hemorrhage. Stroke, 2007. 38(5): p. 1489-94.
92. Kaneko, T., et al., Serum glial fibrillary acidic protein as a predictive biomarker of neurological outcome after cardiac arrest. Resuscitation, 2009. 80(7): p. 790-4.
93. Hayashida, H., et al., Comparison of the predictability of neurological outcome by serum procalcitonin and glial fibrillary acidic protein in postcardiac-arrest patients. Neurocrit Care, 2010. 12(2): p. 252-7.
94. Schmechel, D., et al., Brain endolases as specific markers of neuronal and glial cells. Science, 1978. 199(4326): p. 313-5.
95. Marangos, P.J. and D. Schmechel, The neurobiology of the brain enolases. Essays Neurochem Neuropharmacol, 1980. 4: p. 211-47.
96. Johnsson, P., et al., Neuron-specific enolase increases in plasma during and immediately after extracorporeal circulation. Ann Thorac Surg, 2000. 69(3): p. 750-4.
97. Roine, R.O., et al., Neurological outcome after out-of-hospital cardiac arrest. Prediction by cerebrospinal fluid enzyme analysis. Arch Neurol, 1989. 46(7): p. 753-6.
98. Reisinger, J., et al., Prediction of neurological outcome after cardiopulmonary resuscitation by serial determination of serum neuron-specific enolase. Eur Heart J, 2007. 28(1): p. 52-8.
99. Rech, T.H., et al., Serum neuron-specific enolase as early predictor of outcome after in-hospital cardiac arrest: a cohort study. Crit Care, 2006. 10(5): p. R133.
100. Auer, J., et al., Ability of neuron-specific enolase to predict survival to hospital discharge after successful cardiopulmonary resuscitation. CJEM, 2006. 8(1): p. 13-8.
101. Tiainen, M., et al., Serum neuron-specific enolase and S-100B protein in cardiac arrest patients treated with hypothermia. Stroke, 2003. 34(12): p. 2881-6.
102. Oksanen, T., et al., Predictive power of serum NSE and OHCA score regarding 6-month neurologic outcome after out-of-hospital ventricular fibrillation and therapeutic hypothermia. Resuscitation, 2009. 80(2): p. 165-70.
103. Rundgren, M., et al., Neuron specific enolase and S-100B as predictors of outcome after cardiac arrest and induced hypothermia. Resuscitation, 2009. 80(7): p. 784-9.
104. Moore, B.W., A soluble protein characteristic of the nervous system. Biochem Biophys Res Commun, 1965. 19(6): p. 739-44.
105. Zimmer, D.B., et al., The S100 protein family: history, function, and expression. Brain Res Bull, 1995. 37(4): p. 417-29.
67
106. Goncalves, C.A., M.C. Leite, and P. Nardin, Biological and methodological features of the measurement of S100B, a putative marker of brain injury. Clin Biochem, 2008. 41(10-11): p. 755-63.
107. Rosen, H., et al., Increased serum levels of the S-100 protein are associated with hypoxic brain damage after cardiac arrest. Stroke, 1998. 29(2): p. 473-7.
108. Bottiger, B.W., et al., Astroglial protein S-100 is an early and sensitive marker of hypoxic brain damage and outcome after cardiac arrest in humans. Circulation, 2001. 103(22): p. 2694-8.
109. Weingarten, M.D., et al., A protein factor essential for microtubule assembly. Proc Natl Acad Sci U S A, 1975. 72(5): p. 1858-62.
110. Binder, L.I., A. Frankfurter, and L.I. Rebhun, The distribution of tau in the mammalian central nervous system. J Cell Biol, 1985. 101(4): p. 1371-8.
111. Bitsch, A., et al., Serum tau protein level as a marker of axonal damage in acute ischemic stroke. Eur Neurol, 2002. 47(1): p. 45-51.
112. Vandermeeren, M., et al., Detection of tau proteins in normal and Alzheimer's disease cerebrospinal fluid with a sensitive sandwich enzyme-linked immunosorbent assay. J Neurochem, 1993. 61(5): p. 1828-34.
113. Wunderlich, M.T., et al., Neuron-specific enolase and tau protein as neurobiochemical markers of neuronal damage are related to early clinical course and long-term outcome in acute ischemic stroke. Clin Neurol Neurosurg, 2006. 108(6): p. 558-63.
114. Shaw, G.J., E.C. Jauch, and F.P. Zemlan, Serum cleaved tau protein levels and clinical outcome in adult patients with closed head injury. Ann Emerg Med, 2002. 39(3): p. 254-7.
115. Ma, M., et al., Serum cleaved tau does not predict postconcussion syndrome after mild traumatic brain injury. Am J Emerg Med, 2008. 26(7): p. 763-8.
116. Okumus, N., et al., Tau and S100B proteins as biochemical markers of bilirubin-induced neurotoxicity in term neonates. Pediatr Neurol, 2008. 39(4): p. 245-52.
117. Williams, G.R., Jr. and F.C. Spencer, The clinical use of hypothermia following cardiac arrest. Ann Surg, 1958. 148(3): p. 462-8.
118. Leonov, Y., et al., Mild cerebral hypothermia during and after cardiac arrest improves neurologic outcome in dogs. J Cereb Blood Flow Metab, 1990. 10(1): p. 57-70.
119. Bernard, S.A., et al., Treatment of comatose survivors of out-of-hospital cardiac arrest with induced hypothermia. N Engl J Med, 2002. 346(8): p. 557-63.
120. Hypothermia_after_Cardiac_Arrest_Study_Group, Mild therapeutic hypothermia to improve the neurologic outcome after cardiac arrest. N Engl J Med, 2002. 346(8): p. 549-56.
121. Belliard, G., et al., Efficacy of therapeutic hypothermia after out-of-hospital cardiac arrest due to ventricular fibrillation. Resuscitation, 2007. 75(2): p. 252-9.
122. Oddo, M., et al., From evidence to clinical practice: effective implementation of therapeutic hypothermia to improve patient outcome after cardiac arrest. Crit Care Med, 2006. 34(7): p. 1865-73.
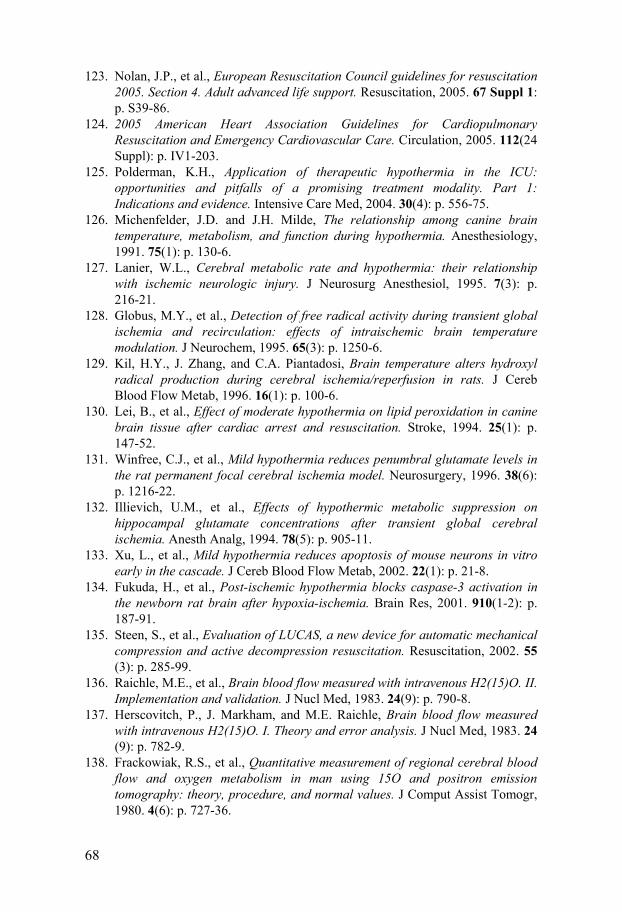
68
123. Nolan, J.P., et al., European Resuscitation Council guidelines for resuscitation 2005. Section 4. Adult advanced life support. Resuscitation, 2005. 67 Suppl 1: p. S39-86.
124. 2005 American Heart Association Guidelines for Cardiopulmonary Resuscitation and Emergency Cardiovascular Care. Circulation, 2005. 112(24 Suppl): p. IV1-203.
125. Polderman, K.H., Application of therapeutic hypothermia in the ICU: opportunities and pitfalls of a promising treatment modality. Part 1: Indications and evidence. Intensive Care Med, 2004. 30(4): p. 556-75.
126. Michenfelder, J.D. and J.H. Milde, The relationship among canine brain temperature, metabolism, and function during hypothermia. Anesthesiology, 1991. 75(1): p. 130-6.
127. Lanier, W.L., Cerebral metabolic rate and hypothermia: their relationship with ischemic neurologic injury. J Neurosurg Anesthesiol, 1995. 7(3): p. 216-21.
128. Globus, M.Y., et al., Detection of free radical activity during transient global ischemia and recirculation: effects of intraischemic brain temperature modulation. J Neurochem, 1995. 65(3): p. 1250-6.
129. Kil, H.Y., J. Zhang, and C.A. Piantadosi, Brain temperature alters hydroxyl radical production during cerebral ischemia/reperfusion in rats. J Cereb Blood Flow Metab, 1996. 16(1): p. 100-6.
130. Lei, B., et al., Effect of moderate hypothermia on lipid peroxidation in canine brain tissue after cardiac arrest and resuscitation. Stroke, 1994. 25(1): p. 147-52.
131. Winfree, C.J., et al., Mild hypothermia reduces penumbral glutamate levels in the rat permanent focal cerebral ischemia model. Neurosurgery, 1996. 38(6): p. 1216-22.
132. Illievich, U.M., et al., Effects of hypothermic metabolic suppression on hippocampal glutamate concentrations after transient global cerebral ischemia. Anesth Analg, 1994. 78(5): p. 905-11.
133. Xu, L., et al., Mild hypothermia reduces apoptosis of mouse neurons in vitro early in the cascade. J Cereb Blood Flow Metab, 2002. 22(1): p. 21-8.
134. Fukuda, H., et al., Post-ischemic hypothermia blocks caspase-3 activation in the newborn rat brain after hypoxia-ischemia. Brain Res, 2001. 910(1-2): p. 187-91.
135. Steen, S., et al., Evaluation of LUCAS, a new device for automatic mechanical compression and active decompression resuscitation. Resuscitation, 2002. 55(3): p. 285-99.
136. Raichle, M.E., et al., Brain blood flow measured with intravenous H2(15)O. II. Implementation and validation. J Nucl Med, 1983. 24(9): p. 790-8.
137. Herscovitch, P., J. Markham, and M.E. Raichle, Brain blood flow measured with intravenous H2(15)O. I. Theory and error analysis. J Nucl Med, 1983. 24(9): p. 782-9.
138. Frackowiak, R.S., et al., Quantitative measurement of regional cerebral blood flow and oxygen metabolism in man using 15O and positron emission tomography: theory, procedure, and normal values. J Comput Assist Tomogr, 1980. 4(6): p. 727-36.
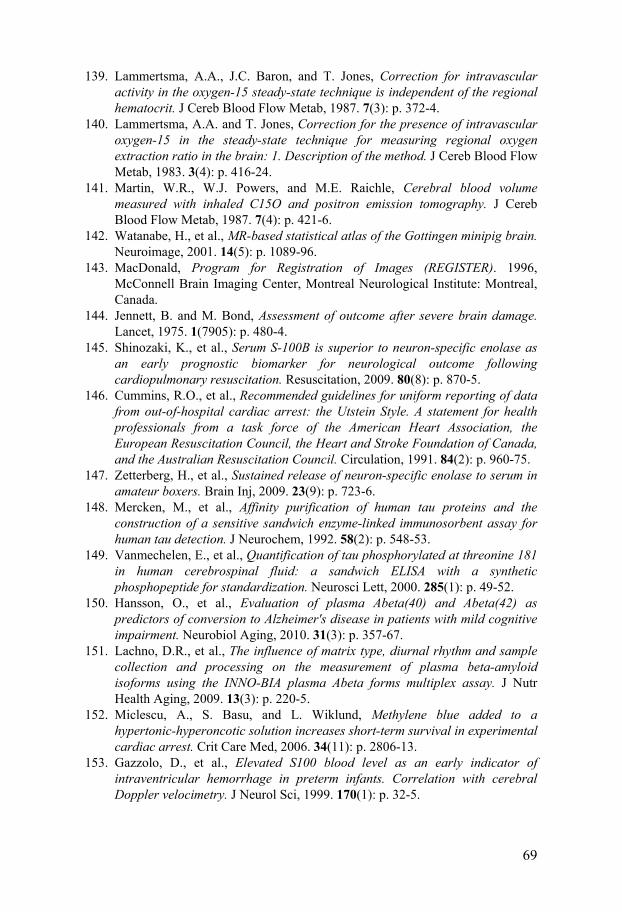
69
139. Lammertsma, A.A., J.C. Baron, and T. Jones, Correction for intravascular activity in the oxygen-15 steady-state technique is independent of the regional hematocrit. J Cereb Blood Flow Metab, 1987. 7(3): p. 372-4.
140. Lammertsma, A.A. and T. Jones, Correction for the presence of intravascular oxygen-15 in the steady-state technique for measuring regional oxygen extraction ratio in the brain: 1. Description of the method. J Cereb Blood Flow Metab, 1983. 3(4): p. 416-24.
141. Martin, W.R., W.J. Powers, and M.E. Raichle, Cerebral blood volume measured with inhaled C15O and positron emission tomography. J Cereb Blood Flow Metab, 1987. 7(4): p. 421-6.
142. Watanabe, H., et al., MR-based statistical atlas of the Gottingen minipig brain. Neuroimage, 2001. 14(5): p. 1089-96.
143. MacDonald, Program for Registration of Images (REGISTER). 1996, McConnell Brain Imaging Center, Montreal Neurological Institute: Montreal, Canada.
144. Jennett, B. and M. Bond, Assessment of outcome after severe brain damage. Lancet, 1975. 1(7905): p. 480-4.
145. Shinozaki, K., et al., Serum S-100B is superior to neuron-specific enolase as an early prognostic biomarker for neurological outcome following cardiopulmonary resuscitation. Resuscitation, 2009. 80(8): p. 870-5.
146. Cummins, R.O., et al., Recommended guidelines for uniform reporting of data from out-of-hospital cardiac arrest: the Utstein Style. A statement for health professionals from a task force of the American Heart Association, the European Resuscitation Council, the Heart and Stroke Foundation of Canada, and the Australian Resuscitation Council. Circulation, 1991. 84(2): p. 960-75.
147. Zetterberg, H., et al., Sustained release of neuron-specific enolase to serum in amateur boxers. Brain Inj, 2009. 23(9): p. 723-6.
148. Mercken, M., et al., Affinity purification of human tau proteins and the construction of a sensitive sandwich enzyme-linked immunosorbent assay for human tau detection. J Neurochem, 1992. 58(2): p. 548-53.
149. Vanmechelen, E., et al., Quantification of tau phosphorylated at threonine 181 in human cerebrospinal fluid: a sandwich ELISA with a synthetic phosphopeptide for standardization. Neurosci Lett, 2000. 285(1): p. 49-52.
150. Hansson, O., et al., Evaluation of plasma Abeta(40) and Abeta(42) as predictors of conversion to Alzheimer's disease in patients with mild cognitive impairment. Neurobiol Aging, 2010. 31(3): p. 357-67.
151. Lachno, D.R., et al., The influence of matrix type, diurnal rhythm and sample collection and processing on the measurement of plasma beta-amyloid isoforms using the INNO-BIA plasma Abeta forms multiplex assay. J Nutr Health Aging, 2009. 13(3): p. 220-5.
152. Miclescu, A., S. Basu, and L. Wiklund, Methylene blue added to a hypertonic-hyperoncotic solution increases short-term survival in experimental cardiac arrest. Crit Care Med, 2006. 34(11): p. 2806-13.
153. Gazzolo, D., et al., Elevated S100 blood level as an early indicator of intraventricular hemorrhage in preterm infants. Correlation with cerebral Doppler velocimetry. J Neurol Sci, 1999. 170(1): p. 32-5.
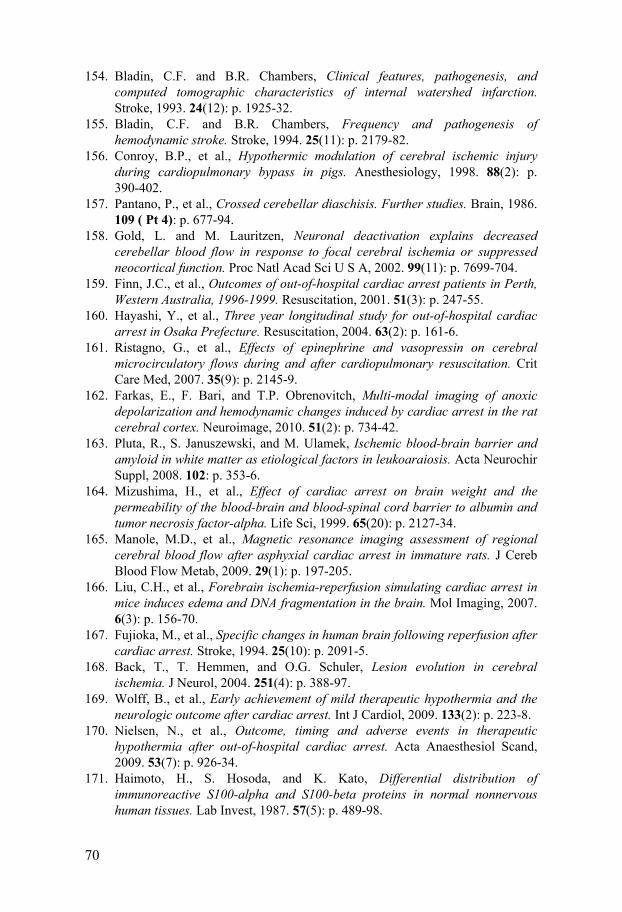
70
154. Bladin, C.F. and B.R. Chambers, Clinical features, pathogenesis, and computed tomographic characteristics of internal watershed infarction. Stroke, 1993. 24(12): p. 1925-32.
155. Bladin, C.F. and B.R. Chambers, Frequency and pathogenesis of hemodynamic stroke. Stroke, 1994. 25(11): p. 2179-82.
156. Conroy, B.P., et al., Hypothermic modulation of cerebral ischemic injury during cardiopulmonary bypass in pigs. Anesthesiology, 1998. 88(2): p. 390-402.
157. Pantano, P., et al., Crossed cerebellar diaschisis. Further studies. Brain, 1986. 109 ( Pt 4): p. 677-94.
158. Gold, L. and M. Lauritzen, Neuronal deactivation explains decreased cerebellar blood flow in response to focal cerebral ischemia or suppressed neocortical function. Proc Natl Acad Sci U S A, 2002. 99(11): p. 7699-704.
159. Finn, J.C., et al., Outcomes of out-of-hospital cardiac arrest patients in Perth, Western Australia, 1996-1999. Resuscitation, 2001. 51(3): p. 247-55.
160. Hayashi, Y., et al., Three year longitudinal study for out-of-hospital cardiac arrest in Osaka Prefecture. Resuscitation, 2004. 63(2): p. 161-6.
161. Ristagno, G., et al., Effects of epinephrine and vasopressin on cerebral microcirculatory flows during and after cardiopulmonary resuscitation. Crit Care Med, 2007. 35(9): p. 2145-9.
162. Farkas, E., F. Bari, and T.P. Obrenovitch, Multi-modal imaging of anoxic depolarization and hemodynamic changes induced by cardiac arrest in the rat cerebral cortex. Neuroimage, 2010. 51(2): p. 734-42.
163. Pluta, R., S. Januszewski, and M. Ulamek, Ischemic blood-brain barrier and amyloid in white matter as etiological factors in leukoaraiosis. Acta Neurochir Suppl, 2008. 102: p. 353-6.
164. Mizushima, H., et al., Effect of cardiac arrest on brain weight and the permeability of the blood-brain and blood-spinal cord barrier to albumin and tumor necrosis factor-alpha. Life Sci, 1999. 65(20): p. 2127-34.
165. Manole, M.D., et al., Magnetic resonance imaging assessment of regional cerebral blood flow after asphyxial cardiac arrest in immature rats. J Cereb Blood Flow Metab, 2009. 29(1): p. 197-205.
166. Liu, C.H., et al., Forebrain ischemia-reperfusion simulating cardiac arrest in mice induces edema and DNA fragmentation in the brain. Mol Imaging, 2007. 6(3): p. 156-70.
167. Fujioka, M., et al., Specific changes in human brain following reperfusion after cardiac arrest. Stroke, 1994. 25(10): p. 2091-5.
168. Back, T., T. Hemmen, and O.G. Schuler, Lesion evolution in cerebral ischemia. J Neurol, 2004. 251(4): p. 388-97.
169. Wolff, B., et al., Early achievement of mild therapeutic hypothermia and the neurologic outcome after cardiac arrest. Int J Cardiol, 2009. 133(2): p. 223-8.
170. Nielsen, N., et al., Outcome, timing and adverse events in therapeutic hypothermia after out-of-hospital cardiac arrest. Acta Anaesthesiol Scand, 2009. 53(7): p. 926-34.
171. Haimoto, H., S. Hosoda, and K. Kato, Differential distribution of immunoreactive S100-alpha and S100-beta proteins in normal nonnervous human tissues. Lab Invest, 1987. 57(5): p. 489-98.
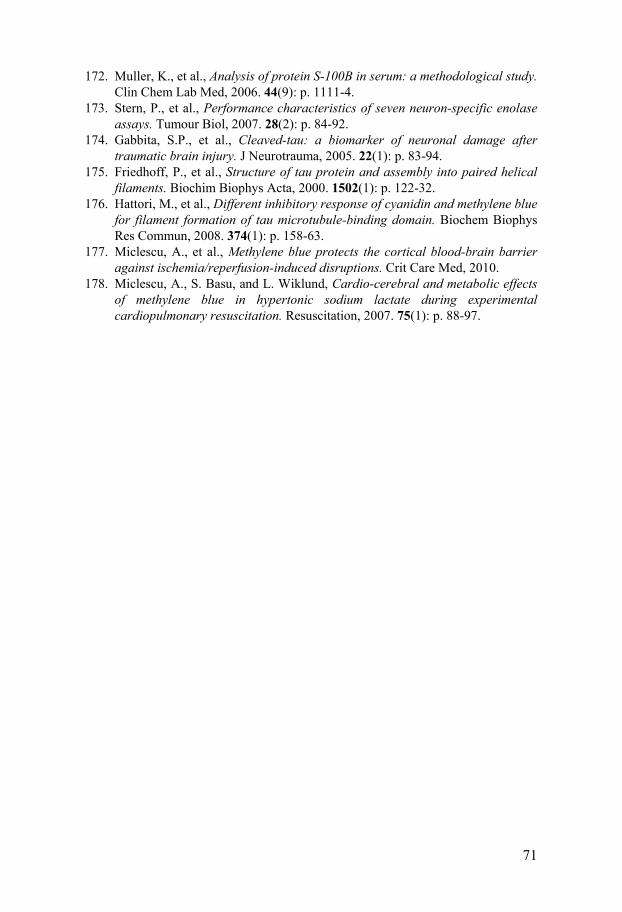
71
172. Muller, K., et al., Analysis of protein S-100B in serum: a methodological study. Clin Chem Lab Med, 2006. 44(9): p. 1111-4.
173. Stern, P., et al., Performance characteristics of seven neuron-specific enolase assays. Tumour Biol, 2007. 28(2): p. 84-92.
174. Gabbita, S.P., et al., Cleaved-tau: a biomarker of neuronal damage after traumatic brain injury. J Neurotrauma, 2005. 22(1): p. 83-94.
175. Friedhoff, P., et al., Structure of tau protein and assembly into paired helical filaments. Biochim Biophys Acta, 2000. 1502(1): p. 122-32.
176. Hattori, M., et al., Different inhibitory response of cyanidin and methylene blue for filament formation of tau microtubule-binding domain. Biochem Biophys Res Commun, 2008. 374(1): p. 158-63.
177. Miclescu, A., et al., Methylene blue protects the cortical blood-brain barrier against ischemia/reperfusion-induced disruptions. Crit Care Med, 2010.
178. Miclescu, A., S. Basu, and L. Wiklund, Cardio-cerebral and metabolic effects of methylene blue in hypertonic sodium lactate during experimental cardiopulmonary resuscitation. Resuscitation, 2007. 75(1): p. 88-97.