Embed Size (px)
Citation preview

Prepared by:
SH&E Limited
210 High Holborn
London WC1V 7BW
Description of runways, navigation aids and distances
United Kingdom
Tel: 44(0) 207242-9333
Fax: 44(0) 20 7242-9334
28thFebruary 2001
ContentsContents.......................................................................................................................................................................... 2
1. Executive Summary............................................................................................................................................... 3
2. Introduction........................................................................................................................................................... 7
2.1 Background to ourStudy............................................................................................................................ 7
2.2 Current Position atDublin Airport............................................................................................................ 7
2.3 DifficultiesEncountered in Summer 2000 and the Appointment of ACL............................................ 8
2.4 Traffic Growth andProjected Demand...................................................................................................... 9
3. Investigation of RunwayUsage and Potential Congestion......................................................................... 11
3.1 Basic Description ofRunway................................................................................................................... 11
3.2 Examination ofPossible Constraints and Potential for Increasing Capacity.................................... 12
3.3 Taxiways...................................................................................................................................................... 13
3.4 Conclusions................................................................................................................................................ 13
4. Investigation of StandCapacity and Potential Congestion......................................................................... 16
4.1 Description ofAvailable Stands.............................................................................................................. 16
Description of runways, navigation aids and distances

4.2 Projected Usage andConstraints............................................................................................................ 16
4.3 Issues to beConsidered............................................................................................................................ 18
4.4 Peak Stand DemandAnalysis.................................................................................................................. 18
4.5 Detailed Examinationof Stand Demand and Turn-round Times......................................................... 21
4.6 Actual Stand Demandon 3/4/5/August 2000........................................................................................ 23
4.7 Summary of Findings................................................................................................................................. 23
5. Investigation ofTerminal Capacity.................................................................................................................. 25
5.1 Description ofTerminal Facilities............................................................................................................ 25
5.2 Demand and PeakHours........................................................................................................................... 25
5.3 ServiceStandards....................................................................................................................................... 27
5.4 Declared Capacity...................................................................................................................................... 27
5.5 Conclusion.................................................................................................................................................. 30
6. Assessment of theFindings in the Context of the Regulation.................................................................... 31
6.1 SH&E’s work inthe context of the Regulation...................................................................................... 31
6.2 Interpretation ofthe Results in the Context of the Regulation........................................................... 32
APPENDICES........................................................................................................................................................... 35
Appendix1 – Reduction of runwayoccupancy times....................................................................................... 36
Appendix2 – Terminal Analysis........................................................................................................................... 37
Appendix3 – Selected Fully Co-ordinated European Airports........................................................................ 38
Description of runways, navigation aids and distances

1. Executive Summary
The IrishDepartment of Public Enterprise has requested an in-depth study of the capacityof Dublin Airport in order to assess the request of Aer Rianta fordesignationas a fully co-ordinated airport under the European Commission Airport SlotAllocation Regulation 95/93. As an initial action, AirportCo-ordinationLimited (ACL) has been appointed Co-ordinator to work with Aer Rianta and theairlines to manage demand and capacity at the airport.
In order toestablish the extent of current or immediate congestion, SH&E hasundertaken a number of investigations of the individual components of theairportsystem, taking into account growth potential and the efficient runningof the whole airport system. This has necessitated analysing complex facilitiesand processes andrelying upon information provided by Aer Rianta, ACL, theairlines and other users. SH&E hasmade every effort to use this data accurately and in good faith. However, as with much airport data, greatcare is necessary in arriving at precise conclusions because of theinterpretation of data or the way in which they arerecorded. It is possible that there may be somerevision to the findings in the course of the review by the main stakeholdersin the process. The results of thisinvestigation are outlined below:
Runway/air traffic control: there is noclear indication of airspace congestion and the Dublin traffic management areais independent of any other major airports. Forscheduling purposes, Dublin is best considered as having asingle-runway. The movements limit is lower than some ‘best practice’single-runway airports, with amaximum of 40 movements per hour and 38 per hourin a two hour period. In the past there has also been a constraint regardingthe ability of aircraft to clear therunway. However, the addition of a RapidExit Taxiway (RET) has helped to overcome this problem. SH&E believes that,with the adoption of ‘best practice’ runwaymanagement, the limit might beraised to 44 movements per hour.
All these calculationsexclude business aviation and other non-transport flights. Currently these makea small contribution to peak hour congestion. Tighter regulationof permissionscould be required in future.
An examination ofdemand for landings and take-offs in summer 2001 shows a requirement exceeding40 movements per hour. This in itselfis not be a reason for fullco-ordination because
a) the actualoperated movements is often lower than initial ‘bids’ to the co-ordinator
b) under‘co-ordination’ airlines can agree to swap and/or move timings from peak to offpeak.
c) Dublin has a more‘homogeneous’ aircraft mix compared with airports such as Gatwick andManchester, which achieve higher productivity from one runway.Both theseairports have been studied by the Irish Aviation Authority (IAA) with a view toadopting some of their procedures.
d) based on thisexamination, the current declared capacity of 40 movements per hour could beraised to 44.
Stands/Apron: there is someuncertainty as to the usage of stands because of the way the statistics arecompiled. The data Aer Rianta has provided on stand occupancydoes not support,in terms of the overall number of stands, the existence of serious congestion,but it indicates some specific difficulties. From evidence provided by
Description of runways, navigation aids and distances

Aer Rianta, we have reached the followingconclusions:
q There could be ashortage of widebody stands from about 2002 period and thereafter, assumingwhat we believe to be a ‘worst case’ demand scenario.
q There are,however, sufficient stands for the next 3-4 years if a higher level of remotestand usage and bussing of passengers is accepted.
q There is apotential conflict regarding the long standing agreement of airlines to haveautomatic access to a number of contact stands.
q There has been ashortage of suitable stands and subsequent delays perhaps because of a lack offlexibility in the stand allocation system, and inadequate standmanagementdecision aids.
q There is adequateland for the construction of more stands if Aer Rianta wishes to do so, but ifthese are to be contact stands they would need to be part of amajor terminalextension, such as the proposed Pier D,or a new terminal complex on a new site.
It cannot bestated categorically that there is a genuine shortage of stands. However thereis an issue of quality of service. In summer 2000, about 20% ofnon-Ryanairmovements were ‘bussed’. However, given that there are no more contact standsexpected to be built, the level of bussed movements could grow to 30%by 2004,even assuming better management of stands. Although this implies a lowerquality of service, it is not a matter that can be addressed through thecoordinationprocess unless the total number of stands is inadequate to meetdemand.
Terminal: there was severecongestion in the terminal in summer 2000, due to the continued rapid growth intraffic and, more importantly, the construction of the 6bay check-in area. Onthe basis that the work is concluded by next summer, we can draw someconclusions regarding the historic ‘pinch points’:
Landside check-inshould have adequate area for the volume of passengers at peak times as well asadequate desks. The CUTE system thatAer Rianta hasimplemented, once adopted by most airlines, will increase theefficiency and throughput. However, there is a serious question regarding theimpact of therefurbishment of the old check-in area, if it is to go ahead.Given the problems associated with the development of the 6 bay, there shouldbe an impact andmanagement plan to avoid a repeat of the serious terminalcongestion of summer 2000.
Security hasadequate channels although careful attention will have to be paid to ‘off peaksurges’ such as early morning outbound charters where, reportedly, toofewchannels have been open or airside access denied to passengers.
Dublin has opengate rooms and there is potential for congestion in some areas, particularlyPier A gates where passengers wait to board Ryanair flights on stands10-12.Making the waiting area deeper by using more of the space in the old terminalbuilding might alleviate this.
There has beensome congestion in airside arrivals because passengers from Piers A and B haveto cross those from Pier C en-route to baggage reclaim. This has beencompounded by the constructionwork for the 6 bay. This work will soonbe completed and the problem solved.
Description of runways, navigation aids and distances

Overall Conclusions
The decision todesignate Dublin airport as co-ordinated and to appoint ACL as the scheduleco-ordinator is fully justified. Thesuccess of this operation will securedthrough the following actions:
q Airlines behaveresponsibly in assisting ACL to spread the air transport movement (ATM) peaks;
q The IrishAviation Authority is prepared to adopt procedures which increase hourly runwaycapacity (in particular adopting a 3 mile aircraft separation)[1];
q Work on theterminal is completed and the refurbishment of the old check-in area does notadversely affect the running of the terminal.
We believe that theseconditions can be met and that if they are, 3-4 years growth may be possiblebefore there is insufficient slack in the system to allowself-management. Thisassumes that traffic grows by the ‘baseline’ Aer Rianta projection. If growth continues at the rates experiencedin the recent past, capacitycould be reached as early as 2002.
Beyond this therewill be a need for firmer and more prescriptive control. However, in theintervening period, if the airlines cannot demonstrate the ability tocomplyfully with ACL under ‘co-ordination’ then ‘full co-ordination’ will benecessary. It is recommended that there is a review of the success of selfmanagementby, at the latest, June 2001 (and each subsequent June), in order tomanage a transition to full co-ordination before the November schedulingconference, if it isdeemed necessary.
The regulationprovides for a rapid transition to full co-ordination as the Member State candesignate an airport as fully co-ordinated if a thorough capacityanalysis“…does not indicate possibilities of resolving the serious problems in theshort term…”. Furthermore, the Regulation provides for full co-ordination tobeapplied at certain periods or even to be lifted, thereby offering twoalternative options.
As a note ofcaution, we must point out that at any airport, even with full co-ordination,there may still be serious congestion and poor quality of service at peaktimesbecause of unexpected problems and surges in demand. At airports like Dublin,which are operating near their absolute maximum capacity, this is highlylikely.
Description of runways, navigation aids and distances

2. Introduction
2.1 Background to our Study
The IrishDepartment of Public Enterprise has requested an in-depth assessment of thecapacity of Dublin Airport in order to assess the request of Aer Riantafordesignation as a fully co-ordinated airport under the European Commission’sAirport Slot Allocation Regulation 95/93. This requires an independent assessment ofthe capacity of the airportto decide if there are periods when capacity problems occur and to determinewhether and on what time scale solutions to these problemscan beimplemented. Consultation with the aircarriers using the airport and with the air traffic control authorities is alsorequired under Article 3(4) of theRegulation. Only if there appear to be no short-term solutions to the capacityshortages may the airport be designated as fully co-ordinated. The study isrequired toprovide a capacity assessment to comply with Article 3(3) ofRegulation 95/93.
2.2 Current Position at Dublin Airport
Dublin is the home base of Aer Lingusand Ryanair. It is the major access point for air passengers to and from Ireland. It has a vital social and economic role.Theextent to which it is congested and the treatment of this congestion are amatter of grave concern for airlines, passengers and the wider Irish economy.
The rapid growth at Dublin in recentyears has placed significant strains on its facilities. However, the capacity provided by the fullextension of Pier C and the recentopening of the 6 bay extension should have greatlyeased pressure in the terminal area. With the exception of North American traffic, there is potentiallyconsiderableoperational flexibility in the areas to be used for the processingof the bulk of passengers.
However, the matter is complicated bycommercial considerations: For example, Ryanair has a preference for gates withcontact stands but no air bridges, while othercarriers prefer to offer ahigher level of service and use air bridges. On the major Heathrow route,British Midland has opted for Pier C and Aer Lingus hasconcentrated on A andB.
Terminal and gate allocations affectstand allocation, and there are further factors that reduce the level ofhomogeneity. In addition to differences in the size of stands,with relativefew being designed for wide-bodied aircraft operating transatlantic servicesand some charter flights, some stands are adjacent to the terminal buildingandsome are remote, requiring the use of buses for access of both passengers andair crew. Most airlines prefer the use of contact stand for reasons of cost,operationalconvenience and customer service. Added to this is the fact thatsome contact stands have air bridges while others do not.
The majority ofaircraft movements at Dublin Airport currently use the main runway, althoughthe airport also has a crosswind runway and another short runway forturbopropoperations. The addition of a fast exitfrom the main runway has increased capacity, but it will be important tounderstand and assess the hourly capacitiesdeclared by the Irish AviationAuthority, which appear to be lower than those applied at other airports with asingle (principal) runway. Currently,Dublin Airport still
Description of runways, navigation aids and distances

has a material number of non-commercial operations bygeneral aviation, corporate and military aircraft which canhave an impact on peak hour congestion.
2.3 Difficulties Encountered in Summer 2000 and theAppointment of ACL
The perception ofthe airport and the view that full co-ordination is required is driven largelyby the problems of summer 2000. Thisperiod saw extreme congestion inthe terminal (landside departures and airsidearrivals) and on the stands. To a large extent, this congestion was due to anumber of temporary infrastructural andorganisation factors including:
q The developmentof the 6 bay extension, which meant that there was construction work clutteringthe terminal
q Inadequatecheck-in capacity prior to the opening of the new area
q Building workintruding on the area at the end of the baggage reclaim belts
q Inadequatebaggage reclaim belts prior to the opening of the new area
q Delays asarriving aircraft waited for contact stands
q Delays as groundservice equipment reached the aircraft
Some of theseproblems were due to the development of the 6 bay terminal extension that isnow complete. Others, such as theaccess to stands are an organisationalissue and will continue into summer 2001unless urgent action is undertaken.[2]For example there were large numbers of passengers crossing each other tore-claimtheir bags[3] .
A furtherdifficulty was the use of Dublin by a number of ‘uncoordinated’ charterairlines. The most prominent was BluePanorama, which, it is alleged, madeinadequate ground arrangements and timedtheir flights to arrive in the peak hours. The resultant confusion and disorganisation added to the overallimpression of anairport that was operating beyond its capacity.
The groundhandlers reported a lack of efficient organisation in summer 2000 that meantthat they and many passengers had to endure a poor quality of product in theairport. There is consistent anecdotal evidence ofinsufficient staff on security and passport control, ineffective or misleadingflight information displays and access tothe airside being closed to earlymorning charter departures. It has tobe stressed that these reports have not been substantiated. Even if they are true, they do notleaddirectly to the conclusion that full co-ordination is necessary. As with manyother aspects of ‘congestion’ at Dublin Airport discovered in the course ofthis study,the answer may lie in the completion of building works and a reviewof procedures/investment in airport management tools.
As a preliminarystep to alleviate the situation, ACL were appointed by the Ministry for PublicEnterprise as co-ordinators and they have acted on behalf of Dublin attheNovember 2000 scheduling conference. Prior to the conference, there was someexcess demand over capacity, based purely on runway slots. One of the main
Description of runways, navigation aids and distances

objectives of ACL’s attendanceat the conference was to reach agreement with the airlines to match demand tosupply. There are already some concerns regarding thedegree of airline’scooperation which reinforces the need for a regular review of self-management.
Generally, theexperience of congestion is one of the driving forces towards fullco-ordination. In order to ascertain the extent to which this is necessary,SH&E hasundertaken an evaluation of the components of the airportsystem. We have assessed the followingsituations:
q Capacityconstraints if the airport infrastructure/management is as of today
q The impact ofsome proposed changes
q Projecting thegrowth for a 4 year period
These will beused as the basis for assessing the need for full co-ordination.
2.4 Traffic Growth and Projected Demand
Dublin Airport isexpected to handle 13.8 million passengers in the year 2000. There has beenconsiderable growth from the 10.3 million handled in 1997. Most of thepassengers are either on UKroutes (54%) or other European (32%). The airport has around 100,000 tonnes ofcargo flown in dedicated cargo aircraft plus considerablecargo in the belly ofpassenger aircraft. The number of widebody aircraft used on cargo services isalready significant and is expected to increase.
Traffic growth isexpected to slow markedly, according to forecasts made available to us, in thenext four years to an average annual growth of around 5%. The maingrowth areasin percentage terms are expected to be southern European charter andtransatlantic. However, these are relatively small flows and the mainvolumetricgrowth will come from UK and European scheduled routes. Table 1shows the expected change in demand levels by route area.
Table 1: Dublin PassengerTraffic Forecasts until 2004 (passenger millions,
Description of runways, navigation aids and distances

centreline forecast)
The above are ‘central’forecasts . Upper and lower forecasts also exist.
Source: AerRianta
3. Investigation of Runway Usage andPotential Congestion
3.1 Basic Description of Runway
Dublin Airporthas three operational runways. The main runway 10/28, is 2637m in length. Thesecond runway, referred to normally as the crosswind runway 16/34 is2072 mlong. The third runway, 11/29, is 1357m long. Attachment 1 shows the locationof these runways.
The figures belowshow the current level of demand and the projected level of demand in summers2001 and 2004.
Figure1:Runway demand and capacity summer 2001
Description of runways, navigation aids and distances

Figure 2:Runway demand and capacity summer 2004
It can be seenthat, in summer 2001, demand occasionally exceeds the one hour declared limitof 40 (requiring some re-timing). However, the hours either side of thesepeakhours have significantly less demand. This means that few flights have to bere-scheduled by more than 30 minutes. By 2004, there will probably beoccasionswhere much greater changes from the preferred timings will be necessary inorder to stay within capacity limits.
The ACLcoordination process in practice works with 15-minute periods. Because of the‘bunching’ of demand around particular timings (e.g. on thehour),considerable, but minor, changes are required to meet the 15-minute capacityconstraints.
In addition,there are separate constraints of 24 movements per hour within the overalltotal for arrivals and departures. In principal, this could be moreconstrainingthan the overall limit but we do not believe this to be case inpractice. The IAA has indicated that there is flexibility in this regard.
While ACL havebeen generally successful in matching the 2001 demand to the availablecapacity, there has already been some difficulty in achieving therequiredschedule adjustments. The task will become progressively more difficult as thescale of the re-timings increases, leading to an eventual need forfullcoordination. This point will arrive sooner if traffic growth exceeds the baseforecast.
Description of runways, navigation aids and distances

3.2 Examination of Possible Constraints and Potentialfor Increasing Capacity
As at most busyairfields, there is a mix of traffic into and out of Dublin in terms of speedand size of aircraft. Data supplied byAer Rianta showed that over 80% ofthe movements were by medium sized aircraft,this should be conducive to a relatively high movement rate because a standardwake vortex turbulence separation formedium category aircraft could beapplied. Aer Rianta acknowledge the need for an education programme with ATCand airlines on runway occupancy andcooperating with Eurocontrol in thismatter.
Although Dublinhas the potential to be at the higher end (relative to other airports) ofmovement rate from a single runway, there are several inhibiting factors:
q Runway 28 waslimited therefore until March 2000, aircraft were not able to exit the runwayquickly, and therefore each aircraft had a high ‘runway occupancytime’ therebyreducing the overall number of achievable movements. This has been resolved tosome extent by the construction of a Rapid Exit Taxiway (RET).However the RETis shorter than those found at many other airports and exiting is stillsomewhat slower than it could be.
q Airlines are notusing the airfield efficiently. For example aircraft do not always enter theairfield efficiently, lack of training or awareness has led to a lowgeneralreaction time (for instance, departing aircraft do not enter the runway andtake off as quickly as they could).
As a result ofthe opening of the new RET in 2000, aircraft are now able to exit more quicklyand this should make possible an increase in declared capacity. Whencoupledwith a reduction in separations, this should make possible a progressiveincrease in capacity over time up to around 44/45 movements per hour. Theexperienceof other airports is that the achievement of higher runwayutilisation is a gradual process. Dublin may increase its rate faster becauseit can learn from other airportswhich have already been through this process.
A number of majorairports, including Gatwick and Heathrow, have benefited from an energeticeducation programme on runway occupancy times. A study by BAAshowed a widevariation in pilot response to line up and takes off clearance, plus groundlanding roll and runway vacation. SH&E is of the opinion that a surveyatDublin would quickly determine if a similar programme would benefit overallefficiency and productivity. The IAA have agreed that adoption of best practicewouldmake it possible to achieve sustainable rates of 44 movements per hour.
3.3 Taxiways
The airfield iswell equipped with a taxiway system which includes the old main runway 05/23but with limitations. The taxiway system for the main runway allowsfor acontinuous flow of departing and arriving traffic with a possible bottleneckfor aircraft requiring the full runway length when runway 10 is in use.Similarly, lineup on the runway 16 has to be correctly sequenced by ATC due tothe absence of a holding bay area.
Description of runways, navigation aids and distances

Although aircraftdeparting on runway 28 have a short taxi from the apron 1 (see attachment 1)there is no holding bay to allow an aircraft to pass although severalaccesspoints provide opportunities for efficient routing. However, the taxiway systemdoes not present a current or potential constraint.
3.4 Conclusions
There have beenmajor improvements in infrastructure and procedures which have increased themovement rate at Dublin.
With the jointaction and commitment of IAA and airlines, SH&E consider a rate of 44movements per hour is possible based on runway 28. Figures 1 and 2 showsthe expected usage for 2001 and projectedto 2004[4],which indicates that, under operating conditions similar to those at othercomparable airports, there should beadequate runway capacity over the courseof a day. There will, however, be a requirement for the airlines to agree tomove some activity from or within the peakhours.
There is no evidence of anyimmediate constraints from taxiways and holding areas. The optimised proceduresdescribed above and in the appendices could mean thatfull co-ordination is notrequired until 2005, provided there are no serious problems in other parts ofthe terminal. This is based on the Aer Rianta ‘base’ forecast. Aforecast morein line with past growth would bring this date forward to about 2003.
Attachment1
4. Investigation of Stand Capacity and Potential Congestion
4.1 Description of Available Stands
A shortage ofpositions, or stands, where aircraft can load or unload passengers or cargo canbe a major constraint.
Aer Riantadeclared a capacity in 2001 of 26 wide-body plus 32 narrow –body, giving atotal of 58 if all the wide-body stands are in use. This rises to 65 if allstandsare occupied by narrow bodied aircraft.
The stands can bedivided between ‘contact’ and ‘non-contact’. By ‘contact’ we mean stands that can reasonably be accessed bypassengers without the use of buses. Wehave defined these as being all those numbered between 8 and 47 inclusive onthe layout plans supplied by Aer Rianta. The distinction is significant because allairlines prefer contactstands and some, we understand, insist on them. If narrow-bodied aircraft occupied all contact stands the totalavailability would be 30[5].
Description of runways, navigation aids and distances

With maximum wide-bodied use (11) weestimate that the total would decline to 24 and with an ‘average’ degree ofwide-bodied use (equivalent to 10 wide-bodiedoccupancies for the airport intotal) the total availability would be 7 wide-bodied plus 21 narrow-bodiedgiving a total of 28.
It is notpossible to give a single figure for the stand capacity at Dublin Airport. This is because the total number of standsavailable depends on the aircraft mix andon the degree to which standards ofservice can be downgraded through use of inconveniently sited stands.
4.2 Projected Usage and ConstraintsAttachment2 shows the locations of the numbered stands and the restrictions in force onstand usage. Table 2 sets out the availabilities described above. Table 3showsthe expected demand against the available capacity.
Attachment2
Table 2:Stand Capacity (Number of Aircraft that can be accommodated)
Source: SH&E
Table 3:Estimated stand demand and capacity 2000 – 2004(typical day in peak period,peak hours)
Source: SH&E based on Aer Rianta base forecast
In addition tothe numbered stands there are some other parking areas. Most of these aresuitable only for light aircraft but the apron extension between taxiwaysP1and D2 currently used for General Aviation (GA) aircraft could be used for anumber of small sized air transport aircraft. In an emergency, taxiways P1 andP2
Description of runways, navigation aids and distances

could also be used for parking aircraft.
4.3 Issues to be ConsideredIt seems to usthat there are a number of issues to be considered when comparing the standprovision at Dublin with forecast demand. These are:
q Whether there areenough stands in total to meet forecast demand.
q Whether it willbe possible to maintain current standards, in terms of individual airlines’requirements for contact and pier-served stands, as demand rises. (Thisis anissue of service standards rather than coordination).
q Whether it willbe possible to meet demand for air transport stands without displacing othermovements – including corporate general aviation flights.
q Whether there areany short-term measures that can be taken to increase stand capacity in theevent that demand exceeds what is currently available.
4.4 Peak Stand Demand AnalysisAer Rianta hasprovided us with details listing all aircraft arrivals in July and August 2000and December 1999. Details of all standoccupancies for the same monthshave also been provided. July and August traffic levels were verysimilar to each other, while December’s were 30 % lower. (Details are given inTable 4.) Peak hoursin December are likely tobe closer to summer peak hours but we believe that if summer schedulingproblems can be resolved, it will always be possible to resolve theequivalentwinter scheduling problems.
The pattern ofdemand is flat (Figure 3). DuringAugust there is a difference of only 8 % between the busiest day and theaverage day. On the basis of this datawesubjected the period 3/ 4/ 5 August to detailed analysis. This period wasvery busy, giving a good representation of normal operating conditions. It alsoincluded bothweekdays and weekend days, which can be significant in view ofdifferent patterns of traffic both in total and in the traffic mix.
However, therelationship between stand demand and traffic levels is not simple. Peak standdemand can result from, for instance, a particular delay pattern on anaverageday as opposed to the sheer volume of traffic. For this reason, we believe that it would be prudent to assume thatthere could be a small number of occasionswhen stand demand was higher than shownin our analysis.
Table4: Daily StandOccupancies – Key Months 1999/2000
Total Daily Stand occupancies (Number ofaircraft)
Date July 2000 Aug 2000 Dec 19991 273 273 2002 296 279 2313 280 278 2214 272 292 1775 274 280 1906 297 275 2237 313 283 224
Description of runways, navigation aids and distances

8 283 280 2169 285 284 230
10 277 298 23811 276 297 17712 266 287 18213 285 284 23014 287 279 22215 287 274 22816 292 284 24317 281 295 24318 272 289 17719 281 279 19120 291 281 22021 304 283 21222 278 274 23023 275 284 23424 284 289 19625 284 309 3726 282 292 16927 304 292 21828 307 294 20929 270 279 22330 267 283 23231 280 292 142
Source:Aer Rianta
Figure3: Total Daily Standoccupancies for December 1999 and Julyand August 2000
Source: Aer Rianta
An analysis was carried out over the samethree day period, 3/ 4/ 5 August, in order to cover a number of areas, asfollows:
Description of runways, navigation aids and distances

q Total standdemand by 15-minute periods throughout the operating day (defined as 0600 to2200).
q Demand for eachindividual stand, giving the number of occupancies, the times of occupancy, theaircraft type and the airline.
q Averageturn-round times by airline by aircraft type. We have defined three aircraft types :
- Wide-bodied, asdefined by Aer Rianta. Its definitionincludes the B.757 in addition to all forms of twin aisle aircraft.
- Other aircraft weighing more than 10tonnes. This covers virtually alltransport type aircraft.
- Aircraft weighing less than 10 tonnes.
In addition, thedetailed analysis enabled us to identify whether the stand in question was inuse for a passenger aircraft or a cargo aircraft. The stands wholly used bycargo aircraft were excluded from theturn-round time analysis, as were individual utilisations that were identifiablycargo aircraft.
4.5 Detailed Examination of Stand Demand and Turn-round TimesTable 5 shows theresults of a detailed analysis we have undertaken of stand occupancies on 3/ 4/5/ August 2000. The traffic has been divided betweenRyanair, AirLingus narrow-bodied, Aer Lingus wide-bodied, other narrow bodiedand other wide-bodied. Stands usedwholly or mainly by cargo aircraft have been excluded. These vary from day to day but are generallystands 48-68 or some from this group. Overnight occupancies have been excludedfrom the turn-round calculations (Inthis context ‘overnight means a standoccupancy at midnight). A small number of extremely long occupancies have alsobeen excluded.
Description of runways, navigation aids and distances

Table 5:Stand Occupancy 3/4/5 August 2000
Source: Aer Rianta
FR=Ryanair ,EINB=Aer Lingus Narrow body, EIWB- Aer Lingus wide body OTNB=Other airlinesnarrow body, OTWB = Other airlines wide body
The mainconclusions from this analysis are:
q Overall averageturn-round times are between 66 and 87 minutes. The average on the Saturday(5/8/00) is much higher than on the weekdays at 87 minutes.
q Ryanair’sturn-rounds are much shorter than either Air Lingus or other airlines, at 40-50minutes compared with 75-100 Aer Lingus narrow-bodied and 60-80(othernarrow-bodied).
q Wide-bodiedturn-rounds are much longer on average than narrow-bodied.(approximately 2hours).
From the analysisit is clear that forecasting stand demand by application of a simple factor torunway movements could be unreliable. Itis also clear that if theproportion of wide-body aircraft in the mix rises thedemand for stands will rise disproportionately.
Description of runways, navigation aids and distances

4.6 Actual Stand Demand on 3/4/5/August 2000
We have looked indetail at the stand occupancy on each of the three study days between 0600 and1100. This shows that:
q Aircraft parkingover night causes the peak demand. Demand declines considerably between 0600 and 0700.
q The peak demandin total is for 40 stands as shown by statistics supplied by Aer Rianta. Thisnumber, however, excludes (on Saturdays and Sundays) cargoaircraft parked formore than 24 hours. It is also potentially affected by the practise of towingaircraft from contact to non-contact stands during the turnaround.Thesefactors could lead to the actual demand being, we estimate, 10-12 higher thanshown by the statistics. There is a nominal capacity of 58 stands,assumingmaximum widebody usage, although in practice, given normal levels ofwide-bodied demand, capacity is likely to be 60-62.
q The peak demandfor contact stands (defined as numbers 8-47) is 24, compared with a capacity of29 or 30.
q We did notspecifically analyse the demand for stands associated with pre-clearance ofUS-bound flights. These have to be pier-served and there could be ashortage ofthem before the onset of overall stand capacity problems.
It would appeartherefore, that even given the uncertainty in the statistics and the fact thatthere may have been other days when stand demand exceeded the levelsshown inour analysis, the overall demand is below capacity. Taking contact stands alone demand is up to 80-85% of capacity.Wide-bodied stand demand peaks at arequirement for six stands simultaneouslyon the sample days. This peak occurs later in the day than total stand demand.
4.7 Summary of Findings
q The initialfindings are that although there may be shortages of contact stands at peaktimes, overall stand provision does not present a current orshort-termconstraint.
q There does notappear to be any justification for full coordination on the basis of overallstand demand for 2001. Because of uncertainties in the data relating to2000,it is difficult to predict when capacity might be reached, but we would expectthis to occur in about 2003.
q However, there islikely to be severe pressure on contact stands in the near future. This may cause problems of allocation but isnot an issue that should in itselflead to full coordination.
q There is somepressure on contact stands for wide-bodied aircraft and as the numbers of theseaircraft increase it will be increasingly necessary for them to beserved bynon-contact stands, with the attendant handling and passenger serviceimplications.
q There are widevariations between airlines in the productivity of stand usage andconsideration may be given to the encouragement of more overallproductivity,for example through faster turnround times.
q A further shortterm solution might be the consideration of an extension to the terminal closeto Pier A (Pier D) which may add up to 12 narrow body stands.
Description of runways, navigation aids and distances

5. Investigation of TerminalCapacity
5.1 Description of Terminal FacilitiesThere is oneterminal at Dublin Airport. This consists of two floors, with arrivals on theground and departures on the first floor. Leading off from the terminalbuildingare three piers A, B and C. All passengers are processed throughcommon facilities. A summary of the facilities is shown in table 6
Table6: Facilities atDublin Airport, November 2000
Facility Size/CapacityCheck in 146 desksDepartures Concourse 5220m²Passenger Search 7 x-raysImmigration 10 desksBaggage Reclaim 2 x 65m, 6 x 38m, 1 x 21mArrivals Concourse 3370m²
Source: AerRianta
5.2 Demand and Peak HoursThe ACL study ofJuly 1999 provides actual and forecast busy hour and annual data for 1991-1998(Actual) and 1999-2006 (Forecast) in Table 9 of the ACLdocument. This showsthe airport becoming gradually less peaked – as measured by the ratio of theannual traffic divided by the busy hour traffic. The ratio forarrivals rises from about 5400 in the earlynineties to 6400 by 1998. Fordepartures the ratio rises from 4800 to 5700. Data presented by BAA to theHeathrowTerminal 5 Inquiry (Document BAA 32, Table D8) is in Table 7:
The ability of the terminal to accommodatepresent and projected traffic levels is measured through the use of busy hourstatistics. Aer Rianta uses ‘typical’ industrybusy hours. With this measure 5%of annual passengers are allowed to use the terminal in hours above the busyhour when conditions are theoretically sub-standard
Table 7:Heathrow Airport
Description of runways, navigation aids and distances

Source: BAA
These figuresindicate an extremely flat traffic pattern, as can be seen by the comparisonwith BAA airports given above. Theforecasts assume some further peakspreading. However, on the assumption that little further spreading is likely tohappen without full co-ordination. Using 1998 as a base, the figures for 1999,2000 and2001 would be as displayed in table 8:
Table 8: Historic and projected peak hour passengersat Dublin
Source: ACL
Elsewhere in dataprovided by Aer Rianta the number of seats provided by hour for the peak summerweeks of 1998,1999 and 2000 is set out. This is based on thescheduled aircraftarrival times multiplied by the number of seats on each aircraft. Table 9 setsout the peak hour and busiest two-hour data :
Table9: Peak hour andbusy two-hour periods
Busiest Hour (Number of passengers) Average of busiest two hours Arrivals Departures Arrivals Departures1998 2843 3035 2441 25611999 2963 3183 2659 27102000 3191 3185 2935 2975
Source: Aer Rianta
The data relatein each case to the week containing 31st July. The busiest hour is an isolated occurrence –comparable with the actual peak hour, whereas the averageof the two busiesthours is more nearly comparable with the busy hour. When compared with the actual and forecast busy hour data givenabove, these figuresindicate load factors in the busy hour of 75-80%(arrivals) and 80-85% (departures). These are consistent with the assumptions normally used in deriving thebusyhour from data on scheduled seats provided.
Description of runways, navigation aids and distances
5.3 Service Standards
Any declaredterminal capacity is based on an assumption that certain standards of servicewill be achieved when the terminal is operating at the capacity level.Thereare two main components of these standards. The first is a series of standardsrelating to the time that passengers have to spend queuing while the variouscontrolprocedures are carried out and the amount of standing, sitting andcirculation space assumed per passenger. The second component relates to thenumber of occasionswhen it is assumed that passengers will suffer sub standardconditions of service when the airport is operating at capacity.
We understandthat Aer Rianta uses a mix of International Air Transport Association (IATA)and BAA standards. As far as the space and time components of thestandards areconcerned, therefore, Dublin’s conform to normal practise. The IATA standardsare fairly broad, while BAA’s are more detailed, but with similar bases.Incalculating the number of “permitted” sub standard hours Aer Rianta uses BAA’s5% busy hour. With this measure 5% of annual passengers are allowed to usetheterminal in hours when conditions are sub-standard. At Dublin given the patternof traffic over the year, the week and the day, this 5% will consist of morethan 100individual hours. This compares with much lower numbers of hours ifother measures are used such as the standard busy rate(SBR), which is the 30thbusiest hour inthe period in the period 16th June to 15thSeptember
In summary webelieve that Aer Rianta uses planning guidelines that will deliver standards ofservice in line with normal international practice.
5.4 Declared Capacity
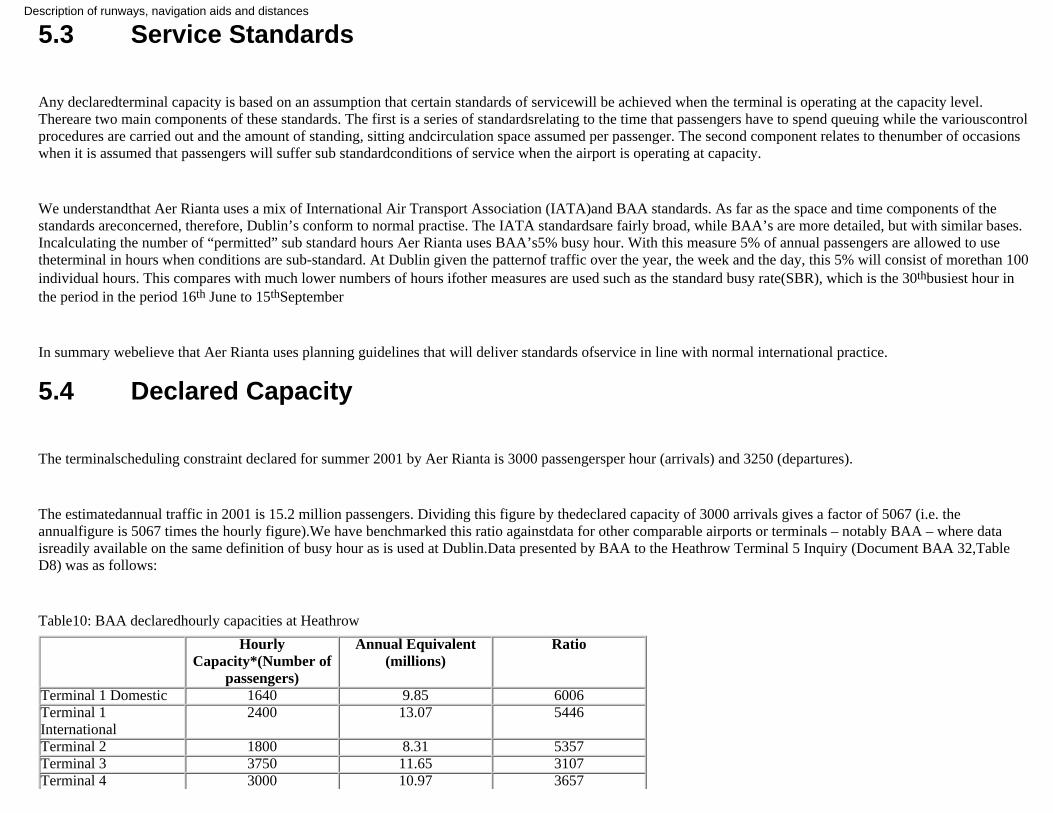
The terminalscheduling constraint declared for summer 2001 by Aer Rianta is 3000 passengersper hour (arrivals) and 3250 (departures).
The estimatedannual traffic in 2001 is 15.2 million passengers. Dividing this figure by thedeclared capacity of 3000 arrivals gives a factor of 5067 (i.e. theannualfigure is 5067 times the hourly figure).We have benchmarked this ratio againstdata for other comparable airports or terminals – notably BAA – where dataisreadily available on the same definition of busy hour as is used at Dublin.Data presented by BAA to the Heathrow Terminal 5 Inquiry (Document BAA 32,TableD8) was as follows:
Table10: BAA declaredhourly capacities at Heathrow
HourlyCapacity*(Number of
passengers)
Annual Equivalent(millions)
Ratio
Terminal 1 Domestic 1640 9.85 6006Terminal 1International
2400 13.07 5446
Terminal 2 1800 8.31 5357Terminal 3 3750 11.65 3107Terminal 4 3000 10.97 3657
Description of runways, navigation aids and distances

*Arrival ordeparture(whichever is the higher)
Source: BAA
The figuresillustrate the difference between long haul and short haul ratios, causedpartly by the constraints on long haul scheduling and partly by the muchhigheraverage loads on long haul aircraft[6].Dublin, being mainly short haul could be expected to have a ratio somewhatlower than the short haul terminals atHeathrow (approximately 5000). Thiswould suggest that Dublin will be at or close to capacity in 2001, but notoverloaded. Similar data for Gatwick’s south terminalin 1992, when it handled11.8 million passengers with a one way busy hour of 2552, give a ratio of 4618.Given that Gatwick handled a significant volume of longhaul traffic in thatyear the figure again suggests that the declared capacity for Dublin in 2001 islikely to be close to the figure for demand.
ACL analysed thesummer 1999 schedule against the above scheduling limits. In doing so it usedload factors supplied by Aer Rianta based on the average of the toptwentyhours, applied to scheduled seats. Thiscould well produce figures that are in fact higher than the 5% busy hourbecause the latter contains nearer to 100 than 20hours. In looking at the future, however, the busyhour values could be understated because they assume a continuation of the pasttrend of peak spreading. This isdone by assuming busy hour growth at 1% peryear lower rates than annual growth. AsDublin already has an extremely flat traffic profile this couldbeover-optimistic. In practice thedifferences over a short period are small.
The impact of theterminal expansion has been assessed in broad terms using data provided by AerRianta. When compared with the estimates of busy hour demandfor 2001 –equivalent to an annual throughput of 15.1million passengers, the individualcomponents have capacities that exceed demand by the amounts shown intable 11:
Table 11: Peak Hour versus Terminal Area Capacity
Source:ACL/Aer Rianta/SH&E
Despite the minorreservations about the methodology used we consider that these figuresrepresent a reasonable picture of the capacity/demand situation.
Description of runways, navigation aids and distances

The abovecapacity estimates relate to the terminal as a whole. They therefore imply an optimum distribution of demand betweenthe three terminal areas. Inpracticethese areas (Pier A, Pier B and Pier C) operate mainly as self-contained units,both as regards the airlines using them and the handling agents . Pier A isusedby Ryanair and Aer Lingus, plus some handled charters, Pier B is used byAer Lingus long-haul, some Aer Lingus short-haul and most flights by NorthAmerican andcontinental European carriers. Pier C is used by British Midland, City Jet, some other foreignshort-haul carriers and by some charters. A subjective look at thesefacilities suggests that some specific problemscould arise if the current distribution of traffic continues. The main problem areas that we haveidentified are:
q Pier A. The GateRooms serving stands 8-12, on the face of the old terminal building, are verynarrow causing potential flow problems for passengers trying toaccess thelower numbered gates. These problemswould be greatly exacerbated if Ryanair replaces its B.737-200s with 800s, asthis would cause an increase of about40% in the average aircraft load. Using the non-contact stands associated withPier A (70-88) would be likely to cause problems. Bussing to these stands from Pier Acould create overcrowding inthe pier.
q Growth in trafficwill make it increasingly difficult for Ryanair to continue to operateexclusively from contact stands without discriminating againstotherairlines.
q Pier B. We have some concerns about the capacity of the immigration facility,which would appear to rely on very fast service times in order to meet demand. If transatlantic traffic continues to growquickly there could also be a shortage of pier-served stands, requiring moretowing-off of aircraft between their arrival anddeparture and loweringpassenger service standards if passengers have to be bussed.
q Pier C. The largebussing facility under Pier C would appear to present one solution to theproblem of increased use of non-contact stands. For this to workeffectively itwould be necessary for some bussing operations to relate to aircraft using thePier A no contact stands and therefore using different handling agentsfromthose in Pier C.
q In general therewill be a quite rapid increase in the proportion of flights needing to behandled on non-contact stands – with its implications for costs, congestiononthe apron and passenger service standards, and the willingness of all airlinesto use non contact stands.
5.5 Conclusion
While thereappears to be sufficient capacity in the terminal as a whole for 3-4 yearsgrowth, this will require some difficult management decisions and aninevitablerapid increase in the use of non-contact stands. The broad conclusions that canbe drawn from the above analysis is that a terminal capacity of 3000passengerfor arrivals and 3250 for departures – as declared by Aer Rianta for 2001 isthe equivalent of about 18.5 million annual passengers assuming no furtherpeakspreading beyond the 1998 level. Thisshould be sufficient to last until 2004 however if the airport is to operatecorrectly at the expected volumes it is imperativethat there is adequateresources provided by the airlines and handling agents to process passengers.
Description of runways, navigation aids and distances

6. Assessment of the Findings in the Context of theRegulation
6.1 SH&E’s work in the context of the Regulation
The regulationand coordination of airports has its legal backing in the Council Regulation (EEC) No 95/93 of January 1993 on common rules forthe allocation ofslots at Community airports’
The Regulationaimed to achieve the following key objectives[7]:to facilitate competition; to ensure slots are allocated on the basis of“neutral, transparent andnon-discriminatory rules”; and, most relevantly toDublin, to encourage the use of airport capacity by making the best use ofavailable slots. Under the Regulation,Member States may designate airports asco-ordinated “provided that principles of transparency, neutrality andnon-discrimination are met”.
The Regulation isunclear about the exact point at which a Member State has no option but toimpose full coordination. The three initial criteria for coordination are:
(i) when air carriers representing more than a half of the operations at anairport and/or the airport authority consider that capacity is insufficient foractual orplanned operations at certain periods or
(ii) when new entrants encounter serious problems in securing slots or
(iii) when a Member State considers it necessary
On the basis ofpoint iii Air Rianta has requested that the Department commission the capacityanalysis. It is simultaneously seeking to arrive at a decision based upontheprocess laid out in the Regulation:
“ If, after consultationwith the air carriers using the airport regularly [and] the airport authorities, air traffic control,authorities and passengers’ organisations …, theanalysis does not indicatepossibilities of resolving the serious problems in the short term, the MemberState shall ensure that the airport shall be designated as fullycoordinatedfor the periods during which capacity problems occur.”
Description of runways, navigation aids and distances

6.2 Interpretation of the Results in the Context of the RegulationOur analysis ofthe three critical sub-systems at Dublin Airport suggests that the decision todesignate the airport as a co-ordinated airport under the terms oftheRegulation 95/93 is fully justified.
However, itappears, at least on paper, that there should just be sufficient capacityavailable to delay a designation of full co-ordination for a small number ofyears.This view is based on our belief that improvements will be implementedin the following areas:
· The improvement by Aer Rianta of its stand allocation and managementprocesses:
· The co-operation of all users of Dublin Airport with Aer Rianta’smanagement of the airport and its stand allocation decisions, particularly inrelation to the useof contact and non-contact stands.
· Ground handling arrangements match growth in traffic
· The cooperation of airlines with requests from ACL for re-scheduling offlight to prevent periods when demands would exceed capacity; and
· The co-operation of new airlines to communicate with ACL beforeoperating.
The most criticalelement in the airport system currently appears to be availability of stands,especially contact stands. There are likely to be adequate stands availableintotal (contact and non-contact) to accommodate demand in the short term. It isa decision of the airline community whether:
a) It is prepared toaccept a reducing quality of service; and
b) Either allairlines agree to use when necessary non-contact stands or the community isprepared to accept the refusal of individual airlines to usenon-contactstands.
If both of theseconditions do not apply, there is potential for unacceptable levels ofcongestion. Regulation 95/93 is not particularly clear in the conditions thatneed toapply for an airport to be designated as fully co-ordinated. However,we consider that a revision to the Regulation would offer greater guidance inthis regard, andwould be consistent with our opinion that in the absence ofairline agreement on these two points, Dublin should be designated as fullyco-ordinated.
Description of runways, navigation aids and distances

Of equalimportance is the voluntary re-scheduling of flights, as and when requested byACL. If this does not happen, and despite our analysis of the capacityofDublin airport (based on average growth rates and typical distributions oftraffic), then it is clear that there would be periods in which demand wouldexceedcapacity. Although not the outcome of a formal capacity study asrequired by Regulation 95/93 (as currently drafted), it would be the clearestpossible indication thatdesignation of Dublin as fully co-ordinated would bejustified. This ultimately is a decision of individual airlines and ACL shouldreport regularly to the Department /the Office of the Aviation Regulator andAer Rianta as appropriate on airline co-operation.
The need forDublin to be guarded as best possible against “un-announced arrivals” is themost difficult to obtain advance agreement on. As slots are only neededatfully co-ordinated airports, there is no obligation on an airline to inform anairport in advance of its intention to operate into to it. The provisions ofthe Regulationare particularly weak and unclear in this regard. We considerthe most practical means of reducing the risks of such un-announced operationsas have occurred inDublin in the past (short of designation as fullyco-ordinated) is to seek the co-operation of the airlines to ensure priorclearance with ACL prior to taking on business.We consider that Aer Riantawould be justified in making this a condition of the right to operate at theairport.
It will beappreciated that there can be no guarantee that all four of these enhancementswill be met (although there should be no difficulty with the first). Each ofthese needs to be closely monitored.
Our capacityassessment also assumes that hourly runway capacity can be increased to 44movements, and that this capacity is fully available for commercialoperations.We believe that this is an achievable objective.
APPENDICES
Appendix 1 – Reduction ofrunway occupancy timesThe capacity of arunway is crucially dependent on the length of time that each landing ordeparting aircraft spends on the runway. The other key determinant istheavailability of aircraft waiting to land or take off. Therefore, training ofpilots and air traffic controllers in order to cut waiting times to a minimumis a way ofachieving higher throughputs from a runway. Surveys at Gatwick and Heathrow airportsshow that significant improvements are possible. We believe that these
Description of runways, navigation aids and distances

improvements could also be achieved atDublin. If they were, a capacity of 44movements per hour should be achievable. The second key feature is theavailability ofa queue of aircraft. Onarrival this can be achieved by reducing separation between aircraft to theminimum safe distance. A key part ofthis is reduction of separationfrom 5miles to 3. Given the mix of aircraft at Dublin - which are mainly of the samemedium jet type- there should be little loss of capacity due to the extraseparationneeded behind very large aircraft. On departures there should not be a problem unless aircraft arrive atthe runway and are then unable to depart due to en-routerestrictions. In this case holding area scan optimise theflow of aircraft to the runway by providing overtaking opportunities
Appendix 2 –Terminal Analysis
Individual components of capacity and the effects ofterminal expansion in 2000.
The demand and capacitystudy carried out by ACL gives details of the capacities of individualcomponents of the terminal in 1999, 2000 and 2001. (These are shownin Table 8 of the ACL Full Report and are reproducedbelow)
All figures arepassenger numbers
1999 2000 2001
Departures Check in 1980 2810 3250Concourse 1540 2410 4190Passenger Search 3000 3510 3510 Arrivals Immigration 2370 2970 2970Baggage Reclaim 1850 3410 3410Concourse 1890 3390 3390
Appendix 3 –Selected Fully Co-ordinated European Airports
The following table showsairports (ranked by annual passenger throughput) in Europe, as provided by IATAand their co-ordination status.
Description of runways, navigation aids and distances

Source: IATA
[1] We also recommend a study to determine if better education wouldimprove pilot response to line up and take of clearance, and ground landingroll and runwayvacation.
[2] According to Aer Rianta, IBM has been appointed to provide standmanagement software.
[3] Currently,passengers arriving in Piers A and B will usually collect bags from the beltsnearest Pier C and vice versa. This causes congestion as passenger flowscrosseach other. This has been compounded by reduced passage due to building works.
Description of runways, navigation aids and distances

[4] before ‘reduction’ and peak spreading.
[5] This is the figure declared by Aer Rianta for 2001.
[6] At Heathrow, atthe time these figures relate to (1993), Terminal 1 handled mainly short – haulhome based traffic. Terminal 2 handled mainly away- basedshort-haul traffic,Terminal 3 away based long haul traffic and terminal 4 home based longhaul.
[7] Ref: European Commission Study of certain aspects of Council Regulation95/93 on common rules for the allocation of slots at CommunityAirports.PriceWaterhouse Coopers, May 2000.
Description of runways, navigation aids and distances