Embed Size (px)
Citation preview

ASSESSMENT OF THE ANTIPROTOZOAL
ACTIVITY OF SOME TUBULIN INHIBITORS
FOLLOWING CYCLODEXTRIN
COMPLEXATION.
By
Kathleen I. Menon BSc. Hons. (Biological Science)
This thesis was submitted as a requirement for the degree of Doctor of
Philosophy at Murdoch University 2002.

ii
DECLARATION
I declare that the thesis ‘Assessment of the antiprotozoal activity of some tubulin
inhibitors following complexation with cyclodextrin’ is a true account of my own
research. To the best of my knowledge, the work submitted is original and contains no
material that has previously been submitted for a degree at any tertiary education
institution.
Kathleen I. Menon

iii
ACKNOWLEDGEMENTS
Firstly, I would sincerely like to thank my supervisors Professors James Reynoldson
and Andrew Thompson for their guidance and patience over the years, and persistence
of these attributes while reading and correcting drafts of my thesis. I also extend my
thanks to the Division of Veterinary and Biomedical Sciences, Murdoch University, for
the provision of research funding and financial assistance with conference travel
expenses which made my studies possible.
Many thanks to Associate Professors Charles McDonald and John Parkin from Curtin
University for their help with the HPLC and phase solubility experiments, and
especially Mike Boddy for teaching me HPLC and for always being there when I
needed help.
Thanks also go to Professor Douglas Clarke and Kenneth Seymour from the Chemistry
department at Murdoch University for their help with the DSC-TGA analysis.
I am also grateful to the staff and students in the Vet school at Murdoch University
(both past and present) for their help on various aspects of my project. In particular,
special thanks to Anthony Armson, Megan Johnson, Keith Sargent, Geoff Dow, Nawal
Hijjawi and Andrew Low from the Parasitology group, and to Ken Chong from the
Biochemistry group, for both their friendship and help throughout this PhD.
Finally, and most of all, I would like to thank my husband Prakash for his support,
belief and love throughout the duration of this project.
iv
ABSTRACT
The purpose of the present study was to evaluate the potential usefulness of tubulin
inhibitors when complexed with hydroxypropyl-β-cyclodextrin (ΗPβCD) against a
range of protozoan parasites. This approach involved investigations into the
complexation of these drugs with ΗPβCD, and subsequent investigations of these drugs
and their complexes in regard to cytotoxicity, pharmacokinetics, in vitro efficacy
against Giardia, Cryptosporidium and rodent malaria (Plasmodium chabaudi), and their
in vivo efficacy against Giardia and malaria.
Albendazole (ABZ) is a benzimidazole carbamate with a broad anti-parasite spectrum,
while the dinitroanilines trifluralin (TF) and oryzalin (OZ) have recently been found to
exhibit activity against certain parasites. All three compounds are microtubule
antagonists in either nematodes or weeds and have poor aqueous solubility, with the
solubility of ABZ and OZ dependent on pH. Cyclodextrins (CD) have a hydrophobic
cavity that allows them to form inclusion complexes with hydrophobic drugs, resulting
in increased drug aqueous solubility, and often, improved drug dissolution and
bioavailability. Thus the complexation of these drugs with ΗPβCD was investigated.
All three compounds exhibited type AL phase solubility diagrams with ΗPβCD
complexation, with additional increases in ABZ and OZ solubility achieved through the
manipulation of temperature and pH. OZ displayed a stronger interaction with ΗPβCD
when ionised over its neutral form. However, insufficient concentrations of the
TF/ΗPβCD complex were achieved for drug efficacy studies.
The cytotoxicity of the drugs and their complexes was assessed using the assay kit
Cytotox 96 with human carcinoma cells. This is a colourimetric assay that measures
lactate dehydrogenase release as a consequence of compromised cellular and membrane
integrity. Both ABZ and OZ are cytotoxic to rapidly proliferating and differentiating
cells but are not cytotoxic to cells in the stationary phase. Complexation did not affect
drug cytotoxicity. In pharmacokinetic studies, complexation improved ABZ (and
metabolites) bioavailability, but had no significant affect on OZ bioavailability. In vitro
drug assessment studies found ABZ to be highly effective against Giardia, and effective

v
against Cryptosporidium and malaria. OZ on the other hand exhibited no activity
against Giardia, but was effective against Cryptosporidium and malaria. Complexation
did not improve the antiprotozoal efficacy of either ABZ or OZ. In particular, excess
ΗPβCD decreased the antigiardial effects of ABZ, possibly due to competitive complex
formation. In addition, complexation did not improve the antiprotozoal effects of ABZ
in vivo. However, the cytotoxic effect of the ABZ/ΗPβCD complex was more evident
in the treatment of malaria in vivo, resulting in increased anaemia and suppression in
weight gain, due to the improved bioavailability of ABZ and metabolites.
ΗPβCD alone was found to be cytotoxic at greater than 2.5%, and inhibited Giardia
both in vitro and in vivo at greater than 1% and 2% respectively. This was attributed to
membrane disruption caused by the dissolution and removal of membrane components.
In comparison, malaria grew better in the presence of ΗPβCD in vitro, with no
detrimental effect observed at up to 8% ΗPβCD. This was attributed to either the
increased solubilization of a necessary media component, or the complexation and
removal of an inhibitory compound from the cultivation medium.
Therefore ΗPβCD complexation did not improve the antiprotozoal activity of the
tubulin antagonists ABZ and OZ. However, the results of the pharmacokinetic studies
suggest that anthelmintic activity of ABZ, particularly against systemic infections, may
be improved with oral administration of the ABZ/ΗPβCD complex. In addition, the
antiparasitic activity of ΗPβCD alone may be promising, especially against intestinal
infections. Finally, the improved in vitro cultivation of P. chabaudi in the presence of
ΗPβCD presents a promising approach to its potential long term cultivation.

vi
TABLE OF CONTENTS
Declaration ii Acknowledgements iii Abstract iv Table of Contents vi Abbreviations xiii List of Figures xiv List of Tables xviii List of Tables xviii Chapter 1. Literature Review 1
1.1. The need for improved drug delivery systems 2 1.1.1. Formulation design 3
1.1.1.1. Complexation 5 1.2. Cyclodextrins 5
1.2.1. Structure and physiochemical properties 5 1.2.2. Synthesis and degradation 7 1.2.3. Biological effects 9
1.2.3.1. Oral administration 9 1.2.3.2. Parenteral administration 10
1.3. Cyclodextrin complexation 11 1.3.1. Solubilization 11 1.3.2. Stability 13 1.3.3. Complex formation 15
1.4. Cyclodextrin derivatives 16 1.4.1. Characteristics 16 1.4.2. Types of derivatives 18
1.4.2.1. Alkylated cyclodextrin derivatives 19 1.4.2.2. Hydroxyalkylated cyclodextrin derivatives 20 1.4.2.3. Branched cyclodextrin derivatives 21 1.4.2.4. Polymerised cyclodextrin derivatives 22 1.4.2.5. Ionic cyclodextrin derivatives 22
1.5. Hydroxypropyl-β-cyclodextrin 23 1.5.1. Characteristics 23 1.5.2. Manufacture 26 1.5.3. Biological effects 27
1.5.3.1. Oral administration 27 1.5.3.2. Parenteral administration 28
1.6. Formulation of inclusion complexes 30 1.6.1. Determination of stability constants 30
1.6.1.1. Phase solubility analysis 31 1.6.2. Analysis of cyclodextrin complexes 33 1.6.3. Solid inclusion compounds 34 1.6.4. Improving complexation efficiency 35
1.7. Conclusion 37 1.7.1. Safety issues 37 1.7.2. Applications 38
1.8. Rationale and Aim 39

vii
Chapter 2. Complexation of the Tubulin Inhibitors Albendazole, Oryzalin and Trifluralin with ΗPβCD 41
2.1. Introduction 42 2.1.1. Tubulin 42 2.1.2. Benzimidazoles 44
2.1.2.1. Mode of action 46 2.1.2.2. Resistance 47 2.1.2.3. Albendazole 48
2.1.2.3.1. Characteristics 48 2.1.2.3.2. Metabolism 49 2.1.2.3.3. Toxicity 49
2.1.3. Dinitroanilines 51 2.1.3.1. Mode of action 52 2.1.3.2. Resistance 52 2.1.3.3. Trifluralin 53
2.1.3.3.1. Characteristics 53 2.1.3.3.2. Degradation 54 2.1.3.3.3. Toxicity 56
2.1.3.4. Oryzalin 57 2.1.3.4.1. Characteristics 57 2.1.3.4.2. Degradation and toxicity 58
2.1.4. Improving drug efficacy through formulation design 58 2.1.5. Aim 59
2.2. Methods 60 2.2.1. Phase-solubility analysis 60 2.2.2. Albendazole/ΗPβCD complex formulation 60
2.2.2.1. HPLC conditions 60 2.2.2.2. Detection and quantitation limits 61 2.2.2.3. ABZ/ΗPβCD complex formation analysis 62 2.2.2.4. Effect of pH on ABZ solubility 62 2.2.2.5. Effect of pH on ABZ/ΗPβCD complex formation 62
2.2.3. Trifluralin/ΗPβCD complex formulation 63 2.2.3.1. HPLC conditions 63 2.2.3.2. Detection and quantitation limits 63 2.2.3.3. Measurement of TF 65 2.2.3.4. TF/ΗPβCD complex formation 65 2.2.3.5. Effect of pH on TF solubility 65
2.2.4. Oryzalin /ΗPβCD complex formulation 66 2.2.4.1. HPLC conditions 66 2.2.4.2. Detection and quantitation limits 66 2.2.4.3. OZ/ΗPβCD complex formation 66 2.2.4.4. Effect of pH on OZ solubility 66 2.2.4.5. Effect of pH on OZ/ΗPβCD complex formation 68
2.2.5. Verification of complex formation 68 2.2.6. Glassware 69 2.2.7. Statistical analysis 69
2.3. Results 70 2.3.1. Albendazole/ΗPβCD complex formulation 70
2.3.1.1. Effect of ΗPβCD on ABZ solubility 70
viii
2.3.1.2. The effect of pH on ABZ/ΗPβCD complex formation 71 2.3.2. Trifluralin/ΗPβCD complex formulation 76
2.3.2.1. Measurement of TF 76 2.3.2.2. Effect of ΗPβCD on TF solubility 76
2.3.3. Oryzalin/ΗPβCD complex formulation 78 2.3.3.1. Effect of ΗPβCD on OZ solubility 78 2.3.3.2. The effect of pH on OZ/ΗPβCD complex formation 80
2.3.4. DSC-TGA analysis 83 2.3.4.1. ABZ complex formation 83 2.3.4.2. OZ complex formation 83
2.4. Discussion 86 2.4.1. Albendazole 86
2.4.1.1. Phase solubility analysis 86 2.4.1.2. Temperature 87 2.4.1.3. pH 88 2.4.1.4. DSC-TGA 88
2.4.2. Trifluralin 89 2.4.2.1. Phase solubility analysis 89 2.4.2.2. Temperature 90
2.4.3. Oryzalin 91 2.4.3.1. Phase solubility analysis 91 2.4.3.2. Temperature 91 2.4.3.3. pH 92 2.4.3.4. DSC-TGA 93
2.4.4. Conclusion 93 Chapter 3. Pharmacokinetics of the Drug/ΗPβCD Complexes 95
3.1. Introduction 96 3.1.1. Oral formulations 96 3.1.2. Parenteral formulations 100 3.1.3. Aim 101
3.2. Methods 102 3.2.1. Origin and housing of experimental animals 102 3.2.2. Pharmacokinetic experiments 102
3.2.2.1. In vivo albendazole pharmacokinetic study design 102 3.2.2.1.1. Pharmacokinetics of the ABZ/HPβCD complex 102 3.2.2.1.2. Pharmacokinetics of a commercial ABZ formulation 103
3.2.2.2. In vivo oryzalin pharmacokinetic study design 104 3.2.2.2.1. OZ/HPβCD pharmacokinetic experiment 104 3.2.2.2.2. OZ pharmacokinetic experiment 104
3.2.3. HPLC analysis 104 3.2.3.1. HPLC analysis of albendazole 104
3.2.3.1.1. UV spectrum 104 3.2.3.1.2. HPLC conditions 104 3.2.3.1.3. HPLC standards 106 3.2.3.1.4. Sample preparation 107 3.2.3.1.5. Extraction validation 107
3.2.3.2. HPLC analysis of oryzalin 109 3.2.3.2.1. HPLC conditions 109 3.2.3.2.2. HPLC standards 109

ix
3.2.3.2.3. Sample preparation 109 3.2.3.2.4. Extraction validation 110
3.2.4. Statistical analysis 110 3.3. Results 112
3.3.1. Albendazole 112 3.3.1.1. Albendazole chromatography and standard curves 112 3.3.1.2. Albendazole extraction validation 112 3.3.1.3. Albendazole pharmacokinetics 115
3.3.1.3.1. ABZ pharmacokinetics at 6 mg kg-1 115 3.3.1.3.2. ABZ pharmacokinetics at 30 mg kg-1 117
3.3.2. Oryzalin 117 3.3.2.1. Oryzalin chromatography and standard curves 117 3.3.2.2. Oryzalin extraction validation 120 3.3.2.3. Oryzalin pharmacokinetics 121
3.4. Discussion 123 3.4.1. Albendazole 123
3.4.1.1. Pharmacokinetics of ABZ (Valbazen®) at 6 mg kg-1 123 3.4.1.2. Pharmacokinetics of ABZ/ΗPβCD complex at 6 mg kg-1 123 3.4.1.3. Pharmacokinetics of ABZ (Suspension) at 30 mg kg-1 124 3.4.1.4. Pharmacokinetics of ABZ/ΗPβCD complex (pH 2.1) at 30 mg kg-1 124
3.4.2. Oryzalin 126 3.4.2.1. Pharmacokinetics of OZ 126 3.4.2.2. Pharmacokinetics of OZ/ΗPβCD complex 126
3.4.3. Complexation behaviour of inclusion compounds in the gastrointestinal tract 127 3.4.4. Conclusion 128
Chapter 4. Cytotoxicity and In Vivo Consumption of ΗPβCD Complexes 130 4.1. Introduction 131
4.1.1. Cellular interactions of CDs 131 4.1.2. Effect of CD on drug membrane diffusion 133 4.1.3. Aim 134
4.2. Methods 135 4.2.1. Cytotoxicity of drug/ΗPβCD complexes and ΗPβCD 135
4.2.1.1. Preparation of HCT-8 cells 135 4.2.1.2. Administration of drugs 135 4.2.1.3. CytoTox 96 assay procedure 136 4.2.1.4. Calculations 136 4.2.1.5. Statistical analysis 137
4.2.2. ΗPβCD consumption in vivo 137 4.2.2.1. Origin and housing of experimental animals 137 4.2.2.2. ΗPβCD consumption 137
4.3. Results 138 4.3.1. Cytotoxicity of drug/ΗPβCD complexes and ΗPβCD alone 138
4.3.1.1. Cytotoxicity of drug formulations 138 4.3.1.2. Cytotoxicity of ΗPβCD 138
4.3.2. ΗPβCD consumption 139 4.4. Discussion 141
4.4.1. Drug cytotoxicity 141 4.4.1.1. Albendazole 141
x
4.4.1.2. Oryzalin 142 4.4.1.3. Effect of complexation on drug cytotoxicity 143
4.4.2. ΗPβCD cytotoxicity 143 4.4.3. ΗPβCD consumption 144
Chapter 5. Antigiardial Effects of the Drug/ΗPβCD Complexes 145 5.1. Introduction 146
5.1.1. Giardia 146 5.1.1.1. Lifecycle 146 5.1.1.2. Morphology 146 5.1.1.3. Giardia species 149
5.1.2. Giardiasis 149 5.1.2.1. Prevalence and transmission 149 5.1.2.2. Disease and diagnosis 150 5.1.2.3. Treatment and prevention 151
5.1.3. Benzimidazole action against Giardia 152 5.1.4. Aim 153
5.2. Methods 154 5.2.1. Maintenance of G. duodenalis in vivo and in vitro 154
5.2.1.1. Cultivation of G. duodenalis in vitro 154 5.2.1.1.1. Culture medium for G. duodenalis trophozoites 154 5.2.1.1.2. Removal of G. duodenalis trophozoites from cryopreservation 154 5.2.1.1.3. Cultivation of G. duodenalis trophozoites 155 5.2.1.1.4. Cryopreservation of G. duodenalis trophozoites 155
5.2.1.2. Amplification of G. duodenalis in vivo 156 5.2.1.2.1. Origin and housing of experimental animals 156 5.2.1.2.2. Infection and amplification of G. duodenalis in vivo 156 5.2.1.2.3. Cryopreservation of G. duodenalis trophozoites amplified in vivo 156
5.2.2. Efficacy experiments against G. duodenalis in vitro 157 5.2.2.1. Drug efficacy experiments 157 5.2.2.2. Administration of drugs 157 5.2.2.3. Determination of in vitro drug efficacy - counting of trophozoites 158
5.2.3. Efficacy experiments against G. duodenalis in vivo 159 5.2.3.1. Origin and housing of experimental animals 159 5.2.3.2. Efficacy of ABZ and ABZ/ΗPβCD against G. duodenalis in vivo 159 5.2.3.3. ABZ drug regime 160 5.2.3.4. ABZ/ΗPβCD drug regime 160 5.2.3.5. ΗPβCD regime 160
5.2.4. Statistical analysis 161 5.3. Results 162
5.3.1. Efficacy experiments against G. duodenalis (P1c10) in vitro 162 5.3.1.1. Effect of ΗPβCD on G. duodenalis in vitro 162 5.3.1.2. ABZ efficacy against G. duodenalis in vitro 163 5.3.1.3. Dinitroaniline efficacy against G. duodenalis in vitro 165
5.3.2. ABZ efficacy experiments against G. duodenalis (Rat 4) in vivo 165 5.3.2.1. Effect of ΗPβCD on G. duodenalis in vivo 165 5.3.2.2. ABZ efficacy against G. duodenalis in vivo 165
5.4. Discussion 168 5.4.1. Effect of ΗPβCD on G. duodenalis 168

xi
5.4.1.1. In vitro 168 5.4.1.2. In vivo 168
5.4.2. Drug efficacy 169 5.4.2.1. In vitro 169 5.4.2.2. In vivo 171
5.4.3. Conclusion 173 Chapter 6. In Vitro Anticryptosporidial Effects of the Drug/ΗPβCD Complexes 174
6.1. Introduction 175 6.1.1. Cryptosporidium 175
6.1.1.1. Lifecycle 175 6.1.1.2. Cryptosporidium species 175
6.1.2. Human cryptosporidiosis 177 6.1.2.1. Prevalence and transmission 177 6.1.2.2. Disease and diagnosis 178 6.1.2.3. Treatment and prevention 178
6.1.3. Development of in vitro drug assays for C. parvum 179 6.1.4. Aim 181
6.2. Methods 182 6.2.1. Maintenance of C. parvum in vivo and in vitro 182
6.2.1.1. Cultivation of C. parvum in vivo 182 6.2.1.1.1. Origin and housing of experimental animals 182 6.2.1.1.2. Infection and collection of C. parvum oocysts in vivo 182 6.2.1.1.3. Ficoll gradients 183
6.2.1.2. Cultivation of C. parvum in vitro 183 6.2.1.2.1. Culture medium for the cultivation of HCT-8 cells 183 6.2.1.2.2. Removal of HCT-8 cells from cryopreservation 184 6.2.1.2.3. Cultivation of HCT-8 cells 184 6.2.1.2.4. Cryopreservation of HCT-8 cells 184 6.2.1.2.5. Excystation of C. parvum oocysts for in vitro cultivation 185 6.2.1.2.6. Cultivation of C. parvum in vitro 185
6.2.2. Efficacy experiments against C. parvum in vitro 186 6.2.2.1. Drug efficacy experiments 186 6.2.2.2. Administration of drugs 186
6.2.3. Quantification of in vitro parasite growth 187 6.2.3.1. DNA extraction 187 6.2.3.2. PCR 187
6.2.4. Statistical analysis 188 6.3. Results 189
6.3.1. Efficacy of albendazole formulations against C. parvum in vitro 189 6.3.2. Efficacy of oryzalin formulations against C. parvum in vitro 190
6.4. Discussion 192 6.4.1. Albendazole 192 6.4.2. Oryzalin 193 6.4.3. Conclusion 193
Chapter 7. Antimalarial Effects of the Drug/ΗPβCD Complexes 195 7.1. Introduction 196
7.1.1. Plasmodium 196 7.1.1.1. Lifecycle of malaria 196 7.1.1.2. Human Plasmodium 198
7.1.2. Malaria 198

xii
7.1.2.1. Prevalence 198 7.1.2.2. Clinical disease 199 7.1.2.3. Treatment and prevention 200
7.1.3. Preclinical assessment of antimalarials 201 7.1.4. Aim 202
7.2. Methods 203 7.2.1. P. chabaudi 203 7.2.2. In vivo parasite amplification for in vitro and in vivo drug studies 203
7.2.2.1. Origin and housing of experimental animals 203 7.2.2.2. Passage of P. chabaudi through mice 203 7.2.2.3. Infection and harvesting of P. chabaudi from donor rats for drug studies 204 7.2.2.4. Cryopreservation of P. chabaudi 204 7.2.2.5. Determination of parasitaemia and parasite titre 205 7.2.2.6. Anaesthesia and euthanasia 205
7.2.3. In vitro drug studies 206 7.2.3.1. Culture medium for in vitro drug studies 206 7.2.3.2. Preparation of drugs 206 7.2.3.3. In vitro drug efficacy studies 207 7.2.3.4. Determination of in vitro drug efficacy 207
7.2.4. In vivo drug studies 207 7.2.4.1. Mass infection of rats for in vivo drug studies 207 7.2.4.2. Drug formulations 208 7.2.4.3. In vivo drug efficacy studies 208 7.2.4.4. Determination of haematocrit values 209 7.2.4.5. Determination of in vivo drug efficacy 209
7.3. Results 210 7.3.1. Effect of ΗPβCD on P. chabaudi in vitro 210 7.3.2. In vitro drug studies 211
7.3.2.1. In vitro efficacy of CHQ, ABZ and OZ against P. chabaudi 211 7.3.2.2. In vitro efficacy of drug/ΗPβCD complexes against P. chabaudi 211
7.3.3. In vivo drug studies 211 7.4. Discussion 214
7.4.1. Effect of ΗPβCD in vitro 214 7.4.2. In vitro drug studies 216 7.4.3. In vivo drug studies 217 7.4.4. Conclusion 219
Chapter 8. General Discussion 221 8.1. Drug solubility and CD complexation 222 8.2. Albendazole CD complexation 224 8.3. CD complexation of the dinitroanilines 229 8.4. The role of cyclodextrins 231 8.5. Conclusion 233
Chapter 9. References 236 Chapter 10. Appendix 285
10.1. Biochemicals 286

xiii
ABBREVIATIONS
Acetonitrile CH3CN Albendazole ABZ Albendazole sulfoxide ABSO Albendazole sulfone ABSO2 Alsevier’s solution (Section 7.2.2.4) AS Butylaminobenzoate BAB Chloroquine CHQ Cyclodextrin CD Differential scanning calorimetry –Thermogravimetric analysis DSC-TGA 2,6-dimethyl-β-cyclodextrin DMβCD Dimethyl sulphoxide DMSO Distilled water dH2O Foetal calf serum FCS Glucose Citrate Solution (Section 7.2.2.2) GC Guanosine triphosphate GTP High Performance Liquid Chromatography HPLC Hydroxyethyl-cyclodextrin HECD 2-hydroxypropyl-cyclodextrin 2-HPCD 3-hydroxypropyl-cyclodextrin 3-HPCD 2-hydroxypropyl-β-cyclodextrin ΗPβCD Limit of detection (Section 2.2.2.2) LOD Limit of quantitation (Section 2.2.2.2) LOQ Mebendazole MBZ Microsomal flavin monooxygenases MFMO New born calf serum NBCS Oryzalin OZ Phosphate buffered saline (Section 5.2.1.1.4) PBS Randomly methylated-β-cyclodextrin RMβCD Red blood cells RBC Relative standard deviation (Section 3.2.3.1.5) RSD Stability constant (Section 1.6.1) KC Sulfobutyl ether-β-cyclodextrin SBEβCD Tetrahydrofluran THF Thiabendazole TBZ Trifluralin TF 2,3,6-trimethylmethyl-β-cyclodextrin TMβCD World Health Organization WHO
xiv
LIST OF FIGURES
Figure 1.1: Chemical structure of α-CD, β-CD and γ-CD (Szejtli, 1988; Thompson, 1997). 6
Figure 1.2: Functional schematic of β-cyclodextrin (Szejtli, 1988; Thompson, 1997). 6
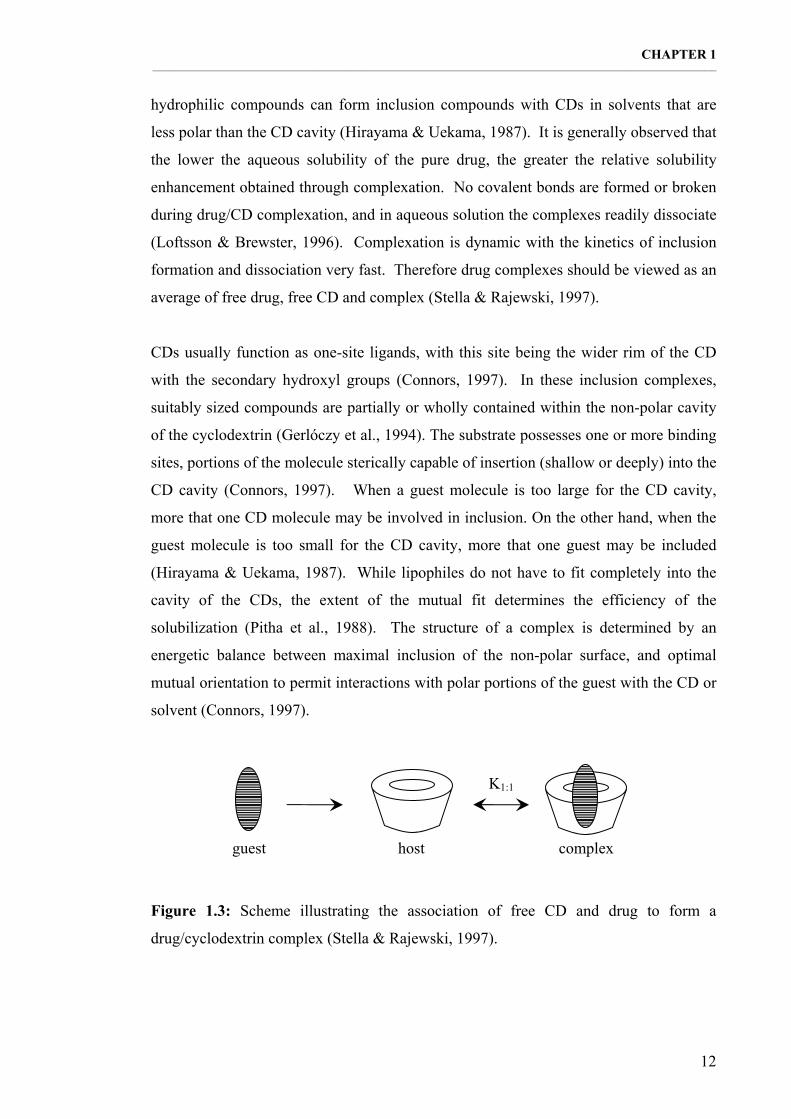
Figure 1.3: Scheme illustrating the association of free CD and drug to form a drug/cyclodextrin complex (Stella & Rajewski, 1997). 12
Figure 1.4: Potential structure of 2-hydroxypropyl-β-cyclodextrin with examples of substituents attached at the 2-, 3- and 6- positions (Pitha, 1990; Brewster, 1992; Thompson, 1997). 24
Figure 1.5: Phase solubility diagrams of Type A systems showing apparent increase in solubility of S caused by component L (Higuchi & Connors, 1965). 33
Figure 1.6: Phase solubility diagrams of Type B systems showing changes in solubility of S caused by component L (Higuchi & Connors, 1965). 33
Figure 2.1: Typical microtubules reach a dynamic equilibrium with tubulin, controlled by endogenous concentrations of co-factors such as GTP, Mg2+, microtubule associated proteins (MAPs), Ca2+ and calmodulin. Text and figure from Lacey, (1990). 43
Figure 2.2: Primary substituent positions of the benzimidazole anthelmintics (Gottschall et al., 1990; Townsend & Wise, 1990). 44
Figure 2.3: Chemical structure of some of the benzimidazole anthelmintics (Townsend & Wise, 1990). 45
Figure 2.4: The main metabolic pathways for ABZ (modified from Gyurik et al., 1981). 50
Figure 2.5: Substitution pattern of the 2,6-dinitroanilines (Probst et al., 1975). 51
Figure 2.6: Structure of trifluralin (Budavari, 1989). 54
Figure 2.7: Three pathways for TF metabolism are nitro reduction, N-dealkylation and hydroxylation (Emmerson & Anderson, 1966; Erkog & Menzer, 1985; Golab et al., 1969; Nelson et al., 1977). 55
Figure 2.8: Structure of OZ (Budavari, 1989). 57
Figure 2.9: UV spectrum of ABZ (10 µg mL-1) in DMSO/methanol (0.5:99.5 v/v). 61
Figure 2.10: Chromatogram of ABZ (10µg mL-1 Att. 7), mobile phase consisted of 40% tetrahydrofuran, 1% formic acid and 59% water (v/v/v). 61
Figure 2.11: UV spectrum of TF (10 µg mL-1) in methanol. 64
Figure 2.12: Chromatogram of TF (4µg mL-1 Att. 4), phase consisted of 65% acetonitrile and 35% water (v/v). 64
Figure 2.13: UV spectrum of OZ (10 µg mL-1) in methanol. 67

xv
Figure 2.14: Chromatogram of OZ (50µg mL-1 Att. 9), mobile phase consisted of 50% acetonitrile and 50% water (v/v). 67
Figure 2.15: Chromatogram of OZ (10µg mL-1 Att. 7), mobile phase consisted of 50% acetonitrile and 50% 100 mM phosphate buffer pH 3 (v/v). 67
Figure 2.16: Solubility of ABZ in the presence of ΗPβCD after 48 h at 25˚C (mean ± SE, n=3). 70
Figure 2.17: Effect of pH (50 mM phosphate buffer) on ABZ solubility after 2 days at room temperature (mean ± SE, n=2). 72
Figure 2.18: Solubility of ABZ with varying pH and ΗPβCD concentrations (50 mM citric acid, n=1). 72
Figure 2.19: Solubility of ABZ with varying pH and ΗPβCD concentrations (50 mM phosphate buffer, n=1). 73
Figure 2.20: Effect of pH (50 mM phosphate buffer) on solubility of ABZ in the presence of ΗPβCD after incubation for 1 w at 35˚C followed by 2 d at room temperature (n=1). 74
Figure 2.21: Effect of ΗPβCD on the solubility of ABZ at different pHs (50 mM phosphate buffer) after incubation for 1 w at 35˚C followed by 2 d at room temperature (n=1). 75
Figure 2.22: Solubility of ABZ in the presence of ΗPβCD at pH 2 (500 mM phosphate buffer) after incubation for 1 w at 35˚C followed by 2 d at room temperature (mean ± SE, n=3). 75
Figure 2.24: Solubility of TF in the presence of ΗPβCD after 48 h at 25˚C (mean ± SE, n=3). 78
Figure 2.25: Solubility of OZ in the presence of ΗPβCD after 48 h at 25˚C (mean ± SE, n=3). 79
Figure 2.26: Effect of pH (50 mM phosphate buffer) on OZ solubility after 2 days at room temperature (mean ± SE, n=2). 81
Figure 2.27: Solubility of OZ with varying pH and ΗPβCD concentrations (either 50 mM or 100 mM phosphate buffer, n=1). 81
Figure 2.28: Effect of pH (50-100 mM phosphate buffer) on solubility of OZ in the presence of ΗPβCD after equilibration for 1 w at 35˚C, 2 d at room temperature (n=1). 82
Figure 2.29: Solubility of OZ in the presence of ΗPβCD at pH 11.2 (500 mM phosphate buffer) after equilibration for 1 w at 35˚C, 2d at 21˚C (mean ± SE, n=1-3). 82
Figure 2.30: DSC-TGA thermograms (5˚C/min) of (a) ABZ, (b) 60% ΗPβCD (w/v) pH 2.1 (200mM phosphate buffer) and (c) ABZ/ΗPβCD pH 2.1 (200mM phosphate buffer). 84
Figure 2.31: DSC-TGA thermograms (5˚C/min) of (a) OZ, (b) 60% ΗPβCD (w/v) pH 11 (200mM phosphate buffer) and (c) OZ/ΗPβCD pH 11 (200mM phosphate buffer). 85

xvi
Figure 3.1: Schematic representation of the dissolution-dissociation-recrystallization process of a CD complex of a poorly water soluble guest. Text and figure from Szejtli, (1991a). 98
Figure 3.2: Theoretical blood level curves obtained after oral administration of a free drug (F) or its CD complexes with different stability constants. Text and figure from Szejtli, (1988). 99
Figure 3.3: UV spectrums of ABZ in 0.5% DMSO in methanol (a); ABSO in 0.5% DMSO in methanol (b); ABSO2 in 0.5% DMSO in methanol (c) and BAB in methanol (d) (10µg mL-1). 100% methanol was used as the blank. 105
Figure 3.4: Extraction procedure for the measurement of ABZ, ABSO, ABSO2 and BAB from plasma samples. 108
Figure 3.5: Extraction procedure for the measurement of OZ from plasma samples. 111
Figure 3.6: Chromatograms of blank rat plasma (Attn. 6) (a); spiked with ABZ (7.7 min), ABSO (3.6 min), ABSO2 (5.2 min) and BAB (8.7 min) (10 µg mL-1) (Attn. 7) (b); and plasma from rat treated orally with ABZ and spiked with BAB (10 µg mL-1) (Attn. 6) (c). 113
Figure 3.7: HPLC standard curves of ABZ, ABSO, ABSO2 and BAB using peak height (mean ± SE, n=3). 114
Figure 3.8: HPLC standard curves of ABZ, ABSO and ABSO2 using height ratio to BAB (10 µg mL-1) following extraction from spiked blank plasma (mean ± SE, n=3-13 – includes RSD values). 115
Figure 3.9: Plasma concentrations of ABSO () and ABSO2 (---) following oral administration of a commercial formulation of ABZ (Valbazen®) and ABZ/HPβCD in rats (6 mg kg-1) (mean ± SE, n=3). 116
Figure 3.10: Plasma concentrations of ABZ, ABSO and ABSO2 following oral administration of ABZ/ΗPβCD (pH 2.1) in rats (30 mg kg-1) (mean ± SE, n=3). 118
Figure 3.11: Plasma concentrations of ABZ, ABSO and ABSO2 following oral administration of ABZ (Suspension) in rats (30 mg kg-1) (mean ± SE, n=3). 118
Figure 3.12: Chromatogram of blank rat plasma (a) spiked with OZ (4.7 min) (2 µg mL-1) (b), and plasma from rat treated i.p. with OZ (c). 119
Figure 3.13: HPLC standard curve of OZ using peak area (r=0.9987) (mean ± SE, n=3). 120
Figure 3.14: HPLC standard curve of OZ following extraction from spiked blank plasma (r=0.987) (mean ± SE, n=3-15 – includes RSD values). 121
Figure 3.15: Plasma concentration of OZ following i.p. administration of OZ and OZ/ΗPβCD in rats (25 mg kg-1) (mean ± SE, n=3). 122
Figure 4.1: Cytotoxicity of ΗPβCD against HCT-8 cells after 24 h incubation (mean ± SE, n=4). 138

xvii
Figure 4.2: Average fluid consumption by five to seven-week-old rats given either water or ΗPβCD solution (mean, n=3). 139
Figure 4.3: Average fluid consumption by three-week-old rats given either water or ΗPβCD solution (mean, n=3). 140
Figure 5.1: Giardia lifecycle (Meyer, 1974). 147
Figure 5.2: Trophozoite and cyst morphology (Meyer, 1985). 147
Figure 5.3: Inhibitory effect of ΗPβCD on Giardia adherence to the culture vessel wall in vitro (mean ± SE, n=3-15). 162
Figure 5.4: In vitro efficacy of three ABZ formulations against Giardia adherence to the culture vessel wall (mean ± SE, n=3-21). 163
Figure 5.5: Effect of ΗPβCD on the efficacy of the ABZ/ΗPβCD complex against Giardia adherence to the culture vessel wall (mean ± SE, n=3-10). 164
Figure 5.6: In vivo inhibitory effect of ΗPβCD on total Giardia number and Giardia trophozoites in the small intestine (mean ± SE, n=3). 166
Figure 5.7: In vivo efficacy of ABZ (Valbazen®) and ABZ/ΗPβCD against trophozoite number in the small intestine of Giardia infected rats (mean ±SE, n=3). 166
Figure 5.8: In vivo efficacy of ABZ (Valbazen®) and ABZ/ΗPβCD against overall Giardia number in Giardia infected rats (mean ±SE, n=3). 167
Figure 6.1: Diagrammatic representation of the proposed lifecycle of C. parvum as it occurs in the mucosal epithelium of an infected mammalian host (Text and figure from Current & Blagburn, 1990, cited in Current & Garcia, 1991). 176
Figure 6.2: In vitro efficacy of ABZ and ABZ/ΗPβCD against C. parvum (mean ± SE, n=4). 189
Figure 7.1: Plasmodium (P. vivax) lifecycle (Fujioka & Aikawa, 1999). 197
Figure 7.2: In vitro effect of ΗPβCD on P. chabaudi parasitaemia over 24 h (mean ± SE, n=4). 210
Figure 7.3: In vitro effect of ABZ/ΗPβCD and OZ/ΗPβCD on P. chabaudi parasitaemia over 24 h (mean ± SE, n=4). The ΗPβCD concentration of the formulations (when greater than 0.5%) is shown in brackets. 212
Figure 7.4: Course of infection in P. chabaudi infected rats, and when treated orally with 18 mg kg-1day-1 CHQ on days 5-7 post-innoculation (mean ± SE, n=8). 212

xviii
LIST OF TABLES
Table 1.1: Characteristics of α-CD, β-CD and γ-CDs (Szejtli, 1988; Connors, 1997). 6
Table 1.2: Some currently available CDs obtained by substitution of the OH groups located in the edge of the CD ring (Loftsson & Brewster, 1996). 19
Table 2.1: The effect of temperature and filtration on ABZ solutions. 71
Table 2.2: One way ANOVA of ABZ solubility, pH and ΗPβCD concentration. 73
Table 3.1: Preparation of standard commercial 'white drench' vehicle used in a number of commercial drenches. 103
Table 3.2: The HPLC detection and quantitation limits for ABZ, ABSO, ABSO2 and BAB following extraction from plasma. 112
Table 3.3: The RSD and Bias of the ABZ assay. 115
Table 3.4: Plasma concentrations of ABSO and ABSO2 after oral administrations of ABZ (Valbazen®) and ABZ/HPβCD (6 mg kg-1) (mean ± SE, n=3). 116
Table 3.5: Plasma concentrations of ABSO and ABSO2 after oral administrations of ABZ (suspension) and ABZ/HPβCD (30 mg kg-1) (mean ± SE, n=3). 117
Table 3.6: The RSD and Bias of the OZ assay. 121
Table 3.7: Plasma concentrations of OZ after oral administrations of OZ and OZ/ΗPβCD (25 mg kg-1) (mean ± SE, n=3). 122
Table 5.1: BI-S-33 medium preparation for the cultivation of G. duodenalis in vitro. 154
Table 5.2: Scoring Method for the Assessment of Trophozoite Viability. 158
Table 5.3: The IC50, MIC and MLC of three ABZ formulations against G. duodenalis in vitro. 164
Table 6.1: Medium preparation for the cultivation of HCT-8 cells. 184
Table 6.2: Medium preparation for the cultivation of C. parvum in vitro. 185
Table 6.3: The IC50, MIC and MLC of two ABZ formulations against C. parvum in vitro. 190
Table 6.4: The IC50, MIC and MLC of two OZ formulations against C. parvum in vitro. 190
Table 7.1: Medium used in drug experiments against P. chabaudi in vitro. 206
Table 7.2: Drug IC50s against P. chabaudi in vitro. 211
Table 7.3: Therapeutic effects of oral ABZ and ABZ/ΗPβCD treatment in P. chabaudi infected rats. 213
Table 7.4: Drug IC50s against P. falciparum, P. berghei and P. chabaudi in vitro. 217

CHAPTER 1 __________________________________________________________________________________________________________
1
CHAPTER 1. LITERATURE REVIEW

CHAPTER 1 __________________________________________________________________________________________________________
2
1.1. THE NEED FOR IMPROVED DRUG DELIVERY SYSTEMS
Parasitic diseases account for millions of deaths each year and impose a significant
burden on Third World countries by reducing the productive potential of its people and
animals (Gero et al., 1991; Smith, 2001). In addition, the mobility of human populations
has resulted in many of these parasites being imported into developed countries (Gero et
al., 1991; World Health Organization (WHO), 1997). Half of humanity is exposed to
the risk of parasitic infections, with the most significant being Ascaris, malaria,
Schistosoma, Filaria, hookworm, Trichuris, Amoeba, Trypanosoma, Leishmania and
Strongyloides (Smith, 2001; Gero et al., 1991). The helminths alone infect more than
one quarter of the world’s population (de Silva et al., 1997). The three groups of
helminths that parasitise humanity are the nematodes (roundworms), trematodes (flukes)
and cestodes (tapeworms), with the most common being Ascaris, Trichuris, hookworm,
filariasis, Onchocerca and Schistosoma. Virtually all of the important helminth
infections can be treated by one of five anthelmintics currently in use, ABZ, MBZ,
diethylcarbamazine, ivermectin and praziquantel (de Silva et al., 1997). However the
control of parasitic diseases has not been as successful as hoped, largely due to the
increased numbers of individuals who are immunocompromised (Gero et al., 1991).
Traditionally important parasitic diseases like malaria and schistosomiasis are at least as
significant in many places as they were in the past, and many rare parasitic infections
such as Pneumocystis, Toxoplasma, Cryptosporidium, Isospora and Sarcocystis are now
more commonly encountered. More information concerning the prevalence and
treatment of the parasites Giardia, Cryptosporidium, and Plasmodium can be found in
chapters 5, 6 and 7 respectively.
Resistance to antiparasitic drugs is also a serious setback in attempts to control many
parasitic diseases. Parasitic resistance is a global problem, both in humans and in many
animal industries, with resistant pathogens emerging and spreading more rapidly than in
previous decades (Gero et al., 1991; Sangster & Gill, 1999). In particular, drug
resistance in malaria has become a major problem, with drug resistance to newly
developed drugs increasing, along with the problem of providing adequate protection to
non-immune travellers (see review in chapter 7) (Gero et al., 1991). The development
of parasite drug resistance, especially in the animal industries, has been exacerbated by
CHAPTER 1 __________________________________________________________________________________________________________
3
treatment techniques such as mass treatments, frequent use of antiparasitic drugs, use of
the same class of drugs over long periods of time, and underdosing. These specifically
have resulted in widespread anthelmintic resistance of nematodes in various sheep
populations across the world (Waller, 1990; Geerts et al., 1997; Hennessy, 1997).
Alternative treatment strategies include vaccines, biological control, and, in the animal
industry, breeding of parasite resistant animals (Hennessy, 1997). However, these are
unlikely to be widely available in the near future, and even then they will be integrated
with chemotherapy (Hennessy, 1997).
The treatment of resistant parasites is increasingly hampered by either the lack of
effective antiparasitic agents, or the significant cost of drug research to develop new
drugs (Hennessy, 1997; WHO, 1997). To compound the problem, there appears to be
no new chemical classes of antiparasitic agents on the horizon (Hennessy, 1997;
Williams, 1997). Therefore existing actives must be preserved and utilized
appropriately if parasite control is to be maintained. Currently, drug development often
results in the simplest formulation being developed, with little thought to maximising
drug bioavailability at the host-parasite interface (Hennessy, 1997). Thus a promising
approach to maintaining drug efficacy is the development of modified formulations
and/or delivery systems using chemical or physical drug carriers. Such systems not
only increase the efficacy of older compounds, but are also instrumental in prolonging
the useful life of newer drugs (Hennessy, 1997). In addition, research on new
formulations of current drugs is less expensive than developing new drugs, and can
result in preparations that are more stable, thus improving drug bioavailability and
increasing their antiparasitic effect.
Chapter one reviews CDs and the formulation of inclusion complexes. Please go to the
individual chapters for reviews on specific parasites.
1.1.1. Formulation design
Almost all orally active drugs are marketed as tablets, capsules or both. Initially
however, in order to guarantee precise drug and dose disposition, they are formulated as
injections for toxicity, metabolic, bioavailability and clinical studies (Wells & Aulton,

CHAPTER 1 __________________________________________________________________________________________________________
4
1988). A common problem experienced in the early development of drug formulations,
especially those intended for parenteral administration, is the solubilization of a slightly
soluble, or water insoluble active ingredient (Sweetana & Akers, 1996). The inability to
generate water-soluble or stable parenteral formulations has limited the application and
development of many drug substances. This is particularly apparent in intravenous
dosage forms as successful systems must be non-toxic and stable (Brewster, 1992).
Drugs are almost always administered in some kind of formulation. While some are
formulated in simple aqueous solutions, more often, however, formulations are complex
mixtures containing the drug compound, or a derivative of the drug compound, together
with excipients, diluents, stabilisers, or preservatives (Jonkman-de Vries et al., 1996).
The development of a drug delivery system is dependent upon the physicochemical and
biological properties of the drug, intended dose, and patient/disease factors (Jonkman-de
Vries et al., 1996). The most important properties of the drug to be considered are the
aqueous solubility, stability, disassociation constant (pKa), and the rate of dissolution
(Wells & Aulton, 1988; Jonkman-de Vries et al., 1996; Sweetana & Akers, 1996).
Usually the first approach used to increase the solubility of an insoluble drug in water is
to form water soluble salts. If salt formation is not possible due to drug instability or
insufficient aqueous solubility, a series of formulation approaches may be investigated.
These include pH adjustment, the formation of prodrugs, lyophilised formulations,
surfactant systems, cosolvent systems, complex formation and colloidal systems (such
as liposomes, microencapsulation systems, emulsions or lipoproteins). These techniques
have been used to modify drug absorption or metabolism, and to specifically direct large
quantities of drug, over an extended or pre-determined period, to the target sites
(Jonkman-de Vries et al., 1996; Sweetana & Akers, 1996; Hennessy, 1997).
The safety of the formulation is also very important. Since any component of the
formulation may contribute to or modify the toxicity, it is important to keep the
formulation as simple as possible (Jonkman-de Vries et al., 1996). The safety of a drug
carrier system must be evaluated from two standpoints: the toxicity of the carrier itself,
and the risk of the novel, drug induced toxicities arising from differences in disposition,
pharmacokinetics, and metabolism of carrier associated drug as compared with
conventional drug formulations (Jonkman-de Vries et al., 1996).

CHAPTER 1 __________________________________________________________________________________________________________
5
1.1.1.1. Complexation
Complexation of water insoluble drugs generally involves the incorporation of the drug
within an inner core of complexing agent/s, so that the outer hydrophilic groups of the
complexing agent interact with the water, rendering the complex soluble (Jonkman-de
Vries et al., 1996; Sweetana & Akers, 1996). Complexation is a reversible association
of a substrate molecule with molecules of a ligand to form a new species, and is carried
out to alter the physicochemical properties of a drug so that the solubility and stability
of the complex is higher than the parent compound (Jonkman-de Vries et al., 1996).
However, caution should be taken to ensure that the change in physicochemical
characteristics does not alter drug activity or mechanism of action. Selection of a
complexing agent is dependent on the structure of the drug, as the complexing agent
must be able to interact with the drug in a structurally specific manner (Yalkowsky,
1999). Examples of complexing agents would be CDs and hydrotropic compounds such
as salicylates, sodium salts, several benzoic acids, and fatty acids. In particular, interest
in drug/CD complexes is increasing, with the aim of designing newer and more
effective drug delivery systems (Szejtli, 1991a).
1.2. CYCLODEXTRINS
1.2.1. Structure and physiochemical properties
Cyclodextrins (CD) are cyclic oligosaccharides of α-D-glucose joined through 1-4
bonds. The three major natural CDs are α-CD, β-CD and γ-CD, which are built up
from 6, 7 and 8 glucopyranose units respectively (Figure 1.1). CDs with less than 6
glucopyranose units cannot be formed for steric reasons (too strained to exist), while
those with greater than 8 are difficult to isolate in crystalline form due to their high
solubility resulting from higher flexibility. They are also thought to have low
complexing ability and therefore of little practical value (Szejtli, 1988; Connors, 1997).
The general physiochemical properties of the CDs (Table 1.1) can be obtained from the
numerous review articles and books, such as Szejtli, (1988) and Connors, (1997).

CHAPTER 1 __________________________________________________________________________________________________________
6
Figure 1.1: Chemical structure of α-CD, β-CD and γ-CD. Arrows indicate the 2-, 3- (secondary) and 6- (primary) hydroxyls of a glucopyranose unit (Szejtli, 1988; Thompson, 1997).
Table 1.1: Characteristics of α-CD, β-CD and γ-CDs (Szejtli, 1988; Connors, 1997).
Property α β γ No. of glucose 6 7 8 Empirical formula C36H60O30 C42H70O35 C48H80O40 Molecular weight 972.85 1134.99 1297.14 Aqueous solubility % (M) 14.5 (0.1211) 1.85 (0.0163) 23.2 (0.168) Melting point °C 275 280 275 Cavity diameter Å 4.7-5.3 6-6.5 7.5-8.3 Height of torus Å 7.9±0.1 7.9±0.1 7.9±0.1 Periphery diameter Å 14.6±0.4 15.4±0.4 17.5±0.4 Approx. cavity vol. per g CD (mL) 0.1 0.14 0.2
Figure 1.2: Functional schematic of β-cyclodextrin. The secondary hydroxyls at the 2- and 3- positions exist on the secondary face of the structure, and the primary hydroxyls at the 6- position exist on the primary face (Szejtli, 1988; Thompson, 1997).
Apolar cavity
15.4 Å
6 Å
7.6 Å
Edge of secondary hydroxyls
Edge of primary hydroxyls
OO OH
CH 2 OH
HO O
O
HO
CH2OHHO
O
O
HO
CH2OHHO
O O
HO CH2OH
HO
O O OH CH 2 OH OH
O
O OH
CH2OH OH
O
O
OH CH2OH
OH
O O OH CH 2 OH
OH O
O
HO
CH2OHHO
O
O
HO
CH2OH
HO
O
OOH
CH2OH
OH
O
O
O
OH
CH2OHOH
O
O
O
OH
CH2OH
OH
OH
O
O
OH
CH2OH
HO
CH2OH
OH
O O
OH
CH 2 OH
HO
O
O
HO
CH 2 OH HO
O
O
HO CH 2 OH
HO
O O
OH
CH 2 OH
OH
O
O
OH
CH 2 OH OH
O
O
OH CH 2 OH
OH
α-cyclodextrin β-cyclodextrin γ-cyclodextrin
3
2
6

CHAPTER 1 __________________________________________________________________________________________________________
7
CDs are not perfectly cylindrical, but are instead shaped like a truncated cone. All
secondary hydroxyls line one end of ring, while the primary hydroxyls line the other
end of ring (Figure 1.2 (above)). The free rotation of the primary hydroxyls at one end
of the molecule reduces its effective diameter (Szejtli, 1988). The interior of the cavity
is free of hydrogen bonding groups, and lined with non-polar methylene groups and
non-polar ether oxygens (Yalkowsky, 1999). In addition, the C2-OH of one
glucopyranose unit can form a hydrogen bond with the C3-OH of its adjacent
glucopyranose unit, resulting in the formation of a secondary belt, making it a rigid
structure (Szejtli, 1988). This secondary hydrogen belt is incomplete in α-CD as one of
the glucopyranose units is distorted. With the CD exterior relatively hydrophilic, and
the interior lipophilic, CDs resemble micelles. However, unlike micelles, whose size is
fluid and can therefore adjust to a wide variety of sizes and shapes, the CD interior is
fixed in size and shape (Yalkowsky, 1999).
The natural CDs, particularly β-CD, have limited aqueous solubility. The lower
solubility of β-CD is attributed to the stable formation of the secondary hydrogen belt
and its ability to form a more stable lattice, which limits its interaction with water
(Szejtli, 1988; Connors, 1997). This secondary hydrogen belt is incomplete in the other
natural CDs, and so allows more favorable interactions between the CD and water
molecules. In addition, γ-CD has a more flexible structure and therefore the most
soluble of the three. The aqueous solubility of the CDs increases with temperature,
approximately doubling with every 20°C increase in temperature (Duchêne et al., 1987;
Yalkowsky, 1999). CD’s are susceptible to acid hydrolysis, particularly at high
temperatures. However, the intact ring is more stable than acyclic dextrins, as splitting
of the first glucosidic bond is slower than the hydrolysis of a terminal glucose unit,
which CD does not have (Szejtli, 1982). The low aqueous solubility of the naturally
occurring CDs as a class causes them to crystallize and produce toxic effects when they
become concentrated in the kidney (Section 1.2.3) (Yalkowsky, 1999).
1.2.2. Synthesis and degradation
Cyclodextrin glycosyltransferase (CGT: EC 2.4.1.19) is produced by various
microorganisms and is responsible for the degradation of starch to CD (Szejtli, 1988).

CHAPTER 1 __________________________________________________________________________________________________________
8
While CD can be produced synthetically, CD can only be produced on an industrial
scale by the enzymatic conversion of starch utilizing the CGT enzyme. Therefore
extensive studies have been carried out on CGT enzyme kinetics. More specific and
detailed information on enzyme properties, sources of enzyme, enzyme activity etc. may
be obtained from Szejtli, (1988) and Horikoshi, (1999). Generally the CGT enzyme
produces all three CDs, with their ratios dependent of the conversion time and the
applied enzyme. Most CGT’s produce α-CD first, with the rate of larger CD formation
much slower. However, as β-CD production is rarely reversed, it accumulates at the
expense of α-CD due to secondary transfer reactions. Therefore only the incubation
time determines which CD is obtained as the main product. Improved production has
been achieved through the use of debranching enzymes, as 1,6-bonds of the amylopectin
branches block CGT action, and immobilized CGT, therefore allowing the same
enzyme to be used for several conversion cycles. Isolation of the desired CD is
accomplished through either insoluble specific complex formation or dialysis. However
the use of complexants has to be carefully controlled to ensure residual content is at
acceptable levels.
The preparation of CDs involves:
- Cultivation of a microorganism which produces CGT
- Separation, concentration and purification of CGT
- Enzymatic conversion of starch to a mixture of cyclic and acyclic dextrins and
- Separation, purification and crystallization of the desired CD (Szejtli, 1988).
Cyclomaltodextrinase (EC 3.2.1.54) is an enzyme that hydrolyses cyclic dextrins and
linear maltodextrins, but has little or no activity for polysaccharides such as starch and
glycogen. It is produced by a number of microbes, including some of those found
among the human colon microflora (Antenucci & Palmer, 1984). Other enzymes are
also capable of degrading CDs, but at a slower rate (Section 1.2.3.1). For a review, see
Saha & Zeikus, (1992).

CHAPTER 1 __________________________________________________________________________________________________________
9
1.2.3. Biological effects
1.2.3.1. Oral administration
α-CD and β-CD are very resistant to enzymatic digestion by the usual starch
hydrolyzing enzymes (Szejtli, 1988). They are completely resistant to β-amylases as
they do not contain end groups susceptible to the attack of this enzyme. α-amylases
however do not require end groups and are therefore capable of hydrolyzing CDs,
although at a slow rate. γ-CD on the other hand can be digested in the upper
gastrointestinal tract by pancreatic enzymes (Antlsperger & Schmid, 1996).
Insignificant amounts of orally administered CD are absorbed intact through the
gastrointestinal tract. Approximately 2% α-CD and <1−10% β-CD are absorbed intact
in the upper intestine by passive transport (Szabó et al., 1981; Frijlink et al., 1990;
Antlsperger & Schmid, 1996). α-CD absorption is thought to occur via the paracellular
pathway (Irie et al., 1988), while γ-CD absorption is negligible due to its digestion
(Antlsperger & Schmid, 1996). The majority of orally administered α-CD and β-CD
is metabolized in the large intestine by the colon microflora (Szabó et al., 1981;
Antenucci & Palmer, 1984). The primary metabolites (glucose and malto-
oligosaccharides) are then metabolized and absorbed in the same way as starch. The
fundamental difference between the metabolism of starch and CD is that starch is
metabolized in the small intestine while CD is metabolized in the colon, with
corresponding maxima observed around 1-2 hours, and 6-8 hours after consumption
respectively. Not all the β-CD is digested, with some also excreted in the faeces
(Gerlóczy et al., 1985). Ingestion of CDs by humans therefore leads to similar
nutritional or physiological effects to starch, at least at low CD concentrations (Szejtli,
1988; Shizuka et al., 1996).
Oral administration of the natural CDs does not result in acute toxicity. Defined oral
LD50 values have been difficult to determine, as high doses do not result in mortality.
The LD50 in rats was determined to be greater than 12.5, 18.8 and 8 g kg-1 for α-CD, β-
CD, and γ-CD respectively (Szejtli & Sebestyén, 1979; Szejtli, 1987; 1988). Poor
digestion of both α-CD and β-CD however, have been attributed to retarded body

CHAPTER 1 __________________________________________________________________________________________________________
10
weight gain, caecal enlargement and reduced body fat disposition when animals have
been administered high doses over extended time frames (Szejtli, 1988).
CDs are capable of complexing with a wide range of compounds (Section 1.3). Orally
administered CDs can therefore potentially complex with a wide range of endogenous
compounds in the gut, influencing their distribution from the gastrointestinal tract
(Pitha, 1990). This may result in secondary systemic effects where increased
gastrointestinal elimination of certain nutrients, steroids and bile salts occurs, or in the
solubilization and increased absorption of toxic contaminants of the ingested food
(Gerlóczy et al., 1994; Pitha, 1994). However, orally administered CD is considered
non-toxic if the daily dose does not exceed 600 mg kg-1 or 1800 mg kg-1 of the diet in
rats and dogs respectively (Bellringer et al., 1995).
1.2.3.2. Parenteral administration
Parenterally administered α-CD and β-CD are not metabolized, but are concentrated in
the kidneys. As these CDs (particularly β-CD) have low solubility and are generally
administered in high doses, they precipitate, resulting in severe nephrotoxicity (Frank et
al., 1976; Gerlóczy et al., 1985). During elimination, CD is taken up in the renal tubules
where they are concentrated in the vacuoles. Initially the number of apical vacuoles
increases and lysosomes become prominent. The lysosomes enlarge and the peripheral
membrane becomes distorted due to confinement of large embedded microcrystals,
which are characteristic of CD nephrosis. This is followed by the appearance of giant
vacuoles and the degeneration of cell organelles, particularly the mitochondria (Frank et
al., 1976; Serfözö et al., 1981). These observations are comparable to injections of
glucose, sucrose, dextran and mannitol, which cause some vacuolative change and
lysosomal increase, but do not result in sustained injury as they are easily hydrolysed.
Therefore CD nephrosis represents an exaggerated form of osmotic nephrosis resulting
in irreversible injury (Frank et al., 1976; Yamamoto et al., 1990).
The intravenous LD50 for α-CD and β-CD is 1008 mg kg-1 and 788 mg kg-1 respectively
(Frank et al., 1976). Similar results have been obtained for subcutaneous,
intraperitoneal and intramuscular treatments (Brewster, 1992). Therefore parenteral

CHAPTER 1 __________________________________________________________________________________________________________
11
applications of α-CD and β-CD are limited to rather low doses (Gerlóczy et al., 1985;
Szejtli, 1988). Of the natural CDs, γ-CD is the most appropriate for use as an injectable
drug carrier due to its higher water solubility and its rapid enzymatic degradation. In
addition, the natural CDs exhibit no mutagenicity or teratogenicity, and are not
carcinogenic, although β-CD may enhance the occurrence of renal tumors in animals
treated with carcinogens (Szejtli, 1988).
Parenterally administered CDs also cause haemolysis of erythrocytes. At low
concentrations (<1mM for β-CD, 5mM for α-CD and 10mM for γ-CD), CDs protect
erythrocytes from osmotic and heat induced haemolysis. These protective effects have
been attributed to membrane expansion and fluidization of membrane components,
therefore altering the mechanical properties of the membrane lipids (Uekama et al.,
1981; Irie et al., 1982). However, at higher concentrations (3mM for β-CD, 6mM for
α-CD and 16mM for γ-CD) they sequester membrane components such as cholesterol,
phospholipids and proteins from cell membranes, resulting in haemolysis (Irie et al.,
1982; Fridrich et al., 1990). The amount and type of extracted component varies with
the CD, and is dependent on the cavity size of the CD (Irie et al., 1982). Therefore CD-
induced haemolysis is a secondary event, resulting from the interaction between CD and
membrane components. A more detailed review of the oral and parenteral toxicity of the
CDs, their complexation of endogenous compounds, and their cytotoxicity can be found
in Szejtli, (1988) and Thompson, (1997).
1.3. CYCLODEXTRIN COMPLEXATION
1.3.1. Solubilization
Due to the hydroxy groups the CD exterior is relatively hydrophilic, while in
comparison the interior is lipophilic. Connors, (1997) determined the interior to have an
effective polarity comparable to ethanol and dioxane (semi-polar). Therefore CDs can
solubilize compounds into aqueous solutions through the formation of inclusion
complexes (Gerlóczy et al., 1994; Stella & Rajewski, 1997) (Figure 1.3). Hydrophobic
compounds have higher affinity for the cavity in aqueous solution, as it provides a
microheterogenous hydrophobic matrix in such polar solvents. On the other hand,
CHAPTER 1 __________________________________________________________________________________________________________
12
hydrophilic compounds can form inclusion compounds with CDs in solvents that are
less polar than the CD cavity (Hirayama & Uekama, 1987). It is generally observed that
the lower the aqueous solubility of the pure drug, the greater the relative solubility
enhancement obtained through complexation. No covalent bonds are formed or broken
during drug/CD complexation, and in aqueous solution the complexes readily dissociate
(Loftsson & Brewster, 1996). Complexation is dynamic with the kinetics of inclusion
formation and dissociation very fast. Therefore drug complexes should be viewed as an
average of free drug, free CD and complex (Stella & Rajewski, 1997).
CDs usually function as one-site ligands, with this site being the wider rim of the CD
with the secondary hydroxyl groups (Connors, 1997). In these inclusion complexes,
suitably sized compounds are partially or wholly contained within the non-polar cavity
of the cyclodextrin (Gerlóczy et al., 1994). The substrate possesses one or more binding
sites, portions of the molecule sterically capable of insertion (shallow or deeply) into the
CD cavity (Connors, 1997). When a guest molecule is too large for the CD cavity,
more that one CD molecule may be involved in inclusion. On the other hand, when the
guest molecule is too small for the CD cavity, more that one guest may be included
(Hirayama & Uekama, 1987). While lipophiles do not have to fit completely into the
cavity of the CDs, the extent of the mutual fit determines the efficiency of the
solubilization (Pitha et al., 1988). The structure of a complex is determined by an
energetic balance between maximal inclusion of the non-polar surface, and optimal
mutual orientation to permit interactions with polar portions of the guest with the CD or
solvent (Connors, 1997).
Figure 1.3: Scheme illustrating the association of free CD and drug to form a
drug/cyclodextrin complex (Stella & Rajewski, 1997).
host complex guest
K1:1

CHAPTER 1 __________________________________________________________________________________________________________
13
Within the motional limitations of the CD, there is still significant conformational
mobility. This lends itself to the accommodation of a wide variety of guests, provided
they are of a size compatible with the CD cavity. Of the three natural CDs, β-CD has a
cavity size that is most appropriate for a wide range of drugs, in that it is able to
accommodate aromatic groups (Szejtli, 1988). Some functional groups that are
included by β-CD are aromatic rings, alkyl groups and trifluoromethyl groups (Jones &
Grant, 1984). α-CD can only be used for small molecules or for the complexation of
slim side chains, while γ-CD fits larger molecules (Szejtli, 1991a). While γ-CD interacts
with many drugs, the current high cost of manufacture has made its extensive use
unfavorable.
Large drug molecules like peptides and proteins can also form CD complexes, as they
contain hydrophobic aromatic moieties that can complex with CD. The CDs attach to
the amino acids exposed on the surface of the protein, creating a hydrate shell around
the molecule. CDs therefore modify protein hydration allowing it to deaggregate,
solubilize, stabilize or even denature the dissolved protein molecule. This results from
either the disruption of certain hydrogen bonds and thus stabilizes the tertiary structure,
or prevents the disorganization of structure-stabilizing hydrogen bonds by immobilizing
certain moieties. The latter can be seen as an increase in the denaturation temperature.
Therefore CDs can reduce the loss of enzyme activity through improved formulation
and storage, and solubilize proteins that usually undergo aggregation or precipitate in
aqueous solution (Szejtli, 1991b; Loftsson & Brewster, 1996). Therefore complexation
often results in both enhanced chemical and physical stability of this type of drug.
1.3.2. Stability
CD complexation can be regarded as molecular encapsulation. In forming inclusion
complexes, the physical and chemical properties of both the guest and cyclodextrin can
be altered (Duchêne et al., 1987; Szejtli, 1991a; Loftsson & Brewster, 1996). For
example, drug/CD complexation has been used extensively to improve the aqueous
solubility and dissolution rate of numerous drugs. However, inclusion of the chemically
reactive centre of a drug molecule within the CD cavity will also stabilize the drug
considerably (Jones & Grant, 1984). Therefore, complexation can be used to increase
CHAPTER 1 __________________________________________________________________________________________________________
14
the boiling point, evaporation temperature and melting point of a compound, or to
increase the stability of drugs that would otherwise be sensitive to temperature,
hydrolysis, autoxidation, photodegradation and other autocatalytic reactions (Duchêne
et al., 1987; Szejtli, 1991a). In addition, complexation can decrease volatility, steric
arrangement, isomerisation, polymerization and even the enzymatic decomposition of a
compound (Jones et al., 1984; Szejtli, 1991a).
Formulation of compounds with CDs may also result in technological advantages (Jones
et al., 1984; Szejtli, 1991a). For example, complexation may be used to convert a liquid
material into a solid product, to mask an unpleasant taste or odor of a compound, or to
change the colour of a compound (as inclusion usually involves a change in spectrum of
the molecule). In addition, drug formulations may be improved by easier
emulsification, avoiding incompatibilities of uncomplexed compound with other drugs
or excipients in the formulation, and specific reactions (such as catalysis) can be made
more selective by the inclusion of specific functional groups (Duchêne et al., 1987;
Szejtli, 1991a). Alternatively, formulation of low dose drugs in CD complexes often
allows improved uniformity in tablets (Jones et al., 1984). These changes are often
translated into biological advantages, such as the enhanced in vivo absorption, and
hence bioavailability, of drugs by a number of administration routes, and reduced
haemolysis, irritancy and toxicity of the drugs (Szejtli, 1991a; Stella & Rajewski, 1997).
However favorable results are not always obtained. For example, drug/CD
complexation may have no effect, or even accelerate drug degradation (Duchêne &
Wouessidjewe, 1990b). If increased drug stability is observed with the inclusion of the
chemically reactive centre of a drug molecule in the CD cavity, the size of the cavity
and the chemically reactive group must be compatible. Therefore if the CD cavity was
not sufficiently large to protect the reactive group, unchanged degradation rates or even
accelerated drug degradation may be observed. The stabilization and sensitization of
certain compounds by certain types of CD is to some extent predictable when the size of
the reactive group is known (Jones & Grant, 1984). Other factors may also affect
stabilization/destabilization, such as the stoichiometric ratio of drug to CD, the
formation of solid drug complexes, and interactions of the CD with the degradation
product (Jones & Grant, 1984; Duchêne et al., 1987; Loftsson & Brewster, 1996).
CHAPTER 1 __________________________________________________________________________________________________________
15
1.3.3. Complex formation
Several types of interactions between guest molecules and cyclodextrin may account for
CD complex formation. These include hydrophobic interaction, van der Waals
interaction, hydrogen bonding, dipole-dipole and/or electric charge interaction
(Connors, 1997). Hydrophobic interaction is probably the most important in many CD
complexations. However, as it does not follow classical hydrophobic interaction
theories, it is often rejected. It has therefore been proposed that a non-classical
hydrophobic interaction, a composite of the hydrophobic interaction and van der Waals
effects, between semi-polar molecules occurs (Loftsson & Brewster, 1996; Connors,
1997). Overall however, hydrophobic interaction is supported by the repeated
observation that the most non-polar portion of guest molecule is enclosed in the CD
cavity. In addition, significant complex stability has been observed in systems where
classic hydrophobic interactions are unlikely (with very polar substrates) and indicates
that other factors contribute to complex stability (Connors, 1997). Therefore
combinations of electrostatic interactions (dipole-dipole and hydrogen bonding),
induction and dispersion forces with hydrophobic interactions can add to complex
stability, depending on the nature of the enclosed guest (Szejtli, 1988; Connors, 1997).
For molecules that are too large to be included in the CD cavity, hydrogen bonding is
probably the main interaction on complexation and solubilization (Jones & Grant,
1984). Conformational strain relief, or the release of high-energy water from the CD
cavity have also been proposed as types of interactions between guest molecules and
cyclodextrin to account for CD complex formation, although they are not strongly
supported by experimental evidence. Connors, (1997) found no support for the theory of
conformational strain relief (induced fit) within the CD ring upon complexation, and did
not consider release of high-energy water from the CD cavity, as a major driving force,
as it neglects the energetics of the entire system, which is overall a destabilizing one.

CHAPTER 1 __________________________________________________________________________________________________________
16
1.4. CYCLODEXTRIN DERIVATIVES
1.4.1. Characteristics
Originally the production of derivatives was undertaken in an attempt to improve the
safety of the natural CDs, especially β-CD, and to increase their aqueous solubility
(Müller & Brauns, 1985; Szente & Strattan, 1992). β-CD is of appropriate size and
shape to interact efficiently with numerous drug substances, but is soluble to only
1.85% w/v in water. While complexes can be generated in an efficient manner with β-
CD, the absolute amount of the drug that can be solubilized is low (Brewster, 1992).
Since the low aqueous solubility of the natural CDs is predominately due to
intramolecular bonding, derivatization techniques that disrupt this process have been
used. CDs can be modified by substitution of the H-atom on any of the primary or
secondary hydroxyls (to produce esters, ethers, glycosyl-CDs), or substitution of the
primary or secondary hydroxyls (to produce deoxy-, halogeno- amino etc CD
derivatives). Alternatively, modification may be carried out by elimination of the H-
atom on the C5-CH2OH to produce C5-COOH, or splitting of the C2-C3 bonds (Szejtli,
1988).
The random replacement of hydroxy groups is technically more feasible, with
substitution of any of the hydroxyl groups, even by hydrophobic moieties, resulting in a
dramatic increase in water solubility (Müller & Brauns, 1985; Szejtli, 1991a). This
improvement results from the disruption of the secondary belt of hydrogen bonds
formed between the secondary C2-OH and C3-OH of adjacent glucopyranose units
(Szente & Strattan, 1992). In addition, chemical manipulation frequently transforms the
crystalline CD into amorphous mixtures of isomeric derivatives (Loftsson & Brewster,
1996). The total solubility of a modified CD is the sum of the independent solubilities
of its components. For example, there are many thousand possible hydroxypropyl
derivatives of β-CD (three different positions on seven rings containing between 1 and
21 hydroxypropyl groups). If each of these had identical solubility, and if the
solubilities were independent of one another, the total solubility of a methylated-ß-
cyclodextrin derivative would be hundreds of times that of any single, pure isomer.
However this difference is not often observed, as certain substitution patterns are not

CHAPTER 1 __________________________________________________________________________________________________________
17
likely to occur (Yalkowsky, 1999). It is this tremendous diversity of molecular entities
that accounts for the lack of crystallinity of chemically modified CDs, and provides a
virtually infinite selection of interactive opportunities for molecular encapsulation
(Szente & Strattan, 1992).
The average degree of substitution (DS) is the most common measure to differentiate
between different CD derivatives, and usually refers to the average number of
chemically-modified groups (adducts) per CD molecule (Pitha et al., 1988; Szente &
Strattan, 1992; Buvári-Barcza et al., 1996). However, the DS does not differentiate
between the different locations where these groups can occur within both the
glucopyranose unit and the CD unit (Buvári-Barcza et al., 1996). While the ratio of
substituted-glucopyranose units can be maintained within a molecule, their location
within the molecule may vary (Pitha, 1990). However there is a degree of positional
(which hydroxyl groups) and regioselectivity (which glucopyranose units) possible. For
example, preparation of hydroxypropyl CD at low alkalinity promotes substitution of
the secondary hydroxy groups, while high alkalinity promotes substitution of the
primary hydroxy groups and possibly oligomeric substitution (Pitha, 1990; Buvári-
Barcza et al., 1996) (See section 1.5). The DS does not uniquely characterize a
chemically-modified CD, with chemically-modified CDs of the same DS potentially
being very different. However, the methods used to determine the DS can produce
spectrographs that can be used to assure that the same product is manufactured each
time (Szente & Strattan, 1992). While it is possible to derivatize specific locations
within the CD unit, this decreases amorphousness and hence solubility (Rao et al., 1990;
Pitha, 1990). The average molecular weights of the preparations can easily be
calculated from the molecular weight of the natural CD (α 973, β 1135 and γ 1297), the
molecular weight of the derivative group, and the DS (Pitha et al., 1988). For example:
Avg. mw for hydroxyethyl CD = mw natural CD + (DS x 44), and
Avg. mw for hydroxypropyl CD = mw natural CD + (DS x 58).
CD derivatives are characterized by the nature of the substituent, the position of the
substituent, and the DS (Szejtli, 1991a; Yalkowsky, 1999). There is a correlation
between the hydrophobicity of a derivative and its solubilizing capacity, complex
stability, tissue irritation, haemolytic effect and surface activity (Müller & Brauns,

CHAPTER 1 __________________________________________________________________________________________________________
18
1986b; Yoshida et al., 1988; Szejtli, 1991a). Therefore the most hydrophobic
derivatives show highest solubilizing power but also display the highest number of
deleterious effects (Szejtli, 1991a). In general, the DS also correlates with surface
activity, with higher degrees of substitution resulting in increased surface activity
(Müller & Brauns, 1986b; Yoshida et al., 1988). In addition, the DS can influence CD
solubility and drug solubilization (Müller & Brauns, 1986b; Backensfeld et al., 1990).
An increased number of substituents improves the solubility of the CD derivative, but
CD derivatives with lower degrees of substitution are better solubilizing agents, as
increases in the number of bulky substituents on the CD ring result in steric blockage of
the CD cavity (Müller & Brauns, 1986b; Backensfeld et al., 1990; Szejtli, 1991a).
However, this is not a rule. One exception to this is indomethacin, where higher
substitution results in a longer CD cavity, which results in increased indomethacin
protection (Backensfeld et al., 1990).
Economic and quality control considerations also play a role is determining what CDs
are pharmaceutically useful. For a given modified CD to be commercially viable, its
synthesis and purification must be relatively inexpensive and feasible. Therefore
modified CDs of pharmaceutical interest are likely to be complex mixtures (Stella &
Rajewski, 1997). Since multi- component systems are considered, accurate
characterization of batches is important to ensure content and reproducibility. Therefore
production methods need to be characterized to ensure lot-to-lot reproducibility,
including possible positional and regio-substitution (Brewster, 1992). They must also
be free of potentially reactive and toxic components, especially for parenteral
formulations, and must be sterilizable either by heat or filtration (Rajewski & Stella,
1996).
1.4.2. Types of derivatives
Although a large number of derivatives have been reported (Table 1.2), the most
common derivatives of β-CD are the partially alkylated, e.g. dimethyl and trimethyl-β-
CD, the partially hydroxyalkylated, e.g. hydroxyethyl and hydroxypropyl-β-CD, and the
branched β-CDs (Yalkowsky, 1999). In the pharmaceutical industry, five general types
of CDs are of interest due to their potential in vivo use (Rajewski & Stella, 1996):

CHAPTER 1 __________________________________________________________________________________________________________
19
- The alkylated CDs
- The hydroxyalkylated CDs
- The branched CDs
- The carboxymethyl CDs (Polymerised CDs)
- The sulphoalkylether CDs (ionic CDs)
Table 1.2: Some currently available CDs obtained by substitution of the OH groups
located in the edge of the CD ring (Loftsson & Brewster, 1996).
CD Derivatives α β γ Alkylated: Methyl
Butyl
Methyl Ethyl Butyl
Methyl Butyl
Hydroxylalkylated: 2-Hydroxypropyl
Hydroxyethyl 2-Hydroxypropyl 2-Hydroxybutyl
Hydroxyethyl 2-Hydroxypropyl
Esterified: Acetyl Succinyl
Acetyl Propionyl Butyryl Succinyl Benzoyl Palmityl Toluenesulfonyl
Acetyl Succinyl
Esterified and alkylated:
Acetyl methyl Acetyl butyl
Branched: Glucosyl Maltosyl
Glucosyl Maltosyl
Glucosyl Maltosyl
Polymerized: Simple polymers Carboxymethyl
Simple polymers Carboxymethyl
Simple polymers Carboxymethyl
Ionic: Carboxymethyl ether Phosphate ester
Carboxymethyl ether Carboxymethyl ethyl Phosphate ester 3-Trimethylammonium-2-hydroxypropyl ether Sulfobutyl ether
Carboxymethyl ether Phosphate ester
1.4.2.1. Alkylated cyclodextrin derivatives
The most common examples of the alkylated (methylated) CDs are 2,6-dimethyl-β-CD
(DMβCD), 2,3,6-trimethylmethyl-β-CD (TMβCD) and randomly methylated-β-CD
(RMβCD). The methylation of the secondary hydroxyl groups increases the solubility
of β-CD many fold. Methylation also extends the hydrophobic cavity of the CD and

CHAPTER 1 __________________________________________________________________________________________________________
20
provides a greater surface area for complexation (Brewster et al., 1989). As a result,
stability constants for drug/CD complexes are generally higher for DMβCD that for β-
CD (Brewster, 1992). Currently the methylated CDs appear to be the most powerful
solubilizers. DMβCD in particular is one of the most effective drug solubilizers of all
CD derivatives (Szejtli, 1991a). The main drawback of the methylated CDs is that they
have similar parenteral toxicity to β-CD. Parenterally administered DMβCD results in
an increase in glutamate-pyruvate transaminase (GPT) and glutamate-oxaloacetate
transaminase (GOT), indicating hepatic disorder (Yamamoto et al., 1990). In addition,
the methylated CDs also show marked surface tension reducing capacity and haemolytic
activity due to their relatively high lipophicity compared to β-CD. They exert detergent-
like effects on biological membranes, where they are able to complex with, and extract,
membrane components from erythrocytes at concentrations as low as 0.07% DMβCD
(Yoshida et al., 1988). The LD50 for DMβCD has been estimated at or below 200mg/kg
(Müller & Brauns, 1985). Another disadvantage is that DMβCD drug complexes
precipitate upon heating, as DMβCD decreases in solubility with heating. Therefore
these complexes cannot be heat sterilized (Duchêne & Wouessidjewe, 1990b). While
methylated β-CDs show great promise as complexing agents, they are too lipophilic for
pharmaceutical use (Szente & Strattan, 1992).
1.4.2.2. Hydroxyalkylated cyclodextrin derivatives
An alternative chemical modification is hydroxy- or dihydroxyalkylation. Examples of
hydroxyalkylated CD derivatives are hydroxyethyl- (HECD), 2-hydroxypropyl- (2-
HPCD), and 3-hydroxypropyl-CDs (3-HPCD) (Brewster et al., 1989). This chemical
reaction generates amorphous mixtures of literally thousands of geometric and optical
CD isomers. They are highly water soluble, hydrophilic, and can rapidly be dissolved
(Brewster et al., 1989). The non-selective nature of these modifications generates many
chemically distinct species whose solubility is independent of even close structural
analogues. For example, the derivatized moiety may be attached at the primary or
secondary hydroxy groups of β-CD or to the secondary hydroxy groups of the
polypropylene side chain from one of the glucose moieties (Pitha, 1990). In addition,
the hydroxyl group of the hydroxypropyl substituent can exist at 1 of 3 carbons, with
the most common HP derivative the 2-hydroxypropyl-CD (Thompson, 1997). The

CHAPTER 1 __________________________________________________________________________________________________________
21
lower lipophilic character of the hydroxyalkylated CD derivatives results in their
negligible surface activity and a greatly reduced tendency to cause haemolysis. Surface
activities of these forms are between those of β-CD and the alkylated CDs, and
increases with increasing degrees of substitution (Yoshida et al., 1988). Their
haemolytic activity and local irritancy are less than the natural CDs and DMβCD, and in
contrast to surface activity, the haemolytic activity decreases with increasing degrees of
substitution (Yoshida et al., 1988). This is probably associated with their decreased
ability to extract membrane components and therefore they are much more compatible
with biological membranes than both the natural CDs and DMβCD (Yoshida et al.,
1988; Brewster et al., 1989). Of the hydroxyalkylated CDs studied, 2-hydroxypropyl-β-
CD (HPβCD) has been the most extensively examined, receiving much attention in the
last few years. The complexing power of HPβCD is generally greater or equal to that of
β-CD, and generally less than DMβCD (Brewster et al., 1989; Szejtli, 1991a). More
importantly, the greater solubility of HPβCD over β-CD allows for the complexation of
much greater quantities of drug (Brewster et al., 1989). Detailed toxicology studies
have found that HPβCD is tolerated as a parenteral carrier even at extremely high doses,
and the raw material is available at an acceptable price and in the quantities necessary
(Szejtli, 1991a; Szente & Strattan, 1992). Further discussion on HPβCD can be found
in section 1.5.
1.4.2.3. Branched cyclodextrin derivatives
The primary hydroxyl group of CDs is substituted by mono- and disaccharides through
the α-1,6 glucosidic linkage (Yamamoto et al., 1990). They are amorphous with high
aqueous solubility (>50%) and have no surface activity, differing from the alkylated and
hydroxyalkylated CD derivatives. They also have lower haemolytic and local tissue
irritancy than the natural CDs and alkylated CDs (DMβCD), with the ability of the
branched CDs to extract membrane components decreasing with increasing number of
branched glucose residues (Duchêne & Wouessidjewe, 1990b; Yamamoto et al., 1990).
They are also more resistant to the action of α-amylase than β-CD, probably due to
steric hindrance of the branched glucose residues (Yamamoto et al., 1990). They
therefore have great potential as parenteral drug carriers (Yamamoto et al., 1990).

CHAPTER 1 __________________________________________________________________________________________________________
22
1.4.2.4. Polymerised cyclodextrin derivatives
The dihydroxypropyl β−CD derivatives are prepared by reaction of β-CD in alkaline
solution with epichlorohydrin to produce two or more covalently linked CD-units
(Szejtli, 1988; 1991a). CD polymers may be water-soluble, insoluble but strongly
swelling or moderately swelling amorphous powders, beads, foams etc (Szejtli, 1988).
The water-soluble polymers usually consist of between 2-5 CD units and are excellent
solubilizers (Szejtli, 1988). However, they are not easily characterized because of their
polymeric nature (Szejtli, 1991a; Szente & Strattan, 1992). Those with carboxymethyl
groups were particularly suited for basic drugs, while those with diethylaminoethyl
groups were particularly suited for acidic drugs (Szejtli, 1991a). Despite showing
neither significant surface activity nor haemolytic activity, they do contain a certain
amount of highly soluble CD oligomeric cross-linked polymers, and therefore have not
been extensively studied for parenteral use. However, they can be used orally and
externally (Szejtli, 1991a). Insoluble swelling CD polymers have a three dimensional
network and are not soluble in any solvent (Szejtli, 1988). Some have been developed
to accelerate wound healing, while those that exhibit poor binding with high
disintegrating properties have been used in tablet formulation (Szejtli, 1988; 1991b;
Duchêne & Wouessidjewe, 1990b).
1.4.2.5. Ionic cyclodextrin derivatives
Mixed ether-ester derivatives are produced by esterifying one or more of the free
hydroxyl groups on methylated β-CD, therefore introducing highly hydrophilic ionic
alkyl or aryl groups. These are crystalline compounds (Szejtli, 1991a). Another group
is the aminoalkyl-ether derivatives and mixed alkyl-, hydroxyalkyl-, and
carboxyalkylether derivatives, such as sulfobutyl ether-β-CDs (SBEβCDs). These are
amorphous and non-crystallizable, with the groups having ether linkages directly to the
CD ring (Szejtli, 1991a). Both groups have retained the excellent solubilizing capacity
of β-CD. In addition, the presence of ionic groups on the torus reduces the haemolytic
activity of the derivative, as they are unable to form strong inclusion complexes with
cholesterol and other membrane lipids. By establishing ionic interactions with ionic
guest molecules, these groups can enhance the solubility and stability of the complex

CHAPTER 1 __________________________________________________________________________________________________________
23
(Szejtli, 1991a). However, this is dependent on the relative proximity of the charge to
the CD cavity. The further the charge from the cavity the better the complexing ability.
Compared to neutral CDs, enhanced complexation is frequently observed when the drug
and CD have opposite charge (Másson et al., 1996). SBE7M-β-CD in particular has
received much attention over the last few years (Stella & Rajewski, 1997). The
SBEβCDs are water miscible and parenterally safe, with higher degrees of substitution
often resulting in higher drug binding (unlike other chemically-modified CDs).
1.5. HYDROXYPROPYL-β-CYCLODEXTRIN
1.5.1. Characteristics
HPβCD is soluble in ethanol, methanol, DMSO and dimethyl formamide (>20% w/v),
and water (>60% w/v) (Szente & Strattan, 1992). The aqueous solubility limit of
HPβCD in water has not been determined, with concentrations up to 75% w/w attained
by 10-20 min stirring (Pitha et al., 1986; Szente & Strattan, 1992). Also, solutions
become more viscous with increasing concentration (Brewster, 1992). For aqueous
solutions above 20% w/v HPβCD, the final volume of the resultant solution will
increase 0.7 mL for every gram of HPβCD (DS 5-7) added. For example, if 100 mL of
50% w/v aqueous HPβCD is needed, one should not start with more than 65 mL water
[100 mL – (0.7 mL/g x 50 g)] (Szente & Strattan, 1992).
HPβCD is an amorphous mixture of many chemical individuals, all of which have good
water solubility and good complexing power (Pitha et al., 1986). As previously
discussed, substitution of any of the hydrogen bond-forming hydroxyl groups result in a
dramatic increase in water solubility. The derivatized moiety may be attached at the
primary or secondary hydroxy groups of β-CD, or to the secondary hydroxy groups of
the modifying hydroxypropyl groups (Figure 1.4) (Pitha, 1990). Since the 2-HP
substituent contains a chiral carbon, and CDs are chiral, every specific substitution by
racemic propylene oxide leads to a pair of diastereomers – compounds that differ in
their chemical and physical properties (Rao et al., 1990). Each of the geometric isomers
is associated with 2n (n = the number of geometric isomers) optical isomers

CHAPTER 1 __________________________________________________________________________________________________________
24
Figure 1.4: Potential structure of 2-hydroxypropyl-β-cyclodextrin with examples of
substituents attached at the 2-, 3- and 6- positions. The fourth substituent demonstrates
the further polymerisation of the substituent with propylene oxide (Pitha, 1990;
Brewster, 1992; Thompson, 1997).
O
O
RO
CH 2 ORRO
O
O
RO
CH 2 OR
RO
O
OORCH 2OR
OR
O
O
O
OR
CH 2 OROR
O
O
O
OR
CH 2OR
OR
OR
O
O
OR
CH 2OR
RO
CH2OR
OR
R=[(CH2CH(CH3)O)]nH. n = 0, 1, 2, 3…
O O
O OHO
CH 2 OH O
O
OOHO
CH2OH
O
O
O OHO
CH 2 OH
O O
O OHHO
CH 2 O
OH
OH
OH
Basic glucopyranose unit
23
6
OHO
O
OOHHO
CH2OO
O Polymerised substituent
CHAPTER 1 __________________________________________________________________________________________________________
25
(Szente & Strattan, 1992). Since each CD molecule contains 28 chiral centres, and each
hydroxypropyl group adds one asymmetrical carbon, the total amount of isomers is very
large. Therefore random substitution of the hydroxyl groups of β-CD generates many
thousand possible derivatives (Loftsson & Brewster, 1996).
The degree of substitution (DS) is the mean number of 2-hydroxypropyl (HP: CH2-
CH(OH)-CH3) units per CD unit. Decreasing the average DS results in a decrease in the
number of components in the mixture, resulting in increased crystallinity and decreased
solubility (Rao et al., 1990). Therefore decreasing the DS decreases the amorphous
nature of the mixture. There is a correlation between the degree of substitution, HPβCD
solubility, and complexing ability (KC) (Pitha et al., 1986; Rao et al., 1992). For
example, at a low DS, the solubility of the CD is low, while its complexing ability is
high, and visa versa. As DS increases, complexing ability decreases due to increased
difficulty of guest to enter the cavity, while solubility increases due to increasing
amorphousness (Rao et al., 1992; Buvári-Barcza et al., 1996). Rao et al., (1992) also
found that at very low DS, complexing ability increased. This was attributed to
lipophilic binding between the guest molecule and the HP-groups. Alternatively,
increased complexing ability may be due to the initial increase in cavity size resulting
from derivatization, with subsequent increases in DS resulting in steric hindrance and
therefore increased difficulty of the guest to enter the cavity. A relationship between
complexing ability and substitution patterns was also observed, with the location of HP
derivatization on the primary or either secondary hydroxyl groups, influencing
complexing ability. Substitution of the secondary hydroxyl groups resulted in
decreasing complexing ability with increasing DS, while substitution of the primary
hydroxyl groups, or random substitution, had a more random effect on complexing
ability (Buvári-Barcza et al., 1996). Therefore the pattern of hydroxypropylation also
influences steric hindrance.
The physical dimensions of HPβCD should approximate its parent as far as the interior
cavity i.e. 7.0 – 8.0 Å is concerned. The other dimensions, such as height of the torus,
diameter of the periphery, and the effective volume of the cavity, can only be estimated
to fall within a relatively broad range, because of the freely rotating nature of the HP
adducts. The molecular weight of HPβCD of a given DS may be calculated by the

CHAPTER 1 __________________________________________________________________________________________________________
26
formula: MW=1135 + (DS x 58), where 1135 is the MW of β-CD and 58 is the
molecular mass added by each HP group (Szente & Strattan, 1992).
1.5.2. Manufacture
The natural CDs are already produced on an industrial scale, although γ-CD is still
expensive (Thompson, 1997). While manufacturers of β-CD are in the best-cost
position to produce HPβCD, the current demand for HPβCD does not call for
substantial HPβCD production. HPβCD price also varies greatly, as HPβCD for
parenteral administration has to meet much stricter requirements than for oral or
external requirements (Szejtli, 1991b; Thompson, 1997). All major manufacturing
methods use a base-catalyzed substitution reaction to produce HPβCD (Strattan, 1992;
Szente & Strattan, 1992). This is called the alkylene oxide method and most
manufacturers use propylene glycol to react with β-CD. The basic steps in the
manufacture of HPβCD are:
- Dissolve sufficient β-CD in an aqueous medium using an appropriate amount of
alkali metal base (usually NaOH).
- Add an appropriate amount of propylene oxide under specified conditions of
temperature, pressure, head-space content, and reaction time.
- Remove the alkali metal base, unreacted β-CD, and products of propylene oxide
side reactions (especially propylene glycol).
- Narrow the distribution of isomers (optional).
- Powder (if necessary).
- Reduce the powder to a uniform size.
The actual process varies widely, and manufacturers are required not only to provide
specifications for purity, residue on ignition, heavy metals and aqueous solubility, but
also for propylene glycol content, β-CD content, residue organics, water content, degree
of substitution and molar substitution. Further, adduct distribution in the isomers and
the degree to which the adducts are polymerized, specific rotation, peak asymmetry
analysis, and microbial and endotoxin content are also required (Strattan, 1992; Szente
& Strattan, 1992). Differences in manufacturing processes produce materials of

CHAPTER 1 __________________________________________________________________________________________________________
27
different DS and distribution of substituents, which need to be considered (Strattan,
1992).
1.5.3. Biological effects
1.5.3.1. Oral administration
Gerlóczy et al., (1985) studied the absorption, distribution and excretion of orally
administered HPβCD, and found that less than 10% was absorbed from the
gastrointestinal tract. Hydrolysis of HPβCD by colon microflora occurs at a slower rate
compared with the unsubstituted CDs, as the adducts interfere with enzymatic
degradation (Müller & Brauns, 1986a; Monbaliu et al., 1990). Of the absorbed HPβCD,
most is initially metabolized by the microflora in the large intestine. A maximum of 2-
3% (possibly as low as 1%) of the absorbed HPβCD is intact, which is then removed by
glomerular filtration (Frijlink et al., 1990; Gerlóczy et al., 1990; Monbaliu et al., 1990).
Up to 86% of the administered dose is unabsorbed and passed in the faeces within 72
hours, of which approximately 60-70% is intact HPβCD (Gerlóczy et al., 1990;
Monbaliu et al., 1990).
Oral doses as high as 15 g kg-1 resulted in no adverse effects in monkeys (Brewster,
1992). Large chronic doses of oral hydroxypropyl CDs in mice were also non-toxic, but
did cause slight liver enlargement (Pitha & Pitha, 1985). This was attributed to the
complexation and removal of bile acids from the intestine, so liver enlargement was
therefore associated with the increased synthesis of bile acids. As HPβCD is capable of
complexing a wide range of compounds, orally administered HPβCD can potentially
complex with a wide range of endogenous compounds in the gut, influencing their
distribution from the gastrointestinal tract (Pitha, 1990). This may explain the various
effects observed after administration of chronic large oral doses of HPβCD. For
example, both cholesterol and bile acids form complexes with HPβCD. Therefore
complexation may act to increase the solubility of cholesterol and bile acids, altering
their distribution (Nakanishu et al., 1989; Gerlóczy et al., 1994). However, Gerlóczy et
al., (1994) did not find orally administered HPβCD to significantly effect total plasma
cholesterol, and suggested that the untoward effects of large doses of HPβCD more

CHAPTER 1 __________________________________________________________________________________________________________
28
likely due to the CD-enhanced dissolution of various lipophilic toxins and carcinogens
present in food.
Orally administered HPβCD in human volunteers (up to 3g) could not be detected in
either plasma or urine, indicating that no absorption from the gastrointestinal tract
occurred, and that HPβCD is not bioavailable after oral administration (Szathmary et
al., 1990). In addition, no specific accumulation in the tissues occurred (Gerlóczy et al.,
1985; Monbaliu et al., 1990). Teratogenicity & embryotoxicity studies of orally
administered HPβCD were negative in the rat and rabbit (Coussement et al., 1990;
Brewster, 1992).
1.5.3.2. Parenteral administration
Over the last few years’ detailed studies of HPβCD absorption, metabolism and toxic
properties in various formulations have been carried out (Szejtli, 1991a). No
toxicologically meaningful data has been obtained for HPβCD in the DS range of 5-9,
with preparations with a DS of about four or more not containing detectable amounts of
starting CDs (Pitha et al., 1988). However, HPβCD with DS values lower than 4 should
be avoided as precipitation may occur in the kidney upon parenteral administration (Rao
et al., 1990).
Acute dosing of very high levels of HPβCD appears to produce no observable
manifestations or nephrotoxicity, with HPβCD eliminated from the body within a few
hours via glomerular filtration (Anderson et al., 1990; Frijlink et al., 1990; Monbaliu et
al., 1990). Acute intravenous administration of 10 g kg-1 in monkeys, and 5 g kg-1 for 7
days in rats resulted in no toxicity (Brewster et al., 1990; Brewster, 1992). The tissue
distribution was limited, with the highest concentrations found in the kidney (Monbaliu
et al., 1990). Similar results have been observed with acute intraperitoneal
administration, with none of the hydroxypropylated parent CDs exhibiting toxicity at 10
g kg-1 in mice (Pitha et al., 1988). Szathmary et al., (1990) and Seiler et al., (1990)
investigated the pharmacokinetics of intravenously administered HPβCD by injecting
successively larger doses of HPβCD into human volunteers (up to 3g). HPβCD was
almost totally eliminated via the kidneys, with almost 80% of the total dose eliminated

CHAPTER 1 __________________________________________________________________________________________________________
29
within 2 hours (Szathmary et al., 1990). No side effects or local irritation were
observed, with vital parameters, haematology and clinical chemistry unaffected, and
with no signs of renal impairment. The possibility that hormones may have been
complexed and excreted was also investigated, with hormone concentrations found to be
unaffected (Seiler et al., 1990).
In subchronic toxicity studies in rats and dogs, daily intravenous administration of 100
mg kg-1 for 90 days resulted in minimal, reversible effects on the urinary tract.
However, the same dosage regime at 400 mg kg-1 resulted in moderate toxicity, with the
urinary tract as the target organ, along with slightly altered blood and serum parameters
(Coussement et al., 1990). The main pathology was increased vacuolization of renal
tubular cells. This is similar to that seen following intravenous administration of large
doses of glucose, sucrose, mannitol or dextrin (Irie et al., 1992a). This effect is
reversible and thought to be dependent on the absolute volume of renally filtered fluid, a
variable often associated with animal size (Strattan, 1992). As the DS, molar
substitution, adduct distribution and the residual content of unreacted β-CD could affect
the potential toxicity of HPβCD, rigid specifications would need to be established to
reduce these potential side effects (Strattan, 1992).
HPβCD is far less toxic than DMβCD, especially after acute administration. Other
parenteral administration routes also provide similarly encouraging results. No
ophthalmic, intracerebral or muscular irritation was observed at HPβCD concentrations
as high as 40, 45 or 50% (w/v) respectively (Pitha et al., 1988; Coussement et al., 1990;
Brewster, 1992). The lower lipophilic character of the HPβCD has resulted in its
negligible surface activity and greatly reduced haemolytic properties in comparison to
either DMβCD or β-CD (Yoshida et al., 1988). Aqueous solutions up to 40% (w/v) are
not haemolytic in vivo (Brewster et al., 1990). Mutagenicity testing using the
salmonella/mammalian microsome plate incorporation mutagenicity assay (1000
µg/plate), and mouse micronucleus test (5 g kg-1) were also negative (Coussement et al.,
1990; Brewster & Bodor, 1990).
As with orally administered CDs, parenterally administered CDs have the capacity to
complex with endogenous compounds and influence their distribution throughout the

CHAPTER 1 __________________________________________________________________________________________________________
30
organism. This also occurs after intravenous administration of drug/CD complexes, as
only small amounts of drug remain complexed. This results from binding competition
between cyclodextrin and plasma protein for the drug, and also competition between the
drug and endogenous compounds for the cyclodextrin. In some cases increased drug
protein binding is observed, and is attributed to the removal of cholesterol from plasma
protein binding sites (Frijlink et al., 1991a; Sideris et al., 1994). The complexation of
cholesterol by HPβCD may be of therapeutic value if HPβCD assisted transport
partially prevents cholesterol deposition (Irie et al., 1992a). Intravenously administered
HPβCD has been used in a case of severe hypervitaminosis A, with the intention to
solubilize retinoids and enhance their urinary excretion (Carpenter et al., 1987). While
treatment did help, the observed increase in serum retinoid concentrations was greater
than expected given the concentration of circulating HPβCD. Therefore Irie et al.,
(1992a) proposed that HPβCD may have accelerated the transfer of retinoids to
lipoproteins, with circulatory HPβCD acting as an intermediary, catalyzing the transport
of cholesterol within the lipoprotein–vascular system, but not transporting
physiologically meaningful quantities of cholesterol itself. While HPβCD is capable of
solubilizing and transporting lipids in organisms, they have limitations as lipid carriers.
As both the binding affinity and specificity toward individual lipid classes are small, no
selective removal can be expected. This is advantageous, as HPβCD cannot compete
with specific carrier proteins for critical lipids, such as vitamins and hormones,
depriving the organism of these critical lipids (Irie et al., 1992a).
1.6. FORMULATION OF INCLUSION COMPLEXES
1.6.1. Determination of stability constants
In solution, an inclusion compound is always in kinetic or thermodynamic equilibrium
with its free components (Section 1.3). This equilibrium is expressed by the stability
constant (KC), and is an index of the change in physicochemical properties of a
compound upon inclusion (Loftsson & Brewster, 1996). All methods to determine the
KC involve analyzing the CD concentration dependency of certain physical or chemical
properties of the guest, such as solubility, chemical reactivity, molar absorptivity, pKa,
CHAPTER 1 __________________________________________________________________________________________________________
31
or even chromatographic retention time. Examples of these methods may be found in
Hirayama & Uekama, (1987).
1.6.1.1. Phase solubility analysis
Phase solubility analysis is the study of the dependence of guest solubility on CD
concentration, and may reveal both the stoichiometry of the complex formation as well
as the stability constant of the complex (Jones et al., 1984). The basis for reliable
formation development is accurate determination of solubility. The solubility of guest
molecules is often determined by UV spectrophotometry, as CDs do not absorb in the
UV spectrum (Jones et al., 1984). Constancy of solubility, like constancy of melting
point and other physical properties, indicate that the solid sample is a pure substance
and is free from foreign material (Grant & Higuchi, 1990). However, in some cases
accurate determination may be difficult due to solid state factors and batch to batch
variation (different polymorphs, hydration state, crystallinity, crystal homogeneity and
impurities) which affect reproducibility (Sweetana & Akers, 1996).
Phase-solubility analysis of drug/CD complexes comprises two processes. The
experimental techniques for phase-solubility analysis involve multiple vials of equal
masses of substrate (compound of interest) and solvent, with increasing amounts of the
ligand (complexing agent), mixing a constant temperature and pressure (Grant &
Higuchi, 1990). This is maintained until equilibrium in reached. As complexation
lowers the thermodynamic activity of the dissolved drug, more drug dissolves until the
activity of the free drug, which is in chemical equilibrium with the complex, becomes
equal to the thermodynamic activity of the pure solid drug (Jones et al., 1984). The
interpretation of the resultant equilibrium plots according to the phase rule results in the
determination of the stability constant of the complex (Jones et al., 1984; Grant &
Higuchi, 1990) (Section 2.2.1). Phase-solubility diagrams are generated by plotting the
total molar concentration of the substrate against the molar concentration of the ligand.
The diagrams obtained fall into two main categories, Type A and Type B (Grant &
Higuchi, 1990).

CHAPTER 1 __________________________________________________________________________________________________________
32
Type A diagrams are characterized by a continual increase in substrate concentration [S]
with increasing ligand concentration [L], presumably due to the formation of soluble
complexes between the substrate and the ligand (Grant & Higuchi, 1990). Three type A
diagrams exist (Figure 1.5). A strict linear rise in substrate concentration with
increasing ligand concentration, designated AL, occurs when complexes are of the first
order in ligand, e.g., SL, S2L, S3L… SmL. The linear relationship between solubility
and CD concentration has a number of advantages, one of which is the lack of
precipitation of the formulation upon dilution (Stella & Rajewski, 1997). Positive
curvature, type AP, arises when the complexes contain the ligand at higher orders than
one, e.g., SL2, SL3… SLm. Negative curvature, type AN, may arise when the presence of
the ligand at high concentrations changes the stability constant of the complex or
induces self-association of the ligand. This behaviour is rare (Grant & Higuchi, 1990).
The plateau may also represent saturation of the solution with ligand, owing to its own
solubility limits. However, only if the diagram reaches a plateau can the actual ratio of
S:L be determined.
Type B phase-solubility diagrams arise when complexes of limited solubility are formed
between the substrate and the ligand (Figure 1.6). The limited solubility of the natural
CDs often gives rise to type B phase diagrams when complexed with other compounds
with limited aqueous solubility (Loftsson & Brewster, 1996). Type BS diagrams
indicate some solubility of the complex. The rise from S0 (solubility of the substrate
without ligand) to a is interpreted as the formation of the complex which dissolves as in
any of the type A diagrams. At point a, however, the solubility limit of the complex is
reached and further addition of ligand results in the formation of more complex in a
solid form. Since the substrate is being precipitated with the ligand, the substrate
continues to dissolve to keep constant the thermodynamic activity and the concentration
of dissolved substrate. At point b, no more solid substrate remains and further addition
of ligand results in the depletion of substrate from the solution by formation and
precipitation of the complex. This becomes somewhat more complicated when the
system forms more than one complex, with each complex having different solubility
limits. Type BI is interpreted in the same manner as BS, except that the complex formed
is insoluble.

CHAPTER 1 __________________________________________________________________________________________________________
33
Figure 1.5: Phase solubility diagrams of Type A systems showing apparent increase in solubility of S caused by component L (Higuchi & Connors, 1965).
Figure 1.6: Phase solubility diagrams of Type B systems showing changes in solubility of S caused by component L (Higuchi & Connors, 1965).
1.6.2. Analysis of cyclodextrin complexes
The formulation of cyclodextrins with potential guests does not guarantee true inclusion
complex formation (Szejtli, 1988). Therefore it is necessary to determine the guest
content of the product, whether the guest is actually included in the cyclodextrin cavity,
and the ratio of complexed to uncomplexed guest. Quantitation of guest content can be
determined using UV, GLC, HPLC or other analytical techniques. However, the
complex must be dissolved and dissociated, in order to account for complexation
resulting in small shifts in UV absorption maxima and molar extinction coefficients, as
well as modifications in the chromatographic mobility, reactivity and other
characteristics (Szejtli, 1988).
[S]
[L]
SO
BI BS
a b
c
d
[S]
[L]
AP
AL
AN
SO

CHAPTER 1 __________________________________________________________________________________________________________
34
The formation of CD inclusion compounds in solution can be detected by various
methods such as circular dichroism, nuclear magnetic resonance (NMR), electron spin
resonance (ESR), fluorescence enhancement, X-ray powder refraction, chromatography,
infra-red spectroscopy and thermoanalytical methods (Jones et al., 1984; Szejtli, 1988).
While most are effective techniques, some techniques are only suitable for particular
compounds. Thermoanalytical methods such as evolved gas analysis (EGA),
differential thermal analysis (DTA), differential scanning calorimetry (DSC), and
thermogravimetric analysis (TGA) are techniques used to study the thermal transitions
of a sample. They can be used to determine whether a true inclusion compound has
been formed, by determining whether the guest substance undergoes some change
before thermic degradation of the CD (250-300°C) (Jones et al., 1984; Szejtli, 1988).
With increasing temperature, TGA and DTG reveal mass loss, EGA measures the
specific rate of gas or vapour evolution from a sample, and DSC reveals enthalpy
changes (Szejtli, 1988). More specifically, DSC involves heating a sample at a specific
rate, and as the sample undergoes endothermic and exothermic reactions, the sample
requires more or less heat to maintain that specific rate of heating, producing
characteristic heat flow curves as a function of temperature (Wells & Aulton, 1988;
Szente & Strattan, 1992). These thermoanalytical methods measure changes within the
sample that may be due to evaporation, oxidization, out-gassing, melting,
crystallization, polymorphic transition or decomposition (Szejtli, 1988). These
techniques produce reproducible thermograms that are like a fingerprint for a particular
compound. Detailed reviews on the preparation and investigation of inclusion
compounds are provided by Hirayama & Uekama, (1987) and Szejtli, (1988).
1.6.3. Solid inclusion compounds
Solid drug preparations are formulated to allow oral delivery of the drug. Solid
inclusion compounds are advantageous as they accelerate and increase drug dissolution
and thus improve the absorption of the orally administered drug. Their dissolution
resembles the rapid dissolution of the CDs rather that the slow dissolution of the drugs.
The most reliable method for the preparation of solid inclusion compounds is to isolate
them from the saturated aqueous solution. However, this can be time consuming and
alternative methods may be more feasible. However, solid inclusion compounds need

CHAPTER 1 __________________________________________________________________________________________________________
35
to be analyzed for their composition (CD, drug, water and contaminants) and
stoichiometric ratio (Hirayama & Uekama, 1987). Analysis of dissolution kinetics of
solid inclusion compounds is often preferable to solubility studies as it reveals not only
solubility improvement, but also the rate of passage into solution (Duchêne et al., 1986).
1.6.4. Improving complexation efficiency
While large numbers of drugs can be complexed, technical and economical reasons set
limitations on the use of CDs (Szejtli, 1991b). For many drugs, complexation is either
not possible, yields no advantage, or the ratio of drug to CD requires unreasonably large
quantities to achieve sufficient doses (Szejtli, 1991b). For K1:1 complexes, the drug
solubility in the presence of CD cannot be any greater than the molar concentration of
the CD used to solubilize the drug, and even this assumes that the binding constant is
infinitely large (Stella & Rajewski, 1997). Most K1:1 values fall within 100-20000 M-1,
and the CD concentration is usually less than 0.1-0.2 M. Therefore the maximum
increase in solubility that can be expected is 1000-2000 fold (Stella & Rajewski, 1997).
As the mass of tablet should not exceed 500mg, and CDs have rather large molecular
weights, the relationship between the required dose and the molecular weight of the
drug determines the feasibility of oral administration (Szejtli, 1991b). Oral applications
of CDs are appropriate for dissolution rate limited drug absorption, but are limited to
low dose drugs with large stability constants due to the mass limitations of oral dosage
units (Rajewski & Stella, 1996). In addition, production of dosage forms on a
commercial scale would consume large amounts of CD. Therefore the CD must be
reasonably inexpensive for the dosage form to be economically feasible. β-CD itself is
quite inexpensive, and the costs or α-CD and γ-CD are declining. Any modification of
the CD structure must entail relatively inexpensive reagents and purification procedures
(Rajewski & Stella, 1996).
As the complexation efficiency of CDs is frequently quite low, increased efficiency can
be achieved by increasing either the aqueous solubility of the drug (SO) or the stability
constant of the complex (KC). A number of commonly used pharmaceutical additives,
such as organic solvents, lipophilic preservatives and surfactants, whose addition may
increase SO, often decrease KC by competing with the drug molecule for space within

CHAPTER 1 __________________________________________________________________________________________________________
36
the CD cavity, resulting in decreased efficiency (Loftsson et al., 1999). Therefore a
number of methods to enhance complexation efficiency have been investigated. Such
methods include altering the pH (Loftsson et al., 1996a; 1998; Carrazana García et al.,
1998; Linares et al., 1998), adding components such as polymers (Loftsson et al., 1996a
and b), organic acids (Bekers et al., 1989; Gerlóczy et al., 1996; Mura et al., 1998),
pluronics (Topchieva et al., 1994), nanoparticles (da Silveira et al., 1998) or
hydroxypropyl methylcellulose (Loftsson et al., 1994; Brewster et al., 1995) to aid
complexation, or altering temperature to affect the thermodynamics of the system (Jones
& Grant, 1984; Bekers et al., 1989; Hoshino et al., 1993; Yalkowsky, 1999; Redenti et
al., 2000). However, the addition of other components does increase the number of
variables, and therefore must be accounted for. The use of drug/cyclodextrin/hydroxy
acid multicomponent systems is becoming increasingly popular as a means of
increasing drug solubility (Redenti et al., 2000). The formation of water-soluble salts
between a basic drug and organic acid can enhance complexation, either through an
increase in SO (through the improved solubility of the individual components, i.e. free
unionized drug + free ionized drug + unionized drug complex + ionized drug complex)
or an increase in KC (i.e. formation of drug/acid/CD ternary complex) or increasing both
simultaneously (Loftsson et al., 1999). In addition, hydroxy acids are often able to
increase the solubility of CD (particularly β-CD), resulting from their capability to
modify the intramolecular hydrogen bond system of the secondary hydroxyls of CD
and/or effect their interaction with the surrounding water molecules (Redenti et al.,
2000). Drugs that achieve the best solubility enhancement are strongly bound to the
CD, even though they are in the ionized form. This is because the ionized portion of the
drug is located quite far from the included part of the drug, so the complexing ability is
not significantly affected. Increased complexation (through KC) can also be achieved
through non-covalent multicomponent associations between the CD, basic drug and the
acid, such as when the hydroxy acid establishes both electrostatic interactions with the
drug and hydrogen bonds with the hydroxyl groups of the CD. For a review, see
Loftsson et al., (1999) and Redenti et al., (2000).
CHAPTER 1 __________________________________________________________________________________________________________
37
1.7. CONCLUSION
1.7.1. Safety issues
A drug molecule needs to be water soluble to be readily delivered to the cellular
membrane, but needs to be hydrophobic to cross the membrane. Traditional
formulation systems for insoluble or unstable drugs involve a combination of organic
solvents, surfactants, and pH extremes (Thompson, 1997). The ability of CDs to
complex drugs enables the formulation of water-soluble drugs that are typically difficult
to solubilize, stabilize, and deliver with the more traditional additives. As α- and β-CD
are parenterally unsafe due to nephrotoxicity, they are more likely to find use in oral
products (Stella & Rajewski, 1997). Because the major source of CD toxicity is related
to their low aqueous solubility, the substituted CDs are generally less toxic to the kidney
than their parent compounds (Yalkowsky, 1999). While derivatization may decrease
the problems associated with CD toxicity, and CD generally do not potentiate the
toxicity of the tested compounds, they may influence the toxic effects of the solubilized
compounds as they are more rapidly distributed throughout the organism (Pitha et al.,
1988).
HPβCD is a useful solubilizing and stabilizing agent for a wide variety of poorly water-
soluble drugs. While other CDs can provide similar complex formations, the fact that
HPβCD is not parenterally toxic makes this material far more compatible with
pharmaceutical dosage design, and will most likely become a widely used solubilizer
and parenteral drug carrier (Brewster, 1992). Strattan, (1992) has proposed dosage
guidelines to avoid any toxic effects of HPβCD. Toxic effects after oral administration
are unlikely to appear when administered doses do not exceed 5-10 g kg-1. Parenterally,
toxic effects are unlikely to appear in humans when administered doses do not exceed
400 mg kg-1 daily i.v. administration, possibly up to 1 g kg-1 intermittent i.v.
administration (after several days of no dosing, acute dosage levels become permissible
again), or 1-5 g kg-1 acute i.v. administration, with the exact dosage determined by
vascular volume and renal parameters. However, while HPβCD is not acutely toxic after
oral, i.v., i.p., i.m., topical or intracerebral administration, it is necessary to evaluate the

CHAPTER 1 __________________________________________________________________________________________________________
38
toxicology of HPβCD/drug complexes as complexation affects drug distribution as well
as its haemolytic properties (Brewster et al., 1990).
Another consideration is the ability of CDs to form complexes with endogenous
compounds. After oral administration CD complexes undergo dissociation, and as the
CD is not absorbed by the tissue or otherwise consumed while delivering the drug, is
then available to solubilize endogenous compounds in the gut. Under laboratory
conditions where the environment and food are standardized this generally does not
present a problem. However, many toxicants and carcinogens present in human food
and environment are known to form complexes with CD and thus are of concern (Pitha,
1994).
1.7.2. Applications
As a result of complex formation, the characteristic properties of the included substance,
such as solubility, chemical reactivity, pKa values, diffusion, electrochemical properties
and spectral properties will be changed. This has lead to the widespread utilization of
CDs in pharmaceutical, food, chemical and other industrial areas (Szejtli, 1988). In the
pharmaceutical industry, almost all applications of CDs in pharmaceutical formulations
involve complexation, either as solid crystalline form, or in an aqueous system, for drug
delivery (Szejtli, 1991a). However, CDs and their derivatives have also been used as
auxiliary additives such as solubilizers, diluents, or tablet ingredients to improve
physical or chemical properties (Li & Purdy, 1992). CDs are also finding increased use
in biotechnology. Generally, the uses of CDs in biotechnology have been to enhance
bioavailability or stimulatory effects on metabolic processes, to protect microorganisms
from toxic products, and as a substitute for more expensive components (Szejtli, 1992;
Bar, 1996). In analytical chemistry CDs also have a number of applications.
Chromatographic separation and purification, electrochemical analysis and
fluorescence, luminescence, NMR and UV-visible spectrometric analysis are just a few
areas where CDs have found a use (Jones & Grant, 1984; Li & Purdy, 1992). In the
food, cosmetics, toiletry and tobacco industries, CDs have been widely used either for
the stabilization of flavours and fragrances, or for the elimination of undesirable tastes,
microbiological contaminants and other undesired components (Li & Purdy, 1992). As

CHAPTER 1 __________________________________________________________________________________________________________
39
CD research continues, along with increased CD production and decreasing prices, the
applications of CD and their derivatives will rapidly increase in a wide variety of
industries. Detailed reviews on the industrial applications of CDs can be obtained from
Szejtli, (1982), Vaution et al., (1987), Szejtli, (1988) and Li & Purdy, (1992).
There are many reviews covering the vast amounts of information concerning CDs, CD
derivatives, complexation characteristics, toxicity, applications of CDs, approved
products, CD analysis etc. More detailed information may be obtained from Szejtli,
(1988), Connors, (1997), Irie & Uekama, (1997) and Thompson, (1997) and as
otherwise stated throughout this literature review.
1.8. RATIONALE AND AIM
The purpose of this investigation is to formulate the antiparasitic agents albendazole,
trifluralin and oryzalin with HPβCD, with the view of improving their aqueous
solubility and hence, bioavailability. The efficacy of these formulations will be
determined against the protozoan parasites Giardia duodenalis, Cryptosporidium
parvum and Plasmodium chabaudi (rodent malaria). Both Giardia and
Cryptosporidium infect the gastrointestinal tract, with Giardia attaching to the mucosa
at the bases of the microvilla (Chapter 5), and Cryptosporidium predominately an
intracellular parasite located at the luminal surface of the host epithelial cell (Chapter 6).
In comparison, malaria causes systemic infections, invading the liver and RBCs
(Chapter 7). Thus the current study will also investigate the role of CD as a drug carrier
to protozoan parasites which inhabit different compartments within the body.
Therefore this study will involve:
1. Formulating inclusion compounds between these agents and HPβCD.
2. Investigating the pharmacokinetics of these antiparasitic agents both alone and
complexed.

CHAPTER 1 __________________________________________________________________________________________________________
40
3. Investigating the cytotoxicity of HPβCD and these antiparasitic agents both
alone and complexed.
4. Investigating the in vitro efficacy of HPβCD and these antiparasitic agents both
alone and complexed against the protozoan parasites G. duodenalis, C. parvum
and P. chabaudi.
5. Investigating the in vivo efficacy of HPβCD and these antiparasitic agents both
alone and complexed against G. duodenalis and P. chabaudi.

CHAPTER 2 __________________________________________________________________________________________________________
41
CHAPTER 2. COMPLEXATION OF THE TUBULIN
INHIBITORS ALBENDAZOLE, ORYZALIN AND
TRIFLURALIN WITH ΗPβCD

CHAPTER 2 __________________________________________________________________________________________________________
42
2.1. INTRODUCTION
2.1.1. Tubulin
Microtubules occur in eukaryotic cells only and make up part of the cell cytoskeleton.
They are vital for cell survival as they form the centrioles and mitotic spindles essential
for cell division, the axoneme structures in flagella necessary for cell motility, are
involved in special organization of the organelles in the cytoplasm, form the cilia, and
contribute to the overall shape and integrity of the cell (Becker & Deamer, 1991).
Microtubular structures also aid in intracellular transport, exo and endocytosis and
secretory processes (Lacey, 1988). Breakdown of the tubulin-microtubule equilibrium
results in both direct and indirect biochemical and physiological changes, ultimately
resulting in a loss of cellular homeostasis.
Microtubules are polymeric hollow structures consisting of tubulin dimers. Tubulin
comprises α- and β-subunits of approximately 50 kDa each. Structurally, both α- and
β-tubulin are heterogeneous proteins, products of multigene families as well as post-
transcriptional modifications (Lacey, 1990). Microtubules exist in dynamic equilibrium
with dimeric tubulin. The ratio of dimeric tubulin and polymeric microtubules is
controlled by a range of co-factors such as endogenous regulatory proteins, GTP, Ca2+
and Mg2+ ions, and is temperature dependent. It is thought that tubulin dimers associate
with the microtubule at one end and dissociate at the other, thus the microtubule
undergoes continuous turnover (Lacey, 1990) (Figure 2.1). This equilibrium can be
altered in vitro and in vivo by microtubule inhibitors. Microtubule inhibitors are a
structurally diverse group of compounds produced by fungi, plants, marine organisms,
possibly higher eukaryotic animals and, more recently, synthetically. Most exert their
action by binding to tubulin to prevent the self-association of subunits onto the growing
microtubules. This results in a ‘capping’ of the microtubule at the associating end while
the microtubule continues to disassociate from the opposite end, with a net loss in
microtubule length. The microtubule cytoskeleton is the target site for many drugs.
Some are used as antitumor agents (e.g. colchicine, taxol and vinblastine), as fungicides
(e.g. benzimidazoles and griseofulvin) or as herbicides (e.g. dinitroanilines,
phosphorothioamidates and N-phenyl-carbamates). These anti-microtubule agents

CHAPTER 2 __________________________________________________________________________________________________________
43
generally have different affinities to tubulin from metazoan, protozoan, plant and algal
cells (Anthony & Hussey, 1999). Benzimidazoles and dinitroaniline derivatives are two
examples of synthetic microtubule antagonists. These bind to tubulin and prevent
microtubule assembly, eventually resulting in the depolymerisation of microtubules.
Comprehensive reviews of microtubule function can be obtained from Lacey, (1988)
and Becker & Deamer, (1991).
Figure 2.1: Typical microtubules reach a dynamic equilibrium with tubulin, controlled
by endogenous concentrations of co-factors such as GTP, Mg2+, microtubule associated
proteins (MAPs), Ca2+ and calmodulin. Regulation in vitro, by increasing temperatures,
enhances polymerization, whereas reducing the temperature induces depolymerization.
Addition of inhibitors causes ‘capping’ and halts polymerization, allowing only
depolymerisation with the net loss of microtubule structure. Text and figure from Lacey,
(1990).
↓ TemperatureCa2+
Calmodulin
↑ Temperature GTP Mg2+ MAPs
Inhibitor

CHAPTER 2 __________________________________________________________________________________________________________
44
2.1.2. Benzimidazoles
Benzimidazoles are broad-spectrum drugs that exhibit a wide range of activities, such as
anti-fungal, herbicidal, insecticidal, anti-bacterial and anti-protozoal effects, even
showing activity against mammalian cells (Lacey, 1990). While their main use has
been anthelmintic, some have recently been used as anti-protozoal agents (Meloni et al.,
1990; Katiyar et al., 1994). Interest in the benzimidazole ring system as a basis for the
development of potential chemotherapeutic agents was established in the 1950s when
the compound 5,6-dimethyl-1-(α-D-ribofuranosyl)benzimidazole was found to be an
integral part of the structure of vitamin B12. Benzimidazole is a bicyclic ring system in
which benzene has been fused to the 4- and 5-position of the heterocycle (Figure 2.2).
Figure 2.2: Primary substituent positions of the benzimidazole anthelmintics
(Gottschall et al., 1990; Townsend & Wise, 1990).
Thiabendazole (TBZ) was discovered in 1961 and found to possess a remarkably broad
spectrum of activity against gastrointestinal parasites. However its use was limited due
to enzymatic hydroxylation at the 5-position, which limited its effectiveness, and due to
its toxicity to humans. To overcome this problem, benzimidazoles with structural
modifications were designed to prevent metabolic inactivation. A combination of
modifications at positions R2 and R5 of the molecule has provided the most active drugs.
Modification at position R2 of TBZ resulted in the production of a number of
compounds that possessed anthelmintic activity, with the 2-methylcarbamate derivative
the most effective. Following the introduction of this compound, additional drugs such
as mebendazole (MBZ), flubendazole, ciclobendazole, albendazole (ABZ),
oxibendazole, fenbendazole and oxfendazole were produced by several companies
(Figure 2.3). Prodrugs are also being developed with increased solubility, and thus can
also be used against systemic infections. They are appropriately substituted benzene
molecules that can be enzymatically converted to an active benzimidazole carbamate
H
N
N
R2
R1
76
5
4 3
2
1

CHAPTER 2 __________________________________________________________________________________________________________
45
after absorption by the animal (Townsend & Wise, 1990). Examples of prodrugs are
thiophanate (methyl), febantel and netobimin, all of which are converted to
benzimidazole carbamates by the host.
Figure 2.3: Chemical structure of some of the benzimidazole anthelmintics (Townsend
& Wise, 1990).
After oral administration the benzimidazole anthelmintics are extensively metabolised.
The primary metabolism and toxicity of the benzimidazoles usually depends on the
substituent present at R2 of the benzimidazole nucleus, and involves a wide variety of
phase 1 reactions such as hydroxylation (TBZ and parbendazole), S-oxidation (ABZ and
fenbendazole), and reduction (MBZ) (Gottschall et al., 1990). Conjugation is also a
frequent occurrence, and in some cases the conjugates become the predominant
R
N
N
S
N
RNHCO2CH3
N
N
C
O
C
O
S
S
FC
O
O
R=CH3CH2CH2CH2- Parbendazole
R=CH3CH2CH2O- Oxibendazole
R=CH3CH2CH2S- Albendazole
Ciclobendazole
R=
R=
Oxfendazole
R=
Fenbendazole
R=
Flubendazole
Mebendazole
R=
Benzimidazole Carbamates
R=(CH3)2CHOCONH- Cambendazole
R=H Thiabendazole
Benzimidazoles

CHAPTER 2 __________________________________________________________________________________________________________
46
products observed. The metabolic profiles of individual benzimidazole anthelmintics
follow similar patterns across species, but metabolite percentages do vary substantially.
The elucidation of the metabolic profile of a specific compound becomes increasingly
important for the understanding and evaluation of overall product safety (Gottschall et
al., 1990).
Currently there are only three benzimidazole compounds in human clinical practice;
ABZ, MBZ and flubendazole (Horton, 1990). These are both safe and highly effective
in the treatment of the majority of intestinal helminth infections and are useful in
individual and mass treatments (Horton, 1990). However, due to their limited
absorption and rapid metabolism, only high and prolonged doses are effective against
human systemic infections such as hydatid disease and neurocysticercosis (Horton,
1990). Detailed reviews of the benzimidazoles can be obtained from Gottschall et al.,
(1990), McKellar & Scott, (1990), Townsend & Wise, (1990) and de Silva et al.,
(1997).
2.1.2.1. Mode of action
The benzimidazoles are thought to have a similar mode of action, which appears to
involve their interaction with the eukaryotic cytoskeletal protein tubulin (Lacey, 1985).
While most research previously focused on anthelmintic activity, recent investigations
have found the benzimidazoles also bind to the tubulin of a number of protozoan
parasites. Benzimidazoles are thought to bind β-tubulin at the colchicine-binding site
and have similar antimitotic and cellular effects to colchicine. The parasite tubulin-
benzimidazole complex, like the mammalian brain tubulin-colchicine complex, is
pseudo-irreversible in that, although the binding is non-covalent, once bound the ligand
cannot easily be removed without denaturing the protein (Lacey, 1990). The potent
inhibitory activity of benzimidazoles against parasites as opposed to host tissue is
attributed to a higher affinity for parasite tubulin, as well as differing benzimidazole
pharmacokinetics within the host and the parasite (Lacey, 1990; McKellar & Scott,
1990).

CHAPTER 2 __________________________________________________________________________________________________________
47
Other reports disagree that the tubulin mechanism is the primary mode of action, instead
proposing that the benzimidazoles act as lipid-soluble proton ionophores, resulting in
bioenergetic disruptions (McCraken & Stillwell, 1991). Alternatively the
benzimidazoles are thought to disrupt enzymes of the respiratory pathways, therefore
disrupting energy synthesis, resulting in insufficient ATP (Behm & Bryant, 1985).
Other postulated modes of action are the inhibition of glucose, amino acid and fatty acid
uptake, and inhibition of various metabolic enzymes such as malate dehydrogenase and
fumarate reductase (Lacey, 1990; McKellar & Scott, 1990). However, such effects are
not seen in all parasites, which may reflect differential metabolic processes between
parasites. It is also proposed that the effect of benzimidazoles on tubulin
polymerization and the biochemical effects on respiratory enzymes may be linked
(McKellar & Scott, 1990). Despite the diverse effects of benzimidazoles at the
biochemical and cellular levels, the primary action of these drugs appears to involve
their interaction with the eukaryote cytoskeletal protein, tubulin. Detailed reviews on
the benzimidazole mode of action can be obtained from Lacey & Snowdon, (1988),
McKellar & Scott, (1990) and Reynoldson et al., (1992).
2.1.2.2. Resistance
While benzimidazoles have been effective in the control of nematode parasites in
livestock, benzimidazole drug resistance is becoming increasingly evident (Horton,
1990; Waller, 1990; de Silva et al., 1997). Specific mutations in the β-tubulin gene have
been implicated in mediation of both resistance and super-sensitivity to the
benzimidazoles (Roos, 1990; Katiyar et al., 1994). However the relevance of these
mutations is as yet unclear as the BZ binding site has not been identified. Difficulties in
determining the benzimidazole-binding site arise because the mutations that confer
benzimidazole resistance are scattered along the ß-tubulin molecule, along with those
that lead to supersensitivity to benzimidazoles. A possible reason for this may be that
the benzimidazole-binding site spans several domains of the β-tubulin molecule, folded
together into a specific conformation. There is also some evidence to suggest that these
recessive mutations may already exist within parasite populations, and have been
selected for by drug use. For example, selection for thermosensitivity has produced β-
tubulin mutants with variable benzimidazole-binding properties. One hypothesis is that

CHAPTER 2 __________________________________________________________________________________________________________
48
the variants that exist are functional at the different temperatures encountered by the
different stages of the life cycle. Further information on benzimidazole resistance can
be found in the reviews of Lacey, (1988) and Roos, (1990).
2.1.2.3. Albendazole
ABZ is a benzimidazole carbamate with a broad anti-parasitic spectrum (Theodorides et
al., 1976). ABZ was first approved for treatment of helminth infections in sheep in
1977, and subsequently approved for human use in 1983 (de Silva et al., 1997). In
general, most ascariasis, trichuriasis, enterobiasis and hookworm infections can be
successfully treated with single dose ABZ, and strongyloidiasis with multiple doses of
ABZ. ABZ has also used in the treatment of capillariasis, gnathostomiasis, and
trichostrongyliasis, the cestode infections hydatidosis, taeniasis and neurocysticercosis,
and the tissue nematodes cutaneous larval migrans, toxicariasis, trichinosis and filariasis
(in combination with other anthelmintics). ABZ has also been used successfully against
mixed infections. Reviews on the efficacy of ABZ against a range of parasites can be
obtained in Horton, (1989), Cook, (1990), de Silva et al., (1997) and Parfitt, (1999).
Absorption of ABZ from the gastrointestinal tract is poor, so orally administered ABZ
is of most value against intestinal nematodes. Once absorbed however, the drug is
rapidly metabolised in the liver before reaching the systemic circulation. The primary
metabolite, albendazole sulfoxide, also has anthelmintic activity, and ABZ efficacy is
attributed to this metabolite (Bogan & Marriner, 1984; Marriner et al., 1986; Hussar,
1997).
2.1.2.3.1. Characteristics
ABZ is a colourless crystaline or white to faint yellow powder with a MW of 265.33
(C12H15N3O2S) and mp between 208-210°C (Budavari, 1989; Parfitt, 1999). It is
practically insoluble in water and alcohol, slightly soluble in ether and dichloromethane,
and freely soluble in anhydrous formic acid (Parfitt, 1999). Commercially sold under
trade names such as Eskazole, Valbazen, Zentel, Zenteland, Albenza and Proftril
(Budavari, 1989; Campbell, 1990). Present in both the Chinese and US pharmacopoeias
(Parfitt, 1999). CAS-54965-21-8.

CHAPTER 2 __________________________________________________________________________________________________________
49
2.1.2.3.2. Metabolism
Placement of a sulfur atom in the benzimidazole side chain has a major effect on
metabolism (Gottschall et al., 1990). The most important biotransformations are
sulphur oxidation, oxidation and carbamate hydrolysis (Gyurik et al., 1981). Oxidation
to the sulfone is the primary metabolic reaction, with further metabolism of the sulfone
by oxidation and carbamate hydrolysis (Figure 2.4). ABZ is metabolised to ABSO in
the presence of microsomal flavin-containing monooxygenase and/or cytochrome P-
450. The degree of involvement of P-450 versus MFMO varies, both between species
and between tissues, depending on enzyme concentrations. Unlike ABZ sulfoxidation,
the oxidation to ABSO2 has been exclusively attributed to cytochrome P-450. The
sulfoxide and sulfone metabolites dominate the plasma profile and are also found as the
major metabolites in the urine, although the exact proportion of each varies
considerably among species. However, in all species studied, ABZ itself was detected
in only trace amounts. Other minor metabolic pathways include aromatic hydroxylation,
and nitrogen and sulfur methylation. It was also determined that ABZ can induce its
own metabolism, by promoting cytochrome P-450 synthesis and activity. Since ABSO
has been implicated as both the active pharmacological and embryotoxic agent, enzyme
induction has the potential to influence both the efficacy and overall product safety.
More detailed reviews of ABZ metabolism can be obtained from Gyurik et al., (1981),
Galtier et al., (1986) and Gottschall et al., (1990).
2.1.2.3.3. Toxicity
The oral LD50 of ABZ in rats is 2.4 g kg-1 (Theodorides et al., 1976). Adverse effects
reported include epigastric pain, diarrhoea, nausea and vomiting, headache, dizziness
and rare allergic phenomena. With higher doses and prolonged use, abnormalities in
liver function, leucopenia and alopecia have also been reported (Davis et al., 1986;
Morris & Smith, 1987; Horton, 1989; Teggi et al., 1993). After very high oral doses
ABZ has also been shown to be teratogenic in rats and rabbits, and this effect is thought
to be associated with its antimicrotubular activity (McKellar & Scott, 1990) (See
further discussion in Chapter 7). Both ABZ and ABSO exhibit embryotoxicity, but as
the plasma concentrations of ABZ are negligible, embryotoxicity has been associated
with the ABSO. Therefore ABZ should not be used in the first trimester of pregnancy
(Delatour et al., 1981; de Silva et al., 1997). Adverse affects are rare at the dosages used

CHAPTER 2 __________________________________________________________________________________________________________
50
for the treatment of nematode infections. The proposed dose rate in humans is 400 mg
day-1, which is considerably less than both the teratogenic and toxic dose (Bogan &
Marriner, 1984). However, higher doses over extended periods of time are given for
neurocysticercosis and hydatidosis (400mg twice daily with meals), with manufacturers
recommending monitoring of liver function and WBC counts during treatment cycles
(Smith et al., 1997).
Figure 2.4: The main metabolic pathways for ABZ (modified from Gyurik et al., 1981).
N
NS
H
NHCO2CH3Albendazole
N
NS
H
O
NHCO2CH3Albendazole Sulfoxide
Albendazole Sulfone (inactive)
N
NS
H
O
O NH2
2-aminosulfone (inactive)
N
NS
H
O
O NHCO2CH3
N
NS
H
O
O NHCO2CH3
OH
N
NS
H
O
O NHCO2CH3
OH
Microsomal flavin containing monooxygenase
Cytochrome P-450
Hydrolysis
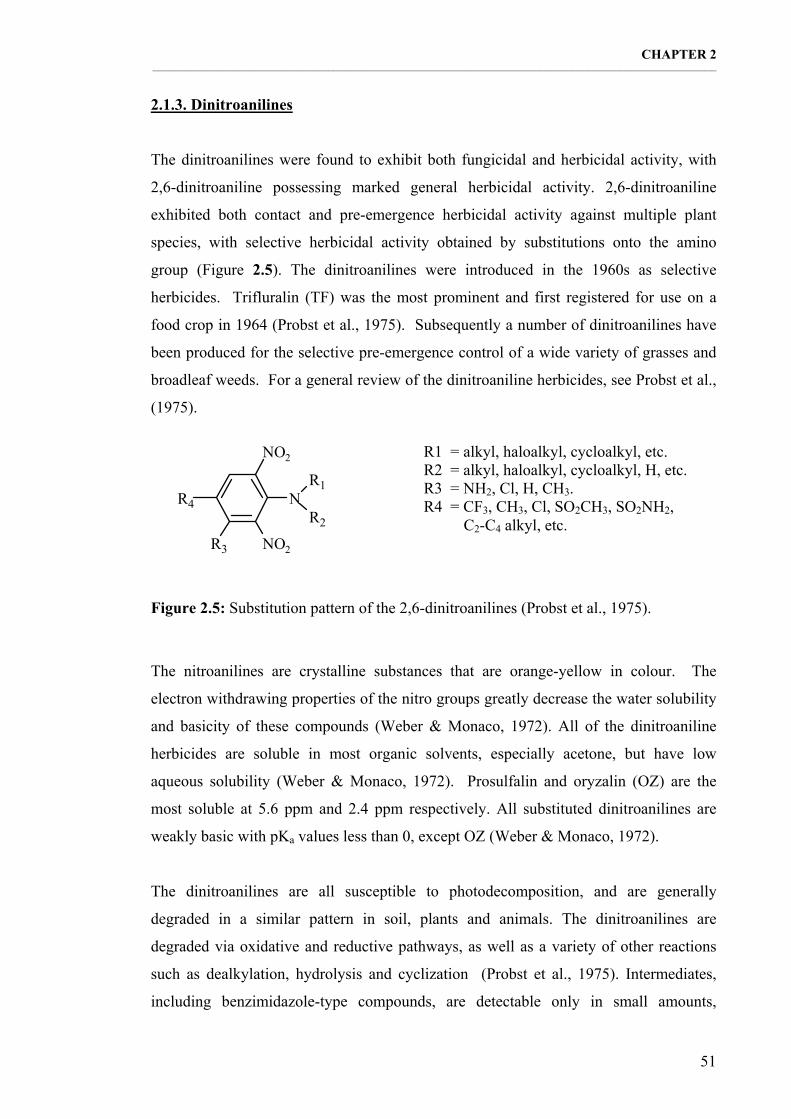
CHAPTER 2 __________________________________________________________________________________________________________
51
2.1.3. Dinitroanilines
The dinitroanilines were found to exhibit both fungicidal and herbicidal activity, with
2,6-dinitroaniline possessing marked general herbicidal activity. 2,6-dinitroaniline
exhibited both contact and pre-emergence herbicidal activity against multiple plant
species, with selective herbicidal activity obtained by substitutions onto the amino
group (Figure 2.5). The dinitroanilines were introduced in the 1960s as selective
herbicides. Trifluralin (TF) was the most prominent and first registered for use on a
food crop in 1964 (Probst et al., 1975). Subsequently a number of dinitroanilines have
been produced for the selective pre-emergence control of a wide variety of grasses and
broadleaf weeds. For a general review of the dinitroaniline herbicides, see Probst et al.,
(1975).
Figure 2.5: Substitution pattern of the 2,6-dinitroanilines (Probst et al., 1975).
The nitroanilines are crystalline substances that are orange-yellow in colour. The
electron withdrawing properties of the nitro groups greatly decrease the water solubility
and basicity of these compounds (Weber & Monaco, 1972). All of the dinitroaniline
herbicides are soluble in most organic solvents, especially acetone, but have low
aqueous solubility (Weber & Monaco, 1972). Prosulfalin and oryzalin (OZ) are the
most soluble at 5.6 ppm and 2.4 ppm respectively. All substituted dinitroanilines are
weakly basic with pKa values less than 0, except OZ (Weber & Monaco, 1972).
The dinitroanilines are all susceptible to photodecomposition, and are generally
degraded in a similar pattern in soil, plants and animals. The dinitroanilines are
degraded via oxidative and reductive pathways, as well as a variety of other reactions
such as dealkylation, hydrolysis and cyclization (Probst et al., 1975). Intermediates,
including benzimidazole-type compounds, are detectable only in small amounts,
R3
NO2
NO2
NR4
R1
R2
R1 = alkyl, haloalkyl, cycloalkyl, etc. R2 = alkyl, haloalkyl, cycloalkyl, H, etc. R3 = NH2, Cl, H, CH3. R4 = CF3, CH3, Cl, SO2CH3, SO2NH2,
C2-C4 alkyl, etc.

CHAPTER 2 __________________________________________________________________________________________________________
52
suggesting the rapid conversion to a mixture of polar products after the initial
degradation steps (Probst et al., 1975; Helling, 1976). In addition, as nitro groups are
strong hydrogen bonders, the nitroanilines are readily absorbed to proteinaceous
substances such as hair and skin (Weber & Monaco, 1972).
2.1.3.1. Mode of action
The primary mode of action of the dinitroanilines against plants is via tubulin
antagonism (Bartels & Hilton, 1973; Hess & Bayer, 1974; Struckmeyer et al., 1976;
Parka & Soper, 1977; Upadhyaya & Nooden, 1978). OZ has been used as a model
dinitroaniline due to its higher aqueous solubility, and has been found to bind to tubulin,
but not intact microtubules (Strachan & Hess, 1983). This causes rapid dissociation of
dimers from the microtubule both in vitro and in vivo (Bajer & Molè-Bajer, 1986;
Morejohn et al., 1987). These drugs have also been found to affect Ca2+ transport, but
at significantly higher concentrations (Hertal et al., 1980; Bajer & Molè-Bajer, 1986).
The dinitroanilines have different affinity for tubulin from different organisms, and
appear to have little effect on mammalian microtubules. Recently the microtubules of
certain parasites have been found susceptible to the dinitroanilines, and this finding has
lead to the suggestion that the dinitroanilines may be used for the chemical control of
these parasites. Leishmania, Toxoplasma gondii, Cryptosporidium parvum and malaria
are protozoan parasites that have been found to be susceptible to the dinitroanilines
(Chan et al., 1993a and b; Stokkermans et al., 1996; Arrowood et al., 1996; Bell, 1998;
Benbow et al., 1998; Armson et al., 1999b).
2.1.3.2. Resistance
Although the dinitroanilines have been used extensively and in a sustained manner, only
a few examples of herbicide resistance in weeds have been recorded. The development
of dinitroaniline resistance is rare, but once established in the natural population,
spreads rapidly. Resistance appears to be inherited as a single nuclear recessive gene,
but there is evidence of semi-dominance as heterozygous plants also have a degree of
resistance. The molecular basis for the resistant phenotype is a mutation in α-tubulin
(Anthony et al., 1998). As the development of resistance to other anti-microtubule

CHAPTER 2 __________________________________________________________________________________________________________
53
agents from mutations in either α- or β-tubulin has resulted in either resistance or super
sensitivity of the organism to the dinitroanilines, it is proposed that these mutations
might form part of the dinitroaniline-binding site, with the mechanism for resistance due
to increased microtubule stability rather than alteration in a specific drug-binding site.
For a review on the dinitroaniline mode of action and herbicide resistance, see Anthony
& Hussey, (1999).
2.1.3.3. Trifluralin
TF is a soil-incorporated herbicide that controls a variety of grasses and broadleaf
weeds (not established weeds) and was first marketed for use on cotton in 1963
(Helling, 1976). Tolerant crops include soybeans, cotton, sugarcane, various bean and
pea crops, safflower, rape seed, sugar beet, cantaloupes, sunflower, potato, nuts,
established alfalfa, wheat, as well as some fruits, vegetables and ornamentals (Tepe &
Scroggs, 1967; Helling, 1976). TF was initially considered as the model for
dinitroaniline herbicide studies, but due to its very low water solubility and its capacity
to bind to glass, this needed to be re-evaluated. It was therefore recommended that OZ
be considered as the model dinitroaniline for in vitro studies as OZ concentrations
remain constant in aqueous solutions (Strachan & Hess, 1982).
2.1.3.3.1. Characteristics
TF (Figure 2.6) is a yellow-orange crystal with a MW of 335.29 (C13H16F3N3O4) and a
mp of 46-47°C (Budavari, 1989). It is freely soluble in acetone, chloroform, acetonitrile,
toluene and ethyl acetate, and is practically insoluble in water (<0.05 ppm) (Tepe &
Scroggs, 1967; Weber & Monaco, 1972; Tomlin, 1994). The compound is
commercially sold as a herbicide under trade names such as Treflan, Triflurex, Olitref,
Tri-4, Trigard, Triplen, Tristar and Zeltoxone (Budavari, 1989; Tomlin, 1994). CAS-
1582-09-8. The ultraviolet absorption of dilute methanolic solutions exhibits maxima at
275 and 376µm (Tepe & Scroggs, 1967).

CHAPTER 2 __________________________________________________________________________________________________________
54
Figure 2.6: Structure of trifluralin (Budavari, 1989).
2.1.3.3.2. Degradation
In soil, plants and animals, TF is extensively and rapidly degraded by N-dealkylation,
nitro reduction, aliphatic hydroxylation and cyclization (Figure 2.7), resulting in the
continuous accumulation of a heterogeneous mixture of polar products (Emmerson &
Anderson, 1966; Probst et al., 1967; Golab et al., 1969; Erkog & Menzer, 1985). In
comparison, photodecomposition mainly involves N-dealkylation, nitro reduction and
cyclization (Leitis & Crosby, 1974). Following oral administration, TF is poorly
absorbed and extensively metabolised within the gut, with complete elimination in the
urine and faeces (up to 80%). Low tissue residues are also observed following oral
administration (Golab et al., 1969; Erkog & Menzer, 1985). With increasing dose size,
the proportion of TF and metabolites excreted in the faeces increases, indicating
saturation of TF absorption and urinary excretion systems (Erkog & Menzer, 1985).
While the majority of TF metabolites are unidentified polar compounds, the principal
identifiable metabolites in faeces result from nitro reduction, and in urine from nitro
reduction and N-dealkylation (Emmerson & Anderson, 1966; Golab et al., 1969). In
vitro the predominant metabolic pathway is aliphatic hydroxylation and N-dealkylation
(Nelson et al., 1977). However, the number of metabolites and significance of the
various pathways varies with dose size (Erkog & Menzer, 1985). Conjugation reactions
have also been reported, as well as the production of benzimidazoles through N-
dealkylation and cyclization reactions (Nelson et al., 1977; Erkog & Menzer, 1985).
NO2
NO2
NF3CCH2CH2CH3
CH2CH2CH3

CHAPTER 2 __________________________________________________________________________________________________________
55
Figure 2.7: Three pathways for TF metabolism are nitro reduction, N-dealkylation and
hydroxylation. Intermediates of these processes are common, such as (8), resulting
from both nitro reduction and N-dealkylation. These metabolites often undergo further
metabolism, such as (9), resulting from oxidative dealhylation of the reduced drug,
ultimately producing a benzimidazole (Emmerson & Anderson, 1966; Erkog & Menzer,
1985; Golab et al., 1969; Nelson et al., 1977).
N
CF3
NO2O2N
H7C3 C3H7
N
CF3
NH2O2N
H7C3 C3H7
N
CF3
NH2NH2
H7C3 C3H7
N
CF3
NO2O2N
H C3H7NH2
CF3
NO2O2N
N
CF3
NO2O2N
H7C3 CH2CH(OH)CH3
N
CF3
NO2O2N
H7C3 CH2CH2CH2OH
Nitro reduction
N-dealkylation
HydroxylationOR
TRIFLURALIN
NH2
CF3
NH2NH2
1
2 3
4 5
6 7
8 9
NNO2N
CF3
CH2CH3HFurther Metabolism

CHAPTER 2 __________________________________________________________________________________________________________
56
Parenteral TF administration results in the accumulation of TF and its metabolites in fat.
This is particularly so for fat at the site of administration, where TF may be localized
(Emmerson & Anderson, 1966; Golab et al., 1969; Heck et al., 1977). Heck et al.,
(1977) also found that i.p. administered TF was not detectable in most plasma samples
and suggested that TF was strongly tissue bound. The oral route of administration
results in relatively little systemic absorption of the unchanged herbicide, while
parenteral studies reveal that once absorbed, the compound and its metabolites may
persist in fat for lengthy periods of time.
2.1.3.3.3. Toxicity
Due to the extensive use of TF as a herbicide, the toxicology of TF has been extensively
studied and reviewed (Robens, 1980; Ebert et al., 1992; Byrd et al., 1995). TF has a low
acute toxicity in rats, mice and dogs, with LD50 values of approximately 2, 5 and >10 g
kg-1 respectively (Ebert et al., 1992). However age is an important factor, with an oral
LD50 in 1-2 day old rats of 500 mg kg-1, while in 49-56 day old rats the LD50 is 36.5 g
kg-1 (Goldenthal, 1971). Adverse effects observed in rats and mice included motorial
activity, squatting, bristled fur, abdominal position, passivity, trembling, mydriasis,
exophthalmos and increased lacrimation (Ebert et al., 1992). In subchronic studies,
depression of body weight and food consumption, and alopecia was observed (Byrd et
al., 1995). In addition, a yellowish to orange-brown discolouration of the urine and
abdominal fatty tissue was observed (Ebert et al., 1992; Byrd et al., 1995). The main
target organs for TF toxicity are red blood cells and to a lesser extent, the liver, which
was reversible after a two-week recovery period (Ebert et al., 1992). In developmental
studies, TF also resulted in the depression of body weights in both mothers and foetuses
(Ebert et al., 1992; Byrd et al., 1995). However, no interference with fertility,
reproductive performance, gestation, lactation, growth or maturation were noted, and no
teratogenic effect was observed (Ebert et al., 1992). Long-life feeding with TF at levels
that caused marked decreases in body weights and anaemia did not produce a general
increase in tumours and indicated no carcinogenic effects (when free of nitrosamines)
(Ebert et al., 1992). While some studies have shown TF to be carcinogenic, this has
been attributed to the contaminant dipropylnitrosamine, which is a liver, oesophagus
and tongue carcinogen (Robens, 1980).

CHAPTER 2 __________________________________________________________________________________________________________
57
2.1.3.4. Oryzalin
The herbicidal properties of OZ were first reported in 1969. The compound is used to
control most annual grasses and broad leaf weeds such as carpetweed, purslane,
lambsquarters and pigweed. Tolerant crops include soybean, cotton, fruit trees, nut
trees, peanuts, oilseed rape, sunflowers, alfalfa, peas, sweet potato, mint and
ornamentals (Decker & Johnson, 1976; Tomlin, 1994).
2.1.3.4.1. Characteristics
OZ (Figure 2.8) is a yellow-orange crystal with a MW of 346.36 (C12H18N4O6S), mp of
137-138°C and pKa of 9.4 (Budavari, 1989; Tomlin, 1994). It is soluble in acetone,
ethanol, methanol and acetonitrile, slightly soluble in benzene, and insoluble in hexane.
Its aqueous solubility at 25°is 2.5 ppm (Budavari, 1989), and it is commercially sold as
a herbicide under trade names such as Dirimal, Ryzelan and Surflan (Decker &
Johnson, 1976; Budavari, 1989). CAS-19044-88-3. The ultraviolet absorption of dilute
methanolic solutions exhibits maxima at 283 and 383µm (Decker & Johnson, 1976).
Figure 2.8: Structure of OZ (Budavari, 1989).
OZ exhibits acidic properties, being highly soluble in alkaline solutions and titratable
with a strong base in a non-aqueous media (Decker & Johnson, 1976). The higher
water solubility and weakly acidic properties of OZ are thought to result from the
substitution of the slightly ionisable aminosulfonyl group at R4 (Weber & Monaco,
1972). OZ is also one of the least volatile dinitroanilines, due to the sulfonyl at R4
(Helling, 1976).
NO2
NO2
NO2S
CH2CH2CH3
CH2CH2CH3
H2N

CHAPTER 2 __________________________________________________________________________________________________________
58
2.1.3.4.2. Degradation and toxicity
Despite the extensive use of OZ as a herbicide, there are few published reports on the
absorption, metabolism or elimination of OZ in animals. As OZ and TF share similar
chemical structures (except at R4), it is susceptible to the same degradation reactions in
sunlight, soil, plants and animals (Section 2.1.3.3.2) (Golab et al., 1975; Helling, 1976).
Additional reactions involving the R4 group include its conversion from a sulfonamide
(-SO2NH2) to sulfanilic acid (-SO3H) (Golab et al., 1975). Oral administration of OZ
results in the elimination of OZ and its metabolites from the body within 72 hours in the
faeces and urine (Tomlin, 1994). Plasma concentrations of OZ are low and has been
attributed to either poor drug absorption or first pass metabolism (Dvorakova et al.,
1997). Following oral and i.p. administration, OZ is metabolised in the liver to its
major metabolite, N-depropyl oryzalin, which is cleared from the body more rapidly
than the parent compound (Dvorakova et al., 1997).
OZ has a low acute toxicity, with an LD50 in adult rats and gerbils of greater than 10
g kg-1 (Decker & Johnson, 1976) and in cats and dogs, 1 and >1 g kg-1 respectively
(Tomlin, 1994). In addition, dermal and optical exposure of rats, and subchronic doses
in dogs caused no adverse effects. OZ has been identified as an inhibitor of mitogen
and growth factor-mediated intracellular free Ca2+ signalling in mammalian cells
(Dvorakova et al., 1997; Powis et al., 1997). Subsequently, OZ was revealed to exhibit
anti-tumour activity in vitro and in vivo. N-depropyl oryzalin also revealed similar anti-
tumour activity to the parent compound in vitro. However, the anti-tumour activity of
OZ and its major metabolite was not observed against established tumours in vivo
(Powis et al., 1997).
2.1.4. Improving drug efficacy through formulation design
With the development of resistance to the current chemical classes of broad-spectrum
anthelmintics, and the absence of a new effective class of antiparasitic agents on the
horizon, existing drugs must be used more efficiently (Section 1.1). While
benzimidazole resistance is developing, numerous techniques are available to restore
efficacy. As the benzimidazoles are rapidly metabolised and removed from the body,
increased efficacy can be achieved with increased systemic duration as well as increased

CHAPTER 2 __________________________________________________________________________________________________________
59
systemic concentration (Waller, 1990; Hennessy, 1997). In addition, the efficacy of
ABZ against systemic parasite infections such as hydatid disease and neurocysticercosis
would be vastly improved. The low water solubility and poor absorption of ABZ from
the gastrointestinal tract results in low bioavailability and reduced efficacy against
systemic parasites. In the absence of new and improved anti-hydatid drugs, the focus
has been on increasing ABZ solubility and absorption from the gastrointestinal tract,
improving ABZ transport and targeting, and altering ABZ pharmacokinetics by
modulation of the metabolic decomposition of benzimidazoles. Examples of the
techniques applied to achieve these goals can be found in Kwan et al., (1988), Lange et
al., (1988), Jung et al., (1990), Lanusse & Prichard, (1991 and 1992), Yang & Fung,
(1991), Barger et al., (1992), del Estal et al., (1993), Justel et al., (1994), New et al.,
(1994), Rodrigues et al., (1995), Wen et al., (1994, 1996a and b), Torrado et al., (1996a,
b and 1997), Hussar, (1997), Sarciron et al., (1997), Domínguez et al., (1998), Redondo
et al., (1998) and Savio et al., (1998). In a similar manner, these techniques can be
applied to other insoluble and poorly absorbed compounds such as the dinitroanilines.
2.1.5. Aim
The purpose of this investigation is to formulate the antiparasitic agents albendazole,
trifluralin and oryzalin with ΗPβCD by forming inclusion compounds, with a view to
provide an alternative oral formulation, and to potentially formulate these agents in
parenteral forms. This will involve:
1. Formulating inclusion compounds between these agents and ΗPβCD.
2. Increasing drug solubility using techniques such as temperature and pH
manipulation.
3. Investigation of the formation of inclusion compounds using DSC-TGA
analysis.

CHAPTER 2 __________________________________________________________________________________________________________
60
2.2. METHODS
2.2.1. Phase-solubility analysis
In solution an inclusion compound is always in kinetic or thermodynamic equilibrium
with its free components, with this equilibrium expressed by the stability constant (KC).
Phase solubility (Section 1.6.1) analysis allows the study of the dependence of guest
solubility on CD concentration, and may be used to determine the stability constant of
the complex. The KC was determined as described by Higuchi & Connors, (1965) and
Grant & Higuchi, (1990) from the slope and the intercept SO (in M-1) of equilibrium
plots according to the following equation:
slope)-(1[S]Slope = K
0
1:1
The molecular weight of ΗPβCD was calculated as described in section 1.5.1 (See
Appendix 10.1).
2.2.2. Albendazole/ΗPβCD complex formulation
2.2.2.1. HPLC conditions
The HPLC system consisted of a GBC HPLC pump (model LC 1120) and a Rheodyne
valve injector (model 7125) fitted with a 20 µL loop. The chromatography was carried
out using a 300 x 3.9 mm Phenomemex (Torrence USA) Bondclone 10 µm C18 reverse
phase column. Detection of ABZ was carried out using a GBC UV/Vis detector (model
1200) at a wavelength of 295 nm (UV spectrum figure 2.9). The chromatography was
recorded using a Hewlett Packard integrator (model 3396 A) and the peak area was
integrated. The mobile phase consisted of 40% tetrahydrofuran, 1% formic acid and
59% water (v/v/v) filtered through Millipore filters (0.45 µm, type FHUP). The
retention time for ABZ was 3.8 min with a flow rate of 1.5 mL min-1 (Figure 2.10).
ABZ was quantified using a calibration curve.

CHAPTER 2 __________________________________________________________________________________________________________
61
2.2.2.2. Detection and quantitation limits
The limit of detection (LOD) for ABZ was calculated at three times the baseline noise
and was 15 ng mL-1. The limit of quantitation (LOQ) was calculated at five times the
baseline noise and was 20 ng mL-1. These are standard procedures for determining the
LOD and LOQ.
Figure 2.9: UV spectrum of ABZ (10 µg mL-1) in DMSO/methanol (0.5:99.5 v/v).
Figure 2.10: Chromatogram of ABZ (10µg mL-1 Att. 7), mobile phase consisted of
40% tetrahydrofuran, 1% formic acid and 59% water (v/v/v).
250 260 270 280 290 300 310 320 330 340 350
0.0
0.1
0.2
0.3
0.4
0.5
0.6
— L 295 = 0.4968
Wavelength (nm)

CHAPTER 2 __________________________________________________________________________________________________________
62
2.2.2.3. ABZ/ΗPβCD complex formation analysis
Phase solubility analysis of ABZ and ΗPβCD was carried out by equilibrating excess
ABZ in 10 mL solutions of between 1-10% ΗPβCD (w/v) in triplicate in borosilicate
tubes. The samples were then incubated in a Lab-Line orbit incubator-shaker (model
3529-1) at 25˚C for two days before the samples were filtered (Gelman GHP 25 mm
acro disc), diluted appropriately with mobile phase, and 20 µL then submitted for HPLC
analysis. ABZ was quantified by a calibration curve.
The effect of temperature and filtration on ABZ concentration was investigated by
dissolving ABZ (100µg mL-1) in 6% ΗPβCD (w/v), followed by filtration or incubation
at 37˚C, 42˚C and 45˚C and 121˚C (autoclave). Treated samples were subsequently
compared to the original sample.
The ABZ/ΗPβCD complex concentration needed to be amplified for biological
experiments. Therefore excess ABZ was added to a 20 mL solution of 74% ΗPβCD
(w/v) in water and incubated at 35˚C for seven days before gentle filtration (0.2µm). A
sample was diluted with mobile phase and analysed as above. The ABZ/ΗPβCD
solution was stored at 4˚C and the concentration was checked before all experiments to
ensure its stability.
2.2.2.4. Effect of pH on ABZ solubility
To determine the effect of pH on ABZ solubility, excess ABZ was added to 10 mL
solutions of 50 mM phosphate buffer at pH's 1.2-10 (n=2) in borosilicate tubes. The
samples were then rotated on a rotary mixer (Selby) at room temperature for two days
before the samples were filtered (0.45µm) and pH determined. Samples were diluted
appropriately with mobile phase and analysed as above.
2.2.2.5. Effect of pH on ABZ/ΗPβCD complex formation
Buffer selection was based on the amount of interference with spectrophotometry,
effectiveness in the pH ranges being investigated and in vivo toxicity (Perrin &

CHAPTER 2 __________________________________________________________________________________________________________
63
Dempsey, 1974; Yalkowsky, 1999). Excess ABZ was added to 10 mL samples of 0, 10
and 20% ΗPβCD (w/v) solutions made up in 50 mM phosphate buffer or 50 mM citric
acid buffer at pH 2, 2.5 and 3. Samples were rotated on a rotary mixer (Selby) at 35˚C
and ABZ added until samples contained excess ABZ. Once achieved the samples were
incubated at room temperature for two days before samples were filtered, pH
determined, and analysed as above.
After optimisation of buffer strength, the above was repeated at between 0-50% ΗPβCD
(w/v) at pH 2 (500 mM phosphate buffer). After determination of pH samples were
analysed as above.
For in vivo experimentation, the ABZ/ΗPβCD complex was made up in 100 mL 60%
ΗPβCD (w/v) in 200mM phosphate buffer (pH 2.1) and incubated at 35˚C for one week
before filtration. After measurement of pH, ABZ concentration was determined as
above. The ABZ/ΗPβCD solutions were stored at 4˚C and the concentration checked
before all biological experiments to ensure their stability.
2.2.3. Trifluralin/ΗPβCD complex formulation
2.2.3.1. HPLC conditions
The HPLC system was as described for ABZ (Section 2.2.2.1). The chromatography
was carried out using a 150 x 3.9 mm Waters Nova Pak C18 reverse phase column and
detection of the TF was carried out at a wavelength of 273 nm (UV spectrum Figure
2.11). The mobile phase consisted of 65% acetonitrile and 35% water (v/v) filtered
through 0.45 µm filters. The retention time for TF was 4.3 min with a flow rate of 2 mL
min-1 (Figure 2.12). TF was quantified by a calibration curve.
2.2.3.2. Detection and quantitation limits
The LOD of TF was calculated at three times the baseline noise and was 15 ng mL-1.
The LOQ was calculated at five times the baseline noise and was 25 ng mL-1.
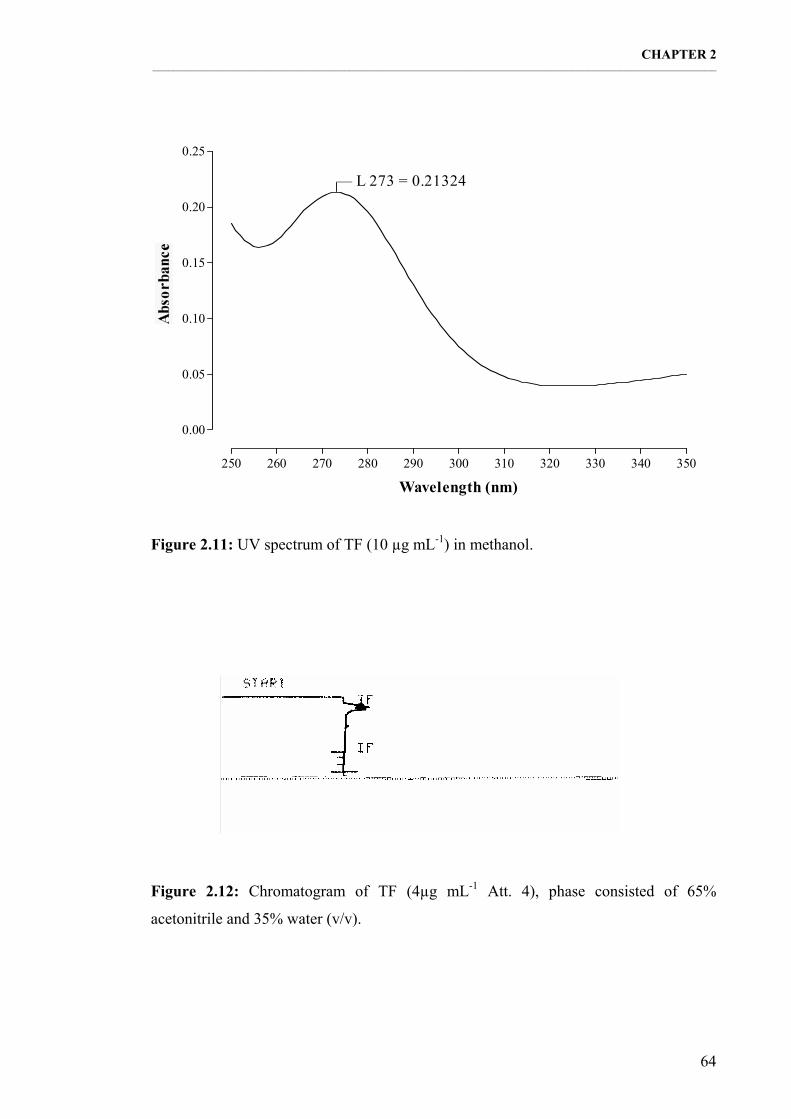
CHAPTER 2 __________________________________________________________________________________________________________
64
Figure 2.11: UV spectrum of TF (10 µg mL-1) in methanol.
Figure 2.12: Chromatogram of TF (4µg mL-1 Att. 4), phase consisted of 65%
acetonitrile and 35% water (v/v).
250 260 270 280 290 300 310 320 330 340 350
0.00
0.05
0.10
0.15
0.20
0.25
— L 273 = 0.21324
Wavelength (nm)

CHAPTER 2 __________________________________________________________________________________________________________
65
2.2.3.3. Measurement of TF
The effects of glass, plastic, light, filtration and methanol concentration on TF
availability were investigated. A 1 µg mL-1 TF sample in 10% methanol and added to
both borosilicate tubes and plastic centrifuge tubes wrapped in alfoil, borosilicate tubes
left in light, and compared to TF samples (1 µg mL-1) dissolved in 40% and 70%
methanol wrapped in alfoil. All samples were rotated on a rotary mixer for up to 5 h.
Methods devised for the measurement of TF were also used for the measurement of OZ.
2.2.3.4. TF/ΗPβCD complex formation
Phase solubility analysis of TF and ΗPβCD was carried out by incubating excess TF
was added to 10 mL solutions of between 2-10% ΗPβCD (w/v) in triplicate in
borosilicate tubes wrapped in alfoil. The samples were then incubated in a Lab-Line
orbit incubator-shaker at 25˚C for two days after which the samples were centrifuged at
2000 g for 10 min. A sample was then added to equal volumes of 50% methanol and 20
µL submitted for HPLC analysis using a glass syringe. TF was quantified by a
calibration curve.
The TF/ΗPβCD complex concentration needed to be amplified for drug experiments.
Therefore excess TF was added to a 10 mL solution of 75% ΗPβCD (w/v) in water and
incubated at 35˚C for two days before centrifugation at 2000 g for 10 min. A sample
was diluted appropriately with 50% methanol and analysed as above. The TF/ΗPβCD
solution was stored at 37˚C and the concentration was checked before all experiments to
ensure its stability.
2.2.3.5. Effect of pH on TF solubility
To determine the effect of pH on TF solubility, excess drug was added to 10 mL
solutions of 50 mM phosphate buffer (pH 4-10) (n=1) in borosilicate tubes wrapped in
alfoil. The samples were then rotated on a rotary mixer at room temperature for two
days before the samples were centrifuged at 2000 g for 10 min. Samples were analysed
as above.

CHAPTER 2 __________________________________________________________________________________________________________
66
2.2.4. Oryzalin /ΗPβCD complex formulation
2.2.4.1. HPLC conditions
The HPLC system was as described in section 2.2.2.1. Detection of the OZ was carried
out at a wavelength of 282 nm (UV spectrum figure 2.13) and the mobile phase
consisted of 50% acetonitrile and 50% water (v/v) filtered through 0.45 µm filters. The
retention time for OZ was 3.2 min (Figure 2.14) with a flow rate of 2 mL min-1. For pH
experiments the mobile phase was 50% acetonitrile and 50% 100 mM phosphate buffer
pH 3 (v/v), with a retention time of 3 min (Figure 2.15). OZ was quantified by a
calibration curve.
2.2.4.2. Detection and quantitation limits
The LOD of OZ was calculated at three times the baseline noise and was 10 ng mL-1.
The LOQ was calculated at five times the baseline noise and was 15 ng mL-1.
2.2.4.3. OZ/ΗPβCD complex formation
Phase solubility analysis of OZ and ΗPβCD, and the OZ/ΗPβCD formulation for in
vitro experiments was determined as described for TF (Section 2.2.3.4).
The effect of autoclaving on OZ/ΗPβCD complex formation/degradation was
investigated by analysis of an OZ/ΗPβCD solution in 10% ΗPβCD (w/v) before and
after autoclaving. Excess OZ in 75% ΗPβCD (w/v) was also autoclaved to determine
the maximum OZ concentration achievable. Samples were analysed as above.
2.2.4.4. Effect of pH on OZ solubility
The effect of pH on the solubility of OZ was determined at pH 2-12 (n=2), as described
for TF (Section 2.2.3.5). Drug concentration was determined as above.

CHAPTER 2 __________________________________________________________________________________________________________
67
Figure 2.13: UV spectrum of OZ (10 µg mL-1) in methanol.
Figure 2.14: Chromatogram of OZ (50µg mL-1 Att. 9), mobile phase consisted of 50%
acetonitrile and 50% water (v/v).
Figure 2.15: Chromatogram of OZ (10µg mL-1 Att. 7), mobile phase consisted of 50%
acetonitrile and 50% 100 mM phosphate buffer pH 3 (v/v).
250 260 270 280 290 300 310 320 330 340 350
0.0
0.1
0.2
0.3
0.4
— L 282 = 0.31201
Wavelength (nm)

CHAPTER 2 __________________________________________________________________________________________________________
68
2.2.4.5. Effect of pH on OZ/ΗPβCD complex formation
Solubility studies were carried out over varying pH and ΗPβCD concentrations. Excess
OZ was added to 10 mL samples of 0, 10 and 20% ΗPβCD (w/v) solutions made up in
50 mM phosphate buffer or 100 mM phosphate buffer at pH's 10.5, 11, 11.5, 12 and
12.5. Initial samples were rotated on a rotary mixer (in alfoil) at 35˚C and OZ added
until samples contained excess OZ. Once achieved the samples were incubated at room
temperature for two days before samples were centrifuged at 2000g for 10 min and pH
determined. Samples were diluted appropriately with 50% methanol and analysed as
above. As both ΗPβCD and OZ were found to decrease pH once added to solutions,
buffer strength needed to be increased. However, buffer solubility decreased with
increasing ΗPβCD concentration at high pH values. Therefore a maximal buffer
strength was selected for the requirements of each experiment.
To further investigate the interaction between OZ and ΗPβCD, excess OZ was added to
3 mL samples of 0-30% ΗPβCD (w/v) solutions made up in 500 mM phosphate buffer
at pH 11.4. Samples were incubated at 35˚C for 1 week followed by 2 days incubation
at room temperature. Samples were centrifuged before dilution with 50% methanol and
analysed as above.
For in vivo experimentation, the OZ/ΗPβCD complex was made up in 20 mL 60%
ΗPβCD (w/v) in 200mM phosphate buffer (pH 11.2) and incubated at 35˚C for two
days (in alfoil) before centrifugation at 2000 g for 10 min. The final pH was determined
before samples were diluted with 50% methanol and analysed as above. The
OZ/ΗPβCD solutions were autoclaved, cooled to 37˚C, and the concentration checked
before all biological experiments to ensure stability.
2.2.5. Verification of complex formation
Complex formation was assessed by Differential Scanning Calorimetry (DSC) and
Thermogravimetry Analysis (TGA) (Section 1.6.2). Analysis was carried out using a
SDT 2960 Simultaneous DSA-TGA (TA Instruments) with the software Instrument
Analysis: Thermal Solutions (Version 1.4E) and Universal Analysis for Windows

CHAPTER 2 __________________________________________________________________________________________________________
69
95/98/NT (Version 2.5) (TA Instruments, Release Version 2.5). The temperatures
ranged from 17˚C to 600˚C with a heat flow of 10˚C/min for ABZ and OZ, and 5˚C/min
for ΗPβCD and drug/ΗPβCD complexes.
2.2.6. Glassware
All glassware used in drug analysis was cleaned with water and methanol to remove
excess drug and ΗPβCD. The glassware was then soaked in chromic acid for a
minimum of two hours before rinsing in Millipore water.
2.2.7. Statistical analysis
Data analysis was carried out using linear regression, non-linear regression (exponential
growth or sigmoidal dose response curves) or one way ANOVAs with Bonferinni’s post
test as appropriate, as indicated in the results. Analysis was performed using GraphPad
Prism version 3.0a for Macintosh, GraphPad Software, San Diego California USA.

CHAPTER 2 __________________________________________________________________________________________________________
70
2.3. RESULTS 2.3.1. Albendazole/ΗPβCD complex formulation
2.3.1.1. Effect of ΗPβCD on ABZ solubility
ABZ was found to be practically insoluble in water, with approximately 0.29 µg mL
-1
ABZ dissolved. The solubility of ABZ increased linearly with ΗPβCD concentration,
corresponding to an AL phase diagram (linear regression, r=0.9997) (Figure 2.16). The
apparent stability constant (KC) was determined with the assumption that the complex
formed was of a 1:1 molar ratio of ABZ and cyclodextrin as described by Higuchi &
Connors, (1965) and Grant & Higuchi, (1990), and had a KC of 9940 M-1 at 25°C. A
10% ΗPβCD (w/v) solution was capable of dissolving approximately 200 µg mL-1
ABZ, a 670 fold increase.
Figure 2.16: Solubility of ABZ in the presence of ΗPβCD after 48 h at 25˚C (mean ±
SE, n=3).
0 2 4 6 8 10
0
50
100
150
200
250
Hydroxypropyl-β-cyclodextrin (%)
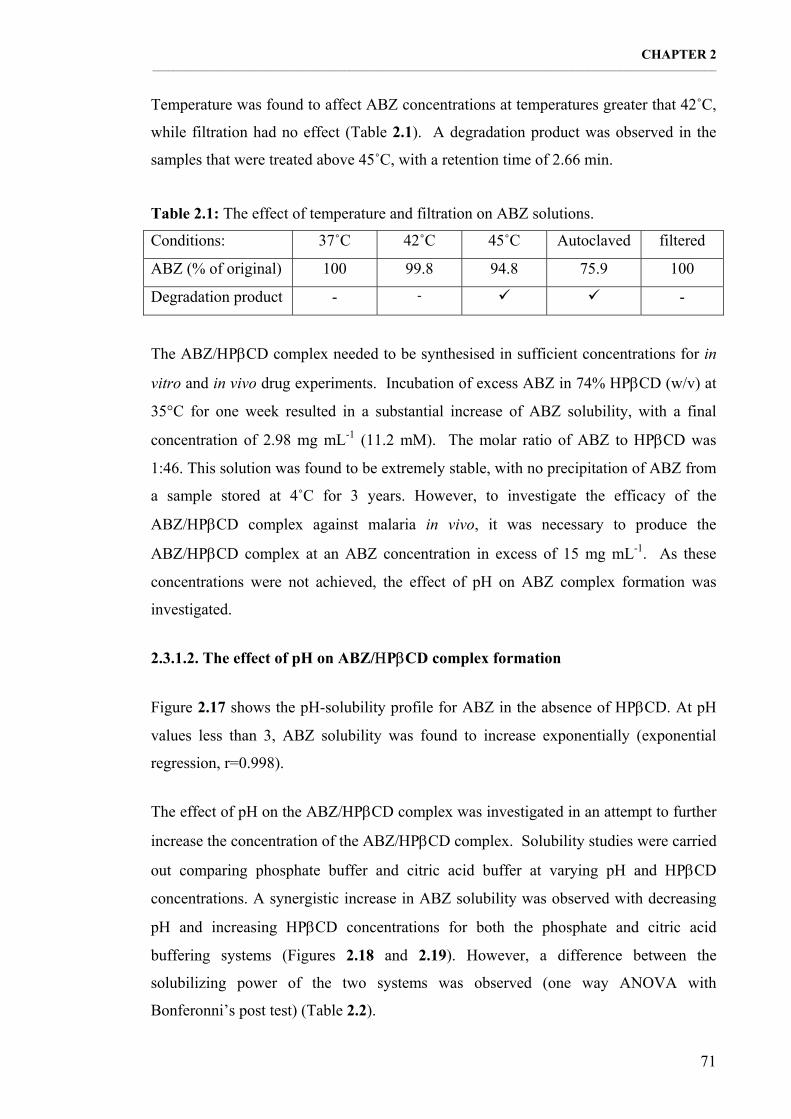
CHAPTER 2 __________________________________________________________________________________________________________
71
Temperature was found to affect ABZ concentrations at temperatures greater that 42˚C,
while filtration had no effect (Table 2.1). A degradation product was observed in the
samples that were treated above 45˚C, with a retention time of 2.66 min.
Table 2.1: The effect of temperature and filtration on ABZ solutions.
Conditions: 37˚C 42˚C 45˚C Autoclaved filtered
ABZ (% of original) 100 99.8 94.8 75.9 100
Degradation product - - -
The ABZ/ΗPβCD complex needed to be synthesised in sufficient concentrations for in
vitro and in vivo drug experiments. Incubation of excess ABZ in 74% ΗPβCD (w/v) at
35°C for one week resulted in a substantial increase of ABZ solubility, with a final
concentration of 2.98 mg mL-1 (11.2 mM). The molar ratio of ABZ to ΗPβCD was
1:46. This solution was found to be extremely stable, with no precipitation of ABZ from
a sample stored at 4˚C for 3 years. However, to investigate the efficacy of the
ABZ/ΗPβCD complex against malaria in vivo, it was necessary to produce the
ABZ/ΗPβCD complex at an ABZ concentration in excess of 15 mg mL-1. As these
concentrations were not achieved, the effect of pH on ABZ complex formation was
investigated.
2.3.1.2. The effect of pH on ABZ/ΗPβCD complex formation
Figure 2.17 shows the pH-solubility profile for ABZ in the absence of ΗPβCD. At pH
values less than 3, ABZ solubility was found to increase exponentially (exponential
regression, r=0.998).
The effect of pH on the ABZ/ΗPβCD complex was investigated in an attempt to further
increase the concentration of the ABZ/ΗPβCD complex. Solubility studies were carried
out comparing phosphate buffer and citric acid buffer at varying pH and ΗPβCD
concentrations. A synergistic increase in ABZ solubility was observed with decreasing
pH and increasing ΗPβCD concentrations for both the phosphate and citric acid
buffering systems (Figures 2.18 and 2.19). However, a difference between the
solubilizing power of the two systems was observed (one way ANOVA with
Bonferonni’s post test) (Table 2.2).

CHAPTER 2 __________________________________________________________________________________________________________
72
Figure 2.17: Effect of pH (50 mM phosphate buffer) on ABZ solubility after 2 days at
room temperature (mean ± SE, n=2).
20
CD (%)103.2
246
2.8
81012
2.4
pH
141618
2.0 1.6
Figure 2.18: Solubility of ABZ with varying pH and ΗPβCD concentrations (50 mM
citric acid, n=1).
1 2 3 4 5 6 7 8 9 10 11
0
50
100
150
200
250
300
350
400
450
500
pH
AB
Z (m
g m
L-1)
0

CHAPTER 2 __________________________________________________________________________________________________________
73
20
CD (%)103.2
246
2.8
81012
2.4
pH
1416
2.0
18
1.6
Figure 2.19: Solubility of ABZ with varying pH and ΗPβCD concentrations (50 mM
phosphate buffer, n=1).
Table 2.2: One way ANOVA of ABZ solubility, pH and ΗPβCD concentration.
Compared data (Bonferonni’s multiple comparison test)
Significantly different
Expected
Between 0, 10, 20% ΗPβCD data within each system Yes, p<0.001 Yes Between 0, 10, 20% ΗPβCD data between each system Yes, p<0.001 Yes Between equivalent data sets across each system
0:010:1020:20
No, p>0.05 No, p>0.05 Yes, p<0.01
Yes Yes No
As there was a significant difference observed between the two systems at a
concentration of 20% ΗPβCD, the data for the buffering systems could not be
amalgamated. Based on results of the ANOVA and figures 2.18 and 2.19, the phosphate
buffering system was seen to be the more successful system and hence subsequently
used in preference to the citric acid buffering system. To further investigate the
interactions between pH adjustment and ΗPβCD concentration, the data for the
phosphate buffering system was plotted as ABZ solubility at each ΗPβCD
concentration over varying pH (Figure 2.20). Again ABZ solubility was observed to
AB
Z (m
g m
L-1)
0

CHAPTER 2 __________________________________________________________________________________________________________
74
increase exponentially with decreasing pH at each ΗPβCD concentration. From the
above figures the expected ABZ solubility at 3 pH values over increasing ΗPβCD
concentrations were determined, all of which corresponded to AL phase diagrams
(Figure 2.21). From this it was estimated that a pH between 2-2.2 at ΗPβCD
concentrations of approximately 50-70% would be necessary to achieve an ABZ
concentration of 15 mg mL-1. To investigate this, the effect of pH on ABZ/ΗPβCD
complexation was further investigated at pH 2 (500mM phosphate buffer) over a range
of ΗPβCD concentrations at 35°C (Figure 2.22). The solubility of ABZ increased
linearly with ΗPβCD concentration, corresponding to an AL phase diagram (Linear
regression, r=0.991) and a KC of 1075 M-1.
For in vivo experimentation, a final solution of 16.2 mg mL-1 ABZ/ΗPβCD (60%
ΗPβCD (w/v), 200mM phosphate buffer) at pH 2.1 was formulated. The molar ratio of
ABZ to ΗPβCD was 1:7. This solution was found to be extremely stable, with no
precipitation of ABZ when stored at 4˚C.
Figure 2.20: Effect of pH (50 mM phosphate buffer) on solubility of ABZ in the presence of ΗPβCD after incubation for 1 w at 35˚C followed by 2 d at room temperature (n=1).
1.5 2.0 2.5 3.0
0
3
6
9
12
15
10% CD20% CD
0% CD
pH

CHAPTER 2 __________________________________________________________________________________________________________
75
Figure 2.21: Effect of ΗPβCD on the solubility of ABZ at different pHs (50 mM phosphate buffer) after incubation for 1 w at 35˚C followed by 2 d at room temperature (n=1).
Figure 2.22: Solubility of ABZ in the presence of ΗPβCD at pH 2 (500 mM phosphate buffer) after incubation for 1 w at 35˚C followed by 2 d at room temperature (mean ± SE, n=3).
0 5 10 15 20
0
3
6
9
12
15
pH 2.2pH 2.5
pH 1.7
Hydroxypropyl-ß-cyclodextrin (%)
0 10 20 30 40 50
0
5
10
15
20
25
Hydroxypropyl-ß-cyclodextrin (%)

CHAPTER 2 __________________________________________________________________________________________________________
76
2.3.2. Trifluralin/ΗPβCD complex formulation
2.3.2.1. Measurement of TF
The effect of glass, plastic, light, filtration and methanol concentration on TF
availability was investigated (1 µg mL-1 solution) (Figure 2.23). Methanol
concentrations above 40% dissolved 100% TF when in a glass vial. In comparison,
10% methanol solutions lost 18% of TF when incubated in glass vials, with an
additional 30% lost when incubated in glass exposed to daylight for 5 hours. In
addition, 10% methanol solutions lost 94% TF when filtered through 0.45µm Millipore
filters, and 91% TF when in a plastic vial.
2.3.2.2. Effect of ΗPβCD on TF solubility
TF was found to be practically insoluble in water, with approximately 0.18 µg mL-1
TF
dissolved. The solubility of TF increased linearly with ΗPβCD concentration,
corresponding to an AL phase diagram (linear regression, r=0.9973) (Figure 2.24). The
apparent stability constant was determined with the assumption that the complex formed
was of a 1:1 molar ratio of TF and cyclodextrin as described by Higuchi & Connors,
(1965) and Grant & Higuchi, (1990), and had a KC of 626 M-1 at 25°C. A 10% ΗPβCD
(w/v) solution was capable of dissolving approximately 7.9 µg mL-1 TF, a 45 fold
increase. Adjusting pH was found to have no effect on TF solubility.
The TF/ΗPβCD complex needed to be synthesised in sufficient concentrations for in
vitro drug experiments. Incubation of excess TF in 75% ΗPβCD (w/v) at 37°C for two
days resulted in a substantial increase of TF solubility, with a final concentration of 60
µg mL-1 (176 µM). The molar ratio of TF to ΗPβCD was 1:2945.

CHAPTER 2 __________________________________________________________________________________________________________
77
Figu
re 2
.23:
Eff
ect o
f met
hano
l con
cent
ratio
n, g
lass
or p
last
ic v
ials
, lig
ht a
nd fi
ltrat
ion
on T
F co
ncen
tratio
n. A
ll so
lutio
ns w
ere
mad
e
up to
1 µ
g m
L-1 in
70%
met
hano
l in
glas
s and
kep
t on
a ro
tato
r for
5 h
in th
e da
rk u
nles
s oth
erw
ise
indi
cate
d.
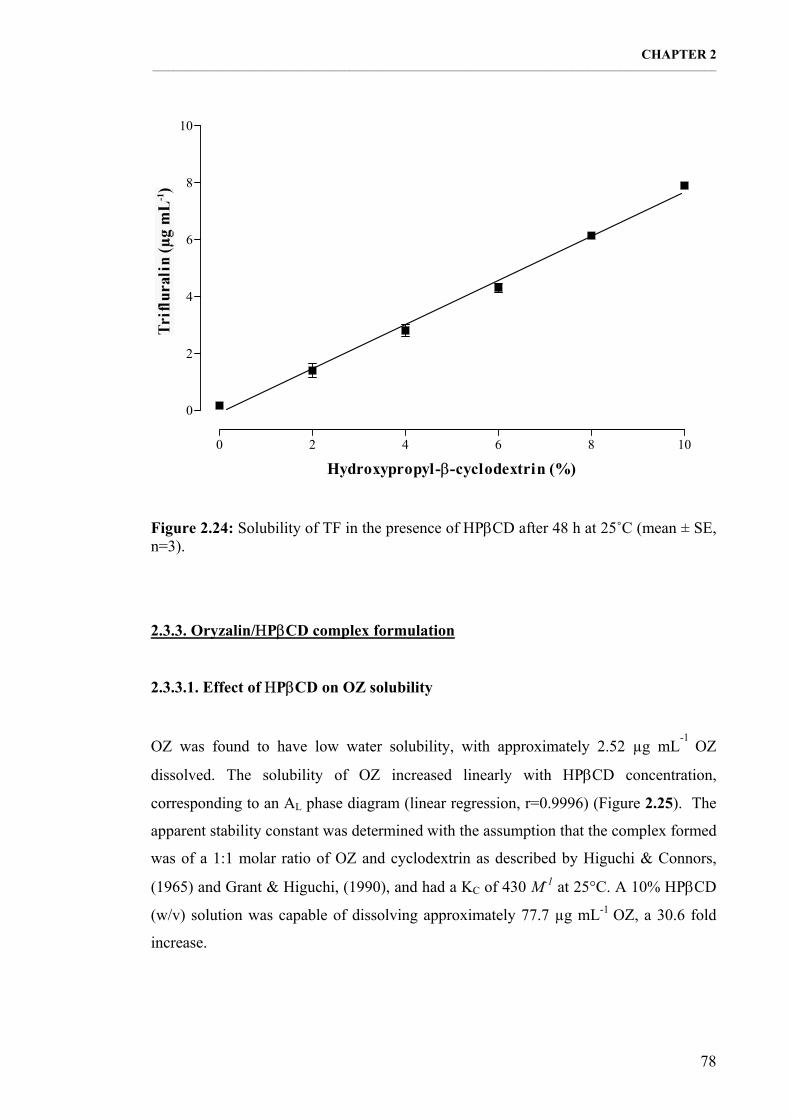
CHAPTER 2 __________________________________________________________________________________________________________
78
Figure 2.24: Solubility of TF in the presence of ΗPβCD after 48 h at 25˚C (mean ± SE, n=3).
2.3.3. Oryzalin/ΗPβCD complex formulation
2.3.3.1. Effect of ΗPβCD on OZ solubility
OZ was found to have low water solubility, with approximately 2.52 µg mL-1
OZ
dissolved. The solubility of OZ increased linearly with ΗPβCD concentration,
corresponding to an AL phase diagram (linear regression, r=0.9996) (Figure 2.25). The
apparent stability constant was determined with the assumption that the complex formed
was of a 1:1 molar ratio of OZ and cyclodextrin as described by Higuchi & Connors,
(1965) and Grant & Higuchi, (1990), and had a KC of 430 M-1 at 25°C. A 10% ΗPβCD
(w/v) solution was capable of dissolving approximately 77.7 µg mL-1 OZ, a 30.6 fold
increase.
0 2 4 6 8 10
0
2
4
6
8
10
Hydroxypropyl-β-cyclodextrin (%)

CHAPTER 2 __________________________________________________________________________________________________________
79
Figure 2.25: Solubility of OZ in the presence of ΗPβCD after 48 h at 25˚C (mean ± SE,
n=3).
The OZ/ΗPβCD complex needed to be synthesised in sufficient concentrations for in
vitro drug experiments. Incubation of excess OZ in 75% ΗPβCD (w/v) at 35°C for two
days resulted in a substantial increase of OZ solubility, with a final concentration of 2.8
mg mL-1 (8 mM). The molar ratio of OZ to ΗPβCD was 1:65. A second solution was
autoclaved and while there was no degradation of OZ, precipitation of the drug occurred
as the solution cooled. However, this allowed samples to be sterilised by autoclaving.
Therefore fresh drug solutions were autoclaved, cooled to 37˚C and OZ concentration
verified before all biological experiments.
While the OZ/ΗPβCD complex was synthesised in sufficient concentration for in vitro
experimentation, these concentrations were insufficient for pharmacokinetic
experiments. Therefore the effect of pH adjustment on OZ complex formation was
investigated.
0 2 4 6 8 10
0
20
40
60
80
100
Hydroxypropyl-β-cyclodextrin (%)

CHAPTER 2 __________________________________________________________________________________________________________
80
2.3.3.2. The effect of pH on OZ/ΗPβCD complex formation
Figure 2.26 shows the pH-solubility profile for OZ in the absence of ΗPβCD. At pH
values greater than 9.5, OZ solubility was found to increase exponentially (exponential
growth, r=0.995).
The effect of both pH and ΗPβCD on OZ solubility was investigated over 5 pH values
and 3 ΗPβCD concentrations using phosphate buffer at two concentrations. Increasing
pH and increasing ΗPβCD concentrations significantly increased OZ solubility for both
the 50 mM and 100 mM phosphate buffering systems. No significant difference was
observed between the two buffering systems so the data was amalgamated (Figure 2.27)
(one way ANOVA with Bonferonni’s post test). As OZ is a weak acid, the addition of
OZ acted to decrease the pH of the samples. To further investigate the interactions
between pH adjustment and ΗPβCD concentration, the above data was plotted as OZ
solubility at each ΗPβCD concentration over varying pH (Figure 2.28). It appeared that
with the addition of ΗPβCD into the system, the increase in OZ concentration with pH
became sigmoidal. However, further analysis became highly speculative. To investigate
this further, the effect of pH on OZ/ΗPβCD complexation was investigated at pH 11.2
(500mM phosphate buffer) over a range of ΗPβCD concentrations at 35°C (Figure
2.29). However, determination of the stability constant was complicated by the fact that
the final pH at equilibrium was often different from initial values. Therefore only
samples with a pH of 11.2 were used in the calculations. The solubility of OZ increased
linearly with ΗPβCD concentration, corresponding to an AL phase diagram (linear
regression, r=0.996) and had a KC of 1164 M-1.
To investigate the pharmacokinetics of the OZ/ΗPβCD complex, it was necessary to
synthesise the OZ/ΗPβCD complex at as high a concentration as possible, without using
extreme pH ranges. Subsequently, incubation of excess OZ in 60% ΗPβCD (w/v) in
200mM phosphate buffer (pH 11.2) at 35°C was found to contain 21.3 mg mL-1 OZ,
with a final pH of 11. The molar ratio of OZ to ΗPβCD was 1:7.

CHAPTER 2 __________________________________________________________________________________________________________
81
Figure 2.26: Effect of pH (50 mM phosphate buffer) on OZ solubility after 2 days at
room temperature (mean ± SE, n=2).
2012.0
5
10
15
11.5
20
25
30
11.0
pH CD (%)1010.5 10.0
Figure 2.27: Solubility of OZ with varying pH and ΗPβCD concentrations (either 50
mM or 100 mM phosphate buffer, n=1).
2 4 6 8 10 12
0
20
40
60
80
100
120
140
160
180
200
pH
OZ
(mg
mL-1
)
0

CHAPTER 2 __________________________________________________________________________________________________________
82
Figure 2.28: Effect of pH (50-100 mM phosphate buffer) on solubility of OZ in the presence of ΗPβCD after equilibration for 1 w at 35˚C, 2 d at room temperature (n=1).
Figure 2.29: Solubility of OZ in the presence of ΗPβCD at pH 11.2 (500 mM phosphate buffer) after equilibration for 1 w at 35˚C, 2d at 21˚C (mean ± SE, n=1-3).
9.5 10.0 10.5 11.0 11.5 12.0
0
5
10
15
20
25
10% CD20% CD
0% CD
pH
0 5 10 15 20 25 30
0
5
10
15
20
25
30
Hydroxypropyl-ß-cyclodextrin (%)

CHAPTER 2 __________________________________________________________________________________________________________
83
2.3.4. DSC-TGA analysis
2.3.4.1. ABZ complex formation
Figure 2.30 shows the DSC-TGA thermograms for ABZ, 60% ΗPβCD (w/v) pH 2.1
(200mM phosphate buffer), and ABZ/ΗPβCD pH 2.1 (60% ΗPβCD (w/v), 200mM
phosphate buffer). The DSC-TGA thermogram of ABZ had an endothermic peak at
209°C with an associated weight loss, which comprised two processes, as seen by the
lack of symmetry within the peak and uniformity in weight loss. A second weight loss
was observed between 280 and 350°C and consisted of an endotherm followed by an
exotherm.
The ΗPβCD and ABZ/ΗPβCD samples were highly viscous and therefore were heated
at 5˚C/min to reduce the risk of the samples bubbling. Both the ΗPβCD and
ABZ/ΗPβCD exhibited weight loss with endothermic peaks due to the evaporation of
water, and continued until approximately 130°C. A second weight loss occurring in
both samples at approximately 230°C is exothermic, indicating oxidisation. Subsequent
weight loss after 290°C was due to carbon charring. The ABZ/ΗPβCD sample
contained excess ΗPβCD (ratio ABZ/ΗPβCD: ΗPβCD = 1:6), therefore the
characteristic peaks of ΗPβCD were observed. The characteristic endothermic and
exothermic peaks of ABZ were not present, indicating that the ABZ and ΗPβCD
formed a true inclusion complex.
2.3.4.2.OZ complex formation
Figure 2.31 shows the DSC-TGA thermograms for OZ, 60% ΗPβCD (w/v) pH 11.2
(200mM phosphate buffer), and OZ/ΗPβCD pH 11 (60%ΗPβCD (w/v), 200mM
phosphate buffer). OZ has a distinct DSC with a single clear endothermic peak 140˚C
with no associated weight loss, correlating with the melting point of OZ. A single clear
exothermic peak at 271˚C with associated weight loss was due to decomposition by
oxidisation.
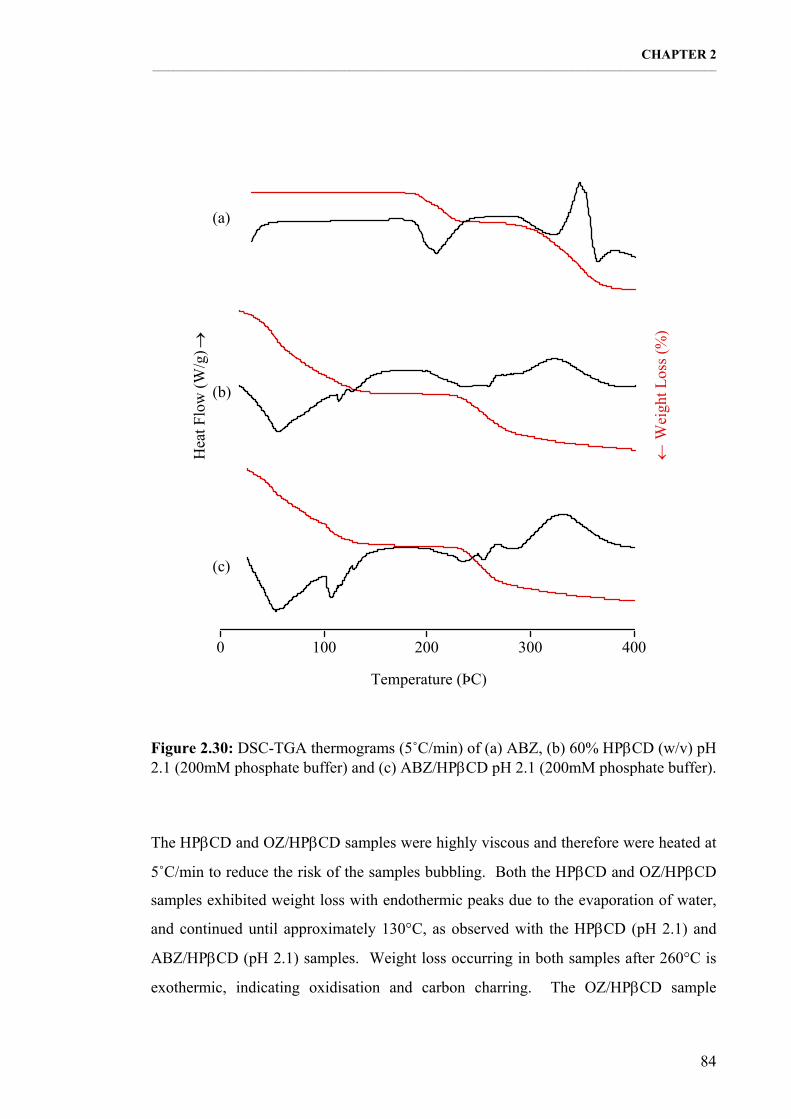
CHAPTER 2 __________________________________________________________________________________________________________
84
Figure 2.30: DSC-TGA thermograms (5˚C/min) of (a) ABZ, (b) 60% ΗPβCD (w/v) pH 2.1 (200mM phosphate buffer) and (c) ABZ/ΗPβCD pH 2.1 (200mM phosphate buffer).
The ΗPβCD and OZ/ΗPβCD samples were highly viscous and therefore were heated at
5˚C/min to reduce the risk of the samples bubbling. Both the ΗPβCD and OZ/ΗPβCD
samples exhibited weight loss with endothermic peaks due to the evaporation of water,
and continued until approximately 130°C, as observed with the ΗPβCD (pH 2.1) and
ABZ/ΗPβCD (pH 2.1) samples. Weight loss occurring in both samples after 260°C is
exothermic, indicating oxidisation and carbon charring. The OZ/ΗPβCD sample
0
25
50
75
100
125
-20
-10
0
10
20
0 100 200 300 400
Temperature (ÞC)
(a)
(b)
(c)
Hea
t Flo
w (W
/g) →
← W
eigh
t Los
s (%
)

CHAPTER 2 __________________________________________________________________________________________________________
85
contained excess ΗPβCD (ratio OZ/ΗPβCD: ΗPβCD = 1:6), therefore the characteristic
peaks of ΗPβCD were observed. The characteristic endothermic and exothermic peaks
of OZ were not present, indicating that the OZ and ΗPβCD formed a true inclusion
complex.
Figure 2.31: DSC-TGA thermograms (5˚C/min) of (a) OZ, (b) 60% ΗPβCD (w/v) pH
11 (200mM phosphate buffer) and (c) OZ/ΗPβCD pH 11 (200mM phosphate buffer).
0 100 200 300 400
Temperature (ÞC)
(a)
(b)
(c)
Hea
t Flo
w (W
/g) →
← W
eigh
t Los
s (%
)

CHAPTER 2 __________________________________________________________________________________________________________
86
2.4. DISCUSSION
2.4.1. Albendazole
2.4.1.1. Phase solubility analysis
The intrinsic aqueous solubility of ABZ was very low, at 0.29 µg mL-1
. This is
comparable to that found by previous researchers (Bogan & Marriner, 1984; Evrard et
al., 1998; Piel et al., 1999), although different authors have observed a vast range in
solubility (Kata & Scheuer, 1991; Torrado et al., 1996a). These differences are most
likely to be predominately due to the techniques used for solubility determination. In
addition, ABZ has been found to form polymorphs, which may affect its solubility (Zhu
et al., 1995).
It has already been shown in the literature that ABZ aqueous solubility can be increased
by forming inclusion compounds with β-cyclodextrin, dimethyl-β-cyclodextrin
hydroxypropyl-β-cyclodextrin and sulphobutylether7-β-cyclodextrin (Kata & Scheuer,
1991; Chun & Park, 1993; Bassani et al., 1996; Evrard et al., 1998; Castillo et al., 1999;
Piel et al., 1999). Phase solubility analysis in the present study revealed that ABZ and
ΗPβCD formed first order complexes, and the KC was determined with the assumption
that the complex formed was of a 1:1 molar ratio ABZ:HPβCD. Similar results were
obtained by Chun & Park, (1993), Castillo et al., (1999) and Piel et al., (1999). In
addition, increases in drug solubility at very high concentrations of HPβCD may not
only involve complexation but also a general change in polarity of the solvent. The
stability constant for the ABZ/ΗPβCD complex indicates an inclusion complex of very
high stability, which was also observed by Evrard et al., (1998). However, different
authors have found widely differing stability constants for the ABZ/HPβCD complex.
This may be due to the different methods used to determine KC, and may indicate that
the stoichiometry deviates from the assumed 1:1 ratio (Szejtli, 1988). The stability
constant of the inclusion complex depends on the degree to which the two molecules
interact, which is affected by the relative sizes of the guest in relation to host cavity size.
Therefore, in water, ΗPβCD accommodates the molecular portion of ABZ involved in
complexation very well.
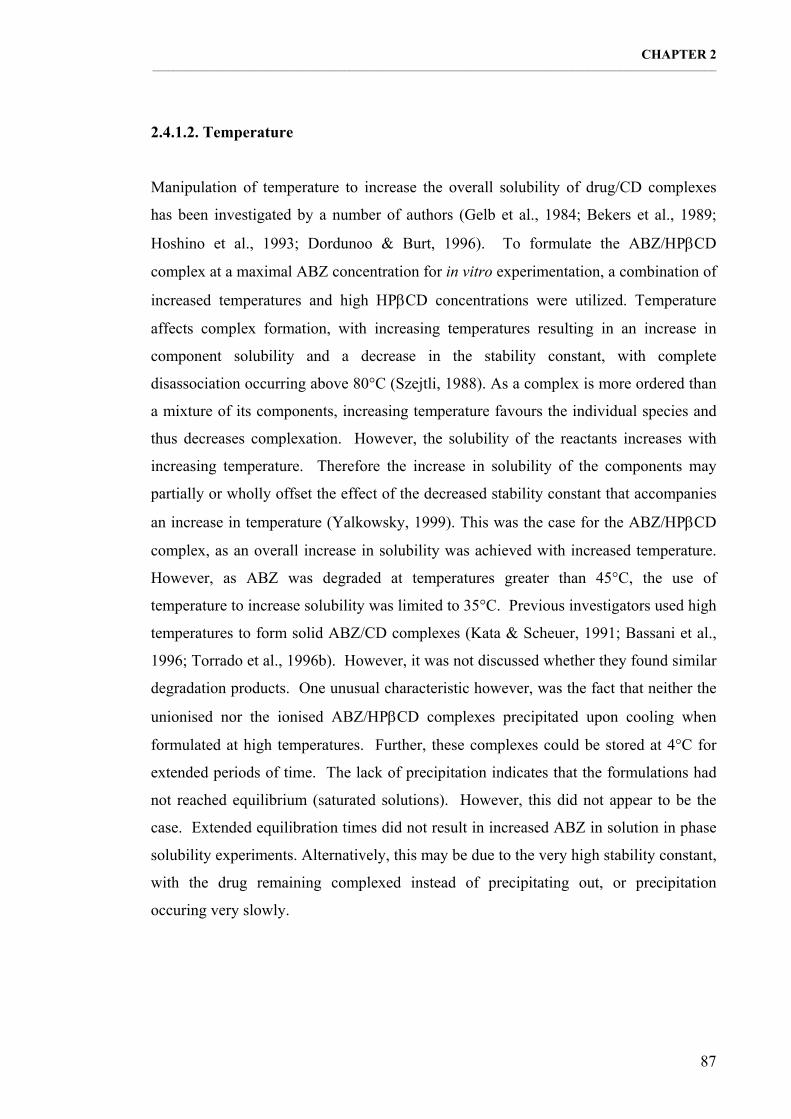
CHAPTER 2 __________________________________________________________________________________________________________
87
2.4.1.2. Temperature
Manipulation of temperature to increase the overall solubility of drug/CD complexes
has been investigated by a number of authors (Gelb et al., 1984; Bekers et al., 1989;
Hoshino et al., 1993; Dordunoo & Burt, 1996). To formulate the ABZ/ΗPβCD
complex at a maximal ABZ concentration for in vitro experimentation, a combination of
increased temperatures and high ΗPβCD concentrations were utilized. Temperature
affects complex formation, with increasing temperatures resulting in an increase in
component solubility and a decrease in the stability constant, with complete
disassociation occurring above 80°C (Szejtli, 1988). As a complex is more ordered than
a mixture of its components, increasing temperature favours the individual species and
thus decreases complexation. However, the solubility of the reactants increases with
increasing temperature. Therefore the increase in solubility of the components may
partially or wholly offset the effect of the decreased stability constant that accompanies
an increase in temperature (Yalkowsky, 1999). This was the case for the ABZ/ΗPβCD
complex, as an overall increase in solubility was achieved with increased temperature.
However, as ABZ was degraded at temperatures greater than 45°C, the use of
temperature to increase solubility was limited to 35°C. Previous investigators used high
temperatures to form solid ABZ/CD complexes (Kata & Scheuer, 1991; Bassani et al.,
1996; Torrado et al., 1996b). However, it was not discussed whether they found similar
degradation products. One unusual characteristic however, was the fact that neither the
unionised nor the ionised ABZ/ΗPβCD complexes precipitated upon cooling when
formulated at high temperatures. Further, these complexes could be stored at 4°C for
extended periods of time. The lack of precipitation indicates that the formulations had
not reached equilibrium (saturated solutions). However, this did not appear to be the
case. Extended equilibration times did not result in increased ABZ in solution in phase
solubility experiments. Alternatively, this may be due to the very high stability constant,
with the drug remaining complexed instead of precipitating out, or precipitation
occuring very slowly.

CHAPTER 2 __________________________________________________________________________________________________________
88
2.4.1.3. pH
In vivo experiments required significantly higher ABZ concentrations than that achieved
using unionised ABZ. Therefore a combination of decreasing pH and increased
temperature to increase ABZ solubility was investigated. Multicomponent systems
using CDs and hydroxy acids to increase overall ABZ solubility have been investigated
in the literature (Chun & Park, 1993; Castillo et al., 1999; Piel et al., 1999), and found
to follow a pseudo-first order kinetic model (Torrado et al., 1996a). ABZ/ΗPβCD
complexation, at a pH of 2, resulted in higher ABZ solubility due to its ionisation, but
had a lower stability constant than for the complex in water. The extent of CD
complexation depends of the polarity of the guest molecule. The stability of the
complex is proportional to the hydrophobic character of the substituents, with ionic
species usually, but not always, unfavoured in complex formation. This is because
ionised molecules produce weaker interactions with the hydrophobic cavities of CDs
(Szejtli, 1988; Loftsson & Brewster, 1996). Therefore, if a pH change produces an
ionic form of the drug, it increases the solubility of the complex but decreases the
formation constant (Yalkowsky, 1999). This was observed with ABZ, with the KC of
ABZ and its ionic form to be 9940 and 1075M-1 respectively. However, improved
overall solubility with decreasing pH was observed despite the decreased solubility
constant, as the solubility difference between the two ABZ forms outweighed the effect
of the difference in complexation. The improved solubilizing capacity of the phosphate
buffer over the citric acid buffer at low pHs may result from interference from the citric
acid between the ionised ABZ and the ΗPβCD molecule. The likelihood is that
hydroxy acids may establish electrostatic interactions with the drug, and hydrogen
bonds with the hydroxyl groups of the CD (multicomponent systems) (Redenti et al.,
2000). Differential solubilizing ability between phosphate buffer and citric acid buffer
has also been observed by Linares et al., (1998).
2.4.1.4. DSC-TGA
The formation of true inclusion compounds was determined by DSC-TGA. The DSC-
TGA thermograms of ABZ showed an asymmetrical endothermic peak at 209°C with
an associated weight loss, corresponding to the melting point of ABZ. Castillo et al.,

CHAPTER 2 __________________________________________________________________________________________________________
89
(1999) also found asymmetry in an endothermic peak at approximately 200°C, and
attributed it to the presence of polymorphous and enantiomeric compounds (Zhu et al.,
1995). The second weight loss observed between 280 and 350°C consisting of an
endotherm followed by an exotherm was probably related to bond breakage followed by
oxidation. ABZ was previously observed to degrade at greater than 45°C, with
substantial degradation occurring when samples were autoclaved. However there is no
indication of structural change or degradation from the DSC-TGA thermograms below
200°C. The degradation of ABZ at high temperatures in the aqueous solution is
therefore likely to be due to hydrolysis.
DSC-TGA thermograms of 60% ΗPβCD (w/v), in 200mM phosphate buffer (pH 2.1),
exhibited weight loss with an endothermic peak due to the evaporation of water, and
continued until approximately 130°C. Evaporation of water content from inclusion
complexes is generally complete below 100°C, while the evaporation of absorbed or
bound water occurs at just above 100°C (Szejtli, 1988). The difference in temperature
is caused by different strengths of the bonds between water molecules and cyclodextrin
molecules (Pedersen et al., 1998). The second weight loss occurring at approximately
230°C is exothermic, indicating oxidisation. Cyclodextrins have no defined melting
point, but decompose above 200°C (Szejtli, 1988).
The DSC-TGA thermograms of ABZ/ΗPβCD complex in 200mM phosphate buffer (pH
2.1) (Section 2.2.2.5) indicated that the drug was completely converted into the
complex. The endothermic and exothermic peaks of ABZ were not present, indicating
that there was no free ABZ. ABZ was therefore protected by ΗPβCD, decomposing
with the ΗPβCD instead of as a separate compound.
2.4.2. Trifluralin
2.4.2.1. Phase solubility analysis
The intrinsic aqueous solubility of TF was very low, at 0.18 µg mL-1
. This is
comparable to values found by previous researchers (Tepe & Scroggs, 1967; Weber &
Monaco, 1972; Tomlin, 1994). Phase solubility analysis revealed that TF and ΗPβCD

CHAPTER 2 __________________________________________________________________________________________________________
90
formed first order complexes, and the KC was determined with the assumption that the
complex formed was of a 1:1 molar ratio TF: ΗPβCD. The stability constant for the
TF/ΗPβCD complex was 626 M-1 at 25°C, which is considered to be sufficiently high to
result in its improved bioavailability (Blanco et al., 1991).
2.4.2.2. Temperature
For in vitro and in vivo experimentation, significantly higher TF concentrations were
required. By increasing temperature, a substantial increase in TF solubility was
achieved at high ΗPβCD concentrations. However, this was still insufficient for in vitro
experimentations. In addition, pH did not affect TF solubility, as it is non-ionic, with a
pKa < 0 (Weber & Monaco, 1972; Tomlin, 1994). Therefore, while the stability
constant indicated potential for improved bioavailability of TF, in actuality, TF
complexation with ΗPβCD, with or without pH adjustment, was not a viable alternative
to increasing TF concentration for in vitro or in vivo efficacy studies against parasitic
agents.
TF was especially prone to either precipitation or sorption onto surfaces when stored in
plastic vials, and dissolved TF was removed from solutions when filtered. Strachan &
Hess, (1982) found that TF bound to both glass and, to a greater extent, plastic, and this
effect increased over time. They also found other dinitroanilines (isopropalin,
pendimethalin, nitralin and OZ) bound to glass, with only nitralin and OZ maintaining
constant concentrations due to their higher solubility. It was thought that the
dinitroaniline herbicides bound to glass by chelating a cation on the glass surface, or by
forming π complexes with transition metals on the surface of the glass. In addition,
nitroanilines readily absorbed to proteinaceous substances by virtue of the nitro groups,
which are strong hydrogen bonders (Weber & Monaco, 1972). Therefore it is important
to avoid using plastic vials, to reduce exposure to light, to remove excess drug by
centrifugation rather that filtration, and to avoid situations where sample analysis was
carried out in low methanol concentrations.
It was observed that TF was susceptible to decomposition by ultraviolet radiation.
Similar results were also reported by Tepe & Scroggs, (1967) and Leitis & Crosby,

CHAPTER 2 __________________________________________________________________________________________________________
91
(1974), who found that TF was very unstable in sunlight, especially in the presence of
an organic solvent. Methods devised for the measurement of TF were also used for the
measurement of the non-filterable OZ, which, like all substituted aromatic nitro
compounds, is susceptible to photodecomposition (Decker & Johnson, 1976).
2.4.3. Oryzalin
2.4.3.1. Phase solubility analysis
The intrinsic aqueous solubility of OZ was 2.52 µg mL-1
, and is comparable to that
observed by previous researchers (Weber & Monaco, 1972; Decker & Johnson, 1976),
although different authors have observed a vast range in solubility (Budavari, 1989;
Benbow et al., 1998). These differences are likely to be predominantly due to the
techniques used for solubility determination. Like TF, OZ could not be filtered through
Millipore filters. Therefore the methods devised for the measurement of TF were used
to analyse OZ.
Phase solubility analysis revealed that OZ and ΗPβCD formed first order complexes,
and that the KC was determined with the assumption that the complex formed was of a
1:1 molar ratio OZ: ΗPβCD. The stability constant for the OZ/ΗPβCD complex was
430M-1 at 25°C, which is considered to be sufficiently high to result in its improved
bioavailability (Blanco et al., 1991).
2.4.3.2. Temperature
To formulate of the OZ/ΗPβCD complex at a maximal OZ concentration for in vitro
experimentation, a combination of increased temperatures and high ΗPβCD
concentrations were utilized. An overall increase in OZ solubility was achieved with
increased temperature. Therefore the increases in component solubility were greater
than the decrease in the stability constant, resulting in increases in overall solubility
with increasing temperature. However, unlike ABZ, samples could not be substantially
cooled without precipitation of the drug. As the sample cools, the components decrease
in solubility, and either complex with ΗPβCD or precipitate out. As the stability

CHAPTER 2 __________________________________________________________________________________________________________
92
constant increases with decreasing temperature, complex formation is favoured.
However, this is not sufficient to offset the decreased solubility of the components. One
advantage this did permit was the sterilization of drug samples. While autoclaving
samples was not a viable method for increasing drug concentration (due to
precipitation), it did allow for sterilization of pre-formulated samples. Repetitive
autoclaving however, resulted in an increase in viscosity, presumably due to a loss of
water from the formulation.
2.4.3.3. pH
In vivo experiments required significantly higher OZ concentrations than that achieved
using unionised OZ. Therefore a combination of increased pH and increased
temperature to increase OZ solubility was investigated. OZ exhibits acidic properties,
being highly soluble in alkaline solutions (Weber & Monaco, 1972; Decker & Johnson,
1976). OZ/ΗPβCD complexation in pH-adjusted media resulted in higher drug
solubility at a pH of 11.2. The stability constants for OZ and its ionic form were 430
and 1075 M-1 respectively. Therefore the ionised OZ/ΗPβCD complex also had a
higher stability constant than the complex in water. While this is uncommon, examples
have been reported in the literature (Higuchi & Kristiansen, 1970; Connors et al., 1982;
Connors, 1995; Esclusa-Díaz et al., 1996, and reviewed by Loftsson et al., 1999). In the
case of OZ, a pH change producing an ionic form of the drug not only increased the
solubility of the drug and its complex, but also increased the stability constant i.e., the
ionised drug was able to complex more strongly. This is unusual and indicated that the
ionised portion of the drug was involved in the interaction between OZ and ΗPβCD,
and actually favoured complexation. This may result from the ionised portion of the
drug interacting with either the ΗPβCD cavity (resulting from a stronger dispersion
force field between the guest and ΗPβCD cavity) or derivatised groups on the outside of
the ΗPβCD (resulting from increased interactions such as hydrogen bonding or dipole-
dipole) (Lin & Connors, 1983; Connors, 1997). Alternatively, ionisation may have
influenced electron density on the ring and therefore binding indirectly. The unusually
shaped pH profiles observed in figure 2.31 may result from 1) alternative stoichiometric
relationships, 2) salt formation or 3) differential complexing ability of the ionised and
unionised forms of OZ with ΗPβCD.

CHAPTER 2 __________________________________________________________________________________________________________
93
2.4.3.4. DSC-TGA
Confirmation that the OZ and ΗPβCD formed true inclusion compounds was
determined by GSC-TGA. Both the ΗPβCD and OZ/ΗPβCD samples exhibited weight
loss with endothermic peaks due to the evaporation of water, and continued until
approximately 130°C, as observed with the ΗPβCD (pH 2.1) and ABZ/ΗPβCD (pH
2.1) samples. Therefore the evaporation of water content occurred below 100°C, while
the evaporation of absorbed or bound water occurred above 100°C. In previous
experiments, it was observed that phosphate buffer solubility at pH 11.2 decreased with
increasing ΗPβCD concentrations. Therefore this may be due to ΗPβCD effectively
‘mopping up’ water. If the addition of ΗPβCD resulted in an increase in the amount of
bound water, there would be a decrease in available water for the buffer to be dissolved
in.
The DSC-TGA thermograms of OZ/ΗPβCD complex in 200mM phosphate buffer (pH
11) (Section 2.2.4.5) indicated that the drug was completely converted into the complex.
The endothermic and exothermic peaks of OZ were not present, indicating that there
was no free OZ. OZ was therefore protected by ΗPβCD, decomposing with the ΗPβCD
instead of as a separate compound.
2.4.4. Conclusion
All three antiparasitic agents exhibited improved solubility with ΗPβCD complexation.
However, only ABZ and OZ exhibited increases in solubility with potential for
assessment of antiparasitic efficacy. Additional increases in ABZ and OZ solubility
were achieved by manipulation of temperature and pH in combination with increased
ΗPβCD concentrations. OZ/ΗPβCD complexation was especially improved by pH
adjustment, with ionisation of OZ favouring complex formation.
While the stability constant of the TF/ΗPβCD complex indicated potential for improved
bioavailability of TF, drug concentrations were insufficient for in vitro or in vivo
efficacy studies against parasitic agents. In comparison, the ABZ/ΗPβCD and

CHAPTER 2 __________________________________________________________________________________________________________
94
OZ/ΗPβCD complexes were formulated in sufficient concentration for in vitro
experiments. The pH-adjusted ABZ/ΗPβCD and OZ/ΗPβCD complexes were
formulated for in vivo experimentation, as substantially higher drug concentrations were
required. However, these formulations could not be investigated in vitro as in vitro
systems are cultivated at a specific pH. Therefore the addition of pH-adjusted
formulations to parasite cultures would change the pH of the formulation, resulting in
drug precipitation.
The above formulations were made with the view of investigating the efficacy of the
antiparasitic agents when complexed with ΗPβCD in comparison to conventional drug
formulations. Therefore the efficacy of the aqueous complexes was investigated in
order to guarantee precise drug dose for assessment of efficacy, toxicity and
bioavailability. While the ABZ/ΗPβCD and OZ/ΗPβCD complexes are in sufficient
concentration for in vivo experimentation, they would be insufficient for human
treatment. Subsequent drug formulation development would entail the manufacture of
solid inclusion complexes with more specific investigations into stoichiometry as well
as dissolution studies and clinical trials, such as those described by Evrard et al., (1998),
Castillo et al., (1999) and Piel et al., (1999).
The interest in designing newer and more effective drug delivery systems is the main
reason for research into CD-drug combinations (Szejtli, 1991a). For ABZ in particular,
its improved formulation will consequently result in improved treatment of systemic
parasites such as Echinococcus granulosis.

CHAPTER 3 __________________________________________________________________________________________________________
95
CHAPTER 3. PHARMACOKINETICS OF THE
DRUG/ΗPβCD COMPLEXES

CHAPTER 3 __________________________________________________________________________________________________________
96
3.1. INTRODUCTION
Many drugs are effective at nanomolar concentrations in vitro, but this is often not
reflected in vivo. This may result from enzymatic or chemical breakdown of the drug,
or insufficient solubility in physiological conditions preventing specific and effective
delivery to their site of action. While the activity of the drug is often related to the
lipophilicity of the compound, adequate bioavailability of the drug requires a degree of
aqueous solubility. Therefore CDs and their derivatives can improve drug delivery,
with HPβCD a potential drug carrier for parenteral, oral and local administration.
However, it is of particular importance that the individual pharmacokinetics of the
complex, carrier and drug are known in the overall assessment of drug effect.
3.1.1. Oral formulations
For oral drug administration, solid drug/CD complexes have a number of advantages
over solid drug. They improve the formulation of the drug (e.g. remove smell or taste),
improve the physical and chemical stability of the drug (resulting in a longer shelf life),
reduce the time it takes for the drug to move from the solid phase into the liquid phase
(dissolution), and reduce drug induced local irritation (Szejtli, 1988 and 1991a). When
a drug is very soluble, its absorption is the limiting factor. In such cases, CD
complexation will not increase the absorption, and eventually may decrease it.
However, when a drug is poorly soluble, dissolution is the limiting factor (Jones &
Grant, 1984; Szejtli, 1991a). Complexation increases dissolution and solubility, and
hence increases the available concentration of drug in the intestine, with the extent of
enhanced dissolution and solubility controlled by various factors such as the solubilities
of the components, the stability constants of the complexes, and the molar ratio of
drug:CD (Habon et al., 1984; Jones & Grant, 1984; Szejtli, 1991a).
As solid drug/CD complexes are usually much more hydrophilic than the free drug, the
solid wets easier, resulting in increased dissolution (Habon et al., 1984). In the same
way that a drug/CD complex in liquid medium is governed by an equilibrium reaction
between host and guest molecules, when a solid drug/CD complex is placed in contact
with water, it dissolves and decomposes following the equilibrium reaction:
CHAPTER 3 __________________________________________________________________________________________________________
97
solid inclusion ↔ dissolved inclusion ↔ free CD + free drug (Duchêne &
Wouessidjewe, 1990a). If the concentration of the free drug (released by dissociation)
surpasses its saturation concentration, the excess precipitates as solid drug (Figure 3.1)
(Habon et al., 1984). Consequently, drug absorption results in a displacement of this
equilibrium, with the appearance of new free molecules of drug from either the drug/CD
complex or precipitated drug (if any) (Duchêne & Wouessidjewe, 1990a).
Orally administered drug can only enter the circulation once dissolved in the
gastrointestinal fluid, with the concentration of dissolved drug one of the parameters
determining the rate of absorption processes. Habon et al., (1984) have developed
computer-simulated theoretical blood level curves that allow predictions of the
pharmacokinetics of CD complexes in oral dosage form. The differences in the blood
level curves obtained after administration of free or complexed drug can be attributed to
the different dissolved free drug concentrations in the gastrointestinal fluid (Habon et
al., 1984; Cho et al., 1995). The computer-simulated theoretical blood level curves
developed by Habon et al., (1984) allow predictions of pharmacokinetics based on the
stability constant and the presence of excess CD (Figure 3.2). As a consequence of the
higher dissolution rates of the complexes, not only is the blood concentration higher,
with its peak occurring sooner, but also the area under the curve (AUC) is larger
(Duchêne et al., 1987). These increases in blood level curves can resemble i.v.
application (Habon et al., 1984). At lower stability constants, the saturation
concentration of the drug can easily be reached, with the degree of dissociation high
enough to ensure a high free drug concentration in the gastrointestinal fluid. These
result in a rapid increase in the blood level curve and high value of the peak. If the
stability constant is high, then dissociation is weak, and even if the solubility of the
inclusion compound is high, the bioavailability of the drug remains low, as there are few
free molecules available for absorption. Therefore the blood level peak will be shifted
toward higher values on the time abscissa and a decrease in the peak height. An
enhanced biological response is however expected in all cases as compared to the free
drug. Thus the absorption rate of drugs can be accelerated or retarded by appropriately
manipulating the complex dissociation equilibria (Habon et al., 1984).

CHAPTER 3 __________________________________________________________________________________________________________
98
Figure 3.1: Schematic representation of the dissolution-dissociation-recrystallization
process of a CD complex of a poorly water soluble guest. The complex rapidly
dissolves, and a metastable oversaturated solution is obtained. The anomalously high
level of dissolved guest drops back but remains higher than the level that can be
obtained with non-complexed drug. Complexed drug () and non-complexed drug
(---). Text and figure from Szejtli, (1991a).
Recrystallized CD guest
AQUEOUS PHASE
Solid inclusion
compound
Dis
solv
ed d
rug
Time (min) 5 60
5 min
60 min

CHAPTER 3 __________________________________________________________________________________________________________
99
Figure 3.2: Theoretical blood level curves obtained after oral administration of a free
drug (F) or its CD complexes with different stability constants. Text and figure from
Szejtli, (1988).
In addition, the complex dissociation equilibria can be shifted toward complex
formation in the aqueous phase by adding excess CD to the system (Habon et al., 1984).
When administering excess CD together with the drug/CD complex, the dissociation
equilibria can be shifted toward a higher ratio of complexed drug in the gastrointestinal
fluid. These changes have a great influence on the shape and peak-height of the blood
level curves. At lower stability constants, the excess amount of CD enhances the
concentration of free dissolved drug, thus a higher blood level can be attained in a
shorter time. At higher stability constants however, the dissociation is suppressed
remarkably on addition of excess CD, and a decrease in the height of the blood level
peak as well as an increase in the time necessary to reach the peak can be observed. In
extreme cases a real retardation can be achieved compared to the free drug. Therefore
the absorption of an orally administered drug can be enhanced or retarded through the
addition of excess CD (Habon et al., 1984). These effects also occur in drug/CD
formulations that have not had excess CD added, with this trend stronger for higher
stability constants. When the stability constant is high, the free drug concentration
decreases during absorption processes due to the increasing CD excess in the
0,1
50
106.M
0,5
0,4
0,3
0,2
40 30 20 10 min
F:CD = 1:1
K=500 K=1000
F
K=5000
K=10000

CHAPTER 3 __________________________________________________________________________________________________________
100
gastrointestinal fluid. Since CD itself cannot get into circulation either in the free or
complexed form (or only to an insignificant extent), the rate of absorption, which is
proportional to the free drug concentration, also decreases (Habon et al., 1984).
Additives may also be administered at the same time to improve the in vivo
effectiveness of the inclusion complex. For example, the bioavailability of complexes
administered at a particular pH may improve from the addition of pH modifiers that
better adapt the stomach pH to its dissolution (Duchêne et al., 1987). It is also possible
to increase dissociation by adding competing agents, such as phenylalanine or bile salts
(Duchêne et al., 1987; Nakanishu et al., 1989). Pharmaceutically it is desirable to use
drug/CD complexes with stability constants between 100-1000 M-1 to take advantage of
the effect of endogenous bile salts. Drugs with small stability constants form unstable
complexes, while those with high stability constants are too stable for exchange with
bile acids to occur. For stability constants within this range, competition between the
drug and bile acids for complex formation occurs, resulting in exclusion of the drug
molecules from the cavity, with the free molecules then available for absorption.
3.1.2. Parenteral formulations
Complexation behaviour following parenteral administration is not well understood,
with dissociation of the complex occurring with dilution of the complex by the
distribution fluids and competition for the drug and CD by plasma components (Mesens
et al., 1992). Therefore only small fractions of the drug remain complexed with the CD
once the complex enters the circulation. Competition in vivo results from the binding
competition between CD and plasma protein for the drug, and also competition between
the drug and endogenous compounds for the CD (Frijlink et al., 1991a; Sideris et al.,
1994). Drug/plasma proteins interactions have very high stability constants, with
competition between plasma proteins and CD for the drug favouring plasma proteins
(Mesens et al., 1992). In addition, parenterally administered CDs have the capacity to
complex with endogenous compounds, resulting in displacement of the drug from the
CD by plasma/lipid fractions. Cholesterol in particular has a very high affinity for
HPβCD, and is also in much higher concentrations in plasma than the drugs
administered as complexes (Mesens et al., 1992; Frijlink et al., 1991b). In some cases

CHAPTER 3 __________________________________________________________________________________________________________
101
increased drug protein binding is observed, and is attributed to the removal of
cholesterol from plasma protein binding sites (Frijlink et al., 1991a). A significant
effect of CD complexation on drug disposition can therefore be expected only for those
drug/CD complexes that possess a relatively high complex stability constant, as
compared with the association constant with plasma proteins, and do not undergo
displacement from the CD complex by endogenous lipids (Frijlink et al., 1991b).
Following parenteral administration, CD complexation can also affect tubular
reabsorption of drugs resulting in increased renal clearance of the drug in the complexed
form. While dissociation is expected with dilution in the bloodstream, concentration of
both the drug and HPβCD in the kidneys may result in their recomplexation and
therefore accelerated elimination (Dietzel et al., 1990). As renal clearance of HPβCD is
rapid, these effects should be manifested soon after drug complex administration
(Habon et al., 1984; Anderson et al., 1990; Dietzel et al., 1990).
3.1.3. Aim
The purpose of this investigation was to compare the pharmacokinetics of the
antiparasitic agents albendazole and oryzalin both alone and complexed. This
involved:
6. Investigating the pharmacokinetics of ABZ and the ABZ/HPβCD complex
following oral administration of 6 mg kg-1.
7. Investigating the pharmacokinetics of ABZ and a pH adjusted ABZ/HPβCD
complex following oral administration of 30 mg kg-1.
8. Investigating the pharmacokinetics of OZ and a pH adjusted OZ/HPβCD
complex following i.p. administration of 25 mg kg-1.

CHAPTER 3 __________________________________________________________________________________________________________
102
3.2. METHODS
3.2.1. Origin and housing of experimental animals
Three to four-week-old male albino Rattus norvegicus (Sprague Dawley strain) were
used in all pharmacokinetic experiments. They were housed in an animal house
maintained on a 12:12 h photoperiod at 21-24°C and were fed Rat and Mouse Cubes
manufactured by Glen Forrest Stockfeeders, Western Australia. Rats were housed three
animals per standard rat cage and both food and water were provided ad libitum. All
animals were obtained from the Western Australian State Animal Resource Centre,
Perth, Western Australia. The Murdoch University Animal Ethics Committee, in
accordance with national animal welfare standards, approved the following
experiments.
3.2.2. Pharmacokinetic experiments
3.2.2.1. In vivo albendazole pharmacokinetic study design
3.2.2.1.1. Pharmacokinetics of the ABZ/HPβCD complex
Sprague Dawley rats were given a single oral dose of 6 mg kg-1 ABZ as ABZ/HPβCD
(Section 2.3.1.1) (HPβCD concentration 1.5 g kg-1) and blood samples were taken
between 1-12 h after drug administration. Animals were anaesthetised with halothane in
a special delivery chamber of clear perspex (40x20x20 cm) with an inlet hose from an
in-line vaporiser (Ohio Medical Products, USA) using oxygen as the carrier for 0.5-1%
halothane. An outlet hose from the chamber was connected to a rat mask, and the
delivery chamber and rat mask were set up within a fume cupboard. Rats were placed
within the chamber until anaesthetised after which they were removed and their heads
placed into the mask to maintain halothane anaesthesia during blood collection. Blood
was collected via cardiac puncture using 21 G needles attached to 5 mL syringes
containing 0.1 mL of 200 U mL-1 porcine heparin in PBS to prevent blood clotting.
After blood collection the animals were euthanased by halothane overdose and cervical
dislocation. Blood samples were centrifuged at 2500 rpm for 10 min and the plasma
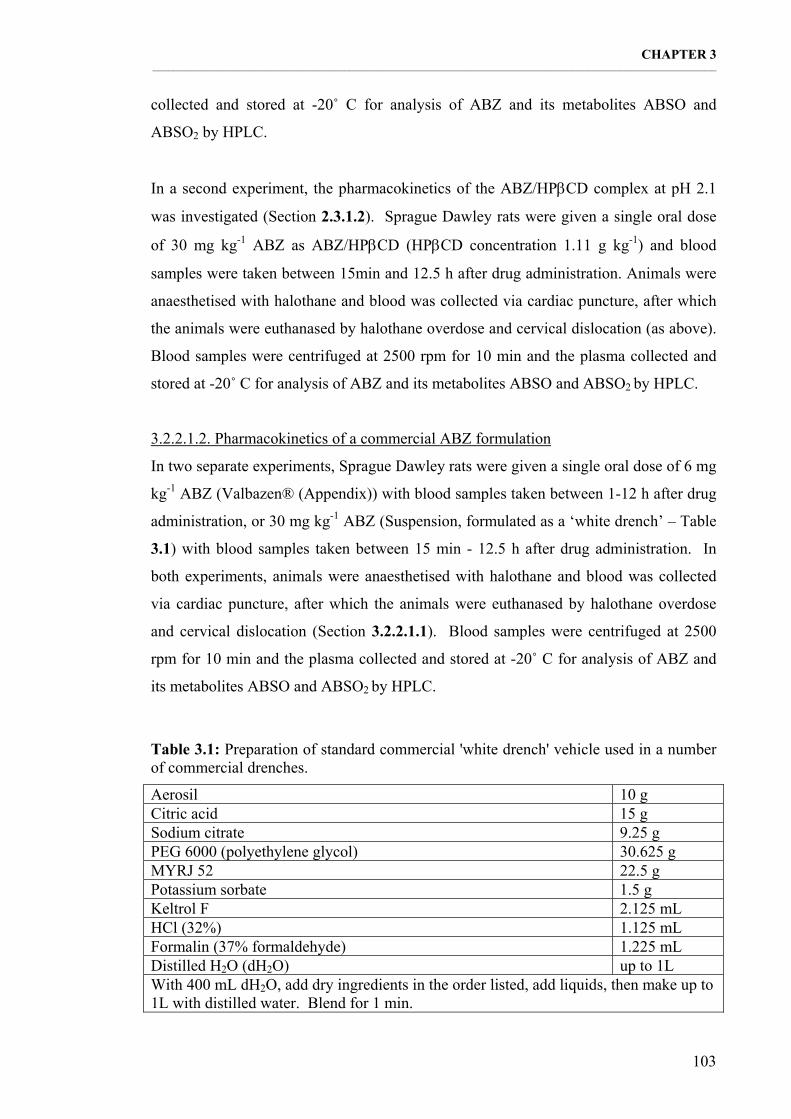
CHAPTER 3 __________________________________________________________________________________________________________
103
collected and stored at -20˚ C for analysis of ABZ and its metabolites ABSO and
ABSO2 by HPLC.
In a second experiment, the pharmacokinetics of the ABZ/HPβCD complex at pH 2.1
was investigated (Section 2.3.1.2). Sprague Dawley rats were given a single oral dose
of 30 mg kg-1 ABZ as ABZ/HPβCD (HPβCD concentration 1.11 g kg-1) and blood
samples were taken between 15min and 12.5 h after drug administration. Animals were
anaesthetised with halothane and blood was collected via cardiac puncture, after which
the animals were euthanased by halothane overdose and cervical dislocation (as above).
Blood samples were centrifuged at 2500 rpm for 10 min and the plasma collected and
stored at -20˚ C for analysis of ABZ and its metabolites ABSO and ABSO2 by HPLC.
3.2.2.1.2. Pharmacokinetics of a commercial ABZ formulation
In two separate experiments, Sprague Dawley rats were given a single oral dose of 6 mg
kg-1 ABZ (Valbazen® (Appendix)) with blood samples taken between 1-12 h after drug
administration, or 30 mg kg-1 ABZ (Suspension, formulated as a ‘white drench’ – Table
3.1) with blood samples taken between 15 min - 12.5 h after drug administration. In
both experiments, animals were anaesthetised with halothane and blood was collected
via cardiac puncture, after which the animals were euthanased by halothane overdose
and cervical dislocation (Section 3.2.2.1.1). Blood samples were centrifuged at 2500
rpm for 10 min and the plasma collected and stored at -20˚ C for analysis of ABZ and
its metabolites ABSO and ABSO2 by HPLC.
Table 3.1: Preparation of standard commercial 'white drench' vehicle used in a number of commercial drenches.
Aerosil 10 g Citric acid 15 g Sodium citrate 9.25 g PEG 6000 (polyethylene glycol) 30.625 g MYRJ 52 22.5 g Potassium sorbate 1.5 g Keltrol F 2.125 mL HCl (32%) 1.125 mL Formalin (37% formaldehyde) 1.225 mL Distilled H2O (dH2O) up to 1L With 400 mL dH2O, add dry ingredients in the order listed, add liquids, then make up to 1L with distilled water. Blend for 1 min.

CHAPTER 3 __________________________________________________________________________________________________________
104
3.2.2.2. In vivo oryzalin pharmacokinetic study design
3.2.2.2.1. OZ/HPβCD pharmacokinetic experiment
Sprague Dawley rats were given a single i.p. dose of 25 mg kg-1 OZ as OZ/HPβCD
(Section 2.3.3.2) (HPβCD concentration 0.72 g kg-1) and blood samples were taken
between 8 min and 24 h after drug administration. Animals were anaesthetised with
halothane and blood was collected via cardiac puncture, after which the animals were
euthanased by halothane overdose and cervical dislocation (Section 3.2.2.1.1). Blood
samples (not heparinized) were centrifuged at 2500 rpm for 10 min and the plasma
collected and stored at -20˚ C for analysis of OZ by HPLC.
3.2.2.2.2. OZ pharmacokinetic experiment
Sprague Dawley rats were given a single i.p. dose of 25 mg kg-1 OZ formulated as 12.5
mg mL-1 OZ in 36% ethanol, 16% DMSO, 8% tween 80, and 40% 0.9% NaCl. Blood
samples were taken as above and analysed as described in section 3.2.2.2.1.
3.2.3. HPLC analysis
3.2.3.1. HPLC analysis of albendazole
3.2.3.1.1. UV spectrum
The UV spectra were determined using a HP 8452A Diode Array Spectrophotometer
with General Scanning MS-DOS Software HP 89532A (A.00.00). The UV spectra of
ABZ, ABSO, and ABSO2 were used to determine the appropriate wavelength for HPLC
analysis (Figure 3.3). The internal standard butyl aminobenzoate (BAB) was selected
based on its UV absorption at the selected wavelength and its retention time during
HPLC analysis (Figure 3.3).
3.2.3.1.2. HPLC conditions
The HPLC system consisted of a Waters solvent controller and pump (model 600) and a
Shimadzu auto injector (model SIL-10 AD VP). The chromatography was carried out
using a 250 x 4.6 mm Altech Econosil 10µm C18 reverse phase column. Detection of
ABZ and its metabolites was carried out using a Waters Tunable Absorbance Detector

CHAPTER 3 __________________________________________________________________________________________________________
105
Figure 3.3: UV spectrums of ABZ in 0.5% DMSO in methanol (a); ABSO in 0.5%
DMSO in methanol (b); ABSO2 in 0.5% DMSO in methanol (c) and BAB in methanol
(d) (10µg mL-1). 100% methanol was used as the blank.
250 260 270 280 290 300 310 320 330 340 3500.0
0.1
0.2
0.3
0.4
0.5
0.6— L 295 = 0.4968
Wavelength (nm)
250 260 270 280 290 300 310 320 330 340 3500.0
0.2
0.4
0.6
0.8
— L 293 = 0.60652
Wavelength (nm)
250 260 270 280 290 300 310 320 330 340 3500.00
0.07
0.14
0.21
0.28
0.35— L 292 = 0.28358
Wavelength (nm)
250 260 270 280 290 300 310 320 330 340 3500.0
0.3
0.6
0.9
1.2
1.5
— L 293 = 1.1214
Wavelength (nm)
(a)
(b)
(c)
(d)

CHAPTER 3 __________________________________________________________________________________________________________
106
(model 486) at a wavelength of 290 nm. The chromatography was recorded using a
Hewlett Packard integrator (model 3396 series II) and the program Hewlett Packard
Peak 96 Data Storage and Information Manager. The peak area was integrated and ABZ
quantified by a calibration curve.
The chromatographic procedure consisted of a gradient of two mobile phases to
measure ABZ, ABSO and ABSO2 simultaneously. Mobile phase A consisted of 30%
acetonitrile, 40% 50mM phosphate buffer pH 6.6 and 30% water (v/v/v). Mobile phase
B consisted of 60% acetonitrile and 40% 50mM phosphate buffer pH 6.6 (v/v). Both
mobile phases were filtered through 0.45 µm filters. Flow rate was 1.5 ml min-1. The
gradient was as described below:
Time Interval (min) Concentration of Solvent 0.0 – 0.5 100% mobile phase A 0.5 – 2.0 Linear gradient to 100% mobile phase B 2.0 – 10 100% mobile phase B 10 – 12 Linear gradient to 100% mobile phase A 12 – 14 100% mobile phase A
Standard integration events and parameters were:
Attenuation 1-8 Chart speed 0.5 cm min-1 Area Reject 10 000 Threshold 3 Peak Width 0.3 Time 2.5 min Start integration 14 min Stop integration
3.2.3.1.3. HPLC standards
The accuracy of the HPLC assay was determined by preparing standard curves of ABZ,
ABSO, ABSO2 and the internal standard BAB. Standard ABZ, ABSO and ABSO2
solutions were prepared in 5% DMSO in mobile phase A at concentrations between 2-
25 µg mL-1. BAB was prepared at the same concentrations in mobile phase A. 50µL
was then submitted for HPLC analysis.

CHAPTER 3 __________________________________________________________________________________________________________
107
3.2.3.1.4. Sample preparation
The extraction procedure was a modification of the method of Valois et al., (1994). The
drugs were extracted with 5 mL dichloromethane-isopropanol (9:1, v/v) from 0.5 mL
plasma aliquots to which 50 µL of internal standard (BAB, 10 µg mL-1) and 1 mL 100
mM phosphate buffer (pH 6.6) were added. After shaking the sample on a rocking
platform (VariMix Thermolyne) at 1 cps for 30 min, the layers were separated by
centrifugation (Selbys ECCO) at 2000 g for 2 min. The organic phase was then
transferred to conical tubes and evaporated to dryness under a nitrogen air flow in a
heated water bath. The residues were reconstituted with 100 µL trimethylpentane and
200 µL mobile phase A. After shaking for 30 s and centrifugation at 2000 g for 2 min,
50 µL of the lower phase were submitted for HPLC analysis (Figure 3.4). All glassware
was scrubbed before cleaning with chromic acid as described in section 2.2.6.
3.2.3.1.5. Extraction validation
To determine the concentration of ABZ, ABSO and ABSO2 in plasma samples, standard
curves of ABZ, ABSO and ABSO2 against the internal standard BAB after extraction
from blank plasma were generated. Stock solutions between 10-200 µg mL-1 ABZ,
ABSO and ABSO2 were prepared in 5% DMSO in methanol, and 200 µg mL-1 BAB
prepared in methanol. 50 µL of ABZ, ABSO, ABSO2 and BAB were added to triplicate
plasma samples (0.5 mL), with final concentrations between 0.5-10 µg mL-1 plasma for
ABZ, ABSO and ABSO2, and 10 µg mL-1 plasma for BAB. Samples were then
extracted, 50 µL submitted for HPLC analysis, and the ratio to BAB determined.
To determine the efficiency of the extraction method for ABZ, ABSO, ABSO2 and
BAB, blank plasma samples were enriched with these compounds at a concentration of
10 µg mL-1 plasma (above) in triplicate. After extraction (using exactly 3 mL of the
organic phase) and chromatographic analysis, actual drug recovery was determined by
comparison to a standard curve.
The repeatability of the assay was evaluated by determining the relative standard
deviation of blank plasma enriched with ABZ, ABSO and ABSO2 at concentrations of
0.5 and 10 µg mL-1 plasma (n=10). The RSD is expressed as a percentage and is
calculated by dividing the standard deviation by the mean and then multiplying by 100.
RSD (%) =SDx
×100

CHAPTER 3 __________________________________________________________________________________________________________
108
Figure 3.4: Extraction procedure for the measurement of ABZ, ABSO, ABSO2 and
BAB from plasma samples.
0.5 mL plasma sample
50 µL internal standard
1 mL 100 mM phosphate buffer, pH 6.6
5 mL dichloromethane/isopropanol (9:1)
Shake on a rocking platform at 1 cps for 30 min followed by seperation of the layers by centrifugation (2000 g for 2 min)
Remove upper layer and transfer
2-3 mL of the lower organic
layer to a conical glass tube
Evaporate to dryness under a stream of nitrogen at 35ÞC
200 µL Solvent A [30% acetonitrile, 40% 50mM phosphate
buffer pH 6.6 and 30% water (v/v/v)]
100 µL trimethylpentane
Shake for 30 sec followed by separation of the layers by
centrifugation (2000 g for 2 min)
Transfer lower layer to small volume HPLC vials for analysis

CHAPTER 3 __________________________________________________________________________________________________________
109
The mean values (above) were also used to determine the sample bias relative to the
standard curves. Bias is expressed as a percentage and is calculated by taking the
standard curve mean from the sample mean and dividing this with the standard curve
mean and then multiplying by 100.
3.2.3.2. HPLC analysis of oryzalin
3.2.3.2.1. HPLC conditions
A Shimadzu HPLC system consisted of a communications bus module (CBM-10A),
low pressure gradient valve (FCV-10AL), solvent delivery unit (LC-10AD), auto
injector (SIL-10A) and UV-VIS detector (SPD-10AD) connected to a chromatography
workstation (CLASS-LC10). The chromatography was carried out using a 150 x 3.9
mm Waters Symmetry C8 reverse phase column and detection of the OZ was at a
wavelength of 282 nm (UV spectrum of OZ, Figure 2.13 Section 2.2.4.1). The peak area
was integrated. The mobile phase consisted of 35% acetonitrile, 30% methanol and 35%
water (v/v) filtered through 0.45 µm filters.
3.2.3.2.2. HPLC standards
The accuracy of the HPLC assay was determined by preparing a standard curve of OZ.
Standard OZ solutions were prepared in 50% methanol at concentrations between 0.5-
10 µg mL-1. 50µL was then submitted for HPLC analysis.
3.2.3.2.3. Sample preparation
The plasma samples were initially extracted on C18 solid phase extraction tubes (200
mg Extract-Clean tubes - Altech) as per instructions. Each Extract-Clean tube was
conditioned with two tube volumes of methanol followed by two tube volumes of water.
Sample extraction was then carried out with 0.5 mL plasma sample and 1 mL phosphate
buffer (100 mM, pH 6.9) applied to the Extract-Clean tube. The tube was then washed
with 2 mL 2% acetonitrile and vacuum dried for 2 min. The drugs were eluted with 2
Bias (%) =x(actual)− x(standard curve)
x(standard curve)×100

CHAPTER 3 __________________________________________________________________________________________________________
110
mL 100% acetonitrile. Samples were evaporated to dryness under a nitrogen air flow in
a heated water bath and the residues reconstituted with 200 µL hexane and 200 µL
mobile phase. After shaking for 30 s and centrifugation at 2000 g for 2 min, 50 µL of
the lower phase were submitted for HPLC analysis (Figure 3.5). All glassware was
scrubbed before cleaning as described in section 2.2.6.
3.2.3.2.4. Extraction validation
To determine the concentration OZ in plasma samples, a standard curve of OZ after
extraction from blank plasma was generated. Stock solutions between 5-100 µg mL-1
OZ were prepared in methanol, with 50 µL of OZ added to triplicate plasma samples
(0.5 mL), with final concentrations between 0.5-10 µg mL-1 plasma. Samples were then
extracted and 50 µL submitted for HPLC analysis.
To determine the extraction efficiency of the extraction method for OZ, blank plasma
samples were enriched with OZ at a concentration of 10 µg mL-1 plasma (above) in
triplicate. After extraction and chromatographic analysis, actual drug recovery was
determined by comparison to a standard curve. The relative standard deviation (RSD)
and bias were determined as described in section 3.2.3.1.5.
3.2.4. Statistical analysis
Data analysis of pharmacokinetic experiments was carried out to determine the
summary statistics (AUC (no smooth curving, 0-t), Cmax and Tmax) of each
pharmacokinetic experiment, and to compare between pharmacokinetic experiments
using repeated measures ANOVA and Bonferonni’s post test. In addition, linear
regression was performed on all standard curves. All analysis was performed using
GraphPad Prism version 3.0a for Macintosh, GraphPad Software, San Diego California
USA.

CHAPTER 3 __________________________________________________________________________________________________________
111
Figure 3.5: Extraction procedure for the measurement of OZ from plasma samples.
Col
umn
Prep
arat
ion
Sam
ple
Extra
ctio
n
add 1 mL 100 mM phosphate buffer (pH 6.9) + 50 µL internal standard + 0.5 mL plasma sample
Evaporate to dryness under nitrogen
200 µL mobile phase
200 µL hexanes
Vortex (1 min) followed by seperation of the layers by centrifugation (2000 g for 2 min)
Transfer lower layer to small volume HPLC
vials for analysis
2 column volumes methanol
VacuumDiscard
2 column volumes
water
VacuumDiscard
VacuumDiscard
2 mL 2% acetonitrile
and 2 column volumes water
VacuumDiscard
vacuum dry 2 min
VacuumDiscard
2 mL 100% acetonitrile
into centrifuge
tube

CHAPTER 3 __________________________________________________________________________________________________________
112
3.3. RESULTS
3.3.1. Albendazole
3.3.1.1. Albendazole chromatography and standard curves
Under the HPLC conditions described, the retention times for ABZ, ABSO, ABSO2 and
BAB were 7.6, 3.6, 5.2 and 8.7 min respectively, at a flow rate of 1.5 mL min-1 (Figure
3.6). The accuracy of the HPLC assay was determined by preparing standard curves of
ABZ, ABSO and ABSO2 and BAB. A comparison between standard curves generated
using peak area and peak height found peak height to be more accurate for all four
compounds. Peak height was therefore used for the rest of experiments. Peak height of
ABZ, ABSO, ABSO2 and the internal standard BAB was found to increase linearly at
drug concentrations between 2-25 µg mL-1 (Figure 3.7) (Linear regression, r=0.9992,
0.9984, 0.9991 and 0.9995 for ABZ, ABSO, ABSO2 and BAB respectively).
3.3.1.2. Albendazole extraction validation
Following plasma extraction, ABZ, ABSO and ABSO2 were quantified by height
against that of the internal standard BAB (Figure 3.6). No interfering peaks were
present in blank plasma for ABZ, ABSO, ABSO2 or BAB. The LOD of the drugs for
the assay following plasma extraction was calculated at three times the baseline noise.
The LOQ was calculated at five times the baseline noise (Table 3.2).
Table 3.2: The HPLC detection and quantitation limits for ABZ, ABSO, ABSO2 and
BAB following extraction from plasma.
Compound Detection Limit (ng mL-1) Quantitation Limit (ng mL-1) ABZ 120 200 ABSO 80 130 ABSO2 45 75 BAB 55 90

CHAPTER 3 __________________________________________________________________________________________________________
113
Figure 3.6: Chromatograms of blank rat plasma (Attn. 6) (a); spiked with ABZ (7.7
min), ABSO (3.6 min), ABSO2 (5.2 min) and BAB (8.7 min) (10 µg mL-1) (Attn. 7) (b);
and plasma from rat treated orally with ABZ and spiked with BAB (10 µg mL-1) (Attn.
6) (c).
(a)
(b)
(c)

CHAPTER 3 __________________________________________________________________________________________________________
114
Figure 3.7: HPLC standard curves of ABZ ( ), ABSO (▲), ABSO2 (▼) and BAB ( ) using peak height (mean ± SE, n=3).
To determine the concentration of ABZ, ABSO and ABSO2 in plasma samples, standard
curves of ABZ, ABSO and ABSO2 were generated against the internal standard BAB
after extraction from blank plasma (Figure 3.8). The ratio of the ABZ, ABSO and
ABSO2 peak height to the internal standard (BAB) was calculated and found to be linear
between the drug concentrations 0.5-10 µg mL-1. For ABZ determination, data for the
RSD (below) was included into the standard curve (Linear regression, r=0.9957, 0.9978
and 0.9975 for ABZ, ABSO and ABSO2 respectively). The repeatability of the assay
was evaluated by determining the RSD of blank plasma enriched with ABZ, ABSO and
ABSO2 at concentrations of 0.5 and 10 µg mL-1 (n=10). The mean values were also
used to determine the sample bias relative to the standard curves (Table 3.3). The RSD
of 10 replicate samples from the mean HPLC response for ABZ, ABSO and ABSO2
was 4.8, 4.05 and 4.9% respectively. At 0.5 µg mL-1, ABZ substantially deviated from
the HPLC standard curve, with an over-estimation by 22.2%. However, ABZ is rarely
observed in the plasma of animals orally treated with ABZ. The extraction efficiency of
ABZ, ABSO, ABSO2 and BAB using peak height was 98.5%, 147%, 142%, and 85%
respectively, with the overestimation of ABSO and ABSO2 possibly due to
contaminating metabolites (accounted for in the standard curve).
0 5 10 15 20 25
0
20
40
60
80
100
120
140
160
180
200
ABSO r = 0.9984ABSO2 r = 0.9991BAB r = 0.9995
ABZ r = 0.9992
Drug Concentration (µg mL-1)
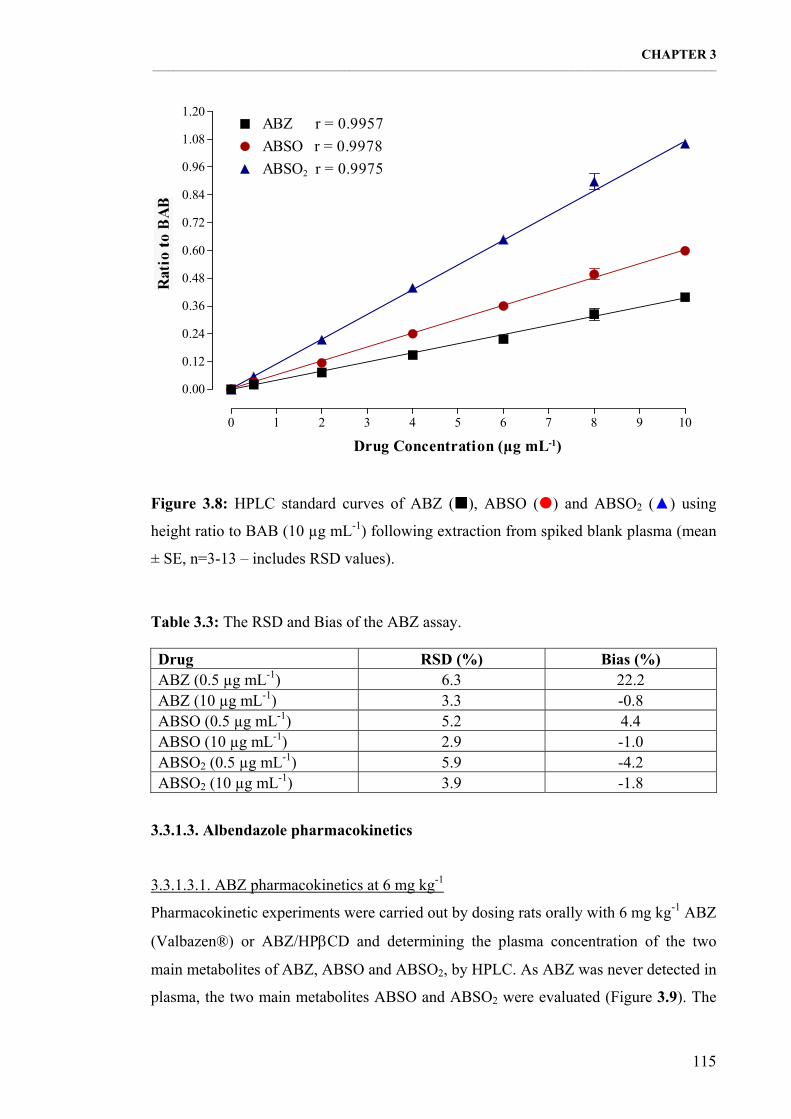
CHAPTER 3 __________________________________________________________________________________________________________
115
Figure 3.8: HPLC standard curves of ABZ ( ), ABSO ( ) and ABSO2 (▲) using
height ratio to BAB (10 µg mL-1) following extraction from spiked blank plasma (mean
± SE, n=3-13 – includes RSD values).
Table 3.3: The RSD and Bias of the ABZ assay.
Drug RSD (%) Bias (%) ABZ (0.5 µg mL-1) 6.3 22.2 ABZ (10 µg mL-1) 3.3 -0.8 ABSO (0.5 µg mL-1) 5.2 4.4 ABSO (10 µg mL-1) 2.9 -1.0 ABSO2 (0.5 µg mL-1) 5.9 -4.2 ABSO2 (10 µg mL-1) 3.9 -1.8
3.3.1.3. Albendazole pharmacokinetics
3.3.1.3.1. ABZ pharmacokinetics at 6 mg kg-1
Pharmacokinetic experiments were carried out by dosing rats orally with 6 mg kg-1 ABZ
(Valbazen®) or ABZ/HPβCD and determining the plasma concentration of the two
main metabolites of ABZ, ABSO and ABSO2, by HPLC. As ABZ was never detected in
plasma, the two main metabolites ABSO and ABSO2 were evaluated (Figure 3.9). The
0 1 2 3 4 5 6 7 8 9 10
0.00
0.12
0.24
0.36
0.48
0.60
0.72
0.84
0.96
1.08
1.20ABZ r = 0.9957ABSO r = 0.9978ABSO2 r = 0.9975
Drug Concentration (µg mL-1)

CHAPTER 3 __________________________________________________________________________________________________________
116
overall concentration time curves were similar between the two formulations, with
ABSO peaking earlier and higher than ABSO2 (Table 3.4). Both the AUC and Cmax of
ABSO were greater for the ABZ/HPβCD complex, resulting in significantly higher
plasma concentrations than that of the commercial formulation (repeated measures
ANOVA with Bonferonni’s post test, p<0.05). However, while the AUC and Cmax of
ABSO2 were greater for the ABZ/HPβCD complex, the plasma concentrations of
ABSO2 of the two formulations were not significantly different (repeated measures
ANOVA with Bonferonni’s post test, p>0.05).
Figure 3.9: Plasma concentrations of ABSO () and ABSO2 (---) following oral administration of a commercial formulation of ABZ (Valbazen® ) and ABZ/HPβCD ( ) in rats (6 mg kg-1) (mean ± SE, n=3).
Table 3.4: Plasma concentrations of ABSO and ABSO2 after oral administrations of ABZ (Valbazen®) and ABZ/HPβCD (6 mg kg-1) (mean ± SE, n=3).
ABZ (Valbazen®) ABZ/HPβCD complex Compound ABSO ABSO2 ABSO ABSO2 TMAX (h) 1 9 1 4 CMAX (µg mL-1) 0.66 0.08 2.59 0.35 AUC (µg mL-1 h) 3.06 0.62 14.91 2.77
0 2 4 6 8 10 12
0.0
0.3
0.6
0.9
1.2
1.5
1.8
2.1
2.4
2.7
3.0ABZ/CD - ABSOABZ/CD - ABSO2
ABZ (Valbazen) - ABSOABZ (Valbazen) - ABSO2
Time After Dosage (h)

CHAPTER 3 __________________________________________________________________________________________________________
117
3.3.1.3.2. ABZ pharmacokinetics at 30 mg kg-1
In a second pharmacokinetic experiment, the pharmacokinetics of the ABZ/HPβCD
complex were compared to that of an ABZ suspension when administered orally at 30
mg kg-1. As ABZ was detected in plasma samples, the plasma concentration of ABZ,
ABSO and ABSO2 were determined by HPLC (Figure 3.10 and 3.11). Again, the
overall concentration time curves were similar between the two formulations, with
ABSO peaking higher than both ABZ and ABSO2 (Table 3.5). Both the AUC and Cmax
of ABSO were greater for the ABZ/HPβCD complex, resulting in significantly higher
plasma concentrations of ABSO than that of the commercial formulation (repeated
measures ANOVA with Bonferonni’s post test, p<0.05). However, while the AUC and
Cmax of ABZ and ABSO2 were greater for the ABZ/HPβCD complex, the plasma
concentrations of ABZ and ABSO2 of the two formulations were not significantly
different (repeated measures ANOVA with Bonferonni’s post test, p>0.05).
Table 3.5: Plasma concentrations of ABSO and ABSO2 after oral administrations of
ABZ (suspension) and ABZ/HPβCD (30 mg kg-1) (mean ± SE, n=3).
ABZ (Suspension) ABZ/HPβCD complex Compound ABZ ABSO ABSO2 ABZ ABSO ABSO2 TMAX (h) 1 6 6 1 6 9 CMAX (µg mL-1) 0.66 14.08 2.04 1.45 23.39 3.9 AUC (µg mL-1 h) 3.19 114.9 15.5 7.4 224.9 29.6
At both 6 and 30 mg kg-1, the ABZ/HPβCD formulations achieved significantly higher
plasma ABSO concentrations than the commercial formulations. In comparing the two
ABZ/ΗPβCD formulations, there is a 10 fold increase in the Cmax and 15 fold increase
in the AUC for a five fold increase in dose.
3.3.2.Oryzalin
3.3.2.1. Oryzalin chromatography and standard curves
Under the HPLC conditions described, the retention time for OZ was 4.7 min, at a flow
rate of 2 mL min-1 (Figure 3.12). No interfering peaks were observed.

CHAPTER 3 __________________________________________________________________________________________________________
118
Figure 3.10: Plasma concentrations of ABZ ( ), ABSO ( ) and ABSO2 (▲) following oral administration of ABZ/ΗPβCD (pH 2.1) in rats (30 mg kg-1) (mean ± SE, n=3).
Figure 3.11: Plasma concentrations of ABZ ( ), ABSO ( ) and ABSO2 (▲) following oral administration of ABZ (Suspension) in rats (30 mg kg-1) (mean ± SE, n=3).
0 2 4 6 8 10 12 14
0
3
6
9
12
15
18
21
24
27
ABZ/CD - ABSO2
ABZ/CD - ABSOABZ/CD - ABZ
Time After Dosage (h)
0 2 4 6 8 10 12 14
0
3
6
9
12
15
18
21
24
27
ABZ - ABSO2
ABZ - ABSOABZ - ABZ
Time After Dosage (h)

CHAPTER 3 __________________________________________________________________________________________________________
119
Figure 3.12: Chromatogram of blank rat plasma (a) spiked with OZ (4.7 min) (2 µg
mL-1) (b), and plasma from rat treated i.p. with OZ (c).
mAbs
20
10
0 2 4 6 8
0
10 min
4.307 6.745 7.243
(a)
mAbs
20
10
0 2 4 6 8
0
10 min
2.414 3.484
4.671
(b)
3.632
mAbs
20
10
0 2 4 6 8
0
10 min
4.718
(c)
3.992
Metabolite A

CHAPTER 3 __________________________________________________________________________________________________________
120
The accuracy of the HPLC assay was determined by preparing a standard curve of OZ
(Figure 3.13). Peak area of OZ increased linearly at concentrations between 0.5-10 µg
mL-1 (Linear regression, r=0.9987).
Figure 3.13: HPLC standard curve of OZ using peak area (r=0.9987) (mean ± SE, n=3).
3.3.2.2. Oryzalin extraction validation
Following plasma extraction, the LOD and the LOQ of OZ were 20 ng mL-1 and 30 ng
mL-1 respectively. To determine the concentration of OZ in plasma samples, a standard
curve of OZ after extraction from blank plasma was generated. The peak area of OZ
was calculated and found to be linear within drug concentrations 0.5-10 µg mL-1 (Figure
3.14). For OZ determination, data for the RSD (below) was included into the standard
curve (Linear regression, r=0.978). The repeatability of the assay was evaluated by
determining the RSD of blank plasma enriched with OZ at concentrations of 0.5 and 10
µg mL-1 (n=10). These values were also used to determine the sample bias relative to
the standard curves (Table 3.6). The RSD of 10 replicate samples from the mean HPLC
response for OZ was 11.75%. At 0.5 µg mL-1, OZ deviated from the HPLC standard
curve with an over-estimation by 11.65%. The extraction efficiency of OZ was 66.4%.
0 2 4 6 8 10
0
100000
200000
300000
400000
500000
600000
700000
Oryzalin Concentration (µg mL-1)

CHAPTER 3 __________________________________________________________________________________________________________
121
Figure 3.14: HPLC standard curve of OZ following extraction from spiked blank
plasma (r=0.987) (mean ± SE, n=3-15 – includes RSD values).
Table 3.6: The RSD and Bias of the OZ assay.
Drug RSD (%) Bias (%) OZ (0.5 µg mL-1) 8 11.6 OZ (10 µg mL-1) 15.5 0.5
3.3.2.3. Oryzalin pharmacokinetics
Pharmacokinetic experiments were carried out by dosing rats i.p. with 25 mg kg-1 OZ or
OZ/ΗPβCD and determining plasma concentration of OZ by HPLC (Figure 3.15). The
overall concentration time curves were similar between the two formulations, with
plasma OZ peaking within the first hour, after which it was observed in very low
concentrations for 8 and 16 h for OZ/ΗPβCD complex and OZ respectively (Table 3.7).
While plasma OZ following OZ/ΗPβCD administration peaked earlier and higher than
after OZ administration, no significant difference was observed between the two overall
concentration time curves (repeated measures ANOVA with Bonferonni’s post test,
0 2 4 6 8 10
0
200000
400000
600000
800000
1000000
1200000
Oryzalin Concentration (µg mL-1)

CHAPTER 3 __________________________________________________________________________________________________________
122
p>0.05). In addition, a yellowish discolouration of the urine was observed for the first
two hours after OZ/ΗPβCD administration.
Figure 3.15: Plasma concentration of OZ following i.p. administration of OZ ( ) and
OZ/ΗPβCD ( ) in rats (25 mg kg-1) (mean ± SE, n=3).
Table 3.7: Plasma concentrations of OZ after oral administrations of OZ and
OZ/ΗPβCD (25 mg kg-1) (mean ± SE, n=3).
OZ OZ/ΗPβCD TMAX (min) 30 8 CMAX (µg mL-1) 5.85 8.06 AUC (µg mL-1 h) 5.30 6.18
0 1 2 3 4
0
2
4
6
8
10
12
Time After Dosage (h)
CHAPTER 3 __________________________________________________________________________________________________________
123
3.4. DISCUSSION
3.4.1. Albendazole
3.4.1.1. Pharmacokinetics of ABZ (Valbazen®) at 6 mg kg-1
The pharmacokinetics of orally administered ABZ in a number of animals (over a range
of doses) has been investigated by numerous researchers (Marriner & Bogan, 1980;
Bogan & Marriner, 1984; Marriner et al., 1986; Delatour et al., 1990; 1991; Wen et al.,
1996a; Torrado et al., 1997; Evrard et al., 1998; Castillo et al., 1999; Dow, 2000). In all
studies the metabolic conversion of ABZ occurred rapidly in the liver. ABSO and
ABSO2 were the main metabolites found, with the occurrence of ABZ negligible or
undetected. The pharmacokinetic profiles of both ABSO and ABSO2 were similar in all
studies, with ABSO peaking earlier and higher than ABSO2. However, the
bioavailability of ABZ is very different across different species. In addition, variable
plasma metabolite concentrations were observed within species at comparable doses,
which may be due to the formulations of ABZ used. Poor absorption of ABZ is likely
due to its low water solubility, with the different formulations of ABZ resulting in
different concentrations of dissolved ABZ in the gastrointestinal fluid. Within studies,
variable plasma concentrations were also often observed, and attributed to the variable
absorption of ABZ rather than to inter-individual differences in the rate of metabolism.
The results of the present study are considerably lower than that observed by previous
comparable studies, which may reflect the Valbazen® suspension, as it tended to
separate quickly.
3.4.1.2. Pharmacokinetics of ABZ/ΗPβCD complex at 6 mg kg-1
The pharmacokinetics of the ABZ/ΗPβCD complex was similar to previous studies, in
that ABSO and ABSO2 were the main metabolites found. However, comparison
between the pharmacokinetic profiles of ABSO for the ABZ/ΗPβCD complex and the
commercial formulation of ABZ (Valbazen®) indicated improved bioavailability of
ABZ when complexed with ΗPβCD, with the AUC and Cmax of ABSO 4.9 and 3.9
times greater than for ABZ (Valbazen®) respectively. This would be due to the

CHAPTER 3 __________________________________________________________________________________________________________
124
increased concentration of dissolved ABZ in the gastrointestinal fluid available for
absorption, and the relatively faster dissociation of the ABZ/ΗPβCD complex to release
free dissolved ABZ, as opposed to suspended ABZ formulations. In addition, ΗPβCD
complexation did not affect ABZ metabolism. The improved bioavailability of the
ABZ/ΗPβCD formulations over conventional formulations is comparable to that
observed by Lange et al., (1988) when ABZ concentrations improved 4 fold in patients
administered 400mg ABZ with a fatty meal over ABZ alone.
3.4.1.3. Pharmacokinetics of ABZ (Suspension) at 30 mg kg-1
As in previous studies, the pharmacokinetics of ABZ using the commercial ‘white
drench’ formulation (Section 3.2.2.1.2) resulted in the rapid metabolic conversion of
ABZ to ABSO and ABSO2, with only low concentrations of ABZ observed. Based on
the relative areas under the curve, the suspension was more effective than the
commercial formulation of Valbazen®. Valbazen® is a commercial formulation
designed for use in cattle and sheep, and is made from raw ABZ. Therefore differences
between the two formulations may result from differences in particle size or other
physiochemical characteristics. In addition, unlike Valbazen®, the white drench did not
separate, with ABZ staying in suspension for longer periods of time.
3.4.1.4. Pharmacokinetics of ABZ/ΗPβCD complex (pH 2.1) at 30 mg kg-1
The pharmacokinetics of the ABZ/ΗPβCD complex (pH 2.1) was also similar to
previous studies, resulting in the rapid metabolic conversion of ABZ to ABSO and
ABSO2, with only low concentrations of ABZ observed. Comparison between the
pharmacokinetic profiles of ABSO for ABZ/ΗPβCD and ABZ (suspension) given at 30
mg kg-1 indicated improved bioavailability of ABZ when complexed with ΗPβCD, with
the AUC and Cmax of ABSO 1.7 and 2 times greater than for ABZ (suspension)
respectively.
The pharmacokinetics of ABZ/CD in multicomponent systems compared to commercial
formulations has been investigated in sheep and mice at 5 and 20 mg kg-1 respectively,
by Evrard et al., (1998) and Castillo et al., (1999). These formulations were

CHAPTER 3 __________________________________________________________________________________________________________
125
administered as solutions of low pH (approximately 3) in order to achieve sufficient
ABZ concentrations. In both cases, ABZ/CD complexation resulted in reduced Tmax,
and greater AUC and Cmax of ABSO (approximately double) over commercial
formulations. In the present study the ABZ/ΗPβCD complex given at 30 mg kg-1 was
also of low pH (pH 2.1), and resulted in approximately double the AUC and Cmax of
conventional formulations at the same dose. Again, this would be due to the increased
solubility of ABZ in the gastrointestinal tract.
At both 6 and 30 mg kg-1, the ABZ/ΗPβCD formulations achieved significantly higher
plasma ABSO concentrations than the commercial formulations. In comparing the two
ABZ/ΗPβCD formulations, there is a 10 fold increase in the Cmax and 15 fold increase
in the AUC for a five fold increase in dose. This indicates improved bioavailability of
ABZ from the pH modified formulation.
ABZ is metabolised to ABSO in the presence of MFMO and/or cytochrome P-450, with
the involvement of these enzymes varying between species and tissues (Section
2.1.2.3.2). ABSO exhibits chirality with two enantiomeric forms present in the plasma.
The plasma concentration of the enantiomers varies between animal species depending
on the involvement of these enzymes, with the (-) ABSO enantiomer dominant in mice
and rats, and (+) ABSO dominant in sheep, dogs and humans (Delatour et al., 1990;
Delatour et al., 1991; García-Rodriguez et al., 2001). After administration the plasma
concentration ratio of (-) and (+) ABSO also changes, which is thought to be due to
substrate enantio-selectivity of the cytochrome P-450-dependent sulphonating reaction
(Auret et al., 1968; Delatour et al., 1991). García-Rodriguez et al., (2001) investigated
the proportion of the enantiomers in mice following oral administration of an ABZ
suspension and an ABZ/ΗPβCD complex. They found that complexation significantly
increased the proportion of the more abundant enantiomer (-), and as the ABZ/ΗPβCD
formulation also exhibited improved anthelmintic activity, proposed that it was the form
responsible for anthelmintic activity. However, these researchers did not elaborate on
the actual plasma concentrations of the enantiomers. This is particularly important as
the ABZ/ΗPβCD complex also resulted in increased plasma ABSO concentrations
(García-Rodriguez et al., 2001). Therefore further research is required into the
relationship between overall the ABSO concentration, the ratio of the enantiomers, and

CHAPTER 3 __________________________________________________________________________________________________________
126
the actual concentrations of the enantiomers following oral administration of an
ABZ/ΗPβCD complex. This is particularly so for species where (+) ABSO is the more
abundant enantiomer. Overall however, these results indicate that ABZ/ΗPβCD
complexation may improve anthelmintic activity not only due to increased ABSO
concentrations, but also due to increased proportions of the anthelmintic enantiomer.
3.4.2. Oryzalin
3.4.2.1. Pharmacokinetics of OZ
The pharmacokinetics of parenterally administered OZ in mice has been investigated by
Dvorakova et al., (1997) and Powis et al., (1997). As was observed in the present
study, orally administered OZ resulted in very low OZ plasma concentrations, and was
attributed to either poor absorption or first pass metabolism. Therefore the
pharmacokinetics of parenterally administered OZ was evaluated, with the
pharmacokinetic profile of OZ similar across studies. Both Dvorakova et al., (1997) and
Powis et al., (1997) also identified a major metabolite of OZ as N-depropyl oryzalin. A
metabolite was observed in the current experiment (Figure 3.12, metabolite A), although
it was not identified and its pharmacokinetics was not followed.
3.4.2.2. Pharmacokinetics of OZ/ΗPβCD complex
In general, the pharmacokinetics of OZ following i.p. administration of OZ was
unaffected by ΗPβCD complexation. Similar results have been observed for other
drug/ΗPβCD complexes following intravenous administration (Arimori & Uekama,
1987; Frijlink et al., 1991b; Löscher et al., 1995). While no significant difference was
observed between the pharmacokinetic profiles of OZ and the OZ/ΗPβCD complex, OZ
plasma concentrations following OZ/ΗPβCD administration peaked earlier and higher
than after OZ administration, and the drug was eliminated from the plasma sooner. Due
to dilution of the complex by distribution fluids and competition for the OZ and ΗPβCD
by plasma components (Section 3.1.2), only a small fraction of parenterally
administered OZ/ΗPβCD is likely to remain complexed. This would be exacerbated as
the nitro groups of OZ are strong hydrogen bonders, with OZ strongly tissue bound.

CHAPTER 3 __________________________________________________________________________________________________________
127
The faster Tmax and higher Cmax of the OZ/ΗPβCD formulation observed is most likely
due to the initial higher mobility of the complex as it moved into the circulatory system
before dissociation occurred. In comparison, the faster plasma OZ elimination and
urine discolouration following OZ/ΗPβCD administration is likely to be due to
increased renal clearance of the drug in the complexed form. While dissociation of the
OZ/ΗPβCD complex is expected in the bloodstream, concentration of both OZ and
ΗPβCD in the kidneys may result in their recomplexation and accelerated elimination.
Similar results have been observed following the intravenous administration of
dexamethasone/HPβCD complex in dogs (Dietzel et al., 1990). As the renal clearance
of HPβCD is rapid, these effects should be manifested soon after drug complex
administration (Habon et al., 1984; Anderson et al., 1990; Dietzel et al., 1990).
Arimori & Uekama, (1987) followed the pharmacokinetics of prednisolone both alone
and complexed with (β and γ) CD following intravenous and intramuscular
administration. While prednisolone/CD complexation did not improve prednisolone
serum levels following intravenous administration, it was improved following
intramuscular administration as a suspension (but not when a solution). This can be
explained by intramuscular administration resulting in similar
dissolution/dissociation/re-complexation characteristics as when administered orally.
Therefore intramuscular administration of OZ may be an alternative to its oral
administration.
3.4.3. Complexation behaviour of inclusion compounds in the gastrointestinal tract
As in the present study, both Evrard et al., (1998) and Castillo et al., (1999)
administered an ABZ/ΗPβCD complex for pharmacokinetic experiments as a solution.
As these experiments did not use the ABZ/ΗPβCD complex as a solid inclusion
compound, dissolution of the formulation was not necessary. This would result in free
ABZ immediately available for absorption. In addition, as the ABZ/ΗPβCD complex
given at 6 mg kg-1 was of a neutral pH, the formulation would not undergo the
dissociation process as a solid inclusion compound would after administration. There
would have been no precipitation of ABZ, with the ABZ not present in all the phases as
described in figure 3.1

CHAPTER 3 __________________________________________________________________________________________________________
128
ABZ/ΗPβCD complex-dissolved + ABZ-dissolved + ΗPβCD-dissolved + ABZ-solid
Therefore, as ABZ was absorbed from the gastrointestinal tract, the amount of free ABZ
would start to immediately decrease, and the amount of excess ΗPβCD would hence
start to increase. Due to the very high stability constant of the ABZ/ΗPβCD complex at
a neutral pH (Chapter 2), excess ΗPβCD would have had a negative impact on the
pharmacokinetics by reducing the amount of free ABZ available for absorption. As can
be seen in figure 3.9 and table 3.4 however, there was still a substantial increase in both
AUC and Cmax over conventional formulations.
In comparison, the ABZ/CD formulations of Evrard et al., (1998) and Castillo et al.,
(1999), and the ABZ/ΗPβCD complex given at 30 mg kg-1, were of a low pH (between
2.1-3). Upon reaching the small intestine, where the pH is between 7-8, the pH of the
formulations would be raised, resulting in the precipitation of ABZ. Therefore the
amount of excess CD would not increase until free ABZ started to decrease. This would
occur only after all precipitated ABZ was redissolved, as the equilibrium that exists
between free CD, free ABZ and the ABZ/CD complex would continue to redissolve the
precipitated ABZ as the free ABZ is removed by absorption into the circulation. This is
because complexation lowers the thermodynamic activity of the dissolved drug, with
more drug dissolving until the activity of the free drug, which is in chemical equilibrium
with the complex, becomes equal to the thermodynamic activity of the pure solid drug
(Jones et al., 1984). The detrimental effect of excess CD would not be observed until
the majority of the ABZ was already absorbed, resulting in greater AUC and Cmax.
3.4.4. Conclusion
Orally administered ΗPβCD did not exceed 1.5 g kg-1, and thus within the limits for
orally administered HPβCD as described by Strattan, (1992) (Section 1.7.1). The
ABZ/ΗPβCD complex at 30 mg kg-1 was formulated in 60% ΗPβCD at pH of 2.1.
Intragastric administration by intubation of this formulation had no adverse effects. The
ABZ pharmacokinetic experiments revealed that complexation of ABZ with ΗPβCD
improved drug bioavailability systemically, indicating a potential for improved efficacy

CHAPTER 3 __________________________________________________________________________________________________________
129
of ABZ against systemic parasites such as malaria and Echinococcus over conventional
ABZ formulations.
ΗPβCD administered i.p. did not exceed 0.72 g kg-1, and was also within the limits for
single dose of HPβCD by parenteral administration as described by Strattan, (1992). In
comparison, the OZ/ΗPβCD complex at 25 mg kg-1 was formulated in 60% ΗPβCD at
pH of 11. Administration of this formulation i.p. at 0.1 mL kg-1 appeared to cause no
adverse effects. However larger or multiple doses of this formulation resulted in
chemical peritonitis and metabolic alkalosis. In addition, the results of the OZ
pharmacokinetic study did not indicate that the OZ/ΗPβCD complex would result in
improved bioavailability of OZ for the treatment of systemic parasites.

CHAPTER 4 __________________________________________________________________________________________________________
130
CHAPTER 4. CYTOTOXICITY AND IN VIVO
CONSUMPTION OF ΗPβCD COMPLEXES
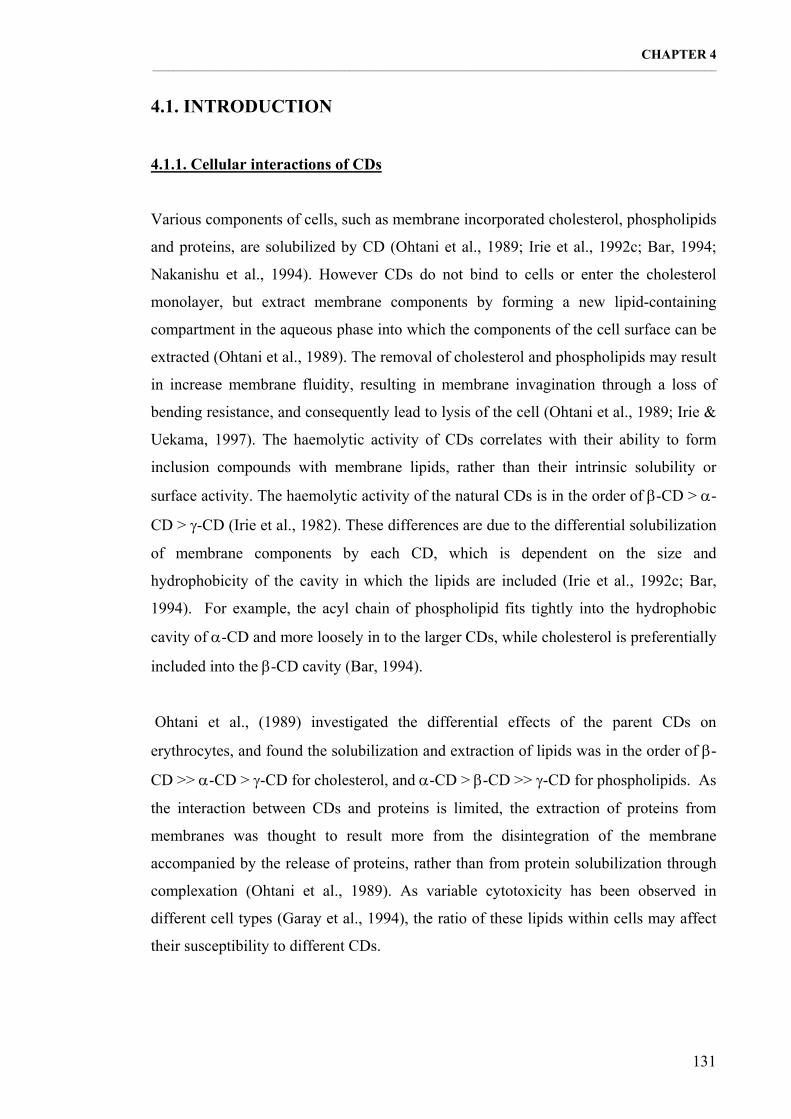
CHAPTER 4 __________________________________________________________________________________________________________
131
4.1. INTRODUCTION
4.1.1. Cellular interactions of CDs
Various components of cells, such as membrane incorporated cholesterol, phospholipids
and proteins, are solubilized by CD (Ohtani et al., 1989; Irie et al., 1992c; Bar, 1994;
Nakanishu et al., 1994). However CDs do not bind to cells or enter the cholesterol
monolayer, but extract membrane components by forming a new lipid-containing
compartment in the aqueous phase into which the components of the cell surface can be
extracted (Ohtani et al., 1989). The removal of cholesterol and phospholipids may result
in increase membrane fluidity, resulting in membrane invagination through a loss of
bending resistance, and consequently lead to lysis of the cell (Ohtani et al., 1989; Irie &
Uekama, 1997). The haemolytic activity of CDs correlates with their ability to form
inclusion compounds with membrane lipids, rather than their intrinsic solubility or
surface activity. The haemolytic activity of the natural CDs is in the order of β-CD > α-
CD > γ-CD (Irie et al., 1982). These differences are due to the differential solubilization
of membrane components by each CD, which is dependent on the size and
hydrophobicity of the cavity in which the lipids are included (Irie et al., 1992c; Bar,
1994). For example, the acyl chain of phospholipid fits tightly into the hydrophobic
cavity of α-CD and more loosely in to the larger CDs, while cholesterol is preferentially
included into the β-CD cavity (Bar, 1994).
Ohtani et al., (1989) investigated the differential effects of the parent CDs on
erythrocytes, and found the solubilization and extraction of lipids was in the order of β-
CD >> α-CD > γ-CD for cholesterol, and α-CD > β-CD >> γ-CD for phospholipids. As
the interaction between CDs and proteins is limited, the extraction of proteins from
membranes was thought to result more from the disintegration of the membrane
accompanied by the release of proteins, rather than from protein solubilization through
complexation (Ohtani et al., 1989). As variable cytotoxicity has been observed in
different cell types (Garay et al., 1994), the ratio of these lipids within cells may affect
their susceptibility to different CDs.

CHAPTER 4 __________________________________________________________________________________________________________
132
The surface activity of the chemically modified CDs is an additional factor that may
further enhance their interactions with cells (Bar, 1994). The haemolytic activity of
some derivatized CDs in comparison to β-CD is reported to be in the order of partially
methylated β-CDs ≈ methyl β-CD > DMβCD ≈ RMβCD ≈ β-CD > HPβCD (Garay et
al., 1994). Irie et al., (1992c) found that methylated CDs significantly extracted
membrane lipids such as cholesterol and phospholipids from the nasal mucosa, and
were capable of interacting with, and sequestering, Ca2+, which is also likely to result in
membrane erosion. In comparison, HPβCD resulted in minimal membrane erosion (Irie
et al., 1992c; Shao et al., 1992; Marttin et al., 1995). In addition, certain types of CDs
(at appropriate concentrations) may weakly and non-destructively interact with certain
cells based on hydrogen bonding between the hydroxylic groups of CDs and ionophoric
groups on the cell wall and membrane. It is also possible for hydrophobic interactions
to take place between chemically modified CDs and hydrophobic components of the
cell wall and membrane (Bar, 1994). These interactions have been suggested to explain
enhancement in microbial growth of Streptomyces (Sawada et al., 1990) and enhanced
microbial conversions in Saccharomyces cerevisiae (Singer et al., 1991) and
Rhodococcus erythropolis (Jadoun & Bar, 1993b). Either interaction could generate a
higher affinity of CD complexes to cells, potentially resulting in the targeting of
compounds to particular cells.
Damage due to CDs observed in vitro is often not observed in vivo. While dilution is
the most obvious factor, plasma and tissues also have considerable buffering capacity
towards the adversary action of CD solubilizers (contain a variety of complexable
lipophiles) (Pitha, 1992; Garay et al., 1994). In addition, CDs are non-specific
solubilizers that deplete membrane lipids in a uniform way, a type of damage that cells
can repair efficiently (Pitha, 1992). In the intestine, β-CD was found to liberated
cholesterol from the intestine only after the removal of mucin from the luminal surface
of the gastrointestinal tract by treatment with N-acetyl-L-cysteine (Nakanishu et al.,
1990 and 1994). Therefore, mucin potentially disturbs the direct interaction of CD (and
drugs) with the mucosal membrane after oral administration.

CHAPTER 4 __________________________________________________________________________________________________________
133
4.1.2. Effect of CD on drug membrane diffusion
As already discussed, CD molecules bring the hydrophobic guest molecules into
solution, keep them in the dissolved state, transport them to the lipophilic membrane,
and deliver them to the cell (Szejtli, 1991b). Therefore transepithelial transport is
attributed to a sequential dissociation-diffusion-partition process that provides free drug
molecules to the cell, rather than the complex transferring the drug to the cell surface
via a collision-mediated process (Ohtani et al., 1989; Cho et al., 1995). The rate of
passive diffusion of complexed drugs is affected by both drug characteristics (size,
solubility, lipophicity) and complex characteristics (stability constant, solubility)
(Duchêne et al., 1987). For example, the more stable the complex, the lower the
diffusion, and the longer the time period over which drug diffusion can be maintained
(Jones & Grant, 1984).
At low CD concentrations, the extraction of membrane components can result in
increased cell permeability without adversely affecting cell viability. Therefore CDs
may also act as drug absorption enhancers, with the transport enhancing properties of
the CDs correlating with the lipophilicity of their core (Hovgaard & Brøndsted, 1995).
DMβCD in particular has been found to be one of the most powerful CD drug
absorption enhancers (Merkus et al., 1991; Irie et al., 1992c; Shao et al., 1992; 1994;
Garay et al., 1994; Hovgaard & Brøndsted, 1995; Marttin et al., 1995). For example,
DMβCD has been found to be a potent enhancer of insulin absorption after oral or nasal
administration, with enhanced absorption attributed to increased membrane
permeability (Merkus et al., 1991; Irie et al., 1992c; Shao et al., 1992; 1994). However,
the effects of CDs on cell membranes can also be inhibited by drug complexation (Irie
& Uekama, 1997). Other factors that may contribute to increased drug bioavailability
due to CDs is the inhibition of proteolytic activity on complexed drugs, and the
disassociation of drug oligomers upon complexation (Irie et al., 1992c; Shao et al.,
1992). For a review of drug absorption enhancement by CDs, see Marttin et al., (1996).
Administration of drug/CD complexes has also been found to reduce drug-induced
hemolysis or irritation. This is achieved at low CD concentrations, where CDs both
reduce the surface activity and decrease the uptake of drugs by cells (Uekama et al.,

CHAPTER 4 __________________________________________________________________________________________________________
134
1981). This has been attributed to a decrease in the effective drug concentration
through inclusion complex formation rather than the direct stabilizing interaction of CD
with the cell membrane (Uekama et al., 1981; 1983). Hence the tolerable level of toxic
substances that can be complexed by CD increases (Szejtli, 1992). This protective
effect correlates with the stability constants of the drug/CD complexes (Uekama et al.,
1983).
4.1.3. Aim
The purpose of this study was to investigate the in vitro cytotoxicity of the antiparasitic
agents ABZ and OZ both alone and complexed, and to investigate the cytotoxicity of
HPβCD. In addition, the in vivo consumption of ΗPβCD by rats was investigated to: 1)
determine if rats would drink ΗPβCD solutions, and 2) ensure no adverse effects would
come to animals when given drug/ΗPβCD solutions in later experiments (Chapter 5).

CHAPTER 4 __________________________________________________________________________________________________________
135
4.2. METHODS
4.2.1. Cytotoxicity of drug/ΗPβCD complexes and ΗPβCD
Cytotoxicity to host cells was determined using the CytoTox 96® assay kit (Promega,
USA). This is a colourmetric assay that measures lactate dehydrogenase released as a
consequence of compromised cellular and membrane integrity. The assay was
performed according to the manufacturer’s instructions in quadruplicate, with
absorbance values determined in duplicate.
4.2.1.1. Preparation of HCT-8 cells
The cultivation of the human ileocaecal adenocarcinoma cells (HCT-8 cells) was as
described in section 6.2.1.2, and cultivated HCT-8 cells were prepared for growth in 24
microwell plates as described in section 6.2.2.1. The cells were suspended in 12.5 mL
of warm medium and 500 µL aliquots per well were then dispensed into 24 microwell
plates. These were incubated at 37°C in 5% CO2 for 24 h before media was removed
and drugs administered. Cells were confluent when exposed to drugs.
4.2.1.2. Administration of drugs
The cytotoxicity of ABZ and OZ dissolved in DMSO was compared to these drugs
when formulated in ΗPβCD, and evaluated against HCT-8 cells. In addition, the
cytotoxicity of ΗPβCD was investigated. 100 mM solutions of ABZ and OZ were
made up in 100% DMSO and then diluted in 100% DMSO to x1000 the concentration
required in the experiments. These were then diluted 1/1000 in 1% FBS RPMI media
(Section 6.2.1.2.1) to create the concentrations required during the course of the
experiment. The final DMSO concentration in the cultures containing DMSO was 0.1%.
The required ΗPβCD concentration was made up in 1% FBS RPMI media.
ABZ/ΗPβCD and OZ/ΗPβCD were diluted from stock solutions with 1% FBS RPMI
media and investigated over the same concentration range as the drugs dissolved in
DMSO. 500 µL of each drug solution was added to the HCT-8 cells randomly in
quadruplicate and incubated for 24 h. The control cultures contained either drug vehicle

CHAPTER 4 __________________________________________________________________________________________________________
136
or dH2O as appropriate. The assay also required 4 additional controls, which were
included in quadruplicate. These were:
1. Media Control (background absorption)
2. Cell Spontaneous Release Control (accounts for LDH spontaneously released)
3. Cell Lysis Control (maximum LDH release)
4. Media Volume Control (control for Cell Lysis)
4.2.1.3. CytoTox 96 assay procedure
Drug experiments were carried out for 24 h. 45 min before the completion of the
experiment, 50 µL lyse solution (9%(v/v) Triton® X-100) was added to the Cell Lysis
Control and the Media Volume Control. On completion of the experiment, all the
samples were centrifuged at 240 g for 4 min before dilution. The Cell Lysis Control
samples were diluted 1:50, all other samples were diluted 1:20. 50 µL was then added
to a 96 well plate, followed by 50 µL reconstituted substrate mix (kit), and the plate
covered in alfoil and incubated of 30 min at room temperature. After 30 min, 50 µL
stop solution (1M acetic acid) was added, any bubbles were removed, and the
absorbance read at 490 nm within 1 h.
4.2.1.4. Calculations
1. Determine averages and account for dilutions
2. Subtract the absorbance of the Media Control from the experimental samples
and Cell Spontaneous Release Control
3. Subtract the absorbance of the Media Volume Control from Cell Lysis Control
4. Determine cytotoxicity with the formula:
% Cytotoxicity =Experimental - Spontaneous Release
Corrected Total Cell Lysis×100

CHAPTER 4 __________________________________________________________________________________________________________
137
4.2.1.5. Statistical analysis
LDH release from control and drug treated cultures were compared using t-tests.
Analysis was performed using GraphPad Prism.
4.2.2. ΗPβCD consumption in vivo
4.2.2.1. Origin and housing of experimental animals
Three to seven-week-old albino male Rattus norvegicus (Sprague Dawley Strain) were
used in all Giardia in vivo experiments. They were housed in an animal house
maintained on a 12:12 h photoperiod at 21-24°C and were fed Rat and Mouse Cubes
manufactured by Glen Forrest Stockfeeders, Western Australia. Rats were housed two
to three animals per standard rat cage and food was provided ad libitum. All animals
were obtained from the Western Australian State Animal Resource Centre, Perth,
Western Australia. The Murdoch University Animal Ethics Committee, in accordance
with national animal welfare standards, approved the following experiments.
4.2.2.2. ΗPβCD consumption
To determine if the rats would drink ΗPβCD solutions, animals (of specific age) were
housed two to three animals per standard rat cage and given a range of ΗPβCD
concentrations over three to four days. Preference/tolerance for ΗPβCD was determined
by twice daily monitoring of fluid consumption and rat weight. Experiments were
terminated if there was no fluid consumption or if animal weight declined.

CHAPTER 4 __________________________________________________________________________________________________________
138
4.3. RESULTS 4.3.1. Cytotoxicity of drug/ΗPβCD complexes and ΗPβCD alone
4.3.1.1. Cytotoxicity of drug formulations The cytotoxicity of ABZ and OZ against HCT-8 cells was investigated over a range of
concentrations up to 100 µM. Both ABZ and OZ, formulated with ΗPβCD or dissolved
in DMSO, were found to have insignificant cytotoxicity (< 0.8% LDH release compared
to controls) against HCT-8 cells up to 100 µM (t-test, p>0.05). However, while ABZ
was not cytotoxic to cells (insignificant LDH release), it did cause cells to lift from the
wells when administered either alone or as a ΗPβCD complex.
4.3.1.2. Cytotoxicity of ΗPβCD The cytotoxicity of ΗPβCD alone against HCT-8 cells was evaluated (Figure 4.1). It
was found that ΗPβCD concentrations of 2.5% and higher resulted in significant
cytotoxicity, with LDH release greater than 2.5% (t-test at ≥2.5% ΗPβCD, p<0.05).
Figure 4.1: Cytotoxicity of ΗPβCD against HCT-8 cells after 24 h incubation (mean ±
SE, n=4).
0.0 0.5 1.0 1.5 2.0 2.5 3.0 3.5 4.0 4.5 5.0
-10
0
10
20
30
40
50
Hydroxypropyl-ß-cyclodextrin (%)

CHAPTER 4 __________________________________________________________________________________________________________
139
4.3.2. ΗPβCD consumption
In vivo ΗPβCD consumption by rats was measured to determine if they would drink
ΗPβCD solutions, and to ensure no adverse effects would come to animals when given
drug/ΗPβCD solutions in later experiments (Chapter 5). The maximum concentration of
ΗPβCD that was tolerated by the rats was determined as the concentration at which the
animals continued to drink ‘normal’ volumes while maintaining a ‘normal’ increase in
body weight when compared to control animals (given water only). ΗPβCD
concentrations above 5% were found to be less tolerable than water, with concentrations
of 10% ΗPβCD and greater being unacceptable to the animals. This was correlated
with drops in body weight, which resulted in termination of experiments (Figure 4.2).
Tolerance of the ΗPβCD solutions appeared to vary with age (Figure 4.3), with three-
week-old rats having a higher tolerance for ΗPβCD solutions. In fact, ΗPβCD
solutions of 5% and less were consumed in slightly greater amounts than water by
control animals.
Figure 4.2: Average fluid consumption by five to seven-week-old rats given either
water or ΗPβCD solution (mean, n=3).
0 1 2 3 4
0
10
20
30
40
50
60
70
80
90
100
5% CD6.5% CD8.5% CD10% CD20% CD
WATER
Time (days)

CHAPTER 4 __________________________________________________________________________________________________________
140
Figure 4.3: Average fluid consumption by three-week-old rats given either water or
ΗPβCD solution (mean, n=3).
0 1 2 3
0
10
20
30
40
50
60WATER2.5% CD5% CD10% CD
Time (days)

CHAPTER 4 __________________________________________________________________________________________________________
141
4.4. DISCUSSION
4.4.1. Drug cytotoxicity
4.4.1.1. Albendazole
Whittaker & Faustman, (1991) investigated the in vitro developmental toxicity of ABZ
and ABSO on rat embryo cells by assessing their effect on cell growth, cell
differentiation and cytotoxicity using a number of methods. Both ABZ and ABSO were
found to be potent inhibitors of cell growth and differentiation. ABZ was found to be
approximately 50-fold more potent than ABSO, with IC50s of approximately 0.3-0.4 µM
for ABZ and 15-18 µM for ABSO. Cytotoxicity assays for both compounds yielded
higher IC50s, with the inhibition of cell growth and differentiation in the absence of
cytotoxicity attributed to the toxicants being selective for proliferating or differentiating
cells. In addition, both compounds elicited an accumulation of cells in the mitotic phase
of the cell cycle, with these cells raised from the surface of the culture dish. The
increased toxicity of ABZ over ABSO was attributed to the inability of rat embryo cells
to metabolise ABZ to ABSO, and the lower potency of ABSO attributed to its higher
polarity and hence lower lipophilicity, resulting in its lower cellular penetration and
interaction with the target site(s) relative to ABZ. The lack of ABZ cytotoxicity against
HCT-8 cells observed in the present study (greater than 100 µM) could therefore be
attributed to the lack of cellular differentiation or growth occurring during the
cytotoxicity assay, and the cells ability to metabolise ABZ to ABSO. In addition, ABZ
was found to cause cells to lift from the wells when administered either alone or as a
ΗPβCD complex, without any increase in cytotoxicity. Whittaker & Faustman, (1991)
also observed similar results, with >90% of suspended cells (that were previously
attached) still viable, as they were able to exclude trypan blue dye in viability
determinations. However, care must be taken when comparing between different
cytotoxicity systems as differing sensitivities to the benzimidazoles exist between
species. The benzimidazoles are microtubule inhibitors and act by binding dimeric
tubulin (Section 2.1.2), and subsequently interfere with a range of cellular functions
(Section 2.1.1). The ultimate fate of arrested cells after ABZ administration is unclear,
and is probably dependent on the drug concentration, cell type and length of exposure

CHAPTER 4 __________________________________________________________________________________________________________
142
(Whittaker & Faustman, 1992). Therefore the effect of ABZ and its metabolites on both
rapidly proliferating and differentiating cells must be considered when evaluating
treatment regimes for parasitic infections.
In the ABZ pharmacokinetic experiments (Chapter 3), ABZ was rapidly metabolised to
ABSO, with low concentrations of plasma ABZ observed in animals dosed orally with
30 mg kg-1 ABZ and ABZ/ΗPβCD (up to 5.4 µM). The highest concentration of ABSO
achieved in the ABZ pharmacokinetics experiments was 83 µM, with the majority of
ABZ metabolites eliminated from the body within 12 hours. Therefore at these
concentrations (<100 µM), ABZ and its metabolites would have resulted in minimal
overall cytotoxicity. However, their effect on rapidly proliferating and differentiating
cells within the body would be relative to the cells ability to metabolise ABZ and the
length of toxicant exposure.
4.4.1.2. Oryzalin
Previously published results found OZ to inhibit a variety of tumour cells in culture,
with IC50s in the range of 2-25 µM (Dvorakova et al., 1997; Powis et al., 1997). Here
however, OZ exhibited no cytotoxicity against HCT-8 cells (up to 100 µM) using the
CytoTox 96® kit. Reasons for the different results may involve the types of cancer
cells selected, or the criteria for evaluating cytotoxic effect. The method used here
measured cytotoxicity based on LDH release from cultured cells, while previous
methods measured cytotoxicity based on cell proliferation assays. This suggests that
OZ may also be selective for proliferating or differentiating cells, similar to ABZ. These
results are not surprising, as both drugs affect the microtubule system (Section 2.1.1).
This may also explain the reduced efficacy of OZ observed against tumours inoculated
into mice when time between tumour inoculation and OZ administration increased
(Powis et al., 1997).
The maximum plasma concentrations (Cmax) achieved in pharmacokinetic experiments
(Chapter 3) were 17 and 23.3 µM for the OZ and OZ/ΗPβCD formulations respectively
when given to rats i.p at 25 mg kg-1. The pharmacokinetics of OZ in other studies also
resulted in Cmax < 100 µM. Powis et al., (1997) achieved a maximum of 37 µM after s.c.

CHAPTER 4 __________________________________________________________________________________________________________
143
administration of up to 1200 mg kg day-1 for 3 days, while Dvorakova et al., (1997)
achieved 72.2 µM after a single i.p. dose of 200 mg kg-1. Therefore these concentrations
were insufficient to result in any cytotoxic effect against living cells based on the
CytoTox 96® kit. However, the effect of OZ on rapidly proliferating and
differentiating cells within the body must be evaluated, and taken into consideration in
future when determining treatment regimes for parasitic infections.
4.4.1.3. Effect of complexation on drug cytotoxicity
Complexation of ABZ or OZ with ΗPβCD did not induce either positive of negative
effects on drug cytotoxicity. Therefore complexation of these drugs with ΗPβCD did
not result in either increased cytotoxicity due to increased membrane permeability, or
reduced cytotoxicity, particularly for ABZ, due to reduced drug surface activity and
decreased the uptake of drugs by cells due to complexation (Section 4.1.2). The
maximum ΗPβCD concentration for both formulations (at 100 µM) was 0.67 and
0.94% ΗPβCD for ABZ/ΗPβCD and OZ/ΗPβCD respectively, so no adverse effects
from the ΗPβCD alone were expected (see below).
4.4.2. ΗPβCD cytotoxicity
The lack of selectivity and the rapidity with which the guests in CD complexes may be
exchanged make it necessary to evaluate the impact CD has on tissue components.
ΗPβCD was found to be cytotoxic at greater that 2.5% ΗPβCD, probably due to
membrane disruption caused by the dissolution and removal of membrane components.
This effect is likely to be reversible, depending on the capacity for the cells to replace
lost membrane components following the removal of ΗPβCD. The cytotoxicity of
HPβCD has been investigated by a number of reporters (Yoshida et al., 1988; Irie et al.,
1992b; Shao et al., 1992). Shao et al., (1992) found HPβCD at 5% resulted in only
minimal removal of epithelial membrane proteins, with no LDH activity, while Yoshida
et al., (1988) observed cell haemolysis started at 0.5%, with an EC50 of approximately
1.8%. However both found the irritancy of HPβCD to be significantly lower than for α-
CD, β-CD and methylated CDs. Any variability in the results is most likely due to the
degree of substitution of HPβCD, as haemolysis and complexing ability decrease with
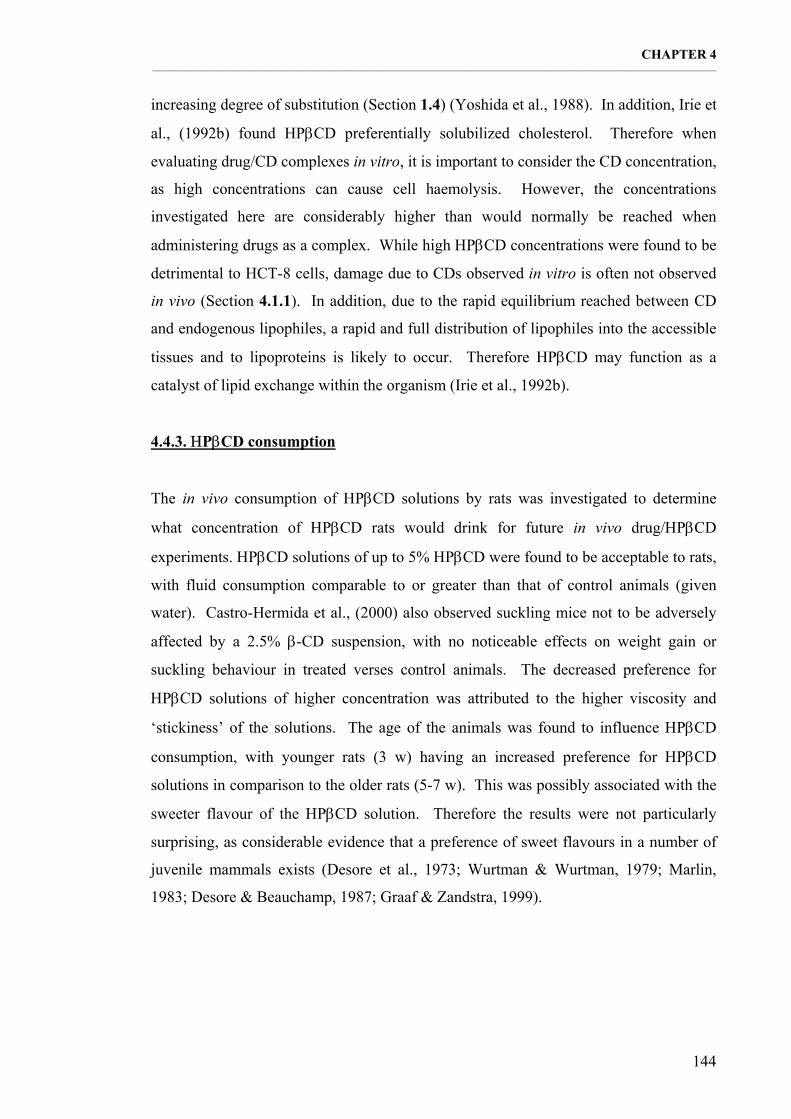
CHAPTER 4 __________________________________________________________________________________________________________
144
increasing degree of substitution (Section 1.4) (Yoshida et al., 1988). In addition, Irie et
al., (1992b) found HPβCD preferentially solubilized cholesterol. Therefore when
evaluating drug/CD complexes in vitro, it is important to consider the CD concentration,
as high concentrations can cause cell haemolysis. However, the concentrations
investigated here are considerably higher than would normally be reached when
administering drugs as a complex. While high ΗPβCD concentrations were found to be
detrimental to HCT-8 cells, damage due to CDs observed in vitro is often not observed
in vivo (Section 4.1.1). In addition, due to the rapid equilibrium reached between CD
and endogenous lipophiles, a rapid and full distribution of lipophiles into the accessible
tissues and to lipoproteins is likely to occur. Therefore HPβCD may function as a
catalyst of lipid exchange within the organism (Irie et al., 1992b).
4.4.3. ΗPβCD consumption
The in vivo consumption of ΗPβCD solutions by rats was investigated to determine
what concentration of ΗPβCD rats would drink for future in vivo drug/ΗPβCD
experiments. ΗPβCD solutions of up to 5% ΗPβCD were found to be acceptable to rats,
with fluid consumption comparable to or greater than that of control animals (given
water). Castro-Hermida et al., (2000) also observed suckling mice not to be adversely
affected by a 2.5% β-CD suspension, with no noticeable effects on weight gain or
suckling behaviour in treated verses control animals. The decreased preference for
ΗPβCD solutions of higher concentration was attributed to the higher viscosity and
‘stickiness’ of the solutions. The age of the animals was found to influence ΗPβCD
consumption, with younger rats (3 w) having an increased preference for ΗPβCD
solutions in comparison to the older rats (5-7 w). This was possibly associated with the
sweeter flavour of the ΗPβCD solution. Therefore the results were not particularly
surprising, as considerable evidence that a preference of sweet flavours in a number of
juvenile mammals exists (Desore et al., 1973; Wurtman & Wurtman, 1979; Marlin,
1983; Desore & Beauchamp, 1987; Graaf & Zandstra, 1999).
CHAPTER 5 __________________________________________________________________________________________________________
145
CHAPTER 5. ANTIGIARDIAL EFFECTS OF THE
DRUG/ΗPβCD COMPLEXES

CHAPTER 5 __________________________________________________________________________________________________________
146
5.1. INTRODUCTION
5.1.1. Giardia
5.1.1.1. Lifecycle
Giardia is a binucleate flagellated protozoan parasite that infects the small intestine of a
number of vertebrate animals (Meyer, 1985; Adam, 1991; 2001). It has a simple
asexual life cycle, which includes a trophozoite and cyst form (Figure 5.1). The
trophozoite multiplies by binary fission and colonises the upper two thirds of the small
intestine by attaching to the mucosa at the bases of the microvilli (Meyer, 1985;
Ampofo et al., 1991). Encystment begins with the trophozoite rounding up to form an
immature cyst. Giardia has two nuclei that then undergo a single division, resulting in
the cyst containing four nuclei. While the initiation of encystation is unknown, it is
thought to be due to either internal signals of the trophozoite, or external factors such as
increased pH, increased bile concentration, or the intestinal contents leaving the
jejunum and beginning to lose moisture (Owen, 1980; Acha & Szyfres, 1987; Farthing,
1993; Eichinger, 2001; Jarroll et al., 2001). The cyst is the dormant phase of the cycle,
which is excreted in the faeces. It is thought that the cyst requires a 3-7 day maturation
period before becoming infective (Ampofo et al., 1991). After ingestion by another host
it excysts after passage through the stomach as a tetranucleate trophozoite and
undergoes cell division to release two trophozoites into the small intestine. Detailed
reviews on Giardia can be found in Feely et al., (1990), Adam, (1991 and 2001), and
Rabbini & Islam, (1994).
5.1.1.2. Morphology
Giardia is an extremely primitive or early diverging eukaryote, and lacks several
prominent organelles, particularly the mitochondria, peroxisomes and the components
for oxidative phosphorylation (Gillin et al., 1996; Adam, 2001; Eichinger, 2001).
However Giardia has two anterior nuclei, and a number of highly evolved cytoskeletal
structures such as four pair of flagellae, a ventral adhesive disc and two median bodies
(Figure 5.2) (Levine, 1985; Adam, 2001).

CHAPTER 5 __________________________________________________________________________________________________________
147
Figure 5.1: Giardia lifecycle (Meyer, 1974).
Figure 5.2: Trophozoite and cyst morphology (Meyer, 1985). AF: anterior flagella, LF:
lateral flagella, CF: caudal flagella, VF: ventral flagella, N: nucleus, AD: adhesive disc,
MB: median bodies, CW: cell wall, SD: fragments of striated disk.
HUMANS
EXTERNAL ENVIRONMENT
death
multiplication by binary fission in
the small intestine
trophozoites on the mucosa of small intestine
excystation in upper small
intestine
trophozoite
cyst
cyst
cyst
INGESTED
EXCRETED
ADN
MB
SD CW N
AD N
AF MB VF
LF
CF

CHAPTER 5 __________________________________________________________________________________________________________
148
The general external morphology resembles a pear cut in half. The dorsal surface is
convex and may be either smooth or pitted, while the ventral surface is concave with a
prominent anterior adhesive disk (Owen, 1980). Internally, the cytoplasm contains both
large and small granules, thought to be glycogen and ribosomes respectively. The cell
periphery however is filled with tubes and vesicles, which appear to form the digestive
system for Giardia, and mainly occurs on the dorsal surface (Owen, 1980; Kattenbach
et al., 1991).
Giardia trophozoites attach to the intestinal epithelium by a rigid adhesive disk
composed of microtubules, microribbons and cross bridges (Holberton, 1973; Holberton
& Ward, 1981; Crossley & Holberton, 1983; Sousa et al., 2001). It is not bilaterally
symmetrical and has a vent in the posterior of the disk (Owen, 1980). The mechanism
of adhesion is unclear, but is thought maintained by reduced pressure beneath the disk
due to disk contraction and flagella beating, with the lateral crest and ventrolateral
flange important structures for attachment (Holberton, 1973; Feely et al., 1982; Sousa et
al., 2001). Giardia has four pairs of posteriorly directed flagellae (Figure 5.2). They
originate within the cytoplasm as axonemes (nine rows of double microtubules
encircling two more microtubules), which pass through the cytoplasm and protrude
from the body covered by a unit of membrane sheath (Owen, 1980). The anterior
flagellae originate between the cell edge and dorsal surface, while the lateral flagellae
from a groove between the margin and dorsal surface. These flagellae provide motion
for the trophozoite when detached, and stir the intestinal fluid when attached (Ghosh et
al., 2001). The ventral flagellae originate from the posterior vent of the adhesive disk
and have fins extending along their entire length, which is thought to aid in expelling
fluid from under the adhesive disk (Holberton, 1973; Owen, 1980). The caudal
flagellae extend from the tapered end and are involved in detachment and providing
internal circulation of cytoplasmic fluids. The median body is an oval aggregate of
curved microtubules, which extend along the caudal flagellae axonemes, and is thought
to reinforce vigorous movement of the caudal flagellae during cytoplasmic pumping and
detachment (Owen, 1980). This is found on the back of the disk and is the structure
used for taxonomic identification (Acha & Szyfres, 1987; Adam, 2001).

CHAPTER 5 __________________________________________________________________________________________________________
149
The cyst has 2-4 nuclei, depending on the maturity of the cyst, and has a number of
fibrillar remnants of trophozoite organelles (Levine, 1985). The cysts are ovoid in
shape, with cell dimensions generally 9 X 12 mm (Ampofo et al., 1991). The cyst is the
infective stage of the lifecycle and is very resistant to environmental factors and
chlorinated disinfectants.
5.1.1.3. Giardia species
It was traditionally believed that Giardia was highly host specific, with different names
given based on the host in which they were isolated from. This resulted in numerous
species being described that were morphologically similar. However morphological
characteristics have since been used to divide the genus into three species, G. agilis, G.
muris and G. duodenalis (Adam, 1991; 2001). G. duodenalis is the only one that can be
cultured in vitro, and hence the most widely studied (Faubert, 1988). Distinctions
between the groups are based on cell dimensions and the morphology of the median
body, although cell dimensions may reflect variation in the host diet and the intestinal
environment, not evolutionary divergence (Owen, 1980; Bertram et al., 1984; Meyer,
1985; Bemrick & Erlandsen, 1988). Electron-microscopic studies have further divided
the G. duodenalis species, with identification of G. microti (rodent parasite), G.
psittacae (parasite of the parakeet) and G. ardeae (parasite of the great blue heron).
Identification of further species or sub-species is likely with the development of new
techniques to distinguish between different strains of Giardia, such as antigenic
differences, isoenzyme studies, serological tests (immunofluorescence) monoclonal
antibody studies and DNA analysis (Meyer, 1985; Bemrick & Erlandsen, 1988; Adam,
2001).
5.1.2. Giardiasis
5.1.2.1. Prevalence and transmission
While G. duodenalis was once considered a commensal of the small intestine, it is now
recognised as a potential hazard to the general population, children in day care centres
and immunocompromised individuals (Farthing, 1993; Thompson, 2000; Linnane et al.,

CHAPTER 5 __________________________________________________________________________________________________________
150
2001). Recent observations indicate that G. duodenalis is the most prevalent intestinal
parasite in the world, particularly among children of developing countries due to
poverty and poor sanitation (McKerrow et al., 1993; Rabbini & Islam, 1994). The
incidence of giardiasis is related to sanitation, with transmission mainly by faecal
contamination. Giardiasis is three times more common in children, as they are less
likely to be concerned about sanitation. In addition, due to their limited exposure to the
organism, they are less likely to have developed any resistance (Levine, 1985; Meyer,
1985; Islam, 1990). The existence of asymptomatic infected individuals, chronic
individuals and the resistance of cysts to environmental conditions are important factors
in the epidemiology (Acha & Szyfres, 1987).
Although person to person contact is the major route of transmission, contaminated
water may serve as a source of infection if it is collected from a wilderness situation
(Bemrick & Erlandsen, 1988; Greig et al., 2001). In addition, the lack of host
specificity of Giardia results in cross transmissions between humans and animals, with
infections confirmed in a great variety of domestic and wild mammals (Acha & Szyfres,
1987; Enriquez et al., 2001). Animals that are commonly thought of as sources of
Giardia are rodents, dogs, cats and hoofed animals (Bemrick & Erlandsen, 1988).
Detailed reviews on G. duodenalis and giardiasis can be found in Smith & Wolfe,
(1980), Pickering & Engelkirk, (1988), Islam, (1990), Wolfe, (1992), Rabbini & Islam,
(1994) and Gillin et al., (1996).
5.1.2.2. Disease and diagnosis
The majority of infections are subclinical, with these infected individuals acting as
carriers (Meyer, 1985). Between 25-50% of people who ingest cysts develop diarrhoea,
with the remainder asymptomatic, although some will pass cysts (Simmons, 1991;
Centers for Disease Control and Prevention (CDC), 2001b). Clinical manifestations
range from mild transient intestinal complaints that resolve spontaneously, to severe
long-standing disease with malabsorption and debilitation. Symptoms of giardiasis are
mainly diarrhoea, bloating, flatulence, nausea, abdominal pain and, less commonly,
vomiting and fever. The incubation period lasts 1-3 weeks after infection. The acute
phase may last 3-4 days, but in the majority of cases it continues for weeks, where it is

CHAPTER 5 __________________________________________________________________________________________________________
151
then accompanied by malabsorption and weight loss (Wolfe, 1978; Acha & Szyfres,
1987; Simmons, 1991; CDC, 2001b).
In patients with acute diarrhoea, both the trophozoite and the cyst phase can be found in
the faeces. However in some patients the examination must be repeated, as cyst
excretion can be variable. Early techniques for the determination of Giardia infections
included examination of duodenal fluid as well as biopsy at the duodenojejunal junction
(Wolfe, 1978). More recently, immunobiologic tests such as indirect
immunofluorescence tests, blastic transformation, macrophage migration inhibition
tests, counterimmunoelectrophoresis and enzyme-linked immunosorbent assays
(ELISA) have been carried out (Acha & Szyfres, 1987; Wolfe, 1992; CDC, 2001b).
5.1.2.3. Treatment and prevention
Currently the most commonly used drugs in the treatment of Giardia infections are the
nitroimidazoles metronidazole and tinidazole. While therapy with these drugs is usually
effective, they have a number of limitations with respect to palatability, systemic
absorption, activity against normal intestinal flora, possible side effects, treatment
failures and potential carcinogenicity (reviewed by Davidson, 1984, Wolfe, 1992,
Gardner & Hill, 2001 and Harder et al., 2001). These limitations are significant
considerations, as drugs may need to be administered repeatedly due to re-infections.
Attempts to improve the chemotherapy of giardiasis were originally hampered by the
lack of in vitro and in vivo modelling systems, but this has since been overcome
(Boreham et al., 1984; Meloni & Thompson, 1987; Reynoldson et al., 1991a).
Subsequently a number of drugs have been evaluated for antigiardial activity in humans.
These include alternative nitroimidazoles, benzimidazoles, tetracyclines and protein
synthesis inhibitors (Boreham et al., 1985; Gordts et al., 1985; Crouch et al., 1986;
Edlind, 1989a and b; Edlind et al., 1990; Morgan et al., 1990; Cedillo-Rivera & Muñoz,
1992; Harris et al., 2001). Of these the protein synthesis inhibitor, paromomycin, is
frequently recommended for treatment of symptomatic giardiasis during pregnancy, due
to its lack of intestinal absorption and the possible teratogenic effects of the other
current antigiardial agents. However, it is known to affect normal intestinal bacteria
(Davidson, 1984; Edlind, 1989a; Adam, 1991; Gardner & Hill, 2001).

CHAPTER 5 __________________________________________________________________________________________________________
152
As Giardia infections are often the result of ingesting viable cysts in contaminated food
and water, methods to reduce food and water contamination, or to destroy or remove
cysts from contaminated food and water, are necessary to prevent the spread of
giardiasis. Therefore public water supplies must be protected from contamination by
human and animal faeces. Alternatively, the use of coagulation-sedimentation-filtration
methods in water treatment plants are necessary to remove cysts and prevent waterborne
giardiasis outbreaks (Wolfe, 1992). While chlorination will kill Giardia, variations in
water temperature, clarity, pH and contact time affect efficacy, so that higher levels (4-
6mg dm) are required (Simmons, 1991). In addition, sanitary elimination of faecal
waste, instruction on personal hygiene in institutions for children, and the treatment of
pets with giardiasis because of the close contact they may have with children are
important measures in guarding against giardiasis (Acha & Szyfres, 1987; Enriquez et
al., 2001).
5.1.3. Benzimidazole action against Giardia
The benzimidazoles ABZ, mebendazole and fenbendazole have exhibited either
comparable or increased efficacy compared with the nitroimidazoles in vitro (Meloni &
Thompson, 1987; Edlind et al., 1990; Cedillo-Rivera & Muñoz, 1992; Reynoldson et
al., 1992). It is currently thought that the primary mode of action of the benzimidazoles
against nematodes involves their ability to selectively bind to tubulin and hence prevent
polymerisation (Section 2.1.2). Microtubules are major components of Giardia
cytoskeletal structures, the adhesive disk, flagellae and median bodies, and thus have an
integral role in maintaining morphology, motility and attachment. Therefore the
integral role of microtubules in the cytoskeleton of Giardia provides a potential drug
target. However it is possible that these drugs exert their effect on the giardins.
Giardins are Giardia specific cytoskeletal proteins and are components of the
microribbons, specific to the ventral disk (Holberton et al., 1988; Peattie et al., 1989;
Peattie, 1990; Nohria et al., 1992). Some support for this may be seen in
benzimidazole-affected Giardia isolates which retain flagella function, even though
flagella rely on tubulin, and not giardins, for their integrity (Edlind et al., 1990; Meloni
et al., 1990; Morgan et al., 1990; Oxberry et al., 1994). Alternatively, the microtubules
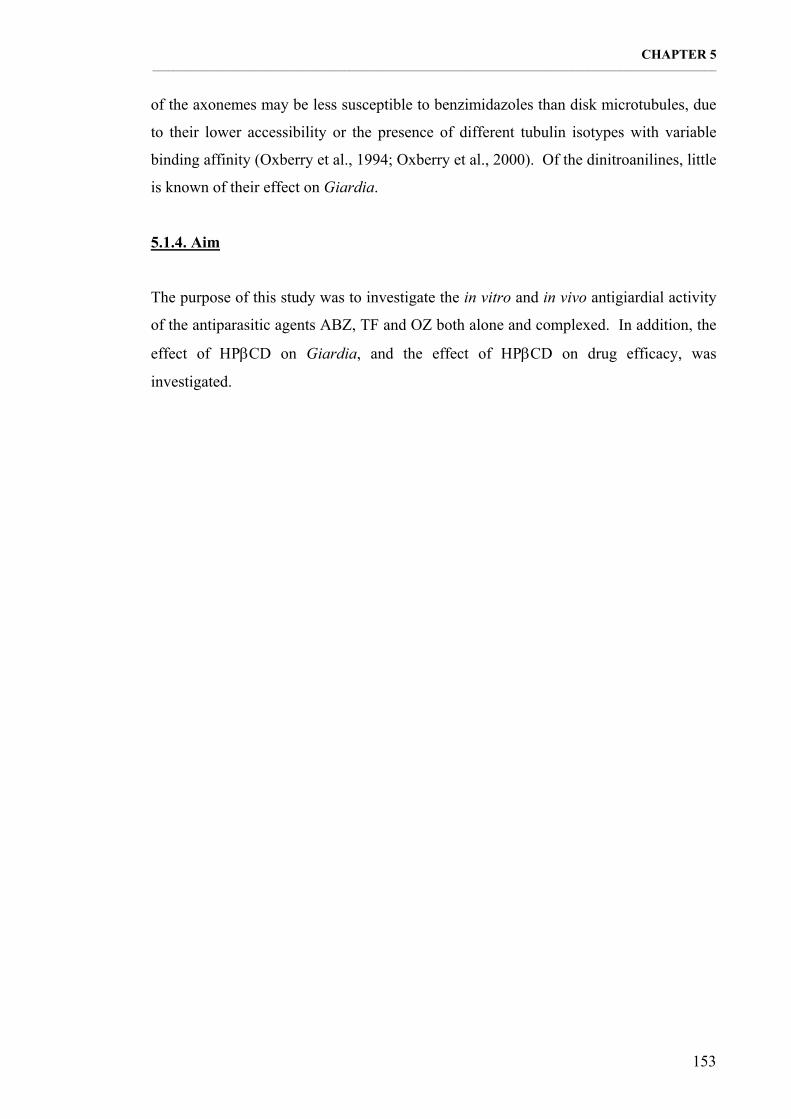
CHAPTER 5 __________________________________________________________________________________________________________
153
of the axonemes may be less susceptible to benzimidazoles than disk microtubules, due
to their lower accessibility or the presence of different tubulin isotypes with variable
binding affinity (Oxberry et al., 1994; Oxberry et al., 2000). Of the dinitroanilines, little
is known of their effect on Giardia.
5.1.4. Aim
The purpose of this study was to investigate the in vitro and in vivo antigiardial activity
of the antiparasitic agents ABZ, TF and OZ both alone and complexed. In addition, the
effect of ΗPβCD on Giardia, and the effect of ΗPβCD on drug efficacy, was
investigated.

CHAPTER 5 __________________________________________________________________________________________________________
154
5.2. METHODS
5.2.1. Maintenance of G. duodenalis in vivo and in vitro
5.2.1.1. Cultivation of G. duodenalis in vitro
5.2.1.1.1. Culture medium for G. duodenalis trophozoites
The G. duodenalis isolate P1c10 (Portland 1: American Type Culture Collection No.
30888, clone 10) was grown in axenic cultures in BI-S-33 medium, pH 6.7 (Meloni &
Thompson, 1987) (Table 5.1).
Table 5.1: BI-S-33 medium preparation for the cultivation of G. duodenalis in vitro.
Ingredients Amount in 1 L Biosate 30 g D-Glucose 10 g Sodium chloride 2.0 g Cysteine-hypochloride monohydrate 2.0 g Di-potassium hydrogen orthophosphate 1.0 g Potassium dihydrogen orthophosphate 0.6 g Ferric ammonium citrate 0.01 g Ascorbic acid 0.2 g Dehydrated bovine bile 0.5 g Antibiotics stock solution: Lincomycin (40 µg mL-1) Ampicillin (40 µg mL-1) Gentamycin (50 µg mL-1)
10 mL
Make up to 900 mL in dH2O. Adjust the pH to 6.7 and filter sterilise at 0.2 µm. NBCS (new born calf serum) 100 mL
5.2.1.1.2. Removal of G. duodenalis trophozoites from cryopreservation
Cryopreserved P1c10 was removed from liquid nitrogen and defrosted quickly at 37°C.
Under sterile conditions approximately 500 µL of the cryopreserved stock was
inoculated into 16 mL borosilicate culture tubes containing warm BI-S-33 medium. The
culture tubes were then filled to capacity with medium to exclude air, inverted twice and
incubated at 37°C at an angle of 10° until monolayer. A monolayer was characterised by
a monolayer of trophozoites attached to the culture tube wall that occurs in the late log
phase of growth (approximately 4 x 10⁶ trophozoites ml-1). Cultures were examined
daily using an inverted microscope (Olympus).

CHAPTER 5 __________________________________________________________________________________________________________
155
5.2.1.1.3. Cultivation of G. duodenalis trophozoites
For the in vitro cultivation of G. duodenalis, healthy cultures that had reached
monolayer were selected for subculturing. The cultures were left at room temperature
for 10 min before rolling the tubes for 1 min to dislodge attached trophozoites. Under
sterile conditions, approximately four drops of the culture was added to 16 mL
borosilicate culture tubes containing warm BI-S-33 medium. The culture tubes were
then inverted twice and incubated at 37°C at an angle of 10° until monolayer. Once the
cultures have reached monolayer they were either subcultured (every 2-3 days),
cryopreserved, or used in drug experiments.
5.2.1.1.4. Cryopreservation of G. duodenalis trophozoites
Healthy cultures that had just reached monolayer were selected for cryopreservation.
The cultures were left on ice for 10 min before rolling the tubes for 1 min to dislodge
attached trophozoites, after which the trophozoite concentration was determined using
an improved Neubauer haemocytometer (B.S.748). The trophozoites were then
concentrated to approximately 1 x 10⁷ cells mL-1 by centrifugation (IEC Centra-4R
centrifuge) at 2000 rpm for 10 min to sediment trophozoites, followed by removal of the
supernatant before resuspending of trophozoites in an appropriate amount of phosphate
buffered saline (PBS, below). An equal volume of sterile 15% dimethyl sulphoxide
(DMSO) was then added so the final DMSO concentration was 7.5% (Lyman &
Marchin, 1984). 1.5 mL aliquots were dispensed into sterile 2 mL cryogenic vials
(Nalgene), which were placed into a cold Cryogenic 1˚C container (Nalgene) (the
container containing isopropanol was placed in freezer for approximately 4 h prior to
use) and put in –80˚C freezer for at least 4 h. The cryopreservation vials were placed in
liquid nitrogen containers once the freezing process was complete.
PBS was prepared by dissolving 8.0 g NaCl, 1.21 g KH2PO4 and 0.34 g K2HPO4 in 1 L
distilled water pH 7.0 and autoclave sterilised before storing at 4˚C.

CHAPTER 5 __________________________________________________________________________________________________________
156
5.2.1.2. Amplification of G. duodenalis in vivo
5.2.1.2.1. Origin and housing of experimental animals
Ten to twelve-day-old Mus musculus (Swiss Quackenbush strain) were used for the in
vivo amplification of G. duodenalis. They were housed with mothers in standard mouse
cages in an animal house maintained on a 12:12 h photoperiod at 21-24°C and were fed
Rat and Mouse Cubes manufactured by Glen Forrest Stockfeeders, Western Australia.
Both food and water were provided ad libitum. All animals were obtained from the
Western Australian State Animal Resource Centre, Perth, Western Australia. The
Murdoch University Animal Ethics Committee, in accordance with national animal
welfare standards, approved the following experiments.
5.2.1.2.2. Infection and amplification of G. duodenalis in vivo
The G. duodenalis strain Rat 4 (isolated at Murdoch University) was used in all in vivo
experiments. This strain is specific for rats, with infections lasting approximately 3
weeks. This strain does not grow in vitro, and therefore needs to be amplified in vivo.
Rat 4 was removed from cryopreservation as described for P1c10 (Section 5.2.1.1.2)
and concentrated to 5 x 10⁶ cells mL-1 by centrifugation at 2000 rpm for 10 min
followed by resuspension in an appropriate amount of PBS. 10-12 day old Swiss
Quackenbush mice were infected orally by stomach intubation with approximately 5 x
105 trophozoites in 0.1 mL PBS using a plastic tube (0.8 mm in diameter) attached to a
blunted needle (23 G) on a 1 mL syringe. Ten days post-infection the mice were
anaesthetised with 80% CO2: 20% O2 and then euthanased by cervical dislocation. The
small and large intestines were removed, cut longitudinally and placed in screw capped
vials containing 5 mL cold PBS. Vials were shaken vigorously for 1 min before the
intestines were removed and the suspension washed through gauze to remove excess
debris. The trophozoite concentration was then determined using a haemocytometer
and the sample prepared for cryopreservation or in vivo drug experiments.
5.2.1.2.3. Cryopreservation of G. duodenalis trophozoites amplified in vivo
Giardia trophozoites isolated in vivo (Section 5.2.1.2.2) were centrifuged (Spintron GT-
20) at 2000 rpm for 10 min to sediment the trophozoites followed by resuspension in
PBS. The procedure was repeated twice more until the supernatant was reasonably clean

CHAPTER 5 __________________________________________________________________________________________________________
157
and to concentrate the cells to approximately 1 x 10⁷ cells mL-1. The trophozoites were
then cryopreserved as described for in vitro cultivated trophozoites (Section 5.2.1.1.4).
5.2.2. Efficacy experiments against G. duodenalis in vitro
5.2.2.1. Drug efficacy experiments
Trophozoites in the late log phase of growth were exposed to a range of drug
formulations (Section 5.2.2.2). Cultures grown to monolayer were left on ice for 10 min
before rolling the tubes for 1 min to dislodge attached trophozoites. The trophozoite
concentration was determined using a haemocytometer, and an appropriate volume of
the trophozoite containing medium was then added directly to the total volume of
medium required for the experiment, with an approximate final concentration between 1
x 105 – 1.5 x 10⁵ trophozoites ml-1. Five mL aliquots of the prepared trophozoites were
then added to 5 mL borosilicate culture tubes, ready for the addition of drugs (Section
5.2.2.2). Once the drugs were added the cultures were incubated at 37°C at an angle of
10°. After incubation for 24 h with constant exposure to drug or vehicle, the medium
was aspirated and replaced with drug-free medium. This needed to be done quickly to
reduce trophozoite exposure to air, as live trophozoites remained attached to the culture
vessel wall. The cultures were incubated for a further 24 h in the manner described,
after which a cell count was determined using an inverted microscope and the
experiment terminated (Section 5.2.2.3).
5.2.2.2. Administration of drugs
ABZ, TF and OZ in two different formulations were tested against G. duodenalis
(P1c10) in vitro. The efficacy of these drugs dissolved in DMSO was compared to their
efficacy when formulated in ΗPβCD. In addition, the efficacy of ΗPβCD and a
commercial form of ABZ (Valbazen®) were also investigated. 10 mM solutions of
ABZ, TF and OZ were made up in 100% DMSO and then diluted with DMSO to create
x1000 the concentrations required during the course of the experiment on the day of the
experiment. ABZ (Valbazen®), ABZ/ΗPβCD, TF/ΗPβCD and OZ/ΗPβCD were
diluted from stock solutions with dH2O and investigated over the same concentration
range as the drugs dissolved in DMSO. Five µL aliquots of the drug solutions were

CHAPTER 5 __________________________________________________________________________________________________________
158
added to 5 mL borosilicate culture tubes containing trophozoites (Section 5.2.2.1). The
final DMSO concentration in the cultures was 0.1%, with the control cultures containing
drug vehicle or water as appropriate. The efficacy of ΗPβCD was investigated by
making stock solutions of ΗPβCD in media and adding 0.5 mL to 5 mL culture tubes
containing trophozoites.
5.2.2.3. Determination of in vitro drug efficacy - counting of trophozoites
Trophozoite viability was determined by their adherence to the side of the glass tube in
which they were grown, and the absence of morphological abnormalities compared with
control cultures. A modification of the method of Meyer, (1970) was used to determine
trophozoite number. Trophozoite number was determined by placing the culture tubes
under an inverted microscope on the same side that they laid during incubation. The
number of viable trophozoites that could be seen in a field of view (diameter 1.72 mm)
using 100 times magnification was counted and given a score (Table 5.2).
Table 5.2: Scoring Method for the Assessment of Trophozoite Viability.
Number of Trophozoites Score 0 0 <1 1 1-10 2 10-25 3 25-50 4 50-100 5 100-250 6 250-500 7 500-1000 8 1000-2000 9 monolayer 10
The scores given to the cultures were used to determine the percentage inhibition of
adherence, which was then used to generate a dose response curve (Section 5.2.4).
Percentage inhibition was calculated using the following formula:
% Inhibition of adherence =score of control culture - score of test culture
score of control culture×100

CHAPTER 5 __________________________________________________________________________________________________________
159
5.2.3. Efficacy experiments against G. duodenalis in vivo
5.2.3.1. Origin and housing of experimental animals
Three-week-old albino male Rattus norvegicus (Sprague Dawley Strain) were used in
all Giardia in vivo experiments. They were housed in an animal house maintained on a
12:12 h photoperiod at 21-24°C and were fed Rat and Mouse Cubes manufactured by
Glen Forrest Stockfeeders, Western Australia. Rats were housed three animals per
standard rat cage and both food and water were provided ad libitum. All animals were
obtained from the Western Australian State Animal Resource Centre, Perth, Western
Australia. The Murdoch University Animal Ethics Committee, in accordance with
national animal welfare standards, approved the following experiments.
5.2.3.2. Efficacy of ABZ and ABZ/ΗPβCD against G. duodenalis in vivo
The efficacy of drug formulations was determined using a modification of the method
described by Reynoldson et al., (1991a). The G. duodenalis strain Rat 4 was used in all
in vivo experiments. Trophozoites that had been amplified in mice (Section 5.2.1.2.2)
were used to infect rats orally by stomach intubation with approximately 5 x 10⁵
trophozoites in 0.1 mL PBS using a plastic tube (0.96 mm in diameter) attached to a
blunted needle (21 G) and 1 mL syringe. Ten days post-infection the rats underwent
drug treatment (below). On the fourth day after commencement of treatment, rats were
anaesthetised using 80% CO2: 20% O2 and then euthanased by cervical dislocation. The
small and large intestines were removed, cut longitudinally and placed in screw capped
vials containing 5 mL and 12.5 mL cold PBS respectively. Vials were shaken
vigorously for 1 min before the intestines were removed and the suspension was washed
through gauze to remove excess debris. The trophozoites were then diluted 1:5 and the
trophozoite concentration determined using a haemocytometer. Cysts in faecal material
were also counted.

CHAPTER 5 __________________________________________________________________________________________________________
160
5.2.3.3. ABZ drug regime
A commercial formulation of ABZ, Valbazen®, was used to compare the efficacy of the
ABZ/ΗPβCD formulation. Valbazen® was diluted with water to 2, 3.3, 6.6, 8, and 10
mg mL-1 and administered at 12 h intervals for three days. Drugs were administered
orally by stomach intubation at 0.1 mL 100 g–1 body weight using a plastic tube (0.96
mm in diameter) attached to a blunted needle (21 G) on a 1 mL syringe.
5.2.3.4. ABZ/ΗPβCD drug regime
The maximum oral dose of ABZ/ΗPβCD that could be achieved by conventional
methods (above) to dose rats with was 6 mg kg-1. As the maximum dosage to be
investigated was greater than this, animals were administered the ABZ/ΗPβCD
formulation in their drinking water. To determine if the rats would drink ABZ/ΗPβCD,
the fluid consumption of rats given a range of ΗPβCD concentrations over three days
was determined (Section 4.2.2). For drug experiments, the ABZ/ΗPβCD formulation
was diluted as necessary based on the ΗPβCD consumption results (Section 4.3.2), with
the ΗPβCD concentration of the ABZ/ΗPβCD formulation not exceeding 5%.
Approximate ABZ/ΗPβCD concentrations of 4, 6.6, 13.2, 16, and 20 mg kg-1 ABZ were
fed to animals, with the actual amount of drug and ΗPβCD consumed determined from
the animals body weight and fluid consumption monitored over the three days. As
Valbazen® was administered twice daily (above), the ABZ/ΗPβCD concentration was
doubled so that the regimes were comparable.
5.2.3.5. ΗPβCD regime
To determine the effect of ΗPβCD on G. duodenalis in vivo, ΗPβCD was administered
to Giardia infected rats in their drinking water at 2, 3.5 and 5% for three days. On the
fourth day of the treatment regimes the rats were anaesthetised using 80% CO2: 20% O2
and then euthanased by cervical dislocation. Trophozoite number was then determined
as described in section 5.2.3.2.
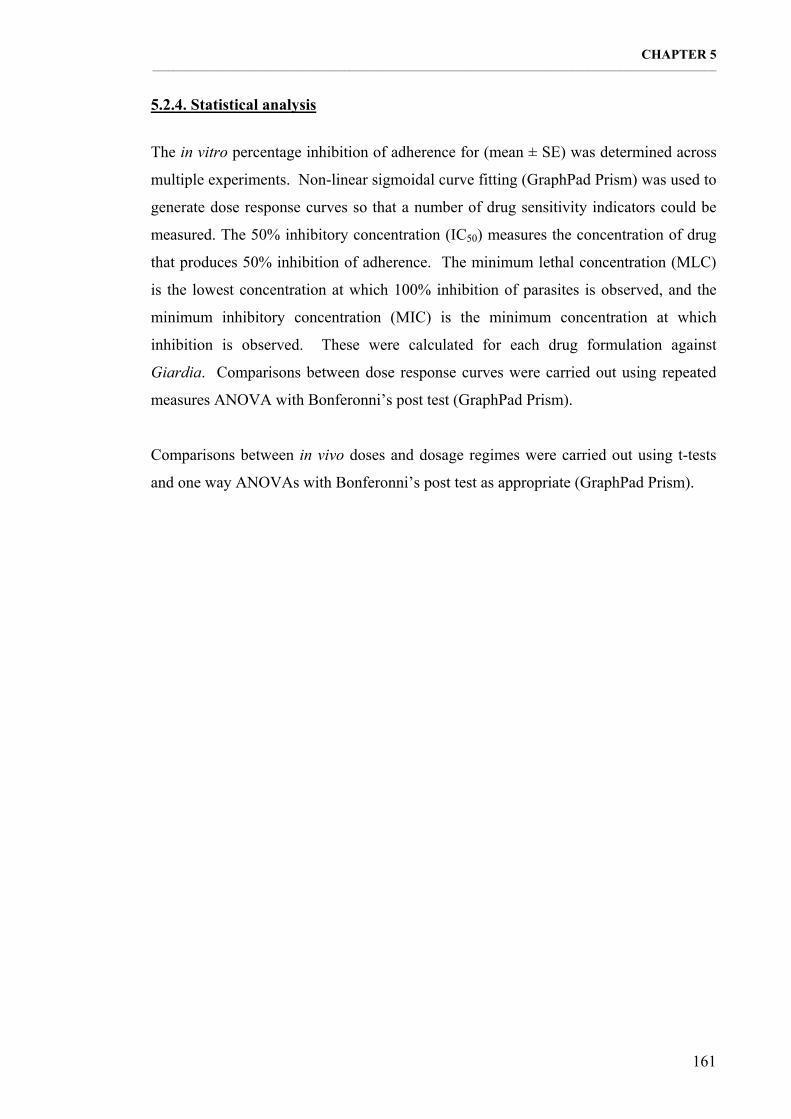
CHAPTER 5 __________________________________________________________________________________________________________
161
5.2.4. Statistical analysis
The in vitro percentage inhibition of adherence for (mean ± SE) was determined across
multiple experiments. Non-linear sigmoidal curve fitting (GraphPad Prism) was used to
generate dose response curves so that a number of drug sensitivity indicators could be
measured. The 50% inhibitory concentration (IC50) measures the concentration of drug
that produces 50% inhibition of adherence. The minimum lethal concentration (MLC)
is the lowest concentration at which 100% inhibition of parasites is observed, and the
minimum inhibitory concentration (MIC) is the minimum concentration at which
inhibition is observed. These were calculated for each drug formulation against
Giardia. Comparisons between dose response curves were carried out using repeated
measures ANOVA with Bonferonni’s post test (GraphPad Prism).
Comparisons between in vivo doses and dosage regimes were carried out using t-tests
and one way ANOVAs with Bonferonni’s post test as appropriate (GraphPad Prism).
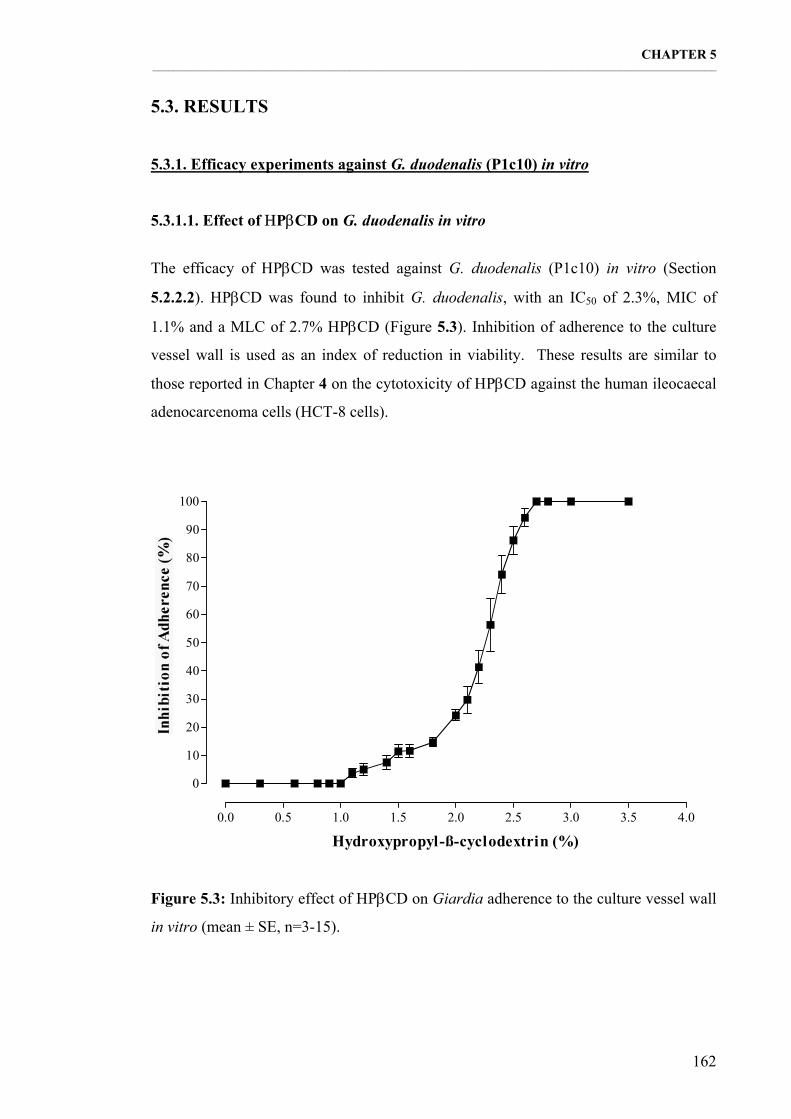
CHAPTER 5 __________________________________________________________________________________________________________
162
5.3. RESULTS
5.3.1. Efficacy experiments against G. duodenalis (P1c10) in vitro
5.3.1.1. Effect of ΗPβCD on G. duodenalis in vitro
The efficacy of ΗPβCD was tested against G. duodenalis (P1c10) in vitro (Section
5.2.2.2). ΗPβCD was found to inhibit G. duodenalis, with an IC50 of 2.3%, MIC of
1.1% and a MLC of 2.7% ΗPβCD (Figure 5.3). Inhibition of adherence to the culture
vessel wall is used as an index of reduction in viability. These results are similar to
those reported in Chapter 4 on the cytotoxicity of ΗPβCD against the human ileocaecal
adenocarcenoma cells (HCT-8 cells).
Figure 5.3: Inhibitory effect of ΗPβCD on Giardia adherence to the culture vessel wall
in vitro (mean ± SE, n=3-15).
0.0 0.5 1.0 1.5 2.0 2.5 3.0 3.5 4.0
0
10
20
30
40
50
60
70
80
90
100
Hydroxypropyl-ß-cyclodextrin (%)

CHAPTER 5 __________________________________________________________________________________________________________
163
5.3.1.2. ABZ efficacy against G. duodenalis in vitro
The in vitro inhibition of G. duodenalis growth by ABZ in three different formulations
was measured, and expressed as a percentage of the growth in untreated cultures. The
efficacy of ABZ when dissolved in DMSO, when formulated with ΗPβCD, and a
commercial form of ABZ (Valbazen®) were investigated. All three formulations were
found to be effective against G. duodenalis in vitro (Figure 5.4). The dose response
curves for the ABZ in DMSO and ABZ/ΗPβCD formulation were not significantly
different (repeated measures ANOVA with Bonferonni’s post test p>0.05), with a mean
IC50 of 118 nM, MIC of 50 nM and MLC of 800 nM (Table 5.3). However, the
commercial form of ABZ (Valbazen®) was found to be significantly different from
both ABZ in DMSO and ABZ/ΗPβCD (repeated measures ANOVA and Bonferonni’s
post test on sigmoidal dose response curves p<0.01), and was less effective with an IC50
of 161 nM, MIC of <50 nM and MLC greater than 800 nM. The dose response curve
for this formulation was highly variable, with this variability and reduced efficacy likely
due to the formulation precipitating out in culture, as it was observed to do in vials.
Figure 5.4: In vitro efficacy of three ABZ formulations against Giardia adherence to
the culture vessel wall (mean ± SE, n=3-21).
-7.50 -7.25 -7.00 -6.75 -6.50 -6.25 -6.00
0
10
20
30
40
50
60
70
80
90
100ABZ in DMSOABZ/CDABZ (Valbazen)
ABZ (Log M)

CHAPTER 5 __________________________________________________________________________________________________________
164
Table 5.3: The IC50, MIC and MLC of three ABZ formulations against G. duodenalis in
vitro.
Drug IC50 (nM) MIC (nM) MLC (nM) ABZ in DMSO 119.3 50 800 ABZ/ΗPβCD 116.5 50 800 ABZ (Valbazen®) 161.3 <50 >800
As previously observed, ΗPβCD is capable of inhibiting G. duodenalis growth. The
ΗPβCD concentration of the ABZ/ΗPβCD complex at the highest dose given (800 nM)
was 0.005%. This is considerably lower than the ΗPβCD concentration required to
inhibit G. duodenalis growth (greater than 1.1%) (Section 5.3.1.1). The effect of low
concentrations of ΗPβCD on the efficacy of the ABZ/ΗPβCD complex against G.
duodenalis in vitro was also investigated (Figure 5.5), and it was found that the efficacy
of the ABZ/ΗPβCD complex declined with the addition of ΗPβCD.
Figure 5.5: Effect of ΗPβCD on the efficacy of the ABZ/ΗPβCD complex against
Giardia adherence to the culture vessel wall (mean ± SE, n=3-10).
-7.50 -7.25 -7.00 -6.75 -6.50 -6.25 -6.00 -5.75 -5.50 -5.25 -5.00 -4.75 -4.50
0
10
20
30
40
50
60
70
80
90
100
ABZ/CD & 0.02% CDABZ/CD & 0.04% CDABZ/CD & 0.08% CDABZ/CD & 0.16% CDABZ/CD & 0.32% CD
ABZ/CD
ABZ (Log M)

CHAPTER 5 __________________________________________________________________________________________________________
165
5.3.1.3. Dinitroaniline efficacy against G. duodenalis in vitro
The dinitroanilines OZ and TF were both ineffective against G. duodenalis in vitro
either complexed or uncomplexed at the maximum concentrations achievable when
complexed with ΗPβCD and the maximum media concentration of ΗPβCD was 1%
(61.3 µM and 1.8 µM respectively). They were therefore not tested in vivo.
5.3.2. ABZ efficacy experiments against G. duodenalis (Rat 4) in vivo
While both trophozoite and cyst numbers from the small intestine, large intestine and
faeces were collected, the faecal cyst and large intestine results were not consistent
within groups and did not reflect any effect from the drug regimes. Therefore only the
results of trophozoite counts from the small intestine and the total G. duodenalis results
(trophozoite and cyst numbers from the small intestine, large intestine and faeces) are
shown.
5.3.2.1. Effect of ΗPβCD on G. duodenalis in vivo
The in vivo efficacy of ΗPβCD alone against G. duodenalis was investigated. When rats
were given ΗPβCD solutions at concentrations between 2% and 5% ΗPβCD,
trophozoite number in the small intestine rapidly declined, with an IC50, MIC and MLC
of 3.2%, 2% and >5% ΗPβCD respectively (Figure 5.6). ΗPβCD did not significantly
affect total G. duodenalis numbers at less than 2% (t-test, p>0.05). Again, these results
are similar to those reported in Chapter 4 on the cytotoxicity of ΗPβCD against HCT-8
cells, and are also comparable the in vitro ΗPβCD results against G. duodenalis
(Section 5.3.1.1). At 3.4 and 5% ΗPβCD, rats were observed to have very soft stool or
diarrhoea. As this was not observed in rats given similar ΗPβCD concentrations or
higher in previous experiments (Section 4.3.2), this was therefore related to the effects
of the G. duodenalis infection in combination with ΗPβCD administration.
5.3.2.2. ABZ efficacy against G. duodenalis in vivo
The in vivo efficacy of a six-dose regime of two ABZ formulations, ABZ/ΗPβCD and
ABZ (Valbazen®), against G. duodenalis was investigated (Figures 5.7 and 5.8).
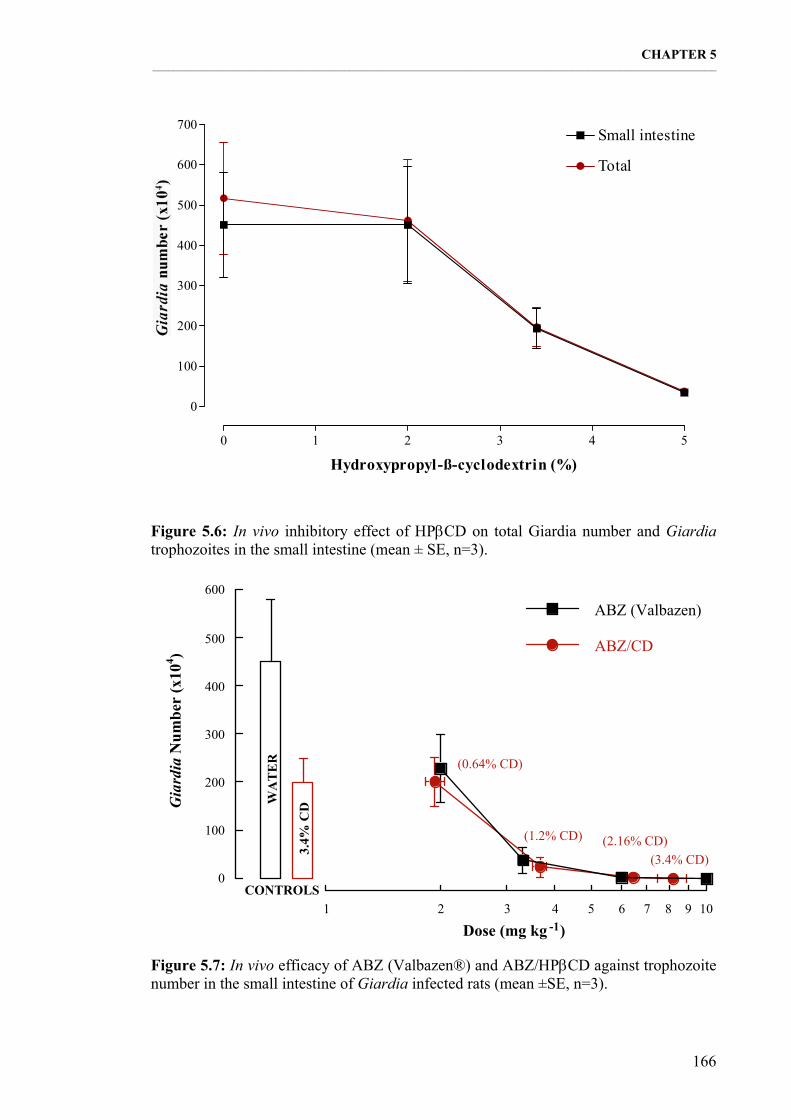
CHAPTER 5 __________________________________________________________________________________________________________
166
Figure 5.6: In vivo inhibitory effect of ΗPβCD on total Giardia number and Giardia trophozoites in the small intestine (mean ± SE, n=3).
Figure 5.7: In vivo efficacy of ABZ (Valbazen®) and ABZ/ΗPβCD against trophozoite number in the small intestine of Giardia infected rats (mean ±SE, n=3).
0 1 2 3 4 5
0
100
200
300
400
500
600
700
Total
Small intestine
Hydroxypropyl-ß-cyclodextrin (%)
0
100
200
300
400
500
600
1 10
Dose (mg kg -1)
ABZ/CD
ABZ (Valbazen)
(0.64% CD)
(1.2% CD) (2.16% CD)
CONTROLS2 3 4 5 6 8
(3.4% CD)
WA
TE
R
3.4%
CD
7 9
Gia
rdia
Num
ber
(x10
4 )

CHAPTER 5 __________________________________________________________________________________________________________
167
Figure 5.8: In vivo efficacy of ABZ (Valbazen®) and ABZ/ΗPβCD against overall Giardia number in Giardia infected rats (mean ±SE, n=3).
The two formulations were found to have similar efficacy against G. duodenalis, both
formulations caused a dose related inhibition of parasite numbers, with doses of 6.4 mg
kg-1 ABZ/ΗPβCD or 10 mg kg-1 ABZ (Valbazen®) completely eliminating G.
duodenalis infections. Trophozoite numbers in the small intestine or total G.
duodenalis numbers at all doses of both ABZ formulations (between 2-10 mg kg-1) were
significantly different to control parasite numbers (t-test, p<0.001). No significant
difference was observed between the two formulations against G. duodenalis
trophozoite numbers in the small intestine or total G. duodenalis numbers (one way
AVOVA with Bonferonni’s post test, p>0.05).
The ABZ/ΗPβCD formulation was administered in the rats’ drinking water, with the
concentration required for a particular dose determined from the consumption of
ΗPβCD solutions by three-week-old rats from previous experiments (Section 4.3.2). In
previous experiments, ΗPβCD solutions of 5% ΗPβCD and less were consumed in
greater amounts than water by control animals. Here however, the ABZ/ΗPβCD
formulation was consumed in amounts comparable to water. This may reflect a possible
change in flavour of ΗPβCD solutions in the presence of complexed ABZ.
0
100
200
300
400
500
600
700
800
1 10
Dose (mg kg -1)
ABZ/CD
ABZ (Valbazen)
CONTROLS
WA
TE
R
3.4%
CD
(0.64% CD)
(1.2% CD)(2.16% CD)
(3.4% CD)
2 3 4 5 6 87 9
Gia
rdia
Num
ber
(x10
4 )

CHAPTER 5 __________________________________________________________________________________________________________
168
5.4. DISCUSSION
5.4.1. Effect of ΗPβCD on G. duodenalis
5.4.1.1. In vitro
At concentrations of ΗPβCD alone greater than 1.1%, G. duodenalis growth was
inhibited in vitro. These results were similar to that of the cytotoxicity assay in section
4.4.2. Thus the effect of ΗPβCD on G. duodenalis trophozoites is probably as
described for HCT-8 cells, and results from membrane disruption caused by the
dissolution and removal of membrane components. This is likely of be reversible,
depending on the capacity for Giardia to repair membrane damage. ΗPβCD was
observed to effect HCT-8 cells at a minimum concentration of 2.5% ΗPβCD, which is
higher than the MIC observed against G. duodenalis trophozoites (1.1%). This may
indicate that G. duodenalis trophozoites membranes are slightly more susceptible to the
effects of ΗPβCD. HPβCD preferentially solubilizes membrane cholesterol (Irie et al.,
1992b). Therefore the effect of other CDs, such as methylated CDs, α-CD and β-CD,
and HPβCD of different degrees of substitution would be worth investigating, as G.
duodenalis trophozoites may have differential susceptibility to these CDs. In addition,
when evaluating drug/CD complexes against G. duodenalis in vitro, it was important to
consider the actual CD concentration, as concentrations greater than 1% inhibit
trophozoite growth.
5.4.1.2. In vivo
ΗPβCD was found to decrease parasite number in Giardia infected rats when
administered as a solution at greater than 2% ΗPβCD. These results are similar to that
observed in the cytotoxicity assay and G. duodenalis trophozoites in vitro, and therefore
also likely to result from trophozoite membrane disruption. In addition, at 3.4 and 5%
ΗPβCD, Giardia infected rats were observed to have very soft stool or diarrhoea, which
was not observed in uninfected rats given similar or higher ΗPβCD concentrations in
previous experiments (Section 4.3.2). As ΗPβCD was effective at eliminating G.

CHAPTER 5 __________________________________________________________________________________________________________
169
duodenalis infections at these concentrations, the occurrence of diarrhoea may be
related to the death and subsequent removal of large amounts of Giardia debris from the
gastrointestinal tract. Alternatively, the capacity for ΗPβCD to complex endogenous
compounds from the gastrointestinal tract, including Giardia components, may be
involved.
5.4.2. Drug efficacy
5.4.2.1. In vitro
ABZ exhibited high efficacy against G. duodenalis in vitro, with an IC50 of 119 nM, and
these results were consistent with other reports (Edlind et al., 1990; Meloni et al., 1990;
Morgan et al., 1990; Cedillo-Rivera & Muñoz, 1992; Katiyar et al., 1994; Oxberry et
al., 1994). While some variability between the IC50s of different studies exists (IC50s
ranging from 38 nM – 4 µM), these differences are due to the different Giardia strains
used, the different methods for assessing drug efficacy, and the use of DMSO to
dissolve drugs. ABZ appears to act irreversibly against Giardia (Meloni et al., 1990;
Morgan et al., 1990). However, research by Oxberry et al., 2000 suggests that Giardia
may be capable of metabolising ABZ to its sulfoxide and sulphone. ABZ is thought to
affect Giardia adherence more so than flagella activity (Edlind et al., 1990; Meloni et
al., 1990; Morgan et al., 1990; Oxberry et al., 1994), with the primary effect of ABZ
against Giardia considered due to its binding to cytoskeletal proteins (tubulin and/or
giardins), particularly of the ventral disk (Edlind, 1989b; Oxberry et al., 1994) (Section
5.1.3). Thus adherence of trophozoites to the culture vessel wall is often used in the
assessment of Giardia viability (Seow et al., 1985; Meloni et al., 1990; Morgan et al.,
1990). HCT-8 cells were also observed to lose their ability to adhere to the culture
vessel wall when cultured in the presence of ABZ (Section 4.4.1.1), indicating a similar
mode of action. However ABZ was not cytotoxic to HCT-8 cells at these
concentrations, indicating that, unlike G. duodenalis, the loss of adherence in these cells
did not interfere with cell survival.
The ABZ/ΗPβCD complex proved to be as effective against G. duodenalis as ABZ
dissolved in DMSO, with an IC50 of 116 nM. The two formulations of ABZ, ABZ in

CHAPTER 5 __________________________________________________________________________________________________________
170
DMSO and the ABZ/ΗPβCD complex, have different characteristics in solution. In the
ABZ in DMSO cultures, the DMSO concentration was consistent, and sufficient to
ensure all administered ABZ remained in solution in the free form. In addition, DMSO
has been reported to stabilise microtubules, which could interfere with the action of
ABZ (Lacey, 1988; 1990). In comparison, the ABZ/ΗPβCD complex presents
dissolved ABZ in two forms, in the free form and as a complex. The identical dose
response curves and IC50s indicated that the complex readily dissociated to make
comparable amounts of ABZ available to inhibit trophozoite growth (in the free form),
similar to the ABZ in DMSO formulation. The efficacy of the ABZ/ΗPβCD complex
may be improved if alternative derivatised CDs were used. For example, the methylated
CDs, particularly DMβCD, may increase drug absorption by increasing cell
permeability (Section 4.1.2). In addition, investigations into alternative derivatised CDs
may reveal CDs that specifically target Giardia trophozoites, by forming weak, non-
destructive interactions (i.e. hydrogen bonding) between the derivatised groups of CDs
and ionophoric groups on the trophozoite cell membrane (Section 4.1.1). CDs with
higher affinity to particular cells could potentially result in the targeting of complexed
drugs to these cells.
The commercial formulation of ABZ had reduced efficacy compared to ABZ dissolved
in DMSO and the ABZ/ΗPβCD complex. However the commercial formulation is
designed for in vivo administered as an oral drench, and therefore unsuitable for in vitro
experimentation. This was reflected in the highly variable results that were observed,
which resulted from the sedimentation of the formulation when administered into in
vitro cultures. In spite of this, the formulation still attained a very high efficacy against
G. duodenalis trophozoites in vitro.
The addition of low concentrations of ΗPβCD to ABZ/ΗPβCD treated cultures resulted
in decreased efficacy of ABZ against G. duodenalis trophozoites in vitro. This effect
has been described in sections 3.1.1 and 4.1.2. The decrease in drug action is attributed
a decrease in the effective drug concentration through inclusion complex formation
rather than an interaction between ΗPβCD and the cell membrane (Uekama et al., 1981;
1983). A drug/CD complex in liquid medium is governed by an equilibrium reaction
between host and guest molecules, i.e.: dissolved complex ↔ free CD + free drug

CHAPTER 5 __________________________________________________________________________________________________________
171
(Duchêne & Wouessidjewe, 1990a). As the drug can only exert its affect when it is
dissolved in solution as free drug, the concentration of dissolved free drug determines
drug efficacy. The administration of low CD concentrations together with the drug/CD
complex results in the dissociation equilibria being shifted toward a higher ratio of
complexed drug in solution (Habon et al., 1984). The extent of this effect correlates
with the stability constants of the drug/CD complexes (Uekama et al., 1983). When the
stability constant is high, which it is for ABZ, then complex dissociation is weak, and
even though the solubility of the drug complex is high, the bioavailability of the drug
remains low, as there are few free drug molecules available for action (Habon et al.,
1984). Therefore excess ΗPβCD effectively 'mops up' free ABZ, decreasing the uptake
of ABZ into G. duodenalis trophozoites.
The dinitroanilines OZ and TF were both ineffective against G. duodenalis in vitro
either complexed or uncomplexed at 61.3 µM and 1.8 µM respectively. These were the
maximum culture concentrations of OZ/ΗPβCD and TF/ΗPβCD that could be achieved
with ΗPβCD concentrations of 1%. Therefore no change in efficacy was observed in
these drugs when complexed with ΗPβCD. Previous experiments at Murdoch
University have also found the dinitroanilines to have limited efficacy against G.
duodenalis in vitro, with IC50s in the mM range (Armson, A. unpublished data).
5.4.2.2. In vivo
Meloni et al., (1988) and Reynoldson et al., (1991b) developed a mouse model to
determine the in vivo effectiveness of ABZ against Giardia infected mice. Reynoldson
et al., (1991a), using this model, found a four-dose regime of ABZ was able to clear
Giardia infections at doses greater than 100 mg kg-1. This model was adapted to
investigate the in vivo effectiveness of ABZ and the ABZ/ΗPβCD complex against
Giardia infected rats. This model was successful, with a six-dose regime of the
commercial formulation of ABZ, Valbazen®, able to clear Giardia infections at doses
greater than 10 mg kg-1. However, unlike Reynoldson et al., (1991a), faecal cyst
numbers in rats did not exhibit a dose related decrease, and were therefore not a reliable
method of determining drug efficacy. The considerably lower doses required to
eliminate Giardia infections in the rat model as apposed to the mouse model is thought

CHAPTER 5 __________________________________________________________________________________________________________
172
to be due to a slower transit time of the drug through the gastrointestinal tract of the rat
in comparison to the mouse, thus increasing the time the parasite was exposed to the
drug (Reynoldson et al., 1991a).
The ABZ/ΗPβCD complex proved to be as effective against Giardia in vivo as the
commercial form of ABZ (Valbazen®). In Chapter 3, the pharmacokinetics of these
two formulations was investigated, and found that administration of the ABZ/ΗPβCD
complex resulted in higher plasma concentrations of ABZ metabolites than for the
commercial form of ABZ. If ABZ was being absorbed to a greater extent systemically,
this could possibly decrease the amount of ABZ available to inhibit Giardia, resulting
in decreased efficacy. However this was not observed. Craft et al., (1987) found oral
antibiotic therapy to be compromised by decreased absorption in the presence of
giardiasis. As Giardia can attach in very high numbers (Feely et al., 1990), they may act
as a physical barrier to drug systemic absorption. In addition, Giardia infections are
known to cause intestinal malabsorption. Some proposed mechanisms for
malabsorption include mucosal damage, increased enterocyte turnover, mucosal
inflammation, bacterial overgrowth, inhibition of lipolysis, or consumption of
conjugated bile salts (reviewed by Farthing, 1986 and Katelaris & Farthing, 1992).
Therefore the Giardia infections may have reduced systemic absorption of the ABZ
from the ABZ/ΗPβCD formulation, with the extent of systemic absorption relative to
the impact of the Giardia infection. In addition, the two formulations were
administered by completely different techniques. Because the ABZ/ΗPβCD
formulation was administered in the drinking water, the ABZ concentration would have
been more consistent over the experimental time frame in comparison to Valbazen®.
Alternatively, if the ABZ/ΗPβCD formulation uncomplexed (and thus precipitated) in
the gut, it would need to redissolve to exert its effect, with dissolution being the rate-
determining step as it is for the commercial preparation. Therefore the mode of
administration would have also impacted on drug efficacy.
Clinical trials have reported ABZ to be effective against Giardia in humans (Zhong et
al., 1986; Hall & Nahar, 1993; Reynoldson et al., 1998), although there have been
conflicting results (Kollaritsch et al., 1993). MBZ, another benzimidazole effective
against Giardia in vitro, also demonstrated variable success (Al-Waili et al., 1988;

CHAPTER 5 __________________________________________________________________________________________________________
173
Gascon et al., 1989). The variable success of these drugs against Giardia may reflect
the formulations used to administer the drugs, as the success of the benzimidazoles is
often attributed to their poor gastrointestinal absorption, therefore resulting in higher
concentrations in the gastrointestinal tract. In addition, the results here indicated that
cyst counts from Giardia infected rats were not a reliable indicator of treatment
effectiveness, as animals with high infections in the gastrointestinal tract could exhibit
variable faecal cyst numbers. Intermittent and variable cyst quantities from Giardia
infected mammals have also been previously reported (Wolfe, 1978; Craft, 1982; Buret
et al., 1991).
5.4.3.Conclusion
The ABZ/ΗPβCD formulation was observed to have equal efficacy against Giardia as
conventional ABZ formulations in vitro and in vivo. Alternative formulations, such as
pH modified ABZ/ΗPβCD formulations (Section 2.3.1.2), may result in increased
efficacy (more ABZ in solution for longer period of time; Section 3.4.3), equal efficacy,
or decreased efficacy (increased systemic absorption). Such formulations cannot be
investigated in vitro due to precipitation of ABZ, an undesirable effect in vitro, although
an appropriate (and expected) effect in vivo. ΗPβCD was also found to reduce ABZ
efficacy. This is attributed a decrease in the effective drug concentration through
inclusion complex formation. In addition, at significantly higher concentrations,
ΗPβCD alone was also effective against Giardia in vitro and in vivo, possibly due to the
extraction of membrane components.

CHAPTER 6 __________________________________________________________________________________________________________
174
CHAPTER 6. IN VITRO ANTICRYPTOSPORIDIAL
EFFECTS OF THE DRUG/ΗPβCD COMPLEXES

CHAPTER 6 __________________________________________________________________________________________________________
175
6.1. INTRODUCTION
6.1.1. Cryptosporidium
6.1.1.1. Lifecycle
Cryptosporidium is a zoonotic protozoan parasite that infects a wide range of vertebrate
hosts worldwide. The life cycle of C. parvum is monoxenous and begins with ingestion
of the oocyst, the resistant stage found in the environment (Figure 6.1). Upon
excystation, sporozoites are released into the gastrointestinal tract where they penetrate
individual epithelial cells. The endogenous developmental stages are intracellular, but
extracytoplasmic, and located at the luminal surface of the host cell (Petersen, 1993).
The parasite develops a feeder organelle at the interface between the parasite and the
host cell cytoplasm, which is thought to be involved in the exchange of material
between the host and parasite (O'Donoghue, 1995). The organism then undergoes
complex asexual and sexual stages which ultimately result in the release of more
infectious oocysts into the environment (see text for Figure 6.1). The two autoinfective
cycles, the type I meronts and thin-walled oocysts, allows persistent chronic infections
without further exposure to exogenous oocysts. While infections predominantly occur
in the small intestine, infections have also been found in other organs and tissues
(O'Donoghue, 1995). Detailed reviews of Cryptosporidium and cryptosporidiosis may
be found in Current & Garcia, (1991) and O'Donoghue, (1995).
6.1.1.2. Cryptosporidium species
Initially it was assumed that Cryptosporidium was host specific, with species named on
the basis of host occurrence. However, Cryptosporidium was later found to be readily
transmissible between different host species, with some degree of host specificity at the
vertebrate class level. Subsequent studies revealed multiple Cryptosporidium species
within the same vertebrate class and even the same host species, with six species now
considered valid on the basis of differences in host specificity, oocyst morphology and
site of infection. These are C. muris, C. parvum and C. wrairi in mammals, C.
meleagridis and C. baileyi in birds, C. serpentis in reptiles and C. nasorum in fish

CHAPTER 6 __________________________________________________________________________________________________________
176
Figure 6.1: Diagrammatic representation of the proposed lifecycle of C. parvum as it
occurs in the mucosal epithelium of an infected mammalian host. After excysting from
oocysts in the lumen of the intestine (a), sporozoites (b) penetrate the host cell and
develop into trophozoites (= uninucleate meronts) (c) within parasitophorous vacuoles
confined to the microvillous region of the mucosal epithelium. Trophozoites undergo
asexual division (merogony) (d and e) to form merozoites. After being released from
type I meronts, the invasive merozoites enter adjacent host cells to form additional type
I meronts, or to form type II meronts (f). Type II meronts do not recycle but enter host
cells to form the sexual stages, microgamonts (g) and macrogamonts (h). Most
(approximately 80%) of the zygotes (i) formed after fertilization of the macrogamont by
the microgametes (released from microgamont) develop into environmentally resistant,
thick-walled oocysts (j) that undergo sporogony to form sporulated oocysts (k)
containing four sporozoites. Sporulated oocysts released in faeces are the
environmentally resistant life cycle forms that transmit the infection from one host to
another. A smaller percentage of the zygotes (approximately 20%) do not form a thick,
two-layered oocyst wall: they only have a unit membrane surrounding the four
sporozoites. These thin-walled oocysts (l) represent auto infective life cycle forms that
can maintain the parasite within the host without repeated oral exposure to the thick-
walled oocysts present in the environment (Text and figure from Current & Blagburn,
1990, cited in Current & Garcia, 1991).
Ingested (Inhaled?)
Macrogamont
Exists Host
Thick-walled oocyst (sporulated)
Sporozoite
Trophozoite
Auto-infection
Thin-walled oocyst (sporulated)
Zygote i
Microgamont
Type I Meront
Merozoite
Merozoites
a b c
d e
f g
h
j
k
l

CHAPTER 6 __________________________________________________________________________________________________________
177
(Levine, 1984; O'Donoghue, 1995). Of the mammalian species, C. parvum appears to
be the most widespread, and is the zoonotic species responsible for the majority of
infections in humans and livestock (Upton & Current, 1985; Dubey et al., 1990;
O'Donoghue, 1995). However further species differentiation is necessary, and likely
with the development of new molecular techniques to distinguish between different
strains of Cryptosporidium.
6.1.2. Human cryptosporidiosis
6.1.2.1. Prevalence and transmission
In industrialised nations it is thought that between 0.4% - 4.5% of the population may
be passing oocysts at any one time, with up to 50% of the population having antibodies
to C. parvum (O'Donoghue, 1995; Upton, 2001). In third world countries however,
prevalence rates are thought to be between 3-20%, and sero-prevalence may be as high
as 85% (Current & Garcia, 1991; Upton, 2001). C. parvum is predominantly a parasite
of neonate animals, and is widespread in both domestic and wild animal populations
(O'Donoghue, 1995). In comparison, humans are susceptible to infection throughout
their lives, with only previous exposure resulting in either partial or full immunity to the
parasite (Upton, 2001). However infections are most common in young children and
the immunocompromised. Peaks in human infection are usually seen in the spring, and
associated with increased runoff and high numbers of neonate animals which amplify
oocyst numbers (Simmons, 1991; Upton, 2001).
Ingestion of drinking water contaminated with oocysts is the major mode of
transmission, with contamination of water supplies occurring via animal excreta.
Person to person transmission is also common, especially in childcare settings.
Infections may also develop from direct contact with infected animals or ingestion of
contaminated foods (Simmons, 1991). In addition, infections may develop from
inhalation of oocysts (O'Donoghue, 1995). The higher prevalence of infections in less
developed countries is thought to be due to poor sanitation, contaminated water
supplies, overcrowding, and greater contact with potential reservoir hosts (Current &
Garcia, 1991).

CHAPTER 6 __________________________________________________________________________________________________________
178
6.1.2.2. Disease and diagnosis
Clinical signs of the disease can vary depending on the host species, its immune and
nutritional status, the site and severity of infection, and the parasite species involved.
The incubation period is approximately one week before the onset of symptoms that
may persist for one to three weeks, although asymptomatic infections are possible
(O'Donoghue, 1995). The main symptom is profuse offensive watery diarrhoea, which
may be accompanied by abdominal pain, vomiting, fever and headache, and may lead to
significant weight loss and dehydration (Ungar, 1990). Most infections are self-
limiting, with the immune system able to stop the infection (Simmons, 1991;
O'Donoghue, 1995). Many factors affect the longevity of infections, with the most
important relating to the immunocompetency of the host and the parasite species
involved (O'Donoghue, 1995). However in some individuals, specifically young
children, the elderly and the immunocompromised, infections may be associated with
severe, chronic disease that can become life threatening (Simmons, 1991; O'Donoghue,
1995).
Diagnosis is primarily by microscopic demonstration of oocysts in the faeces, or by
direct detection of parasite life stages within host tissues (Simmons, 1991; O'Donoghue,
1995). While immunofluorescence microscopy is most commonly used in the detection
of oocysts, several immunolabelling techniques have been developed and are now
commercially available (O'Donoghue, 1995; CDC, 2001a). In addition,
immunoserological tests are being developed for the detection of specific host
antibodies against Cryptosporidium antigens. While several molecular diagnostic
methods have been developed, they are mainly used as research tools (CDC, 2001a).
6.1.2.3. Treatment and prevention
The majority of treatments for cryptosporidiosis deal with the symptoms of the disease,
and are aimed at adequate fluid and electrolyte replacement. This is because, at present,
there is no specific chemotherapeutic treatment for eliminating C. parvum (CDC,
2001a). Because of the severity of infections in the young and immunocompromised,

CHAPTER 6 __________________________________________________________________________________________________________
179
the development of effective therapy is vital to treat cryptosporidiosis in these
populations. While hundreds of compounds have been tested against C. parvum, none
have been shown to be particularly effective (Fayer & Fetterer, 1995; O'Donoghue,
1995). In immunocompromised individuals, immunological intervention to restore or
enhance the host immune function can sometimes provide passive immunity
(O'Donoghue, 1995). In addition, paromomycin and nitazoxanide have also had some
effect on the parasite, and can occasionally eliminate the disease (Upton, 2001). For a
review on the drugs tested, see O'Donoghue, (1995).
The genes of the microtubule proteins α-tubulin and β-tubulin of C. parvum have been
cloned and sequenced, and thus provide information on potential targets for
chemotherapeutic agents against cryptosporidiosis (Petersen, 1993). The dinitroanilines
are thought to target tubulin (Section 2.1.3.1), and have recently been found to have
some effect against C. parvum in vitro (Arrowood et al., 1996; Benbow et al., 1998;
Armson et al., 1999a; 1999b; MacDonald et al., 2002) and in vivo (Armson et al.,
1999b; 2002). However further investigations are required to assess their potential
against human cryptosporidiosis.
Cryptosporidium oocysts are highly resistant to a range of environmental conditions and
to chemical disinfectants, in particular chlorination at concentrations used to treat
drinking water (Tzipori, 1983; Robinson et al., 1992). Therefore to reduce the risk of
infection they must be removed by effective flocculation and filtration (Simmons,
1991). However, due to its ability to pass through the majority of filtration systems, it is
far better to prevent contamination of water supplies than to rely on water treatment
techniques. Therefore the best preventative measures are frequent water testing, and
converting to well maintained public water supplies. In addition, high standards of
hygiene should be observed to reduce transmission between humans, from animals, and
from contaminated food (Dubey et al., 1990).
6.1.3. Development of in vitro drug assays for C. parvum
C. parvum has earned a worldwide reputation as a serious threat to public health,
particularly to neonates and the immunocompromised. The search for curative

CHAPTER 6 __________________________________________________________________________________________________________
180
treatments has been severely hampered by the absence of reliable in vitro drug assays
for the assessment of potential anticryptosporidial agents. While a number of techniques
have been developed for the detection and quantitation of C. parvum in vitro (Upton et
al., 1995; Woods et al., 1995; Arrowood et al., 1996; You et al., 1996; Walker et al.,
1998; Armson et al., 1999a), they are often subjective and time consuming, and lack
sensitivity and reproducibility. More recently, PCR methods have been developed to
overcome these disadvantages (Jenkins et al., 1998; Walker et al., 1998; MacDonald et
al., 2002).
A reliable quantitative-PCR (Q-PCR) method for the quantitation of in vitro drug assays
for C. parvum has been developed by MacDonald et al., (2002). In brief, Q-PCR uses a
molecular fluorescent probe that is specific for a particular DNA sequence, which
generates a fluorescent signal that is proportional to the initial amount of template DNA.
The fluorescent probe consists of an oligonucleotide probe with a fluorescent reporter
dye attached linked to the 5’ end, and a quencher dye attached to the 3’ end, with the
close proximity of the quencher dye to the reporter dye greatly reducing reporter
fluorescence due to Forster resonance energy transfer (Livak et al., 1995). During PCR
the fluorescent probe anneals to the target DNA (of C. parvum), which is downstream
from one of the primers, and during extension of the primer the 5’ nuclease activity of
Taq DNA polymerase cleaves the probe. This results in the separation of the reporter
dye from the quencher dye, and thus an increase in the fluorescence signal from the
reporter. With each cycle of the PCR, additional fluorescent probes are cleaved,
resulting in an increase in fluorescence that is proportional to the initial amount of target
DNA. The fluorescence values are then plotted against the cycle number, and the
reactions characterised by the cycle number when the PCR product is first detected (Ct
value). The method developed by MacDonald et al., (2002) offers not only higher
sensitivity and specificity in comparison to other, labour intensive methods, but also
allows the rapid assessment of a wide range of potential anticryptosporidial agents. In
addition, it has the potential to be used in a variety of in vivo systems (i.e. parasite
burdens in clinical samples to in vivo drug trials) as well as for genotyping and
quantification of oocysts in environmental samples.

CHAPTER 6 __________________________________________________________________________________________________________
181
6.1.4. Aim
The purpose of this study was to investigate the in vitro anticryptosporidial activity of
the antiparasitic agents ABZ and OZ both alone and complexed with ΗPβCD. Due to
the unusual cellular location of Cryptosporidium, it was thought that the action of
ΗPβCD as a drug carrier (Chapter 1) and its ability to increase membrane permeability
(Chapter 4) might improve the activity of these drugs when complexed with ΗPβCD.

CHAPTER 6 __________________________________________________________________________________________________________
182
6.2. METHODS
6.2.1. Maintenance of C. parvum in vivo and in vitro
The C. parvum isolate used in both in vivo and in vitro experiments was originally
obtained from a calf in Millicent, South Australia in 1993 (Meloni & Thompson, 1996).
The methodology for the in vivo and in vitro cultivation of C. parvum was as described
by Meloni & Thompson, (1996).
6.2.1.1. Cultivation of C. parvum in vivo
6.2.1.1.1. Origin and housing of experimental animals
Six to seven day old Mus musculus (ARC strain) were used in the in vivo amplification
of C. parvum. They were housed with mothers in standard mouse cages in an isolated
animal house maintained on a 12:12 h photoperiod at 21-24°C and were fed Rat and
Mouse Cubes manufactured by Glen Forrest Stockfeeders, Western Australia. Both
food and water were provided ad libitum. All animals were obtained from the Western
Australian State Animal Resource Centre, Perth, Western Australia. The Murdoch
University Animal Ethics Committee, in accordance with national animal welfare
standards, approved the following experiments.
6.2.1.1.2. Infection and collection of C. parvum oocysts in vivo
Six to seven day old ARC mice were infected orally by stomach intubation with
approximately 1 x 10⁵ oocysts (obtained from previously infected mice) in 0.1 mL PBS
using a plastic tube (0.8 mm in diameter) attached to a blunted 23 G needle on a 1 mL
syringe. Seven days post-infection the mice were anaesthetised with 80% CO2: 20% O2
and then euthanased by cervical dislocation. The jejunum, ileum, caecum, colon and
rectum were removed, chopped finely and pooled with approximately 4 mL cold sterile
PBS containing tween-20 (0.02%) and suptasol (5 mg mL-1) per mouse intestine. The
suspension was homogenised at 4˚C followed by rotation on a rotary mixer (Ratex
Instruments) for 90-120 min before it was centrifuged (Spintron GT-20) at 3000 rpm for
10 min. The supernatant was removed to within 1 mL of the pellet and an ether
extraction was performed by resuspending the oocyst-containing pellet in PBS/Tween-

CHAPTER 6 __________________________________________________________________________________________________________
183
20 and ether (20% final volume). The homogenate was then mixed vigorously (30 sec)
and centrifuged at 3000 rpm for 8 min. This was repeated twice to wash the suspension.
After the second spin, the plug and supernatant were removed and the pellet checked for
oocysts. Additional oocysts were recovered by remixing the supernatant layers from the
ether extraction and re-centrifuging as described above to pellet and wash the oocysts.
The pellet was then resuspended in 4 mL PBS and cold ficoll gradients (Section
6.2.1.1.3) were used to further purify the oocysts by layering 2 mL of suspension on top
of each gradient. The gradients were centrifuged at 2500 rpm for 30 min before
removing the interface into a sterile tube and diluting to 1 x 10⁶ mL-1 oocysts with
sterile PBS and antibiotics (ampicillin and streptomycin). The oocysts were then stored
at 4˚C until ready for reinfection of mice or in vitro cultivation.
6.2.1.1.3. Ficoll gradients
Ficoll gradients are used to purify C. parvum oocysts from intestinal and faecal samples.
Four solutions consisting of 0.5, 1, 2 and 4% ficoll in 16% sodium diatrizoate in sterile
PBS were made up. One mL aliquots of each solution are layered upon each other,
starting with the 4% layer on the bottom and finishing with the 0.5% layer on top. The
gradients were then centrifuged at 3500 rpm for 5 min to separate the layers, after which
they were stored in the refrigerator at 4ºC.
6.2.1.2. Cultivation of C. parvum in vitro
For the in vitro cultivation of C. parvum oocysts obtained as described in section
6.2.1.1.2, the oocysts needed to undergo excystation before they could infect the
continuous cell line, human ileocaecal adenocarcenoma cells (HCT-8 cells) in vitro.
6.2.1.2.1. Culture medium for the cultivation of HCT-8 cells
HCT-8 cells were maintained in 25-mm2 tissue culture flasks with filter caps in RPMI
1640 medium supplemented with 25 mM HEPES, 25 mM sodium hydrogen carbonate,
2 mM glutamine, 10% foetal bovine serum (FBS), antibiotics, and incubated in an
incubator (Forma Scientific) at 37°C in 5% CO2 (Table 6.1).

CHAPTER 6 __________________________________________________________________________________________________________
184
Table 6.1: Medium preparation for the cultivation of HCT-8 cells.
Ingredients Concentration Amount to prepare 1 L RPMI 1640 - 10.4 g HEPES 25 mM 5.97 g Sodium hydrogen carbonate 25 mM 2.1 g Glutamine 2 mM 0.3 g Stock solution antibiotics: Lincomycin (40 µg mL-1) Ampicillin (40 µg mL-1) Gentamycin (50 µg mL-1)
4 µg mL-1
4 µg mL-1
5 µg mL-1
10 mL
Make up to 900 mL with dH2O. Adjust the pH to 7.4 and filter sterilise at 0.2 µm. FBS 10% 100 mL
6.2.1.2.2. Removal of HCT-8 cells from cryopreservation
Cryopreserved HCT-8 cells were removed from liquid nitrogen and defrosted quickly at
37°C. Under sterile conditions approximately 500 µL HCT-8 cells were added to
25mm2 flasks containing 5 mL of culture medium (Section 6.2.1.2.1) and incubated at
37°C in 5% CO2.
6.2.1.2.3. Cultivation of HCT-8 cells
For the cultivation of HCT-8 cells, healthy cultures that had reached confluence were
selected. The medium was removed and the cells were rinsed twice with PBS, followed
by the addition of 700 µL trypsin for 20 min to lift the cells from the culture vessel wall.
Ten mL of warm media was added and mixed to separate the cells, of which 5 mL
aliquots were then dispensed into 25mm2 flasks and incubated at 37°C in 5% CO2.
HCT-8 cells that were to be maintained at confluence were grown in 1% FBS, with the
above media made up to 990 mL before the addition of FBS.
6.2.1.2.4. Cryopreservation of HCT-8 cells
For the cryopreservation of HCT-8 cells, healthy cultures that had reached confluence
were selected. The media was removed and the cells rinsed twice with PBS. 700 µL
trypsin were added for 10 min to lift the cells from the culture vessel wall. Two mL of
warm media were added and mixed to separate the cells followed by centrifugation at
1500 rpm for 5 min and the supernatant discarded. The cells were resuspended in FBS
(90%) and DMSO (10%) in a volume of 2 mL. One mL aliquots were dispensed into
sterile 2 mL cryogenic vials, which were then placed into a cold Cryogenic 1˚C

CHAPTER 6 __________________________________________________________________________________________________________
185
container and put in –80˚C freezer for at least 4 h. The cryopreservation vials were
placed in liquid nitrogen containers once the freezing process was complete.
6.2.1.2.5. Excystation of C. parvum oocysts for in vitro cultivation
The in vitro cultivation of C. parvum was as described by Hajjawi et al., (2001).
Excystation was carried out by exposing 0.1-1 mL aliquots of purified oocysts (Section
6.2.1.1.2) (approximately 5000 oocysts per flask to be infected) to 9 mL warm sterile
excystation media (0.5% trypsin in dH2O, pH 2.5) at 37˚C for 20 min, with mixing
every 5 min. The oocysts were then centrifuged at 3500 rpm for 4 min before the pellet
was resuspended in an appropriate amount of RPMI-1640 basal medium (Table 6.2).
Table 6.2: Medium preparation for the cultivation of C. parvum in vitro.
Ingredients Amount to prepare 1 L RPMI 1640 10.4 g HEPES 5.97 g Sodium hydrogen carbonate 2.1 g Glutamine 0.3 g Dehydrated bovine bile 0.2 g D-Glucose 1.0 g Folic acid 0.25 mg 4-aminobenzoic acid 1.0 mg Calcium pantothenate 0.5 mg Ascorbic acid 8.75 mg
Make up to 990 mL with dH2O. Adjust the pH to 7.4 and filter sterilise at 0.2 µm. FBS 10 mL
6.2.1.2.6. Cultivation of C. parvum in vitro
HCT-8 cells that had been grown to confluence were used for the cultivation of C.
parvum. The medium of the HCT-8 cells was removed and RPMI-1640 basal medium
containing the excysted oocysts (Section 6.2.1.2.5) added. The oocysts were then
incubated for 60-120 min at 37˚C in a candle jar after which the infected medium was
replaced with fresh RPMI-1640 basal medium and the cultures incubated in a candle jar
for a further 72-120 h at 37˚C. The cultures were examined daily using an inverted
microscope (Olympus) at magnifications ranging from x150 to x600.

CHAPTER 6 __________________________________________________________________________________________________________
186
6.2.2. Efficacy experiments against C. parvum in vitro
6.2.2.1. Drug efficacy experiments
Cultivated HCT-8 cells were prepared for growth in 24 microwell plates as described in
section 6.2.1.2.3. The cells were then suspended in 12.5 mL of warm medium and 500
µL aliquots per well were dispensed into 24 microwell plates and incubated at 37°C in
5% CO2. Once the cell layers were confluent (approximately 24 h) they were
maintained in 1% FBS and infected with 5000 oocysts per well (Section 6.2.1.2.6)
followed by incubation for 120 min. Following removal of infected medium and
addition of test medium (Section 6.2.2.2), the cells were incubated for 48 h with
constant exposure to the drugs or drug vehicle. Upon completion of the experiment, the
media was removed, the cell monolayer washed twice with PBS, and 200 µL ATL
buffer (Qiagen, Hilden, Germany) added before the cultures were frozen. Parasite
growth was quantified as per section 6.2.3.
6.2.2.2. Administration of drugs
ABZ and OZ in two different formulations were tested against C. parvum in vitro. The
efficacy of these drugs dissolved in DMSO was compared to when these drugs were
formulated in ΗPβCD. 10 mM solutions of ABZ and OZ were made up in 100%
DMSO and then diluted with DMSO to create x1000 the concentrations required during
the course of the experiment on the day of the experiment. ABZ/ΗPβCD and
OZ/ΗPβCD were diluted from stock solutions with dH2O and investigated over the
same concentration range as the drugs dissolved in DMSO. 2.5 µL of each drug
concentration were added to 2.5 mL culture medium, with 0.5 mL then added per
parasitised microwell in quadruplicate. The control cultures contained either drug
vehicle or dH2O as appropriate. The final DMSO concentration in the cultures
containing DMSO was 0.1%. The assay also required 2 additional controls, which were
included in quadruplicate on each microwell plate. These were:
5. HCT-8 cells only (negative controls)
6. Untreated parasitised HCT-8 cells (positive controls)

CHAPTER 6 __________________________________________________________________________________________________________
187
6.2.3. Quantification of in vitro parasite growth
Quantification of parasite growth following in vitro drug efficacy experiments against
C. parvum was as described by MacDonald et al., (2002).
6.2.3.1. DNA extraction
The procedure for extracting total DNA from drug treated cultures was a modification
of the method by Morgan et al., (1995). Previously frozen cultures containing 200 µL
ATL buffer (Section 6.2.2.1) were thawed, incubated at 37°C for 30 min, and the cell
lysate removed to a fresh eppindorff tube. The microwells were then rinsed with an
additional 200 µL ATL buffer and pooled with the cell lysate, giving a total of 400 µL.
The pooled lysate was incubated at 95°C for 10 min, centrifuged at 14 000 rpm for 30
sec, and the supernatant added to another eppindorff tube containing 200 µL AL buffer
(Qiagen) and 10 µL glass milk (Bio-rad, Richmond, Calif). The sample was then
vortexed, incubated at 72°C for 15 min with gentle mixing every 5 min, and then
centrifuged at 14 000 rpm for 2 min, after which the supernatant was discarded. The
pellet was washed twice with 600 µL AW buffer (Qiagen) and vacuum dried for 10 min
before elution of the DNA in 50 µL AE elution buffer (Qiagen) at 37°C for 30 min.
After centrifugation at 14 000 rpm for 5 min the supernatant was removed to a fresh
eppindorff tube and stored at 20°C until required.
6.2.3.2. PCR
The primers and fluorescent probe were designed by MacDonald et al., (2002) based on
a diagnostic sequence previously described by Morgan et al., (1996). Primer specificity,
QT-PCR sensitivity and QT-PCR reproducibility was evaluated by MacDonald et al.,
(2002). The forward primer 5’ AAGAAGGCCGTGTTGGCTTA 3’ and reverse primer
5’ GGGATTCAGCCCACCAGAAT 3’ amplified an 85bp product, with the probe, 5’
(FAM) TGTACCACAAACTGCACAAGAAAGCTCAGAA (TAMARA) 3’ designed
to the complementary strand. Amplifications were carried out in an Applied
Biosystems ABI 7700 sequence detector using the software Sequence Detection
Systems Version 1.7 (ABI Prism, Perkin Elmer). Amplifications were in 25 µL

CHAPTER 6 __________________________________________________________________________________________________________
188
reactions consisting of 6.25 pmoles of forward and reverse primers (Life Technologies,
Mulgrave, VIC) and probe (Applied Biosystems) (2.5 µL each), 12.5 µL Taqman
Universal Master Mix, 2.5 µL sterile dH20, and 2.5 µL sample DNA. The thermal
cycling consisted of 1 cycle of 50°C for 2 min, 1 cycle 95°C for 10 min, and 40 cycles
of 95°C for 15 sec, 60°C for 1 min.
6.2.4. Statistical analysis
While the method developed by MacDonald et al., (2002) was quantitative, here the
method was used to determine relative amounts of Cryptosporidium DNA in treated
cultures compared to control cultures. Standards were prepared for each microwell
plate using DNA from untreated parasitised controls (neat), with the neat sample taken
as 100% DNA, the maximum amount of parasite DNA produced under specified
conditions without drug treatment. The neat sample was then serially diluted to provide
50%, 25%, 12.5% and 6.25% of neat DNA, and a Ct value was determined for each
sample (Section 6.1.3). A standard curve plotting the Ct value vs the log of the dilution
factor was then generated by the software (r > 0.92, n=3), which was used to determine
the percentage inhibition of the drug treated samples on that microwell plate. The %
DNA reduction of drug treated samples was then pooled across microwell plates and the
IC50, MLC and MIC for each drug formulation against C. parvum determined. Where
possible, dose response curves using non-linear sigmoidal curve fitting were generated
(GraphPad Prism). Comparisons between dose response curves were carried out using
repeated measures ANOVA with Bonferonni’s post test or t-tests where appropriate
(GraphPad Prism).

CHAPTER 6 __________________________________________________________________________________________________________
189
6.3. RESULTS
6.3.1. Efficacy of albendazole formulations against C. parvum in vitro
The in vitro efficacy of ABZ when dissolved in DMSO and when formulated with
ΗPβCD was evaluated against C. parvum, and expressed as a percentage DNA
reduction in comparison to untreated controls (Figure 6.2). The dose response curves
for ABZ in DMSO and ABZ/ΗPβCD were not significantly different (repeated
measures ANOVA with Bonferonni’s post test p>0.05). However the results at the
lowest concentration tested (1 µM) were significantly different (t-test, p<0.001). The
IC50, MIC and MLC for ABZ was <1 µM, <1 µM and >100 µM, and for ABZ/ΗPβCD
were 4.3 µM, 1 µM and >100 µM respectively (Table 6.3). OF the two formulations,
ABZ dissolved in DMSO appeared to be more effective, as its IC50 was less than 1 µM.
Figure 6.2: In vitro efficacy of ABZ and ABZ/ΗPβCD against C. parvum (mean ± SE,
n=4).
-6.5 -6.0 -5.5 -5.0 -4.5 -4.0
0
10
20
30
40
50
60
70
80
90
100ABZABZ/CD
ABZ (Log M)

CHAPTER 6 __________________________________________________________________________________________________________
190
Table 6.3: The IC50, MIC and MLC of two ABZ formulations against C. parvum in
vitro.
Drug IC50 (µM) MIC (µM) MLC (µM) ABZ in DMSO <1 <1 >100 ABZ/ΗPβCD 4.3 1 >100
As previously observed, CD is capable of inhibiting a number of cell types (Chapters 4
and 5). Castro-Hermida et al., (2000) and Castro-Hermida et al., (2001) investigated the
in vitro and in vivo efficacy of β-CD against C. parvum and found β-CD as a 2.5%
suspension to be effective against C. parvum oocysts both in vitro and in vivo. The
ΗPβCD concentration of the ABZ/ΗPβCD complex at the highest dose given (100 µM)
was 0.661%. Therefore the ΗPβCD concentration was lower than that required to
inhibit G. duodenalis, HCT-8 cells and C. parvum oocysts. It is therefore it is unlikely
to have affected either the HCT-8 cells on which C. parvum was cultured, or any of the
C. parvum life stages.
6.3.2. Efficacy of oryzalin formulations against C. parvum in vitro
The in vitro efficacy of OZ in two different formulations against C. parvum was also
investigated, and found that OZ when dissolved in DMSO and when formulated with
ΗPβCD were equally effective against C. parvum in vitro (Figure 6.4). The dose
response curves for the two formulations were not significantly different (repeated
measures ANOVA with Bonferonni’s post test p>0.05) with a mean IC50 of 0.86 µM,
MIC of <0.1 µM and MLC of >10 µM (Table 6.2).
Table 6.4: The IC50, MIC and MLC of two OZ formulations against C. parvum in vitro.
Drug IC50 (µM) MIC (µM) MLC (µM) OZ in DMSO 0.9 <0.1 >10 OZ/ΗPβCD 0.81 <0.1 >10
The ΗPβCD concentration of the OZ/ΗPβCD complex at the highest dose given (10
µM) was 0.094%, which was considerably lower than the ΗPβCD concentration
required to inhibit G. duodenalis, HCT-8 cells and C. parvum oocysts. Therefore it is

CHAPTER 6 __________________________________________________________________________________________________________
191
unlikely to have affected either the HCT-8 cells on which C. parvum was cultured, or
any of the C. parvum life stages.
Figure 6.3: In vitro efficacy of OZ and OZ/ΗPβCD against C. parvum (mean ± SE,
n=8).
-7.5 -7.0 -6.5 -6.0 -5.5 -5.0
0
10
20
30
40
50
60
70
80
90
100
OZ/CDOZ
OZ (Log M)
CHAPTER 6 __________________________________________________________________________________________________________
192
6.4. DISCUSSION
6.4.1. Albendazole
ABZ was predicted to have minimal efficacy against C. parvum based on β-tubulin
sequences (Edlind et al., 1994; Katiyar et al., 1994; Cacciò et al., 1997), which has been
reflected in vitro (Armson, Murdoch University, unpublished data) and in vivo (Fayer &
Fetterer, 1995). While some efficacy has been observed, high drug concentrations are
required. Here both ABZ dissolved in DMSO and the ABZ/ΗPβCD complex showed in
vitro efficacy against C. parvum at lower concentrations than that observed in previous
research (10-30 µM versus 4.3 µM). This is likely to be a reflection of the alternative
assessment method employed here. As ABZ affects the HCT-8 cell layer at these
concentrations by causing the cells to lift from the culture flask (Sections 4.3.1.1 and
4.4.1.1), microscopic evaluation of parasite growth becomes impossible. However, as
the suspended cells were still viable, it is unclear whether C. parvum growth has really
been affected. It is therefore impossible to determine if ABZ efficacy is related to its
effect on the cell layer or against C. parvum itself. While the results here do indicate
that ABZ affect C. parvum, it is unclear whether the efficacy of ABZ is related to a
decreased ability of the parasite to infect suspended cells, or a direct effect against C.
parvum itself.
Differential efficacy between ABZ dissolved in DMSO and the ABZ/ΗPβCD complex
was observed, with the ABZ/ΗPβCD appearing to have lower efficacy. As there are
two potential targets of ABZ, the HCT-8 cell layer and C. parvum, the decreased
efficacy may be related to a differential effect of the ABZ/ΗPβCD complex on one or
both of these processes. This may be reflected in both formulations having similar MLC
but different IC50’s. As the ABZ/ΗPβCD complex had a high stability constant (Section
2.4.1.1), and a high stability constant can reduce the concentration of free drug (Section
3.1.1 and 4.1.2), ΗPβCD may have decreased the amount of free ABZ through inclusion
complex formation and therefore decreasing its ability to interact with either of these
processes. However, it is unusual that this process occurred here against C. parvum but
did not occur against G. duodenalis unless excess ΗPβCD was added (Section 5.4.2.1).
Even though the proportion of ABZ to ΗPβCD was the same against both parasites,

CHAPTER 6 __________________________________________________________________________________________________________
193
ΗPβCD appeared to decrease the efficacy of the complex against C. parvum. Therefore
the differential effect may instead relate to the different locations of the two parasites in
culture, G. duodenalis on the culture wall and C. parvum within a host cell. For
example, ΗPβCD may have partially protected the HCT-8 cell membrane against the
effects of ABZ (Section 1.2.3.2 and 4.1.1), but could not protect the parasite due to its
location within the cell. This implies that the effect of ABZ against HCT-8 cells occurs
at much lower concentrations than the effect of ABZ against C. parvum. However this
would need to be evaluated in more detail. Alternatively, the ABZ/ΗPβCD complex
may have had differential efficacy against different stages in the lifecycle of C. parvum.
However these results may simply be a reflection of the method used to evaluate drug
efficacy against C. parvum, discussed in more detail below (Section 6.4.3).
6.4.2. Oryzalin
Previous research has found C. parvum to be susceptible to OZ both in vitro (Benbow et
al., 1998; Armson et al., 1999b; MacDonald et al., 2002) and in vivo (Armson et al.,
1999b; 2002). OZ exhibited relatively high efficacy against C. parvum in vitro both
alone and complexed, with an average IC50 of 0.86 µM. These results were comparable
to that observed in previous research. The similar efficacy of the two formulations
indicated that complexation with ΗPβCD did not interfere with drug action as it did
with the ABZ/ΗPβCD complex. This may be due to the fact that OZ does not interfere
with the cell layer, as did ABZ, or that OZ inhibited a different stage of the lifecycle to
ABZ. Alternatively, the lower stability constant of the OZ/ΗPβCD complex resulted in
the complex readily dissociating to allow free OZ to inhibit C. parvum growth.
6.4.3. Conclusion
The ABZ/ΗPβCD complex showed decreased efficacy against C. parvum compared to
ABZ dissolved in DMSO in vitro, although the reasons for this were unclear. In
comparison the OZ/ΗPβCD complex exhibited equal efficacy against C. parvum
compared to OZ dissolved in DMSO. The PCR method developed by MacDonald et al.,
(2002) is a convenient and efficient method for in vitro drug screening. However, the
quality of data vastly improved when 8 samples rather than 4 samples were assessed, as

CHAPTER 6 __________________________________________________________________________________________________________
194
sample variability was high. In addition, as the method requires fresh oocysts, in vivo
oocyst amplification must be carried out immediately prior to in vitro experiments,
which increases the time taken to perform experiments. The effect of ΗPβCD on C.
parvum was not evaluated here as it was previously found to extract membrane
components from HCT-8 cells on which C. parvum is cultivated. In addition, Castro-
Hermida et al., (2000) reported that a 2.5% suspension of β-CD reduced oocyst viability
in vitro, and had both preventative and curative effects against C. parvum in vivo.
However, oocysts exposed to β-CD before administration to animals were still infective,
with reduced intensity of infection. These results were attributed to β-CD modifying the
oocyst wall permeability. As HPβCD has a reduced tendency to extract membrane
components, it may be less effective against C. parvum. However, the in vivo efficacy
of β-CD against C. parvum appears promising, and may add to the in vivo efficacy of
drug/CD complexes. As neither formulation resulted in increased drug efficacy when
formulated with ΗPβCD, in vivo drug efficacy was not investigated.

CHAPTER 7 __________________________________________________________________________________________________________
195
CHAPTER 7. ANTIMALARIAL EFFECTS OF THE
DRUG/ΗPβCD COMPLEXES

CHAPTER 7 __________________________________________________________________________________________________________
196
7.1. INTRODUCTION
7.1.1. Plasmodium
7.1.1.1. Lifecycle of malaria
Malaria is a mosquito-borne infection caused by the protozoan parasite Plasmodium.
The life cycle of Plasmodium involves two hosts, with the vector a female mosquito.
There are at least 60 species of Anopheles mosquito, the principal vector, and for lizard
and bird malaria, culicine mosquitos and sandflies are vectors (Katz et al., 1982). When
the vector takes a blood meal, sporozoites present in the salivary glands of the mosquito,
the infective stage of plasmodia, are injected into the vertebrate host (Figure 7.1). The
sporozoites infect liver cells and there undergo asexual multiplication to produce
merozoites in a process called exoerythrocytic schizogony. After a period of time
thousands of merozoites are released into the blood stream. The latent period after
initial infection depends on the infecting species of Plasmodium, and some species of
Plasmodium have two exoerythrocytic forms. The second form is the hypnozoite,
which is capable of remaining dormant in liver cells for extended periods of time. At
some future time, which may by weeks or even years after initial infection, the
hypnozoites activate, undergo exoerythrocytic schizogony, and subsequently release
merozoites into the blood stream.
Once the merozoites enter the bloodstream they invade red blood cells (RBC), initiating
erythrocytic schizogony. Here the parasite continues asexual multiplication in the RBC,
with the ensuing release of merozoites being responsible for the clinical manifestations
of the disease. In a number of Plasmodium species erythrocytic schizogony becomes
synchronised, with the simultaneous rupture of large numbers of RBC and the liberation
of large numbers of merozoites and metabolic waste products into the blood stream
resulting in the paroxysms of malaria (Garcia & Bruckner, 1988). The length of this
development cycle, and hence periodicity of clinical manifestation, also varies
depending on the infecting Plasmodium species.

CHAPTER 7 __________________________________________________________________________________________________________
197
Figure 7.1: Plasmodium (P. vivax) lifecycle (Fujioka & Aikawa, 1999).
Ookinete
Oocyst
Fertilisation
Exflagelating microgametocyte
Sporozoite
Salivary gland
Macrogametocyte
MOSQUITO
HUMAN
Macrogametocyte
Microgametocyte
Ruptured erythrocyte ERYTHROCYTIC
SCHIZOGONY
Hepatic cell
HYPNOZOITE
Trophozoite
EXOERYTHROCYTIC SCHIZOGONY
Host cell entry
Merozoite

CHAPTER 7 __________________________________________________________________________________________________________
198
Some of the merozoites in the RBC then differentiate into the sexual stages called the
gametocytes, consisting of female macrogametocytes and male microgametocytes. A
vector ingests the gametocytes during a blood meal, where they mature in the
mosquito's stomach. After fertilisation the zygote develops into a motile ookinete that
migrates to the lining of the midgut and develops into an oocyst. The oocyst grows,
ruptures, and releases sporozoites, which invade the entire mosquito, including the
salivary glands. The vector phase of the lifecycle is called sporogony, and can take
between 8-35 days, depending on the infecting Plasmodium species and environmental
conditions. Inoculation of the sporozoites into a new vertebrate host perpetuates the
malaria life cycle. Detailed reviews on Plasmodium can be found in Noble & Noble,
(1979), James & Gilles, (1985) and Garcia & Bruckner, (1988), and online by Navy
Environmental Health Center, (2001) and CDC, (2001c).
7.1.1.2. Human Plasmodium
There are approximately 156 named species of Plasmodium that infect various species
of vertebrates and four are known to infect humans: P. falciparum, P. vivax, P. ovale
and P. malariae. These are distinguished by the type, severity and frequency of the
clinical symptoms, and by the morphology of the parasites in stained blood smears
during microscopic analysis (James & Gilles, 1985). Some simian Plasmodium species,
such as P. knowlesi and P. cynomolgi, are also capable of infecting humans, causing
relatively mild disease (Katz et al., 1982).
7.1.2. Malaria
7.1.2.1. Prevalence
Malaria is one of the most serious protozoan diseases affecting humans, and is
widespread in more than 100 countries. Malaria generally occurs in tropical and
subtropical areas, where environmental conditions allow parasite multiplication to occur
in the vector (CDC, 2001c; Navy Environmental Health Center, 2001). The WHO
estimates that 300-500 million cases of malaria occur yearly, with more than 1 million
people a year worldwide dying of the disease (WHO, 2000a; CDC, 2001c). The

CHAPTER 7 __________________________________________________________________________________________________________
199
majority of infections occur in children under the age of five years, with most
developing partial immunity that protects them from severe disease (Winstanley, 2000).
Despite extensive control programs to eradicate it, malaria is still a major health
problem in many developing countries, and also poses a significant economic burden to
these countries (WHO, 2000b). Difficulties in the eradication of malaria have arisen
due to increasing populations in high risk areas, increased population movement,
increasing drug resistance in both the vector and parasite, and the spread of malaria via
human impact on the environment into areas previously transmission-free (Olliaro et al.,
1996; Martens & Hall, 2000; Persidis, 2000; WHO, 2000c).
7.1.2.2. Clinical disease
The symptoms of uncomplicated malaria can be rather non-specific, and develop 10
days to 4 weeks after infection, depending on the infecting species of Plasmodium. The
initial symptoms of malaria may be mild and include fever, malaise and flu-like
symptoms, with or without other symptoms such as headache, muscle aches and
weakness, shaking chills, nausea, vomiting, diarrhoea and cough (Garcia & Bruckner,
1988). Anaemia and jaundice may also develop due to the loss of red blood cells
(WHO, 2001; CDC, 2001c). The clinical presentation can vary substantially depending
on the infecting species, the level of parasitemia, and the immune status of the patient.
A characteristic response to the synchronised erythrocytic cycle is the paroxysm, which
begins with chills and a gradually mounting fever, followed by the patient feeling
intensely hot, after which perspiration starts until the fever subsides (Noble & Noble,
1979). If left untreated, all forms of malaria tend to become chronic, with the
development of immunity eventually leading to its spontaneous cure (Katz et al., 1982).
Infection with P. falciparum can also develop into more severe forms of the disease,
involving the central nervous system and/or other organs. If not promptly treated,
severe malaria can result in rapid deterioration into stupor, seizures, coma and usually
death (CDC, 2001c).

CHAPTER 7 __________________________________________________________________________________________________________
200
7.1.2.3. Treatment and prevention
Even with the development of a number of antimalarial drugs in the last 20 years, only a
relatively small number of antimalarial drugs are available today (Persidis, 2000).
Current control measures are becoming less effective due to drug resistance, and as yet
no highly effective vaccine exists (Persidis, 2000; Winstanley, 2000). Therefore,
affordable new drugs as well as improved formulations of existing drugs are needed.
While malaria can be cured with prescription drugs, the type of drugs and length of
treatment is dependent on the kind of malaria diagnosed, where the patient was infected,
the age of the patient, and how severely ill the patient was at start of treatment (CDC,
2001c). Commonly used antimalarial drugs include chloroquine (CHQ), quinine,
artemisinin and its derivatives, pyrimethamine combinations and primaquine, and the
more expensive mefloquine and halofantrine. CHQ has been a cheap, safe and practical
antimalarial drug for decades, but with the extensive development of resistance it can no
longer be relied upon to produce clinical improvement in patients infected with P.
falciparum (Winstanley, 2000). CHQ has been largely replaced by quinine in the
treatment of P. falciparum, and while resistance has developed, it is largely confined to
Southeast Asia (Winstanley, 2000). For a review of the currently used antimalarials, see
White, (1996) and Winstanley, (2000). As microtubules have been identified in nearly
all stages of the Plasmodium lifecycle, antimicrotubule drugs have also been
investigated as potential antimalarial agents (see reviews by Bell, 1998 and Hommel &
Schrével, 1998). A number of classes of microtubule inhibitors have been investigated
against malaria, such as colchicine-site binders (including some benzimidazoles),
vinblastine-site binders, vinca alkaloids and taxoids, as well as the microtubule
inhibitors tubulozole and trifluralin. While a number are potent against various stages
of Plasmodium, many also exhibit mammalian cell toxicity. Therefore further
investigation into antimicrotubules that have a weaker effect on mammalian cells may
prove worthwhile. However, detailed analysis of malarial microtubule proteins is
hampered due to the technical difficulty in obtaining material for biochemical studies
(Section 7.1.3).
Current malaria intervention programs utilise a number of avenues to reduce malaria-
induced morbidity and mortality, such as vector control and avoidance, vaccine

CHAPTER 7 __________________________________________________________________________________________________________
201
development, chemoprophylaxis, drug treatment/management, and basic education
programs for populations at risk (Persidis, 2000; WHO, 2000c). For travellers to
Africa, prevention of malaria can be achieved by using insect repellents and indoor
residual spraying between dusk and dawn, and insecticide-treated mosquito nets where
necessary, in combination with the regular use of the correct antimalarial drugs for
prophylaxis (WHO, 2001). WHO recommends weekly mefloquine prophylaxis, which
should be started 2-3 weeks before travel. Alternatively, daily doxycycline treatment
started the day before travel. Both drugs should be continued during the stay and for 4
weeks after leaving the endemic area (WHO, 2001).
7.1.3. Preclinical assessment of antimalarials
The present day methodology for the assessment of antimalarials involves a number of
techniques, including the initial selection and screening of compounds for antimalarial
activity against P. falciparum in vitro. P. falciparum can be cultivated in continuous
culture in vitro, and procedures for the assessment of blood schizontocidal action of
drugs have been developed (James & Gilles, 1985). Further drug screening is then
carried out using non-human Plasmodium species in vivo. There are many animal
models for non-human Plasmodium species. As a number of murine plasmodia have
been adapted to certain laboratory rodents, and can be transmitted through species of
laboratory-reared mosquitoes, these have become the most practical models for the
experimental study of mammalian malaria (Carter & Diggs, 1977). However, one of the
disadvantages in early drug screening is that data obtained from in vitro screens against
P. falciparum and in vivo screens against rodent malarias are not directly comparable.
While in vitro drug screening methods against rodent malaria have been developed, the
in vitro cultivation of the rodent malarias in continuous culture has been more difficult
(Coombs & Gutteridge, 1975; McNally et al., 1992; Sohal & Arnot, 1993). The
development of in vitro rodent malaria models offers a number of advantages. The
rodent malarias are more accessible and relatively inexpensive in comparison to the
primate malarias (McNally et al., 1992), they are easy and safe to handle and
manipulate in the laboratory (Janse & Waters, 1995), they are not infective to humans,
and they allow direct comparison to in vivo drug trials (Mons & Sinden, 1990). In
addition, this will allow the mass cultivation of parasite material for molecular studies

CHAPTER 7 __________________________________________________________________________________________________________
202
as well as investigations into the relationship between the parasite and the host’s
immune system (Mons & Sinden, 1990; Janse & Waters, 1995). The basic biology of
P. berghei, the most commonly studied rodent malaria, closely resembles other
mammalian malaria parasites, and hence exhibits similarities in drug susceptibility and
mechanisms of drug resistance (Janse & Waters, 1995; Mons & Sinden, 1990). While
recent advances have allowed the cultivation of P. berghei in vitro (Mons & Sinden,
1990; Janse & Waters, 1995; Dow, 2000), its cultivation is still problematic, and its
preference for reticulocytes makes it less comparable to P. falciparum (Mons & Sinden,
1990). Therefore research into the in vitro cultivation of other rodent plasmodia needs
to be continued, particularly those that are similar to P. falciparum, such as P. chabaudi
(Mons & Sinden, 1990).
7.1.4. Aim
The purpose of this study was to investigate the in vitro and in vivo antimalarial activity
of the antiparasitic agents ABZ and OZ both alone and complexed. In addition, the
effect of ΗPβCD on P. chabaudi, and the effect of ΗPβCD on drug efficacy, was
investigated.

CHAPTER 7 __________________________________________________________________________________________________________
203
7.2. METHODS
7.2.1. P. chabaudi
The rodent malaria P. chabaudi used in in vitro and in vivo experiments was obtained
from Professor David Walliker at the University of Edinburgh. All procedures were
carried out under sterile conditions using a biohazard hood. The cultivation of P.
chabaudi in vitro and in vivo was modified from Dow, (2000).
7.2.2. In vivo parasite amplification for in vitro and in vivo drug studies
7.2.2.1. Origin and housing of experimental animals
Six-week-old male Mus musculus (ARC Swiss strain) were used to passage P. chabaudi
in vivo, and five-week-old male Rattus norvegicus (Wistar strain) were used as donor
rats to amplify parasite number for in vitro and in vivo experiments. They were housed
in an isolated animal house maintained on a 12:12 h photoperiod at 21-24°C and were
fed Rat and Mouse Cubes manufactured by Glen Forrest Stockfeeders, Western
Australia. Mice were housed 3 animals per standard mouse cage and rats housed 3
animals per standard rat cage, and both food and water were provided ad libitum. All
animals were obtained from the Western Australian State Animal Resource Centre,
Perth, Western Australia. The Murdoch University Animal Ethics Committee, in
accordance with national animal welfare standards, approved the following
experiments.
7.2.2.2. Passage of P. chabaudi through mice
P. chabaudi was maintained in vivo by serial passage through mice. P. chabaudi was
obtained from either cryopreserved stock (Section 7.2.2.4) or from previously infected
mice. Blood was collected from infected mice by snipping the tip of the animal’s tail
with sharp scissors (less than 1.0mm of tail was removed each time a blood sample was
taken), and two to three drops of tail vein blood collected. A thin smear of the blood
was used to determine parasitaemia (Section 7.2.2.5). The blood of the infected mouse

CHAPTER 7 __________________________________________________________________________________________________________
204
was then diluted in 10 mL glucose citrate solution (GC - below) of which 300 µL were
injected i.p. into a recipient mouse using a 26G needle under halothane anesthesia
(Section 7.2.2.6). After 6-8 days, asexual stages became visible on peripheral blood
smears and the parasite was passaged again.
GC was prepared by dissolving 15 g tri-sodium citrate and 2.5 g D-glucose in 500 mL
warm deionised water and filter sterilised (0.2µm) before storing at 4˚C.
7.2.2.3. Infection and harvesting of P. chabaudi from donor rats for drug studies
P. chabaudi was maintained in vivo by serial passage through mice (Section 7.2.2.2).
To amplify parasite number for drug experiments, blood from an infected mouse with
parasitaemia in excess of 20% (eight to nine days post infection) was used to infect
donor rats. 1-2 drops of infected mouse blood (obtained by cardiac puncture, section
7.2.2.6) were diluted in 300 µL GC solution and injected i.p. into recipient rats using a
26G needle under halothane anaesthesia (Section 7.2.2.6). Six to eight days after
infection the rats had rising parasitaemias of >5% and were used as donor animals for
drug experiments. Blood was taken via cardiac puncture (Section 7.2.2.6) and diluted in
5.0 mL prewarmed GC solution. The parasite titre (Section 7.2.2.5) was calculated
before the parasites were diluted to the appropriate concentration for drug experiments
with GC solution.
7.2.2.4. Cryopreservation of P. chabaudi
P. chabaudi was cryopreserved by mixing a drop of blood obtained from an infected
mouse (Section 7.2.2.2) with 150µL Alsevier’s solution (AS - below) in sterile 2 mL
cryogenic vials (Nalgene). The vials were then submerged in liquid nitrogen for
storage. Cryopreserved P. chabaudi was removed from liquid nitrogen and defrosted
quickly at 37°C. The vial contents were then immediately injected i.p. into recipient
mice using a 26G needle (as described in section 7.2.2.2).
AS was prepared by dissolving 0.52 g NaCl, 1 g tri-sodium citrate, 2.33 g D-glucose
and 9.5 mL glycerol in 100 mL warm deionised water and filter sterilised (0.2µm)
before storing at 4˚C.

CHAPTER 7 __________________________________________________________________________________________________________
205
7.2.2.5. Determination of parasitaemia and parasite titre
The parasitaemia is defined as the percentage of red blood cells (RBC) parasitised by P.
chabaudi, and was determined using Diff-Quik (Perth Scientific Equipment, Australia)
stained thin smears prepared from tail blood from infected rodents. A thin blood smear
was allowed to dry before ten one-second dips in methanol followed by rinsing with
five one-second dips in water, with this procedure repeated for each of the dyes. At
least 2000 erythrocytes (five to ten fields of view) per smear were viewed under oil at
1000x magnification, with the total number of erythrocytes and number of infected
erythrocytes determined. The parasitaemia was then determined using the formula:
Parasite titre is the concentration of infected erythrocytes and was determined from the
RBC titre (RBC mL-1) and parasitaemia (above) of the infected animal. The RBC titre
was determined using a haemocytometer and used to calculate the parasite titre
according to the following formula:
7.2.2.6. Anaesthesia and euthanasia
Animals to be infected with P. chabaudi were anaesthetised for parasite administration
i.p. They were anaesthetised with halothane in a special delivery chamber of clear
perspex (40x20x20 cm) with an inlet hose from an in-line vaporiser (Ohio Medical
Products, USA) using oxygen as the carrier for 0.5-1% halothane. An outlet hose from
the chamber was connected to a rat mask, the rat was placed within the chamber until
anaesthetised after which it was removed and the snout placed into the mask to maintain
halothane anaesthesia during parasite administration.
For the collection of blood by cardiac puncture, animals were anaesthetised as above.
Blood was then collected via cardiac puncture using 21G needles into 1 mL (mice) or 5
mL (rats) syringes containing 0.1 mL of 200 U mL-1 porcine heparin in PBS to prevent
Parasitaemia (%) =number infected erythrocytes
total number erythrocytes×100
)mL (RBC titreRBC x 100iaParasitaem = )mL RBC ed(parasitis titreParasite 1-
1-

CHAPTER 7 __________________________________________________________________________________________________________
206
blood clotting. After blood collection the animals were euthanased by halothane
overdose and cervical dislocation.
7.2.3. In vitro drug studies
7.2.3.1. Culture medium for in vitro drug studies
The culture medium for in vitro drugs experiments against P. chabaudi was RPMI 1640
medium supplemented with 2 mM L-glutamine, 25 mM HEPES, 21 mM sodium
hydrogen carbonate, antibiotics and 20% FBS (Table 7.1).
Table 7.1: Medium used in drug experiments against P. chabaudi in vitro.
Ingredients Concentration Amount to prepare 1 L RPMI 1640 - 10.4 g L-glutamine 2 mM 0.3 g HEPES 25 mM 5.95 g Sodium hydrogen carbonate 21 mM 1.75 g Gentamycin (50 µg mL-1) 15 ng mL-1 0.3 mL
Made up to 800 mL in dH2O. Adjust to pH 7.2 and filter sterilise at 0.2 µm. FBS 20% 200 mL
7.2.3.2. Preparation of drugs
The in vitro efficacy against P. chabaudi of ABZ and OZ when dissolved in DMSO was
compared to their formulation in ΗPβCD. The efficacy of CHQ, the ABZ metabolites
ABSO and ABSO2, and the effect of ΗPβCD were also investigated. Appropriate
concentrations of ABZ, ABSO, ABSO2 and OZ were made up in 100% DMSO and then
diluted with DMSO to create 200 times the concentrations required during the course of
the experiment on the day of the experiment. The drug solutions were then diluted 1:100
with media (above), so that they were twice the concentration required in the
experiment (in 1% DMSO). CHQ was similarly prepared, except that it was dissolved in
PBS before dilution with media. ABZ/ΗPβCD (Section 2.3.1.1) and OZ/ΗPβCD
(Section 2.3.3.1) were diluted from stock solutions with media to the same
concentration range as the drugs dissolved in DMSO. The drug solutions were then
added to equal volumes of parasitised blood (Section 7.2.2.3), so that the parasitised
CHAPTER 7 __________________________________________________________________________________________________________
207
blood volume diluted the drugs to the appropriate concentrations. The final DMSO
concentration in the cultures containing DMSO was 0.5%. Control cultures contained
DMSO, PBS or dH2O as appropriate.
7.2.3.3. In vitro drug efficacy studies
Drug efficacy experiments against P. chabaudi were performed using 96 well plates.
100µL aliquots of drug (Section 7.2.3.2), and 100µL of P. chabaudi-parasitised
erythrocytes at a parasitaemia of 11.6% (Section 7.2.2.3) were added to each well (final
parasitaemia 5.8%). Each drug concentration was investigated in quadruplicate. The
cultures were mixed gently and then incubated in 5% CO2 and 10% O2 in nitrogen for
24 h before evaluation of drug efficacy.
7.2.3.4. Determination of in vitro drug efficacy
Drug efficacy against P. chabaudi in vitro was determination as described by Dow,
(2000). After incubation of the parasites in the presence of the drugs for 24 h, a drop of
the culture was used to prepare a thin film. The parasitaemia of the cultures was then
determined as described in section 7.2.2.5, and drug efficacy assessed using the
following formula:
The average inhibition was then determined for each drug concentration and non-linear
sigmoidal curve fitting (Prism™) was used to generate dose response curves and to
determine IC50 values.
7.2.4. In vivo drug studies
7.2.4.1. Mass infection of rats for in vivo drug studies
Five-week-old male Rattus norvegicus (Wistar strain) were used in in vivo drug
experiments. They were housed, caged and fed as described in section 7.2.2.1. P.
% Inhibition =control parasitaemia - test parasitaemia
control parasitaemia×100

CHAPTER 7 __________________________________________________________________________________________________________
208
chabaudi-parasitised erythrocytes derived from donor rats (Section 7.2.2.3) were diluted
to a concentration of 6.67 x 10⁶ parasitised RBC mL-1 (parasite titre, section 7.2.2.5)
with GC solution (Section 7.2.2.2). Recipient rats were inoculated i.p. with 300 µL of
diluted parasites, or a final inoculum of two million parasitised RBC. This inoculum
protocol was broadly based on a review of published methods Ager, (1984).
7.2.4.2. Drug formulations
The in vivo efficacy of ABZ (suspension, section 3.2.2.1.2, Table 3.1) against P.
chabaudi was compared to that of the ABZ/ΗPβCD complex at pH 2.1 (Section
2.3.1.2). As the ABZ/ΗPβCD formulation was at a specific pH and ΗPβCD
concentration to ensure all ABZ was dissolved, the volume of the ABZ/ΗPβCD
formulation was adjusted as appropriate to administer 7.5, 15, 30 or 60 mg kg-1 day-1
ABZ. This was done to avoid premature precipitation of the ABZ. A similar dosing
regime was applied to the ABZ suspension. The efficacy of 18 mg kg-1 day-1 CHQ
dissolved in PBS was also evaluated. The controls were the suspension and ΗPβCD
only (at pH 2.1) administered at 1.2 g kg-1 (same ΗPβCD concentration and volume as
the largest ABZ/ΗPβCD dose).
7.2.4.3. In vivo drug efficacy studies
Wistar rats inoculated with P. chabaudi (Section 7.2.4.1) were administered ABZ,
ABZ/ΗPβCD, chloroquine or control solutions PO (Section 7.2.4.2) at 12 h intervals on
days 5, 6 and 7 post inoculation. The maximum ΗPβCD concentration was 1.2 g kg-1.
Rats were lightly anaesthetised before drugs were administered by stomach intubation
of up to 0.2 mL 100 g–1 rat using a plastic tube (0.96 mm in diameter) attached to a
blunted needle (21 G) on a 1 mL syringe. Animals were assessed by twice daily
examinations, and parasitaemias determined on days 4, 5, 6, 7, 8 and 10 post-
inoculation (Section 7.2.2.5), and hematocrits determined on days 4, 6, 8 and 10 post-
inoculation (Section 7.2.4.4). Upon completion of the experiment (10 days post
inoculation), animals were euthanased by halothane overdose and cervical dislocation as
described in section 7.2.2.6.

CHAPTER 7 __________________________________________________________________________________________________________
209
7.2.4.4. Determination of haematocrit values
Haematocrit values were determined to assess whether animals were anaemic. Tail vein
blood samples were collected (Section 7.2.2.2) into heparinised capillary tubes (Chase
Scientific Glass, USA), which were then plugged and centrifuged for six minutes in a
haematocrit centrifuge (Clements). The respective lengths of the red cell and plasma
columns were recorded and used to determine haematocrit values in the formula:
7.2.4.5. Determination of in vivo drug efficacy
In all chemotherapy experiments the drug efficacy of each drug regime was evaluated
using repeated measures ANOVA with Bonferonni’s post test (GraphPad Prism).
Comparisons of the percentage change in mean body weight between days 4 and 10 post
inoculation, and haematocrit on day 10 post-inoculation, were carried out for each drug
using t-tests (GraphPad Prism). The percentage change in body weight between days 4
and 10 post inoculation was determined by the following formula:
fraction plasma oflength +fraction cell red oflength fraction cell red oflength =t Haematocri
% Change in body weight =x weight on day 10 - x weight on day 4
x weight on day 4×100

CHAPTER 7 __________________________________________________________________________________________________________
210
7.3. RESULTS
7.3.1. Effect of ΗPβCD on P. chabaudi in vitro
Short term in vitro cultures (24h) were used to assess the efficacy of a range of
compounds against P. chabaudi. The parasitaemia declined during culture, with the
parasitaemia of control cultures dropping from 5.8% at the commencement of the
experiment to an average of 2.7% at the completion of the experiment.
The effect of ΗPβCD on P. chabaudi was investigated in vitro, and was found to
improve culture conditions. Approximately 2% ΗPβCD maintained the initial
parasitaemia, and concentrations greater than 2% resulted in increased parasite growth
over the initial parasitaemia (Figure 7.2).
Figure 7.2: In vitro effect of ΗPβCD on P. chabaudi parasitaemia over 24 h (mean ±
SE, n=4).
0.5 1 2 4 8
0
2
4
6
8
10
Parasitaemia atinoculation (Time 0)
Hydroxypropyl-ß-cyclodextrin (%)

CHAPTER 7 __________________________________________________________________________________________________________
211
7.3.2. In vitro drug studies
7.3.2.1. In vitro efficacy of CHQ, ABZ and OZ against P. chabaudi
The efficacy of CHQ, ABZ, ABSO, ABSO2 and OZ were investigated against P.
chabaudi in vitro. CHQ, ABZ and OZ exhibited IC50‘s of 0.98 µM, 63.7 µM, and 5.4
µM respectively (Table 7.2). However, ABZ preparations at high concentrations
(≥100µM) formed a precipitate. The ABZ metabolites ABSO and ABSO2 both were
found to be ineffective against P. chabaudi in vitro at below 1000 µM.
Table 7.2: Drug IC50s against P. chabaudi in vitro.
Drug CHQ ABZ ABSO ABSO2 OZ
IC50 against P. chabaudi (µM) 0.98 63.7 >1000 >1000 5.4
7.3.2.2. In vitro efficacy of drug/ΗPβCD complexes against P. chabaudi
The efficacy of the ABZ/ΗPβCD and OZ/ΗPβCD complexes were also investigated
against P. chabaudi in vitro. Both drug formulations resulted in improved parasite
growth (Figure 7.3), with improved growth associated with the ΗPβCD concentration of
the formulations. The improved growth due to the ΗPβCD concentration of the
formulations correlate with the results of section 7.3.1.
7.3.3. In vivo drug studies
P. chabaudi infection in Wistar rats resulted in relatively high parasitaemias (up to
35%), no mortality or neurological symptoms, and did not cause severe anaemia or
weight loss (control animals, Table 7.3). At a dose of rate of 18 mg kg-1day-1, CHQ
significantly reduced P. chabaudi infection, causing 100% suppression of parasitaemia
by day 10 post-inoculation (repeated measures ANOVA and Bonferonni’s post test,
p<0.05) (Figure 7.4).

CHAPTER 7 __________________________________________________________________________________________________________
212
Figure 7.3: In vitro effect of ABZ/ΗPβCD and OZ/ΗPβCD on P. chabaudi parasitaemia over 24 h (mean ± SE, n=4). The ΗPβCD concentration of the formulations (when greater than 0.5%) is shown in brackets.
Figure 7.4: Course of infection in P. chabaudi infected rats, and when treated orally with 18 mg kg-1day-1 CHQ on days 5-7 post-innoculation (mean ± SE, n=8).
-8 -7 -6 -5 -4 -3 -2
0
2
4
6
8
10
OZ/CD
(6.6% CD)
(0.66% CD) (2.3% CD)
ABZ/CD
Drug/CD concentration (Log M)
0 2 4 6 8 10
0
2
4
6
8
10
12
Control
CHQ (18 mg kg-1day-1)
Days post-innoculation

CHAPTER 7 __________________________________________________________________________________________________________
213
ABZ did not exhibit significant efficacy when administered at up to 60 mg kg-1 day-1
(repeated measures ANOVA and Bonferonni’s post test, p>0.05). Investigation into the
therapeutic effects of ABZ found that ABZ treatment resulted in increased anaemia
(significant at 60 mg kg-1day-1, t test, p<0.05) (Table 7.3). The in vivo efficacy of the
ABZ/ΗPβCD complex (pH 2.1) against P. chabaudi was also investigated, and found to
exhibit no significant efficacy at up to 60 mg kg-1day-1 (repeated measures ANOVA and
Bonferonni’s post test, p>0.05). In addition, the ABZ/ΗPβCD formulation resulted in a
dose related depression of weight gain (significant at 60 mg kg-1day-1, t test, p<0.05)
and increased anaemia (significant at 60 mg kg-1day-1, t test, p<0.05), which appeared to
be greater than that observed for the ABZ formulation (Table 7.3).
Table 7.3: Therapeutic effects of oral ABZ and ABZ/ΗPβCD treatment in P. chabaudi
infected rats.
ABZ a ABZ/ΗPβCD b Drug treatment
(mg kg-1day-1)
% Change in body weight ±
SE c
Post treatment haematocrit ±
SE d
% Change in body weight ±
SE c
Post treatment haematocrit ±
SE d Control +18.8 ± 2.8 0.32 ± 0.018 +17 ± 2.8 0.33 ± 0.02
7.5 +20.1 ± 4.0 0.32 ± 0.01 +18.9 ± 3.1 0.36 ± 0.014 15 +19.7 ± 3.5 0.3 ± 0.019 +14.6 ± 2.1 0.36 ± 0.008 30 +19.5 ± 2.5 0.29 ± 0.011 +13.8 ± 2.5 0.27 ± 0.031 60 +12.4 ± 3.1 0.24 ± 0.017* +1.9 ± 5.1* 0.21 ± 0.042*
a. ABZ and control (drug vehicle) were administered orally at 12 h intervals on days 5, 6 and 7 post inoculation. b. ABZ and control (ΗPβCD) were administered orally at 12 h intervals on days 5, 6 and 7 post inoculation. c. Percentage change in mean body weight between days 4 and 10 post inoculation. d. Haematocrit on day 10 post-inoculation. Haematocrit values greater than 0.39 are normal in rats (Dow, 2000). * Significantly different from control group (t test, p<0.05).
The OZ/ΗPβCD complex was formulated in 60% ΗPβCD at pH of 11. I.p.
administration of this formulation at 0.1 mL kg-1 appeared to cause no adverse effects.
However larger or multiple doses of this formulation resulted in chemical peritonitis and
metabolic alkalosis (Section 3.4.4). Therefore the in vivo antimalarial activity of OZ or
OZ/ΗPβCD complex was not investigated further.

CHAPTER 7 __________________________________________________________________________________________________________
214
7.4. DISCUSSION
7.4.1. Effect of ΗPβCD in vitro
The parasitaemia of short term P. chabaudi cultures declined during culture, with the
parasitaemia of control cultures dropping from 5.8% to 2.7% over 24 h. Similar results
were observed in P. chabaudi chabaudi by Sohal & Arnot, (1993), P. vinckei chabaudi
by Coombs & Gutteridge, (1975) and in P. berghei by Dow, (2000) and Kamiyama &
Matsubara, (1992). These researchers reported the decrease in parasitaemia due to
reduced reinvasion by merozoites under in vitro culture conditions, and therefore this
was probably the case here. ΗPβCD was found to improve P. chabaudi growth in in
vitro cultures. CD has also been found to improve microbial growth in a number of in
vitro systems (Bar, 1990; Sawada et al., 1990; Ramirez et al., 1993; Morshed et al.,
1994; Kátó et al., 1993; 1994; Frohlich et al., 1996; Gorfien et al., 2000; Testerman et
al., 2001), although the mechanism for improved growth was not always clear.
Proposed mechanisms for increased microbial growth have been:
1. CD as a carbon source (Schlosser et al., 1993), as described in section 1.2.2.
2. Increased solubilization of a substrate or product due to complexation (Sawada et al.,
1990; Singer et al., 1991; Greenberg-Ofrath et al., 1993; Jadoun & Bar, 1993a;
Ramirez et al., 1993; Kátó et al., 1993; 1994; Gorfien et al., 2000), as described in
section 1.3.1.
3. Increased stability of a substrate (Kátó et al., 1994), as described in section 1.3.2.
4. Modification of the cell membrane/wall (Sawada et al., 1990; Frohlich et al., 1996),
as described in section 4.1.1 and 4.1.2.
5. CD involved in a microbial process by interacting with the cell membrane (Singer et
al., 1991; Jadoun & Bar, 1993a), as described in section 4.1.1.

CHAPTER 7 __________________________________________________________________________________________________________
215
6. Decreased inhibition by an inhibitory or toxic compound due to complexation (by
decreasing the concentration of the uncomplexed compound) (Sawada et al., 1990;
Singer et al., 1991; Kátó et al., 1993; 1994; Morshed et al., 1994; Frohlich et al., 1996;
Gorfien et al., 2000; Testerman et al., 2001), as described in section 3.1.1 and 4.1.2.
7. CD stressed the microorganism in a particular manner that resulted in a specific
response, which lead to improved survival/growth (Siundiukova et al., 1999).
Several of these mechanisms can lead to either decreased or increased microbe growth.
In addition, in in vitro culturing systems where the exact media components are not
known, several of these processes may be occurring, as CDs are capable of complexing
a wide range of components. Therefore it is necessary to determine which is the critical
process, i.e. the one that leads to increased microbial growth. As the decreased
parasitaemia in in vitro cultures of P. chabaudi was associated with reduced reinvasion
by merozoites, it is possible that increases in parasitaemia observed with the addition of
ΗPβCD may have been associated with the improved reinvasion of RBC by merozoites.
However the mechanism for such an improvement is unclear. It is also quite possible
that improved P. chabaudi growth in the presence of ΗPβCD resulted from ΗPβCD
acting as a food source. Intracellular plasmodia ingest the contents of the host cell,
which is mainly haemoglobin or haemoglobin precursors, depending on the age of the
cell. In comparison, exoerythrocytic plasmodia obtain their nutrients mainly by simple
diffusion, with the main source of energy being glucose (Carter & Diggs, 1977; Noble
& Noble, 1979). As the malaria media contained excess glucose (11.1 mM from
RPMI), and to use ΗPβCD as a food source, the parasite would need
cyclomaltodextrinases to breakdown the ΗPβCD (Section 1.2.2), it is unlikely that
ΗPβCD was acting as a food source. Alternatively, ΗPβCD may interact with, or
induce modifications to the merozoite or RBC membrane that facilitate reinvasion or
improve the survival of the free merozoite. However increases in ΗPβCD concentration
greater than 4% did not lead to additional increases in parasite growth. Therefore
improved growth more likely resulted from the increased solubilization, and hence
bioavailability of a necessary component, or the complexation and removal of an
inhibitory compound.

CHAPTER 7 __________________________________________________________________________________________________________
216
During erythrocytic schizogony, the parasite invades and multiplies in the RBC.
Therefore the susceptibility of RBC to CD is also very important. Garay et al., (1994)
investigated the haemolytic effects of CDs on human RBC, and found the presence of
plasma strongly reduced the haemolytic potency of HPβCD and the methylated CDs. In
particular, HPβCD exhibited a hemolysis ED50 of 57 mM (approximately 8%) in saline
media, whereas no hemolysis was observed in plasma. This would explain the absence
of RBC hemolysis due to HPβCD in the P. chabaudi in vitro experiments, as the
cultures contained 50% whole blood. The presence of whole blood resulted in a larger
competitive binding capacity exerted by the larger amounts of complexable components
in the medium.
Complexation of ABZ and OZ with ΗPβCD did not improve the antimalarial efficacy
of these drugs. Instead, the parasitaemia of the test cultures increased in correlation
with their ΗPβCD concentration. While ΗPβCD may be acting to decrease the efficacy
of the drugs, it is more likely that the improved growth due to ΗPβCD was greater that
the detrimental effect of the drugs. CDs have been introduced as carriers of essential
lipids, cholesterol and long-chain fatty acids into a number of microbial in vitro
cultures, as an alternative to serum and BSA (Greenberg-Ofrath et al., 1993). However
the results of these experiments indicate that the use of CDs as a part of the cultivation
medium may modify the behaviour and therefore efficacy of administered drugs in in
vitro drug studies. Therefore after optimisation of cultures with CD, the effect of CD on
the efficacy of these drugs would need to be investigated.
7.4.2. In vitro drug studies
The control compound, CHQ, exhibited an IC50 of 0.984 µM against P. chabaudi in
vitro, which is higher than that previously reported for this parasite (Sohal & Arnot,
1993), and for the malaria parasites P. falciparum and P. berghei (Dow, 2000) (Table
7.5). This is most likely a consequence of the different culture and assay conditions.
ABZ exhibited an IC50 of 63.7 µM against P. chabaudi in vitro, which is comparable to
that previously reported for P. falciparum (Dieckmann-Schuppert & Franklin, 1990;
Skinner-Adams et al., 1997; review by Bell, 1998), but lower than that for P. berghei,

CHAPTER 7 __________________________________________________________________________________________________________
217
which was >1000 µM (Dow, 2000) (Table 7.5). In addition, both ABSO and ABSO2
were found to be ineffective against P. chabaudi in vitro. As previously observed by
Dow, (2000), ABZ preparations at high concentrations (>100µM) formed a precipitate.
Dow, (2000) therefore suggested that the level of antimalarial potency of ABZ observed
in published reports may be underestimated. The wide range in ABZ efficacy over a
narrow pH range observed by Skinner-Adams et al., (1997) supports this, as ABZ
solubility increases with decreasing pH (Section 2.3.1.2).
OZ exhibited an IC50 of 5.424 µM against P. chabaudi in vitro, which is comparable to
that previously reported for P. berghei (Dow, 2000) (Table 7.5). The effects of the
dinitroaniline trifluralin against P. falciparum have been investigated, and found to
cause microtubule depolymerisation (Kaidoh et al., 1995). This is therefore the likely
explanation for the effect of OZ against P. chabaudi and P. berghei, given their similar
structural characteristics.
Table 7.4: Drug IC50s against P. falciparum, P. berghei and P. chabaudi in vitro.
Drug IC50 against P. falciparum (µM)
IC50 against P. berghei (µM) b
IC50 against P. chabaudi (µM) c
ABZ 2->100 a >1000 63.7 ABSO 200 a >1000 >1000 ABSO2 >100 a >1000 >1000 OZ - 4.3 5.424 CHQ 0.015 b 0.096 0.984 a. Data from Dieckmann-Schuppert & Franklin, (1990), Skinner-Adams et al., (1997) and Bell, (1998). b. Data from Dow, (2000). c. Present experiments.
7.4.3. In vivo drug studies
While the rat malaria model did not result in malaria infections comparable in severity
and mortality to conventional mouse malaria models (Carter & Diggs, 1977; Dow,
2000; Dow et al., 1998), in vivo drug efficacy was easily assessable as seen from the
CHQ data. The efficacy of CHQ (18 mg kg-1day-1) against P. chabaudi was similar to
that previously reported for P. berghei (Dow, 2000), causing 100% suppression of
parasitaemia in the rat malaria model. However ABZ (up to 60 mg kg-1day-1) either
alone or complexed was ineffective against P. chabaudi infections, as the highest dose

CHAPTER 7 __________________________________________________________________________________________________________
218
tested did not result in significant parasite inhibition. These results correlate with the
pharmacokinetics of ABZ (Chapter 3) and the in vitro antimalarial efficacy of ABZ,
ABSO and ABSO2 (Section 7.4.2). In pharmacokinetic studies, orally administered
ABZ achieved only low plasma concentrations, and was rapidly metabolised to ABSO
and ABSO2, which had no efficacy against P. chabaudi in vitro at less than 1000 µM.
Therefore the plasma concentrations achieved by these compounds in vivo were
considerably lower than those required to cause 50% inhibition of parasite growth.
P. chabaudi infected Wistar rats did not exhibit the characteristic anaemia or
suppression in body weight gain as was described for P. berghei infected LEW/SSN rats
by Dow et al., (1999). Dow et al., (2000) observed orally administered ABZ to
exacerbate these symptoms in a dose related fashion. Here high doses of ABZ resulted
in suppression in weight gain, and high doses of the ABZ/ΗPβCD complex resulted in
anaemia and suppression in weight gain. ABZ has been found to induce pancytopenia
in a dog, cat (Stokol et al., 1997) and an elderly woman with hepatic hydatids
(Fernández et al., 1996). Leucopaenia in rats (Dow, 2000), resulting from bone marrow
toxicosis has also been observed. The toxic effect was thought to be directed against
proliferating committed hematopoietic precursors, probably caused by inhibition of
mitosis resulting from the antitubulin action of ABZ (Stokol et al., 1997). This theory is
supported by the results of Whittaker & Faustman, (1991), who found ABZ to be a
potent inhibitor of cell growth and differentiation, causing an accumulation of cells in
the mitotic phase of the cell cycle in rat embryonic cells (See section 4.4.1.1).
Manifestations of the antimitotic activity of a number of benzimidazole analogues
include cell-cycle arrest, cytoskeletal disruption, random chromosomal dispersion and
micronucleus formation (Holden et al., 1980, reviewed by Delatour & Parish, 1986 and
Whittaker & Faustman, 1991). The occurrence of anaemia and suppression in weight
gain in rats treated with high doses of ABZ/ΗPβCD is therefore likely the result of ABZ
induced bone marrow injury, with increased bone marrow injury in rats administered
the ABZ/ΗPβCD complex associated with the higher systemic concentrations that can
be achieved following oral administration (Section 3.4.1.4).
Dow et al., (2000) found ABZ to inhibit P. berghei in vivo. However, as P. berghei
preferentially parasitises reticulocytes and other young RBC (McNally et al., 1992), it is
CHAPTER 7 __________________________________________________________________________________________________________
219
likely that the antimalarial effects of ABZ against P. berghei are mediated via depletion
of red cell precursors, as opposed to a direct effect against the parasite itself (Dow et al.,
2000). While not observed in vivo, P. chabaudi has also been found to preferentially
parasitise reticulocytes in vitro, but to a lesser extent than P. berghei (McNally et al.,
1992). This therefore explains the absence of any indirect effect of ABZ against P.
chabaudi in vivo.
7.4.4. Conclusion
P. chabaudi is difficult to cultivate in vitro, predominately due to the reduced reinvasion
of erythrocytes by merozoites. The use of CDs therefore offers a potential solution to
this problem. As whole blood or plasma reduces the haemolytic effect of HPβCD by
providing a source of complexable compounds, it effectively reduces the free
concentration of HPβCD. Therefore more research would be required to determine
appropriate concentrations of CD and plasma for the in vitro cultivation of the rodent
malarias. CD solubility, its toxicity to the cell, its ability to complex lipids, and the
extent of complexation (strong binding decreases the concentration of the uncomplexed
compound) are important factors that must be considered when choosing a CD. In
general the methylated CDs are the most potent solubilizing agents (Szente, 1994), but
their effect on cell membranes would need to be closely monitored. If the increase in P.
chabaudi growth is the result of complexation of either water insoluble or inhibitory
compounds, the methylated CDs may offer improved in vitro cultivation systems.
Alternatively, HPβCD may offer a compromise between increased lipid solubilization
and decreased membrane interference. However, a possible disadvantage of the use of
CD to enhance P. chabaudi growth for drug studies is the potential sequestration of
drug by CD following drug addition to the cultures.
Due to the occurrence of bone marrow injury after oral administration of high doses of
ABZ, the necessity for high doses of ABZ to exhibit antimalarial efficacy in vitro, and
the rapid metabolism of ABZ in vivo, ABZ is unlikely to be an effective antimalarial
agent. The dinitroanilines appear to be more promising antimalarials than the
benzimidazoles. In particular, Dow, (2000) found pendimethalin and TF to be the most
effective dinitroanilines against malaria in vitro. However, due to the low plasma levels
CHAPTER 7 __________________________________________________________________________________________________________
220
of TF achieved in in vivo experiments, it was found to be ineffective against P. berghei
in vivo. OZ also achieved only low plasma concentrations for short periods of time in
pharmacokinetic experiments (Chapter 3). Therefore, while these plasma
concentrations were in excess of the IC50 for OZ against P. chabaudi in vitro, the results
of the OZ pharmacokinetic study did not indicate that the OZ/ΗPβCD complex would
result in improved bioavailability of OZ for the treatment of systemic parasites.
Therefore alternative means to improve systemic concentrations of the dinitroanilines
still need to be investigated.

CHAPTER 8 __________________________________________________________________________________________________________
221
CHAPTER 8. GENERAL DISCUSSION

CHAPTER 8 __________________________________________________________________________________________________________
222
8.1. DRUG SOLUBILITY AND CD COMPLEXATION
CDs have the ability to form noncovalent bonded inclusion complexes with
hydrophobic drugs, increasing various physicochemical properties such as drug aqueous
solubility, stability and dissolution rate (Duchêne et al., 1987; Szejtli, 1991a; Loftsson
& Brewster, 1996). This allows the creation of formulations for water insoluble drugs
that are difficult to deliver with more traditional formulations. Extensive examples of
the role of CD complexation of poorly water-soluble drugs to improve their aqueous
solubility and stability, to provide improved dissolution characteristics over other
formulations of the drug, and hence improved bioavailability, exist in the literature.
Here the antiparasitic agents ABZ, TF and OZ were investigated with a view of
improving their water solubility and in vivo bioavailability through CD complexation.
All three antiparasitic agents exhibited improved solubility with ΗPβCD complexation.
However, complexation alone was not enough to produce formulations of sufficient
concentration for in vivo experiments. In general the complexation efficiency of CDs is
rather low, and thus large amounts of CD are required to complex small amounts or
drug (Loftsson et al., 1999). Increased complexation efficiency can be achieved by
increasing either the aqueous solubility of the drug (SO) or the stability constant of the
complex (KC). The use of temperature and pH were used to increase the water
solubility of the drugs, with ABZ solubility increasing with increasing temperature and
decreasing pH, and OZ solubility increasing with increasing temperature and increasing
pH. Subsequently, additional increases in ABZ and OZ solubility were achieved
through the manipulation of temperature and pH in combination with increased ΗPβCD
concentrations. Of particular interest is the improved pharmacokinetics of the
ABZ/ΗPβCD complex when formulated at a low pH. In addition, complexation of OZ
with ΗPβCD was also improved with increasing pH, with ionisation of OZ favouring
complex formation (increasing KC) (Section 2.4.3.3). The investigations into potential
CD formulations here were by no means exhaustive. Alternative techniques that may be
investigated to enhance of the drug solubilizing capacity of CD include the addition of
components such as polymers, organic acids, pluronics, nanoparticles, or hydroxypropyl
methylcellulose to aid complexation (Section 1.3.1), the complexation of prodrugs, or
by altering the ionic strength (Zia et al., 2001). In addition, improved solubilization
over that achieved by HPβCD may potentially be observed with a number of other CDs

CHAPTER 8 __________________________________________________________________________________________________________
223
and derivatised CDs, particularly the methylated CDs (Castillo et al., 1999). However,
the mode of drug administration would need to be considered, as alternative CDs can
have drawbacks in relation to their own biological activity (Section 1.4.2 and 1.7.1).
More recently, SBE7M-β-CD has been found to have stronger complexation ability over
HPβCD (Zia et al., 2001), and as it has comparable parenteral safety to that of HPβCD
(Stella, 1996), it may provide a feasible alternative.
Various methods can be applied to enhance the complexation efficiency of CDs, and it
is frequently possible to enhance the efficiency even further by applying several
methods simultaneously (Loftsson et al., 1999). Several methods to increase ABZ
solubility and bioavailability have been investigated. These include various additives or
formulations (Lanusse & Prichard, 1991; Yang & Fung, 1991; del Estal et al., 1993;
Wen et al., 1994; 1996a and b; Rodrigues et al., 1995; Torrado et al., 1996a and b;
1997; Sarciron et al., 1997), as well as altered diet and dosing regimes (Kwan et al.,
1988; Lange et al., 1988; Barger et al., 1992; Hussar, 1997; New et al., 1994).
Combinations of these methods in conjunction with CD formulation, temperature
adjustment and pH modifications could therefore enhance ABZ solubility and
bioavailability considerably. In addition, DMβCD (Castillo et al., 1999) and SBE7M-β-
CD (Piel et al., 1999) have been observed to improve ABZ solubilization over that
achieved by HPβCD, though the biological activity of these cyclodextrins via various
routes of administration needs to be considered. However, by using appropriate CDs
and enhancing complexation efficiency, less CD is needed to solubilize a given amount
of drug, thus reducing its potential impact on biological systems.
Ionic cyclodextrin derivatives may enhance the solubility and stability of ionic guest
molecules by establishing ionic interactions with them (Szejtli, 1991a; Másson et al.,
1996) (Section 1.4.2.5). Compared to the neutral CDs, enhanced complexation is
frequently observed when the drug and CD have opposite charge (Másson et al., 1996;
1998). The mode of interaction is presumed to be the hydrophobic interaction with the
cavity interior, with additional electrostatic interactions between the oppositely charged
guest and host (Zia et al., 2001). As previously discussed (Section 2.4.1.3), increased
drug solubility due to its ionisation is generally associated with a decrease in
complexation (Yalkowsky, 1999). However, while the location/arrangement of the
CHAPTER 8 __________________________________________________________________________________________________________
224
guest within the CD cavity may be modified to allow for ionic interactions, the presence
of this charge attraction between the ionised drug and the ionic CD derivative seems to
counterbalance the adverse effect of the increased guest hydrophilicity, thus maintaining
their binding potential (Másson et al., 1998; Zia et al., 2001). Therefore particular ionic
CDs may be more effective at solubilizing ionic ABZ and OZ. Given that ionised OZ
exhibited improved complexation with HPβCD, additional improvements may also by
observed with oppositely charged ionic CDs. This would also allow investigations into
the increased complexation of OZ observed when in its ionised form, and potentially
allow less extreme pHs to be tested.
Further research should also include the preparation of solid inclusion complexes for
more specific investigations into stoichiometry, dissolution studies and clinical drug
trials. While the stoichiometry of the ABZ/CD complex has been investigated by a
number of researchers (Kata & Scheuer, 1991; Piel et al., 1999; Castillo et al., 1999),
more detailed studies are needed, as well as investigations into the stoichiometry of the
OZ/ΗPβCD complex. Further studies are also required to investigate the effect of
different buffers on drug solubility enhancement. A number of different buffers have
been used in combination with ABZ/CD complexation with the view of modifying the
pH and thus enhancing ABZ solubility (Chun & Park, 1993; Evrard et al., 1998;
Castillo et al., 1999; Piel et al., 1999). In the present study a differential solubilizing
ability between phosphate buffer and citric acid buffer was observed, with the
phosphate buffer more effective. The reason for this requires further investigation, as
well as investigations into alternative buffering systems that may result in additional
increases in ABZ solubility. In addition, OZ was observed to have unusual
solubilization curves with varying pH values and ΗPβCD concentration (Section
2.3.3.2), which also requires further investigation.
8.2. ALBENDAZOLE CD COMPLEXATION
ABZ is a benzimidazole carbamate with a broad anti-parasitic spectrum (Theodorides et
al., 1976; de Silva et al., 1997; Parfitt, 1999). Initially ABZ was predominantly used as
an anthelmintic, but over recent years it has also been used as an antiprotozoal agent
(Morgan et al., 1990; Reynoldson et al., 1992; Harris et al., 2001). As absorption of

CHAPTER 8 __________________________________________________________________________________________________________
225
ABZ from the gastrointestinal tract is poor, orally administered ABZ has been of most
value against intestinal parasites. ABZ is principally metabolised in the gut, with ABZ
that is absorbed from the gastrointestinal tract rapidly metabolised in the liver to ABSO
and ABSO2. ABSO is considered the active compound against helminths, whereas ABZ
is the active compound against protozoa (Bogan & Marriner, 1984; Marriner et al.,
1986; Hussar, 1997). Therefore the purpose of the present study was to evaluate the
potential usefulness of ABZ when complexed with ΗPβCD against a range of protozoan
parasites. This approach involved investigations into the pharmacokinetics,
cytotoxicity, in vitro efficacy against Giardia, Cryptosporidium and malaria, and the in
vivo efficacy against Giardia and malaria of both ABZ and the ABZ/ΗPβCD complex.
Through the use of ΗPβCD complexation ABZ solubility was increased sufficiently for
in vitro drug efficacy studies, and in combination with pH modification and temperature
manipulation, ABZ solubility was sufficient for in vivo drug efficacy studies (Chapter
2). The cytotoxicity experiments carried out here supported the findings of Whittaker &
Faustman, (1991), where the cytotoxic affects of ABZ were only relevant to cells
undergoing rapid cellular growth or differentiation, or those that were unable to detoxify
ABZ. It was also determined that ΗPβCD complexation did not affect ABZ cytotoxicity
(Chapter 4). Therefore the effect of ABZ and its metabolites on both rapidly
proliferating and differentiating cells must be considered when evaluating treatment
regimes for parasitic infections, particularly when high concentrations are used over
extended periods of time. In the ABZ pharmacokinetic experiments investigated here,
single oral doses of up to 30 mg kg-1 were administered. Complexation of ABZ with
ΗPβCD improved drug bioavailability systemically, indicating a potential for improved
efficacy of ABZ against systemic parasites over conventional ABZ formulations. ABZ
was rapidly metabolised to ABSO and ABSO2, with plasma concentrations <100 µM
(maximum concentration investigated in cytotoxicity experiments), and the majority of
ABZ metabolites eliminated from the body within 12 hours (Chapter 3). Therefore
ABZ and its metabolites would have resulted in minimal overall cytotoxicity. However,
their effect on rapidly proliferating and differentiating cells within the body would be
relative to the ability of the cells to metabolise ABZ and the length of toxicant exposure
(Whittaker & Faustman, 1992). The treatment of malaria infected rats with ABZ
required high doses of ABZ to be administered over an extended time frame, resulting

CHAPTER 8 __________________________________________________________________________________________________________
226
in dose related anaemia and suppression in weight gain, which was amplified in rats
administered the ABZ/ΗPβCD complex (Chapter 7). The occurrence of anaemia and
suppression in weight gain is likely the result of ABZ induced bone marrow injury,
resulting from the anti-tubulin action of ABZ (Stokol et al., 1997; Dow, 2000).
Therefore under these conditions the cytotoxic effects of ABZ were evident. In
addition, the increased bone marrow injury in rats administered the ABZ/ΗPβCD
complex was associated with the higher systemic concentrations of ABSO that can be
achieved following the oral administration of ABZ.
The efficacy of ABZ was investigated against three protozoan parasites that infect
different compartments within the body. Both Giardia and Cryptosporidium infect the
gastrointestinal tract, with Giardia attaching to the mucosa at the bases of the microvilla
(Meyer, 1985; Ampofo et al., 1991), and Cryptosporidium predominately an
intracellular parasite located at the luminal surface of the host epithelial cell
(O'Donoghue, 1995; Petersen, 1993). Malaria on the other hand causes systemic
infections, invading the liver and RBCs (James & Gilles, 1985; Garcia & Bruckner,
1988; CDC, 2001c; Navy Environmental Health Center, 2001). ABZ was a potent
inhibitor of Giardia in vitro, with the MIC, IC50 and MLC all in the nM range. In
addition, ABZ was effective against Giardia in vivo. The primary effect of ABZ against
Giardia appears to be due to its binding to cytoskeletal proteins (tubulin and/or
giardins), thus effecting Giardia attachment and possibly feeding (Seow et al., 1985;
Edlind, 1989b; Meloni et al., 1990; Morgan et al., 1990; Oxberry et al., 1994).
Therefore the location of the parasite within the body makes it susceptible to orally
administered antigiardial agents (Chapter 5). ABZ was also effective against
Cryptosporidium in vitro, although less so than against Giardia, with the MIC, IC50 and
MLC in the low µM range. The lower efficacy of ABZ against Cryptosporidium was
attributed the lower susceptibility of Cryptosporidium tubulin (Edlind et al., 1994;
Katiyar et al., 1994; Fayer & Fetterer, 1995; Cacciò et al., 1997) (Chapter 6). In
comparison, ABZ was effective against malaria in vitro in the low µM range, but was
not effective against malaria in vivo. While malaria tubulin has been found to be
susceptible to a number of tubulin antagonists (Bell, 1998; Hommel & Schrével, 1998;
Dow, 2000), the absence of ABZ in vivo efficacy in comparison to its in vitro efficacy

CHAPTER 8 __________________________________________________________________________________________________________
227
was due to the low plasma concentrations of ABZ following its oral administration
(Chapter 7).
Complexation of ABZ with ΗPβCD modified the behaviour of ABZ in a number of
systems. As discussed above, the complex did not affect ABZ cytotoxicity, but did
improve the pharmacokinetics of ABZ. Against the protozoan parasites, the
ABZ/ΗPβCD formulation was observed to have equal efficacy against Giardia both in
vitro and in vivo, but decreased efficacy against C. parvum in vitro compared to
conventional ABZ formulations. This was attributed to the different locations of the
two parasites, G. duodenalis on the culture wall in vitro or attached to epithelial cells in
vivo, and C. parvum enclosed within a host cell. In addition, excess ΗPβCD was also
found to reduce ABZ efficacy against Giardia in vitro, due to a decrease in the effective
drug concentration through competitive inclusion complex formation. ΗPβCD
complexation also decreased the efficacy of ABZ against malaria in vitro. However,
this is more likely the result of improved cultivation of the parasite as opposed to any
effect on ABZ efficacy. However, further investigations would be required to verify
this. In comparison, the ABZ/ΗPβCD formulation did not affect ABZ efficacy against
malaria in vivo, despite the improved dissolution and absorption of ABZ, as the
systemic concentrations of ABZ would have still been insufficient to inhibit parasite
growth.
Albendazole is highly effective in the treatment of a majority of intestinal helminth
infections and, with high, prolonged doses, against systemic helminth infections
(Section 2.1.2.3). Many attempts to increase ABZ solubility and dissolution have been
carried out with the view of increasing the systemic bioavailability of ABSO for the
treatment of a number of systemic infections such as hydatid disease and
neurocysticercosis (Section 2.1.4.1). As high and prolonged doses of ABZ are required
against such infections, methods that improve ABSO bioavailability can result in a
decrease in the dose and duration of albendazole treatment, and possibly, reduce its
adverse effects. Recently the efficacy of an ABZ/HPβCD complex was investigated
against the tissue nematode Trichinella spiralis, and compared to ABZ prepared in 0.5%
sodium-carboxymethylcellulose (García-Rodriguez et al., 2001). Complexation was
found to improve both the pharmacokinetics (AUC and Cmax) and anthelmintic effects

CHAPTER 8 __________________________________________________________________________________________________________
228
of the complex against all stages of the Trichinella lifecycle, particularly the intestinal
and muscular stages. In comparison, the pharmacokinetic profile of the ABZ/HPβCD
complex (pH 2.1) used here were greater that that achieved by García-Rodriguez et al.,
(2001), and thus may also prove effective against systemic helminth infections. In
addition, previously used methods to increase ABZ or ABSO bioavailability could be
used in conjunction with CD complexation. One such method is the co-administration
of the dipeptide methyl ester (Phe-Phe-OMe), which has been found to damage the
laminated layer of the cyst of E. multilocularis (Sarciron et al., 1997). The laminated
layer is a non-cellular membrane that represents an important barrier to the penetration
of drugs. Another alternative is the co-administration of cimetidine, a cytochrome p-
450 inhibitor that has been found to enhance ABSO concentrations, particularly in the
liver and biliary system (Wen et al., 1994; 1996a).
Ultimately, the formulation of ABZ with ΗPβCD did not improve ABZ efficacy against
the protozoan parasites Giardia, Cryptosporidium or malaria. Drugs with low solubility
have an advantage in the treatment of intestinal parasites, as a larger portion of the drug
remains in the gastrointestinal tract, and hence, in contact with the parasites. Therefore
the main advantage of the ABZ/ΗPβCD complex, i.e. the improved dissolution and
absorption of ABZ, is unlikely to present any real improvements over current
formulations against Giardia and Cryptosporidium. The oral administration of the
ABZ/ΗPβCD complex would therefore be more beneficial in the treatment of systemic
parasites, as the ABZ/ΗPβCD complex results in higher systemic concentrations of the
ABZ and its metabolite ABSO over conventional formulations. In addition, further
evaluation of the role of enantiomeric ABSO may also reveal interesting results.
However, as protozoan parasites are predominantly affected by ABZ and not ABSO, the
high systemic concentration of ABSO achieved is of little consequence against malaria.
Therefore the future use of ABZ/ΗPβCD complexes has potential against susceptible
systemic parasites, and with further investigation may also show potential against a
range of intestinal parasites or even multiple infections.

CHAPTER 8 __________________________________________________________________________________________________________
229
8.3. CD COMPLEXATION OF THE DINITROANILINES
The dinitroanilines exhibit both fungicidal and herbicidal activity, and have recently
been found to exhibit activity against certain parasites (Probst et al., 1975). Following
oral administration the dinitroanilines OZ and TF display low tissue residues and
plasma concentrations, which is attributed to poor drug absorption and their extensive
metabolism in the gut. Parenteral administration also results in low plasma
concentrations, as they are strongly tissue bound (Weber & Monaco, 1972) (Section
2.1.3). Therefore the purpose of the present study was to evaluate the potential
usefulness of the dinitroanilines TF and OZ when complexed with CD against a range
of protozoan parasites. While the solubility of TF did improve with ΗPβCD
complexation, the final TF/ΗPβCD concentrations were insufficient for in vitro or in
vivo drug efficacy studies. However OZ did exhibit increases in solubility when
complexed with ΗPβCD that were sufficient for drug efficacy studies, and hence its
antiparasitic activity was investigated. This involved investigations into the
pharmacokinetics, cytotoxicity, and in vitro efficacy against Giardia, Cryptosporidium
and malaria of both OZ and the OZ/ΗPβCD complex.
Through the use of ΗPβCD complexation OZ solubility was increased sufficiently for in
vitro drug efficacy studies, and in combination with pH modification and temperature
manipulation, OZ solubility was increased sufficiently for in vivo drug efficacy studies.
Previously published results found OZ to inhibit a variety of tumour cells in culture,
with IC50s in the range of 2-25 µM (Dvorakova et al., 1997; Powis et al., 1997).
However the present cytotoxicity studies did not reveal any cytotoxic effects of OZ
(Chapter 4). This was thought due to the different assessment techniques employed, and
attributed to OZ being selective for proliferating or differentiating cells, similar to ABZ.
These results are not surprising, as both drugs affect the microtubule system (Anthony
& Hussey, 1999) (Section 2.1.1). Therefore the effect of OZ on both rapidly
proliferating and differentiating cells must be considered when evaluating treatment
regimes for parasitic infections, particularly when high concentrations are used over
extended periods of time. In the OZ pharmacokinetic experiments carried out here,
single i.p. doses of up to 25 mg kg-1 were administered, with the complexation of OZ
with ΗPβCD not significantly improving the bioavailability of OZ (Chapter 3).

CHAPTER 8 __________________________________________________________________________________________________________
230
However, OZ plasma concentrations following OZ/ΗPβCD administration peaked
earlier and higher than after OZ administration, and OZ was eliminated from the plasma
sooner. While plasma OZ concentrations in these experiments did reach sufficient
concentrations to effect proliferating or differentiating cells based on the findings of
Dvorakova et al., (1997) and Powis et al., (1997), they were not sufficient to affect cells
in the stationary phase based on the cytotoxicity experiments carried out here. Therefore
the administration of larger doses over extended time frames would need to be carefully
evaluated. Given the strong binding capacity of OZ and its extensive metabolism in
vivo, lower toxicity than expected may be observed. Alternatively, CD complexation,
while not affecting the pharmacokinetic profile of OZ, may improve OZ stability and
increase renal clearance, thus reducing its toxicity. As the dinitroanilines are
susceptible to photodecomposition and readily adsorb to glass and proteinaceous
substances, the capacity for CD complexation to influence the photodecomposition and
binding capacity of the dinitroanilines also requires further investigation.
The in vitro efficacy of OZ was investigated against the three protozoan parasites
Giardia, Cryptosporidium and malaria. OZ was found to be ineffective against Giardia
at the concentrations tested, with IC50’s in the mM range (Chapter 5). In comparison,
OZ was effective against Cryptosporidium and malaria in vitro, with IC50’s of 0.9 nM
and 5.4 µM respectively (Chapters 6 and 7). Following complexation with ΗPβCD, OZ
efficacy did not improve against Giardia or Cryptosporidium, and in the presence of
ΗPβCD, OZ efficacy against malaria decreased in vitro. The OZ/ΗPβCD complex had
a lower stability constant than the ABZ/ΗPβCD complex (Chapter 2). While this would
have resulted in the increased solubility and potentially improved dissolution of OZ, it
would have not exhibited the extent of altered drug behaviour that was observed for the
ABZ/ΗPβCD complex (i.e. its decreased efficacy against Giardia in the presence of
excess ΗPβCD, and its decreased efficacy against Cryptosporidium). As the efficacy of
the OZ/ΗPβCD complex did not improve against Giardia or Cryptosporidium in vitro,
the in vivo efficacy of both OZ and the OZ/ΗPβCD complex were not evaluated.
However, this does not mean that improved efficacy could not be observed in vivo.
Improved efficacy may be observed against Cryptosporidium due to the improved
dissolution and/or stability of OZ in the gastrointestinal tract, and particularly as CD
itself also exhibits anticryptosporidial activity. While the OZ plasma concentrations

CHAPTER 8 __________________________________________________________________________________________________________
231
were in excess of the IC50 for OZ against P. chabaudi in vitro, the in vivo efficacy of the
OZ/ΗPβCD complex was also not evaluated against malaria, as the pH-modified
OZ/ΗPβCD formulation was not suitable for high, multiple i.p. doses.
Ultimately the OZ/ΗPβCD complex did not improve the bioavailability of OZ, or its
efficacy against the protozoan parasites Giardia, Cryptosporidium or malaria. Therefore
alternative means to improve TF and OZ bioavailability still need to be investigated.
Given their poor absorption and rapid metabolism within the gastrointestinal tract, it is
likely that such a formulation would need to be administered parenterally. In addition,
the alternative formulation would need to be able to compensate for the fact that the
dinitroanilines are strongly tissue bound. Such methods may involve the formation and
formulation of prodrugs, or even the use of liposomes to modify drug absorption or
metabolism, and to specifically direct large quantities of drug to the sites of parasitic
infection.
8.4. THE ROLE OF CYCLODEXTRINS
In biological systems CDs exhibit a lack of selectivity and may rapidly exchange guest
molecules (Pitha, 1990), thus making it necessary to evaluate the impact CD has on
tissue components. HPβCD was found to be cytotoxic to human carcinoma cells at
greater than 2.5% (Chapter 4), and to inhibit Giardia both in vitro and in vivo at greater
than 1% and 2% respectively (Chapter 5). In addition, a 2.5 % suspension of β-CD
reduced oocyst viability in vitro, and had both preventative and curative effects against
C. parvum in vivo (Castro-Hermida et al., 2000) (Chapter 6). The effect of HPβCD in
these systems is most probably due to membrane disruption caused by the dissolution
and removal of membrane components (Irie et al., 1982; Ohtani et al., 1989; Bar, 1994;
Irwin et al., 1994). This effect is likely to be reversible, depending on the capacity for
the cells to replace lost membrane components following the removal of CD (Pitha,
1992). Thus, when evaluating drug/CD complexes in vitro, it is important to consider
the CD concentration, as high concentrations can cause cell damage and even
haemolysis.

CHAPTER 8 __________________________________________________________________________________________________________
232
Following oral administration of CD the viability of both Giardia (Chapter 5) and C.
parvum were effected in vivo (Castro-Hermida et al., 2000; 2001; 2002). This most
likely resulted from the high concentration of CD in the gastrointestinal tract, leading to
the extraction of membrane components as observed in in vitro systems. Under normal
conditions the oral consumption of up to 5% ΗPβCD solutions by rats had minimal
impact on the animals (Section 4.3.2), but similar doses in Giardia infected animals
resulted in very soft stool or diarrhoea (Section 5.4.1.2). Previous research has found
that the removal of mucin from the surface of the intestine enhances the effects of CD
on the mucosal membrane (Nakanishu et al., 1990; 1994). Mucin adheres to the luminal
surface of the gastrointestinal tract as a gel or high viscosity solution, thus disturbing the
direct interaction of CD with membrane lipids of the mucosal membrane. Therefore
under normal conditions, CD has a limited impact on gastrointestinal cells due to the
mucin layer. Both Giardia and C. parvum infect the gastrointestinal tract of the host,
resulting in a broad spectrum of intestinal abnormalities that ultimately disturbs the
intestinal absorptive function and compromises the nutritional status of the host
(Farthing, 1986; Katelaris & Farthing, 1992; Armson et al., 2002). Thus parasitic
infections are likely to disturb this protective mucin layer, allowing a direct interaction
between CD and the mucosal membrane. Therefore under parasitised conditions the
detrimental effect of CD on mucosal cells would be more pronounced (i.e. the diarrhoea
observed in Giardia infected animals).
Unlike Giardia and C. parvum, in vitro cultivated P. chabaudi grew better in the
presence of ΗPβCD, with no detrimental effect observed at up to 8% ΗPβCD. The
improved growth was thought to result from the increased solubilization, and hence
bioavailability of a necessary component, or the complexation and removal of an
inhibitory compound from the cultivation medium. However, given the affect of
ΗPβCD on human carcinoma cells, Giardia and C. parvum, it was surprising to find
that even high concentrations of ΗPβCD had no detrimental effects on the parasite.
This was attributed to the presence of whole blood in the cultivation medium, as plasma
reduces the haemolytic effect of HPβCD by providing a source of complexable
compounds (Garay et al., 1994). This resulted in greater competition for the cavity of
HPβCD, therefore reducing its impact on membrane components. In comparison, orally
administered CD would have limited impact on systemic parasites, as minimal amounts

CHAPTER 8 __________________________________________________________________________________________________________
233
of orally administered CD are absorbed intact (Gerlóczy et al., 1990; Frijlink et al.,
1990; Monbaliu et al., 1990). Parenterally administered CD would also have limited
impact on systemic parasitic infections due to decreased CD concentration (unless
administered directly to site of infection), to the rapid equilibrium reached between CD
and endogenous lipophils (Pitha, 1992; Garay et al., 1994), and to the rapid elimination
of CD from the blood stream (Anderson et al., 1990; Frijlink et al., 1990; Monbaliu et
al., 1990) (Section 3.4.2.2).
Given the antigiardial and anticryptosporidial effects of CD both in vitro and in vivo,
CD could potentially play a role in the treatment of these parasites. In addition, CD
complexation of antiparasitic drugs and additions of excess CD may result in a
synergistic increase in efficacy. This may result from the increased drug dissolution of
the drug/CD complex, the excess CD limiting drug absorption from the gastrointestinal
tract, and the antiparasitic activity of CD itself. However further studies would need to
be carried out to investigate the effect CD against a greater range of cells as well as
determining whether CD is static or cidal against these parasites. CD has been used to
improve the cultivation of a number of organisms in vitro (Section 7.4.1). CD was also
found to improve the cultivation of P. chabaudi, although more research would be
required to determine the exact effects of CD as well as formulating an ideal culture
medium. Therefore these results may help in the development of in vitro rodent malaria
models, thus complimenting the current in vivo rodent malaria models. In addition,
these results open the door to alternative cultivation techniques for the vast array of
parasites that cannot currently be cultivated in vitro.
8.5. CONCLUSION
While CDs have a wide range of applications, in the pharmaceutical industry they have
predominantly been used to increase the aqueous solubility of poorly water-soluble
drugs, with the view of improving drug dissolution and hence systemic bioavailability
(Section 1.7.2). In the present study the tubulin inhibitors ABZ, TF and OZ were
complexed with ΗPβCD, and their potential usefulness against the protozoan parasites
Giardia, Cryptosporidium and Plasmodium was evaluated. Complexation did not affect
drug cytotoxicity, and in pharmacokinetic studies complexation improved ABZ (and

CHAPTER 8 __________________________________________________________________________________________________________
234
metabolites) bioavailability, but had no significant affect on OZ bioavailability. In
addition, the antiprotozoal activity of the tubulin inhibitors was not improved following
complexation with ΗPβCD. However, this does not mean that the complexation of
these compounds with CD will not increase their efficacy against other parasitic
organisms. Here improved bioavailability of ABZ and its metabolites was observed
following oral administration of the ABZ/ΗPβCD complex. Therefore, while it is
unlikely that ABZ efficacy would be improved against intestinal protozoan parasites,
the improved bioavailability indicates potential against susceptible systemic parasitic
infections. This has recently been demonstrated, with CD complexation improving the
anthelmintic activity of ABZ against T. spiralis (García-Rodriguez et al., 2001). In
comparison, complexation of OZ with CD is unlikely to be of any benefit against
systemic infections, as it did not improve OZ bioavailability. CD complexation has also
been used to increase drug stability and decrease drug degradation (Section 1.3.2).
Therefore, as OZ is rapidly metabolised within the gut, its efficacy against intestinal
parasites may be improved if complexation with CD reduces its gastrointestinal
degradation. However, further research into the degradation of the OZ/ΗPβCD
complex is required.
Orally administered CD was found to inhibit both Giardia (Chapter 5) and
Cryptosporidium (Castro-Hermida et al., 2000; 2001; 2002) in vivo. This was attributed
to parasite membrane disruption caused by the dissolution and removal of membrane
components when exposed to high concentrations of CD within the gastrointestinal
tract. Therefore the antiparasitic activity of CD alone should be investigated further,
particularly against intestinal infections. However, these investigations also need to
assess the effect of high CD concentrations on intestinal epithelial cells. In comparison,
ΗPβCD alone improved the in vitro growth of malaria. This was attributed to either the
increased solubilization of a necessary media component, or the complexation and
removal of an inhibitory compound from the cultivation medium. While in vitro drug
screening methods against rodent malaria have been developed, the in vitro cultivation
of the rodent malarias in continuous culture has been more difficult (Section 7.1.3).
Therefore the improved in vitro cultivation of P. chabaudi in the presence of CD
presents a promising approach to its potential long-term cultivation. Given the results
of the current study, it is unlikely that either ABZ or OZ in their current formulations

CHAPTER 8 __________________________________________________________________________________________________________
235
(either alone or complexed) will ever be used as clinical antimalarials. However, this
should not preclude further investigations into other microtubule antagonists. One
significant advantage of an in vitro rodent malaria model would be the mass cultivation
of parasite material for molecular studies, particularly detailed analysis of malarial
microtubule proteins. Such studies would allow the characterisation of drug binding
sites on malaria tubulin, thus facilitating the development of microtubule antagonists as
antimalarials.
One major limitation of the current research was the requirement for large amounts of
CD to solubilize small amounts of drug. Therefore the impact of high in vivo doses of
CD needed to be carefully monitored. This also limits the choice of CDs available,
particularly with different modes of administration. In addition, ΗPβCD alone was not
sufficient to achieve adequate drug concentrations, so temperature and pH were also
manipulated in order to increase drug concentrations. However, these manipulations
limited the flexibility of the formulations, with small changes in temperature and pH
resulting in precipitation of the drug, particularly for the OZ/ΗPβCD complex. In
addition, the necessity for extreme pH values meant that the OZ/ΗPβCD formulation
could not be administered parenterally. Therefore future work in this area should
include investigations into the feasibility of alternative CDs as well as alternative
techniques to increase drug solubility in combination with CD (discussed above).

CHAPTER 9 __________________________________________________________________________________________________________
236
CHAPTER 9. REFERENCES
CHAPTER 9 __________________________________________________________________________________________________________
237
Acha, P. N., and Szyfres, B. (1987) Zoonoses and communicable diseases common to
man and animals, pp 612-616. Pan American Health Organization, Washington.
Adam, R. D. (1991) The Biology of Giardia spp. Microbiological Reviews. 55(4): 706-
732.
Adam, R. D. (2001) Biology of Giardia lamblia. Clinical Microbiological Reviews.
14(3): 447-475.
Ager, A. L. (1984) Rodent malaria models. Handbook of Experimental Pharmacology.
Vol. 68, pp 225-264. Springer-Verlag, Berlin.
Al-Waili, N. S., Al-Waili, B. H., and Saloom, K. Y. (1988) Therapeutic use of
mebendazole in giardial infections. Transactions of the Royal Society of Tropical
Medicine and Hygiene. 82: 438.
Ampofo, E., Fox, E. G., and Shaw, C. P. (1991) Giardia and Giardiasis in New
Zealand. A review, Department of Health, Wellington.
Anderson, W. R., Brewster, M. E., Simpkins, J. W., and Bodor, N. (1990) Tissue
distribution of radiolabeled 2-hydroxypropyl-ß-cyclodextrin in the rat. Pharmaceutical
Research. 7(9): S-226.
Antenucci, R. N., and Palmer, J. K. (1984) Enzymatic degradation of α- and ß-
cyclodextrins by bacteroides of the human colon. Journal of Agricultural Food and
Chemistry. 32: 1316-1321.
Anthony, R. G., and Hussey, P. J. (1999) Dinitroaniline herbicide resistance and the
microtubule cytoskeleton. Trends in Plant Science. 4(3): 112-116.
Anthony, R. G., Waldin, T. R., Ray, J. A., Bright, S. W. J., and Hussey, P. J. (1998)
Herbicide resistance caused by spontaneous mutation of the cytoskeletal protein tubulin.
Nature. 393: 260-263.
CHAPTER 9 __________________________________________________________________________________________________________
238
Antlsperger, G., and Schmid, G. (1996) Toxicological comparison of cyclodextrins.
Proceedings of the Eighth International Symposium on Cyclodextrins. (Szejtli, J., and
Szente, L., Eds.), pp 149-154. Kluwer Academic Publishers, Budapest, Hungary.
Arimori, K., and Uekama, K. (1987) Effects of β- and γ-cyclodextrins on the
pharmocokinetic behaviour of prednisolone after intravenous and intramuscular
administrations to rabbits. Journal of Pharmacobio-Dynamics. 10: 390-395.
Armson, A., Meloni, B. P., Reynoldson, J. A., and Thompson, R. C. A. (1999a)
Assessment of drugs against Cryptosporidium parvum using a simple in vitro screening
method. FEMS Microbiology Letters. 178: 227-233.
Armson, A., Menon, K. I., O'Hara, A., MacDonald, L. M., Read, C., Thompson, R. C.
A., and Reynoldson, J. A. (2002) Efficacy of oryzalin and associated histological
changes in Cryptosporidium infected neonatal rats. Parasitology. in press.
Armson, A., Sargent, K., MacDonald, L. M., Finn, M. P., Thompson, R. C. A., and
Reynoldson, J. A. (1999b) A comparison of the in vitro and in vivo effects of two
dinitroanilines against Cryptosporidium parvum in neonatal mice and rats. FEMS
Immunology and Medical Microbiology. 26(2): 109-113.
Arrowood, M. J., Mead, J. R., Xie, L., and You, X. (1996) In vitro anticryptosporidial
activity of dinitroaniline herbicides. FEMS Microbiology Letters. 136(3): 245-249.
Auret, B. J., Boyd, D. R., and Henbest, H. B. (1968) Stereoselectivity in the oxidation
of sulphoxides ot sulphones in the presence of Aspergillus niger. Journal of the
Chemical Society. C: 2374-2376.
Backensfeld, T., Müller, B. W., Wiese, M., and Seydel, J. K. (1990) Effect of
cyclodextrin derivatives on indomethacin stability in aqueous solution. Pharmaceutical
Research. 7(5): 484-490.

CHAPTER 9 __________________________________________________________________________________________________________
239
Bajer, A. S., and Molè-Bajer, J. (1986) Drugs with colchicine-like effects that
specifically disassemble plant but not animal microtubules. Annals New York Academy
of Sciences: 767-784.
Bar, R. (1990) A new cyclodextrin-agar medium for surface cultivation of microbes on
lipophilic substrates. Applied Microbiology and Biotechnology. 32(4): 470-472.
Bar, R. (1994) Interactions between cyclodextrins and microbial cells. Proceedings of
the Seventh International Cyclodextrins Symposium, pp 27-32. Business Centre for
Academic Societies, Tokyo, Japan.
Bar, R. (1996) Application of cyclodextrins in biotechnology. Proceedings of the Eighth
International Symposium on Cyclodextrins. (Szejtli, J., and Szente, L., Eds.), pp 521-
526. Kluwer Academic Publishers, Budapest, Hungary.
Barger, I. A., Steel, J. W., and Rodden, B. R. (1992) Effects of controlled-release
albendazole capsule on parasitism and production from grazing Merino ewes and lambs.
Australian Veterinary Journal. 70(2): 41-48.
Bartels, P. G., and Hilton, J. L. (1973) Comparison of trifluralin, oryzalin, pronamide,
propham and colchicine treatments on microtubules. Pesticide Biochemistry and
Physiology. 3: 462-472.
Bassani, V. L., Krieger, D., Duchêne, D., and Wouessidjewe, D. (1996) Enhanced
water-solubility of albendazole by hydroxypropyl-ß-cyclodextrin. Proceedings of the
Eighth International Symposium on Cyclodextrins. (Szejtli, J., and Szente, L., Eds.), pp
321-324. Kluwer Academic Publishers, Budapest, Hungary.
Becker, W. M., and Deamer, D. W. (1991) The World of the Cell, 2nd ed., Te
Benjamin/Cummings Publishing Company, Inc., Sydney.

CHAPTER 9 __________________________________________________________________________________________________________
240
Behm, C. A., and Bryant, C. (1985) The modes of action of some anthelmintics.
Resistance in Nematodes to Anthelmintic Drugs. (Anderson, N., and Waller, P., Eds.),
pp 57-66. CSIRO Australia.
Bekers, O., Beijnen, J. H., Groot Bramel, E. H., Otagiri, M., Bult, A., and Underberg,
W. J. M. (1989) Stabilization of mitomycins on complexation with cyclodextrins in
aqueous acidic media. International Journal of Pharmaceutics. 52: 239-248.
Bell, A. (1998) Microtubule inhibitors as potential antimalarial agents. Parasitology
Today. 14(6): 234-240.
Bellringer, M. E., Smith, T. G., Read, R., Gopinath, C., and Oliver, P. (1995) ß-
cyclodextrin: 52-week toxicity studies in the rat and dog. Food and Chemical
Toxicology. 33(5): 367-376.
Bemrick, W. J., and Erlandsen, S. L. (1988) Giardiasis-is it really a zoonosis?
Parasitology Today. 4(3): 69-71.
Benbow, J. W., Bernberg, E. L., Korda, A., and Mead, J. R. (1998) Synthesis and
evaluation of dinitroanilines for treatment of Cryptosporidiosis. Antimicrobial Agents
and Chemotherapy. 42(2): 339-343.
Bertram, M. A., Meyer, E. A., Anderson, D. L., and Jones, C. T. (1984) A
morphometric comparison of five axenic Giardia isolates. The Journal of Parasitology.
70(4): 530-535.
Blanco, J., Vila-Jato, J. L., Otero, F., and Anguiano, S. (1991) Influence of method of
preparation on inclusion complexes of naproxen with different cyclodextrins. Drug
Development and Industrial Pharmacy. 17(7): 943-957.
Bogan, J. A., and Marriner, S. E. (1984) Pharmacodynamic and toxicological aspects of
albendazole in man and animals. Royal Society of Medicine International Congress and
Symposium. 61: 13-21.

CHAPTER 9 __________________________________________________________________________________________________________
241
Boreham, P. F. L., Phillips, R. E., and Shepherd, R. W. (1984) The sensitivity of
Giardia intestinalis to drugs in vitro. Journal of Antimicrobial Chemotherapy. 14: 449-
461.
Boreham, P. F. L., Phillips, R. E., and Shepherd, R. W. (1985) A comparison of the in-
vitro activity of some 5-nitroimidazoles and other compounds against Giardia
intestinalis. Journal of Antimicrobial Chemotherapy. 16: 586-595.
Brewster, M. E. (1992) Parenteral Safety and applications of 2-hydroxypropyl ß-
cyclodextrin. New trends in cyclodextrins and derivatives. (Duchêne, D., Ed.), pp 313-
350. Editions de Santé, Paris, France.
Brewster, M. E., Anderson, W. R., Loftsson, T., Huang, M. J., Bodor, N., and Pop, E.
(1995) Preparation, characterization, and anesthetic properties of 2-hydroxypropyl-ß-
cyclodextrin complexes of pregnanolone and pregnanolone in rat and mouse. Journal of
Pharmaceutical Sciences. 84(10): 1154-1159.
Brewster, M. E., and Bodor, N. (1990) Parenteral safety and uses of 2-hydroxypropyl ß-
cyclodextrin. Minutes of the Fifth International Symposium on cyclodextrins. (Duchêne,
D., Ed.), pp 525-534. Editions de Santé, Paris, France.
Brewster, M. E., Estes, K. S., and Bodor, N. (1990) An intravenous toxicity study of 2-
hydroxypropyl-ß-cyclodextrin, a useful drug solubilizer, in rats and monkeys.
International Journal of Pharmaceutics. 59: 231-243.
Brewster, M. E., Simpkins, J. W., Singh Hora, M., Stern, W. C., and Bodor, N. (1989)
The potential use of cyclodextrins in parenteral formulations. Journal of Parenteral
Science and Technology. 43(5): 231-240.
Budavari, S. (1989) The Merck Index, . Merck and Co., Inc., Rahway, N.J., U.S.A.
CHAPTER 9 __________________________________________________________________________________________________________
242
Buret, A., Gall, D. G., and Olson, M. E. (1991) Growth, activities of enzymes in the
small intestine, and ultrastructure of microvillous border in gerbils infected with
Giardia duodenalis. Parasitology Research. 77: 109-114.
Buvári-Barcza, Á., Kajtár, J., and Barcva, L. (1996) Hydroxypropyl cyclodextrin
complexes: relationships between the substitution pattern, stability constants and
circular dichroism spectra. Proceedings of the Eighth International Symposium on
Cyclodextrins. (Szejtli, J., and Szente, L., Eds.), pp 245-249. Kluwer Academic
Publishers, Budapest, Hungary.
Byrd, R. A., Markham, J. K., and Emmerson, J. L. (1995) Developmental toxicity of
dinitroaniline herbicides in rats and rabbits I. Trifluralin. Fundamental and Applied
Toxicology. 26: 181-190.
Cacciò, S., Rosa, G. L., and Pozio, E. (1997) The β-tubulin gene of Cryptosporidium
parvum. Molecular and Biochemical Parasitology. 89: 307-311.
Campbell, W. C. (1990) Benzimidazoles: veterinary uses. Parasitology Today. 6(4):
130-133.
Carpenter, T. O., Pettifor, J. M., Russell, R. M., Pitha, J., Mobarthan, S., Ossip, M. S.,
Wainer, S., and Anast, C. S. (1987) Severe hypervitaminosis A in siblings: Evidence of
variable tolerance to retinol intake. The Journal of Pediatrics. 111(4): 507-512.
Carrazana García, J., Al Soufí, W., Nova Rodríguez, M., and Vázquez Tato, J. (1998)
Influence of pH on the stability of the inclusion complex of methyl orange and ß-
cyclodextrin. Proceedings of the Ninth International Symposium on Cyclodextrins.
(Labandeira, J. J. T., and Vila-Jato, J. L., Eds.), pp 179-182. Kluwer Academic
Publishers, Santiago de Compostela, Spain.
Carter, R., and Diggs, C. L. (1977) Plasmodia of rodents. Parasitic Protozoa. (Kreier, J.
P., Ed.). Vol. III, pp 359-465. Academic Press, New York.
CHAPTER 9 __________________________________________________________________________________________________________
243
Castillo, J. A., Palomo-Canales, J., Garcia, J. J., Lastres, J. L., Bolás, F., and Torrado, J.
J. (1999) Preparation and characterisation of albendazole ß-cyclodextrin complexes.
Drug Development and Industrial Pharmacy. 25(12): 1241-1248.
Castro-Hermida, J. A., Freire-Santos, F., Oteiza-López, Á. M., and Ares-Mazás, E.
(2000) Unexpected activity of ß-cyclodextrin against experimental infection by
Cryptosporidium parvum. Journal of Parasitology. 86(5): 1118-1120.
Castro-Hermida, J. A., González-Losada, J., Freire-Santos, F., González-Warleta, M.,
Mezo-Menéndez, M., and Ares-Mazás, E. (2002) Efficacy of ß-cyclodextrin against
experimental cryptosporidiosis in neonatal lambs. Journal of Parasitology. 88(1): 185-
187.
Castro-Hermida, J. A., González-Losada, J., Freire-Santos, F., Mezo-Menéndez, M.,
and Ares-Mazás, E. (2001) Evaluation of β-cyclodextrin against natural infections of
cryptosporidiosis in calves. Veterinary Parasitology. 101: 85-89.
Cedillo-Rivera, R., and Muñoz, O. (1992) In-vitro susceptibility of Giardia lamblia to
albendazole, mebendazole and other chemotherapeutic agents. Journal of Medical
Microbiology. 37: 221-224.
Centers for Disease Control and Prevention (2001a) Cryptosporidiosis (Online),
Available World Wide Web:
http://www.dpd.cdc.gov/dpdx/HTML/cryptosporidiosis.htm (accessed 25/10/2001).
Centers for Disease Control and Prevention (2001b) Giardiasis (Online), Available
World Wide Web: http://www.dpd.cdc.gov/dpdx/html/Giardiasis.htm (accessed
25/10/2001).
Centers for Disease Control and Prevention (2001c) Malaria (Online), Available World
Wide Web: http://www.dpd.cdc.gov/dpdx/HTML/Malaria.htm (accessed 25/10/2001).
CHAPTER 9 __________________________________________________________________________________________________________
244
Chan, M. M.-Y., Grogl, M., Chen, C.-C., Bienen, E. J., and Fong, D. (1993a)
Herbicides to curd human parasitic infections: in vitro and in vivo effects of trifluralin
on the trypanosomatid protozoans. Proceedings of the National Academy of Science
USA. 90: 5657-5661.
Chan, M. M.-Y., Tzeng, J., Emge, T. J., Ho, C.-T., and Fong, D. (1993b) Structure-
function analysis of antimicrotubule dinitroanilines against promastigotes of the
parasitic protozoan Leishmania mexicana. Antimicrobial Agents and Chemotherapy.
37(9): 1909-1913.
Cho, M. J., Chen, F. J., and Huczek, D. L. (1995) Effects of inclusion complexation on
the transepithelial transport of a lipophilic substance in vitro. Pharmaceutical Research.
12(4): 560-564.
Chun, I. K., and Park, I. S. (1993) Solubilization and dissolution enhancement of
benzimidazole anthelmintic drugs by cyclodextrin complexation. Yakhak Hoeji. 37(3):
216-227.
Connors, K. A. (1995) Population characteristics of cyclodextrin complex stabilities in
aqueous solution. Journal of Pharmaceutical Sciences. 84(7): 843-848.
Connors, K. A. (1997) The stability of cyclodextrin complexes in solution. Chemical
Reviews. 97: 1325-1357.
Connors, K. A., Lin, S.-F., and Wong, A. B. (1982) Potentiometric study of molecular
complexes of weak acids and bases applied to complexes of α-cyclodextrin with para-
substituted benzoic acids. Journal of Pharmaceutical Sciences. 71(2): 217-222.
Cook, G. C. (1990) Use of benzimidazole chemotherapy in human helminthiasis:
indications and efficacy. Parasitology Today. 6(4): 133-136.
Coombs, G. H., and Gutteridge, W. E. (1975) Growth in vitro and metabolism of
Plasmodium vinckei chabaudi. Journal of Protozoology. 22(4): 555-560.

CHAPTER 9 __________________________________________________________________________________________________________
245
Coussement, W., van Cauteren, H., Vandenberghe, J., Vanparys, P., Teuns, G., Lampo,
A., and Marsboon, R. (1990) Toxicology profile of hydroxypropyl ß-cyclodextrin (HP
ß-CD) in laboratory animals. Minutes of the Fifth International Symposium on
cyclodextrins. (Duchêne, D., Ed.), pp 522-524. Editions de Santé, Paris, France.
Craft, J. C., Holt, E. A., and Tan, S. H. (1987) Malabsorption of oral antibiotics in
humans and rats with giardiasis. Pediatr Infect Dis J. 6(9): 832-836.
Craft, J. C. (1982) Experimental infection with Giardia lamblia in rats. The Journal of
Infectious Diseases. 145(4): 495-498.
Crossley, R., and Holberton, D. V. (1983) Characterization of proteins from the
cytoskeleton of Giardia lamblia. Journal of Cell Science. 59: 81-103.
Crouch, A. A., Seow, W. K., and Thong, Y. H. (1986) Effect of twenty-three
chemotherapeutic agents on the adherence and growth of Giardia lamblia in vitro.
Transactions of the Royal Society of Tropical Medicine and Hygiene. 80: 893-896.
Current, W. L., and Blagburn, B. L. (1990) Cryptosporidium: infections in man and
domesticated animals. Coccidiosis of man and domesticated animals. (Long, P. L., Ed.),
pp 155-185. CRC Press, Inc., Boca Raton, Fla.
Current, W. L., and Garcia, L. S. (1991) Cryptosporidiosis. Clinical Microbiological
Reviews. 4(3): 325-358.
da Silveira, A. M., Ponchel, G., Puisieux, F., and Duchêne, D. (1998) Combined
poly(isobutylcyanoacrylate) and cyclodextrins nanoparticles for enhancing the
encapsulation of lipophylic drugs. Pharmaceutical Research. 15(7): 1051-1055.
Davidson, R. A. (1984) Issues in clinical parasitology: The treatment of Giardiasis. The
American Journal of Gastroenterology. 79(4): 256-261.

CHAPTER 9 __________________________________________________________________________________________________________
246
Davis, A., Pawlowski, Z. S., and Dixon, H. (1986) Multicentre clinical trials of
benzimidazolecarbamates in human echinococcosis. Bulletin of the World Health
Organization. 64(3): 383-388.
de Silva, N., Guyatt, H., and Bundy, D. (1997) Anthelmintics. A comparative review of
their clinical pharmacology. Drugs. 53(5): 769-788.
Decker, O. D., and Johnson, W. S. (1976) Oryzalin. Analytical methods for pesticides
and plant growth regulators. (Zweig, G., and Sharma, J., Eds.), pp 433-442. Academic
press, New York.
del Estal, J. L., Alvarez, A. I., Villaverde, C., and Prieto, J. G. (1993) Comparative
effects of anionic, natural bile acid surfactants and mixed micelles on the intestinal
absorption of the anthelmintic albendazole. International Journal of Pharmaceutics. 91:
105-109.
Delatour, P., Benoit, E., Besse, S., and Boukraa, A. (1991) Comparative
enantioselectivity in the sulphoxidation of albendazole in man, dogs and rats.
Xenobiotica. 21(2): 217-221.
Delatour, P., Benoit, E., Caude, M., and Tambute, A. (1990) Species differences in the
generation of the chiral sulphoxide metabolite of albendazole in sheep and rats.
Chirality. 2: 156-160.
Delatour, P., and Parish, R. C. (1986) Benzimidazole anthelmintics and related
compounds: toxicity and evaluation of residues. Drug Residues in Animals. (Rico, A.
G., Ed.), pp 175-204. Academic Press, Orlando.
Delatour, P., Parish, R. C., and Gyurik, R. J. (1981) Albendazole: A comparison of
relay embryotoxicity with embryotoxicity of individual metabolites. Annales de
Recherches Vétérinaires. 12: 159-167.

CHAPTER 9 __________________________________________________________________________________________________________
247
Desore, J. A., and Beauchamp, G. K. (1987) Longitudinal changes in sweet preferences
in humans. Physiology and Behavior. 39: 639-641.
Desore, J. A., Maller, O., and Turner, R. E. (1973) Taste in acceptance of sugars by
human infants. Journal of Comparative and Physiological Psychology. 84(496-501).
Dieckmann-Schuppert, A., and Franklin, R. M. (1990) Mode of action of tubulozoles
against Plasmodium falciparum in vitro. Antimicrobial Agents and Chemotherapy. 34:
1529-1534.
Dietzel, K., Estes, K. S., Brewster, M. E., Bodor, N., and Derendorf, H. (1990) The use
of 2-hydroxypropyl-ß-cyclodextrin as a vehicle for intravenous administration of
dexamethasone in dogs. International Journal of Pharmaceutics. 59: 225-230.
Domínguez, L., Savio, E., Saldaña, J., Malanga, A., Quevedo, D., Camarote, C., Ochoa,
A., and Fagiolino, P. (1998) Lipid matrix of albendazole sulphoxide: is it a an
alternative for systemic infections? Bollettino Chimico Farmaceutico. 137(10): 383-
349.
Dordunoo, S. K., and Burt, H. M. (1996) Solubility and stability of taxol: effects of
buffers and cyclodextrins. International Journal of Pharmaceutics. 133: 191-201.
Dow, G. S. (2000) Development and application of a rat malaria model to investigate
the pharmacology of microtubule antagonists as antimalarials. PhD Thesis. Division of
Veterinary and Biomedical Sciences. Murdoch University, Perth, Western Australia.
Dow, G. S., O'Hara, A., Newton, S. C., Reynoldson, J. A., and Thompson, R. C. A.
(2000) Plasmodium berghei: the antimalarial activity of albendazole in rats is mediated
via effects on the hematopoietic system. Experimental Parasitology. 94(4): 259-263.
Dow, G. S., Reynoldson, J. A., and Thompson, R. C. A. (1998) Plasmodium berghei: In
vivo efficacy of albendazole in different malarial models. Experimental Parasitology.
88: 154-456.

CHAPTER 9 __________________________________________________________________________________________________________
248
Dow, G. S., Reynoldson, J. A., and Thompson, R. C. A. (1999) Plasmodium berghei: a
new rat model for assessment of blood schizonticidal activity. Experimental
Parasitology. 93: 92-94.
Dubey, J. P., Speer, C. A., and Fayer, R. (1990) General biology of Cryptosporidium.
Coccidiosis of man and domesticated animals. (Long, P. L., Ed.), pp 1-29. CRC Press,
Inc., Boca Raton, Fla.
Duchêne, D., Glomot, F., and Vaution, C. (1987) Pharmaceutical applications of
cyclodextrins. Cyclodextrins and their Industrial Uses. (Duchêne, D., Ed.), pp 211-257.
Editions de Santé, Paris, France.
Duchêne, D., Vaution, C., and Glomot, F. (1986) Cyclodextrins, their value in
pharmaceutical technology. Drug Development and Industrial Pharmacy. 12(11-13):
2193-2215.
Duchêne, D., and Wouessidjewe, D. (1990a) Pharmaceutical uses of cyclodextrins and
derivatives. Drug Development and Industrial Pharmacy. 16(17): 2487-2499.
Duchêne, D., and Wouessidjewe, D. (1990b) Physicochemical characteristics and
pharmaceutical uses of cyclodextrin derivatives, part II. Pharmaceutical Technology.
August: 22-30.
Dvorakova, K., Dorr, R. T., Gallegos, A., McClure, T., and Powis, G. (1997)
Pharmacokinetic studies of the herbicide and antitumor compound oryzalin in mice.
Journal of Chromatography B. 696: 275-281.
Ebert, E., Leist, K.-H., Hack, R., and Ehling, G. (1992) Toxicology and hazard potential
of trifluralin. Food and Chemical Toxicology. 30(12): 1031-1044.

CHAPTER 9 __________________________________________________________________________________________________________
249
Edlind, T. D. (1989a) Susceptibility of Giardia lamblia to aminoglycoside protein
synthesis inhibitors: correlation with rRNA structure. Antimicrobial Agents and
Chemotherapy. 33(4): 484-488.
Edlind, T. D. (1989b) Tetracyclines as antiparasitic agents: lipophilic derivatives are
highly active against Giardia lamblia in vitro. Antimicrobial Agents and Chemotherapy.
33(12): 2144-2145.
Edlind, T. D., Hang, T. L., and Chakraborty, P. R. (1990) Activity of the anthelmintic
benzimidazoles against Giardia lamblia in vitro. Journal of Infectious Diseases. 162:
1408-1411.
Edlind, T. D., Visvesvara, G. S., Li, J., and Katiyar, S. K. (1994) Cryptosporidium and
microsporidial β-tubulin sequences: predictions of benzimidazole sensitivity and
phylogeny. Journal of Eukaryote Microbiology. 41(5): 38S.
Eichinger, D. (2001) Encystation in parasitic protozoa. Curr. Opin. Microbiol. 4(4):
421-426.
Emmerson, J. L., and Anderson, R. C. (1966) Metabolism of trifluralin in the rat and
dog. Toxicology and Applied Pharmacology. 9: 84-97.
Enriquez, C., Nwachuku, N., and Gerba, C. P. (2001) Direct exposure to animal enteric
pathogens. Rev. Environ. Health. 16(2): 117-131.
Erkog, F. U., and Menzer, R. E. (1985) Metabolism of trifluralin in rats. Journal of
Agricultural Food and Chemistry. 33(6): 1061-1070.
Esclusa-Díaz, M. T., Pérez-Marcos, M. B., Vila-Jato, J. L., and Torres-Labandeira, J. J.
(1996) Improvement in the dissolution properties of ketoconazole through
multicomponent ß-cyclodextrin complexation. Proceedings of the Eighth International
Symposium on Cyclodextrins. (Szejtli, J., and Szente, L., Eds.), pp 305-308. Kluwer
Academic Publishers, Budapest, Hungary.

CHAPTER 9 __________________________________________________________________________________________________________
250
Evrard, B., Chiap, P., Piel, G., van Hees, T., Ghalmi, F., Losson, B., and Delattre, L.
(1998) Influence of cyclodextrins on the solubility and the pharmacokinetics of
albendazole. Proceedings of the Ninth International Symposium on Cyclodextrins.
(Labandeira, J. J. T., and Vila-Jato, J. L., Eds.), pp 223-226. Kluwer Academic
Publishers, Santiago de Compostela, Spain.
Farthing, M. J. G. (1986) Interaction of parasitic diseases and nutrition: clinical impact
of Giardiasis. Pont. Acad. Scient. Script. Var. (Chagas, C., and Keusch, G. T., Eds.), pp
185-202.
Farthing, M. J. G. (1993) Diarrhoeal disease: current concepts and future challenges.
Transactions of the Royal Society of Tropical Medicine and Hygiene. 87(3): 17-21.
Faubert, G. M. (1988) Evidence that Giardiasis is a zoonosis. Parasitology Today. 4(3):
66-71.
Fayer, R., and Fetterer, R. (1995) Activity of benzimidazoles against Cryptosporidiosis
in neonatal BALB/c mice. Journal of Parasitology. 81(5): 794-795.
Feely, D. E., Holberton, D. V., and Erlandsen, S. L. (1990) The Biology of Giardia.
Giardiasis. (Meyer, E. A., Ed.), pp 11-49. Elsevier Science Publishers B.V.
Feely, D. E., Schollmeyer, J. V., and Erlandsen, S. L. (1982) Giardia spp.: distribution
of contractile proteins in the attachment protein. Experimental Parasitology. 53: 145-
154.
Fernández, F. J., Rodríguez-Vidigal, F. F., Ledesma, V., Cabanillas, Y., and Vagace, J.
M. (1996) Aplastic anemia during treatment with albendazole. American Journal of
Haematology. 53: 53-54.
Frank, D. W., Gray, E. J., and Weaver, R. N. (1976) Cyclodextrin nephrosis in the rat.
American Journal of Pathology. 83(2): 367-374.

CHAPTER 9 __________________________________________________________________________________________________________
251
Fridrich, R., Mehnert, W., and Frömming, K.-H. (1990) Studies of the inclusion
compound between ß-cyclodextrin and cholesterol. Minutes of the Fifth International
Symposium on cyclodextrins. (Duchêne, D., Ed.), pp 299-302. Editions de Santé, Paris,
France.
Frijlink, H. W., Eissens, A. C., Hefting, N. R., Poelstra, K., Lerk, C. F., and Meijer, D.
K. F. (1991a) The effect of parentally administered cyclodextrins on cholesterol levels
in the rat. Pharmaceutical Research. 8(1): 9-16.
Frijlink, H. W., Franssen, E. J. F., Eissens, A. C., Oosting, R., Lerk, C. F., and Meijer,
D. K. F. (1991b) The effects of cyclodextrins on the disposition of intravenously
injected drugs in the rat. Pharmaceutical Research. 8(3): 380-385.
Frijlink, H. W., Visser, J., Hefting, N. R., Oosting, R., Meijer, D. K. F., and Lerk, C. F.
(1990) The pharmacokinetics of ß-cyclodextrin and hydroxypropyl-ß-cyclodextrin in
the rat. Pharmaceutical Research. 7(12): 1248-1252.
Frohlich, B. T., d'Alarcao, M., Feldberg, R. S., Nicholson, M. L., Siber, G. R., and
Swartz, R. W. (1996) Formation and cell-medium partitioning of autoinhibitory free
fatty acids and cyclodextrin's effect in the cultivation of Bordetella pertussis. Journal of
Biotechnology. 45(2): 137-148.
Fujioka, H., and Aikawa, M. (1999) 2. The malaria parasite and its life-cycle. Malaria:
Molecular and Clinical Aspects. (Wahlgren, M., and Pelmann, P., Eds.), pp 19-55.
Harwood Academic, Amsterdam.
Galtier, P., Alvinerie, M., and Delatour, P. (1986) In vitro sulfoxidation of albendazole
by ovine liver microsomes: assay and frequency of various xenobiotics. American
Journal of Veterinary Research. 47(2): 447-450.
Garay, R. P., Féray, J. C., Fanous, K., Nazaret, C., Villegas, M. J., and Letavernier, J. F.
(1994) A new approach for the in vitro evaluation of cyclodextrin effects on cellular
CHAPTER 9 __________________________________________________________________________________________________________
252
membranes of human cells. Proceedings of the Seventh International Cyclodextrins
Symposium, pp 373-376. Business Centre for Academic Societies, Tokyo, Japan.
Garcia, L. S., and Bruckner, D. A. (1988) Malaria and Babesia spp. Diagnostic Medical
Parasitology, pp 86-108. Elsevier Science Publishing, New York.
García-Rodriguez, J. J., Torrado, J. J., and Bolás, F. (2001) Improving bioavailability
and anthelmintic activity of albendazole by preparing albendazole-cyclodextrin
complexes. Parasite. 8(2 Suppl): S188-S190.
Gardner, T. B., and Hill, D. R. (2001) Treatment of giardiasis. Clinical Microbiological
Reviews. 14(1): 114-128.
Gascon, J., Moreno, A., Valls, M. E., Miró, M. J., and Corachán, M. (1989) Failure of
mebendazole treatment in Giardia lamblia infection. Transactions of the Royal Society
of Tropical Medicine and Hygiene. 83: 647.
Geerts, G., Coles, G. C., and Gryseels, B. (1997) Anthelmintic resistance in human
helminths: learning from the problems with worm control in livestock. Parasitology
Today. 13(4): 149-151.
Gelb, R. I., Schwartz, L. M., and Laufer, D. A. (1984) Adamantan-1-ylamine ad
adamantan-1-ylamine hydrochloride complexes with cycloamylose. J. Chem. Soc.
Perkin Trans. 2: 15-21.
Gerlóczy, A., Antal, S., Szatmari, I., Müller-Horvath, R., and Szejtli, J. (1990)
Absorption, distribution and excretion of 14C-labeled hydroxypropyl ß-cyclodextrin in
rats following oral administration. Minutes of the Fifth International Symposium on
cyclodextrins. (Duchêne, D., Ed.), pp 507-513. Editions de Santé, Paris, France.
Gerlóczy, A., Fónagy, A., Keresztes, P., Perlaky, L., and Szejtli, J. (1985) Absorption,
distribution, excretion and metabolism of orally administered 14C-ß-cyclodextrin in rat.
Drug Research. 35(2): 1042-1047.

CHAPTER 9 __________________________________________________________________________________________________________
253
Gerlóczy, A., Hoshino, T., and Pitha, J. (1994) Safety of oral cyclodextrins: Effects of
hydroxypropyl cyclodextrins, cyclodextrin sulfates and cationic cyclodextrins on steroid
balance in rats. Journal of Pharmaceutical Sciences. 83(2): 193-196.
Gerlóczy, A., Szemán, J., Csabai, K., Kolbe, I., Jicsinszky, L., Acerbi, D., Ventura, P.,
Redenti, E., and Szejtli, J. (1996) Pharmacokinetic study of orally administered
ketoconazole and its multicomponent complex on rabbits of normal and low gastric
acidity. Proceedings of the Eighth International Symposium on Cyclodextrins. (Szejtli,
J., and Szente, L., Eds.), pp 515-518. Kluwer Academic Publishers, Budapest, Hungary.
Gero, A., Woodrow, G., and Walker, J. (1991) Parasitic diseases: here today, here
tomorrow? Today’s Life Science. July: 14-17.
Ghosh, S., Frisardi, M., Rogers, R., and Samuelson, J. (2001) How Giardia swim and
divide. Infection and Immunity. 69(12): 7866-7872.
Gillin, F. D., Reiner, D. S., and McCaffery, J. M. (1996) Cell biology of the primitive
eukaryote Giardia lamblia. Annual Review of Microbiology. 50: 679-705.
Golab, T., Bishop, C. E., Donoho, A. L., Manthey, J. A., and Zornes, L. L. (1975)
Behaviour of 14C oryzalin in soils and plants. Pesticide Biochemistry and Physiology. 5:
196-204.
Golab, T., Herberg, R. J., Day, E. W., Raun, A. P., Holzer, F. J., and Probst, G. W.
(1969) Fate of carbon-14 trifluralin in artificial rumen fluid and in ruminant animals.
Journal of Agricultural Food and Chemistry. 17(3): 576-580.
Goldenthal, E. I. (1971) A compilation of LD50 values in newborn and adult animals.
Toxicology and Applied Pharmacology. 18: 185-207.

CHAPTER 9 __________________________________________________________________________________________________________
254
Gordts, B., Hemelhof, W., Asselman, C., and Butzler, J. (1985) In vitro susceptibilities
of 25 Giardia lamblia isolates of human origin to six commonly used antiprotozoal
agents. Antimicrobial Agents and Chemotherapy. 28(3): 378-380.
Gorfien, S., Paul, B., Walowitz, J., Keem, R., Biddle, W., and Jayme, D. (2000) Growth
of NS0 cells in protein-free, chemically defined medium. Biotechnol. Prog. 16(5): 682-
687.
Gottschall, D. W., Theodorides, V. J., and Wang, R. (1990) The metabolism of
benzimidazole anthelmintics. Parasitology Today. 6(4): 115-124.
Graaf, C. D., and Zandstra, E. H. (1999) Sweetness intensity and pleasantness in
children, adolescents, and adults. Physiology and Behavior. 67(4): 513-520.
Grant, D. J. W., and Higuchi, T. (1990) Solubility Behaviour of Organic Compounds.
Vol. XXI, John Wiley and Sons, Inc, Brisbane.
Greenberg-Ofrath, N., Terespolosky, Y., Kahane, I., and Bar, R. (1993) Cyclodextrins
as carriers of cholesterol and fatty acids in cultivation of mycoplasmas. Applied and
Environmental Microbiology. 59(2): 547-551.
Greig, J. D., Michel, P., Wilson, J. B., Lammerding, A. M., Majowicz, S. E., Stratton,
J., Aramini, J. J., Meyers, R. K., Middleton, D., and McEwen, S. A. (2001) A
descriptive analysis of giardiasis cases reported in Ontario, 1990-1998. Can. J. Public
Health. 92(5): 361-365.
Gyurik, R. J., Chow, A. W., Zaber, B., Brunner, E. L., Miller, J. A., Villani, A. J., Petka,
L. A., and Parish, R. C. (1981) Metabolism of albendazole in cattle, sheep, rats and
mice. Drug Metabolism and Disposition. 9(6): 503-508.
Habon, I., Fritsch, S., and Szejtli, J. (1984) Simulation of pharmacokinetic behaviour of
drug-cyclodextrin complexes. Pharmazie. 39: 830-834.

CHAPTER 9 __________________________________________________________________________________________________________
255
Hajjawi, N. S., Meloni, B. P., Morgan, U. M., and Thompson, R. C. A. (2001) Complete
development and long-term maintenance of Cryptosporidium parvum human and cattle
genotypes in cell culture. International Journal for Parasitology. 31: 1048-1055.
Hall, A., and Nahar, Q. (1993) Albendazole as a treatment for infections with Giardia
duodenalis in children in Bangladesh. Transactions of the Royal Society of Tropical
Medicine and Hygiene. 87: 84-86.
Harder, A., Greif, G., and Haberkorn, A. (2001) Chemotherapeutic approaches to
protozoa: Giardia, Trichomonas and Entamoeba - current level of knowledge and
outlook. Parasitology Research. 87(9): 785-786.
Harris, J. C., Plummer, S., and Lloyd, D. (2001) Antigiardial drugs. Applied
Microbiology and Biotechnology. 57(5-6): 614-619.
Heck, H. d. A., Dyer, R. L., Scott, A. C., and Anbar, M. (1977) Determination and
disposition of trifluralin in the rat. Separation by sequential high-pressure liquid
chromatography and quantitation by field ionisation mass spectrometry. Journal of
Agricultural Food and Chemistry. 25(4): 901-908.
Helling, C. S. (1976) Dinitroaniline herbicides in soils. Journal of Environmental
Quality. 5(1): 1-15.
Hennessy, D. R. (1997) Modifying the formulation or delivery mechanism to increase
the activity of anthelmintic compounds. Veterinary Parasitology. 72: 367-390.
Hertal, C., Quader, H., Robinson, D. G., and Marme, D. (1980) Antimicrotubular
herbicides and fungicides affect Ca2+ transport in plant mitochondria. Planta. 149: 336-
340.
Hess, D., and Bayer, D. (1974) The effect of trifluralin on the ultrastructure of dividing
cells of the root meristem of cotton (Gossypium hirsutum L. 'ACALA 4-42'). Journal of
Cell Science. 15: 429-441.

CHAPTER 9 __________________________________________________________________________________________________________
256
Higuchi, T., and Connors, K. A. (1965) Phase-solubility techniques. Advances in
Analytical Chemistry and Instrumentation. 4: 117-212.
Higuchi, T., and Kristiansen, H. (1970) Binding specificities between small organic
solutes in aqueous solution: Classification of some solutes into two groups according to
binding tendencies. Journal of Pharmaceutical Sciences. 56: 1601-1608.
Hirayama, F., and Uekama, K. (1987) Methods of investigating and preparing inclusion
compounds. Cyclodextrins and their Industrial Uses. (Duchêne, D., Ed.), pp 131-172.
Editions de Santé, Paris, France.
Holberton, D. V. (1973) Fine structure of the ventral disk apparatus and the mechanism
of attachment in the flagellate Giardia muris. Journal of Cell Science. 13: 11-41.
Holberton, D. V., Baker, D. A., and Marshall, J. (1988) Segmented α-helical coiled-coil
structure of the protein giardin from the Giardia cytoskeleton. Journal of Molecular
Biology. 204: 789-795.
Holberton, D. V., and Ward, A. P. (1981) Isolation of the cytoskeleton from Giardia.
Tubulin and a low-molecular-weight protein associated with microribbon structures.
Journal of Cell Science. 47: 139-166.
Holden, H. E., Crider, P. A., and Wahrenburg, M. G. (1980) Mitotic arrest by
benzimidazole analogs in human lymphocyte cultures. Environmental Mutagenesis. 2:
67-73.
Hommel, M., and Schrével, J. (1998) Malaria, microtubules and merozoite invasion.
Parasitology Today. 14(1): 6-7.
Horikoshi, K. (1999) Alkaliphiles: some applications of their products for
biotechnology. Microbiology and Molecular Biology Reviews. 63(4): 735-750.

CHAPTER 9 __________________________________________________________________________________________________________
257
Horton, R. J. (1989) Chemotherapy of Echinococcus infection in man with albendazole.
Transactions of the Royal Society of Tropical Medicine and Hygiene. 83: 97-102.
Horton, R. J. (1990) Benzimidazoles in a wormy world. Parasitology Today. 6(4): 106.
Hoshino, T., Uekama, K., and Pitha, J. (1993) Increase in temperature enhances
solubility of drugs in aqueous solutions of hydroxypropylcyclodextrins. International
Journal of Pharmaceutics. 98: 239-242.
Hovgaard, L., and Brøndsted, H. (1995) Drug delivery studies in Caco-2 monolayers.
IV. Absorption enhancer effects of cyclodextrins. Pharmaceutical Research. 12(9):
1328-1332.
Hussar, D. A. (1997) New drugs of 1996. Journal of the American Pharmaceutical
Association. NS37(2): 192-228.
Irie, T., Fukunaga, K., Garwood, M. K., Carpenter, T. O., Pitha, J., and Pitha, J. (1992a)
Hydroxypropylcyclodextrins in parenteral use. II: Effects on transport and disposition of
lipids in rabbit and humans. Journal of Pharmaceutical Sciences. 81(6): 524-528.
Irie, T., Fukunaga, K., and Pitha, J. (1992b) Hydroxypropylcyclodextrins in parenteral
use. I: Lipid dissolution and effects of lipid transfers in vitro. Journal of Pharmaceutical
Sciences. 81(6): 521-523.
Irie, T., Otagiri, M., Sunada, M., Uekama, K., Ohtani, Y., Yamada, Y., and Sugiyama,
Y. (1982) Cyclodextrin induced hemolysis and shape changes of human erythrocytes in
vitro. Journal of Pharmacobio-Dynamics. 5: 741-744.
Irie, T., Tsunenari, Y., Uekama, K., and Pitha, J. (1988) Effect of bile on the intestinal
absorption of α-cyclodextrin in rats. International Journal of Pharmaceutics. 43: 41-44.

CHAPTER 9 __________________________________________________________________________________________________________
258
Irie, T., and Uekama, K. (1997) Pharmaceutical applications of cyclodextrins. III.
Toxicological issues and safety evaluation. Journal of Pharmaceutical Sciences. 86(2):
147-162.
Irie, T., Wakamatsu, K., Arima, H., Aritomi, H., and Uekama, K. (1992c) Enhancing
effects of cyclodextrins on nasal absorption of insulin in rats. International Journal of
Pharmaceutics. 84: 129-139.
Irwin, W. J., Dwivedi, A. K., Holbrook, P. A., and Dey, M. J. (1994) The effect of
cyclodextrin on the stability of peptides in nasal enzymic systems. Pharmaceutical
Research. 11(12): 1698-1703.
Islam, A. (1990) Giardiasis in developing countries. Giardiasis. (Meyer, E. A., Ed.), pp
236-266. Elsevier Science Publishers B.V.
Jadoun, J., and Bar, R. (1993a) Microbial transformations in a cyclodextrin medium.
Part 3. Cholesterol oxidation by Rhodococcus erythropolis. Applied Microbiology and
Biotechnology. 34: 230-240.
Jadoun, J., and Bar, R. (1993b) Microbial transformations in a cyclodextrin medium.
Part 4. Enzyme vs. microbial oxidation of cholesterol. Applied Microbiology and
Biotechnology. 40: 477-482.
James, D. M., and Gilles, H. M. (1985) Malaria. Human Antiparasitic Drugs -
Pharmacology and Usage, pp 120-164. John Wiley and Sons, New York.
Janse, C. J., and Waters, A. P. (1995) Plasmodium berghei: The application of
cultivation and purification techniques to molecular studies of malaria parasites.
Parasitology Today. 11(4): 138-143.
Jarroll, E. L., Macechko, P. T., Steimle, P. A., Bulik, D., Karr, C. D., van Keulen, H.,
Paget, T. A., Gerwig, G., Kamerling, J., Vliegenthart, J., and Erlandsen, S. (2001)

CHAPTER 9 __________________________________________________________________________________________________________
259
Regulation of carbohydrate metabolism during Giardia encystment. Journal of
Eukaryote Microbiology. 48(1): 22-26.
Jenkins, M. C., Trout, J., and Fayer, R. (1998) Detection and application of an improved
semiquantitative technique for detection of low-level Cryptosporidium parvum
infections in mouse tissue using polymerase chain reaction. Journal of Parasitology. 84:
182-186.
Jones, S. P., and Grant, D. J. W. (1984) Cyclodextrins in the pharmaceutical sciences
part II: pharmaceutical, biopharmaceutical, biological and analytical aspects, and
applications of cyclodextrin and its inclusion complex. Acta Pharmaceutica
Technologica. 30(4): 263-277.
Jones, S. P., Grant, D. J. W., Hadgraft, J., and Parr, G. D. (1984) Cyclodextrins in
pharmaceutical sciences Part I: preparation, structure and properties of cyclodextrins
and cyclodextrin inclusion compounds. Acta Pharmaceutica Technologica. 30(3): 213-
223.
Jonkman-de Vries, J. D., Flora, K. P., Bult, A., and Beijnen, J. H. (1996)
Pharmaceutical development of (investigational) anticancer agents for parental use-a
review. Drug Development and Industrial Pharmacy. 22(6): 475-494.
Jung, H., Hurtado, M., Medina, M. T., Sanchez, M., and Sotelo, J. (1990)
Dexamethasone increases plasma levels of albendazole. Journal of Neurology. 237:
279-280.
Justel, A., Alvarez, A. I., Alonso, M. L., del Estal, J. L., Villaverde, C., Barrio, J. P., and
Prieto, J. G. (1994) Influence of ethanol on gastric absorption and metabolism of
albendazole and mebendazole. Drug and Alcohol Dependence. 36: 49-55.
Kaidoh, T., Nath, J., Fujioka, H., Okoye, V., and Aikawa, M. (1995) Effect and
localization of trifluralin in Plasmodium falciparum gametocytes: an electron
microscope study. Journal of Eukaryote Microbiology. 42(1): 61-64.

CHAPTER 9 __________________________________________________________________________________________________________
260
Kamiyama, T., and Matsubara, J. (1992) Application of a simple culture of Plasmodium
berghei for assessment of antiparasitic activity. International Journal for Parasitology.
22(8): 1137-1142.
Kata, M., and Scheuer, M. (1991) Increasing the solubility characteristics of
albendazole with dimethyl-ß-cyclodextrin. Acta Pharmaceutica Hungarica. 61: 23-31.
Katelaris, P. H., and Farthing, M. J. G. (1992) Diarrhoea and malabsorption in
Giardiasis: a multifactorial process. Gut. 33: 295-297.
Katiyar, S. K., Gordon, V. R., McLaughin, G. L., and Edlind, T. D. (1994)
Antiprotozoal activities of benzimidazoles and correlations with ß-tubulin sequence.
Antimicrobial Agents and Chemotherapy. 38(9): 2086-2090.
Kátó, L., Szejtli, J., and Szente, L. (1993) Water soluble complex of palmitic acid in
media for cultivation of leprosy-derived psychrophilic mycobacteria from
Mycobacterium leprae infected tissue. Acta Microbiologica Hungarica. 40(1): 47-58.
Kátó, L., Szejtli, J., and Szente, L. (1994) Water soluble complexes of C14 and C16 fatty
acids and alcohols in media for cultivation of leprosy-derived psychrophilic
mycobacteria. International Journal of Leprosy. 62(1): 75-88.
Kattenbach, W. M., Pimenta, P. F. P., de Souza, W., and Pinto da Silva, P. (1991)
Giardia duodenalis: a freeze-fracture, fracture-flip and cytochemistry study.
Parasitology Research. 77: 651-658.
Katz, M., Despommier, D. D., and Gwadz, R. W. (1982) Parasitic Diseases, Springer-
Verlag, New York.
Kollaritsch, H., Jeschko, E., and Wiedermann, G. (1993) Albendazole is highly
effective against cutaneous larval migrans but not against Giardia infection: results of

CHAPTER 9 __________________________________________________________________________________________________________
261
an open pilot trial in travellers returning from the tropics. Transactions of the Royal
Society of Tropical Medicine and Hygiene. 87: 689.
Kwan, L. C., Gyurik, R. J., Freeman, J. F., Chimes, N., Ritch, G. M., and Theodorides,
V. J. (1988) Influence of dosing regimens on the anthelmintic activity of albendazole in
sheep. Journal of Controlled Release. 8: 31-38.
Lacey, E. (1985) The biochemistry of anthelmintic resistance. Resistance in Nematodes
to Anthelmintic Drugs. (Anderson, N., and Waller, P., Eds.), pp 69-78. CSIRO
Australia.
Lacey, E. (1988) The role of the cytoskeletal protein, tubulin, in the mode of action and
mechanism of drug resistance to benzimidazoles. International Journal for
Parasitology. 18(7): 885-936.
Lacey, E. (1990) Mode of action of benzimidazoles. Parasitology Today. 6(4): 112-115.
Lacey, E., and Snowdon, K. L. (1988) A routine diagnostic assay for the detection of
benzimidazole resistance in parasitic nematodes using tritiated benzimidazole
carbamates. Veterinary Parasitology. 27: 309-324.
Lange, H., Eggers, R., and Bircher, J. (1988) Increased systemic availability of
albendazole when taken with a fatty meal. European Journal of Clinical Pharmacology.
34: 315-317.
Lanusse, C. E., and Prichard, R. K. (1991) Enhancement of the plasma concentration of
albendazole sulphoxide in sheep following coadministration of parenteral netobimin and
liver oxidase inhibitors. Research in Veterinary Science. 51: 306-312.
Lanusse, C. E., and Prichard, R. K. (1992) Methimazole increases the plasma
concentrations of the albendazole metabolites of netobimin in sheep. Biopharmaceutics
and Drug Disposition. 13: 95-103.

CHAPTER 9 __________________________________________________________________________________________________________
262
Leitis, E., and Crosby, D. G. (1974) Photodecomposition of trifluralin. Journal of
Agricultural Food and Chemistry. 22(5): 842-848.
Levine, N. D. (1984) Taxonomy and review of the coccidian genus Cryptosporidium
(Protozoa, Apicomplexa). Journal of Protozoology. 31: 94-98.
Levine, N. D. (1985) Veterinary Protozoology, Iowa State University Press, Ames.
Li, S., and Purdy, W. C. (1992) Cyclodextrins and their applications in analytical
chemistry. Chemical Reviews. 92: 1457-1470.
Lin, S.-F., and Connors, K. A. (1983) Complex formation between α-cyclodextrin and
4-substituted phenols studied by potentiometric and competitive spectrometric methods.
Journal of Pharmaceutical Sciences. 72(11): 1333-1338.
Linares, M., de Bertorello, M., and Longhi, M. (1998) Solubility of isoxazolyl-
naphtoquinone by complexation with hydroxypropyl-ß-cyclodextrin. Proceedings of the
Ninth International Symposium on Cyclodextrins. (Labandeira, J. J. T., and Vila-Jato, J.
L., Eds.), pp 207-218. Kluwer Academic Publishers, Santiago de Compostela, Spain.
Linnane, E., Roberts, R., and Looker, N. (2001) Nappies and transmission of Giardia
lamblia between children. Lancet. 358(9280): 507.
Livak, K. J., Flood, S. J., Marmaro, J., Giusti, W., and Deetz, K. (1995)
Oligonucleotides with fluorescent dyes at opposite ends provide a quenched probe
system useful for detecting PCR product and nucleic acid hydridisation. PCR Methods
Appl. 4: 357-362.
Loftsson, T., and Brewster, M. E. (1996) Pharmaceutical applications of cyclodextrins.
I. Drug solubilization and stabilization. Journal of Pharmaceutical Sciences. 85(10):
1017-1025.

CHAPTER 9 __________________________________________________________________________________________________________
263
Loftsson, T., Friôriksdóttir, H., and Guômundsdóttir, T. K. (1996a) The influence of
water-soluble polymers and pH on hydroxypropyl-β-cyclodextrin complexation of
drugs. Drug Development and Industrial Pharmacy. 22(5): 401-405.
Loftsson, T., Friôriksdóttir, H., Thórisdóttir, S., and Stefánsson, E. (1994) The effect of
hydroxypropyl methylcellulose on the release of dexamethasone from aqueous 2-
hydroxypropyl-ß-cyclodextrin formulations. International Journal of Pharmaceutics.
104: 181-184.
Loftsson, T., Másson, M., and Sigurjonsdóttir, F. J. (1998) Enhanced complexation
efficacy of cyclodextrins. Proceedings of the Ninth International Symposium on
Cyclodextrins. (Labandeira, J. J. T., and Vila-Jato, J. L., Eds.), pp 257-260. Kluwer
Academic Publishers, Santiago de Compostela, Spain.
Loftsson, T., Másson, M., and Sigurjonsdóttir, F. J. (1999) Methods to enhance the
complexation efficiency of cyclodextrins. S.T.P. Pharma Sciences. 9(3): 237-242.
Loftsson, T., Stefánsson, E., Fridriksdóttir, H., and Kristinsson, J. K. (1996b) Novel
CD-based drug delivery system. Proceedings of the Eighth International Symposium on
Cyclodextrins. (Szejtli, J., and Szente, L., Eds.), pp 407-412. Kluwer Academic
Publishers, Budapest, Hungary.
Löscher, W., Hönack, D., Richter, A., Schulz, H.-U., Schürer, M., Düsing, R., and
Brewster, M. E. (1995) New injectable aqueous carbamazepine solution through
complexing with 2-hydroxypropyl-ß-cyclodextrin: tolerability and pharmacokinetics
after intravenous injection in comparison to a glycofurol-based formulation. Epilepsia.
36(3): 255-261.
Lyman, J. R., and Marchin, G. L. (1984) Cryopreservation of Giardia lamblia with
dimethyl sulfoxide using a dewar flask. Cryobiology. 21(2): 170-176.
MacDonald, L. M., Sargent, K., Armson, A., Thompson, R. C. A., and Reynoldson, J.
A. (2002) The development of a real-time quantitative-PCR method for characterisation

CHAPTER 9 __________________________________________________________________________________________________________
264
of a Cryptosporidium parvum in vitro culturing system and assessment of drug efficacy.
Molecular and Biochemical Parasitology. 121: 279-282.
Marlin, N. A. (1983) Early exposure to sugars influences the sugar preference of the
adult rat. Physiology and Behavior. 31: 619-623.
Marriner, S. E., and Bogan, J. A. (1980) Pharmacokinetics of albendazole in sheep.
American Journal of Veterinary Research. 41(7): 1126-1129.
Marriner, S. E., Morris, D. L., Dickson, B., and Bogan, J. A. (1986) Pharmacokinetics
of albendazole in man. European Journal of Clinical Pharmacology. 30: 705-708.
Martens, P., and Hall, L. (2000) Malaria on the move: human population movement and
malaria transmission. Emerging Infectious Diseases. 6(2): 103-109.
Marttin, E., Verhoef, J. C., Romeijn, S. G., and Merkus, F. W. H. M. (1995) Effects of
absorption enhancers on rat nasal epithelium in vivo: release of marker compounds in
the nasal cavity. Pharmaceutical Research. 12(8): 1151-1156.
Marttin, E., Verhoef, J. C., Romeijn, S. G., and Merkus, F. W. H. M. (1996)
Cyclodextrins in nasal drug delivery: Trends and perspectives. Proceedings of the
Eighth International Symposium on Cyclodextrins. (Szejtli, J., and Szente, L., Eds.), pp
381-386. Kluwer Academic Publishers, Budapest, Hungary.
Másson, M., Loftsson, T., Fridriksdóttir, H., Petersen, D. S., and Jónsdóttir, S. (1996)
Complexation of drug compounds with ionic and non-ionic cyclodextrins. Proceedings
of the Eighth International Symposium on Cyclodextrins. (Szejtli, J., and Szente, L.,
Eds.), pp 365-368. Kluwer Academic Publishers, Budapest, Hungary.
Másson, M., Loftsson, T., Jónsdóttir, S., Fridriksdóttir, H., and Petersen, D. S. (1998)
Stabilisation of ionic drugs through complexation with non-ionic and ionic
cyclodextrins. International Journal of Pharmaceutics. 164: 45-55.

CHAPTER 9 __________________________________________________________________________________________________________
265
McCraken, R. O., and Stillwell, W. H. (1991) A possible biochemical mode of action
for benzimidazole anthelmintics. International Journal for Parasitology. 21(1): 99-104.
McKellar, Q. A., and Scott, E. W. (1990) The benzimidazole anthelmintic agents - a
review. Journal of Veterinary Pharmacology and Therapeutics. 13: 223-247.
McKerrow, J., Sun, E., Rosenthal, P., and Bouvier, J. (1993) Proteases of parasitic
protozoa. Annual Review of Microbiology. 47: 821-853.
McNally, J., O'Donovan, S. M., and Dalton, J. P. (1992) Plasmodium berghei and
Plasmodium chabaudi chabaudi: development of simple in vitro erythrocyte invasion
assays. Parasitology. 105: 355-362.
Meloni, B. P., Lymbery, A. J., and Thompson, R. C. A. (1988) Isoenzyme
electrophoresis of 30 isolates of Giardia from humans and felines. American Journal of
Tropical Medicine and Hygiene. 38(1): 65-73.
Meloni, B. P., and Thompson, R. C. A. (1987) Comparative studies on the axenic in
vitro cultivation of Giardia of human and canine origin: evidence for intraspecific
variation. Transactions of the Royal Society of Tropical Medicine and Hygiene. 81: 637-
640.
Meloni, B. P., and Thompson, R. C. A. (1996) Simplified methods for obtaining
purified oocysts from mice and for growing Cryptosporidium parvum in vitro. Journal
of Parasitology. 82(5): 757-762.
Meloni, B. P., Thompson, R. C. A., Reynoldson, J. A., and Seville, P. (1990)
Albendazole: a more effective antigiardial agent in vitro than metronidazole or
tinidazole. Transactions of the Royal Society of Tropical Medicine and Hygiene. 84:
375-379.

CHAPTER 9 __________________________________________________________________________________________________________
266
Merkus, F. W. H. M., Verhoef, J. C., Romeijn, S. G., and Schipper, N. G. M. (1991)
Absorption enhancing effect of cyclodextrins on intranasally administered insulin in
rats. Pharmaceutical Research. 8(5): 588-592.
Mesens, J. L., Putteman, P., and Verheyen, P. (1992) Pharmaceutical applications of 2-
hydroxypropyl ß-cyclodextrin. New trends in cyclodextrins and derivatives. (Duchêne,
D., Ed.), pp 369-407. Editions de Santé, Paris, France.
Meyer, E. A. (1970) Isolation and axenic cultivation of Giardia trophozoites from the
rabbit, chinchilla and cat. Experimental Parasitology. 27: 179-183.
Meyer, E. A. (1974) Microorganisms and Human Disease, Appleton-Century, New
York.
Meyer, E. A. (1985) The epidemiology of Giardiasis. Parasitology Today. 1(4): 101-
105.
Monbaliu, J., van Beijsterveldt, L., Meuldermans, W., Szathmary, S. C., and Heykants,
J. (1990) Disposition of hydroxypropyl ß-cyclodextrin in experimental animals. Minutes
of the Fifth International Symposium on cyclodextrins. (Duchêne, D., Ed.), pp 514-517.
Editions de Santé, Paris, France.
Mons, B., and Sinden, R. E. (1990) Laboratory models for research in vivo and in vitro
on malaria parasites of mammals: current status. Parasitology Today. 6(1): 3-7.
Morejohn, L. C., Bureau, T. E., Molè-Bajer, J., Bajer, A. S., and Fosket, D. E. (1987)
Oryzalin, a dinitroaniline herbicide, binds to plant tubulin and inhibits microtubule
polymerisation in vitro. Planta. 172: 252-264.
Morgan, U. M., Constantine, C. C., O'Donoghue, P., Meloni, B. P., O'Brien, P. A., and
Thompson, R. C. A. (1995) Molecular characterization of Cryptosporidium isolates
from humans and other animals using random amplified polymorphic DNA analysis.
American Journal of Tropical Medicine and Hygiene. 52(6): 559-564.

CHAPTER 9 __________________________________________________________________________________________________________
267
Morgan, U. M., O'Brien, P. A., and Thompson, R. C. A. (1996) The development of
diagnostic PCR primers for Cryptosporidium using RAPID-PCR. Molecular and
Biochemical Parasitology. 77: 103-108.
Morgan, U. M., Reynoldson, J. A., and Thompson, R. C. A. (1990) Activities of several
benzimidazoles and tubulin inhibitors against Giardia spp. in vitro. Antimicrobial
Agents and Chemotherapy. 37(2): 328-331.
Morris, D. L., and Smith, P. G. (1987) Albendazole in hydatid disease-hepatocellular
toxicity. Transactions of the Royal Society of Tropical Medicine and Hygiene. 81: 343-
344.
Morshed, M. G., Karita, M., Konishi, H., Okita, K., and Nakazawa, T. (1994) Growth
medium containing cyclodextrin and low concentration of horse serum for cultivation of
Helicobacter pylori. Microbiol. Immunol. 38(11): 897-900.
Müller, B. W., and Brauns, U. (1985) Solubilization of drugs by modified ß-
cyclodextrins. International Journal of Pharmaceutics. 26: 77-88.
Müller, B. W., and Brauns, U. (1986a) Cyclodextrin ethers as complexing
agents/enzymatic degredation. Pharm. Ind. 48(11): 1427-1429.
Müller, B. W., and Brauns, U. (1986b) Hydroxypropyl-ß-cyclodextrin derivatives:
Influence of average degree of substitution on complexing ability and surface activity.
Journal of Pharmaceutical Sciences. 75(6): 571-572.
Mura, P., Franchi, G., Faucci, M. T., Manderioli, A., and Bramanti, G. (1998)
Improvement of econazole solubility in multicomponent systems with cyclodextrins and
acids. Proceedings of the Ninth International Symposium on Cyclodextrins.
(Labandeira, J. J. T., and Vila-Jato, J. L., Eds.), pp 375-378. Kluwer Academic
Publishers, Santiago de Compostela, Spain.

CHAPTER 9 __________________________________________________________________________________________________________
268
Nakanishu, K., Masada, M., Nadai, T., and Miyajima, K. (1989) Effects of the
interaction of drug-ß-cyclodextrin complex with bile salts on the drug absorption from
rat small intestinal lumen. Chemical Pharmaceutical Bulletin. 37(1): 211-214.
Nakanishu, K., Masukawa, T., and Miyajima, K. (1994) The interaction of cyclodextrin
and biological membrane on the drug absorption. Proceedings of the Seventh
International Cyclodextrins Symposium, pp 377-381. Business Centre for Academic
Societies, Tokyo, Japan.
Nakanishu, K., Nadai, T., Masada, M., and Miyajima, K. (1990) Effects of
cyclodextrins on biological membrane. I. Effect of cyclodextrins on the absorption of a
non-absorbable drug from rat small intestine and rectum. Chemical Pharmaceutical
Bulletin. 38(6): 1684-1687.
Navy Environmental Health Center (2001) Malaria Prevention and Control (Online),
Available World Wide Web: http://www.vnh.org/Malaria/ch1.html (accessed
25/10/2001).
Nelson, J. O., Kearney, P. C., Plimmer, J. R., and Menzer, R. E. (1977) Metabolism of
trifluralin, profluralin and fluchloralin by rat liver microsomes. Pesticide Biochemistry
and Physiology. 7: 73-82.
New, R. R. C., Wen, H., Craig, P. S., Zou, P. F., Merdan, A., Wang, J. H., Wang, Y. H.,
Wang, P., and Zhang, J. H. (1994) Efficacy of albendazole administered orally is
improved by encapsulation in liposomes. Journal of Controlled Release. 28: 350-351.
Noble, E. R., and Noble, G. A. (1979) Parasitology. The biology of animal parasites,
4th ed., Lea and Febiger, Philadelphia.
Nohria, A., Alonso, R. A., and Peattie, D. A. (1992) Identification and characterisation
of γ-giardin and the γ-giardin gene from Giardia lamblia. Molecular and Biochemical
Parasitology. 56: 27-38.

CHAPTER 9 __________________________________________________________________________________________________________
269
O'Donoghue, P. J. (1995) Cryptosporidium and Cryptosporidiosis in man and animals.
International Journal for Parasitology. 25(2): 139-195.
Ohtani, Y., Irie, T., Uekama, K., Fukunaga, K., and Pitha, J. (1989) Differential effects
of α-, ß- and γ-cyclodextrins on human erythrocytes. European Journal of
Biochemistry. 186: 17-22.
Olliaro, P., Cattani, J., and Wirth, D. (1996) Malaria, the submerged disease. Journal of
the American Veterinary Medical Association. 275(3): 230-233.
Owen, R. L. (1980) The ultrastructural basis of Giardia function. Transactions of the
Royal Society of Tropical Medicine and Hygiene. 74(4): 429-433.
Oxberry, M. E., Reynoldson, J. A., and Thompson, R. C. A. (2000) The binding and
distribution of albendazole and its principal metabolites in Giardia duodenalis. Journal
of Veterinary Pharmacology and Therapeutics. 23: 113-120.
Oxberry, M. E., Thompson, R. C. A., and Reynoldson, J. A. (1994) Evaluation of the
effects of albendazole and metronidazole on the ultrastructure of Giardia duodenalis,
Trichomonas vaginalis and Spironucleus muris using transmission electron microscopy.
International Journal for Parasitology. 24(5): 695-703.
Parfitt, K. (1999) Martindale: The Complete Drug Reference, 32nd ed., Pharmaceutical
Press, London.
Parka, S. J., and Soper, O. F. (1977) The physiology and mode of action of the
dinitroaniline herbicides. Weed Science. 25(1): 79-87.
Peattie, D. A. (1990) The giardins of Giardia lamblia: genes and proteins with promise.
Parasitology Today. 6(2): 52-56.
Peattie, D. A., Alonso, R. A., Hein, A., and Caulfield, J. P. (1989) Ultrastructural
Localization of giardins to the edges of disk microribbons of Giardia Lamblia and the

CHAPTER 9 __________________________________________________________________________________________________________
270
nuclotide and deduced protein sequence of alpha giardin. The Journal of Cell Biology.
109: 2323-2335.
Pedersen, M., Bjerregaard, S., Jacobsen, J., Larsen, A. R., and Sørensen, A. M. (1998)
An econazole ß-cyclodextrin inclusion complex: an unusual dissolution rate,
supersaturation, and biological efficacy example. International Journal of
Pharmaceutics. 165: 57-68.
Perrin, D. D., and Dempsey, B. (1974) Buffers for pH and Metal Ion Control, Chapman
and Hall, London.
Persidis, A. (2000) Malaria. Nature Biotechnology. 18: 111-112.
Petersen, C. (1993) Cellular biology of Cryptosporidium parvum. Parasitology Today.
9(3): 87-91.
Pickering, L. K., and Engelkirk, P. G. (1988) Giardia lamblia. New Topics in Pediatric
Infectious Disease. 35(2): 565-577.
Piel, G., Evrard, B., van Hees, T., Llabres, G., and Delattre, L. (1999) Development of a
parenteral and of an oral formulation of albendazole with cyclodextrins. S.T.P. Pharma
Sciences. 9(3): 257-260.
Pitha, J. (1990) Hydroxypropyl cyclodextrins in pharmacy and pharmacology, progress
from toy to tool. Minutes of the Fifth International Symposium on cyclodextrins.
(Duchêne, D., Ed.), pp 501-506. Editions de Santé, Paris, France.
Pitha, J. (1992) Pharmacological role of hydroxypropyl cyclodextrins. New trends in
cyclodextrins and derivatives. (Duchêne, D., Ed.), pp 315-367. Editions de Santé, Paris,
France.

CHAPTER 9 __________________________________________________________________________________________________________
271
Pitha, J. (1994) Cyclodextrins and their derivatives: Effects on human health.
Proceedings of the Seventh International Cyclodextrins Symposium, pp 361-364.
Business Centre for Academic Societies, Tokyo, Japan.
Pitha, J., Irie, T., Sklar, P. B., and Nye, J. S. (1988) Drug solubilizers to aid
pharmacologists: amorphous cyclodextrin derivatives. Life Sciences. 43: 493-502.
Pitha, J., Milecki, J., Fales, H. M., Pannell, L., and Uekama, K. (1986) Hydroxypropyl-
ß-cyclodextrin: Preparation and characterisation; effects on solubility of drugs.
International Journal of Pharmaceutics. 29: 73-82.
Pitha, J., and Pitha, J. (1985) Amorphous water-soluble derivatives of cyclodextrins:
nontoxic dissolution enhancing excipients. Journal of Pharmaceutical Sciences. 74(9):
987-990.
Powis, G., Gallegos, A., Abraham, R. T., Ashendel, C. L., Zalkow, L. H., Dorr, R.,
Dvorakova, K., Salmon, S., Harrison, S., and Worzalla, J. (1997) Inhibition of
intracellular Ca2+ signalling, cytotoxicity and antitumor activity of the herbicide
oryzalin and its analogues. Cancer Chemotherapy and Pharmacology. 41(1): 22-28.
Probst, G. W., Golab, T., Herberg, R. J., Holzer, F. J., Parka, S. J., van der Schans, C.,
and Tepe, J. B. (1967) Fate of trifluralin in soils and plants. Journal of Agricultural
Food and Chemistry. 15(4): 592-599.
Probst, G. W., Golab, T., and Wright, W. L. (1975) Dinitroanilines. Herbicides:
Chemistry, Degradation and Mode of Action. (Kearney, P. C., and Kaufman, D. D.,
Eds.). Vol. Vol 1, pp 453-500. Marcel Dekker INC, New York.
Rabbini, G. H., and Islam, A. (1994) Giardiasis in humans: populations most at risk and
prospects for control. Giardia: From Molecules to Disease. (Thompson, R. C. A.,
Reynoldson, J. A., and Lymbery, A. J., Eds.) pp 217-249. CAB International,
Wallingford, U.K.

CHAPTER 9 __________________________________________________________________________________________________________
272
Rajewski, R. A., and Stella, V. J. (1996) Pharmaceutical applications of cyclodextrins.
2. In vivo drug delivery. Journal of Pharmaceutical Sciences. 85(11): 1142-1169.
Ramirez, H. E., Cortes, M., and Agosin, E. (1993) Bioconversion of drimenol into 3β-
hydroxydrimanes by Aspergillus niger. Effect of culture additives. Journal of Natural
Products. 56(5): 762-764.
Rao, C. T., Fales, H. M., and Pitha, J. (1990) Pharmaceutical usefulness of
hydroxypropylcyclodextrins: "E Pluribus Unum" is an essential feature. Pharmaceutical
Research. 7(6): 612-615.
Rao, C. T., Pitha, J., Lindberg, B., and Lindbreg, J. (1992) Distribution of substituents
in O-(2-hydroxypropyl) derivatives of cyclomalto-oligosaccharides (cyclodextrins):
influence of increasing subsitution, of the base used in the preparation, and of
macrocyclic size. Carbohydrate Research. 223: 99-107.
Redenti, E., Szente, L., and Szejtli, J. (2000) Drug/cyclodextrin/hydroxy acid
multicomponent systems. Properties and pharmaceutical applications. Journal of
Pharmaceutical Sciences. 89(1): 1-8.
Redondo, P. A., Alvarez, A. I., García, J. L., Villaverde, C., and Prieto, J. G. (1998)
Influence of surfactants on oral bioavailability of albendazole based on the formation of
the sulphoxide metabolites in rats. Biopharmaceutics and Drug Disposition. 19: 65-70.
Reynoldson, J. A., Thompson, R. C. A., and Meloni, B. P. (1991a) In vivo efficacy of
albendazole against Giardia duodenalis in mice. Parasitology Research. 77: 325-328.
Reynoldson, J. A., Thompson, R. C. A., and Meloni, B. P. (1991b) The mode of action
of benzimidazoles against Giardia and their chemotherapeutic potential against Giardia
and other parasitic protozoa. Biochemical Protozoology. (Coombs, G. H., and North, M.
J., Eds.), pp 587-593. Taylor and Francis, London.

CHAPTER 9 __________________________________________________________________________________________________________
273
Reynoldson, J. A., Thompson, R. C. A., and Meloni, B. P. (1992) The potential and
possible mode of action of the benzimidazoles against Giardia and other protozoa.
Journal of Pharmaceutical Medicine. 2: 35-50.
Reynoldson, J. A., Behnke, J. M., Gracey, M., Horton, R. J., Spargo, R., Hopkins, R.
M., Constantine, C. C., Gilbert, F., Stead, C., Hobbs, R. P., and Thompson, R. C. (1998)
Efficacy of albendazole against Giardia and hookworm in a remote Aboriginal
community in the north of Western Australia. Acta Tropica. 71(1): 27-44.
Robens, J. F. (1980) Carcinogenicity studies of selected herbicides. Veterinary and
Human Toxicology. 22: 328-334.
Robinson, L. J., Campbell, A. T., and Smith, H. V. (1992) Survival of Cryptosporidium
parvum oocysts under various environmental pressures. Applied and Environmental
Microbiology. 58: 3494-3500.
Rodrigues, J. M. J., Bories, C., Emery, I., Fessi, H., Devissaguet, J. P., and Liance, M.
(1995) Development of an injectable formulation of albendazole and in vivo evaluation
of its efficacy against Echinococcus multilocularis metacestode. International Journal
for Parasitology. 25(12): 1437-1441.
Roos, M. H. (1990) The molecular nature of benzimidazole resistance in helminths.
Parasitology Today. 6(4): 125-127.
Saha, B. C., and Zeikus, J. G. (1992) Cyclodextrin degrading enzymes. Starch/Stärk.
44(8): 312-315.
Sangster, N. C., and Gill, J. (1999) Pharmacology of anthelmintic resistance.
Parasitology Today. 15(4): 141-146.
Sarciron, M. E., Walchshofer, N., Walbaum, S., Arsac, C., Descotes, J., Petavy, A. F.,
and Paris, J. (1997) Increases in the effects of albendazole on Echinococcus

CHAPTER 9 __________________________________________________________________________________________________________
274
multilocularis metacestodes by the dipeptide methyl ester (phe-phe-ome). American
Journal of Tropical Medicine and Hygiene. 56(2): 226-230.
Savio, E., Domínguez, L., Malanga, A., Quevedo, D., Saldaña, J., Camarote, C., Ochoa,
A., and Fagiolino, P. (1998) Lipid matrix of albendazole: an alternative for systemic
infections. Bollettino Chimico Farmaceutico. 137(9): 345-349.
Sawada, H., Suzuki, T., Akiyama, S., and Nakao, Y. (1990) Mechanism of the
stimulatory effect of cyclodextrins on lankacidin-producing Streptomyces. Applied
Microbiology and Biotechnology. 32: 556-559.
Schlosser, D., Irrgang, S., and Schmauder, H.-P. (1993) Steroid hydroxylation with free
and immobilized cells of Penicillium raistrickii in the presence of ß-cyclodextrin.
Applied Microbiology and Biotechnology. 1993(39): 16-20.
Seiler, K.-U., Szathmary, S. C., Huss, H.-J., De Coster, R., and Junge, W. (1990) Safety
profile and intravenous tolerance of hydroxypropyl ß-cyclodextrin after increasing
single dose. Minutes of the Fifth International Symposium on cyclodextrins. (Duchêne,
D., Ed.), pp 518-521. Editions de Santé, Paris, France.
Seow, W. K., Crouch, A. A., and Thong, Y. H. (1985) The adherence of Giardia
lamblia trophozoites to nylon fibre microcolumns: effect of temperature, fluoride,
cyanide and metronidazole. Transactions of the Royal Society of Tropical Medicine and
Hygiene. 79: 359-362.
Serfözö, J., Szabó, P., Ferenczy, T., and Tóth-Jakab, A. (1981) Renal effects of
parenterally administered methylated cyclodextrins on rabbits. Proceedings of the First
International Symposium on Cyclodextrins. (Szejtli, J., Ed.), pp 123-132. Reidel
Publishing Company, Akadémiai Kiadó, Budapest.
Shao, Z., Krishnamoorthy, R., and Mitra, A. K. (1992) Cyclodextrins as nasal
absorption promotors of insulin: Mechanistic evaluations. Pharmaceutical Research.
9(9): 1157-1163.

CHAPTER 9 __________________________________________________________________________________________________________
275
Shao, Z., Li, Y., Chermak, T., and Mitra, A. K. (1994) Cyclodextrin as mucosal
absorption promotors of insulin. II. Effects of ß-cyclodextrin derivatives on α-
chymotryptic degredation and enteral absorption of insulin in rats. Pharmaceutical
Research. 11(8): 1174-1179.
Shizuka, F., Hara, K., and Hashimoto, H. (1996) Dietary fibre-like effects of orally
administered cyclodextrins in the rat. Proceedings of the Eighth International
Symposium on Cyclodextrins. (Szejtli, J., and Szente, L., Eds.), pp 157-160. Kluwer
Academic Publishers, Budapest, Hungary.
Sideris, E. E., Koupparis, M. A., and Macheras, P. E. (1994) Effect of cyclodextrins on
protein binding of drugs: The diflunisal/hydroxypropyl-ß-cyclodextrin model case.
Pharmaceutical Research. 11(1): 90-95.
Simmons, N. A. (1991) Cryptosporidium and Giardia lamblia. Biologist. 38(4): 147-
148.
Singer, Y., Shity, H., and Bar, R. (1991) Microbial transformations in a cyclodextrin
medium. Part 2. Reduction of androstenedione to testosterone by Saccharomyces
cerevisiae. Applied Microbiology and Biotechnology. 35: 731-737.
Siundiukova, R. A., Basnak'ian, I. A., Stukalova, N. V., and Aleksakhina, N. N. (1999)
The effect of methylated cyclodextrin on pertussis toxin accumulation in a Bordetella
pertussis culture in a bioreactor. Zh. Mikrobiol. Epidemiol. Immunbiol. 6: 14-17.
Skinner-Adams, T. S., Davis, T. M. E., Manning, L. S., and Johnston, W. A. (1997) The
efficacy of benzimidazole drugs against Plasmodium falciparum in vitro. Transactions
of the Royal Society of Tropical Medicine and Hygiene. 91: 580-584.
Smith, A. L., Rego, L. P., and Williams, R. (1997) Albendazole monitoring. American
Journal of Health System Pharmacology. 54(1): 319-320.

CHAPTER 9 __________________________________________________________________________________________________________
276
Smith, J. M. (2001) Parasitic infections (Online), Available World Wide Web:
http://martin.parasitology.mcgill.ca/incidenc.htm (accessed 26/10/2001).
Smith, J. W., and Wolfe, M. S. (1980) Giardiasis. Ann. Rev. Med. 31: 373-383.
Sohal, A. K., and Arnot, D. E. (1993) Plasmodium chabaudi: a short-term in vitro
culture method and its application to chloroquine resistance testing. Experimental
Parasitology. 76: 314-317.
Sousa, M. C., Goncalves, C. A., Bairos, V. A., and Poiares-Da-Silva, J. (2001)
Adherence of Giardia lamblia trophozoites to Int-407 human intestinal cells. Clin
Diagn Lab Immunol. 8(2): 258-265.
Stella, V. J. (1996) SBE7-ß-CD, a new, novel and safe polyanionic ß-cyclodextrin
derivative: characterisation and biomedical applications. Proceedings of the Eighth
International Symposium on Cyclodextrins. (Szejtli, J., and Szente, L., Eds.), pp 471-
476. Kluwer Academic Publishers, Budapest, Hungary.
Stella, V. J., and Rajewski, R. A. (1997) Cyclodextrins: their future in drug formulation
and delivery. Pharmaceutical Research. 14(5): 556-567.
Stokkermans, T. J. W., Schwartzman, J. D., Keenan, K., Morrissette, N. S., Tilney, L.
G., and Roos, D. S. (1996) Inhibition of Toxoplasma gondii replication by dinitroaniline
herbicides. Experimental Parasitology. 84: 355-370.
Stokol, T., Randolph, J. F., Nachbar, S., Rodi, C., and Barr, S. C. (1997) Development
of bone marrow toxicosis after albendazole administration in a dog and cat. Journal of
the American Veterinary Medical Association. 210(12): 1753-1756.
Strachan, S. D., and Hess, F. D. (1982) Dinitroaniline herbicides absorb to glass.
Journal of Agricultural Food and Chemistry. 30(2): 389-391.

CHAPTER 9 __________________________________________________________________________________________________________
277
Strachan, S. D., and Hess, F. D. (1983) The biochemical mechanism of action of the
dinitroaniline herbicide oryzalin. Pesticide Biochemistry and Physiology. 20: 141-150.
Strattan, C. E. (1992) 2-Hydroxypropyl-ß-Cyclodextrin: Part II, Safety and
manufacturing issues. Pharmaceutical Technology. 1992(Feb): 52-58.
Struckmeyer, B. E., Binning, L. K., and Harvey, R. G. (1976) Effect of the
dinitroaniline herbicides in a soil medium on snap bean and soybean. Weed Science.
24(4): 366-369.
Sweetana, S., and Akers, M. J. (1996) Solubility principles and practices for parenteral
drug dosage form development. PDA Journal of Pharmaceutical Sciences and
Technology. 50(5): 330-342.
Szabó, P., Ferenczy, T., Serfözö, J., Szejtli, J., and Lipták, A. (1981) Absorption and
elimination of cyclodextrin derivatives by rabbits and rats. Proceedings of the First
International Symposium on Cyclodextrins. (Szejtli, J., Ed.), pp 115-122. Reidel
Publishing Company, Akadémiai Kiadó, Budapest.
Szathmary, S. C., Seiler, K.-U., Luhmann, I., and Huss, H.-J. (1990) Pharmacokinetic
behaviour and absolute bioavailability of hydroxypropyl ß-cyclodextrin after increasing
doses in volunteers. Minutes of the Fifth International Symposium on cyclodextrins.
(Duchêne, D., Ed.), pp 535-540. Editions de Santé, Paris, France.
Szejtli, J. (1982) Cyclodextrins and their inclusion complexes, Akadémiai Kiadó,
Budapest.
Szejtli, J. (1987) The metabolism, toxicity and biological effects of cyclodextrins.
Cyclodextrins and their Industrial Uses. (Duchêne, D., Ed.), pp 173-210. Editions de
Santé, Paris, France.
Szejtli, J. (1988) Cyclodextrin Technology, Kluwer Academic Publishers, Dordrecht.

CHAPTER 9 __________________________________________________________________________________________________________
278
Szejtli, J. (1991a) Cyclodextrins in drug formulations: Part I. Pharmaceutical
Technology International. 2: 15-22.
Szejtli, J. (1991b) Cyclodextrins in drug formulations: Part II. Pharmaceutical
Technology International. 3(3): 16-24.
Szejtli, J. (1992) The use of cyclodextrins in biotechnological operations. New trends in
cyclodextrins and derivatives. (Duchêne, D., Ed.), pp 595-623. Editions de Santé, Paris,
France.
Szejtli, J., and Sebestyén, G. (1979) Resorption, metabolism and toxicity studies on the
peroral application of the beta-cyclodextrin. Starch/Stäerke. 31: 385-389.
Szente, L. (1994) Industrial significance of lipid/cyclodextrin interactions. Proceedings
of the Seventh International Cyclodextrins Symposium, pp 13-18. Business Centre for
Academic Societies, Tokyo, Japan.
Szente, L., and Strattan, C. E. (1992) Hydroxypropyl ß-cyclodextrins, preparation and
physiochemical properties. New trends in cyclodextrins and derivatives. (Duchêne, D.,
Ed.), pp 55-96. Editions de Santé, Paris, France.
Teggi, A., Lastilla, M. G., and De Rosa, F. (1993) Therapy of human hydatid disease
with mebendazole and albendazole. Antimicrobial Agents and Chemotherapy. 37(8):
1679-1684.
Tepe, J. B., and Scroggs, R. E. (1967) Trifluralin. Analytical methods for pesticides,
plant growth regulators and food additives. (Zweig, G., Ed.), pp 527-535. Academic
Press, New York.
Testerman, T. L., McGee, D. J., and Mobley, H. L. (2001) Helicobacter pylori growth
and urease detection in the chemically defined medium Ham's F-12 nutrient mixture.
Journal of Clinical Microbiology. 39(11): 3842-3850.

CHAPTER 9 __________________________________________________________________________________________________________
279
Theodorides, V. J., Gyurik, R. J., Kingsbury, W. D., and Parish, R. C. (1976)
Anthelmintic activity of albendazole against liver flukes, tapeworms, lung and
gastrointestinal roundworms. Experientia. 32(6): 702-703.
Thompson, D. O. (1997) Cyclodextrins-enabling excipients: Their present and future
use in pharmaceuticals. Critical Reviews in Therapeutic Drug Carrier Systems. 14(1):
1-104.
Thompson, R. C. (2000) Giardiasis as a re-emerging infectious disease and its zoonotic
potential. International Journal for Parasitology. 30(12-13): 1259-1267.
Tomlin, C. (1994) The Pesticide Manual, 10th ed., Crop Protection Publications.
Topchieva, I. N., Blumenfeld, A. L., Polyakov, V. A., and Klyamkin, A. A. (1994)
Complexation between cyclodextrins and pluronics. Proceedings of the Seventh
International Cyclodextrins Symposium, pp 262-265. Business Centre for Academic
Societies, Tokyo, Japan.
Torrado, S., López, M. L., Torrado, G., Bolás, F., Torrado, S., and Cadórniga, R. (1997)
A novel formulation of albendazole solution: oral bioavailability and efficacy
evaluation. International Journal of Pharmaceutics. 156: 181-187.
Torrado, S., Torrado, S., Cadórniga, R., and Torrado, J. J. (1996a) Formulation
parameters of albendazole solution. International Journal of Pharmaceutics. 140: 45-
50.
Torrado, S., Torrado, S., Torrado, J. J., and Cadórniga, R. (1996b) Preparation,
dissolution and characterisation of albendazole solid dispersions. International Journal
of Pharmaceutics. 140: 247-250.
Townsend, L. B., and Wise, D. S. (1990) The synthesis and chemistry of certain
anthelmintic benzimidazoles. Parasitology Today. 6(4): 107-112.
CHAPTER 9 __________________________________________________________________________________________________________
280
Tzipori, S. (1983) Cryptosporidiosis in animals and humans. Microbiological Reviews.
47: 84-96.
Uekama, K., Irie, T., Otagiri, M., Hoshino, T., Yamada, Y., and Ohtani, Y. (1983)
Protective effects of cyclodextrins on the hemolysis induced with imipramine in vitro.
Membrane. 8(5): 315-321.
Uekama, K., Irie, T., Sunada, M., Otagiri, M., and Tsubaki, K. (1981) Protective effects
of cyclodextrins on drug-induced hemolysis in vitro. Journal of Pharmacobio-
Dynamics. 4: 142-144.
Ungar, B. L. P. (1990) Cryptosporidiosis in humans (Homo sapiens). Cryptosporidiosis
in Man and Animals. (Dubey, J. P., Speer, C. A., and Fayer, R., Eds.), pp 59-82. CRC
Press, Inc., Boston.
Upadhyaya, M. K., and Nooden, L. D. (1978) Relationship between the induction of
swelling and the inhibition of elongation caused by oryzalin and colchicine in corn
roots. Plant and Cell Physiology. 19(1): 133-138.
Upton, S. J. (2001) Basic biology of Cryptosporidium (Online), Available World Wide
Web: http://www.ksu.edu/parasitology/basicbio (accessed 25/10/2001).
Upton, S. J., and Current, W. L. (1985) The species of Cryptosporidium (Apicomplexa:
Cryptosporidiidae) infecting mammals. Journal of Parasitology. 71: 625-629.
Upton, S. J., Tilley, M., and Brillhart, D. B. (1995) Effects of select medium
supplements on in vitro development of Cryptosporidium parvum in HCT-8 cells.
Journal of Clinical Microbiology. 33: 371-375.
Valois, M. E., Takayanagui, O. M., Bonato, P. S., Lanchote, V. L., and Carvalho, D.
(1994) Determination of albendazole metabolites in plasma by HPLC. Journal of
Analytical Toxicology. 18: 86-90.

CHAPTER 9 __________________________________________________________________________________________________________
281
Vaution, C., Hutin, M., Glomot, F., and Duchêne, D. (1987) The use of cyclodextrins in
various industries. Cyclodextrins and their Industrial Uses. (Duchêne, D., Ed.), pp 297-
350. Editions de Santé, Paris, France.
Walker, M. J., Montemagno, C., Bryant, J. C., and Ghiorse, W. C. (1998) Method
detection limits of PCR and immunofluorescence assay for Cryptosporidium parvum in
soil. Applied and Environmental Microbiology. 64: 2281-2283.
Waller, P. J. (1990) Resistance in nematode parasites of livestock to the benzimidazole
anthelmintics. Parasitology Today. 6(4): 127-129.
Weber, J. B., and Monaco, T. J. (1972) Review of the chemical and physical properties
of the substituted dinitroaniline herbicides. Proceedings, Southern Weed Science
Society. 25: 31-37.
Wells, F. I., and Aulton, M. E. (1988) Preformulation. Pharmaceutics: The Science of
Dosage form and Design. (Aulton, M. E., Ed.), pp 223-253. Churchill Livingstone,
Melbourne.
Wen, H., New, R. R. C., Muhmut, M., Wang, J. H., Wang, Y. H., Zhang, J. H., Shao, Y.
M., and Craig, P. S. (1996a) Pharmacology and efficacy of liposome-entrapped
albendazole in experimental secondary alveolar echinococcosis and effect of co-
administration with cimetidine. Parasitology. 113(part 2): 111-121.
Wen, H., Wang, J. H., Shao, Y. M., Yang, W. G., Rouge, N., and Craig, P. S. (1996b)
Experimental studies on efficacy of liposomes entrapment of albendazole and effect of
cimetidine co-administration against alveolar and cystic echinococcosis. American
Journal of Tropical Medicine and Hygiene. Abstracts: 184.
Wen, H., Zhang, H. W., Muhmut, M., Fou, P. F., New, R. R. C., and Craig, P. S. (1994)
Initial observation on albendazole in combination with cimetidine for the treatment of
human cystic echinococcosis. Annals of Tropical Medicine and Parasitology. 88(1): 49-
52.

CHAPTER 9 __________________________________________________________________________________________________________
282
White, N. J. (1996) The treatment of malaria. The New England Journal of Medicine.
335(11): 801-806.
Whittaker, S. G., and Faustman, E. M. (1991) Effects of albendazole and albendazole
sulphoxide on cultures of differentiating rodent embryonic cells. Toxicology and
Applied Pharmacology. 109(1): 73-84.
Whittaker, S. G., and Faustman, E. M. (1992) Effects of benzimidazole analogs on
cultures of differentiating rodent embryonic cells. Toxicology and Applied
Pharmacology. 133(1): 144-151.
Williams, J. C. (1997) Anthelmintic treatment strategies: current status and future.
Veterinary Parasitology. 72: 461-477.
Winstanley, P. A. (2000) Chemotherapy for falciparum malaria: the armoury, the
problems and the prospects. Parasitology Today. 16(4): 146-153.
Wolfe, M. S. (1978) Giardiasis. Medical Intelligence. 298(6): 319-321.
Wolfe, M. S. (1992) Giardiasis. Clinical Microbiological Reviews. 5(1): 93-100.
Woods, K. M., Nesterenko, M. V., and Upton, S. J. (1995) Development of a microtitre
ELISA to quantify development of Cryptosporidium parvum in vitro. FEMS
Microbiology Letters. 128: 89-94.
World Health Organization (1997) Resistance to antimicrobial agents. Weekly
Epidemiological Record. 72(45): 333-336.
World Health Organization (2000a) Malaria. Weekly Epidemiological Record. 75(29):
233-240.

CHAPTER 9 __________________________________________________________________________________________________________
283
World Health Organization (2000b) Malaria - Economic implications. Weekly
Epidemiological Record. 75(39): 313-320.
World Health Organization (2000c) Malaria interventions. Weekly Epidemiological
Record. 75(38): 305-312.
World Health Organization (2001) Malaria risk for travellers to Africa. Weekly
Epidemiological Record. 76(4): 25-32.
Wurtman, J. J., and Wurtman, R. J. (1979) Sucrose consumption early in life fails to
modify the appetite of adult rats for sweet foods. Science. 205(4403): 321-322.
Yalkowsky, S. H. (1999) Solubility and Solubilization in Aqueous Media, Oxford
University Press, New York.
Yamamoto, M., Aritomi, H., Irie, T., Hirayama, F., and Uekama, K. (1990)
Pharmaceutical evaluation of branched ß-cyclodextrins as parenteral drug carriers.
Minutes of the Fifth International Symposium on cyclodextrins. (Duchêne, D., Ed.), pp
541-544. Editions de Santé, Paris, France.
Yang, Y.-S., and Fung, K.-F. (1991) Preparation of albendazole liposomes and its effect
on Fasciola hepatica in goats. The 5th Congress of the European Association for
Veterinary Pharmacology and Toxicology. (Friis, C., Gyrd-Hansen, N., Nielsen, P., and
Rasmussen, F., Eds.), pp 406-407. Fredericksburg, Denmark, Copenhagen, Denmark.
Yoshida, A., Arima, H., Uekama, K., and Pitha, J. (1988) Pharmaceutical evaluation of
hydroxyalkyl ethers of ß-cyclodextrins. International Journal of Pharmaceutics. 46:
217-222.
You, X., Arrowood, M. J., Lejkowski, M., Xie, L., Schinazi, R. F., and Mead, J. R.
(1996) A chemiluminescence immunoassay for evaluation of Cryptosporidium parvum
growth in vitro. FEMS Microbiology Letters. 136: 251-256.

CHAPTER 9 __________________________________________________________________________________________________________
284
Zhong, H., Cao, W., Rossignol, J. F., Feng, M., Hu, R., Gan, S., and Tan, W. (1986)
Albendazole in nematode, cestode, trematode and protozoan (Giardia) infections.
Chinese Medical Journal. 99(11): 912-915.
Zhu, J., Yang, Y., and Botha, S. A. (1995) Polymorphism in albendazole: preparation,
identification and characterisation. Pharmaceutical Research. 12: S-199.
Zia, V., Rajewski, R. A., and Stella, V. J. (2001) Effect of cyclodextrin charge on
complexation of neutral and charged substrates: comparison of (SBE)7M-β-CD and HP-
β-CD. Pharmaceutical Research. 18(5): 667-673.
CHAPTER 10 __________________________________________________________________________________________________________
285
CHAPTER 10. APPENDIX

CHAPTER 10 __________________________________________________________________________________________________________
286
10.1. BIOCHEMICALS
ABZ, ABSO, ABSO2 and Valbazen (drench, 19 mg kg-1) were from SmithKline
Beecham, TF and OZ were from Alltech. BAB was from Curtin University, Perth, WA.
HPβCD was from Wacker-Chemie, (Germany) with a molar substitution of 0.71 and an
average molecular mass of 1423.26. All solvents were analytical and chromatographic
grade.
Product Supplier Acetonitrile EM Science and Burdick and Jackson Aerosil Western Stock Distributors 4-aminobenzoic acid ICN Biochemicals Amphotericin Trace Biosciences Ampicillin Commonwealth Serum Laboratories Ascorbic acid Sigma Chemical Company Calcium pantothenate ICN Biochemicals Citric acid APS Chemicals Chromic acid (glassware cleaning) APS Chemicals Cysteine-hypochloride monohydrate Calbiochem CytoTox 96® Promega Biosate Baltimore Biological Laboratory Dehydrated bovine bile Sigma Chemical Company Dichloromethane Row Scientific DMSO (Dimethyl sulfoxide) Ajax Chemicals Di-potassium hydrogen orthophosphate Ajax Chemicals di-sodium hydrogen orthophosphate Ajax Chemicals Ethanol Biolab Scientific Ferric ammonium citrate British Drug House Chemicals FBS (foetal bovine serum) Life Technologies Ficoll Pharmica Biotech AB Folic acid ICN Biochemicals formaldehyde Western Stock Distributors Formic Acid Ajax Chemicals Gentamycin Sigma Chemical Company Glycerol Ramprie Laboratories D-Glucose Ajax Chemicals Glutamine Sigma Chemical Company Halothane Laser Animal Health, Australia HBSS (Hank’s balanced salt solution) Flow Laboratories Heparin DBL Laboratories HEPES BDH Laboratory Supplies HEPES (1M) Sigma R-6504
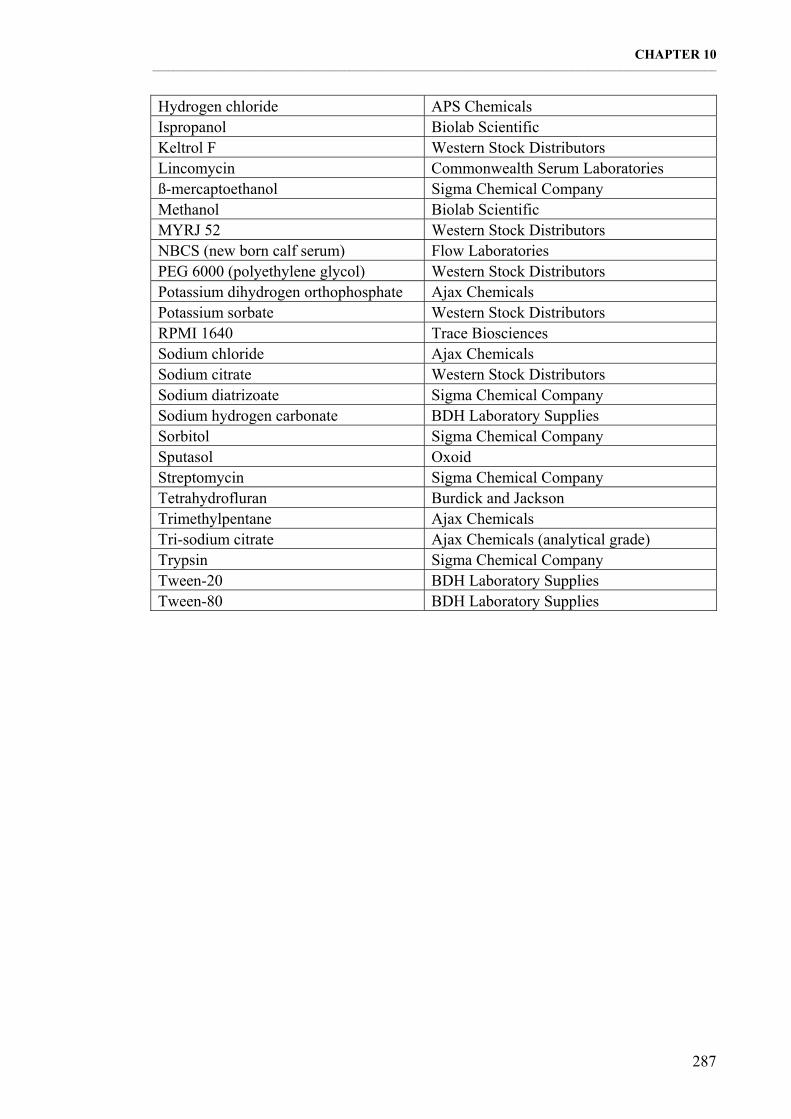
CHAPTER 10 __________________________________________________________________________________________________________
287
Hydrogen chloride APS Chemicals Ispropanol Biolab Scientific Keltrol F Western Stock Distributors Lincomycin Commonwealth Serum Laboratories ß-mercaptoethanol Sigma Chemical Company Methanol Biolab Scientific MYRJ 52 Western Stock Distributors NBCS (new born calf serum) Flow Laboratories PEG 6000 (polyethylene glycol) Western Stock Distributors Potassium dihydrogen orthophosphate Ajax Chemicals Potassium sorbate Western Stock Distributors RPMI 1640 Trace Biosciences Sodium chloride Ajax Chemicals Sodium citrate Western Stock Distributors Sodium diatrizoate Sigma Chemical Company Sodium hydrogen carbonate BDH Laboratory Supplies Sorbitol Sigma Chemical Company Sputasol Oxoid Streptomycin Sigma Chemical Company Tetrahydrofluran Burdick and Jackson Trimethylpentane Ajax Chemicals Tri-sodium citrate Ajax Chemicals (analytical grade) Trypsin Sigma Chemical Company Tween-20 BDH Laboratory Supplies Tween-80 BDH Laboratory Supplies