Embed Size (px)
Citation preview

HAL Id: hal-00407504https://hal.archives-ouvertes.fr/hal-00407504
Submitted on 17 Aug 2009
HAL is a multi-disciplinary open accessarchive for the deposit and dissemination of sci-entific research documents, whether they are pub-lished or not. The documents may come fromteaching and research institutions in France orabroad, or from public or private research centers.
L’archive ouverte pluridisciplinaire HAL, estdestinée au dépôt et à la diffusion de documentsscientifiques de niveau recherche, publiés ou non,émanant des établissements d’enseignement et derecherche français ou étrangers, des laboratoirespublics ou privés.
Assessment of structural and transport properties infibrous C/C composite preforms as digitized by X-ray
CMT. Part II : Heat and gas transportGerard L. Vignoles, Olivia Coindreau, Azita Ahmadi, Dominique Bernard
To cite this version:Gerard L. Vignoles, Olivia Coindreau, Azita Ahmadi, Dominique Bernard. Assessment of structuraland transport properties in fibrous C/C composite preforms as digitized by X-ray CMT. Part II : Heatand gas transport. Journal of Materials Research, Cambridge University Press (CUP), 2007, 22 (6),pp.1537-1550. �10.1557/jmr.2007.0216�. �hal-00407504�

1
Assessment of geometrical and transport properties of a fibrous C/C composite preform as
digitized by x-ray computerized micro-tomography. Part II: Heat and gas transport properties
Gerard L. Vignoles°*, Olivia Coindreau°, Azita
Ahmadi$, Dominique Bernard#
° Laboratoire des Composites ThermoStructuraux (LCTS),
UMR 5801 CNRS-Université Bordeaux 1 – CEA – Snecma,
Université Bordeaux 1,
F 33600 Pessac, France
*corresponding author, [email protected]
$ Transport, Ecoulements Fluides, Energétique (TREFLE),
UMR 8508 CNRS-ENSAM-ENSCPB-Université Bordeaux 1,
F 33405 Talence Cedex, France
# Institut de Chimie de la Matière Condensée de Bordeaux (ICMCB),
UPR 9048 CNRS,
F 33608 Pessac Cedex, France
J. Mater. Res. vol. 22 n°6 (2007), pp. 1537-1550.

2
LIST OF SYMBOLS
LATIN
Symbol Signification Unit a Sub-sample edge length m ; µm
b Closure variable m
B Permeability m2 ; µm2
dp Pore diameter m ; µm
D Diffusion coefficient m2.s-1
f,F Closure variables m, m2
G Image greyscale value -
Id Identity tensor -
M Corrective constant in eq. (12) -
N Distribution number -
n Normal vector
P Pressure Pa
Kn Knudsen number -
Q Auxiliary variable, see eq. (16)
v Velocity m.s-1
GREEK
Symbol Signification Unit
Characteristic exponent for tortuosity-porosity
correlations
-
Porosity (volume fraction) -
Tortuosity factor -
Thermal conductivity W.m-1.K-1
µ Viscosity Pa.s
Density kg.m-3
fi Fibre volume fraction -
Any material property
Space domain [m3]

3
SUPERSCRIPTS AND UNDERSCRIPTS
Symbol Signification
< > • Intermediate-scale average
< > • Porosity-distribution-based average
< > • f Intrinsic fluid average
{ } • Large-scale average
•lim Limiting value
•ref Reference
•eff Effective value
•b Relative to binary diffusion
•f Relative to fluid phase
•fi Relative to fibre
•fs Relative to fluid-solid interphase
•gas Relative to gas phase
•p Relative to percolation threshold
•pyC Relative to pyrocabon
•s Relative to solid phase
•v Relative to viscous flow
•x, y or z Relative to x, y or z direction
•0 Initial state
•// Relative to parallel direction
• Relative to perpendicular (transverse) direction

4
Abstract
Raw and partially infiltrated carbon-carbon composite preforms have been
scanned by high-resolution synchrotron radiation x-ray computerized micro-
tomography (CMT). Three-dimensional (3D) high-quality images of the pore space
have been produced at two distinct resolutions and have been used for the
computation of transport properties: heat conductivity, binary gas diffusivities,
Knudsen diffusivities, and viscous flow permeabilities. The computation procedures
are based on a double change-of-scale strategy suited to the bimodal nature of pore
space, and on the local determination of transport anisotropy. Good agreement has
been found between all calculated quantities and experimental data.
Key words
Thermal conductivity, diffusion, X-ray tomography
1 Introduction
Thermostructural composites are characterized by their ability of operating
under high mechanical stresses and high temperature (above 1000 °C), such as in
spatial propulsion systems or aircraft brake disks. They are made of carbon or
ceramic fibres (SiC, Al2O3…) linked together by a carbon or ceramic matrix. The
association of these two brittle components leads to a material with pseudo-plastic
mechanical behaviour. They are manufactured, among other processes, by chemical
vapour infiltration (CVI): a heated fibrous preform is infiltrated by the chemical
cracking of a vapour precursor of the matrix material inside its pore space [1, 2].
The final quality of materials fabricated by CVI relies on processing conditions

5
(such as vapour precursor concentration, temperature and pressure), as well as on
geometrical, gas and heat transport properties of the preform. This rather expensive
process has a strong need for model-based optimization, either in isothermal or in
thermal-gradient process modifications. Numerous previous works have shown the
crucial importance of adequate structural models in the quality of the modelling
procedures [3-9]. In addition to these process-related issues, thermal characteristics
of these composites are also of great interest: in some cases (braking, re-entry into
the atmosphere…) they are as important as their mechanical or chemical properties.
The aim of the present work is to provide for fibrous carbon/carbon (C/C)
composites estimates of such properties based on accurate 3D representations
obtained by x-ray computerized micro-tomography (CMT). In a previous study, it
was demonstrated that geometrical properties of the composite preform could be
determined from such images [10]. In this companion paper, the same 3D images
are used to assess heat and gas transport properties.
Experimental determination of heat [11-13] and gas [14-15] transport
properties of thermostructural composites can be performed. However, this
characterization has to be undertaken each time a new material is produced.
Moreover, measuring the effective diffusivity of porous media is still a challenging
task [15]. To complete these approaches, numerous works have been performed to
compute thermal conductivity [16-19], diffusivity [20-22] and permeability [23-25]
of ideal media such as regular or random arrays of cylinders. However, real
composites exhibit a much more complex structure. In this paper, 3D CMT images
are directly used to compute the transport properties of a preform at different stages
of densification with the aim of performing direct comparisons either with
experimental data, or with known model results.

6
In high-resolution images, carbon fibres can be seen in details whereas low-
resolution images enable us to view components of the fibrous reinforcement (yarns
and needlings). Our computational method, described in the next paragraph, makes
use of low-resolution images to compute thermal conductivity, gas diffusivity and
permeability of the material. High-resolution images are also used to determine the
local arrangement of fibres inside yarns, and to compute diffusivity-porosity
relations. Results related to each property are presented and discussed in the last
section.
2 Experimental study
A thorough description of the material studied here can be found in our
previous paper [10]. It is a C/C composite, provided by Snecma Propulsion Solide,
Le Haillan, France. The preform weave layers are stacked horizontally (x – y plane).
Then, harpoon-shaped needles are used to punch these cloth stacks: as a
consequence, fibres are broken and partially transferred in the z direction. The
stacks are now held together by needlings. The volume fraction of fibres is about
30%, and 4% lie in z direction. The diameter of carbon fibres is about 8 µm. The
yarn, less than 1 mm in diameter, is made up of the gathering of a large number of
fibres. In this study, pores inside a yarn will be referred to as micro-pores while
pores between yarns will be called macro-pores. Thus, there are two scales of
heterogeneity to take into account in order to assess correctly the properties of the
preform.
Three samples were extracted from the preform at different stages of
densification. The first one, CC0, was taken from the raw preform. Its bulk density,
obtained by weighing and measuring the sample, is 470 kg.m-3, and the

7
corresponding porosity is 73%. Two other samples were taken after the preform was
partially infiltrated. Owing to the fabrication process (isothermal isobaric CVI), the
core of the preform is more porous than its borders.
The samples, extracted at different depths, have consequently distinct
characteristics. CC1 has a bulk density of 770 kg.m-3 (corresponding to 58%
porosity) and CC2 a bulk density of 1520 kg.m-3 (corresponding to 20% porosity).
The samples were embedded in organic resin and manufactured so as to image them
at two different resolutions (high and low), and view the two scales of porosity. In
addition to these samples, another sample with an infiltration level intermediate
between CC1 and CC2 (giving a 35% porosity) has been imaged only at low
resolution. It will be referred to as CC1b.
The interested reader is referred to the preceding paper [10] for a detailed
description of the experimental procedure featuring sample preparation and
synchrotron x-ray CMT acquisition at European Synchrotron Radiation Facility
(ESRF, Grenoble). Images used in this study are high and low-resolution images
(effective voxel size equal respectively to 0.7 and 7.46 µm). Figure 1 is an example
of the results obtained for sample CC1.
3 Computational methods
3.1 Double change of scale strategy
Due to the fabrication process (gathering of a large number of fibres in yarn
and then arrangement by weaving and needling of these yarns), the preform exhibits
two scales of heterogeneity. High-resolution images enable us to view small-scale
details [at the scale of the yarn, see Fig. 1(b)] whereas large-scale patterns can be
fully captured in low-resolution images [see Fig. 1(a)]. Geometrical assessments

8
[10] strongly support such an evidence, at least for partially infiltrated samples.
Since low-resolution images only provide information on large-scale properties (i.e.,
at Representative Elementary Volume (REV) size), small-scale information has to
be integrated into it. This is the first change of scale: its procedure, schematised in
Fig. 2, consists in determining the local properties of the high-resolution image by
dividing it into cubic sub-samples of edge length a (variable parameter). Porosity,
fibre orientation and then transport properties inside each sub-sample are
determined. The results are cast into expressions relating the transverse and parallel
properties to the local porosity. The second change of scale consists in computing
the effective properties (thermal conductivity, gas diffusivity and permeability) of
the low-resolution image from a field of small-scale properties by the method of
volume averaging (see Fig. 3). The procedure starts from the subdivision of the low-
resolution images into sub-images; then, inside every sub-image, an evaluation of
porosity and local fibre orientation is performed. Then, local property tensors may
be affected to every sub-image; they may come either from the results of the first
change of scale, or from analytical models.
This strategy is suggested by the following argument: in a macro-scale
image, there exists a distribution of porosity N()d, that may be assessed by means
of image analysis. If some property is known to be correlated to porosity by a
relation = (), a porosity-average of the property is given by:
1
0
dN (1)
Then, the proposed procedure is a mere extension of this simple averaging by taking
into account the true space distribution of porosity, as sampled at macro-scale. The

9
hypothesis that is taken here is that the porosity-property correlation is correctly
sampled at micro-scale and directly transposable for macro-scale computations.
The double change of scale procedure is suggested for the computation of
effective properties of the fibrous preform at the beginning of the densification
process (sample CC0 and CC1 with respective porosities 73% and 58%). In the
latter stages of densification, a simple change of scale procedure for the computation
of gas transport properties is proposed (samples CC1b and CC2 with respective
porosities 35% and 20%). Indeed, in such a case, the micro-pores are quite sealed
off by the deposition reaction, so that they may be safely disregarded.
3.2 Determination of local porosity
Six sub-samples, 2103 voxels (i.e., 1.63 mm3) in size, have been selected,
three of them in the tomographic low-resolution image of CC0 and the three other
ones in the low-resolution image of CC1. Each sub-sample has been subdivided into
cubic sub-sub-samples of 6 voxels edge size (i.e., 0.045 mm3), the porosity of which
has to be determined. The tomographic image is a 3D reconstruction of the
absorption coefficient of the material traversed by the x-ray beam. Therefore, the
grey level of each voxel is a linear combination of the average grey level of each
individual component of the material. Let G1 be the grey level associated to void
space, and G2 the grey level of the carbon components (fibre or deposit). Then, the
average grey level <G>i of the ith sub-sample of porosity i is:
1 2 (1 ) i i iG G G (2)
Finally, a proportionality relationship is given between the average grey level of the
sub-sub-sample and its porosity:
2
1 2 1 2
1i i
GGG G G G
(3)

10
However, there is a phase contrast phenomenon [26] which makes this law not
exactly true. Moreover, we have assumed that the grey level was the same for all
carbon-containing components, which is not strictly the case, as their densities are
indeed somewhat different [27]. Instead of using Eq. (3), we have determined, in an
image of 500 voxels edge length, the threshold greyscale value Gt that leads to a
binary image whose porosity matches the experimentally determined value. Then,
the porosity i of each sub-image of 6 voxels edge length has been determined by a
thresholding operation at greyscale level Gt. A linear correlation has finally been
established between i and the average value of the greyscale level <G>i of the sub-
image.
Using these correlations, the porosity of each sub-sub-sample inside low-
resolution images of CC0 and CC1 has been calculated. The mean pore volume
fraction of the whole sub-samples (210 voxels edge length) are 72.7, 73.6, and
73.4% for CC0 and 60.6, 58.7, and 55.3% for CC1, in agreement with
measurements (73 ± 1.5% for CC0 and 58 ± 2% for CC1). The scatter of pore
fraction values indicates that the sub-samples are not large enough to be
representative, particularly for CC1. Consequently, the effective property of the
composite will be assessed by averaging the values determined in the three sub-
samples.
3.3 Determination of local fibre orientation
The second geometrical property that is crucial in the computational
procedures is the local orientation of the fibres. This issue has been addressed with
an original method based on a random-walk algorithm sensitive to the local
anisotropy. Details are given in the first part of this article [10]. Each cubic region of
6 voxels edge length was arbitrarily thresholded to 50% pore fraction and random

11
walkers were allowed to travel in the “fluid” phase until the covariance matrix of the
centred displacements, divided by twice the walk time, converges to a pseudo-
diffusion tensor. The eigenvector associated to the largest eigenvalue indicates the
direction of preferred diffusion, which is assimilated to the local fibre orientation.
The validity of the method has been checked by quantifying the proportion of fibres
lying in the x, y and z orientation. The proportion detected by our method is in good
agreement with values established otherwise [28].
3.4 First change of scale by direct computation
Once the porosity and the fibre orientation inside each sub-sub-sample of 6
voxels edge length have been computed, the next step consists in determining
effective transport properties from each sub-sample by homogenisation.
3.4.1. Determination of local gas transport properties
Computations make use of a random-walk algorithm described by Vignoles
[29]. It is indeed a homogenisation procedure since the effective property is
computed over walks the size of which is much larger than one single image. When
a walker crosses an image border, it is reintroduced in the opposite border. Another
way to describe the method is the following: consider that the space is paved by
repetition of the elementary image. At t = 0, all walkers are placed randomly in the
fluid phase of an elementary image located at the space origin: thus the initial
average concentration field is (up to some noise due to the finite number of walkers)
a hat-function. The random walk provides a numerical Lagrangian solver for the
classical unsteady diffusion problem represented by Fick’s second law, subject to
the above mentioned initial condition and to boundary conditions of null
concentration at infinite distances. The diffusion coefficient that arises from the
convergence of the covariance matrix is also an inverse identification of the

12
analytical Gaussian solution in the limit of large spreading (i.e., such that the initial
hat-function is considered as a Dirac impulse distribution).
There are three diffusion regimes depending on the Knudsen number Kn,
which is the ratio between the mean free path of the molecules and the pore
diameter: the ordinary (continuum) regime (Kn << 1), the transition regime (Kn ~1)
and the Knudsen regime (Kn >> 1). The random walk performed by the molecules
introduced in the void space of the porous medium is directly linked to the Knudsen
number and allows one to determine the effective diffusivity tensor D at any value
of Kn.
The numerical procedure, applied with 10,000 walkers over 20,000 voxel-
long walks (the image edge size was 141 voxels) has been validated in comparison
with analytical results [16] in bulk diffusion regime for square and hexagonal
regular arrays of parallel cylinders, and by comparing with numerical results in
Knudsen regime for a square array of parallel cylinders [22] with differences inferior
to 5% in all cases, the worst ones lying close to the percolation threshold.
Results are shown in Figs. 4 and 5 in terms of tortuosities for Knudsen and
ordinary transport in transverse direction. Tortuosity is defined by:
1refD D (4)
where refD is a reference diffusivity, corresponding to the longitudinal diffusivity in
a capillary the diameter of which is equal to the mean pore diameter. This reference
value is computed using the Bosanquet formula [30]. When Kn has appreciable
values, refD depends on an assessment of the pore diameter, which is available in
the images as shown previously [10].
The results are then collected together in a porosity-transport property
correlation [31]. To do so, gas diffusivity has been evaluated in a large number of

13
sub-images within the high-resolution 3D images of CC0 and CC1 (respectively
384 for sample CC0 and 1176 for sample CC1). These high-resolution sub-samples
have nearly the same physical size as the sub-samples in the low-resolution images
(i.e., ~0.05 mm3) so that correspondence between the microscopic correlation
established from these extracts and the property of the sub-samples is valid.
The simulated longitudinal and transverse tortuosity of each sub-sample can
be modelled in the form suggested by Tomadakis and Sotirchos [32], which is an
extension of Archie’s law:
0limi
pi i
p
(5)
Using a unit initial porosity, the identified coefficients for continuum and rarefied
limits in parallel and transverse direction are shown in Table I. In all cases the
parameter fitting has been satisfactory, as indicated by the values of the R2
correlation coefficient on Table I. It is worth to compare them with predictions for
ideal media like 1D, 2D, and 3D random overlapping fibre arrangements [32,21],
and regular arrays in the bulk diffusion regime [16] (Note that estimates in Knudsen
regime cannot be cast into the form of Eq. (5) because of the “infinite horizon
effect” that would yield an infinite value for refD ). Table I shows that the
percolation porosity matches well the situation for 3D random fibre arrangements.
The tortuosity limits in Knudsen regime lie between values for 1D and 3D random
arrangements, and the characteristic exponent is close to the value for a 1D random
arrangement. In the bulk diffusion regime, the limit tortuosity differs from all ideal
predictions by only 9%; on the other hand, the characteristic exponent is neatly
lower than all values for random media and higher than values for regular 1D arrays.

14
However the estimates for the regular arrays using Eq. (5) are not very accurate with
respect to the original formulae.
From Figs. 4 and 5 and Table I, it is seen that there is not a large difference
between samples CC0 and CC1 in Knudsen transport. On the other hand, for binary
diffusion, an apparently more marked difference appears between samples CC0
(very similar to a 1D random arrangement) and CC1 (much closer to a 3D random
arrangement). However, the ordinate scale is linear in Fig. 5, while it is logarithmic
for Knudsen diffusion (Fig. 4), denoting a much larger sensitivity to fibre
arrangement in the latter regime.
3.4.2. Verification of the locally orthotropic character
The computational results yield three values of tortuosity, the lowest being
close to 1 and defining the direction parallel to fibres, and the other two related to
the perpendicular direction. These two values should be equal if the medium were
locally orthotropic, but it is generally not the case. The error made when one
considers the medium as orthotropic is quantified by the relative difference of these
two values :
2
Error x y
x y
(6)
Figure 6 is a histogram plot of the distribution of this error. It appears that sample
CC0 is very close to obey orthotropy, especially for continuum diffusion (the error
average is 5%), and to a lesser extent for Knudsen diffusion (average error 22%); on
the other hand, the discrepancy is stronger for CC1: 16% average error for binary
transport, and 72% average error for Knudsen diffusion. However, this has not a
strong influence on further computations, since the anisotropy ratio is much larger
than this relative difference.

15
3.4.3. Computation of the viscous flow permeabilities
The values of the permeabilities are obtained from micro-scale images by an
averaging technique, performing a Stokes-Darcy change of scale. At low Reynolds
numbers, it is sufficient to describe the fluid movement by Stokes equations:
2 0 in 0 in
0 on
f
f
fs
P
vv
v (7)
Either by homogenization [33-34], or volume averaging [35], the
macroscopic behaviour is proved to have the following form [36]:
eff1
0fB P
v
v (8)
where effB is the mesoscopic permeability tensor (m2). Eq. (8) is the well-known
Darcy law [37]. The numeric value of the permeability tensor may be attained as an
average of a closure tensor F:
effB F f (9)
where F, together with another vector closure variable f, satisfies the following
problem [38]:
2f
f
fs
in . 0 in
= 0 on
= 0 + periodic B.C.'s for and
F IdF
F
F
f =
ff
f
(10)
The resolution has been implemented in a finite-volume solver [39-40],
using an artificial compressibility transient scheme.
It has not been possible to perform as many computations as for diffusion,
because the large size of the sub-samples required too much computer memory;

16
rather, it has been chosen to select some sub-samples and correlate permeabilities to
existing expressions. Of particular interest is the correlation with effective binary
diffusivities suggested by Johnson et al. [41] and Tomadakis & Robertson [42]. If
one defines viscous flow tortuosity v
as:
2
eff 1
32p
v
dB (11)
Then, summarizing the theory of Johnson [41], the permeability-diffusivity
correlation is given by the simple formula:
2
, ,,
ln1
lnb i b i
v i M
(12)
where M is a constant close to 1. Recalling the extended Archie’s law result
[Eq. (5)], one has the following prediction:
2
, ,, 1b i b i
v ipM
(13)
The best found value for M in perpendicular direction is 0.95. Figure 7 is a
plot of the tortuosities in perpendicular direction predicted with Eq. (13) against the
value computed directly. Even though some scatter is present, the agreement is
satisfactory on a broad enough tortuosity range. On the other hand, results in parallel
direction are somewhat underestimated through this method; they match more
satisfactorily the correlations given by van der Westhuizen and Du Plessis [25] and
by Tomadakis and Robertson [42] for random arrays of nonoverlapping parallel
cylinders, as illustrated in Fig. 8. Also reported is the Kozeny relationship identified
by Gutowski et al. [43], with a less satisfactory agreement.

17
3.5 First change of scale from ideal media: local thermal conductivity
Heat conduction in carbon/carbon composites is strongly related to the
precise nature of the carbon-based components (carbon fibre and pyrocarbon
deposit), as well as to the gas. The thermal conductivity of carbon fibres is not easy
to measure and is a subject of research [44-45]. In lack of precise measurements, we
will refer to studies conducted by Sauder [46], who deduced from electrical
resistivity measurements the longitudinal conductivity of carbon fibres. According
to Jumel et al. [47], the thermal conductivity of carbon fibres lies between 4 and
10.5 W.m-1.K-1. A value of 5 W.m-1.K-1 has been retained for this study. The values
determined by Jumel et al. [47,48] for the pyrocarbon deposit have been used.
However, it is worth mentioning that there is a great variety of pyrocarbons, with
different nanotextures and consequently various thermal properties. The values
taken for this work are summarized in Table II. Of course, the gas thermal
conductivity is markedly lower than all other values, and its possible variation with
pressure and temperature may be safely neglected.
It appears immediately that the heat conductivity of the solid phases is
strongly anisotropic; moreover, the pyrocarbon deposit displays a cylindrical
symmetry: this renders extremely difficult a direct simulation from CMT images,
since the central axis of every fibre should be determined before assigning a local
value of the heat conductivity to any voxel. So, it has been decided to provide a
somewhat less satisfactory but readily feasible estimation based on a square array of
parallel cylinders. The periodic unit cell is described in Fig. 9.
The longitudinal conductivity ,//i of the ith cell is directly given in analytical
form by a law of mixtures (for conductances in parallel), where ,fi i is the fibre
volume fraction:

18
,// , ,// , ,//(1 )i i gas fi i fi i fi i pyC (14)
At the raw state (sample CC0), the material is only made of fibres and pores
so that ,fi i is simply 1 i . When the material is partially infiltrated, the local
fibre fraction can be deduced from the local porosity by using the following
proportionality relation:
, 1 fifi i i
s
(15)
where fi is the average fibre fraction in the material and s the average
solid fraction. The ratio between these two values is about 0.643 for CC1.
For the transverse conductivity of CC0, the following analytic equation of
Perrins et al. [16] is suitable:
, ,,4 8
,, ,, 82
,
2 11 with
10.305827 0.013362
1.402958
fi i fi gasi
gas fi gasfi i fi ifi i
fi i
QQQ
(16)
For CC1, constituted of three phases, the situation is more difficult. To partially
circumvent this, the transverse conductivity of a square array of cylinders covered
by an anisotropic deposit [see Fig. 9(a)] has been computed. The radius taken for the
cylinders is 3.98 µm and the deposit thickness 2.6 µm (values assessed in [10] and
confirmed by SEM micrographs). Computations have been performed for volume
fraction of fibres lying between 0 and the percolation threshold for such an
arrangement (i.e., 78.5%). The flux/force correlation method [49-50], solved by a
finite element software package, has been used. The results established for CC1
follow Eq. (16) if ,fi i lies below a given threshold ,fi t , and in the converse case is:
2
, ,, ,
-0.0141 143.1 137.9 -12.8 fi fi i i
fi i fi t
(17)

19
Expressions (16) and (17) are plotted at Fig. 10(a). They are converted into a
porosity-conductivity correlation for CC1 as plotted at Fig. 10(b).
3.6 Second change of scale: Computation of “large scale” properties
3.6.1 Strategy
The second change of scale consists in determining the effective property in
large-scale images, the size of which is broad enough to ensure adequate
representation of the whole porous medium. Whatever the property, this is computed
by the same method, since all integrated expressions have the same flux-force
formalism.
Details of the application of the volume averaging method [35] to the
process of heat conduction in two- and three-phase systems is described in [51]. In
their work, focused on the first change of scale, spherical conductivity tensors are
considered for each phase. However, the change of scale procedure for another
diffusive process, namely the single phase flow in heterogeneous porous media
(two-region media and heterogeneous porous media with continuously varying
properties), leads to similar results in which the permeability tensors considered are
not necessarily spherical [52]. The extension of their results to multi-region models
is rather straightforward. In all the works cited above the averaging process and the
closure is based upon an equilibrium assumption, assuming that a single large-scale
equation, therefore a single large-scale effective property, is sufficient for a correct
macroscopic description of the phenomena.
The averaging process [53] leads to the following closure problem:

20
: 0 on , 1,...
on
on 1 d 0
+ periodic B.C.'si
i ii
ij i ij j iji i j j
i j ij
ii
i n
V
b
n b n b
b b
b b
(18)
where is the large-scale averaging volume composed of n regions (i, i =
1,..,n). The tensor i is the conductivity tensor for the ith region (i), bi is the closure
variable defined in i. The interface between regions i and j is denoted ij. The
large-scale average of a quantity is defined as
dv1 (19)
The effective conductivity tensor is given explicitly as a function of the
closure variable b and local conductivities resulting from the first change of scale:
~* : b (20)
Where ~ is the conductivity deviation resulting from the decomposition of the
local conductivity as ~
The closure problem has been solved numerically using a continuous-flux,
locally conservative finite volume method with a 27-point scheme proposed by
Edwards and Rogers [54]. Indeed, the typically employed seven-point stencil cannot
be used in this particular case of full tensor local conductivity. A thorough
description of the method can be found in Cherblanc et al. [55].
At advanced stages of densification, the pore space exhibits only one degree
of heterogeneity with respect to gas transport, since the contribution of micro-pores
vanishes because of size reduction and of connectivity loss. Thus, a simple change

21
of scale can be designed for the computation of gas transport properties of such a
material. However, since heat transport is not ensured by the pore space, this
assumption is not true for the computation of thermal conductivity. For the
computation of gas transport properties, 3 extracts with edge size equal to 200
voxels were selected within low-resolution images of CC1b and CC2. Sub-images
were segmented to separate the solid phase from the pore space. Effective
diffusivities are then computed using the random-walk algorithm described
previously. For the effective permeability tensor, the algorithm developed by Anguy
and Bernard [39-40] presented above has been used again.
The results have been compared to experimental measurements as far as
possible; data were available on thermal conductivity [56] and on pure gas transport
[57-58]. The latter properties have been determined at LCTS on a simple traditional
experimental setup, inspired from [59,15] using argon, with a calibrated gas flow
meter, a pressure difference gauge, and a terminal low-pressure regulation unit
(vacuum pump and vane). From steady-state flow versus pressure difference curves
obtained at various average pressures, the permeability and Knudsen diffusion
coefficient were recovered [60-61].
3.6.2 Results
Figure 11 is a plot of computed Knudsen diffusivities as compared to
experimental determinations performed at LCTS; at macro-scale, the parallel and
perpendicular directions now refer to the cloth stacking, and not to the fibre
orientations. The calculated values are in qualitative agreement with the
experiments, but there is a tendency to underestimate at high porosities. Many
reasons may be put forward. First, the experimental determinations are of limited
reliability, because of the small values of the flows involved. Also, the CMT-based

22
estimation relies on the assumption of linear relationship between local greyscale
level and density, which is not exactly verified because of the presence of a certain
amount of phase contrast – such an artefact is more pronounced for the most porous
samples.
Even if there is no experimental data available on binary diffusion, it is of
interest to investigate the effect of the Knudsen number on the effective tortuosity.
Figure 12 is a plot of the estimated values for samples CC0 and CC1, showing : (i) a
very low value for all tortuosities, as can be expected in a very porous medium, and
(ii) a monotonous evolution for CC1 while there is a hump for CC0. The latter
behaviour had been reported in [22] for regular unidirectional arrays of cylinders
with large porosity. A direct interpretation for it is that the mean free path is
drastically increased when going from the transitional to the rarefied regime,
because a very open structure provides longer free paths; indeed, when it is too
open, convergence of the effective transport law (i.e., flux/gradient relationship) to
classical Knudsen diffusion is not even ensured.
Figure 13 is a plot of computed versus measured permeabilities, showing
qualitative agreement, and a marked discrepancy for high-porosity samples. The
aforementioned limitations on the image-based evaluation method appear again,
more or less in the same way as for Knudsen diffusion.
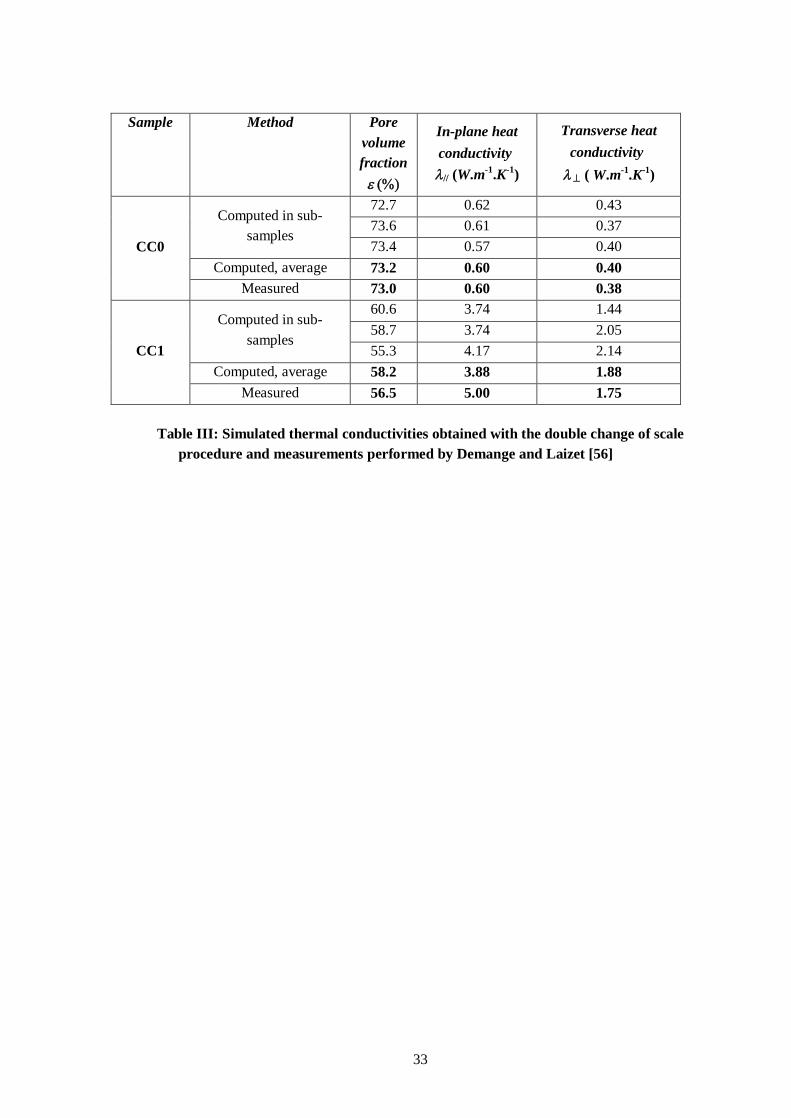
Figure 14 is a plot of computed vs. measured heat conductivities, showing an
excellent agreement in both directions.
Summarizing the results of Figs. 11, 13, and 14, it can be said that the porous
medium family corresponding to the C fibre preform at various stages of infiltration
has been correctly assessed on all transport (and geometrical) properties. Of these
transport properties, Knudsen transport has been found to be the most sensitive to

23
infiltration, followed by viscous flow and finally by thermal conductivity. This is in
agreement with the physicist’s intuition: first, thermal conductivity contrasts are
known to be low, e. g. compared to electrical conductivity or any other property;
second, Knudsen transport displays in many media a stronger tortuosity increase
with diminishing porosity than the other gas transport parameters, because of the
rapid view-factor reduction for direct transport as soon as a conducting medium is
not straight. This last fact is confirmed here again both numerically and
experimentally.
4 Conclusion and outlook
Raw and partially infiltrated carbon-carbon composite preforms have been
scanned by high-resolution synchrotron radiation X-ray Computerized Micro-
Tomography (CMT). The quality of the images had been assessed on geometrical
quantities in a previous work [10]. Here, the images of the pore space have been
produced at two distinct resolutions and have been used for the computation of
transport properties: heat conductivity, binary gas diffusivities, Knudsen
diffusivities, and viscous flow permeabilities. It is the first attempt to perform such a
simultaneous evaluation directly from tomographic scans on C/C composites, mostly
because: (i) very high-scale 3D images with adequate phase identification were not
previously available, and (ii) the bimodal nature of the samples implies to develop a
double-change-of-scale strategy.
The numerical evaluation of fibre-scale gas diffusivities in continuum and
rarefied regime in the studied media compare favourably with estimates on ideal
media families like 1D, 2D and 3D random fibre arrays. Viscous flow permeabilities
have also been assessed and compared to available correlations for 1D random fibre
arrangements, showing excellent agreement with the van der Westhuizen-Du Plessis

24
[25] and Tomadakis [42] models in parallel direction, and with the Tomadakis
model in perpendicular direction. Further work at this scale concerns primarily the
direct computation of thermal conductivity or diffusivity: this requires a separate
segmentation of fibres and matrix, with a local assignment of material principal axes
of anisotropy; this work is currently under way.
Computations at a larger scale have been carried out for all transport
properties; it has been possible to compare directly the results with experimental
data acquired on the same materials for Knudsen diffusivity, viscous flow
permeability, and thermal conductivity. Despite an excellent agreement on all
properties, many improvements may be suggested. First, images of high-porosity
samples do not totally verify the greyscale-porosity correlation because of phase
contrast – tomographs taken at the same resolution with a classical x-ray source
would be of better exploitation.
Second, concerning gas transport, there is a need for a unified solver, able to
manage high- and low-porosity samples in the same way. This could be achieved for
viscous transport by writing down a Stokes-Brinkman microscopic problem,
followed by the traditional change-of-scale procedure. This is also under way.
Third, replacing the provided analytical estimates for fibre-scale thermal
conductivity by estimates based on the results of a full numerical computation (as
mentioned above), would increase greatly the confidence in the quality of this CMT-
based approach.
Taking note of these improvement suggestions, it is claimed here that CMT-
based simulations are a powerful tool for the assessment of all properties of interest
in C/C composite preforms during infiltration, which is of great importance in CVI
process modelling. By combining process-scale approaches and the correlations

25
obtained in the past [10] and present works, it is possible to carry out a multi-scale
simulation. Repeating the procedure on several fibre arrangements would allow
comparing them one to each other in the sense of “infiltrability”, that is, of the
predisposition to receive as much matrix as possible in given conditions.
Finally, it is also possible to develop numerical methods for the detailed
simulation of in-pore matrix deposition; utilizing them in a suitable double-change-
of-scale strategy would also allow to assess quantitatively the notion of
“infiltrability”. This is yet another work in progress.

26
Acknowledgements
The authors wish to thank Snecma Propulsion Solide and CNRS for a joint
PhD grant to O.C.. They are indebted to the ESRF ID 19 team (José Baruchel, Peter
Cloetens, Elodie Boller) for the acquisition of CMT scans and to Marie-Anne
Dourges and Mickaël Vignes for experimental determination of gas transport
coefficients at LCTS. Jean-Marc Goyhénèche (CEA) is deeply acknowledged for his
invaluable help in thermal modelling.

27
References 1. R. Naslain and F. Langlais, « Fundamental and practical aspects of the chemical vapour infiltration of porous materials », High Temperatures Science 27, 1990, pp. 221-235.
2. T. M. Besmann, B. W. Sheldon, R. A. Lowden and D. P. Stinton, "Vapor-phase fabrication and properties of continuous-filament ceramic composites", Science 253, 1991, pp.1104-1109.
3. S. Vaidyaraman, W. J. Lackey, P. K. Agrawal, and T. L. Starr, “1-D model for forced-flow-thermal gradient chemical vapor infiltration process for carbon/carbon composites”, Carbon 34, 1996, pp. 1123–1133.
4. J. Y. Ofori, S. V. Sotirchos, ”Structural model effects on the predictions of CVI models”, J. Electrochem. Soc. 143, 1996, pp.1962-1973.
5. N. Reuge, G. L. Vignoles, " Modeling of isobaric–isothermal chemical vapor infiltration: effects of reactor control parameters on a densification", J. Mater. Proc. Technol. 166, 2005, pp. 15-29.
6. G. L. Vignoles, N. Nadeau, C.-M. Brauner, J.-F. Lines and J.-R. Puiggali, “ The Notion of Densification Front in CVI processing of CMCs”, Ceram. Engineering and Science Proc 26 no. 2, 2005, pp. 187-195.
7. G. L. Vignoles, J.-M. Goyhénèche, P. Sébastian, J.-R. Puiggali, J.-F. Lines, J. Lachaud, P. Delhaès and M. Trinquecoste, “The film-boiling densification process for C/C composite fabrication : from local scale to overall optimization ” , Chem. Eng. Sci. 61, 2006, pp. 5336-5353.
8. N. Nadeau, G. L. Vignoles, and C.-M. Brauner, “ Analytical and numerical study of the densification of carbon/carbon composites by a film-boiling chemical vapor infiltration process ”, Chem. Eng. Sci. 61, 2006, pp. 7509–7527.
9. G. L. Vignoles, “Modelling of CVI Processes”, “ Proc. CIMTEC 2006 ”, P. Vicenzini ed., Adv. Sci. Technol. 50, 2006, pp. 97-106.
10. O. Coindreau, G. L. Vignoles, « Assessment of geometrical and transport properties of a fibrous C/C composite preform as digitized by X-ray computed micro-tomography. Part I: Image acquisition and geometrical properties », J. Mater. Res. 20, 2005, pp. 2328-2339.
11. L. M. Russell, L. F. Johnson, D.P.H. Hasselman, "Thermal Conductivity/Diffusivity of Silicon Carbide Whisker Reinforced Mullite", J. Amer. Ceram. Soc., 70, 1987, pp.C226-C229.
12. H. Tawil, L. D. Bentsen, S. Baskaran, D. P. H. Hasselman, « Thermal Diffusivity of Chemically Vapour Deposited Silicon Carbide Reinforced With Silicon Carbide or Carbon Fibres », J. Mater. Sci. 20, 1985, pp. 3201-3212
13. D. J. Jaklitsch, J. W. Walkinshaw, “Flash Pulse Measurement for Off-Axis Thermal Conductivity of Carbon Composite Materials”, Ind. Eng. Chem. Res. 27, 1988, pp. 702-706
14. D. J. Skamser, D. P. Bentz, R. T. Coverdale, M. S. Spotz, N. Martys, L. H. Jennings, D. L. Johnson, “Calculation of the Thermal Conductivity and Gas Permeability in a Uniaxial Bundle of Fibers”, J. Amer. Ceram. Soc. 77, 1994, pp. 2669-2680.

28
15. T. L. Starr, N. Hablutzel, "Measurement of Gas Transport through Fiber Preforms and Densified Composites for Chemical Vapor Infiltration", J. Amer. Ceram. Soc. 81, 1998, pp. 1298-1304.
16. W. T. Perrins, D. R. McKenzie, R. C. McPhedran, « Transport properties of regular arrays of cylinders », Proc. R. Soc. Lond. A 369, 1979, pp. 207-225.
17. G. W. Milton, « Bounds on the transport and optical properties of a two-component composite material », J. Appl. Phys. 52, 1981, pp. 5294-5304.
18. D. S. Tsai, W. Strieder, « Effective conductivities of random fibre beds », Chem. Eng. Commun. 40, 1986, pp. 207-213.
19. I. Kim, S. Torquato, « Determination of the effective conductivity of heterogeneous media by brownian motion simulation », J. Appl. Phys. 68, 1990, pp. 3892-3903.
20. M. M. Tomadakis, S. V. Sotirchos, « Ordinary and transition regime diffusion in random fibre structures », AIChE J. 39, 1993, pp. 397-412.
21. M. M. Tomadakis, S. V. Sotirchos, « Transport properties of random arrays of freely overlapping cylinders with various orientation distributions », J. Chem. Phys. 98, 1, 1993, pp. 616-626.
22. F. Transvalidou, « Diffusion of gases in structures of multifilamentous fibres », PhD Thesis, Univ. of Rochester, New York, 1995.
23. A. S. Sangani, A. Acrivos, « Slow flow past periodic arrays of cylinders with application to heat transfer », Int. J. Multiphase Flow 8, 3, 1982, pp 193-206.
24. J. F. McCarthy, « Analytical models for the effective permeability of sand-shale reservoirs », Geophys. Int. J. 105, 1991, p. 513.
25. J. van der Westhuizen, J. P. du Plessis, “ An Attempt to Quantify Fibre Bed Permeability Utilizing the Phase Average Navier-Stokes Equation, Composites-Part A, 27A, 1996, pp.263–269.
26. P. Cloetens, R. Barrett, J. Baruchel, J. P. Guigay, M. Schlenker, “Phase objects in synchrotron radiation hard X-ray imaging”, J. Phys. D 29, 1996, pp. 133-146.
27. O. Coindreau, G. L. Vignoles, P. Cloetens, « Direct 3D microscale imaging of carbon-carbon composites with computed holotomography », Nucl. Instr. and Meth. In Phys. Res. B 200, 2003, pp. 308-314.
28. M. Jonard, « Etude du réseau de porosité de textures tridimensionnelles » (Study of the pore network in tridimensional textures), Engineering report, Snecma, 2001.
29. G. L. Vignoles, « Modelling binary, Knudsen and transition regime diffusion inside complex porous media », Journal de physique IV, C5, 1995, pp. 159-166.
30. W. G. Pollard, R. D. Present, “On Gaseous Self-Diffusion in Straight Cylindrical pores”, Phys. Rev. 73, 1948, pp. 762-774.
31. O. Coindreau, G. L. Vignoles, and J.-M. Goyhénèche, “ Multiscale X-ray CMT of C/C composites : a tool for properties assessment”, Ceram. Trans. 175, 2005, pp. 77-84.

29
32. M. M. Tomadakis, S. V. Sotirchos, « Effects of fibre orientation and overlapping on Knudsen, transition, and ordinary regime diffusion in fibrous structures », , in Chemical Vapor Deposition of Refractory Metals and Ceramics II, edited by T.M. Besmann, B.M. Gallois, and J.W. Warren (Mater. Res. Soc. Symp. Proc. 250, Pittsburgh, PA, 1992), pp. 221-226.
33. E. Sanchez-Palencia, « Non-homogeneous media and vibration theory », Lecture Notes in Physics 127, Springer, New-York, 1980.
34. A. Bensoussan, J.-L. Lions, G. Papanicolaou, Asymptotic analysis for periodic structures, North-Holland Publishing Compagny, Amsterdam, 1978.
35. S. Whitaker, « Diffusion and dispersion in porous media », AIChE J. 13, 1967, pp. 420-427.
36. J. Barrère, O. Gipouloux, S. Whitaker, « On the closure problem for Darcy’s law », Trans. in Porous Media 7, 1992, pp. 209-222.
37. H. P. G. Darcy, Les fontaines publiques de la ville de Dijon, (The public springs of the city of Dijon), Paris, Victor Dalmont, 1856.
38. M. Quintard, S. Whitaker, « Transport in ordered and disordered porous media : volume-averaged equations, closure problems, and comparison with experiment », Chem. Eng. Sci. 48, 14, 1993, pp. 2537-2564.
39. Y. Anguy, D. Bernard, R. Ehrlich, « The local change of scale method for modelling flow in natural porous media (I) : Numerical tools », Adv. Water Res., 17, 1994, pp. 337-351.
40. D. Bernard, « Using the volume averaging technique to perform the first change of scale for natural random porous media », in Advanced methods for groundwater pollution control, Courses and lectures n° 364, G. Gambolati & G. Verri eds., Springer-Verlag, Wien New-York, 1995.
41. D. L. Johnson , J. Koplik, L. M. Schwartz, “New Pore-Size Parameter Characterizing Porous Media”, Phys. Rev. Lett. 57, 1986, pp. 2564-2567.
42. M. M. Tomadakis , T. J. Robertson, “Viscous Permeability of Random Fiber Structures: Comparison of Electrical and Diffusional Estimates with Experimental and Analytical Results”, J. Compos. Mater. 39, 2005, pp. 163-188.
43. T. G. Gutowski, Z. Cai, S. Bauer, D. Boucher, J. Kingery, S. Wineman, « Consolidation experiments for laminate composites », J. Composite Mater. 21, 1987, pp. 650-669.
44. N. C. Gallego, D. D. Edie, B. Nysten, J. P. Issi, J. W. Treleaven, G. V. Deshpande, “The thermal conductivity of ribbon-shaped carbon fibers”, Carbon 38, 2000, pp. 1003-1010.
45. C. Pradère, « Caractérisation thermique et thermo-mécanique de fibres jusqu’à très haute température » (Thermal and thermomechanical characterization of fibres up to very high temperatures) , Ph. D. thesis, University Bordeaux I, 2003.
46. C. Sauder, « Relation microstructure / propriétés à haute température dans les fibres et matrices de carbone » (High-temperature structure-properties relationship in carbon fibers and matrices), Ph. D. Thesis, University Bordeaux I, 2477, 2001.

30
47. J. Jumel, J.-C. Krapez, F. Lepoutre, F. Enguehard, D. Rochais, G. Neuer, M. Cataldi, « Microscopic thermal characterization of C/C and C/C-SiC composites », 28th Annual Review of Progress in QNDE, Brunswick (USA), 2001.
48. J. Jumel, F. Lepoutre, J.-P. Roger, G. Neuer, M. Cataldi, F. Enguehardt, “Microscopic thermal characterization of composites”, Rev. Sci. Instr. 74, 2003, 537-539.
49. D. M Staicu, D. Jeulin, M. Beauvy, M. Laurent, C. Berlanga, N. Negrello, D. Gosset, “Effective thermal conductivity of heterogeneous materials: calculation methods and application to different microstructures”, High Temperatures - High Pressures, 33, 2001, pp. 293-301.
50. G. E. Youngblood, D. J. Senor, R. H. Jones, S. Graham, « The transverse conductivity of 2D-SiCf / SiC composites », Composites Science and Technology 62, 2002, pp. 1127-1139.
51. I. Nozad, R. G. Carbonell, S. Whitaker, « Heat Conduction in Multiphase Systems – I Theory and experiment for two-phase systems », Chemical Engineering Science 40, 1985, pp. 843-855.
52. M. Quintard, S. Whitaker, « Ecoulement monophasique en milieu poreux : Effet des hétérogénéités locales » (Single phase flow in porous media : effect of local heterogeneities), J. Méc. Théor. Appl. 6, 1987, pp. 691-729.
53. M. Quintard, S. Whitaker, « Transport in ordered and disordered media II : generalized volume-averaging », Transport in Porous Media 14, 1994, pp.179-206.
54. M.G. Edwards, C.F. Rogers, « A flux continuous scheme for the full tensor pressure equation », Proceeding 4th European Conference on the Mathematics of Oil Recovery D, 1994.
55. F. Cherblanc, A. Ahmadi, M. Quintard, « Two-medium description of dispersion in heterogeneous porous media : calculation of macroscropic properties », Water Resour. Res. 39, 2003, pp. 1154-1173.
56. D. Demange, J. C. Laizet, « Mesure de la conductivité thermique de préformes sèches et densifiées » (Measurements of thermal conductivity in raw and infiltrated preforms), technical report n° RT 1/03519 DMSC, 2000.
57. M.-A. Dourges, O. Coindreau, N. Reuge, G. L. Vignoles, and R. Pailler, “ Caractérisation de solides poreux complexes : étude des propriétés de transport de gaz ” (Charactrization of complex solid porous media), Proceedings of « 5es Journées d’Etude sur les Milieux Poreux » (Porous media Workshop), IUSTI, Marseilles, France, 6-7 November 2001.
58. O. Coindreau, G. L. Vignoles, “Computing Structural and Transport Properties of C/C Composites from 3D Tomographic Images”, Mater. Sci. Forum 455-456, 2004, pp. 751-754.
59. D. G. Huizenga, D. M. Smith, “Knudsen diffusion in random assemblages of uniform spheres”, AIChE J. 32, 1986, pp. 1-6.
60. L. J. Klinkenberg, “The permeability of porous media to liquids and gases”, Drilling and Productions Practices, 19471, American Petroleum Institute, pp. 200–213.
61. Y.-S. Wu, K. Pruess and P. Persoff, “Gas flow in porous media with Klinkenberg effects”, Transp. in Porous Media 32, 1998, pp. 117-137.

31
Rarefied (Knudsen) regime Continuum (ordinary) regime Percolation porosity
Limit tortuosity
Exponent Limit tortuosity
Exponent
Parallel
Samples CC1 and CC0
0.04 0.817 0.126 1.0 0.107
Correlation coefficient R2 0.95 0.99
2D random 0.11 1.149 0.954 1.0 0.521
1D random 0 0.549 0 1.0 0.
Transverse
Samples CC1 and CC0
0.04 1.411 1.047 1.09 0.465
Correlation coefficient R2 0.93 0.99
3D random 0.037 1.444 0.921 1.0 0.661
2D random 0.11 1.780 1.005 1.0 0.785
1D random 0.33 1.747 1.099 1.0 0.707
1D hexagonal 0.093 1.0 0.335
1D square 0.215 1.0 0.358
Table I : Comparison of parallel and transverse tortuosity-porosity correlation parameters [Eq. (12)] obtained from high-resolution tomographic images with estimations on
ideal fibrous media [32]

32
Component Thermal conductivity (W.m-1.K-1)
Longitudinal : fi,// = 20 Fibre
Transverse : fi, = 4 Longitudinal : pyC,// = 114 Radial : pyC, = 44 Pyrocarbon
Orthoradial : pyC,// = 114 Gas Isotropic : gas = 0.13
Table II : Thermal conductivities of C/C composite components
33
Sample Method Pore
volume fraction
In-plane heat conductivity(W.m-1.K-1)
Transverse heat conductivity( W.m-1.K-1)
72.7 0.62 0.43 73.6 0.61 0.37
Computed in sub-samples
73.4 0.57 0.40 Computed, average 73.2 0.60 0.40
CC0
Measured 73.0 0.60 0.38 60.6 3.74 1.44 58.7 3.74 2.05
Computed in sub-samples
55.3 4.17 2.14 Computed, average 58.2 3.88 1.88
CC1
Measured 56.5 5.00 1.75
Table III: Simulated thermal conductivities obtained with the double change of scale procedure and measurements performed by Demange and Laizet [56]