Embed Size (px)
Citation preview

Faculté de génie Département de génie civil
ASSESSMENT OF STRENGTH, STIFFNESS, AND DEFORMATION CAPACITY OF CONCRETE SQUAT
WALLS REINFORCED WITH GFRP BARS Évaluation de la résistance, la rigidité et la capacité en déformation des voiles courts en béton armé
d’armature en PRFV
Thèse de doctorat
Spécialité: génie civil
Ahmed Noureldean Mohamed Arafa A dissertation submitted in partial fulfillment
of the requirements for the degree of Doctor of Philosophy (Civil Engineering)
Jury: Prof. Brahim Benmokrane (directeur de recherche) Prof. Murat Saatcioglu (Examinateur) Prof. Ehab El-Salakawy (Examinateur) Prof. Sébastien Langlois (Examinateur)
Sherbrooke (Québec) Canada August 2017


i
ABSTRACT The present study addressed the feasibility of reinforced-concrete squat walls totally
reinforced with GFRP bars to attain reasonable strength and drift requirements as specified in
different codes. Nine large-scale squat walls with aspect ratio (height to length ratio) of 1.33—
one reinforced with steel bars (as reference specimen) and eight totally reinforced with GFRP
bars—were constructed and tested to failure under quasi-static reversed cyclic lateral loading.
The key studied parameters were: (1) use of bidiagonal web reinforcement; (2) use of
bidiagonal sliding reinforcement; and (3) web reinforcement configuration (horizontal and/or
vertical) and ratio. The reported test results clearly revealed that GFRP-reinforced concrete
(RC) squat walls have a satisfactory strength and stable cyclic behavior as well as self-
centering ability that assisted in avoiding sliding shear that occurred in the companion steel-
reinforced wall following steel yielding. The results are promising regarding using GFRP-
reinforced squat walls in areas prone to seismic risk where environmental conditions are
adverse to steel reinforcement. Bidiagonal web reinforcement was shown to be more effective
than conventional web reinforcement in controlling shear-cracks width. Using bidiagonal
sliding reinforcement was demonstrated to be not necessary to prevent sliding shear. The
horizontal web reinforcement ratio was found to have a significant effect in enhancing the
ultimate strength and deformation capacity as long as the failure is dominant by diagonal
tension. Existence of both horizontal and vertical web reinforcement was shown to be essential
for cracks recovery. Assessment of the ultimate strengths using the available FRP-reinforced
elements code and guidelines (CSA S806-12 and ACI 440.1R-15) was conducted and some
recommendations were proposed to attain a reasonable estimation of ultimate strengths. Given
their importance in estimating the walls’ later displacement, the effective flexural and shear
stiffness of the investigated walls were evaluated. It was found that the cracked shear stiffness
could be estimated based on the truss model; while the flexural stiffness can be estimated
based on the available expressions in FRP-reinforced elements codes and guidelines. Based on
a regression analysis, a simple model that directly correlates the flexural and shear stiffness
degradation of the test walls to their top lateral drift was also proposed.
Keywords: Squat walls, concrete, GFRP bars, seismic, hysteretic response, sliding shear,
residual displacement, web reinforcement, flexural and shear deformations, stiffness.

ii
RÉSUMÉ La présente étude traite de la faisabilité de voiles courts en béton armé totalement renforcés
avec des barres de polymères renforcés de fibres de verre (PRFV), obtenant une résistance et
un déplacement latéral raisonnable par rapport aux exigences spécifiées dans divers codes.
Neuf voiles à grande échelle ont été construits: un renforcé avec des barres d'acier (comme
spécimen de référence) et huit renforcés totalement avec des barres de PRFV. Les voiles ont
été testés jusqu’à la rupture sous une charge quasi-statique latérale cyclique inversée. Les
voiles ont une hauteur de 2000 mm, une largeur de 1500 mm (élancement 2000 mm/1500 mm
= 1,33) et une épaisseur de 200 mm. Les paramètres testés sont : 1) armature bi-diagonale dans
l’âme; 2) armature bi-diagonale dans l’encastrement du mur à la fondation (zone de
glissement); 3) configuration d’armature verticale et horizontale réparties dans l’âme et taux
d’armature. Les résultats des essais ont clairement montré que les voiles courts en béton armé
de PRFV ont une résistance satisfaisante et un comportement cyclique stable ainsi qu'une
capacité d'auto-centrage qui ont aidé à éviter la rupture par glissement à l’encastrement
(sliding shear). Ce mode de rupture (sliding shear) s’est produit pour le voile de référence
armé d’acier après la plastification de l’armature. Les résultats sont prometteurs concernant
l'utilisation de voiles en béton armé de PRFV dans les régions sismiques dans lesquelles les
conditions environnementales sont défavorables à l’armature d’acier (corrosion). L’armature
bi-diagonale en PRFV dans l’âme s’est avérée plus efficace pour le contrôle des largeurs de
fissures de cisaillement comparativement à l’armature répartie dans l’âme. L'utilisation d'un
renforcement de cisaillement bi-diagonal a été démontrée comme n'étant pas nécessaire dans
les voiles courts en béton armé de PRFV pour prévenir la rupture par glissement à
l’encastrement (shear sliding). Par ailleurs, les résultats d’essais ont montré que le taux
d’armature horizontale répartie dans l’âme a un effet significatif sur l’augmentation de la
résistance et la capacité en déformation des voiles dont la rupture par effort tranchant se fait
par des fissures diagonales (tension failure). L'existence d’armature verticale et horizontale
répartie dans l’âme du voile en béton armé de PRFV s'est révélée essentielle pour l’ouverture
et la fermeture des fissures au cours des chargements cycliques. Les normes calcul CSA S806-
12 et ACI 440.1R-15 ont été utilisées pour évaluer la résistance au cisaillement des voiles
courts en béton armé de PRFV. Certaines recommandations ont été proposées pour obtenir une

iii Résumé
estimation raisonnable des forces ultimes. Compte tenu de leur importance dans l'estimation
du déplacement latérale des voiles, la rigidité effective en flexion et en cisaillement des voiles
étudiés a été évaluée. On a constaté que la raideur de cisaillement du béton fissuré pourrait
être estimée en utilisant le modèle de treillis. La rigidité à la flexion peut être, quant à elle,
estimée en fonction des expressions disponibles dans les normes et les guides de conception de
membrures en béton armé avec des barres en PRFV. Sur la base d'une analyse de régression,
un modèle simple qui corrèle directement la dégradation de la rigidité en flexion et en
cisaillement des voiles courts en béton armé de PRFV testés avec le déplacement latérale dans
la partie supérieure des voiles a également été proposé.
Mots-Clés : Voiles courts, béton, barres d’armature en polymère renforcé de fibre de verre
(PRFV), sismique, réponse hystérétique, rupture par glissement, déplacement résiduel,
armature de l’âme, déformation due à la flexion et à l’effort tranchant, rigidité.

iv
ACKNOWLEDGEMENT
Thanks to Almighty ALLAH for the gracious kindness in all the endeavors I have taken up in my life.
The author would like to express his gratefulness to the valuable advices and patience of his
supervisor, Prof. Brahim Benmokrane, and for giving him the opportunity to conduct such
research in Sherbrooke University and providing him support at times when it was most
needed.
To Dr. Ahmed Sabry Farghaly, your passion to structural engineering has been an inspiration
to me. I cannot thank you enough for the countless encouragement, discussion, and support.
This is beside the hand-by-hand work with dedication and devotion in every single step during
the whole project.
Gratitude must be extended to Prof. Sebastien Langlois for his hospitality to conduct a large
scale test at his facility. Sincere words of thanks must also go to our group technical staff; Mr.
Martin Bernard, Mr. Marc Demers. I value the assistance of my colleagues Khaled Mohamed,
Ahmed Hassanein, and Mohamed Gaber for their invaluable help during the experimental
program.
I am grateful for the scholarship granted to me by the Canada Research Chair in Advanced
Composite Materials for Civil Structures and Natural Sciences and Engineering Research
Council of Canada (NSERC-Industry Research Chair program).
To my parents, thank you for your commitment to my education and for making me the person
that I am today. To my brothers and sisters, thank you for your unconditional love and
encourage, your patience and supporting made this possible.
Ahmed Noureldean Mohamed Arafa August 2017

v
TABLE OF CONTENTS ABSTRACT iRÉSUMÉ iiACKNOWLEDGEMENT ivTABLE OF CONTENTS vLIST OF TABLES viiiLIST OF FIGURES ix CHAPTER 1: INTRODUCTION 1
1.1. General Background 11.2. Objectives and Scopes 31.3. Methodology 31.4. Thesis Outlines 4
CHAPTER 2: LITERATURE REVIEW 72.1. Introduction 72.2. Steel RC Squat Walls 7
2.2.1. General Background 72.2.2. Mode of Failures 10
2.2.2.1. Diagonal Tension Failure 102.2.2.2. Diagonal Compression Failure 102.2.2.3. Sliding Shear Failure 11
2.2.3. Factors Affecting Squat Walls Behavior 122.2.3.1. Walls’ Aspect Ratio 122.2.3.2. Presence of Boundary Elements 142.2.3.3. Horizontal and Vertical Web Reinforcement 152.2.3.4. Use Diagonal Web Reinforcement 182.2.3.5. Construction Joint 212.2.3.6. Axial Load 23
2.2.4. Shear Strength Prediction 242.3. FRP Composite Materials 25
2.3.1. FRP Constituents 262.3.2. Manufacturing Process 272.3.3. Mechanical Properties 28
2.3.3.1. Tensile Strength 282.3.3.2. Compression Strength 292.3.3.3. Flexural Strength 302.3.3.4. Shear Strength 302.3.3.5. Fatigue Strength 312.3.3.6. Bent Portion Strength 31
2.4. FRP RC Structural System for Seismic Forces 332.4.1. Structural Frame Systems 33

vi Table of Contents
2.4.2. Shear Walls 37 CHAPTER 3: EXPERIMENTAL PROGRAM 39
3.1 Introduction 393.2 Testing Matrix 393.3 Material Properties 443.4 Specimens Construction 453.5 Preliminary Specimens Design 473.6 Test-setup 503.7 Loading Procedure 533.8 Instrumentations 53
CHAPTER 4: EXPERIMENTAL BEHAVIOR OF GFRP-REINFORCED CONCRETE SQUAT WALLS SUBJECTED TO SIMULATED EARTHQUAKE 56
4.1 Introduction 584.2 Experimental Program 59
4.2.1 Test Matrix of Specimens 594.2.2 Material Properties 624.2.3 Specimens Design 644.2.4 Test Setup and Procedure 674.2.5 Instrumentations 68
4.3 Test Results and Discussion 694.3.1 General Behavior and Mode of Failures 694.3.2 Hysteretic Response 744.3.3 Steel-Versus GFRP-reinforced Walls 764.3.4 Effect of Different Configurations 79
4.4 Prediction of Ultimate Strength 804.5 Energy Dissipation 824.6 Conclusions 84
CHAPTER 5: EFFECT OF WEB REINFORCEMENT ON THE SEISMIC RESPONSE OF CONCRETE SQUAT WALLS REINFORCED WITH GLASS-FRP BARS
86
5.1 Introduction 885.2 Experimental Program 89
5.2.1 Description of Test Specimens 895.2.2 Material Properties 925.2.3 Test Setup and Procedure 925.2.4 Instrumentations 94
5.3 Experimental Results and Discussion 955.3.1 Failure Progression and Hysteretic Response 955.3.2 Load-Top Displacement Envelop Curves 1015.3.3 Strain in Vertical Reinforcement 1035.3.4 Strain in Horizontal Reinforcement 1055.3.5 Shear Crack Width 107

vii
5.3.6 Influence of Web Reinforcement on Concrete Shear Resistance 1105.4 Prediction of Specimens’ Ultimate Strength 112
5.4.1 Flexural Strength 1125.4.2 Shear Strength 1135.4.3 Comparison of Predicted Ultimate Strength to Test Results 1155.4.4 Confinement Influence on Wall Response 118
5.5 Conclusions 119
CHAPTER 6: EVALUATION OF FLEXURAL AND SHEAR STIFFNESS OF CONCRETE SQUAT WALLS REINFORCED WITH GLASS-FIBER-REINFORCED-POLYMER (GFRP) BARS
122
6.1 Introduction 1246.2 Research Significant 1256.3 Summary of Experimental Program and Results 125
6.4 Decoupling of Flexural and Shear Deformations 128
6.4.1 Original and Corrected Flexural and Shear Deformations 131
6.5 Shear Stiffness 1346.5.1 Design Codes and Guides for Shear-Strength Predictions 1376.5.2 Evaluation of Shear Crack Angle 1386.5.3 Evaluation of Concrete Shear Strength 1396.5.4 Proposed Shear-Stiffness Models 142
6.6 Flexural Stiffness 1446.7 Conclusions 148
CHAPTER 7: CONCLUSIONS AND RECOMMENDATIONS 1507.1 General Conclusions 1507.2 Recommendations for Future Work 1537.3 Conclusion 1547.4 Recommandation pour des Travaux Futurs 158
REFERENCES 160
viii
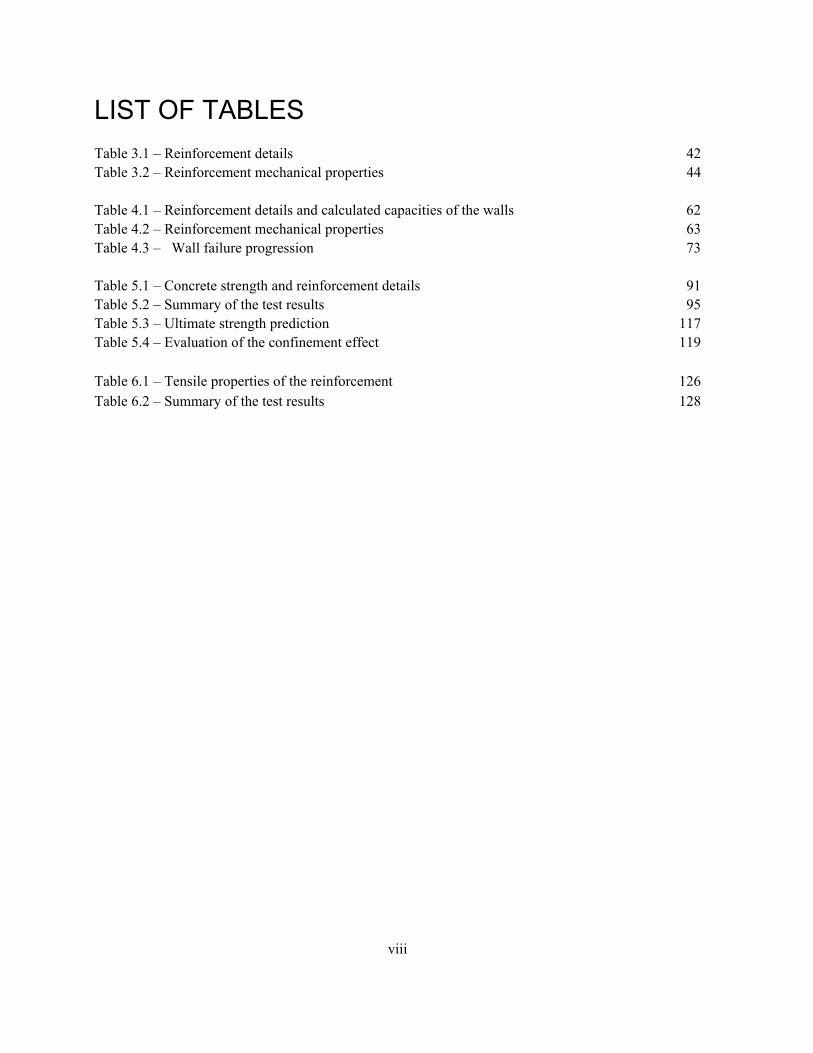
LIST OF TABLES Table 3.1 – Reinforcement details 42Table 3.2 – Reinforcement mechanical properties 44 Table 4.1 – Reinforcement details and calculated capacities of the walls 62Table 4.2 – Reinforcement mechanical properties 63Table 4.3 – Wall failure progression 73 Table 5.1 – Concrete strength and reinforcement details 91Table 5.2 – Summary of the test results 95Table 5.3 – Ultimate strength prediction 117Table 5.4 – Evaluation of the confinement effect 119 Table 6.1 – Tensile properties of the reinforcement 126Table 6.2 – Summary of the test results 128

LIST OF FIGURES Figure 1.1 – Corrosion in squat walls 2 Figure 2.1 - Structural walls’ categories based on height to length ratio 8Figure 2.2 - Squat wall applications 9Figure 2.3 – Diagonal tension failure; (a) schematic details; (b) photo (Woods et al. 2015) 10Figure 2.4 – Diagonal compression failure 11Figure 2.5 – Sliding shear failure; (a) schematic detail; (b) Photo (Paulay et al. 1982) 12Figure 2.6 – Load transfer in squat walls (Barda et al. 1977) 13Figure 2.7 – Typical Shapes of Squat Walls 14Figure 2.8 – Shear resistance mechanisms in squat walls (Paulay 1972) 18Figure 2.9 – Sliding shear resistance components 22Figure 2.10 – Pultrusion process 28Figure 2.11 – Stress strain for steel and FRP bars 29Figure 2.12 – Bends in GFRP bars reinforcement 32Figure 2.13 – Effect of the lengthening of period on design force levels 34Figure 2.14 – Measured shear strain at ultimate load (Mohamed et al. 2014b) 38 Figure 3.1 – Overall dimensions of test walls 40Figure 3.2 – Reinforcement details 42Figure 3.2 – Reinforcement details (continue) 43Figure 3.3 – GFRP reinforcement 45Figure 3.4 – Prepared formwork and cage of the base 45Figure 3.5 – Assembly of the wall cage to the base cage 46Figure 3.6 – Assembly and alignment of wall formwork 46Figure 3.7– Casting the base 46Figure 3.8 – Casting the wall 46Figure 3.9 – Specimens after curing 46Figure 3.10 – Test-setup 52Figure 3.11– Loading history of testing program 53Figure 3.12 – Stain gauges instrumentation 54Figure 3.13 – LVDTs instrumentation 55 Figure 4.1 – Concrete dimensions and reinforcement details 60Figure 4.2 – GFRP reinforcement and wall cage 63Figure 4.3 – Test setup 68Figure 4.4 – Loading history 68Figure 4.5 – Instrumentation 69Figure 4.6 – Crack pattern 70Figure 4.7 – Failure progression of specimen S4-80 71Figure 4.8 – Failure progression of specimens G4-80, G6-80, and G4 72Figure 4.9 – Failure of specimen GD 72Figure 4.10 – Hysteretic response 76

x List of Figures
Figure 4.11 – Envelope curves: Steel vs. GFRP 78Figure 4.12 – Envelope curves: Top displacement 80Figure 4.13 – Concrete strain 82Figure 4.14 – Energy dissipation 84 Figure 5.1 – Concrete dimensions and details of reinforcement 90Figure 5.2 – Test Setup 93Figure 5.3 – Displacement history 93Figure 5.4 – Instrumentation: (a) LVDTs instrumentation; (b) strain-gauge instrumentation 94Figure 5.5 – Crack pattern 96Figure 5.6 – Lateral load versus top displacement 97Figure 5.7 – Failure modes: (a) G4-250; (b) G4-160; (c) G4-80; (d) G6-80; (e) G-V; (f) G-H 99Figure 5.8 – Damage aspects 99Figure 5.9 – Load-top displacement envelope curves 102Figure 5.10 – Vertical strains distribution along the wall length 103Figure 5.11 – Maximum measured vertical strain 105Figure 5.12 – Horizontal strain distribution along the wall height 106Figure 5.13 – Load-average horizontal strain envelope curves 107Figure 5.14 – Load-shear crack width envelope curves 108Figure 5.15 – Vertical strain versus horizontal strain at the same location (G4-250) 108Figure 5.16 – Maximum measured horizontal strain versus shear crack width 109Figure 5.17 – (a) Concrete shear strength versus top displacement envelope curves; (b) shear resistance components
111
Figure 6.1 – Concrete dimensions, reinforcement details, test setup, load history, and instrumentation
126
Figure 6.2 – Failure modes of the test specimens 127Figure 6.3 – Load–top-displacement envelope curves 128Figure 6.4 – Decoupling of flexural and shear deformations 129Figure 6.5 – Method for estimating α (rotation profile over the wall height) 130Figure 6.6 – Calculated curvature and rotation profiles for the test specimens 130Figure 6.7 – Comparison between the measured and calculated displacement at a height equal to the wall length
132
Figure 6.8 – Displacement components at a height equal to the wall length 133Figure 6.9 – Comparison between flexural and shear deformations in test specimens 134Figure 6.10 – Truss model for shear deformation estimation 136Figure 6.11 – Lateral load versus experimental and predicted shear deformations using different shear crack angles
139
Figure 6.12 – Lateral load versus experimental and predicted shear deformations using different concrete shear strength (θ = 60o)
140
Figure 6.13 – Concrete shear strength versus top displacement 141Figure 6.14 – Shear stiffness degradation normalized with gross shear stiffness versus drift ratio
141
Figure 6.15 – Validation of the proposed model for shear stiffness degradation 143Figure 6.16 – Comparison of predicted normalized shear stiffness with experimental data 144Figure 6.17 – Comparison of Predicted (a) flexural displacement (b) normalized flexural stiffness 147Figure 6.18 – Normalized flexural stiffness versus drift ratio 148


CHAPTER 1
INTRODUCTION
1.1. General Background
Squat walls are defined as structural walls with a height to length ratio (aspect ratio) less than
2.0. This type of wall is widely used as the primary seismic-force resisting component in low-
rise structures such as nuclear facilities, industrial buildings, and parking structures. Moreover,
such walls also frequently serve as bridge piers and abutments. Squat walls may also be used
in high-rise buildings where a substantial part of the lateral load may be assigned to them
when extending over the first few stories above foundation level (Paulay et al. 1982).
Because of their aspect ratio, squat walls—unlike slender walls—generate high shear forces at
their bases to develop structural flexural strength, which makes shear capacity a major issue in
their design (Paulay et al. 1982; Kuang and Ho 2008; Whyte and Stojadinovic 2014).
Investigations revealed that the flexural and shear deformations are intimately correlated in
squat walls. By the onset of flexural reinforcement yielding, shear deformations either shear
distortion and/or sliding have been shown to be activated and localized along the yielding zone
then begins to dominate the behavior causing rapid degradation in strength and stiffness with
subsequent premature shear failure (Paulay et al. 1982; Saatcioglu 1991; Sittipunt et al. 2001).
In North America, many bridges and other types of buildings in which squat walls are used are
deficient due to the corrosion of steel reinforcement and consequent failure in concrete (Figure
1.1). Some conditions, such as, significant temperature fluctuations and environmental
aggression aggravate this phenomenon and make the hazard more severe.
The high economic consequences of corrosion problems led engineers all over the world to
search for new and affordable construction materials as well as innovative approaches and
systems to problem solving. In recent years, the use of fiber-reinforced polymer (FRP) as an
alternative reinforcing material in concrete structures has emerged as an innovative solution to
overcome the corrosion problem. In addition to its non-corrodible nature, FRP reinforcement
1

2 Chapter 1: Introduction
presents many advantages such as high strength-to-weight ratio, ease of handling, and
immunity against the electrochemical corrosion (Rizkalla et al. 2003, Benmokrane et al. 2006,
2007). These advantages paved the way for their applications into numerous construction
elements such as slabs, beams, columns (Arafa et al. 2016a, El-Salakawy et al. 2005, Kassem
et al. 2011, Tobbi et al. 2012). However, since the investigations mainly focused on the
behavior under static-loading conditions omitting the seismic design; the feasibility of using
FRP as internal reinforcement for a complete structure immune to corrosion while having
strength, stiffness, and deformation capacity to resist seismic loads, has become questionable.
Figure 1.1 – Corrosion in squat walls
To address this issue, an experimental study was conducted by Mohamed et al. (2014a) to
investigate the behavior of mid-rise shear walls totally reinforced with glass (G) FRP bars.
Four large-scale shear walls—one reinforced with steel bars (as reference specimen) and three
totally reinforced with GFRP bars—were constructed and tested to failure under quasi-static
reversed cyclic lateral loading. The reported test results clearly showed that properly designed
and detailed GFRP-reinforced concrete (RC) walls could reach their flexural capacities with
no strength degradation while achieving high level of deformability. The test results also
revealed the potential of GFRP bars in controlling shear distortion compared to steel
reinforcement (Mohamed et al. 2014b). It was explained that using elastic material (GFRP
bars) gave uniform distribution of shear strain along the shear region of GFRP RC shear walls,
resulting in a better control of shear distortion compared to steel RC shear wall, in which the
yielding of the flexural reinforcement redistributed shear strains causing their localization at
the yielding zone.

3
The conducted results of using FRP bars in mid-rise shear walls in term of its ability in
controlling shear distortion and overriding the corrosion problem called for a new
investigation to study the feasibility of using this material in squat walls in which these
problems are frequently encountered. Currently; however, no experimental data are available
on the seismic behavior of squat walls reinforced with FRP reinforcing bars. This has been the
main impetus to carry out this study to fill the gap of knowledge and provide information
about this behavior.
1.2. Objectives and Scope
Experimental program on large-scale squat walls reinforced with GFRP bars under reversed
cyclic lateral loading was conducted. The ability of such structural element to achieve the
strength and drift requirements, specified in various codes, is the main scope of this study.
Basically, the objectives of the current study can be summarized as follows:
1. Investigate the difference in behavior between GFRP and steel RC walls;
2. Assess the influence of bidiagonal web reinforcement in lieu of horizontal and vertical web reinforcement on the shear strength of squat walls;
3. Study the efficiency of bidiagonal sliding reinforcement to suppress sliding failure;
4. Examine the effect of web reinforcement configuration (horizontal and/or vertical) and ratio;
5. Assess methods to reasonably predict the ultimate flexural and shear strength;
6. Assess methods to calculate realistic flexural and shear deformations in squat walls; and
7. Evaluate the walls’ flexural and shear stiffness.
1.3. Methodology
To achieve the foregoing objectives, a series of test specimens that comprised nine large-scale
squat walls were constructed and tested laterally under quasi-static reversed cyclic loading up
4 Chapter 1: Introduction
to failure. One wall was reinforced totally with steel bars and served as a control specimen
while the others were reinforced with GFRP bars in different configurations and reinforcement
ratios according to the studied parameters. The preliminary design and reinforcement details
of the wall specimens were conducted according to the CSA A23.3 (2014) for steel RC wall
and the CSA S806 (2012) for GFRP RC walls. Given the absence of seismic provisions in the
CSA S806 (2012); however, similar philosophies that are being used in the companion code,
CSA A23.3 (2014), were adopted. Analysis of the experimental results in term of
deformability, energy dissipation, ultimate strength, and failure mode was conducted showing
the main aspects of difference between the behavior of steel and GFRP RC squat walls.
Evaluation of the influence of either bidiagonal web reinforcement or sliding reinforcement
was discussed. The experimental results were also analyzed, identifying the effect of different
web reinforcement configurations and ratio on the crack pattern and failure mode, drift
capacity and ultimate strength as well as the shear crack widths. Documentation of the strain
distribution in either horizontal or vertical direction was also presented. Evaluation of the
ultimate capacity according to the ACI and CSA codes provisions was also introduced. As a
result, some recommendations that assist in a reasonable estimation of the ultimate strength
were given.
The experimental measurements permitted to decouple flexural and shear deformations and
examine their contribution to the lateral deformations. The results showed that shear
deformation significantly increase by the onset of the first shear crack initiation and
represented a significant portion of the total deformations. Consequently, prediction of shear
stiffness of squat walls beside its flexural stiffness was found to be necessary. The available
expressions in guidelines and codes as well as some technical papers were used in lateral shear
and flexural stiffness prediction. Additionally, in the context of displacement based design, a
simple model that directly correlates the flexural and shear stiffness degradation of the tested
walls to their top lateral drift was proposed.
1.4. Thesis Organization
The thesis consists of seven chapters. The contents of each chapter can be summarized as
follows:

5
Chapter 1 of this thesis presents background information on the research topic, the work
objectives and the adopted methodology.
Chapter 2 introduces a literature review reporting the past known characteristics of steel RC
squat walls. Some aspects such as failure modes and the most decisive parameters that affect
the walls’ behavior are presented. Additionally, the available methods in the ACI 318 (2014)
and CSA A23.3 (2014) for ultimate shear strength’s prediction are introduced. This is
followed by a background about some mechanical characteristics of FRP reinforcement.
Finally, the available knowledge of seismic behavior of FRP RC systems is discussed.
Chapter 3: gives the details of the experimental program and the testing procedure. The
geometry and reinforcement details of the test specimens, web reinforcement configuration,
test setup and procedure, and the instrumentation details are presented. In addition, detailed
characteristics of the used materials are provided.
The subsequent three chapters respectively correspond to three technical papers and one
technical note that have submitted for publication in scientific journals:
Chapter 4: (Paper 1) Arafa, A., Farghaly, A. S., and Benmokrane, B., 2016 (submitted)
“Experimental Behavior of GFRP-Reinforced Concrete Squat Walls subjected to
Simulated Earthquake Load,” Journal of Composites for Construction, ASCE.
Chapter 5: (Paper 2) Arafa, A., Farghaly, A. S., and Benmokrane, B., 2017 (submitted)
“Effect of Web Reinforcement on the Seismic Response of Concrete Squat Walls
Reinforced with Glass-FRP Bars,” Engineering Structures.
(Paper 3) Arafa, A., Farghaly, A. S., and Benmokrane, B., 2017 (submitted
technical note) “Prediction of Flexure and Shear Strength of Concrete Squat
Walls Reinforced with Glass-FRP Bars,” Journal of Composites for Construction,
ASCE.
Chapter 6: (Paper 4) Arafa, A., Farghaly, A. S., and Benmokrane, B., 2017 (submitted)
“Evaluation of Flexural and Shear Stiffness of Concrete Squat Walls Reinforced
with Glass-Fiber-Reinforced-Polymer (GFRP) Bars,” ACI Structural Journal.

6 Chapter 1: Introduction
Chapter 7 presents a general conclusion of the results obtained from the experiments and
analyses with respect to the problems and observations discussed throughout the thesis in
addition to recommendations for future work.


7
CHAPTER 2
LITERATURE REVIEW
2.1. Introduction
In this chapter, a survey of relevant previous works related to this research study is presented.
A review for the behavior of steel RC squat walls under seismic loading is first presented.
Emphasis is given on the identifications of failure modes and main factors that affect the
behavior. In addition, a summary of the available models in the ACI 318 (2014) and CSA
A23.3 (2014) that are being used in predicting the ultimate shear strength of steel RC walls is
presented. This is followed by a brief summary about FRP material constituents,
manufacturing, and properties as well as the available knowledge of seismic behavior of FRP
RC systems.
2.2. Steel RC Squat Walls
2.2.1. General Background
Reinforced concrete walls are commonly used as the primary component for lateral load-
resisting system in buildings prone to seismic risk and/or wind pressure. Compared to frame-
type structures, the main advantages that can be rendered by structural walls are the significant
increase in building’s lateral stiffness which leads to a reduction of second-order effects and
subsequent increase of safety against collapse (Fintel 1995, Paulay 1972). Even after extensive
cracking, the structural walls are able to maintain most of their vertical load-bearing capacity
which is not always the case for frame-type systems. These advantages were recognized and
evidenced from the observation during the 3 March 1985 Chilean earthquake (Wyllie et al.
1986); where buildings equipped with well-designed RC walls showed overwhelming success
in controlling damages.
Structural walls are generally classified based on its height to length ratio into three categories;
slender walls, mid-rise walls, and squat walls. Slender walls are structural walls with a height

8 Chapter 2: Literature Review
to length ratio larger than 4.0. Such type of walls is used in high rise buildings and it can be
treated as ordinary reinforced concrete cantilever beam. In slender walls, it is relatively easy to
ensure developing adequate ductility as flexural behavior is dominated. Structural walls with a
height to length ratio between 2.0 and 4.0 are classified as mid-rise walls and widely used in
mid-rise buildings (buildings with 4 to 10 stories). Both nonlinear flexural and shear
deformations significantly contribute to the lateral response of such shear walls. The last
category is squat walls with a low height to length ratio that is typically less than 2.0.
Figure 2.1 - Structural walls’ categories based on height to length ratio
(a) Slender walls (hw/lw > 4.0) (c) Low-rise walls (hw/lw< 2.0)
(b) Mid-rise walls (4.0>hw/lw> 2.0)
V
hw
lw
V
hw
lw
lw
V
hw

9
Squat walls are widely used in low-rise buildings such as nuclear plants, industrial buildings;
parking structures, highway overpasses, and bridge abutments (Figure 2.2 shows some
applications of using squat walls). Squat walls may also be used in high-rise buildings where a
significant portion of lateral load can be assigned to them (Paulay et al. 1982).
Figure 2.2 - Squat wall applications; (a) wall in nuclear reactor (Whyte and Stojadinovic.
2013), (b) bridge piers, (c) overpass piers, (d) bridge abutment, (e) low-rise housing made
of walls and slabs (Sánchez-Alejandre and Alcocer 2010)
In squat walls, relatively large shearing forces are generated at the wall base, that are sufficient
to destroy the structure in brittle shear manner before achieving its flexural strength. This is
mainly due to the combination of a squat (low height to length ratio) and the uniform
distribution of vertical reinforcement across the wall’ section. Therefore, squat wall behavior
is generally dominated by shear deformations (shear distortion and/or sliding shear
deformations) and its shear capacity constitutes a major concern in their design. Numerous
experimental and analytical investigations have been devoted to study the behavior of steel RC
squat walls under quasi-static reversed cyclic lateral loading as a simulation for seismic
loading. Based on these studies; failure modes, hysteretic behavior characteristics as well as
the main parameters affecting the behavior and ultimate shear strength were identified. These
(e)
(a) (b) (c)
(d)

10 Chapter 2: Literature Review
issues will be discussed in the following subsections in addition to the codes’ methods for
ultimate shear strength estimation.
2.2.2. Mode of Failures
2.2.2.1. Diagonal Tension Failure
Failure due to diagonal tension occurs when horizontal web reinforcement is inadequate
(Figure 2.3a). In such case, horizontal reinforcement yields and widely spaced diagonal cracks
appear. The failure then occurs suddenly through a sliding along diagonal plane associated
with the rupture of the horizontal reinforcement crossing this plane as shown in Figure 2.3b.
Test results demonstrated that the inclination of failure plane can be affected by the wall’s
aspect ratio (height to length ratio) and the existence of a beam at the top of the wall (Paulay et
al. 1982). The results also showed that avoiding such types of failure can be achieved by
providing horizontal shear reinforcement capable of transferring a larger shear force than the
one which produces flexural yielding.
Figure 2.3 – Diagonal tension failure; (a) schematic details; (b) photo (Woods et al. 2015)
2.2.2.2. Diagonal Compression Failure
If adequate horizontal shear reinforcement is provided and the average shear stress in the wall
section is large, concrete may crush under diagonal compression. Resistance of the concrete
compression struts in the web of the wall deteriorates as the inclined cracks in two opposite
directions open and close successively under cyclic loading. Ultimately, the concrete struts are
crushed as shown in Figure 2.4a. This type of failure mode occurs for walls with a very high
shear stress such as walls with flanges or barbells and/or walls with a high axial load. Flanged
and barbell walls can potentially accommodate more reinforcement at the wall ends, which
(b)
Horizontal bars rupture
(a)

11
provides substantial flexural strength and increase the shear demands in the wall web. In spite
of the preferable effect of axial load in term of controlling shear crack width and increasing
the shear strength; their existence with large value increase the compressive stresses in the
web of the wall and accelerate the occurrence of diagonal compression failure. Diagonal
compression failure is usually associated with dramatic and irrecoverable loss of strength.
Therefore, diagonal compression failure is highly undesirable (Paulay et al. 1982). This mode
of failure can only be avoided if the average shear stress in the wall critical section is limited
between 0.5 fc1/2
and 0.9 fc1/2; as a function of the ductility requirements imposed on the wall
(Park and Paulay 1975, Oesterle et al. 1980). An example of a diagonal compression failure
from Maier and Thürlimann (1985) is shown in Figure 2.4b.
Figure 2.4 – Diagonal compression failure; (a) schematic detail; photo (Maier and
Thürlimann 1985)
2.2.2.3. Sliding Shear Failure
Sliding shear failure occurs when the wall has sufficient horizontal reinforcement to prevent a
diagonal tension failure, and relatively small amount of vertical reinforcement in the wall web
with low axial loading. Inelastic deformation required for energy dissipation would be
expected to be created mainly from post yielding strains originated in the vertical flexural
reinforcement. However, after a few cycles of reversed loading that causes significant yielding
in the flexural reinforcement, sliding displacement can occur along flexural cracks that
interconnect and form a continuous horizontal shear path, as depicted in Figure 2.5a. Such
sliding displacements are responsible for a significant reduction of stiffness, particularly at
(b)(a)

12 Chapter 2: Literature Review
low load intensities, consequently, a reduction of energy dissipation (Paulay et al. 1982). This
mode of failure is also responsible for significant degradation of stiffness. Typical sliding
shear failure reported by Paulay et al. (1982) is shown in Figure 2.5b.
Figure 2.5 – Sliding shear failure; (a) schematic detail; (b) Photo (Paulay et al. 1982)
2.2.3. Factors Affecting Squat Walls Behavior
The experimental database compiled from previous experimental and analytical researches
revealed that the shear behavior of squat wall was governed by many factors such as wall’s
aspect ratios, presence of boundary elements (barbells or flanges), horizontal and vertical web
reinforcement, diagonal web reinforcement, construction joint as well as the magnitude of
axial loading. Summary about the effect of each parameter is briefly presented in the
following subsections.
2.2.3.1. Wall’s Aspect Ratio
There is an agreement that aspect ratio (height to length ratio) is one of the most crucial
parameters that affects the shear strength, deformability and mode of failure of squat walls.
The work conducted by Barda et al. (1977) is one of the early investigations that studied this
parameter. Eight flanged squat walls with aspect ratios of 0.25, 0.5, and 1.0 were constructed
and tested under lateral loading. It was observed that walls with lower aspect ratio possess
high shear strength; the shear strength of specimen with aspect ratio of 0.5 was found to be
20% higher than the shear strength of the companion specimen with aspect ratio of 1.0. This
(a) (b)
13
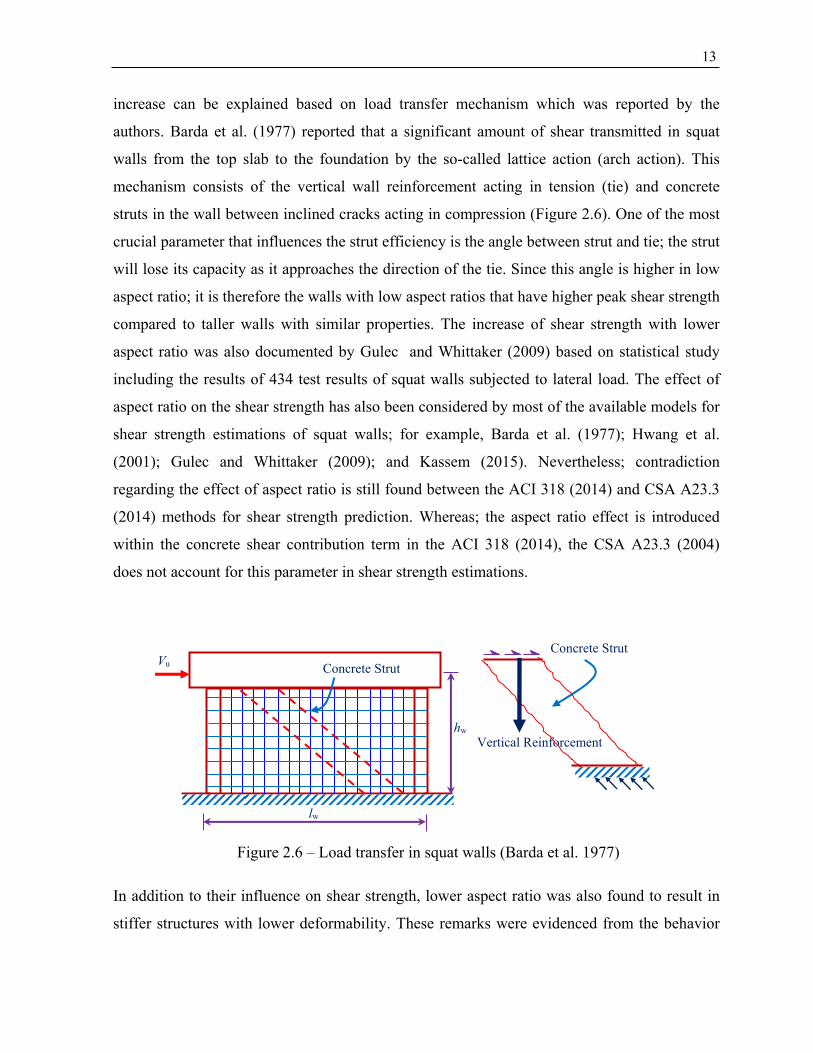
increase can be explained based on load transfer mechanism which was reported by the
authors. Barda et al. (1977) reported that a significant amount of shear transmitted in squat
walls from the top slab to the foundation by the so-called lattice action (arch action). This
mechanism consists of the vertical wall reinforcement acting in tension (tie) and concrete
struts in the wall between inclined cracks acting in compression (Figure 2.6). One of the most
crucial parameter that influences the strut efficiency is the angle between strut and tie; the strut
will lose its capacity as it approaches the direction of the tie. Since this angle is higher in low
aspect ratio; it is therefore the walls with low aspect ratios that have higher peak shear strength
compared to taller walls with similar properties. The increase of shear strength with lower
aspect ratio was also documented by Gulec and Whittaker (2009) based on statistical study
including the results of 434 test results of squat walls subjected to lateral load. The effect of
aspect ratio on the shear strength has also been considered by most of the available models for
shear strength estimations of squat walls; for example, Barda et al. (1977); Hwang et al.
(2001); Gulec and Whittaker (2009); and Kassem (2015). Nevertheless; contradiction
regarding the effect of aspect ratio is still found between the ACI 318 (2014) and CSA A23.3
(2014) methods for shear strength prediction. Whereas; the aspect ratio effect is introduced
within the concrete shear contribution term in the ACI 318 (2014), the CSA A23.3 (2004)
does not account for this parameter in shear strength estimations.
Figure 2.6 – Load transfer in squat walls (Barda et al. 1977)
In addition to their influence on shear strength, lower aspect ratio was also found to result in
stiffer structures with lower deformability. These remarks were evidenced from the behavior
Vertical Reinforcement
Concrete Strut Vu
hw
lw
Concrete Strut

14 Chapter 2: Literature Review
of 26 squat walls with aspect ratios ranged from 0.7 to 2.0 (Hidalgo et al. 2002). Other test
results also indicated that walls with a low aspect ratio may be more vulnerable to sliding
shear than those with a higher aspect ratio as reported by Salonikios et al. (1999 and 2000).
2.2.3.2. Presence of Boundary Elements
Squat walls are generally grouped by plan geometry into rectangular walls or walls framed by
either end boundary columns (barbell walls) or boundary flanges (flanged walls) (Figure 2.7).
Boundary elements are often presented to allow effective anchorage of transverse beams. Even
without beams, they are often provided to accommodate the principal flexural reinforcement,
to provide stability against lateral buckling of a thin-walled section and to provide more
effective confinement of the compressed concrete in the potential plastic hinge. Walls meeting
each other at right angles will give rise to flanged sections. Such walls are normally required
to resist earthquake forces in both principal directions of the building.
Figure 2.7 – Typical Shapes of Squat Walls
A review of the literature revealed that most previous studies on squat walls mainly focused
on a single shape; hence the effect of this parameter on squat walls behavior could only be
estimated by comparing results for similar walls tested in different programs. More
specifically, only the works conducted by Paulay et al. (1982) and Maier and Thurlimann
(1985) have two types of wall shapes; rectangular, and flanged. Paulay et al. (1982) reported
that flanged walls are more seriously affected by sliding shear along interconnecting flexural
cracks. Maier and Thurlimann (1985), on the other hand, reported that the horizontal
a) Rectangular wall b) Barbell wall c) Flanged wall

15
resistance is a function of the cross-sectional geometry; adding boundary elements improve
the strength of squat walls. The concept of comparing results for similar walls tested in
different programs with the objective of estimating the crucial parameters and validating some
proposed analytical models in squat walls was followed by some researchers (Hwang et al.
2001, Gulec and Whittaker 2009; Kassem 2015).
Hwang et al. (2001) reviewed and catalogued the results of 62 reinforced concrete squat walls
with different shapes with the aim of calibrating a proposed softened strut and tie model for
the determination of shear strength of squat walls. The investigation showed that walls with
barbell or flanged cross-section resist significantly higher shear forces than a rectangular wall
with the same amount and arrangement of web reinforcement. Some flanged walls achieved
20% higher shear strength than other identical rectangular walls. The authors explained that
the higher capacity of flanged walls can be attributed to the improved end conditions of its
diagonal strut provided by the compression boundary element. The authors added that the
depth of compression strut of a wall increases with the presence of boundary elements which
leads to an increase in the shear strength. The same conclusions were drawn by Gulec and
Whittaker (2009) and Kassem (2015) based on a database of information from tests of 434 and
645 squat walls, respectively. Kassem (2015); however, added that the existence of boundary
elements cause additional confining effect which reduces the concrete softening effect and
limits the cracking and extension of the walls; subsequently, increasing in the shear capacity.
Even though the review emphasized on the effectiveness of boundary elements in enhancing
squat wall’s shear strength; current ACI 318 (2014) and CSA A23.3 (2014) ignore the cross-
section effect on shear strength predictions; resulting in less-than-satisfactory estimates with a
disagreement with the experimentally observed structural behavior. This remark with other
deficiencies has been reported by many researchers (for example, Hwang et al. 2001, Gulec
and Whittaker 2009, Kassem 2015) who pointed to the importance of developing more
rational prediction methods capable of fully characterizing the real response of RC squat walls
under various loading conditions while considering those parameters that significantly
influence the behavior of such walls.

16 Chapter 2: Literature Review
2.2.3.3. Horizontal and Vertical Web Reinforcement
Previous investigations on steel RC squat walls have confirmed that minimum horizontal and
vertical web reinforcement are essential for crack control. Nevertheless, there is no consensus
between researchers about the effect of horizontal and vertical web reinforcement on the shear
strength. Some researchers reported that using proper amount of horizontal reinforcement
suppresses the diagonal tension, hence increasing in the shear and deformation capacity of
squat walls (Paulay et al. 1982; Pilakoutas and Elnashai 1995; Hidalgo et al. 2001). In contrast
to what adopted by those researchers, other experiments showed that horizontal web
reinforcement has no impact on the shear strength of squat walls, whereas, it significantly
increases as a function of vertical web reinforcement (Maier and Thurlimann 1985; Wood
1990; Lefas et al. 1990; Gupta and Rangan 1996; Emamy Farvashany et al. 2008). In between
the first and second opinion, other investigations; however, indicated that the presence of both
horizontal and vertical web reinforcement activate more contribution of concrete for shear
resistance mechanism by providing additional load paths beside the diagonal strut, and hence
increase the shear capacity (Cardenas et al. 1980, Hwang et al. 2001, Kassem 2015).
Current ACI 318 (2014) and CSA A23.3 (2014) methods for shear strength estimation of squat
walls only account for the amount of horizontal web reinforcement. Nevertheless, both codes
recognized that vertical web reinforcement is essential to maintain equilibrium of internal
forces. Considering the Barada et al. (1972) conclusion that for squat walls having aspect ratio
less than 1.0, the shear forces are transmitted to the base by inclined struts developed within
the web (Figure 2.8a), the inclined struts forces must be vertically in equilibrium by vertical
web reinforcement (Figure 2.8b), while both horizontal and vertical web reinforcement
contribute in equilibrium at the wall edges (Figure 2.8c) (refer to Paulay 1972). The vertical
web reinforcement is therefore recommended by both the ACI 318 (2014) and CSA A23.3
(2014) to be a ratio of the horizontal web reinforcement. Apparently from Figure 2.8c, the
ratio that satisfies equilibrium is typically equal to cot2 θ; where θ is the struts inclination
angle to the longitudinal axis. The ACI 318 (2014) conservatively assume that θ = 45°; hence,
it is required that the vertical web reinforcement should be equal to the horizontal web
reinforcement for all squat walls; regardless their aspect ratio. The CSA A23.3 (2014);
however, provide Eq. 2.1, to calculate θ that is based on the modified compression field theory

17
and is a function of the wall depth, reinforcement axial rigidity, and internal forces applied at
the section of interest.
l 700029 (2.1)
where εl = average longitudinal strain at mid-height of the section of interest and can be
calculated as follows:
FF
fv
f
l AE
Vd
M
2
(2.2)
where Mf, Vf , are the applied moment and shear at the section of interest, dv is the effective
shear depth, EF and AF are the modulus of elasticity and the total cross-sectional area of the
longitudinal reinforcement at the same section.
Based on the calculated θ, the CSA A23.3 (2014) gives the following equation to calculate
vertical web reinforcement ratio:
gys
shv Af
P
2cot
(2.3)
where ρv, ρh are the vertical and horizontal web reinforcement, Ps is the axial load; φs is the
material resistance factor fy is the specified yield strength of web reinforcement; and Ag gross
area of the wall section.
It can be noticed from Eq. 2.3 that the CSA A23.3 (2014) accounts for another component in
forces equilibrium that is the compression stresses applied on the wall. This effect; however, is
conservatively ignored in the ACI 318 (2014). Furthermore, whereas the ACI required that
vertical web reinforcement must equal horizontal web reinforcement regardless their aspect
ratio, the CSA A23.3 (2014) limits Eq. 2.3 application for squat walls having an aspect ratio
less than 1.0. In spite of the aforementioned discrepancy between the ACI 318 (2014) and
CSA A23.3 (2014), both codes agree that minimum horizontal and vertical web reinforcement
(equal to 0.25%) should be provided to control cracks propagation and width.

18 Chapter 2: Literature Review
Figure 2.8 – Shear resistance mechanisms in squat walls (Paulay 1972)
2.2.3.4. Use Diagonal Web Reinforcement
Extensive researches have been devoted to study the influence of using diagonal
reinforcement; either concentrated at the base to reduce the excessive sliding, or distributed in
the web to control shear distortion. Consistent results about this effect have been drawn. Using
diagonal reinforcement was found to considerably improve the seismic response of squat walls
compared to that with conventional web reinforcement (horizontal and vertical). The aspects
of enhancement included preventing sliding shear and diagonal compression failure, reduction
in shear distortion and relatively high energy dissipation. In spite of the merits of using
diagonal reinforcement, it may attribute higher cost than using horizontal and vertical bars.
Given the fact that the diagonal reinforcement needs more labor time to be cut in different
lengths as well as the difficulty in their placing and anchorage relatively to using horizontal
and vertical reinforcement.
Historically, the first attempt for applying diagonal reinforcement in squat-walls was
conducted by Iliya and Bertero (1980). Two walls with aspect ratio of 1.3 were constructed;
the first specimen was reinforced with equal amount of horizontal and vertical web
reinforcement, while the web reinforcement in the other specimen was arranged diagonally
with angle of 45°. The specimens were cyclically loaded up to the first yield of the
longitudinal steel in the boundary elements. The cracks in the specimens were then repaired by
epoxy grouting. The repaired specimens were subsequently loaded, with a few intermediate
cycles, up to failure. Finally, the damaged walls were retrofitted and again subjected to cyclic
loadings until failure. The test results showed that the 45° arrangement of the wall reinforcing
(a) Wall under loading (b) Equilibrium at zone 1 (c)Equilibrium at zone 2
Vu
hw
lw
2
1 Horizontal and vertical components
Vu
Vertical components
Vu Concrete Struts
θ

19
bars is more effective in resisting the effect of shear reversals; the specimen with diagonal
reinforcement exhibited less stiffness and strength degradation under the cyclic load. In
addition, the noticed failure in conventionally reinforced specimens was mainly due to
diagonal cracking, whereas in the specimen with diagonal web reinforcement the flexural
failure was dominant.
In order to suppress the detrimental effect of sliding shear failure at the base of squat walls,
special bidiagonal reinforcement extending from the base through the web was provided in
two squat walls tested by Paulay et al. (1982). These walls duplicated two other
conventionally reinforced walls with equal flexural and shear strengths. It was concluded that
bidiagonal reinforcement considerably improve seismic response of squat walls, even when as
little as 30 percent of the applied shear was resisted by such reinforcement. Diagonal
reinforcement used in these tests was insufficient to prevent slip. However, when the diagonal
bars were yielding due to slip displacements, significant energy dissipation additional to that
due to flexure resulted.
Salonikios et al. (1999) carried out a comprehensive experimental program involving eleven
wall specimens; six with aspect ratio of 1.5 while the others have aspect ratio of 1.0. The wall
specimens were reinforced against shear, either conventionally (orthogonal grids of web
reinforcement), or conventionally plus bidiagonal bars. Using bi-diagonal reinforcement was
found to offer an attractive alternative to current practice from an economic point of view,
since for a lower quantity of total web reinforcement an improved seismic performance was
achieved. The authors also reported that the using bidiagonal bars contributed to better control
of the inclined shear cracks width in the web of specimen. The main reason for enhancement
is that bidiagonal bars intersect the inclined shear cracks almost at right angles; hence, they
work essentially in direct tension, whereas the bars in the orthogonal grid intersect the shear
cracks at 35 to 45° and tend to work primarily as dowels.
Sittipunt and Wood (1995) carried out an analytical study using finite element models to
investigate the effect of using diagonal web reinforcement. The study comprised analysis of
six walls with varying arrangements of web reinforcement. Conventional web reinforcement
(vertical and horizontal web reinforcement) was used in the first specimen. The amount of

20 Chapter 2: Literature Review
horizontal web reinforcement in the lower half of the wall is doubled in second wall, and the
amount of vertical web reinforcement in the lower half of the wall is tripled in the third wall.
Increase of vertical web reinforcement was also tested in the fourth wall but the bars were not
anchored in the foundation. The final two arrangements of reinforcement included equal
diagonal web reinforcement in the lower portion of the wall (either distributed or
concentrated), in addition to vertical and horizontal web reinforcement. The main drawn
conclusion was that hysteretic response of squat walls can be significantly improved by
controlling the shear distortion near the base. However, the mechanism by which forces are
carried in the web of the wall must be changed if the overall force-displacement response is to
be changed appreciably. Adding vertical or horizontal web reinforcement did not improve the
hysteretic response significantly because forces were still carried across the cracks in the web
by dowel action. Therefore, the possibility of web crushing at a given level of deformation
was not decreased. When diagonal reinforcement was added in the web, the load-carrying
mechanism was changed to direct tension in the reinforcing bars, and the shear distortion was
reduced significantly.
Continuing their efforts in studying the effect of diagonal web reinforcement, Sittipunt et al.
(2001) tested four squat walls with aspect ratio of 1.6 and incorporating different web
reinforcement ratios and configurations. Two walls contained different amount of horizontal
and vertical web reinforcement, while the others contained diagonal web reinforcement (45°
orientation) with amount equal to the companion specimens which was reinforced
conventionally. All specimens were tested under horizontal quasi-static cyclic load up to
failure with absence of axial load. The test results confirmed the outcomes obtained from the
pre-described analytical investigation. It was reported that the brittle mode of failure due to
web crushing could be avoided by using diagonal web reinforcement; both walls with
conventional web reinforcement failed due to web crushing. Pinched shapes characterized the
hysteresis curves for top displacement and shear distortion near the base. In contrast, the walls
with diagonal reinforcement displayed rounded hysteresis curves and failed due to crushing of
the boundary elements. It was also concluded that the advantages in performance of specimens
reinforced with diagonal reinforcement can offset the difficulties associated with placement of
diagonal bars during construction. Other investigations have been conducted later (Chiou et al.
21
2004, Liao et al. 2004, Shaingchin et al. 2007, Zhong et al. 2009) and yielded to similar
results.
2.2.3.5. Construction Joint
Construction joints in squat walls, especially for those under low axial load, may dramatically
deteriorate under cyclic load and become the weakest link in the chain; leading to sliding shear
failure (Doostdar 1994). After a few cycles of reversed loading that causes significant yielding
in the flexural reinforcement, sliding displacement can occur along flexural cracks that
interconnect and form a continuous, approximately horizontal shear path (Paulay et al. 1982).
Such sliding displacements are responsible for a significant reduction of stiffness, particularly
at low load intensities, and consequently, a reduction of energy dissipation. Therefore, to
ensure structural resistance of squat walls and ensure energy dissipation, sliding shear across a
construction joint should be avoided (Paulay et al. 1982; Salonikios et al. 1999, and 2000).
This can be achieved through a rational design of the construction joint such that it has a shear
capacity larger than the shear capacity of the wall’s web; hence, it will not constitute the
weakest link in the load transfer. As mentioned earlier, once sliding movement commences,
major horizontal crack spreads through the entire construction joint and start to widen. Thus,
any approach that can delay or prevent the widening of this crack will significantly promote
the shear resistance along the construction joints. Defining of these approaches; however,
requires the knowledge of how shear is transferred in the construction joint. In this regard, a
brief summary of publications covering this topic as well as available recommendations that
were proposed to prevent sliding shear are presented in the following paragraphs.
In their efforts to explain how shear is transferred along an existing or potential crack in
connections (Construction joint in our case), Birkeland and Birkeland (1966) and Mast (1968)
proposed that shear could be transfer by what they termed “shear friction” between the rough
faces of the cracks. It is assumed in this theory that as the uneven crack faces slide past one
another, the projections on the crack faces ride over one another and force the crack faces
apart, stretching any reinforcement crossing the crack sufficiently to cause it to yield. The
tensile force so developed in the reinforcement is assumed to compress the crack faces
together, which results in frictional resistance to sliding along the crack. Mattock et al. (1975)

22 Chapter 2: Literature Review
experimentally demonstrated the validity of shear friction hypothesis; adding that if a
compressive stress is applied to wall section, it should be added to shear resistance component
by adding its value to the previously mentioned normal stresses originated by bars crossing the
sliding plane. Another investigation by Mattock (1974) showed that when the shear-friction
reinforcement is inclined with respect to the shear plane such that the component of the shear
force parallel to the reinforcement tends to produce tension in the reinforcement, part of the
shear is resisted by the component parallel to the shear plane of the tension force in the
reinforcement. Hence; based on the shear friction theory that has proposed by Birkeland and
Birkeland (1966) and Mast (1968) and later developed by Mattock (1974 and 1975), the
sliding shear resistance can be calculated as the summation of two primary components. The
first is the friction caused by all reinforcement crossing the potential sliding shear plane in
addition to any normal force acting across it [μ(Avf fy +μN)]; where μ is friction coefficient and
depends on the surface roughness; Avf is the area for all reinforcement crossing sliding plane;
other terms were previously described) (Figure 2.9a). The second is the component parallel to
the shear plane of the tension force in the inclined reinforcement (Ainc fy cos α) (Figure 2.9b).
Figure 2.9 – Sliding shear resistance components
Based on the shear transfer mechanism; Paulay (1972) pointed that if sliding shear failure is
desired to be prevented in structural walls, the following aspects should be taken into
consideration:
Compression on concrete surface =Avf fy +N
N
Assumed crack or shear plane
Applied shear
(a)
V
V
Friction stress= μ(Avf fy +N)
Tension in reinforcement= Avf fycos α
Reinforcement
(b)
α
Ainc fy
Ainc fycos
Ainc fysin α
Ainc fy
V

23
1. The construction joint surface should be cleaned and intentionally roughened to use
artificially high values of the coefficient of friction in the shear-friction equations;
2. Any compression force acting across the joint can be utilized in calculation sliding
shear resistance;
3. If the flexural reinforcement that passed through construction joint plus the normal
force is not sufficient to resist sliding shear, additional sliding shear reinforcement can
be added vertically or diagonally; however, diagonal reinforcement is preferable; and;
4. To preserve the functionality of sliding shear reinforcement, shear-friction
reinforcement shall be appropriately placed along the shear plane and shall be
anchored to develop fy on both sides by embedment, hooks, or welding to special
devices.
2.2.3.6. Axial Load
Little experimental works have been conducted to assess the effect of axial load on the
behavior of reinforced concrete squat walls (Lefas et al. 1990; Salonikios et al. 1999; Li and
Xiang 2014). Three levels of constant axial loads were investigated in the testing program by
Lefas et al. (1990); 0.0, 0.1, and 0.2 of the axial capacity of the walls; while two levels of axial
loading were tested by Salonikios et al. (1999) and Li and Xiang (2014); (0.0, and 0.07), (0.0,
and 0.05) of the axial capacity, respectively. It was reported that axial load has a significant
effect on enhancing the shear strength and stiffness of the squat walls. This is due to the fact
that axial loads significantly control shear cracks width and therefore the ability of structure to
transfer shear by the aggregate interlock would be substantial. In addition, axial load was
shown to significantly enhance the wall resistance against sliding shear.
In spite of the agreement between the mentioned studies about the beneficial effect of axial
loads on squat walls behavior, other researchers (Park and Paulay 1975; Paulay et. 1982)
reported that common squat walls generally carry small axial loads, and therefore this effect
was suggested to be ignored. The contradiction can be also found between the available
analytical models and guidelines methods for predicting the shear strength of squat walls. For
instance, the effect of normal force was incorporated in the softened truss model which was
proposed by Hsu and Mo (1985) and the softened strut and tie model which proposed by

24 Chapter 2: Literature Review
Hwang et al. (2001) and simplified later by Kassem (2015). This effect is also involved in the
empirical equations suggested by Gulec and Whittaker (2009). Nevertheless; the ACI 318
(2014) and CSA A23.3 (2004) methods for shear strength estimation of squat walls still ignore
this effect.
2.2.4. Ultimate Shear Strength Prediction
To predict the nominal shear strength of squat walls, two procedures are usually followed. The
first depends on derivation of empirical equations based on the experimental investigations
and test results. In the second procedure, the researchers assume a shear model based on the
structure mechanics and conduct a formula for prediction after use equilibrium, compatibility
and material constitutive relationships. The current code provisions use empirical or semi-
empirical equations to calculate the nominal shear strength of squat walls. In the following
subsections, a brief summary of the available equations that predict nominal shear strength of
squat walls in the ACI 318-14 and CSA A23.3-14 codes are presented.
ACI 318 (2014)
The current ACI 318 (2014) shear strength expression is based on an assumed shear crack at a
45° angle across an effective wall length (lw), and is comprised of two superimposed resisting
mechanisms: the shear reinforcement strength and the concrete shear strength. The
contribution of shear reinforcement is estimated by considering equilibrium of forces at a
typical joint of the 45о truss model while concrete contribution has been empirically obtained
from experimental results. The ACI 318 (2014) expression for in-plane shear resistance (V) of
steel RC squat walls is given as follows (SI units):
'' 83.0)( ccvyhhcccv fAffAV (2.4)
where αc is the aspect ratio coefficient equal to 0.25 for hw/lw ≤ 1.5, 0.17 for hw/lw ≥ 2.0, and
varies linearly between 0.25 and 0.17 for aspect ratios between 1.5 and 2.0, λ is a coefficient
depending on the concrete type; equal to 1.0 for normal weight concrete and 0.75 for
lightweight concrete, fc’ is the concrete compressive strength, ρh is the horizontal web
reinforcement ratio, fyh is the horizontal reinforcement yield stress, and Acv is the gross area of
the web of the wall (equal to wall length × web thickness).

25
CSA A.23 (2014)
The CSA A23.3 (2014) provides a shear design method based on the modified compression
field theory (MCFT) (Vecchio and Collins 1986). In this theory, the shear resistance of a
concrete member can be expressed as the sum of concrete contribution (Vc), which depends on
the tensile stresses in concrete, and the shear reinforcement contribution (Vs). However, due to
the significant degradation of concrete shear resistance caused by crisscross shear cracks; the
CSA A23.3 (2014) ignores the concrete contribution in shear strength. Following this concept,
the shear strength of squat walls can be predicted based on the shear capacity of shear
reinforcement only which can be calculated as follows (SI Units):
cots v y vs
A f dV
s
(2.5)
where, s is the material resistance factor (equal 1.0 in case of comparison with experimental),
Av is the area of transverse web reinforcement perpendicular to the axis of member with in the
distance s, fy is the specified yield strength of web reinforcement, dv is the effective shear
depth equal to the greater of 0.9d or 0.72 lw but should not be less than 0.8 lw (Clause
21.6.9.3), θ is the angle of inclination of diagonal compressive stresses to the longitudinal axis
of the wall. Unlike the ACI 318 (2014), a rotating crack provision is used in which the angle
of the principal compression strut varies depending on the longitudinal strain condition and
can be calculated based on the following equations with maximum value of 50 о and minimum
value of 30о:
x 700029 (2.6)
ss
fvfx AE
VdM
2
/ (2.7)
2.3. FRP Composite Materials
The deterioration of reinforced concrete structures due to steel corrosion has become a serious
problem in the last decades. In North America, this phenomenon has been accelerated in many

26 Chapter 2: Literature Review
structures such as parking garages and bridges. This is typically due to temperature fluctuating
and the increasing use of deicing salts. The added cost of repairing deteriorated structures with
replacement costs commonly more than twice the original cost of construction, led to the
adoption of stricter specifications in some building codes and more stringent limits of chloride
ions in construction materials. It also stimulated the recent major research efforts in design and
construction techniques to improve the durability of reinforced concrete.
The use of fiber reinforced polymer (FRP) reinforcing bars as alternative for steel reinforcing
bars has emerged as one of the many techniques to enhance the corrosion resistance of
reinforced concrete structures. In particular, FRP reinforcing bars offer great potential for use
in reinforced concrete construction under conditions in which conventional steel reinforced
concrete has yielded unacceptable service. If correctly applied in the infrastructure area, FRP
can result in significant benefits related to both overall cost and durability. Other advantages
include high-strength and stiffness to-weight ratios, resistance to corrosion and chemical
attack, controllable thermal expansion and damping characteristics as well as electromagnetic
neutrality. In addition, fatigue strength and fatigue damage tolerance for many FRPs
composite showed satisfactory results. Given their lower cost compared to other types of FRP
bars, glass-FRP (GFRP) bars have been used extensively in different applications such as
bridges, parking garages, water tanks, tunnels and marine structures (Erki and Rizkalla 1993,
El-Salakawy et al. 2005; Kassem et al. 2011, Tobbi et al. 2014). A brief summary about FRP
material constituents, manufacturing, types, and properties is presented in the following
subsections.
2.3.1. FRP Constituents
FRP products are composite materials consist of reinforcing fibers impregnated with a matrix
(resin). The fibers are responsible for providing the mechanical strength and stiffness to the
composite, while the resins are responsible for transferring stresses between the fibers,
protecting the fibers from mechanical abrasion, and prevent the fibers from buckling. In order
to provide the reinforcing function, the fiber-volume fraction should be more than 55% for
FRP bars and rods (ISIS 2007).

27
Fibers
The most commonly used material for FRP reinforcement products are aramid, carbon, glass,
and recently basalt fibers. Given their lower cost compared to other types of FRP types, glass-
FRP (GFRP) are more attractive to the construction industry. Glass fibers present many
advantages such as high strength-to-weight ratio, low cost, electromagnetic neutrality, and
chemical resistance. Notwithstanding, the disadvantages are relatively low tensile modulus,
sensitive to abrasion, and relatively low fatigue resistance. Glass fibers are classified as fiber
drawn from an inorganic product of fusion that has cooled without crystallizing. The types of
glass fibers commonly used are E-glass, S-glass and C-glass. E-glass has the lowest cost
among all commercially available reinforcing fibers, which is the reason for its widespread use
in the FRP industry (ISIS 2007).
Matrix (Resin)
The final mechanical properties of the FRP product are significantly affected by the selection
of the proper matrix (resin). The matrix should be able to develop a higher ultimate strain than
the fibers to exploit the full strength of the fibers (Phillips. 1989). There are two types of
polymeric matrices widely used for FRP composites; namely, thermosetting and
thermoplastic. However, thermosetting polymers are used more often than thermoplastic in
FRP industry. They are low molecular-weight liquids with very low viscosity, and their
molecules are joined together by chemical cross-links. Hence, they form a rigid three-
dimensional structure that once set, cannot be reshaped by applying heat or pressure (ISIS
2007).
2.3.2. Manufacturing Process
There are three common manufacturing processes for FRP materials; pultrusion, braiding and
filament winding. Straight FRP bars are produced using the pultrusion technique. In this
method, the continuous strands of the fibers are pulled from a creel of fibers to be impregnated
in a resin tank. Once they are saturated with resin, they are shaped through a heated die at
which they can be cured as shown in Figure 2.10. Before the FRP bars are cut to the required

28 Chapter 2: Literature Review
lengths, the bars surface must be treated in the form of spirals or with sand coating to create
rough surface that creates a strong bond with concrete (ISIS 2007).
Figure 2.10 – Pultrusion process
2.3.3. Mechanical Properties
2.3.3.1. Tensile Strength
When loaded in tension, FRP bars do not exhibit any plastic behavior (yielding) before
rupture. The tensile behavior of FRP bars consisting of one type of fiber material is
characterized by a linearly elastic stress-strain relationship until failure with a general lack of
ductility, very high tensile strength and relatively low modulus of elasticity (Figure 2.11).
Various factors affect the tensile strength of FRP bars. The most significant factors are fiber
type and fiber-volume fraction that is defined as the ratio of the volume of fiber to the overall
volume of the bar over the unit length. Bar manufacturing process, quality control and the rate
of thermoset resin curing also affect tensile strength [ACI 440.1R (2015)].

29
0
500
1000
1500
2000
2500
3000
3500
0 1 2 3 4 5 6
Carbon Aramid
Glass Steel
Figure 2.11 – Stress strain for steel and FRP bars
Unlike steel, the unit tensile strength of an FRP bar can vary with diameter. Faza and
Gangarao (1993) reported that GFRP bars from three different manufacturers exhibited tensile
strength reductions of up to 40% as the diameter increases proportionally from 9.5 to 22.2
mm. However, a 7% strength reduction in pultruded AFRP bars has been observed when the
bar diameter increased from 3 to 8mm. Due to this discrepancy in results, the ACI 440.1R
(2015) design guidelines recommend that the bar manufacturers should be requested to
provide the strength values of different bar sizes.
2.3.3.2. Compression Strength
Limited research has gone into investigating the behavior of FRP bars under compression
load. Tests on FRP bars with a length-diameter ratio from 1:1 to 2:1 have shown that the
compressive strength is lower than the tensile strength (Wu 1990). The compressive modulus
of elasticity of FRP bars depends on length-to-diameter ratio; bar size and type; and other
factors, such as boundary conditions. In the reported results from compression tests, it is
generally agreed that compressive stiffness ranges from 77 to 100% of the tensile stiffness
(Bedard. 1992, Chaallal and Benmokrane 1993, Tavassoli et al. 2015), while the compressive
strength is around 50% of the tensile strength. Experimental test results (Alsayed et al. 1999;
De Luca et al. 2009; ; Issa et al. 2011, Deiveegan and Kumaran 2009) on the behavior of
concrete columns entirely reinforced with glass fiber RC polymer (GFRP) reinforcement have
also demonstrated the feasibility of such structural element. Nevertheless, the current ACI
440.1R (2015) design guidelines still do not recommend using FRP bars as longitudinal

30 Chapter 2: Literature Review
reinforcement in compression members, while the CSA S806 (2012) states that the
compressive contribution of FRP longitudinal reinforcement is negligible.
2.3.3.3. Flexural Strength
The behavior of FRP RC sections is different compared to sections reinforced with traditional
steel reinforcement. This is due to the different mechanical behavior between the two types of
reinforcements. FRP bars exhibit linear stress-strain behavior up to failure without any
yielding. Therefore, tension failure in FRP RC section is sudden and catastrophic; hence, it
should be avoided (Jaeger et al. 1997, Theriault and Benmokrane 1998). On the other hand,
compression failure of FRP RC sections offers more favorable response, as concrete ductility
is utilized in giving ample warnings before failure (Nanni 1993).
Most of current codes and guidelines require FRP RC section to be design for compression
failure. According to ACI 440.1R (2015), a large amount of FRP reinforcement to be provided
in the tension zone of flexural members in order to obtain compression failure mode which is
the most ductile failure mode, as well as, for controlling crack width and deflection. The CSA
S6 (2014) and CSA S806 (2012), on the other hand, recommends that the moment of
resistance of flexure member cross section reinforced with FRP should be at least 50% greater
than the cracking moment, to avoid brittle failure.
2.3.3.4. Shear Strength
As identified by Joint ACI-ASCE Committee 445 (ACI-ASCE 1998), cracked reinforced
concrete members resist the applied shear stresses by the following five mechanisms: (1) shear
stresses in uncracked concrete; (2) aggregate interlock; (3) dowel action of the longitudinal
reinforcing bars; (4) arch action; and (5) residual tensile stresses transmitted directly across the
cracks. Aggregate interlock results from the resistance to relative slip between the two rough
interlocking surfaces of the crack, much like frictional resistance. As long as the crack is not
too wide, this action can be significant (Razaqpur et al. 2001). Dowel forces generated by
longitudinal bars crossing the crack partially resist shearing displacements along the crack.
Arching action occurs in deep members or in members having shear span-to-depth ratio less
than 2.5 (Razaqpur et al. 2004). The residual tension in cracked concrete is reported to be
present for cracks less than 0.15 mm in width (ACI-ASCE Committee 445. 1998).

31
Due to the relatively low modulus of elasticity of FRP bars, concrete members reinforced with
FRP will develop wider and deeper cracks than members reinforced with steel. Deeper cracks
decrease the contribution to shear strength from the uncracked concrete due to the lower depth
of concrete in compression. Wider cracks, in turn, decrease the contributions from aggregate
interlock and residual tensile stresses. Additionally, due to the relatively small transverse
strength of FRP bars and the relatively wider cracks, the contribution of dowel action may be
negligible. Eventually, the overall shear capacity of concrete members reinforced with FRP
bars as flexural reinforcement is lower than that of concrete members reinforced with steel
bars.
2.3.3.5. Fatigue Strength
Fatigue refers to the degradation or failure of a structural material or element after repeated
cycles of loading and unloading. Factors such as the material properties of the concrete and
reinforcement, reinforcement ratio, transverse reinforcement, minimum and maximum values
of repeated loading, range and rate of loading, all play a major role in estimate fatigue life and
fatigue strength of reinforced concrete elements. The environmental factors such as
temperature and humidity also affect the fatigue life and strength. According to many
researchers, FRP bars exhibit good fatigue resistance (Uomoto and Ohga 1996, Demers 1998,
Adimi et al. 2000, El-Ragaby et al. 2007). It was documented that carbon-epoxy composites
have better fatigue strength than steel, while the fatigue strength of glass composites is lower
than steel at low stress ratio. Even though GFRP is weaker than steel in fatigue, tests on
specimens with unbonded GFRP dowel bars have shown fatigue behavior similar to that of
steel dowel bars for cyclic transverse shear loading of up to 10 million cycles. The test results
and the stiffness calculations have shown that an equivalent performance can be achieved
between FRP and steel bars subjected to transverse shear by changing some of the parameters,
such as diameter, spacing, or both (Porter et al. 1993).
2.3.3.6. Bent Portion Strength
Currently-available FRP reinforcing bars are fabricated using thermosetting resin matrices and
consequently cannot be bent on site. Bends and hooks, when required, must be produced by

32 Chapter 2: Literature Review
the bars’ manufacturer during the fabrication process. It is possible to obtain bends and hooks
in virtually any geometry from current FRP rebar manufacturers (Figure 2.12), although
minimum bend radius is typically larger than for steel bars due to significant weakening of
FRP bars around tight corners. Typical minimum allowable bend radius for FRP bars are 3.5
to 4 times the bars’ diameter and these bends are accompanied by up to 50 percent reduction
in the tensile strength of the bar at the bend (ISIS 2007).
Figure 2.12 – Bends in GFRP bars reinforcement
Many studies have reported a significant reduction in the tensile strength of bent FRP bars and
stirrups at the location of the bend. For instance, Shehata et al. (2000) reported that the bend
strength generally decreases with decreasing bend radius and can be as low as 35% of the
tensile capacity of straight portions of the bar. Other investigation conducted by Morphy et al.
(1997) on 16 specimens with different types of CFRP stirrups, it was recommended limiting
the strength of CFRP stirrups to 50% of the ultimate straight bar capacity for design. The CSA
S806 (2012) recommends that bend portion strength shall be taken equal to 40% of the straight
portion tensile strength while the ACI 440.1R (2015) gives the following equation for bend
portion strength estimation (SI units):
fuFubbFRPbend ffdrf )3.0/05.0( (2.8)
where fFRPbend is the bend portion strength, rb is the bend portion’s radius, db is the bar
diameter, ffu is the ultimate tensile strength for straight portion.

33
2.4. FRP RC Structural Systems for Seismic Forces
2.4.1. Structural Frame Systems
Moment-resisting frames are rectilinear assemblages of beams and columns that are well
detailed in a standard way to be able to resist gravity and seismic loads. The philosophy
behind the seismic design of frame systems is to provide them with sufficient ductility by
which they can dissipate the acting seismic energy (Mady et al. 2011). However, due to the
elastic nature of FRP up to failure, concerns have been raised about its applicability as internal
reinforcement in earthquake resisting frames that require the inelastic behavior (ductility) of
reinforcement. To address this issue, many investigations have been conducted to validate the
feasibility of FRP RC frame in earthquake regions. A brief summary for the implemented
works, ordered chronologically, is given as following.
The first investigation was conducted by Fukuyama and Masuda (1995) on a half-scale three-
story concrete frame totally reinforced with braided aramid fiber polymer reinforcing bars.
The frame had 1800 mm story height, and 3500 mm span (between column centers). The
selected reinforcement ratios for the beams were 0.64% and 0.48% at the bottom and top;
respectively. Meanwhile, the main reinforcement ratio of the columns was 1.47%. The
specimen was tested under reversed cyclic loading applied at the mid-height of the third floor
up to failure. It was reported that the frame remained elastic up to a drift angle of 1/50 rad, and
no substantial decrease in strength took place after rupture of some main beam bars due to the
high degree of indeterminacy of the frame. Due to the elastic behavior of FRP bars in
tension, the unloading branch of hysteresis loops was observed to aim towards the origin with
negligible residual deformations. This indicated that rehabilitation of FRP RC frame would be
much easier than the case if it was reinforced with steel.
Said and Nehdi (2004) tested two full-scale beam-column joint specimens; one reinforced with
steel while the other with GFRP grids in order to investigate their performance under the event
of an earthquake. Beams and columns cross section were similar and measured 250 × 400 mm.
The GFRP RC specimen was designed to have a similar flexural capacity to that of the control
steel RC specimen, thus inducing a comparable level of joint shear input. The GFRP RC

34 Chapter 2: Literature Review
specimen showed a satisfactory drift capacity, assuming a minimum drift requirement of 3%
as recommended in the literature for ductile frame buildings. However, the joint showed very
low plasticity features resulting in lower energy dissipation compared to that of the
conventional steel RC beam-column joint.
Sharbatdar and Saatcioglu (2009) conducted an experimental program including testing two
types of reinforced concrete elements; square columns and rectangular beams. The elements
represent portions of column and beam elements between rigidly attached adjoining members
and the points of contra-flexure, as cantilever specimens. Four specimens of each element
were constructed and reinforced with carbon FRP bars and carbon FRP grids as longitudinal
and transverse reinforcement, respectively. The studied parameters were the shear span length
and the spacing of transverse reinforcement. The columns were tested under constant axial
load and lateral cyclic load while the beams were tested under cyclic load only. The test
results indicated that FRP RC concrete beams and columns can attain a lateral drift ratio up to
3%, while essentially remaining elastic in spite of the softening induced by cracking. It was
concluded that using FRP as flexural and shear reinforcement in concrete frames is feasible.
Given the elastic nature of FRP bars; however, it was suggested that FRP RC frames should be
designed based on elastic member behavior (i.e. the seismic reduction factor is equal to the
unity) while taking advantage of relative flexibility of FRP material and the associated
elongations in the fundamental period of structures with potentially reduced seismic demand
(Figure 2.13).
Figure 2.13 – Effect of the lengthening of period on design force levels (Sharbatdar and
Saatcioglu 2009)

35
Hasaballa (2009) tested four full-scale exterior T-shaped beam-column joints. The first
specimen was reinforced with longitudinal and transverse steel bars and served as a reference
specimen. The second was similar to the first; however, GFRP bars were used in the
longitudinal direction. The other two specimens were reinforced with GFRP bars and stirrups
with different reinforcement ratio. Each specimen was simulating a beam-column connection
of an exterior bay in a multi-bay, multistory reinforced concrete moment-resisting plane
frame. It was concluded that although steel RC specimen was able to dissipate energy in the
order of 2 to 3 times that of the GFRP specimens, the residual strains in the GFRP flexural
reinforcement at the 4.0% drift ratio were much lower than in steel RC specimen. This
indicated that the joint will regain its original shape after removing the loads, thus requiring
minimum amount of repair.
Mady et al. (2011) continued the investigation that started by Hasaballa (2009). A total of five
full-scale beam-column joint prototypes were constructed and tested under cyclic loading up
to failure. The first test specimen was reinforced with conventional steel bars and stirrups and
used as a control specimen. The second specimen was reinforced with GFRP bars and steel
stirrups. The remaining three specimens were totally reinforced with GFRP bars and stirrups
with different reinforcement ratios. The findings revealed that GFRP RC joints can be
designed to satisfy both strength and deformability requirements. The tested GFRP RC
concrete beam-column joints safely achieved 4.0% drift capacity with insignificant damage.
The obtained drift capacities were more than the 2.5% required by the NBCC (NBCC 2005)
and the 3.5% required by the ACI 374.1 (2005). The results also demonstrated that increasing
the beam reinforcement ratio can enhance the ability of the joint to dissipate the seismic
energy through utilizing the inelastic behavior of concrete as long as the joint is safe under the
applied shear stresses.
Tavassoli et al. (2015) carried out an experimental program including nine circular columns.
The main investigated variables were the axial load level, the type of GFRP bars, and size and
spacing of GFRP spirals. The specimens were tested under constant axial load and lateral
cyclic displacement excursions. The axial load was either 0.28Po or 0.42Po, where Po is the
nominal axial load capacity of the column. Two types of GFRP bars were used. The diameter

36 Chapter 2: Literature Review
of spiral was either 12 mm or 16 mm and spaced at a distance ranged from 50 mm to 275 mm.
Experimental results in the form of moment-versus-curvature and shear-versus-tip deflection
hysteretic responses and various ductility parameters were presented and compared with
results of similar steel RC circular columns which conducted by Sheikh and Khoury (1993).
The results showed that concrete columns reinforced with GFRP bars and spirals can behave
in a manner that has stable post-peak response and achieve high levels of deformability. The
results also indicated that due to the large stiffness of GFRP bars than steel beyond yielding,
GFRP RC columns performed in a more stable manner than the companion steel RC
specimens.
Ali and El-Salakawy (2016) tested eight full-scale rectangular column prototypes under
combined lateral cyclic quasi-static and constant axial loading. The test specimens represented
the lower portion of first-story columns between the footing and the contra-flexure point. The
test parameters included longitudinal reinforcement type and ratio, level of axial load, and
stirrup spacing. Test results showed that the drift capacity of GFRP reinforced concrete (RC)
rectangular columns at failure ranged between 8.5 and 12.5%, which highly exceeds the
limitations of North American building codes. This indicates that the deformability of GFRP-
RC column prototypes successfully replaced the ductility in steel–RC columns in dissipating
the seismic energy in the presence of constant axial load. Furthermore, there was insignificant
strength degradation before failure due to the well-confined concrete core.
Naqvi and El-Salakawy (2016) studied the effect of using lap splices in GFRP-RC rectangular
columns subjected to cyclic-reversed loads. The experimental program comprised six
specimens; five reinforced with GFRP bars while the last specimen reinforced with steel and
served as a reference. The test parameters included lap splice length of longitudinal
reinforcement and transverse reinforcement spacing. Test results indicated that a splice length
of 60 times the diameter of the longitudinal column bar was adequate in transferring the full
bond forces along the splice length. In addition, lap-spliced GFRP-RC columns with closely
spaced transverse reinforcement showed stable hysteresis response and achieved high levels of
deformability, which far exceeded the limitations of the North American building codes.

37
2.4.2. Shear Walls
Shear walls are broadly used as the first line of defense against earthquake excitations and
they have many advantages over moment-resisting frames. Compared to the studies conducted
in FRP RC resisting frames; however, very little research has been done in investigating the
feasibility of shear walls reinforced with GFRP in regions prone to earthquake excitations. The
first attempt was conducted by Yamakawa and Fujisaki (1995) on seven wall specimens
reinforced with CFRP grids. The specimens were tested under reversed cyclic lateral loading
while simultaneously subjected to constant axial load. All specimens exhibited early
degradation in lateral load capacity when 1% drift was achieved associated with low energy
dissipation. The authors attributed the poor performance to three main reasons: (1) the CFRP
grids were not able to carry compressive stress and therefore experienced fracture under low
compressive stresses, (2) there was a need to design adequate development length to prevent
the reinforcing bars from pulling out of the wall base, and (3) the CFRP grid reinforcement did
not provide concrete confinement.
Mohamed (2014a) started another study to investigate the cyclic behavior of shear walls
internally reinforced with GFRP bars. From the learned lessons in Yamakawa and Fujisaki
study, the authors strove to avoid all brittle failures that might occur in shear walls and that
would prevent them from reaching their capacities. Four large-scale shear walls—one
reinforced with steel bars (as reference specimen) and three totally reinforced with GFRP
bars—were constructed and tested to failure under quasistatic reversed cyclic lateral loading.
The main parameter is the wall’s aspect ratio (height/length). The three GFRP RC walls, G10,
G12, and G15 had aspect ratio of 3.5, 2.9 and 2.3, respectively. The steel specimen ST15
served as a reference for G15, hence the it had the same concrete dimensions and axial
stiffness. The reported test results clearly showed that properly designed and detailed GFRP
RC walls could reach their flexural capacities with no strength degradation, and that shear,
sliding shear, and anchorage failures were not major problems and could be effectively
controlled. It was also reported that GFRP RC walls showed a recoverable and self-centering
behavior up to allowable drift limits before moderate damage occurred and achieved a
maximum drift level meeting the limitation of most building codes.
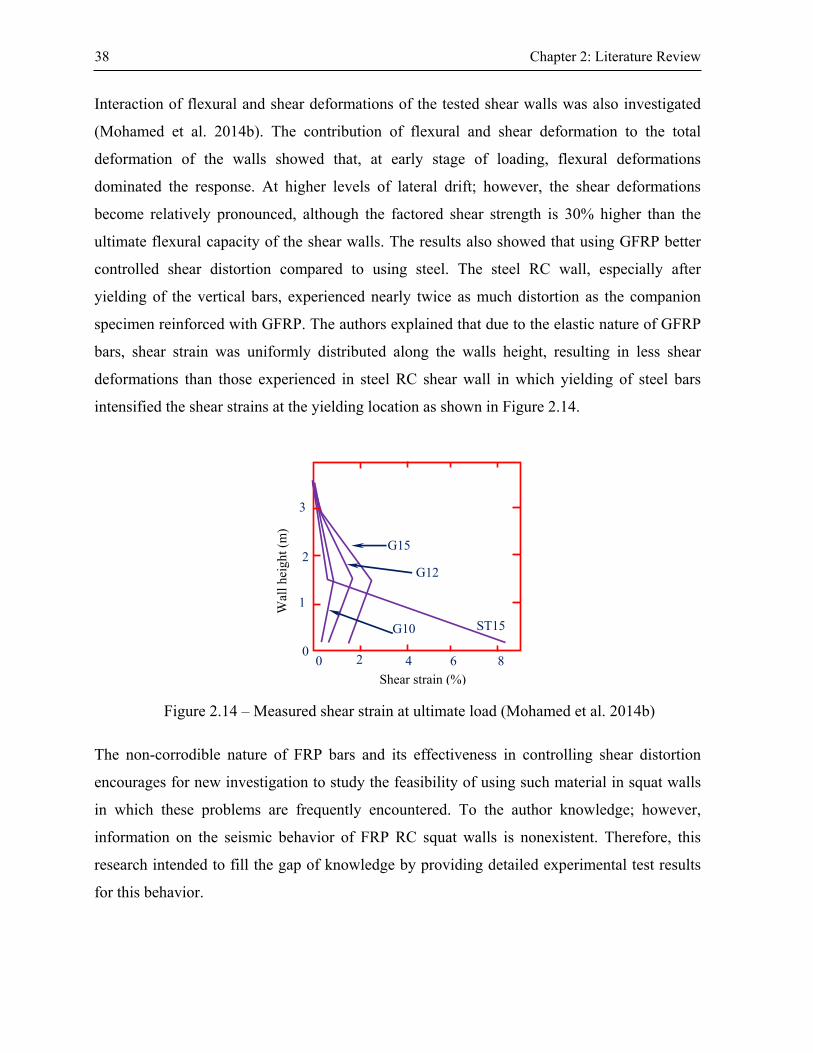
38 Chapter 2: Literature Review
Interaction of flexural and shear deformations of the tested shear walls was also investigated
(Mohamed et al. 2014b). The contribution of flexural and shear deformation to the total
deformation of the walls showed that, at early stage of loading, flexural deformations
dominated the response. At higher levels of lateral drift; however, the shear deformations
become relatively pronounced, although the factored shear strength is 30% higher than the
ultimate flexural capacity of the shear walls. The results also showed that using GFRP better
controlled shear distortion compared to using steel. The steel RC wall, especially after
yielding of the vertical bars, experienced nearly twice as much distortion as the companion
specimen reinforced with GFRP. The authors explained that due to the elastic nature of GFRP
bars, shear strain was uniformly distributed along the walls height, resulting in less shear
deformations than those experienced in steel RC shear wall in which yielding of steel bars
intensified the shear strains at the yielding location as shown in Figure 2.14.
Figure 2.14 – Measured shear strain at ultimate load (Mohamed et al. 2014b)
The non-corrodible nature of FRP bars and its effectiveness in controlling shear distortion
encourages for new investigation to study the feasibility of using such material in squat walls
in which these problems are frequently encountered. To the author knowledge; however,
information on the seismic behavior of FRP RC squat walls is nonexistent. Therefore, this
research intended to fill the gap of knowledge by providing detailed experimental test results
for this behavior.
Wal
l hei
ght (
m)
G15
G12
ST15 G10
0 2 4 6 8 0
1
2
3
Shear strain (%)


CHAPTER 3 EXPERIMENTAL PROGRAM
3.1. Introduction
The details of the experimental program that included nine large-scale squat walls are
presented in this chapter. The design, construction and testing of the specimens at the
Structural Engineering Laboratory at the University of Sherbrooke are discussed in details.
3.2. Test Matrix
Nine large-scale squat walls with an aspect ratio (height to length ratio) of 1.3 were
constructed and tested under quasi-static reversed cyclic lateral loading up to failure. One
specimen was reinforced with conventional steel bars and served as a control specimen; the
remaining eight were entirely reinforced with GFRP bars. The preliminary design and details
have been conducted according to according to CSA A23.3 (2014) and CSA S806 (2012) for
steel RC wall and GFRP RC walls, respectively. It should be noted that since there is no
seismic provisions in the CSA S806 (2012), similar methodologies that are being using in the
companion code was followed. The specimens measured 1500 mm in length, 2000 mm in
height, and 200 mm in thickness. The walls’ thickness satisfied the CSA A23.3 (2014) Clause
14.1.7.1 requirement for the minimum thickness. Each specimen was cast with an integral
2700 ×1200 × 700 mm3 heavily reinforced foundation; functioning as anchorage for the
vertical reinforcement and to enable the specimen to be fixed to the laboratory floor. Figure
3.1 shows the concrete dimensions of the test specimens.
Two boundary elements with equal width and breadth (200 × 200 mm) were placed at each
end of the horizontal length. The longitudinal and transverse reinforcement ratios at the
boundary elements were kept constant in all specimens; 1.43% and 0.89%, respectively. The
longitudinal reinforcement involved 8 No. 10 (#3) GFRP or steel bars and laterally tied against
premature buckling by using transverse reinforcement No. 10 spiral (#3) GFRP or steel ties
with spacing of 80 mm which is approximately the maximum spacing permitted in CSA S806
39

40 Chapter 3: Experimental Program
(2012). Two layers of web reinforcement were used in all walls according to CSA A23.3
(2014).
Figure 3.1 – Overall dimensions of test walls
The specimens were arranged to investigate the influence of the following parameters on the
behavior:
1. Reinforcement type (GFRP, steel);
2. Horizontal web reinforcement ratio (0.0%, 0.51%, 0.79%, 1.58%, and 3.56%);
3. Existence of vertical web reinforcement (0.0%, 0.59%);
4. Use of bidiagonal web reinforcement; and
5. Use of bidiagonal sliding reinforcement.
The first specimen G4-80 was designed to have almost equal flexural and shear capacities.
The horizontal web reinforcement consisted of two layers of No. 13 (#4) GFRP bars spaced at
80 mm. The vertical web reinforcement consisted of two layers of No. 10 (#3) GFRP bars
spaced at 120 mm. Sliding shear was prevented by adding one layer of bidiagonal No. 10 (#3)
GFRP bars across the potential sliding plane at an angle of 45°, spaced at 100 mm and
sufficiently anchored on each side of the shear plane. The anchorage length for both the
vertical reinforcement and bidiagonal sliding reinforcement was equal to the development
1500
200
2000 500
350
350
1200
2700
700
2000
350 All dimensions in mm
Position of Dywidag bars fixing the foundation to the laboratory floor the laboratory floor

41
length specified in CSA S806 (2012) multiplied by 1.25 to account for the cyclic effect as
suggested by Mohamed et al. (2014a). The steel RC wall (S4-80) served as a control specimen
for G4-80, so both had identical reinforcement configurations and ratios. It should be
mentioned that this configuration ensured S4-80 would fail in flexure, since its shear strength
against either sliding or diagonal tension was much higher than its flexural strength.
Three specimens; G4-250, G4-160, and G6-80 were reinforced identically to G4-80; however,
with different horizontal web reinforcement ratios; 0.51%, 0.79%, and 3.58% using No. 13
(#4) GFRP bars with spacing of 250, 160 or No. 19 (#6) with spacing 80 mm, respectively.
Two other specimens were constructed with either vertical or horizontal web reinforcement,
G-V, and G-H, respectively, to test the absence of horizontal or vertical web reinforcement on
the behavior. Specimen G-V was reinforced with vertical web reinforcement identical to that
used in the prescribed four GFRP RC specimens while specimen G-H was reinforced with
horizontal web reinforcement identical to specimen G4-250. Another specimen, GD, was
designed to investigate the effect of using bidiagonal web reinforcement instead of horizontal
and vertical web reinforcement. The specimen was reinforced with two layers of bidiagonal
No. 10 GFRP bars spaced at 100 mm with angle of 45° relative to the longitudinal axis of the
wall. The web reinforcement details were selected such that GD had a flexural capacity similar
to its counterpart specimen G4-80. It should be mentioned that although GD had less web
reinforcement than G4-80, GD’s predicted shear strength was almost twice that of G4-80 due
to the absence of bent portions, which are responsible for the lower strength of horizontal web
reinforcement; more details is discussed in Ch. 4. In an attempt to investigate the sliding-shear
resistance of GFRP, specimen G4 was built identical to G4-80 but without bidiagonal sliding-
shear reinforcement. The base for all specimens was reinforced with 25M Grade 60 deformed
steel bars spaced at 100 mm in each direction in both upper and lower levels. All specimens
had a concrete cover of 25 mm. The used reinforcement ratios in each specimen are listed in
Table 3.1. Figure 3.2 shows reinforcement details of the tested specimens.

42 Chapter 3: Experimental Program
Table 3.1 – Reinforcement details
Wall fc'
(MPa)
Reinforcement Ratio
ρl (%) ρt (%) ρv (%) ρh (%) ρd (%) ρs (%)
S4-80 35 1.43 0.89 0.59 1.58 ---- 0.48
G4-250 35 1.43 0.89 0.59 0.51 ---- 0.48
G4-160 35 1.43 0.89 0.59 0.79 ---- 0.48
G4-80 40 1.43 0.89 0.59 1.58 ---- 0.48
G6-80 41 1.43 0.89 0.59 3.56 ---- 0.48
G-V 38 1.43 0.89 0.59 ---- ---- 0.48
G-H 35 1.43 0.89 ---- 0.51 ---- 0.48
GD 34 1.43 0.89 ---- ---- 0.71 0.95
G4 40 1.43 0.89 0.59 1.58 ---- ---- fc' = concrete compressive strength; ρl = boundary longitudinal-bar reinforcement ratio; ρt = boundary-tie reinforcement ratio; ρv = web vertical-bar reinforcement ratio; ρh = horizontal web reinforcement ratio; ρd = bidiagonal web reinforcement ratio; ρs = bidiagonal sliding-shear reinforcement ratio.
Figure 3.2 – Reinforcement details
Reinforcement details for S4-80, G4-250, G4-160, G4-80, and G6-80
Vertical web reinf.
Horizontal reinforcement details
No. 10 steel or GFRP @ 100
Θ = 45°
No.10 steel or GFRP @ 120
8 No.13 steel or GFRP
Horizontal web reinf.
Vl. boundary
A
No.13 or No.19 steel or GFRP @
S
A
No. 13 GFRP @S= 250 mm for G4-250
No. 13 GFRP @S= 160 mm for G4-160
No. 13 GFRP @S= 80 mm for G4-80
No. 19 GFRP @S= 80 mm for G6-80
No. 13 steel @S = 80 mm for S4-80
Sliding reinf.
Sec A-A
200
Vl. No.10@ 120
Hz. No.13 or No. 19 @ S
8 No.10 Vl. boundary
2001500
200
No. 10 ties @ 80

43
Figure 3.2 – Reinforcement details (continued)
200
Reinforcement details for G-V
Hz No.13 @250 8No.10 GFRP Vl. boundary
Horizontal web reinf.
No. 13 GFRP@ 250 Vertical web reinf.
GFRP No.10 @ 100
Θ = 45°
No.10 GFRP @ 120
8 No.13 GFRP
Vl. boundary
A A
Reinforcement details for GD
GFRP No.10 @ 120
Reinforcement details for G4
Boundary Element 8 GFRP No. 10
Vertical Reinf.
GFRP No.13 @ 80Horizontal Reinf.
Sec A-A (G-H)
200
8 No.10 GFRP Vl. boundary
2001500
200
No.10 GFRP ties @ 80 mm
Sliding reinf.
Sec A-A (G-V)
Sliding reinf.
Vl No.10 GFRP @ 120
2001500
200
No.10GFRP ties @ 80 mm
Diagonal Web Reinf. No.10 GFRP @ 100
Sec A-A (GD)
2001500
200
8 No.10 GFRP Vl. boundary
200
200
Vl No.10 GFRP @ 120
Hz No.13 GFRP @ 80
8 No.10 GFRP Vl. boundary
Sec A-A (G4)
2001500
200
A A A A
Reinforcement details for G-H
GFRP No.10 @ 100
Θ = 45°
8 No.10 GFRP
Vl. boundary
A A
8 GFRP No. 10
Boundary Element
GFRP No.10 @ 100
Θ = 45°

44 Chapter 3: Experimental Program
3.3. Material Properties
The test specimens were cast using normal-weight, ready-mixed concrete with a target 28-day
compressive strength of 40 MPa. Table 3.1 gives the actual concrete compressive strength (fc')
based on the average of at least three 100 × 200 mm cylinders for each concrete batch on the
day of specimen testing. An average concrete tensile strength of 3.5 MPa was obtained from
the split-cylinder tests. Specimen S4-80 contained No. 10 (#3) and No. 13 (#4) grade 420
deformed steel bars: No. 10 (#3) for vertical and rectilinear spiral reinforcement; No. 13 (#4)
for horizontal reinforcement. The GFRP reinforcing bars consisted of three diameters of Grade
III sand-coated bars (CSA S807 2015): No. 10 (#3) for vertical and rectilinear spiral
reinforcement and No. 13 (#4) and No. 19 (#6) for horizontal reinforcement. The longitudinal
tensile properties of the GFRP bars were determined by testing five specimens according to
ASTM D7205 (2011), in the case of the straight bars, and test method B.5 in ACI 440.3R
(2004), in the case of the bent bars. The manufacturer provided the properties of the steel bars.
Table 3.2 lists the material properties of the reinforcing bars. Figure 3.3 shows the vertical,
horizontal, and rectilinear spiral GFRP reinforcement.
Table 3.2 – Reinforcement mechanical properties
Bar
Designated Bar
Diameter (mm)
Nominal Area1
(mm2)
Immersed Area (mm2)
Tensile Modulus of Elasticity2
(GPa)
Tensile Strength2*
(MPa)
Average Strain at Ultimate
(%)
Straight bars No. 10 GFRP 9.53 71.3 84 65 1372 2.1No. 10 steel 9.5 71 --- 200 fy = 420 εy = 0.2No. 13 steel 12.8 129 --- 200 fy= 420 εy = 0.2Bent No. 10 GFRP – rectilinear spiralStraight 9.5 71 84 50 1065 2.1Bent --- 460 ---Bent No. 13 GFRP – horizontal bar Straight 12.7 127 143 50 1020 2.0Bent --- 459 ---Bent No. 19 GFRP – horizontal bar Straight 19.1 285 315 50 1028 2.0Bent --- 463 ---fy: steel yielding strength, εy: steel yielding strain. 1According to CSA S807 (CSA, 2010) 2 Tensile properties were calculated using nominal cross-sectional areas. *Guaranteed tensile strength: Average value – 3 × standard deviation (ACI 440 2006)

45
Rectilinear spiral (No. 10 GFRP)
Horizontal bars
Vertical bar (No. 10 GFRP)
No. 13 GFRP
No. 19 GFRP
Figure 3.3 – GFRP reinforcement
3.4. Specimens Construction
The specimens were constructed at the Structural Laboratory in the Department of Civil
Engineering at the University of Sherbrooke. Efforts have been made to fabricate and cast the
specimens in upright position to ensure realistic construction site conditions. The construction
started with assembling of the steel base cage in wooden formwork (Figure 3.4). Then the wall
cages were instrumented and assembled to the base steel cage (Figure 3.5) followed by
preparation of wall formwork (Figure 3.6). Casting of the specimens was implemented in two
stages. The base was cast first. The rest of the specimen was cast 2 days later, without taking
any specific measures for curing at the construction joint in order to represent the construction
practices used for an actual reinforced concrete (RC) building site (Figure 3.8). One day later,
the specimens were wrapped with wet burlap and plastic sheets and cured for 7 days then left
to the date of testing. Figure 3.9 shows the specimens after construction and curing.
Figure 3.4 – Prepared formwork and cage of the base

46 Chapter 3: Experimental Program
Figure 3.5 – Assembly of the wall cage to the base cage
Figure 3.6 – Assembly and alignment of wall formwork
Figure 3.7– Casting the base
S4-80 G4-80 GD

47
Figure 3.8 – Casting the wall
Figure 3.9 – Specimens after curing
3.5. Preliminary Design of Specimens
The predicted flexural strength for the investigated walls was calculated based on plane
sectional analysis. The analysis was based on strain compatibility, internal force equilibrium,
and the controlling mode of failure. The calculation was carried out considering the
unconfined and confined concrete section. The contribution of the GFRP longitudinal bars in
compression to the flexural strength was considered by assuming its strength in compression is
50% of its tensile strength as suggested by Deitz et al. (2003) with keeping the modulus of
elasticity is constant. The contribution of the diagonal web reinforcement or sliding-shear

48 Chapter 3: Experimental Program
reinforcement was obtained by considering their components in the longitudinal direction of
the wall.
Regarding the shear capacity, due to the absence of seismic provisions for GFRP RC squat
walls in CSA S806 (2012), we adopted the concept provided in CSA A23.3 (2014) for steel.
Clause 21.5.10.8 in CSA A23.3 (2014) specifies that, under seismic loading, the shear force is
to be resisted by horizontal web reinforcement only with no reliance on the concrete
contribution to shear strength. This is due to the effect of criss cross shear cracks and the
subsequent degradation of concrete shear resistance. The shear strength of the steel RC wall
was determined as follows:
s
dfAVV vyvs
ssr
cot (3.1)
where Vr is the shear strength, Vss is the shear resistance provided by the horizontal web
reinforcement, s is the material resistance factor for steel, Av is the area of horizontal web
reinforcement within the distance s, fy is the specified yield strength of the horizontal web
reinforcement, dv is the effective shear depth equal to the greater of 0.9d or 0.72 lw but not less
than 0.8 lw, θ is the angle of inclination of diagonal compressive stresses to the longitudinal
axis of the wall and equal to 45°, and s is the spacing of the horizontal web reinforcement
measured along the longitudinal axis of the wall.
The shear capacity of horizontal web reinforcement in the GFRP RC walls was calculated as
follows:
s
dfAVV vfuvf
sfr
cot4.0 , l 700030 ,
ff
fvfl AE
VdM
2
(3.2)
where, f is the material resistance factor for GFRP; εl is the longitudinal strain at mid-depth
of the section; Mf and Vf are the bending moment and shear force at the critical section for
shear, respectively; and θ ranges from 30° to 60°.
For specimen GD, which had bidiagonal web reinforcement, the shear resisted by the diagonal
web reinforcement was computed from the general formula as follows:

49
s
dfAVV vfuvf
sfr
sin)cot(cot (3.3)
where α is the angle between the diagonal bars and the longitudinal axis of the member.
It should be noted that CSA S806 (2012) currently limits the stress level in the FRP
transverse-reinforcement stirrups to (1) avoid failure at the bent portion of the FRP stirrup, (2)
control shear-crack widths under service load, and (3) maintain the maximum size of the
diagonal cracks at ultimate state so as to not seriously diminish shear transfer by aggregate
interlock. Based on the available geometric requirement for the bent portion, the ultimate
strength of the bent portion ranged between 0.4 and 0.45 fu. CSA S806 (2012) conservatively
recommends the ultimate strength be equal 0.4fu. To limit the allowable crack-width size
under service load, CSA S806 (2012) limits the maximum strain in the stirrups to 5000
μstrain. This level of strain was also found to satisfy the third condition of maintaining shear
transfer through aggregate interlock (Razaqpur and Spadea 2015). Since our study ignored the
shear capacity carried by concrete (in terms of aggregate interlock and dowel action) and due
to the elastic nature of GFRP bars, which should enable the cracks to realign and close after an
earthquake, the second and third criteria were omitted. Hence, the ultimate strength of the
GFRP was limited to 0.4fu (Eq. 4.2). In specimen GD, which contained bidiagonal web
reinforcement, the bar stress was limited to fu due to the absence of bent portions (Eq. 4.3).
Construction joints in squat walls may drastically degrade under cyclic loading and become
the weakest link in the chain, resulting in premature sliding-shear failure. Clause 8.4.4.9 in
CSA A23.3 (2014) gives the following equation for calculating the resistance to sliding-shear
failure:
cosr c s v y fv c f (3.4)
where vr (MPa) is the sliding-shear strength; λ is a factor to account for low-density concrete,
c is the resistance factor for concrete, c is the cohesion stress, μ is the coefficient of friction,
fy is the yield strength for the steel, λc(c + μσ) shall not exceed 0.25c fc', f is the resistance
factor for steel, and αf is the angle between the shear-friction reinforcement and the shear
plane.
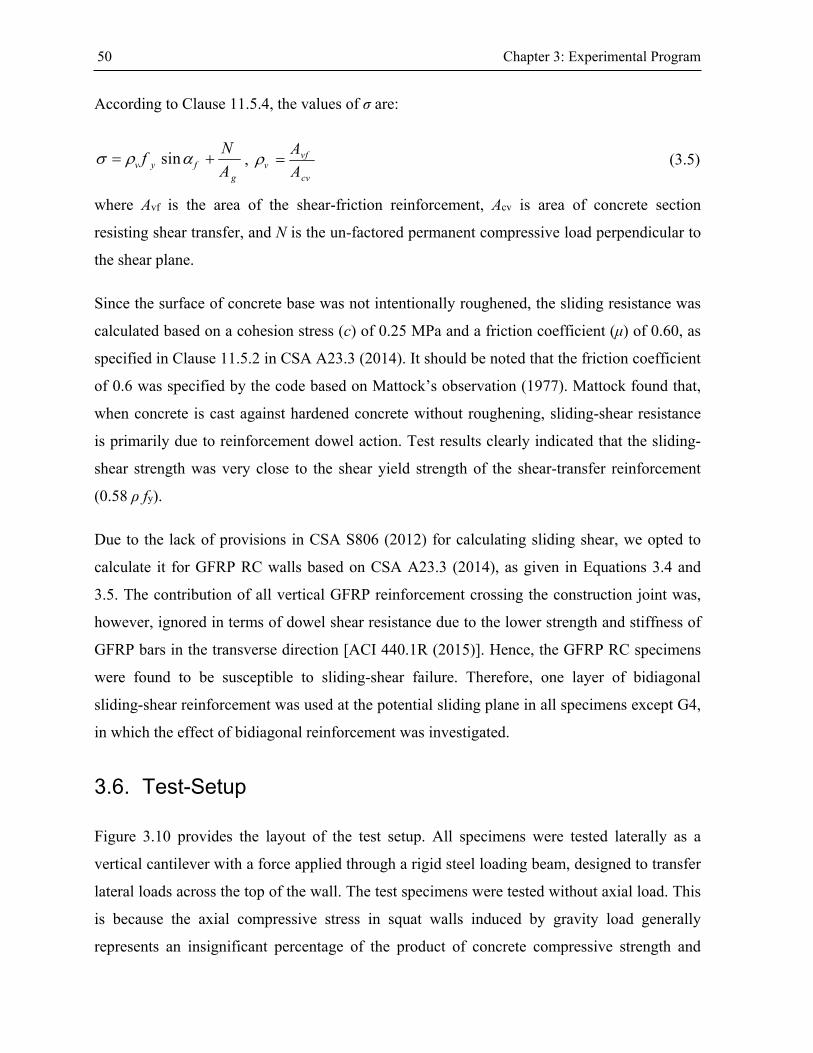
50 Chapter 3: Experimental Program
According to Clause 11.5.4, the values of σ are:
sinv y fg
Nf
A , vf
vcv
A
A (3.5)
where Avf is the area of the shear-friction reinforcement, Acv is area of concrete section
resisting shear transfer, and N is the un-factored permanent compressive load perpendicular to
the shear plane.
Since the surface of concrete base was not intentionally roughened, the sliding resistance was
calculated based on a cohesion stress (c) of 0.25 MPa and a friction coefficient (μ) of 0.60, as
specified in Clause 11.5.2 in CSA A23.3 (2014). It should be noted that the friction coefficient
of 0.6 was specified by the code based on Mattock’s observation (1977). Mattock found that,
when concrete is cast against hardened concrete without roughening, sliding-shear resistance
is primarily due to reinforcement dowel action. Test results clearly indicated that the sliding-
shear strength was very close to the shear yield strength of the shear-transfer reinforcement
(0.58 ρ fy).
Due to the lack of provisions in CSA S806 (2012) for calculating sliding shear, we opted to
calculate it for GFRP RC walls based on CSA A23.3 (2014), as given in Equations 3.4 and
3.5. The contribution of all vertical GFRP reinforcement crossing the construction joint was,
however, ignored in terms of dowel shear resistance due to the lower strength and stiffness of
GFRP bars in the transverse direction [ACI 440.1R (2015)]. Hence, the GFRP RC specimens
were found to be susceptible to sliding-shear failure. Therefore, one layer of bidiagonal
sliding-shear reinforcement was used at the potential sliding plane in all specimens except G4,
in which the effect of bidiagonal reinforcement was investigated.
3.6. Test-Setup
Figure 3.10 provides the layout of the test setup. All specimens were tested laterally as a
vertical cantilever with a force applied through a rigid steel loading beam, designed to transfer
lateral loads across the top of the wall. The test specimens were tested without axial load. This
is because the axial compressive stress in squat walls induced by gravity load generally
represents an insignificant percentage of the product of concrete compressive strength and

51
gross area. Additionally, adding axial loading will increase the sliding resistance of GFRP-
reinforced squat walls which was questionable at the preliminarily design. Hence, the author
opted to study sliding resistance provided exclusively by GFRP bars while conservatively
omitting the effect by axial load. The test setup of the squat walls is summarized in the
following steps:
1. The base was strictly aligned and fixed to the laboratory floor by four pre-stressing 66
mm diameter Dywidag bars (high strength steel bars) to prevent uplifting and/or
horizontal sliding during the application of lateral loading
2. Lateral load was applied to the wall specimen with an MTS hydraulic actuator with a
maximum capacity of 1000 kN and a maximum stroke of ±250 mm. The actuator was
jointly connected to the transfer steel beam and transmitted lateral load to the specimen
through a 50 mm thick steel bearing plate. Lateral loads were applied at 2550 mm
above the base of the wall.
3. Out-of-plane bracing was provided at the level of transfer steel beam to prevent
twisting of the wall specimen during testing. The out of plane supporting consisted of
two steel beams attached to the reaction wall with two bearing rollers at the end
attached to the transfer steel beam.
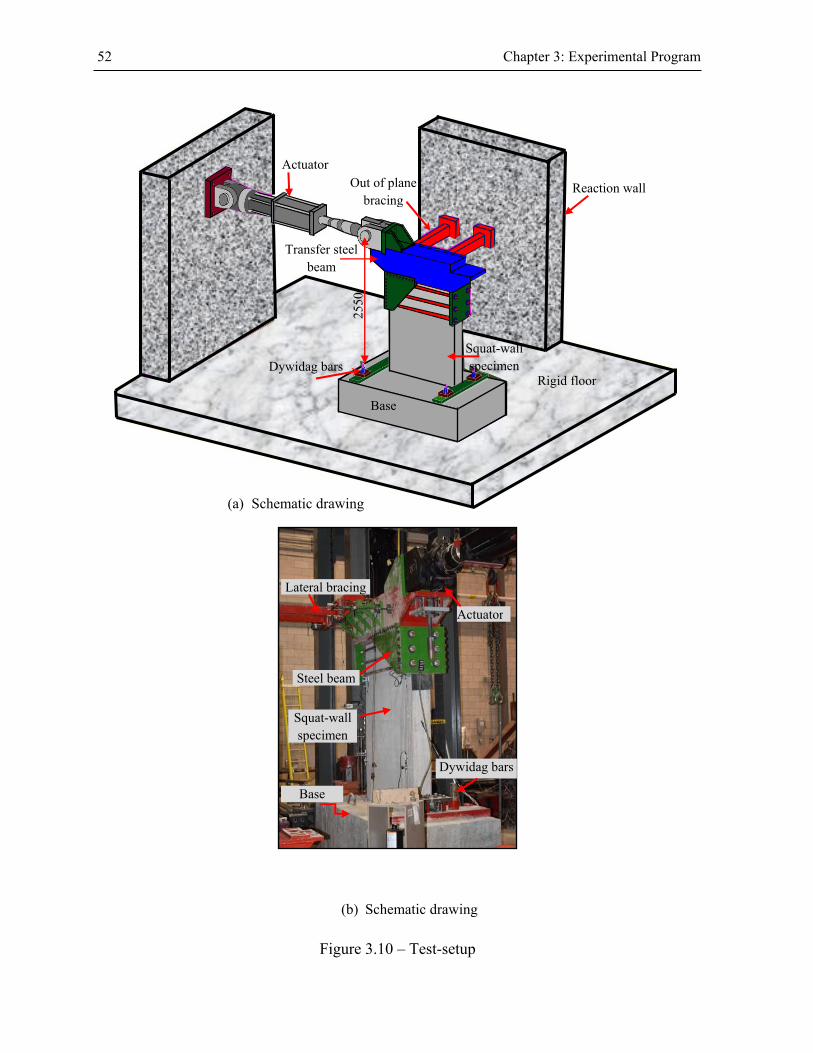
52 Chapter 3: Experimental Program
Figure 3.10 – Test-setup
(b) Schematic drawing
Reaction wall
Rigid floor
Base
Squat-wall specimen
Transfer steel beam
Actuator
Out of plane
bracing
Dywidag bars25
50
Lateral bracing
Actuator
Steel beam
Squat-wall specimen
Base
Dywidag bars
(a) Schematic drawing

53
3.7. Loading Procedure
The loading procedure for all specimens followed the recommendations of the American
Concrete Institute (ACI) Committee 374 Report on the acceptance criteria for testing
reinforced concrete structural elements under Slowly Applied Simulated Seismic Loads [ACI
374.2R (2013)]. The walls were cycled twice at each displacement level with increments of
0.1% up to 0.5% lateral drift, followed by increments of 0.25% up to 2.5%, and then
increments of 0.5% to failure. Figure 3.11 gives a typical sequence of displacement cycles.
Figure 3.11– Loading history of testing program
3.8. Instrumentations
For each specimen, a total of 22 electrical resistance strain gauges are attached to the
reinforcing bars (boundary and web reinforcement) at critical locations to measure strains as
shown in Figure 3.12. Two longitudinal bars of the main boundary reinforcement are
instrumented at the extreme compression and tension fibers at two height levels of the walls;
200 mm from the base, and at height h = lw/2. Three vertical web bars were instrumented at
three height levels; 200 mm from the base, lw/2, and lw. This pattern gives the distribution of
the vertical strains both along the horizontal length of the walls and along the instrumented
-4
-3
-2
-1
0
1
2
3
4
-80
-60
-40
-20
0
20
40
60
80
0 5 10 15 20 25 30Cycle number
Lat
eral
dis
plac
emen
t (m
m)
Lat
eral
dri
ft (
%)

54 Chapter 3: Experimental Program
bars. Similarly, horizontal web reinforcement was instrumented with strain gauges at the same
three height levels of walls. This pattern of gauging gives the distribution of horizontal strains
at three different levels and along the instrumented bars. Further four strain gauges were
attached to sliding reinforcement at sliding plane. For specimen GD, the diagonal web
reinforcement was instrumented at three levels; 200 mm from the base, lw/2, and lw, in a
pattern similar to that in the companion specimen with horizontal and vertical web
reinforcement.
Figure 3.12 – Stain gauges instrumentation
Deformation response was monitored by a series of linear variable displacement transducers
(LVDTs) as shown in Figure 3.13. Two LVDTs were installed to measure the lateral
displacement at two levels; one at the wall tip, while the other at a height equal to the wall
length (lw). One LVDT was mounted between the wall and base to measure sliding
displacement. One LVDT was used to measure the sliding between the base and laboratory
rigid floor, if any. Two LVDTs are mounted close to the boundary elements to measure the
concrete strain and wall curvature. Two LVDTs were installed at the wall ends to measure the
axial deformations of the boundaries, by which the rotation between wall and base can be
calculated. Shear distortion was calculated based on the X-configuration LVDTs inclined at
45° and attached of a square panel with dimension of lw × lw. For the sake of safety, further
l w
l w / 2
20
0
l w
l w / 2
200

55
two LVDTs were attached to the upper steel beam to measure the top out-of-plane
deformation. The flexural and shear cracks width were also measured through two LVDTs
mounted at the first two major cracks.
The foregoing system of measurements made it possible to estimate the flexural, shear, and
sliding components of the wall deformation, as discussed in the following sections. These
estimates were also based on a series of strain gage measurements at various positions along
the reinforcing bars.
Figure 3.13 – LVDTs instrumentation
Lateral displacement at h=lw
Lateral top displacement Out-of-plane displacement
Concrete strain
Diagonal LVDT Vertical LVDT
Wall-base sliding
Base-floor sliding
h= l w


CHAPTER 4
EXPERIMENTAL BEHAVIOR OF GFRP-
REINFORCED CONCRETE SQUAT WALLS
SUBJECTED TO SIMULATED EARTHQUAKE
LOAD
Foreword
Authors and Affiliation
o Ahmed Arafa: PhD candidate, Department of Civil Engineering, University of
Sherbrooke.
o Ahmed Sabry Farghaly: Postdoctoral Fellow, Department of Civil Engineering,
University of Sherbrooke, and Associate Professor, Assiut University, Egypt.
o Brahim Benmokrane: Department of Civil Engineering, University of Sherbrooke,
Sherbrooke.
Journal: Journal of Composites for Construction, ASCE
Paper status: Submitted on October 6, 2016
Reference: Arafa, A., Farghaly, A. S., and Benmokrane, B., 2016, “Experimental Behavior of
GFRP-Reinforced Concrete Squat Walls subjected to Simulated Earthquake
Load,” Journal of Composites for Construction, ASCE.
56

57
Contribution in thesis:
This chapter includes the test results of specimen S4-80, G4-80, G6-80, G4, and GD. The
feasibility of using GFRP RC squat walls as a lateral seismic system is discussed. The main
differences in behavior between steel and GFRP RC walls in term of crack pattern and failure
mode, drift capacity and ultimate strength as well as the energy dissipation, are presented. The
effect of using either bidiagonal web reinforcement or sliding reinforcement is also evaluated.
Additionally, the preliminary design of specimens was assessed.
Abstract
This study addressed the feasibility of reinforced-concrete squat walls totally reinforced with
glass-fiber-reinforced-polymer (GFRP) bars achieving the strength and drift requirements
specified in various codes. Using noncorrodible GFRP bars represents an effective method for
overcoming deterioration due to corrosion problems. The previous experimental studies on
GFRP-reinforced mid-rise shear walls showed that GFRP reinforcement can control shear
deformation, which is a major problem in steel-reinforced squat walls. Five full-scale concrete
squat walls with an aspect ratio (height to length ratio) of 1.3—one reinforced with steel bars
(as a reference specimen) and four totally reinforced with GFRP bars—were constructed and
tested to failure under quasi-static reversed cyclic lateral loading. The reported test results
clearly show that properly designed and detailed GFRP-reinforced concrete squat walls can
reach high deformation levels with no strength degradation. The results also show that the
achieved drift satisfies the limitation in most building codes. Acceptable levels of energy
dissipation, compared to the steel-reinforced squat wall, were observed. The promising results
can provide impetus for constructing concrete walls reinforced with GFRP and constitute a
step toward using GFRP reinforcement in such lateral-resisting systems.
Keywords: GFRP bars, concrete walls, hysteretic response, energy dissipation

58 Chapter 4: Experimental Behavior Of GFRP-Reinforced Concrete Squat Walls Subjected
4.1. Introduction
Squat walls are defined as structural walls with a height to length ratio less than 2.0, which is
widely used as the primary seismic-force-resisting component in low-rise structures such as
nuclear facilities and industrial buildings. Squat walls also frequently serve as bridge piers and
abutments (Paulay et al. 1982).
Because of their low aspect ratio, squat walls generate high shear forces at their bases to
develop structural flexural strength. This makes shear capacity a major issue in squat walls’
design since the ductile behavior induced by the inelastic flexural yielding cannot be achieved
(Paulay et al. 1982, Kuang and Ho 2008, Whyte and Stojadinovic 2014). Experimental
investigations of squat walls have demonstrated that their behavior is dominated by inelastic
shear deformations (shear distortion or sliding shear), indicating that these deformations
develop and significantly increase with the onset of flexural-reinforcement yielding
(Saatcioglu 1991, Massone et al. 2009, Takahashi et al. 2013, Luna et al. 2015). These
deformations, in turn, rapidly degrade strength and stiffness with subsequent shear-induced
damage.
Thousands of bridges and parking garages in North America that use squat walls need repair
and rehabilitation, or complete replacement due to corrosion problems. Using fiber-reinforced-
polymer (FRP) bars as the main reinforcement in concrete structures in harsh environments is
becoming a widely accepted solution to override corrosion issues [ACI 440 (2007)]. Since
glass-FRP (GFRP) bars are relatively less expensive compared to the other commercially
available FRP bars, GFRP bars in reinforced concrete structures have found their way into
numerous applications such as bridge deck slabs, beams, and columns (El-Salakawy et al.
2005; Kassem et al. 2011, Tobbi et al. 2014).
With the requirement of designing a multistory building with adequate strength and stiffness
using GFRP reinforcement, Mohamed et al. (2014a) recently conducted an experimental study
to investigate the feasibility of using GFRP bars to reinforce mid-rise shear walls that would
resist lateral loads. The reported test results clearly revealed that properly designed and
detailed GFRP-reinforced walls could reach their flexural capacities with no strength
degradation and with reasonable deformability in an inelastic stage. It was also found that

59
using elastic materials (GFRP bars) distributed the shear strain along the wall height, resulting
in controlled shear deformation relatively to the localized shear deformation in the yielding
zone experienced by steel-reinforced shear walls (Mohamed et al. 2014b). Controlling shear
deformation and solving corrosion problems in mid-rise shear walls with GFRP bars calls for
investigations into the applicability of GFRP bars for reinforcing squat walls, in which these
issues dominate. It is worth mentioning that none of the current FRP design codes and
guidelines [CSA S806 (2012), ACI 440.1R (2015)] provide any recommendations about the
seismic design of GFRP-reinforced squat walls.
This study aimed at assessing the behavior of GFRP-reinforced squat walls under quasi-static
reversed cyclic loading to simulate seismic loading. The investigation focused mainly on the
assessment of failure characters, drift capacity, ultimate strength, and hysteretic response.
Documentation on the amount of energy dissipation attained by the tested walls is also
presented and the prediction of ultimate strength is assessed.
4.2. Experimental Program
4.2.1. Test Matrix of Specimens
Five large-scale squat walls with an aspect ratio (height to length ratio) of 1.3 were
constructed and tested under quasi-static reversed cyclic lateral loading up to failure. One
specimen (ST4-80) was reinforced with conventional steel bars and served as a control
specimen; the remaining four (G4-80, G6-80, GD, and G4) were entirely reinforced with
GFRP bars. The walls were designed and detailed according to CSA A23.3 (2014) and CSA
S806 (2012). The specimens measured 1500 mm in length, 2000 mm in height, and 200 mm in
thickness. Each specimen was cast vertically to ensure realistic construction-site conditions
and connected to a rigid base. Figure 4.1 shows the concrete dimensions and reinforcement
details of the test specimens.

60 Chapter 4: Experimental Behavior Of GFRP-Reinforced Concrete Squat Walls Subjected
Figure 4.1 – Concrete dimensions and reinforcement details
GFRP No.10 @ 120
Hz. Steel or GFRP No.13 or No.19@ 80
d) Reinforcement configurations for G4
Boundary Element 8 GFRP No.10
Vertical Reinf.
GFRP No.13 @ 80Horizontal Reinf.
a) Concrete dimensions
1500
200
1200
2700
700
2000
Boundary element
8 steel or GFRP No.10
No.10 steel or GFRP @ 120vertical reinf.
No.13 or No.19 steel or GFRP
horizontal reinf.
No.10 steel or GFRP @ 100Θ = 45°
c) Reinforcement configurations for GD
8 GFRP No.10
Boundary Element
GFRP No.10 @ 100
Θ = 45°
Diagonal Web Reinf. No.10 GFRP @ 100
f) Hz. Cross section in GD
200 1500
200
8 No.10 GFRP Vl. boundary
200
Vl No.10 steel or GFRP @ 120
8 No.10 steel or GFRP Vl boundary
e) Hz. Cross section in ST4-80, G4-80, and
2001500
200 Sliding reinf.
200
200
Vl No.10 GFRP @ 120
Hz No.13 GFRP @ 80
8 No.10 GFRP Vl boundary
g) Hz. Cross section in G4
2001500
200

61
All specimens were reinforced with the same longitudinal and transverse reinforcement ratios
in the boundaries. The longitudinal reinforcement in the boundaries consisted of 8 No. 10 (#3)
bars (steel or GFRP) and were laterally tied with No. 10 (#3) rectilinear spiral transverse
reinforcement (steel or GFRP), and spaced at 80 mm along the total wall height, which is
approximately the maximum spacing permitted in CSA S806 (2012). Two layers of web
reinforcement were used in all walls according to CSA A23.3 (2014).
Specimen G4-80 was designed to have almost equal flexural and shear capacities. The
horizontal web reinforcement consisted of two layers of No. 13 (#4) GFRP bars spaced at 80
mm. The vertical web reinforcement consisted of two layers of No. 10 (#3) GFRP bars spaced
at 120 mm. Sliding shear was prevented by adding one layer of bidiagonal No. 10 (#3) GFRP
bars across the potential sliding plane at an angle of 45°, spaced at 100 mm and sufficiently
anchored on each side of the shear plane. The anchorage length for both the vertical
reinforcement and bidiagonal sliding reinforcement was equal to the development length
specified in CSA S806 (2012) multiplied by 1.25 to account for the cyclic effect as suggested
by Mohamed et al. (2014a). The steel-reinforced wall (S4-80) served as a control specimen for
G4-80, so both had identical reinforcement configurations and ratios. It should be mentioned
that this configuration ensured S4-80 would fail in flexure, since its shear strength was much
higher than its flexural strength.
Specimen G6-80 was identical to G4-80 except that No. 19 (#6) horizontal web reinforcement
was used. Specimen GD was designed to investigate the effect of using bidiagonal web
reinforcement instead of horizontal and vertical web reinforcement. The specimen was
reinforced with two layers of bidiagonal No. 10 (#3) GFRP bars spaced at 100 mm with angle
of 45° relative to the longitudinal axis of the wall. The web reinforcement details were
selected such that GD had a flexural capacity similar to its counterpart specimen G4-80. It
should be mentioned that although GD had less web reinforcement than G4-80, GD’s
predicted shear strength was almost twice that of G4-80 owing to the absence of bent portions,
which are responsible for the lower strength of horizontal web reinforcement; more details are
discussed in specimen design section. To investigate the sliding-shear resistance of GFRP,
specimen G4 was built identical to G4-80 but without the bidiagonal sliding-shear

62 Chapter 4: Experimental Behavior Of GFRP-Reinforced Concrete Squat Walls Subjected
reinforcement. The base for all specimens was reinforced with 25M Grade 420 deformed steel
bars spaced 100 mm in each direction in both upper and lower levels. All specimens had a
concrete cover of 25 mm. Table 4.1 lists the reinforcement details of the tested walls.
Table 4.1 – Reinforcement details and calculated capacities of the walls
Wall fc'
(MPa)
Reinforcement Ratio Pu
(kN)
Vr (kN)
Vs (KN)
Unconfined Confined
ρl ρt ρv ρh ρd ρs Vfunc (kN)
Pu/Vfunc
Vfcon (kN)
Pu /Vfcon
S4-80 35 1.43 0.89 0.59 1.58 ---- 0.48 534 1625 1358 586 0.91 624 0.86
G4-80 40 1.43 0.89 0.59 1.58 ---- 0.48 912 895 1459 623 1.46 901 1.01
G6-80 41 1.43 0.89 0.59 3.56 ---- 0.48 935 2030 1459 630 1.48 943 0.99
GD 34 1.43 0.89 ---- ---- 0.71 0.95 804 1851 2841 604 1.33 919 0.87
G4 40 1.43 0.89 0.59 1.58 ---- ---- 740 895 75 553 1.34 776 0.95
fc' = concrete compressive strength; ρl = boundary longitudinal-bar reinforcement ratio; ρt = boundary-tie reinforcement ratio; ρv = web vertical-bar reinforcement ratio; ρh = horizontal web reinforcement ratio; ρd = bidiagonal web reinforcement ratio; ρs = bidiagonal sliding-shear reinforcement ratio; Pu = experimental ultimate strength; Vr = predicted shear strength; Vs = predicted sliding-shear strength; Vfunc = predicted flexural strength for unconfined section; Vfcon= predicted flexural strength for confined section.
4.2.2. Material Properties
The test specimens were cast using normal-weight, ready-mixed concrete with a target 28-day
compressive strength of 40 MPa. Table 4.1 gives the actual concrete compressive strength (fc')
based on the average of at least three 100 × 200 mm cylinders for each concrete batch on the
day of specimen testing. Specimen S4-80 contained No. 10 (#3) and No. 13 (#4) grade 420
deformed steel bars: No. 10 (#3) for vertical and rectilinear spiral reinforcement; No. 13 (#4)
for horizontal reinforcement. The GFRP reinforcing bars consisted of three diameters of Grade
III sand-coated bars [CSA S807 (2015)]: No. 10 (#3) for vertical and rectilinear spiral
reinforcement and No. 13 (#4) and No. 19 (#6) for horizontal reinforcement. The longitudinal
tensile properties of the GFRP bars were determined by testing five specimens according to
ASTM D7205 (2011), in the case of the straight bars, and test method B.5 in ACI 440.3R
(2004), in the case of the bent bars. The manufacturer provided the properties of the steel bars.
Table 4.2 lists the material properties of the reinforcing bars. Figure 4.2 shows the vertical,
horizontal, and rectilinear spiral reinforcement and a typical assembled cage.

63
Rectilinear spiral (No. 10 GFRP)
Horizontal bars
Vertical bar (No. 10 GFRP)
No. 13 GFRP
No. 19 GFRP
Assembly of wall cage
Table 4.2 – Reinforcement mechanical properties
Bar
Designated Bar
Diameter (mm)
Nominal Area1
(mm2)
Immersed Area (mm2)
Tensile Modulus of Elasticity2
(GPa)
Tensile Strength2*
(MPa)
Average Strain at Ultimate
(%)
Straight bars No. 10 GFRP 9.53 71.3 84 65 1372 2.1No. 10 steel 9.5 71 --- 200 fy = 420 εy = 0.2No. 13 steel 12.8 129 --- 200 fy= 420 εy = 0.2Bent No. 10 GFRP – rectilinear spiralStraight 9.5 71 84 50 1065 2.1Bent --- 460 ---Bent No. 13 GFRP – horizontal barStraight 12.7 127 143 50 1020 2.0Bent --- 459 ---Bent No. 19 GFRP – horizontal barStraight 19.1 285 315 50 1028 2.0Bent --- 463 ---fy: steel yielding strength, εy: steel yielding strain. 1According to CSA S807 (CSA, 2010) 2 Tensile properties were calculated using nominal cross-sectional areas. *Guaranteed tensile strength: Average value – 3 × standard deviation (ACI 440 2006)
Figure 4.2 – GFRP reinforcement and wall cage
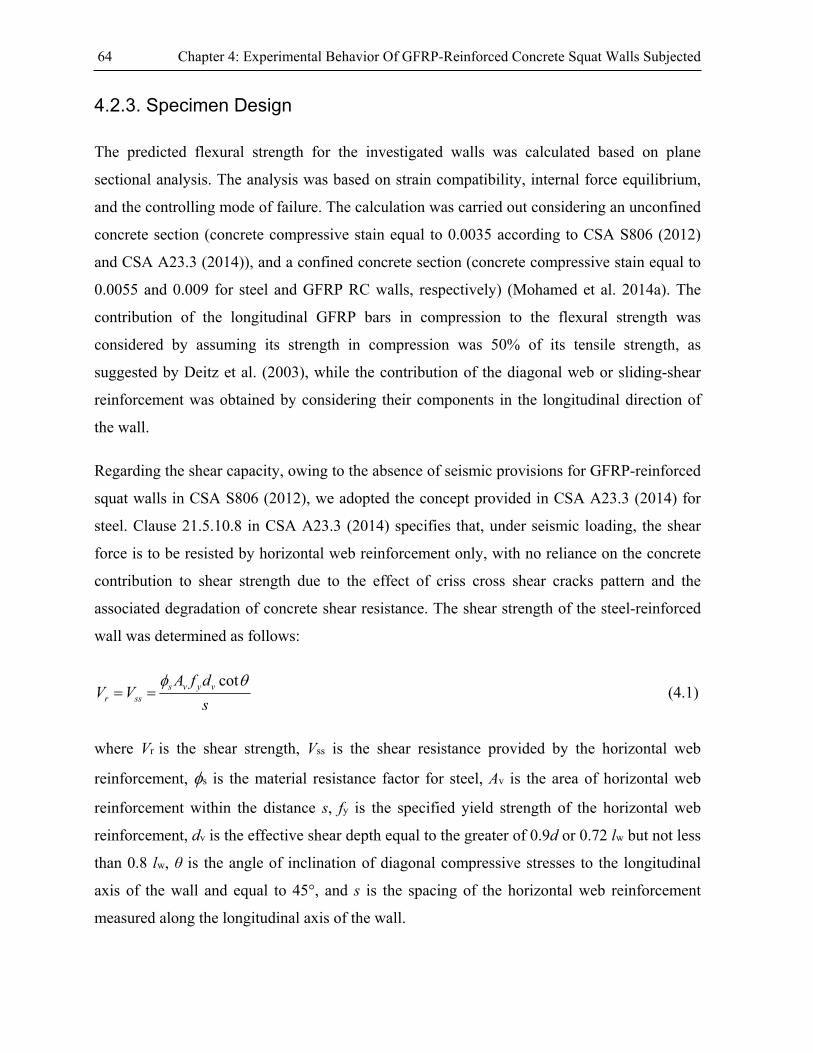
64 Chapter 4: Experimental Behavior Of GFRP-Reinforced Concrete Squat Walls Subjected
4.2.3. Specimen Design
The predicted flexural strength for the investigated walls was calculated based on plane
sectional analysis. The analysis was based on strain compatibility, internal force equilibrium,
and the controlling mode of failure. The calculation was carried out considering an unconfined
concrete section (concrete compressive stain equal to 0.0035 according to CSA S806 (2012)
and CSA A23.3 (2014)), and a confined concrete section (concrete compressive stain equal to
0.0055 and 0.009 for steel and GFRP RC walls, respectively) (Mohamed et al. 2014a). The
contribution of the longitudinal GFRP bars in compression to the flexural strength was
considered by assuming its strength in compression was 50% of its tensile strength, as
suggested by Deitz et al. (2003), while the contribution of the diagonal web or sliding-shear
reinforcement was obtained by considering their components in the longitudinal direction of
the wall.
Regarding the shear capacity, owing to the absence of seismic provisions for GFRP-reinforced
squat walls in CSA S806 (2012), we adopted the concept provided in CSA A23.3 (2014) for
steel. Clause 21.5.10.8 in CSA A23.3 (2014) specifies that, under seismic loading, the shear
force is to be resisted by horizontal web reinforcement only, with no reliance on the concrete
contribution to shear strength due to the effect of criss cross shear cracks pattern and the
associated degradation of concrete shear resistance. The shear strength of the steel-reinforced
wall was determined as follows:
s
dfAVV vyvs
ssr
cot (4.1)
where Vr is the shear strength, Vss is the shear resistance provided by the horizontal web
reinforcement, s is the material resistance factor for steel, Av is the area of horizontal web
reinforcement within the distance s, fy is the specified yield strength of the horizontal web
reinforcement, dv is the effective shear depth equal to the greater of 0.9d or 0.72 lw but not less
than 0.8 lw, θ is the angle of inclination of diagonal compressive stresses to the longitudinal
axis of the wall and equal to 45°, and s is the spacing of the horizontal web reinforcement
measured along the longitudinal axis of the wall.

65
The shear capacity of horizontal web reinforcement in the GFRP-reinforced walls was
calculated as follows:
s
dfAVV vfuvf
sfr
cot4.0 , l 700030 ,
ff
fvfl AE
VdM
2
(4.2)
where, f is the material resistance factor for GFRP; is the longitudinal strain at mid-depth
of the section; Mf and Vf are the bending moment and shear force at the critical section for
shear, respectively; and θ ranges from 30° to 60°.
For specimen GD, which had bidiagonal web reinforcement, the shear resisted by the diagonal
web reinforcement was computed from the general formula as follows:
s
dfAVV vfuvf
sfr
sin)cot(cot (4.3)
where α is the angle between the diagonal bars and the longitudinal axis of the member.
It should be noted that CSA S806 (2012) currently limits the stress level in the FRP
transverse-reinforcement stirrups to: (1) avoid failure at the bent portion of the FRP stirrup, (2)
control shear-crack widths under service load, and (3) constrain the maximum size of the
diagonal cracks at ultimate state to not seriously diminish shear transfer by aggregate
interlock. Based on the available geometric requirement for the bent portion, the ultimate
strength of the bent portion ranged between 0.4 and 0.45 fu. The CSA S806 (2012)
conservatively recommends the ultimate strength be equal 0.4fu. To limit the allowable crack-
width size under service loads, CSA S806 (2012) limits the maximum strain in the stirrups to
5000 με. This level of strain was also found to satisfy the third condition of maintaining shear
transfer through aggregate interlock (Razaqpur and Spadea. 2015). Since our study ignored the
shear capacity carried by concrete (in terms of aggregate interlock and dowel action) as well
as the elastic nature of GFRP bars, which should enable the cracks to realign and close after an
earthquake, the second and third criteria were omitted. Hence, the ultimate strength of the
GFRP was limited to 0.4fu (Equation 4.2). In specimen GD, which contained bidiagonal web

66 Chapter 4: Experimental Behavior Of GFRP-Reinforced Concrete Squat Walls Subjected
reinforcement, the bar stress was limited to fu owing to the absence of bent portions (Equation
4.3).
Construction joints in squat walls may drastically degrade under cyclic loading and become
the weakest link in the chain, resulting in premature sliding-shear failure. Clause 8.4.4.9 in
CSA A23.3 (2014) gives the following equation for calculating the resistance to sliding-shear
failure:
cosr c s v y fv c f (4.4)
where vr (MPa) is the sliding-shear strength; λ is a factor to account for low-density concrete,
c is the resistance factor for concrete, c is the cohesion stress, μ is the coefficient of friction, fy
is the yield strength for the steel, λc (c + μσ) shall not exceed 0.25c fc', f is the resistance
factor for steel, and αf is the angle between the shear-friction reinforcement and the shear
plane.
According to Clause 11.5.4, the values of σ and ρ are:
sinv y fg
Nf
A , vf
vcv
A
A (4.5)
where Avf is the area of the shear-friction reinforcement, Acv is area of concrete section
resisting shear transfer, and N is the unfactored permanent compressive load perpendicular to
the shear plane.
Since the surface of concrete base was not intentionally roughened, the sliding resistance was
calculated based on a cohesion stress (c) of 0.25 MPa and a friction coefficient (μ) of 0.60, as
specified in Clause 11.5.2 in CSA A23.3 (2014) It should be noted that the friction coefficient
of 0.6 was specified by the code based on Mattock (1977). He found that, when concrete is
cast against hardened concrete without roughening, sliding-shear resistance is primarily due to
reinforcement dowel action. Test results clearly indicated that the sliding-shear strength was
very close to the shear yield strength of the shear-transfer reinforcement (0.58 ρ fy).

67
Due to the lack of provisions in CSA S806 (2012) for calculating sliding shear, we opted to
calculate it for GFRP-reinforced walls based on CSA (2014), as shown in Equations 4.4 and
4.5. The contribution of all vertical GFRP reinforcement crossing the construction joint was,
however, ignored in terms of dowel shear resistance due to the lower strength and stiffness of
GFRP bars in the transverse direction [ACI 440.1R (2015)]. Hence, the GFRP-reinforced
specimens were found to be susceptible to sliding-shear failure. Therefore, two layers of
bidiagonal sliding-shear reinforcement were used in the potential sliding plane in all
specimens except G4, in which the effect of bidiagonal reinforcement was investigated. Table
4.1 provides the predicted strength in flexure, shear, and sliding shear of the tested specimens.
It should be noted that the material-reduction factors and safety factors were only used in the
design to reflect uncertainties in material characteristics as well as contractor quality. In the
experimental study, however, all resistance factors were set to unity since the material
characteristics were accurately determined and the specimens were produced in the laboratory
under high quality control.
4.2.4. Test Setup and Procedure
Figure 4.3 provides the layout of the test setup. All specimens were tested laterally as a
vertical cantilever with force applied through a top comprised of a specially fabricated steel
load-transfer assembly. Since the axial compressive stress in squat walls due to gravity load
generally represent an insignificant percentage of the product of concrete compressive strength
and gross area, the test specimens were tested without axial load. The lateral cyclic
displacement was applied at 2550 mm above the base of the wall with a hydraulic actuator
with a maximum capacity of 1000 kN and a maximum stroke of ± 250 mm. Out-of-plane
bracing was employed at the level of the steel transfer beam to prevent out-of-plane
displacement during testing.
The seismic loading in this study was applied in several steps under displacement-control
mode throughout the test. Each loading step consisted of two identical displacement cycles
with increments of ±2 mm up to 10 mm, followed by increments of ±5 mm up to 50 mm, and
thereafter increments of ±10 mm up to failure. Figure 4.4 gives a typical sequence of
displacement cycles.
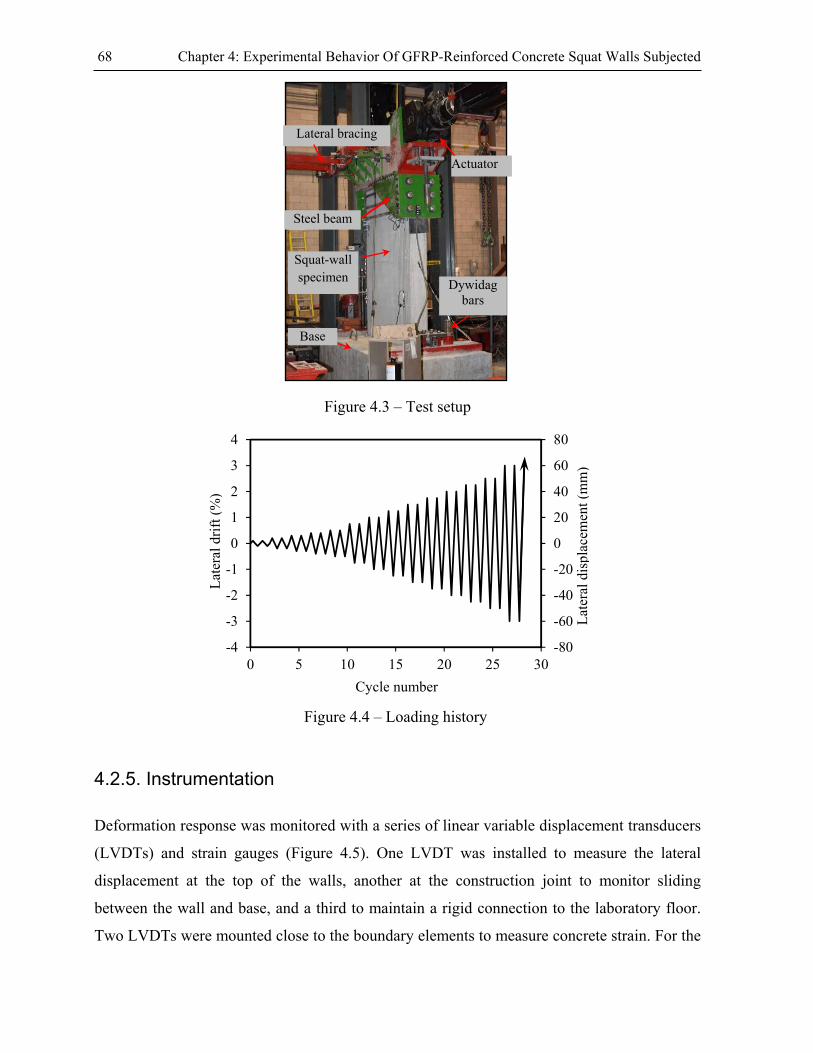
68 Chapter 4: Experimental Behavior Of GFRP-Reinforced Concrete Squat Walls Subjected
Figure 4.3 – Test setup
Figure 4.4 – Loading history
4.2.5. Instrumentation
Deformation response was monitored with a series of linear variable displacement transducers
(LVDTs) and strain gauges (Figure 4.5). One LVDT was installed to measure the lateral
displacement at the top of the walls, another at the construction joint to monitor sliding
between the wall and base, and a third to maintain a rigid connection to the laboratory floor.
Two LVDTs were mounted close to the boundary elements to measure concrete strain. For the
Lateral bracing
Actuator
Steel beam
Squat-wall specimen
Base
Dywidag bars
Cycle number
Lat
eral
dis
plac
emen
t (m
m)
Lat
eral
dri
ft (
%)
-4
-3
-2
-1
0
1
2
3
4
-80
-60
-40
-20
0
20
40
60
80
0 5 10 15 20 25 30

69
sake of safety, two more LVDTs were attached to the upper steel beam to measure the top out-
of-plane deformation. Crack width was also measured with two LVDTs mounted at the first
two major cracks.
Figure 4.5 – Instrumentation
4.3. Test Results and Discussion
4.3.1. General Behavior and Mode of Failure
Figure 4.6 depicts the typical crack propagation for the tested walls. Initially, a few cracks—
predominantly horizontal—propagated in the lower part of the walls. With further loading,
these cracks acquired some inclination in the central zone of the web due to shear stresses and
propagated up to one-third of the wall height. As loading continued, new shear cracks tended
to propagate closer to the top of the wall. These cracks were steeper than those propagated in
the lower part of the wall. Their inclination and width were, however; significantly lower close
to the boundary element. This control stems from the presence of heavy reinforcement and
confinement in the boundary elements, which are known to favorably affect the shear capacity
of squat walls (Salonikios et al. 1999, Kassem 2015). As larger displacements were imposed,
flexural shear or shear cracks originating from each side continued to progressively extend
down to the opposite side with increased inclination and intersected each other forming a
crisscross pattern. With increased displacement, cover splitting gradually initiated at the most
compressed fibers of the boundary, as shown in Figures 4.7a and 4.8a for the steel- and GFRP
Lateral top displacement
Out-of-plane displacement
Concrete strain
Wall–base sliding
Base–floor sliding

70 Chapter 4: Experimental Behavior Of GFRP-Reinforced Concrete Squat Walls Subjected
RC squat walls, respectively, associated with gradual spalling of the concrete cover (Figures
4.7b and 4.8b) for the steel- and GFRP RC squat walls, respectively. At this stage, yielding of
the longitudinal reinforcement in the steel RC squat wall became significant along both sides
of the wall and localized at the plastic-hinge zone, which extended above the height of the
bidiagonal sliding reinforcement. As a result, a noticeable horizontal crack was observed
(Figure 4.7c) above the bidiagonal sliding reinforcement going through the entire wall length.
Consequently, a localized sliding-shear deformation was clearly apparent (Figure 4.7d)
associated with excessive deterioration of the concrete cover in this region, leading to
progressive degradation of lateral strength. The substantial deterioration associated with the
in-plane buckling of longitudinal bars (Figure 4.7e) caused failure as this stage, followed by a
drastic drop in lateral strength. Figure 4.8f shows the specimen at the end of testing. It should
be mentioned that, due to the additional shear resistance provided by the diagonal cross sliding
reinforcement, the most damaged wall section was pushed away from the base–wall interface,
where the interaction between moment and shear is the largest.
Figure 4.6 – Crack pattern (note: the cracks with bold line are the major detected shear cracks)
b) G4-80
Concrete crushing
Concrete crushing
(c) G6-80 a) S4-80
Con
cret
e de
teri
orat
ion
abov
e
Longitudinal bar buckling
Concrete crushing
(d) GD (e) G4
Concrete crushing

71
Figure 4.7 – Failure progression of specimen S4-80: (a) vertical cover splitting, (b) spalling of
concrete cover, (c) concrete deterioration above sliding reinforcement, (d) spalling of the
deteriorated concrete, (e) buckling of longitudinal reinforcement causing failure, (f) specimen
face at failure
Contrary to S4-80 specimen, the GFRP RC specimens continued carrying loads with no
strength degradation. In G4-80, G6-80, and G4, the failure started with gradual deterioration
and splitting of the concrete in the compressed boundary element; flexural failure was then
imminent. The specimens ultimately failed in flexural compression (Figure 4.8c), associated
with rupture of the GFRP ties at the bent portion (Figure 4.8d) and fracture in the compressed
longitudinal reinforcement (Figure 4.8e). In the last specimen, GD, the failure progression was
quite different; a few cycles before failure, the specimen experienced out-of-plane buckling of
some diagonal compression bars at the lower part of the wall. As a result, progressive spalling
of the web concrete cover in the vicinity of the buckled bars was evidenced (Figure 4.9a).
Specimen GD eventually failed because of excessive out-of-plane-buckling of the diagonal
compression bars associated with concrete-core crushing in the compression zone, as shown in
Figure 4.9b, c, and d. Table 4.3 summarizes the performance parameters during failure
progression of the test specimens.
a b c
d e f

72 Chapter 4: Experimental Behavior Of GFRP-Reinforced Concrete Squat Walls Subjected
Figure 4.8 – Failure progression of specimens G4-80, G6-80, and G4: (a) vertical cover
splitting, (b) spalling of concrete cover, (c) concrete crushing causing failure, (d) rupture of
GFRP tie, (e) fracture of longitudinal bars
Figure 4.9 – Failure of specimen GD: (a) out-of-plane buckling, (b) concrete crushing, (c)
rupture of GFRP tie, (d) fracture of longitudinal bars
a b c
d e
c d
ba
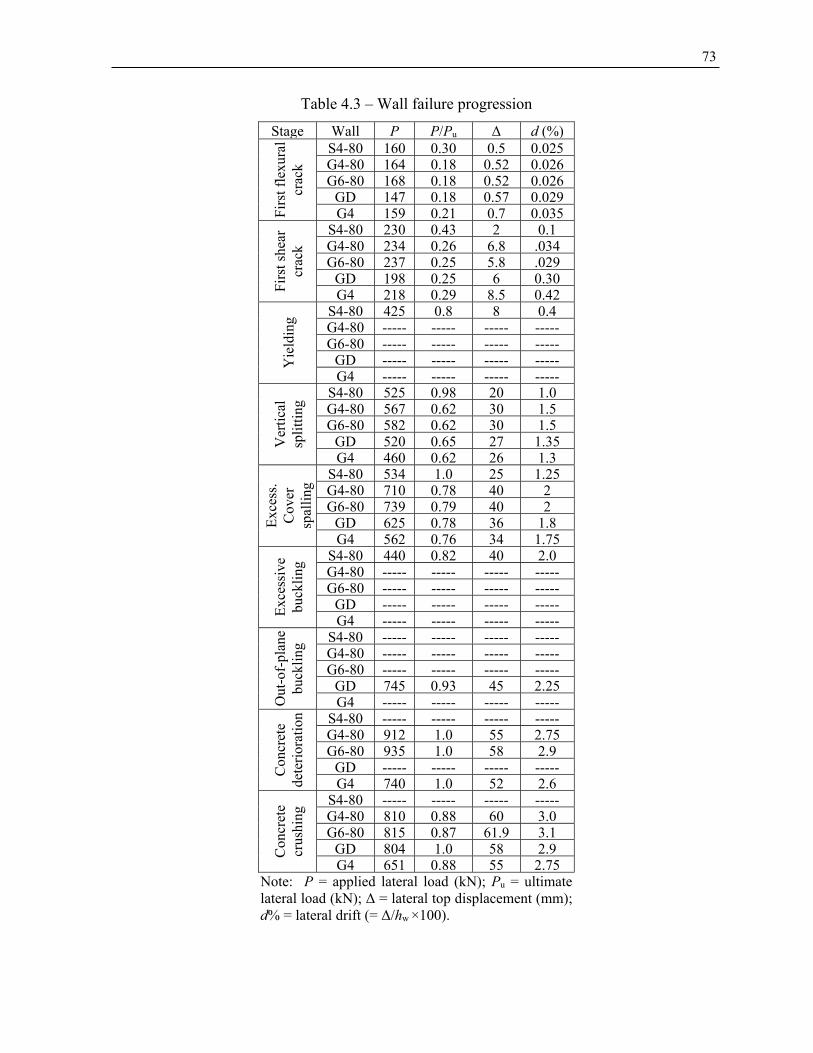
73
Table 4.3 – Wall failure progression
Stage Wall P P/Pu Δ d (%)
Fir
st f
lexu
ral
crac
k
S4-80 160 0.30 0.5 0.025G4-80 164 0.18 0.52 0.026G6-80 168 0.18 0.52 0.026
GD 147 0.18 0.57 0.029G4 159 0.21 0.7 0.035
Fir
st s
hear
cr
ack
S4-80 230 0.43 2 0.1G4-80 234 0.26 6.8 0. 34G6-80 237 0.25 5.8 0. 29
GD 198 0.25 6 0.30G4 218 0.29 8.5 0.42
Yie
ldin
g
S4-80 425 0.8 8 0.4G4-80 ----- ----- ----- -----G6-80 ----- ----- ----- -----
GD ----- ----- ----- -----G4 ----- ----- ----- -----
Ver
tica
l sp
litt
ing
S4-80 525 0.98 20 1.0G4-80 567 0.62 30 1.5G6-80 582 0.62 30 1.5
GD 520 0.65 27 1.35G4 460 0.62 26 1.3
Exc
ess.
C
over
sp
alli
ng S4-80 534 1.0 25 1.25
G4-80 710 0.78 40 2G6-80 739 0.79 40 2
GD 625 0.78 36 1.8G4 562 0.76 34 1.75
Exc
essi
ve
buck
ling
S4-80 440 0.82 40 2.0G4-80 ----- ----- ----- -----G6-80 ----- ----- ----- -----
GD ----- ----- ----- -----G4 ----- ----- ----- -----
Out
-of-
plan
e bu
ckli
ng S4-80 ----- ----- ----- -----
G4-80 ----- ----- ----- -----G6-80 ----- ----- ----- -----
GD 745 0.93 45 2.25G4 ----- ----- ----- -----
Con
cret
e de
teri
orat
ion S4-80 ----- ----- ----- -----
G4-80 912 1.0 55 2.75G6-80 935 1.0 58 2.9
GD ----- ----- ----- -----G4 740 1.0 52 2.6
Con
cret
e cr
ushi
ng S4-80 ----- ----- ----- -----
G4-80 810 0.88 60 3.0G6-80 815 0.87 61.9 3.1
GD 804 1.0 58 2.9G4 651 0.88 55 2.75
Note: P = applied lateral load (kN); Pu = ultimate lateral load (kN); Δ = lateral top displacement (mm); d% = lateral drift (= Δ/hw ×100).

74 Chapter 4: Experimental Behavior Of GFRP-Reinforced Concrete Squat Walls Subjected
4.3.2. Hysteretic Response
Figure 4.10 gives the applied cyclic load versus the lateral drift, and the points illustrating the
special events of damage during the loading process. The hysteretic response of each squat
wall showed reasonable symmetric lateral load–top-drift relationships for loading in the
positive and negative directions until failure occurred at one end.
The response of specimen S4-80 was initially linear up to the formation of the first crack.
During early loading, the longitudinal reinforcement at the boundary yielded at a drift ratio of
0.4%, followed by widening in the hysteretic loops, in addition to a gradual decrease in overall
stiffness. Thereafter, the hysteretic loops got gradually wider with larger commenced residual
displacement. At 1% lateral drift, concrete-cover splitting was observed; clear cover spalling
continued at a lateral drift of 1.25%, at which point the wall achieved its ultimate lateral load
of 534 kN. This was followed by strength degradation due to localized sliding-shear
deformations. It is clear that the reloading process—in the opposite loading direction—
exhibited initial softening, followed by gradual stiffening, which is attributed to the localized
shear deformations. As bar buckling occurred corresponding to a 2% drift ratio, the wall’s
strength remarkably decreased to 82% and 55% of the ultimate load in the positive and
negative loading directions, respectively.
For the GFRP RC walls, the specimens exhibited initial stiff behavior up to the initiation of
the first flexural crack, at which point a reduction in stiffness was observed. This was followed
by a gradual degradation in stiffness as cracks propagated. The unloading/reloading curves
seemed to demonstrate linearity due to the linear nature of the GFRP bars. At a lateral drift
ranging from 1.3% to 1.5%, cracks propagation stabilized and the concrete cover split,
resulting in a slight widening of the hysteretic loops. This defined the beginning of the
inelastic stage in the wall and the specimens lost self-centering. Such response has been
previously observed in mid-rise GFRP RC walls (Mohamed et al. 2014a).

75
Figure 4.10 – Hysteretic response
Loa
d (k
N)
Loa
d (k
N)
Loa
d (k
N)
Lateral drift (%) Lateral drift (%)
Top displacement (mm) Top displacement (mm)
Lateral drift (%) Lateral drift (%)
Top displacement (mm) Top displacement (mm)
Loa
d (k
N)
S4-80 G4-80
G6-80 GD
Lateral drift (%)
Loa
d (k
N)
G4
Top displacement (mm)
Cover splitting
Concrete deterioration
Concrete crushing
Excessive cover spalling
Initial yielding (S4-80 )
Bars buckling (S4-80 )
Out-of-plane buckling (GD)

76 Chapter 4: Experimental Behavior Of GFRP-Reinforced Concrete Squat Walls Subjected
Spalling of the concrete cover gradually initiated after cover splitting and became more
significant at a lateral drift ranging from 1.75% to 2%. Nevertheless, the concrete core
remained intact due to the confinement at the boundary elements. As a result, G4-80, G6-80,
and G4 experienced no strength degradation up to drift ratios of 2.75%, 2.9%, and 2.6%,
corresponding to ultimate loads of 912, 935, and 740 kN, respectively. This stage was
followed by a gradual degradation in strength up to 3%, 3.1%, and 2.75% drift for G4-80, G6-
80, and G4, respectively. At this point, the lateral strength decreased to 88%, 87%, and 89% of
the peak capacity, respectively, followed by a sudden drop in capacity as a result of concrete
crushing. The diagonally web RC wall (GD) was similar to the other GFRP RC squat walls,
except that the diagonal web-bars buckled and the web concrete cover spalled at a lateral drift
of 2.25%, followed by a clear ability to sustain further displacement but in softer manner up to
a lateral drift of 2.9%. At that point, a drop in strength induced by excessive out-of-plane
buckling and concrete crushing was observed. Specimen GD attained an ultimate lateral load
of 804 kN.
The NBCC (2010) and CSA A23.3 (2014) require that structural walls be able to maintain
structural integrity at least three-quarters of their ultimate capacity through peak displacements
equal to a story drift ratio of 2.0%. The four GFRP RC squat walls safely reached this drift
ratio without strength degradation; indicating the feasibility of using GFRP RC squat walls in
earthquake regions.
4.3.3. Steel-versus GFRP RC Walls
The crack patterns of S4-80 and G4-80 were generally similar, although G4-80 exhibited more
distributed and intensive cracks (Figure 4.6). This could be attributed to two main reasons: (1)
the difference in bond characteristics between GFRP and steel bars; (2) the different
deformation levels experienced by the specimens. Figure 4.6 also clearly shows that the angle
between the inclined cracks and longitudinal axis of the specimen was larger in G4-80 than in
S4-80 (ranging from 55ο to 59ο and 35ο to 40ο in G4-80 and S4-80, respectively) due to the
higher axial rigidity of specimen S4-80 (Razaqpur and Spadea. 2015). The cracks in G4-80
tended to realign and close between load reversals with negligible residual crack width (the
crack width at zero loading) up to a lateral drift of 1.5%, corresponding to concrete-cover

77
splitting, while S4-80 exhibited significant residual crack width, especially after the steel
reinforcement yielded. This can be attributed to the elastic nature of GFRP bars and
considered an advantage in their use. Moreover, it provides evidence of satisfactory bond
between the GFRP reinforcement and concrete. Furthermore, while S4-80 had smaller crack
widths than G4-80 during early loading, crack widths substantially increased and became
remarkably larger in S4-80 after yielding occurred. The measured maximum flexural-crack
width at failure was 6 mm and 2.1 mm in S4-80 and G4-80, respectively.
It is worth mentioning that, despite S4-80 and G4-80 having the same reinforcement ratios and
configurations, S4-80 exhibited extensive sliding shear failure while G4-80 failed in flexural
compression and almost the full flexural capacity for the confined section was achieved, as
will be discussed later. In S4-80, a major continuous crack along the wall length formed above
the sliding reinforcement and remained open even under compressive reversal loading because
the longitudinal reinforcement yielded. The shear stress was therefore transferred along this
crack primarily by longitudinal-reinforcement dowel action, since the friction-resistance forces
maintained by aggregate interlock were degraded under cycling. Due to the relatively flexible
nature of this mechanism, the sliding-shear deformations localized in this zone and caused
concrete deterioration with subsequent degradation of lateral-loading capacity before the full
flexural capacity was achieved. Such interaction between flexural and sliding-shear
deformations has been documented in a number of experimental studies on steel RC squat
walls (Paulay et al. 1982, Salonikios et al. 1999, Whyte and Stojadinovic 2014). In G4-80, the
elastic nature of GFRP bars helped the cracks realign and close between load reversals, and
spread deformations along the wall height rather than localizing them in the plastic-hinge
zone. As a result, the specimen was able to achieve its flexural capacity with no sign of sliding
distress.
Figure 4.11 shows the envelope curve S4-80 and G4-80. Initially, both specimens had similar
stiffness until initiation of the flexural crack. Due to the low modulus of elasticity of GFRP
bars compared to steel bars, G4-80 exhibited a softer response than S4-80 until their responses
intersected at a lateral drift of 1.35%, corresponding to 99% and 56% of ultimate load for S4-
80 and G4-80, respectively. Thereafter, S4-80 experienced significant strength degradation

78 Chapter 4: Experimental Behavior Of GFRP-Reinforced Concrete Squat Walls Subjected
due to the localized shear deformations up to failure at 2% lateral drift. Conversely G4-80’s
strength kept increasing almost linearly to achieve an ultimate load and drift capacity higher
than S4-80, with ratios equal to 71% and 50%, respectively. The higher ultimate load and drift
ratio achieved by G4-80 indicates the acceptable behavior of GFRP RC squat walls in resisting
lateral loads. It should be mentioned that although the softer behavior of G4-80 compared to
S4-80 would increase the displacement demand, it could be considered as advantage of using
GFRP bars. This is due to the fact that the lower structural stiffness results in a longer natural
period of vibration and, consequently, lower seismic force demand (Sharbatdar and Saatcioglu
2009).
Figure 4.11 – Envelope curves: Steel vs. GFRP
4.3.4. Effect of Reinforcement Configurations
The initial flexural or shear cracking load was not affected by using different horizontal web-
reinforcement ratios, changing from orthogonal to diagonal web reinforcement, or removing
the diagonal sliding-shear reinforcement (Table 4.3). The studied parameters, however,
appeared to significantly control the shear-crack width as the measured maximum crack width
was 0.51, 0.43, and 0.98 mm for G6-80, GD, and G4-80, respectively (The locations of the
measured maximum shear crack are indicated in Figure 4.6). The greater diameter of
horizontal web reinforcement in G6-80 compared to G4-80 caused less shear strain to develop,
0 1 2 3
0
200
400
600
800
1000
0 20 40 60
G4-80
S4-80
Top displacement (mm)
Lateral drift (%)
Loa
d (k
N)
Cover splitting Concrete deteriorationConcrete crushingCover spalling
Initial yielding Bar buckling
1.35
%

79
leading to controlled crack width. The diagonal web reinforcement in GD was almost
perpendicular to the shear-crack direction, so it acted primarily in direct tension, while the
horizontal and vertical web reinforcement in G4-80 intersected the shear cracks at 30° to 60ο,
so it tended to act essentially as dowels (Salonikios et al. 1999, Sittipunt and Wood 1995). G4
exhibited larger crack widths in its lower part than G4-80 due to the absence of bidiagonal
sliding reinforcement.
Figure 4.12 shows the envelope curve for the GFRP RC specimens. Increasing the horizontal
web reinforcement in G6-80 with respect to G4-80 did not significantly affect drift capacity
and ultimate strength as the difference was less than 3%. This minor difference could be
attributed to the shear deformation, which was greater in G4-80 than in G6-80, causing greater
deformability of the concrete. The lack of bidiagonal sliding reinforcement, however,
significantly affected the ultimate capacity; since G4 had an ultimate capacity 23% lower than
G4-80. This is due to the fact that sliding reinforcement contributes not only to sliding shear
but to flexure as well. It is interesting to note that, while GD had approximately 47% less total
web reinforcement than G4-80, both specimens exhibited similar behavior up to 2.25% drift.
However, after this stage G4-80 kept increasing up to a drift ratio of 3%, while GD exhibited
softer behavior, failing at similar drift ratio of 2.9% but at a lower ultimate capacity. The
difference in concrete compressive strength between G4-80 and GD is eliminated by
calculating the shear stress, which was found to be 0.6 'cf and 0.56 '
cf MPa, respectively.
Hence, GD’s reduced lateral capacity at failure could be attributed to the out-of-plane buckling
of the diagonal web reinforcement. Transverse links could be an efficient solution to delay or
eliminate the out-of-plane buckling; this might, however, raise construction issues. Other
solution could also be rendered by prestressing the diagonal bars. In such case, the tension
induced in the diagonal bars would allow exploiting the advanced mechanical properties of
GFRP.
The advantage of using diagonal web reinforcement is control the shear-crack width with less
reinforcement so as to attain a capacity similar to that when using an orthogonal grid. In
addition, straight diagonal reinforcement is much easier to fabricate than horizontal

80 Chapter 4: Experimental Behavior Of GFRP-Reinforced Concrete Squat Walls Subjected
reinforcement with bent ends. Therefore, from economic and design points of view, using
diagonal reinforcement as web reinforcement might be attractive.
Figure 4.12 – Envelope curves: Top displacement (mm)
4.4. Prediction of Ultimate Strength
The predicted ultimate strength of the tested walls in flexure, shear, and sliding, using the
methodology discussed in section 4.2.3, are listed in Table 4.1. The experimentally obtained
capacity for the GFRP RC squat walls that exhibited flexural failure is significantly larger than
the predicted flexural strength assuming an unconfined concrete section (concrete compressive
strain = 0.0035 according to the CSA S806 (2012) and CSA A23.3 (2014). This can be
attributed to the effect of confinement at the boundary elements, which remarkably improved
concrete compressive strain and consequently improved the flexural strength of GFRP RC
elements. This effect has been recognized in many studies (Tavassoli et al. 2015; Mohamed et
al. 2014a; Ali and El-Salakawy 2016). Figure 4.13 shows that the measured compressive strain
at the GFRP RC walls’ toes are more than double the value specified in the CSA codes. In
contrast, due to the sliding shear deformations, the maximum measured concrete compressive
strain in S4-80 is much lower than that in the companion specimens.
0 1 2 3
0
200
400
600
800
1000
0 20 40 60
G4-80
G4
GD
G6-80
Lateral drift (%)
Top displacement (mm)
Cover splitting
Concrete deterioration Concrete crushing Cover spalling Out-of-plane bar
Lat
eral
load
(kN
)

81
Given the necessity of considering the confinement effect in GFRP RC squat walls, their
flexural capacity was recalculated considering the confinement effect using the experimentally
recorded concrete compressive strain. The ratios between the experimentally obtained ultimate
strengths to their predicted analytical values, listed in Table 1, generally reflect that using
plane sectional analysis gave a reasonable estimate of the ultimate flexural strength as the
ratios at the ultimate levels are within a 5% difference. The maximum difference can be
observed in specimen GD, which could be attributed to the out-of-plane buckling of web
reinforcement and subsequent cover loss.
While G4 was expected to fail due to sliding-shear, it did so identically to G4-80 (gradual
flexural compression); while the sliding displacement was negligible (less than 1% of the top
displacement). This indicates that the assumption “the shear resistance along unintentionally
roughened shear plane is equal to the transverse shear strength of the crossing reinforcement at
right angles (CSA S806)” is not completely valid for GFRP RC squat walls. Hence, this
suggests that the mechanism of aggregate interlock in the flexural compression zone could be
engaged with the dowel action to resist the applied shear stresses as the flexural cracks that
formed between the wall and the base tended to realign and lock up in the compression zone
with load reversal due to the elastic nature of the GFRP bars. Further experimental study
should be conducted to address this difference in behavior and to expand understanding of the
sliding-shear resistance for joints reinforced with GFRP bars under tension–compression load
reversals
The maximum measured strain in the straight portion of G4-80’s horizontal web reinforcement
(4840 με) was much lower than the rupture strain in the bent portion (8000 με according to
CSA S806-12). The experimentally obtained ultimate strength of G4-80 was, however,
slightly higher than the predicted value. This indicates that the shear stresses were not carried
only by the horizontal web reinforcement, as indicated in CSA A23.3 (2014). Further
investigation is thus needed to determine the load-transfer mechanisms in GFRP RC squat
walls.

82 Chapter 4: Experimental Behavior Of GFRP-Reinforced Concrete Squat Walls Subjected
Figure 4.13 – Concrete strain
4.5. Energy Dissipation
Figure 4.14 shows the cumulative energy dissipation of the tested specimens, which is a
common index to describe the ability of a structure to dissipate imposed seismic energy. The
cumulative energy dissipation was calculated by summing up the dissipated energy values in
consecutive load–displacement loops throughout the test. The residual displacement values
G4
Concrete strain Concrete strain
Concrete strain Concrete strain
Concrete strain
Loa
d (k
N)
Loa
d (k
N)
Loa
d (k
N)
Loa
d (k
N)
Loa
d (k
N)
LVDT 1
LVDT 2
LVDT 1
LVDT 2
LVDT 1
LVDT 2
LVDT 1
LVDT 2
LVDT 1
LVDT 2
LVDT 1
LVDT 2
S4-80 G4-80
G6-80 GD
(+) P (-)L
VD
T 2
LV
DT
1

83
were also plotted against the corresponding cumulative dissipated energy values in each cycle
(Figure 4.14b). As expected, at all drift levels, S4-80 exhibited the highest energy dissipation
but with substantial residual displacement. Conversely, due to the elastic behavior of the
GFRP bars, the GFRP RC walls exhibited almost linear behavior with limited residual
deformations. Although G4-80 had a pinched behavior, it provided energy dissipation similar
to S4-80 at the moderate-damage load level corresponding to concrete-cover splitting. The
dissipated energy was 17.4 and 14.8 kN.m, corresponding to 7.3 and 1.08 mm residual
displacement for S4-80 and G4-80, respectively. The higher strength achieved by G4-80
compared to S4-80 significantly contributed to the steel- and GFRP RC squat walls attaining
comparable levels of dissipated energy. Similarly, the energy dissipated by S4-80 and G4-80
at concrete-cover spalling was similar: 31 and 28 kN.m, corresponding to 13.2 and 2.7 mm
residual displacement, respectively. At this stage, a noticeable opening in the hysteretic loops
of S4-80 and G4-80 can be seen, resulting in an increase in the rate of dissipated energy. That
was due to excessive yielding of the steel in S4-80 and due to concrete plasticity in G4-80.
The maximum achieved energy dissipation at failure was 94 and 53 kN.m, corresponding to
26 and 4.6 mm residual displacement for S4-80 and G4-80, respectively.
Figure 4.14 shows similar cumulative dissipated energy of approximately 16 kN.m by all the
GFRP RC walls up to concrete-cover splitting. The effect of removing sliding reinforcement
in G4 or changing the web reinforcement configuration in GD was apparent after the drift
level corresponding to concrete cover splitting, while no significant effect was observed due to
increasing the horizontal web reinforcement in G6-80. The maximum accumulated energy
dissipation was 53, 56, 70, and 73 kN.m corresponding to 4.6, 5.4, 7.13, and 8.6 mm residual
displacement for G4-80, G6-80, GD, and G4, respectively. The fact that G4 dissipated more
energy than G4-80 can be attributed to the lack of bidiagonal sliding reinforcement, which
allowed G4 to experience higher deformations during unloading. The higher energy
dissipation in GD could be attributed to the damage induced by out-of-plane buckling and
subsequent concrete-cover spalling.

84 Chapter 4: Experimental Behavior Of GFRP-Reinforced Concrete Squat Walls Subjected
Figure 4.14 – Energy dissipation
The discussion demonstrates the capability of GFRP RC squat walls to dissipate energy
through the inelastic behavior of concrete. Additionally, the discussion reveals that a GFRP
RC squat wall could potentially be restored after an earthquake event, while there will likely
be technical difficulties in repairing steel RC walls owing to excessive permanent
deformations.
4.6. Conclusions
This chapter presented a test program aimed at studying the applicability using GFRP RC
squat walls as seismic-force-resisting elements. The results of testing five steel- and GFRP RC
squat walls under simulated earthquake loading are presented. Based on the analysis of the
experimental results, the following conclusions were reached:
1. The GFRP reinforcement provided the laterally loaded squat walls with stable behavior
through the hysteretic response, as no strength degradation or signs of premature shear
failure was observed in comparison to the steel RC squat wall.
(a) Cumulative energy dissipation
0
20
40
60
80
100
0 5 10 15 20 25 30
0.0 1.0 2.0 3.0
0
20
40
60
80
100
0 10 20 30 40 50 60
Cover spalling
Cover splitting
Yielding
Bar buckling
Concrete crushing
Bar buckling
Concrete crushing
Cover spalling
Cover splitting
Yielding Cum
ulat
ive
ener
gy d
issi
patio
n (k
N.m
)
Cum
ulat
ive
ener
gy d
issi
patio
n (k
N.m
)
Top displacement (mm) Top displacement (mm)
Lateral drift (%)
S4-G4-G6-GD G4
S4-G4-G6-GDG4
(b) Residual displacement
85
2. The elastic nature of the GFRP bars helped the cracks realign and close between load
reversals and distribute shear deformations along the wall height. This assisted in
avoiding premature sliding failure in GFRP RC walls.
3. GFRP ties at the boundary elements played a significant role in delaying crushing of the
concrete core with a subsequent increase in ultimate capacity.
4. The GFRP-reinforced squat walls exhibited reasonable levels of energy dissipation
associated with relatively small residual displacements compared to the steel-reinforced
wall as a result of the plastic deformations of the concrete
5. Bidiagonal web reinforcement was more effective than conventional web reinforcement in
controlling shear-crack width. Eliminating the out-of-plane buckling in the diagonally
reinforced wall could be achieved by using transverse link or by prestressing the diagonal
grid, but this might lead to construction issues.
6. The GFRP RC wall demonstrated their ability to dissipate energy through plastic
deformations of concrete.
7. Using horizontal web reinforcement exceeding the amount required to carry the ultimate
flexural strength had no effect on either the ultimate strength or the drift ratio. On the
other hand, it clearly controlled the shear-crack width.
8. Using bidiagonal sliding reinforcement is not necessary in GFRP RC squat walls; further
investigation is needed to address the elastic nature of GFRP bars.
9. The shear stresses induced by the lateral load were not carried only by the horizontal web
reinforcement as indicated in CSA A23.3 (2014). Further studies, therefore, are required
to clarify this point.
10. All of the GFRP RC walls safely attained the maximum allowable drift ratio required by
both the NBCC (2010) and CSA A23.3 (2014) with no strength degradation, while the
residual deformation was insignificant. This indicates the applicability of GFRP RC squat
walls in resisting lateral loads in low to moderate earthquake-prone regions.


CHAPTER 5
Effect of Web Reinforcement on the Seismic
Response of Concrete Squat Walls Reinforced with
Glass-FRP Bars
Foreword
Authors and Affiliation
o Ahmed Arafa: PhD candidate, Department of Civil Engineering, University of
Sherbrooke.
o Ahmed Sabry Farghaly: Postdoctoral Fellow, Department of Civil Engineering,
University of Sherbrooke, and Associate Professor, Assiut University, Egypt.
o Brahim Benmokrane: Department of Civil Engineering, University of Sherbrooke,
Sherbrooke.
Journal: Engineering Structures
Paper status: Submitted on May 11, 2017
Reference: Arafa, A., Farghaly, A. S., and Benmokrane, B., 2017 “Effect of Web
Reinforcement on the Seismic Response of Concrete Squat Walls Reinforced with
Glass-FRP Bars,” Engineering Structures Journal.
Journal: Journal of Composites for Construction
Paper status: Submitted on May 1, 2017
Reference: Arafa, A., Farghaly, A. S., and Benmokrane, B., 2017 (submitted technical Note)
“Prediction of Flexure and Shear Strength of Concrete Squat Walls Reinforced
with Glass-FRP Bars,” Journal of Composites for Construction, ASCE.
86

87
Contribution in thesis:
This chapter includes the test results of specimen G4-250, G4-160, G4-80, G6-80, G-V, and
G-H. It is aimed at evaluation the effect of web reinforcement configurations (horizontal
and/or vertical) and the horizontal web reinforcement ratio . Emphasis is given to the effect on
ultimate strength, mode of failure, drift capacity. Documentation of strain distribution in the
horizontal and vertical direction is presented. Evaluation of the ultimate strength using the
ACI 440.1R-15 and CSA S806-12 guidelines and codes is also discussed. Some
recommendations that assist in a reasonable estimation of ultimate strength are also given.
Finally, the efficiency of confinement on the behavior is discussed.
Abstract
Six full-scale concrete squat walls reinforced with glass-fiber-reinforced-polymer (GFRP) bars
were tested to failure under quasi-static reversed cyclic loading. The test parameters were the
configuration of web reinforcement (horizontal and/or vertical) and the horizontal web
reinforcement ratio. The test specimens experienced different mode of failures as a function of
the web reinforcement. The horizontal web reinforcement was found to significantly increase
the ultimate strength as long as the failure was dominated by diagonal tension but had no
significant effect if in excess of what was needed for flexural resistance. Both horizontal and
vertical web reinforcement was shown to be essential for crack recovery between load
reversals and for controlling shear-crack width as well as for enhancing the concrete
contribution to the lateral shear resistance. The predictions based on FRP Canadian and
American design codes and guidelines were investigated and compared to the test results. The
results demonstrated that, in the Canadian code, the concrete contribution to the shear
resistance should be considered and, in the American design guidelines, the 45° shear-crack-
angle assumption should be modified for squat walls with different properties and should
consider the increase in concrete shear contribution after initiation of the first shear crack. The
confinement at boundary elements has been shown to significantly improve ultimate flexural
strength that should not be omitted in the design.
Keywords: Concrete; GFRP bars; squat walls; shear strength; web reinforcement; seismic
88 Chapter 5: Effect of Web Reinforcement on the Seismic Behavior of Squat Walls
5.1. Introduction
A considerable amount of work has been devoted to understanding the behavior of steel RC
concrete squat walls (height-to-length ratio ≤ 2.0). The behavior of reinforced squat walls is
different from that of slender walls due to their relatively larger magnitude of shearing and
normal stresses. Test investigations have revealed that, by the onset of flexural reinforcement
yielding, shear deformations—either shear distortion and/or sliding—are activated and
localized along the yielding zone and then begin to dominate the behavior, causing rapid
strength and stiffness degradation with subsequent premature shear failure (Paulay et al. 1982;
Saatcioglu 1991; Sittipunt et al. 2001).
There is no consensus among researchers about the influence of web reinforcement in squat
walls on shear strength. Some researchers have reported that using proper amount of
horizontal reinforcement restrained the diagonal tension, thereby increasing the shear strength
(Beekhuis 1971; Pilakoutas and Elnashai 1995; Hidalgo et al. 2002). In contrast, other
experiments have shown that horizontal web reinforcement has no impact, whereas the shear
strength significantly increased as a function of vertical web reinforcement (Barda et al. 1977;
Lefas et al. 1990; Emamy Farvashany et al. 2008). The methods in ACI 318 (2014) and CSA
A23.3 (2014) for estimating the shear strength of squat walls only consider the amount of
horizontal reinforcement. Nevertheless, both codes recognize that vertical web reinforcement
is essential to maintain the equilibrium of internal forces. Both codes also require that
minimum horizontal and vertical web reinforcement should be provided to control crack
propagation and width.
In practice, squat walls are being used in low-rise structures such as parking garages and
overpass bridges, which are exposed to severe environmental conditions in northern climates
that cause the corrosion of steel reinforcement. The use of glass-fiber-reinforced-polymer
(GFRP) bars as a viable alternative reinforcing material has grown to obviate corrosion issues
while providing an acceptable level of performance [ACI 440R (2007), ACI 440.1R (2015)].
Mohamed et al. (2014a, b) investigated the applicability of using GFRP as internal
reinforcement for earthquake-resistant systems such as mid-rise shear walls. The test results
demonstrated the potential of GFRP reinforcement for distributing shear deformations along

89
the wall height, owing to its elastic nature, resulting in controlled shear distortion relative to
the steel RC wall. This result motivated a new study to evaluate the feasibility of using GFRP
bars in squat walls, in which these problems are dominant. As a part of the ongoing
experimental program, two squat walls with a height-to-length ratio of 1.3 were tested: one
was reinforced with steel bars, the other with GFRP bars (Arafa et al. 2016b). The test results
clearly showed the stable behavior of the GFRP RC squat wall through its hysteretic response,
since it evidenced no strength degradation or signs of premature shear failure compared to the
steel RC one. The results also demonstrated that the attained drift ratio satisfied the limitation
in most building codes. Nevertheless, FRP has not been adopted yet by the relevant design
codes and guidelines [CSA S806 (2012), ACI 440.1R (2015)] as internal reinforcement for
squat walls under seismic loads.
This paper aimed at experimentally assessing the impact of web reinforcement on the response
of squat walls totally reinforced with GFRP bars under quasi-static reversed cyclic loading.
The experimental results were analyzed considering the crack pattern, mode of failure, drift
capacity, ultimate strength, and load–top-displacement hysteretic response. The distribution of
strains in either the vertical or horizontal direction is documented. The effect of horizontal and
vertical web reinforcement on the concrete shear resistance is discussed. Evaluation of the
ultimate capacity according to the ACI and CSA codes was also introduced.
5.2. Experimental Program
5.2.1. Description of Test Specimens
A total of six large-scale rectangular concrete squat walls entirely reinforced with GFRP bars
were constructed and tested in the Structural Laboratory in the Department of Civil
Engineering at the University of Sherbrooke. Each test specimen measured 200 mm thick,
1500 mm long, and 2000 mm high. The wall thickness satisfied the CSA A23.3 (2014)
minimum-thickness requirement in Clause 14.1.7.1. Each specimen was cast vertically to
reproduce construction practice, with an integral 2700 × 1200 × 700 mm heavily reinforced
foundation functioning as anchorage for the vertical reinforcement and to fasten the specimen
to the laboratory floor. Figure 5.1 provides the concrete dimensions and reinforcement details.

90 Chapter 5: Effect of Web Reinforcement on the Seismic Behavior of Squat Walls
Figure 5.1 – Concrete dimensions and details of reinforcement
Two boundary elements of equal width and breadth (200 × 200 mm) were placed at each end
of the horizontal length. The longitudinal and transverse reinforcement ratios at the boundary
elements were kept constant in all specimens: 1.43% and 0.89%, respectively. The
longitudinal reinforcement consisted of 8 No. 10 (#3) GFRP bars laterally tied against
premature buckling with transverse reinforcement consisting of No. 10 (#3) spiral GFRP ties
spaced at 80 mm along the wall height. The experimental parameters were the effect of the
horizontal and vertical web reinforcement. The focus; however, was on the horizontal web
reinforcement since the current codes for steel RC squat walls [ACI 318 (2014) and CSA
a) Concrete dimensions
200 mm1500 mm
2700 mm 1200 mm
2000
mm
b) Reinforcement configuration
No. 10 GFRP @ 100
Θ = 45°
Vertical web rein.
8 No. 10 GFRP
See Sec A-A
See Sec A-A
Vl. boundary
A A
Horizontal web rein.
No.10 GFRP @ 100
200
No.10 Vl. GFRP @ 120
8 No.10 Vl. GFRP boundary
d) Sec A-A for specimen G-V
2001500
200
No.10 GFRP ties
200
No.13 Hz GFRP @ 250
8 No.10 GFRP Vl. boundary
e) Sec A-A for specimen G-H
2001500
200
No.10 GFRP ties @ 80 mm
#3 GFRP @ 100
c) Sec A-A for specimens G4-250, G4-160, G4-80, and G6-80
200
No.10 Vl. GFRP @ 120
No.13 or No.19 Hz GFRP @ S
8 No.10 Vl. GFRP boundary
2001500
200
No.10 GFRP ties @ 80 mm
No.10 GFRP @ 100
No. 13@S= 250 mm for G4-250
No. 13@S= 160 mm for G4-160
No. 13@S= 80 mm for G4-80
All dimensions in mm
No. 19@S= 80 mm for G6-80

91
A23.3 (2014)] calculates the shear capacity of squat walls based on the horizontal web
reinforcement. Four specimens—G4-250, G4-160, G4-80, and G6-80—were reinforced with
different horizontal web reinforcement ratios; 0.51%, 0.79%, and 1.58%, and 3.58%,
respectively, using No. 13 (#3) GFRP bars spaced at 250, 160, and 80 mm or No. 19 (#6)
GFRP bars spaced at 80 mm, respectively. The vertical web reinforcement was kept constant
and comprised No. 10 (#3) GFRP bars spaced at 120 mm with a reinforcement ratio of 0.59%.
The two remaining specimens were constructed with either vertical or horizontal web
reinforcement (G-V, and G-H, respectively) to test the absence of horizontal or vertical web
reinforcement on wall behavior. G-V was reinforced with vertical web reinforcement identical
to that used in the four specimens, while G-H was reinforced with horizontal web
reinforcement identical to that used in G4-250. The sliding shear was prohibited by adding one
layer of bidiagonal No. 10 (#3) GFRP bars across the potential sliding plane at an angle of 45°
spaced at 100 mm. All reinforcement crossing the wall–base joint were anchored to the base
with a development length in compliance with the requirements of CSA S806 (2012)
multiplied by a factor of 1.25 to account for the effect of compression and tension cycles as
suggested by Mohamed et al. (2014a). Table 5.1 gives the test matrix and reinforcement
details of the wall specimens.
Table 5.1 – Concrete strength and reinforcement details
Test No. Wall ID fc'
(MPa) Reinforcement Ratio (%)
ρl ρt ρv ρh
1 G4-250 35 1.43 0.89 0.59 0.51
2 G4-160 35 1.43 0.89 0.59 0.79
3 G4-80 40 1.43 0.89 0.59 1.58
4 G6-80 41 1.43 0.89 0.59 3.56
5 G-V 38 1.43 0.89 0.59 0.00
6 G-H 35 1.43 0.89 0.00 0.51 Notes: fc' = concrete compressive strength; ρl = boundary longitudinal-bar reinforcement ratio; ρt = boundary-tie reinforcement ratio; ρv = web vertical-bar reinforcement ratio; ρh = horizontal web reinforcement ratio.
92 Chapter 5: Effect of Web Reinforcement on the Seismic Behavior of Squat Walls
5.2.2. Material Properties
The test specimens were made with normal-weight, ready-mixed concrete with a target 28-day
compressive strength of 40 MPa. Table 5.1 provides the actual concrete compressive strength
(fc') based on the average of at least three 100 × 200 mm cylinders for each concrete batch
tested on the day of wall testing. The longitudinal GFRP reinforcing bars were sand-coated
bars: No. 10 (#3) was used for longitudinal bars, either in the boundary or in the web (ffu =
1372 MPa, Ef = 65 GPa, εfu = 2.1%, Af = 71 mm2) and spiral ties (for straight portions:
ffu = 1065 MPa, Ef =50 GPa, εfu = 2.1 %, Af = 71 mm2; for bent portions: ffu = 460 MPa). Two
diameters were used as horizontal web reinforcement: No. 13 (#4) (for straight portions: ffu =
1020 MPa, Ef =50 GPa, εfu = 2%, Af = 127 mm2; for bent portions: ffu = 459 MPa), and No. 19
(#6) (for straight portions: ffu = 1028 MPa, Ef =50 GPa, εfu = 2%, Af = 285 mm2; for bent
portions: ffu = 463 MPa). The horizontal reinforcement in the walls had 90° end hooks. The
tensile properties of the straight GFRP bars were specified based on testing five specimens
according to ASTM D7205/D7205M (2006). The B.5 test method stipulated in ACI 440.3R
(2004) was used to determine the tensile properties of the bent bars. The reported tensile
properties of the GFRP bars were calculated using nominal cross-sectional areas.
5.2.3. Test Setup and Procedure
Figure 5.2 shows the layout of the test setup. All specimens were tested laterally as a vertical
cantilever with a force applied through a rigid steel loading beam, designed to transfer lateral
loads across the top of the wall. The lateral cyclic loading was applied at 2550 mm above the
base of the wall using a 1000 kN MTS hydraulic actuator with a maximum stroke of ±250
mm. The base of each specimen was clamped down to the strong laboratory foundations
through four prestressing high-strength steel rods 66 mm in diameter to achieve full fixation at
the base level. Out-of-plane supports were pinned to the wall at the level of the transfer steel
beam to prevent out-of-plane movement. No axial load was applied to the test specimens since
axial stresses in squat walls are typically insignificant when proportioned to the product of
concrete compressive strength and gross area.

93
Figure 5.2 – Test setup
The loading was applied by gradual increasing in the displacement of the wall tip under a
quasi-static rate of 0.01 Hz. The loading history started by applying two identical
displacement cycles with increments of ±2 mm up to 10 mm (0.5% lateral drift), followed by
increments of ±5 mm up to 50 mm (2.5% lateral drift), and thereafter increments of ±10 up to
failure. Figure 5.3 shows a typical sequence of displacement cycles adopted in this study.
Figure 5.3 – Displacement history
Actuator
Lateral bracing
Loading beam
Squat-wall specimen Pre-stressing steel rods
Base
2550
mm
Cycle number
Lat
eral
dis
plac
emen
t (m
m)
Lat
eral
dri
ft (
%)
-4
-3
-2
-1
0
1
2
3
4
-80
-60
-40
-20
0
20
40
60
80
0 5 10 15 20 25 30

94 Chapter 5: Effect of Web Reinforcement on the Seismic Behavior of Squat Walls
5.2.4. Instrumentation
The deformation response was recorded with a series of linear variable displacement
transducers (LVDTs) and strain gauges. Only the instruments used in this paper are reported
on (Figure 5.4a). One LVDT was installed at the wall tip to measure the lateral displacement.
One LVDT was installed at the construction joint to monitor sliding between the wall and
base. One LVDT was used to measure the sliding between the base and laboratory rigid floor.
Two LVDTs were mounted close to the boundary elements to measure the concrete strain. For
the sake of safety, two additional LVDTs were attached to the upper steel beam to measure the
top out-of-plane deformation. The crack width was also measured with two LVDTs mounted
at the first two major cracks. Figure 5.4a shows the layout of the LVDTs instrumentation.
A total of 14 electrical resistance strain gauges were mounted on the reinforcing bars
(boundary and web reinforcement) at critical locations to measure strains (Figure 5.4b). Five
bars were instrumented to measure the vertical strain distribution at the wall base: two
longitudinal bars in the boundary elements in the extreme compression and tension fibers and
three vertical bars in the web. Three other horizontal bars located at three height levels—200
mm, 750 mm, and 1500 mm—were selected to measure the shear-strain distribution. Each bar
was instrumented at the left, right and middle.
Figure 5.4 – Instrumentation: (a) LVDTs instrumentation; (b) strain-gauge instrumentation
1500
750
200
Lateral top displacement
Out-of-plane displacementConcrete strain
Wall-base
Base-floor

95
5.3. Experimental Results and Discussion
5.3.1. Failure Progression and Hysteretic Response
This section introduces the test results of the investigated walls in reference to hysteretic
response and damage progression. The damage progressions involved the propagation of
flexural, and shear cracks, cover splitting and spalling, failure mode, and the failure-associated
damage. Table 5.2 summarizes the test results. Figure 5.5 depicts the crack pattern. Figure 5.6
gives the experimentally recorded hysteretic response for the lateral load at each loading step
against lateral top displacement. Figures 5.7 and 5.8 provide the final failure mode and
damage-associated failure, respectively.
Table 5.2 – Summary of the test results
Wall ID
Initial Flexural Crack
Initial Shear Crack
Concrete Cover
Splitting
Excessive Cover
Spalling
Peak Capacity
Failure
P (kN)
d (%) P
(kN) d
(%)P
(kN)d
(%)P (kN)
d (%)
P (kN)
d (%)
Failure mode
P (kN)
d (%)
G4-250 147 0.025 228 0.39 510 1.35 615 2.0 678 2.65 DT 678 2.55
G4-160 145 0.025 227 0.36 528 1.45 639 2.0 708 2.8 FT 708 2.8
G4-80 164 0.026 234 0.34 567 1.5 710 2.0 912 2.75 FC 810 3.0
G6-80 168 0.026 237 0.29 582 1.5 739 2.0 935 2.9 FC 815 3.1
G-V 153 0.025 217 0.39 378 1.20 398 1.5 398 1.5 DT 307 2.20
G-H 139 0.03 175 0.36 ----- ----- ----- ----- 482 2.4 FT 482 2.4
Notes: P = applied lateral load; d = drift ratio; DT = diagonal tension; FT = flexural tension; FC = flexural compression
In general, the initial behavior of all walls was characterized by a flexural response as
evidenced by the typical amount of horizontal flexural cracks propagated in the lower part of
the walls at a lateral load within the range of 139 to 168 kN (Table 5.2). As a result of the
flexural cracks, all of the specimens exhibited a reduction in lateral stiffness (Figure 5.6). At a
load level of 169 to 237 kN (corresponding to 0.36%–0.44% lateral drift; Table 5.2), the
flexural cracks tended to incline down toward the central zone of the web owing to the effect
of shear stresses. As larger deformations were imposed, horizontal cracks were accompanied
by inclined cracks and continued to initiate, forming a fan shape since the cracks varied in
inclination as they approached the wall base. This variation is attributed to moment gradient

96 Chapter 5: Effect of Web Reinforcement on the Seismic Behavior of Squat Walls
along the wall height, which affected the orientation of the principle stresses defining shear-
crack direction. As the load increased, new shear cracks tended to propagate near the top of
the wall, while the existing cracks tended to widen and extend downward to the opposite
boundary element with increased inclination and intersected the cracks originating from the
other direction. Clearly due to the existence of boundary elements with heavy longitudinal and
transverse reinforcement, the inclination and width of the propagated shear cracks
significantly decreased at the ends of the walls, suggesting that the longitudinal reinforcement
at the boundary elements and the confinement contributed to wall shear resistance. This is
consistent with test results for squat walls reinforced with conventional steel (Luna et al.
2015).
Figure 5.5 – Crack pattern (note that the indicated locations are the positions of the maximum measured shear cracks)
As new cracks developed and existing ones extended, a gradual degradation in overall
stiffness occurred as reflected in the hysteretic response. Furthermore, the unloading/reloading
hysteretic curves seem to demonstrate linearity owing to the linear nature of the GFRP bars
(Figure 5.6). Except for G-H, as loading increased, vertical splitting cracks occurred at the
most compression zone at a lateral drift ranging from 1.2% to 1.5% and were associated with
the initiation of cover spalling (Table 5.2). After this stage, however, each specimen
experienced a different failure mode as illustrated in the following sections.
(a) G4-250
θ=58o
(f) G-H(e) G-V
θ=59o
(b) G4-160
(c) G6-80
(b) G4-80

97
Figure 5.6 – Lateral load versus top displacement
-3 -2 -1 0 1 2 3
-1000-800-600-400-200
0200400600800
1000
-60 -40 -20 0 20 40 60
-3 -2 -1 0 1 2 3
-1000-800-600-400-200
0200400600800
1000
-60 -40 -20 0 20 40 60
-3 -2 -1 0 1 2 3
-1000-800-600-400-200
0200400600800
1000
-60 -40 -20 0 20 40 60
-3 -2 -1 0 1 2 3
-1000-800-600-400-200
0200400600800
1000
-60 -40 -20 0 20 40 60
-3 -2 -1 0 1 2 3
-1000-800-600-400-200
0200400600800
1000
-60 -40 -20 0 20 40 60
-3 -2 -1 0 1 2 3
-1000-800-600-400-200
0200400600800
1000
-60 -40 -20 0 20 40 60
Drift ratio (%)
Loa
d (k
N)
Lateral top displacement (mm)
Drift ratio (%)
Drift ratio (%) Drift ratio (%)
Drift ratio (%) Drift ratio (%)
Lateral top displacement (mm)
Lateral top displacement (mm)
Lateral top displacement (mm) Lateral top displacement (mm)
Loa
d (k
N)
Loa
d (k
N)
Loa
d (k
N)
Loa
d (k
N)
Loa
d (k
N)
(a) (b)
(c) (d)
(e) (f)
Lateral top displacement (mm)
Cover splitting
Cover spalling
Shear failure
G-V
G4-80 G6-80
G4-160G4-250
Cover splitting
Cover spalling
Shear failure
Cover splitting
Cover spalling
Flexural bars rupture
Cover splitting
Cover spalling
Concrete crushing
Concrete deterioration
G-H
Cover splitting
Cover spalling
Concrete crushingConcrete deterioration
Flexural bars rupture
Cover splitting
Major horizontal crack

98 Chapter 5: Effect of Web Reinforcement on the Seismic Behavior of Squat Walls
Wall G4-250
This wall experienced shear failure along a major diagonal crack forming along a distance of
1250 mm from the base and at 58ο angle to the wall’s longitudinal axis (Figure 5.7a). As the
shear failure approached, diagonal cracks became substantially wider, providing sign of shear
distress. Failure then occurred suddenly at a lateral load of 678 kN, corresponding to a lateral
drift of 2.65% (Figure 5.6a). While the bent portion of some of the horizontal web
reinforcement was straightened (Figure 5.8a), the ultimate strain corresponding to rupture of
the bent portion was almost achieved, as will be discussed below. Having the tail length
extend beyond the bent portion is recommended to eliminate such failure-associated behavior.
Wall G4-160
The specimen experienced sudden flexural rupture in the longitudinal bars at the boundary
element under tension (Figures 5.7b and 5.8b). The failure was brittle and associated with an
explosive sound. The maximum lateral load achieved was 708 kN, corresponding to a lateral
drift of 2.8% (Figure 5.6b).
Walls G4-80 and G6-80
The failure of specimens G4-80 and G6-80 was identified as flexural compression failure and
preceded by ample warning, starting with extensive deterioration of the concrete at the
compression zone (at a lateral drift of 2.75% and 2.9% for G4-80 and G46-80, respectively).
Noise generated from this zone was accompanied by a gradual degradation in lateral strength
(912 and 935 kN, respectively) (Figures 5.6c and 5.6d). Ultimately, concrete crushing (Figures
5.7c and d), associated with rupture in the GFRP ties (Figure 5.8c), was prominently evident,
causing wall failure and a drop in lateral strength, followed by the sequential fracturing of the
compressed GFRP bars in the boundary element (Figure 5.8c). The ultimate attained drifts
were 3% and 3.1% for G4-80 and G6-80, respectively (Figures 5.6c and 5.6d). It should be
mentioned that no sign of shear distress was observed up to failure. This indicates that the
GFRP web reinforcement was adequate in resisting diagonal tension.

99
Figure 5.7 – Failure modes: (a) G4-250; (b) G4-160; (c) G4-80; (d) G6-80; (e) G-V; (f) G-H
Figure 5.8 – Damage aspects
Bar rupture
(a) G4-250 (b) G4-160 (c) G4-80 and G6-80
(d) G-V (e) G-H
Fracture of vertical bar dowel
Rupture of GFRP ties crossing shear
crack
Bar rupture Major horizontal cracks above sliding .reinforcement
End hooks straightened
Rupture of GFRP ties
Fracture of the compressed
Bars rupture
(a) G4-250 (b) G4-160 (c) G4-80
(e) G-V (f) G-H
θ=58o
Shear
Shear
θ=59o
Bars rupture
Concrete
(d) G6-80
Concrete crushing

100 Chapter 5: Effect of Web Reinforcement on the Seismic Behavior of Squat Walls
Wall G-V
This specimen achieved its ultimate strength (398 kN) at a lateral drift of 1.5%, and then
experienced pronounced degradation owing to the deterioration of shear-resisting components.
The failure occurred at a lateral drift of 2.2% by sliding along a major diagonal shear crack
(Figure 5.7e). This diagonal shear crack spread along a distance of 1300 mm from the base at
an angle of 59° with the specimen’s longitudinal axis and measured 7.20 mm wide before
failure. The failure was associated with the progressive fracture of the vertical web bars and
fracturing of the GFRP ties at the boundary element crossing the shear crack (Figure 5.8d).
This observation gives evidence that the reinforcement in the boundary element contributed to
the wall’s shear resistance.
Wall G-H
Due to the absence of vertical web reinforcement in this specimen, a noticeable major
horizontal crack above sliding shear reinforcement going through the entire web length was
observed at a lateral drift of 1%. With load reversal, the horizontal crack remained open along
the web zone even under compression stresses of bending moment while it closed at the
boundary zone due to longitudinal reinforcement (Figure 5.8e). This observation reflects the
necessity of using vertical web reinforcement for crack recovery between load reversals. The
specimen failed suddenly due to tensile rupture of the longitudinal bars at the boundary
element above sliding reinforcement (Figure 5.7f, Figure 5.8e) at 2.4% lateral drift,
corresponding to a lateral strength of 482 kN (Figure 5.6f). It is worth mentioning that, even
though the wall failed due to flexural rupture, there was substantial widening of the shear
cracks and shear failure was imminent as the bar rupture took place. It should also be noted
that, due to the additional flexural resistance provided by the bidiagonal sliding shear
reinforcement, flexural rupture of the longitudinal bars was shifted away from the base–wall
interface where the bending moment is maximum.
In general, as presented in Table 5.2, web reinforcement (horizontal or vertical) had no
significant effect on the first flexural and shear cracking loads. The initial cracks were a
primary function of the concrete splitting stress, which depends on concrete compressive
strength; the minor difference observed could be attributed to the difference in concrete

101
strength. Figure 5.5 demonstrates that all the specimens exhibited similar tendencies with
respect to the propagated flexural shear cracks. The main difference, however, was the number
of propagated cracks. Using horizontal or vertical web reinforcement or increasing the
horizontal web reinforcement ratio appeared to result in more cracks. This could be attributed
to two main reasons: (1) the higher ultimate load in specimens with higher web reinforcement
ratios resulted in more cracks; and (2) the fact that the web reinforcement often works as a
crack initiator and consequently influences the shear-crack spacing. This is in agreement with
experiments conducted by Barda et al. (1977) and Luna et al. (2015) on steel RC squat walls.
It is worth mentioning that no sign of premature sliding or anchorage failure was observed in
the specimens. This indicates that FRP bars are adequate in resisting the applied sliding force
and that the anchorage length was sufficient to transmit the wall forces to the base under the
reversed cyclic loadings.
5.3.2. Load–Top Displacement Envelope Curves
Figure 5.9 presents the load–top-displacement envelope curves for the test specimens.
Generally, all the specimens had comparable levels of initial stiffness up to initiation of the
first flexural crack. After that, the specimens experienced reduced lateral stiffness and
represented a cracked specimen with reduced moment of inertia. Different trends were
observed as a function of the web reinforcement. The higher stiffness can be attributed to
either the horizontal or vertical web reinforcement. Consequently, at the same load level, less
lateral displacement was evidenced in walls with both horizontal and vertical web
reinforcement. G-V exhibited a progressive deterioration in lateral stiffness as shear cracks
formation and extension and the associated dramatic shear deformations. This behavior,
however, was significantly enhanced by the horizontal web reinforcement in G4-250, which
outperformed its counterpart, G-V, by approximately 70% and 16% with respect to ultimate
capacity and drift ratio, respectively. Hence, it can be concluded that horizontal web
reinforcement had a direct impact in increasing the ultimate shear strength of the squat walls
when diagonal tension shear failure was dominant. On the other hand, the lower stiffness of G-
H relative to its counterpart G4-250 is attributed to the absence of vertical web reinforcement

102 Chapter 5: Effect of Web Reinforcement on the Seismic Behavior of Squat Walls
with reduced axial stiffness. It would be desirable, if the failure of G-H was pure shear, to
judge the effectiveness of vertical web reinforcement on wall ultimate shear strength. Since
wall strength was generally controlled by flexure, albeit the shear distress was significant, it is
difficult to judge this effectiveness. More investigation is needed to clarify this point.
Tentatively; however, the measured shear crack widths and evaluation of the concrete
contribution to shear resistance will be used later to give an idea of their influence on
behavior.
Figure 5.9 – Load–top displacement envelope curves
Figure 5.9 also reveals that suitable horizontal web reinforcement can change the failure mode
from shear to flexural while achieving higher ultimate strength and drift ratio with
subsequently higher deformability. G4-80 shows this clearly, exhibiting flexural compression
failure while outperforming its counterpart G4-250 by approximately 35% and 18% with
respect to ultimate strength and drift ratio, respectively. Furthermore, while the horizontal web
reinforcement in G6-80 was 125% higher than that in G4-80, both specimens exhibited similar
levels of ultimate strength and drift ratio (the difference did not exceed 3%). This behavior
reveals that using horizontal web reinforcement in excess of the amount required for resisting
the ultimate flexural capacity had no impact on either ultimate strength or drift ratio.
0 0.5 1 1.5 2 2.5 3 3.5
0
200
400
600
800
1000
0 10 20 30 40 50 60 70G
4-80
G4-
160
G4-
250
G6-
80
G-V
G-H
Loa
d (k
N)
Lateral top displacement (mm)
Drift ratio (%)
Flexural bar rupture
Cover splitting
Major horizontal crack
Excessive cover spalling
Concrete crushing
Concrete deterioration
Shear failure

103
5.3.3. Strains in Vertical Reinforcement
Figure 5.10 presents the typical vertical strain distributions along the base of the wall length at
different drift levels. The values at the same drift level are connected with a solid line in all
specimens except for G-H, in which the strains were recorded at only two locations in the
boundary elements; these values are connected by a dashed line. It can be seen that the vertical
strain varied almost linearly along the wall length at small drift levels (0.25%). After this
stage, the distribution exhibited modest variations at the boundary zone either in tension or
compression. This data are useful in evaluating the existing widely used models which are
based on plane section assumptions.
Figure 5.10 – Vertical-strain distribution along the wall length
-4000
-2000
0
2000
4000
6000
8000
10000
12000
14000
0 300 600 900 1200 1500
0.25%0.50%0.75%1.00%1.50%
-4000
-2000
0
2000
4000
6000
8000
10000
12000
14000
0 300 600 900 1200 1500
0.25%0.50%0.75%1.00%1.50%
-4000
-2000
0
2000
4000
6000
8000
10000
12000
14000
0 300 600 900 1200 1500
0.25%0.50%0.75%1.00%1.50%
-4000
-2000
0
2000
4000
6000
8000
10000
12000
14000
0 300 600 900 1200 1500
0.25%0.50%0.75%1.00%1.50%
Distance along wall (mm) Distance along wall (mm)
Distance along wall (mm) Distance along wall (mm)
Str
ain
(με)
Str
ain
(με)
S
trai
n (μ
ε)
Str
ain
(με)
G4-250 G4-160
G4-80 G6-80

104 Chapter 5: Effect of Web Reinforcement on the Seismic Behavior of Squat Walls
Figure 5.10 – Vertical-strain distribution along the wall length (continued)
Figure 5.11 shows the envelope curves for the applied load versus the maximum measured
strain in the vertical reinforcement, which is typically recorded in the first longitudinal bar
near the extreme tension fibers. Initially, before cracking, all of the specimens exhibited
negligible strain, since all stresses are carried by the concrete. By the onset of the flexural
cracks, however, a portion of the stress was transferred to the longitudinal reinforcement,
resulting in a sudden increase in the measured strain in all of the specimens. After this stage,
the strain in all specimens increased almost proportionally with increasing load due to the
elastic nature of the GFRP bars. The horizontal web reinforcement appeared to have no impact
on the longitudinal strain readings, since the specimens with different horizontal web
reinforcement ratios exhibited comparable strains at all loading levels. As expected, however,
the absence of vertical web reinforcement in G-H resulted in higher longitudinal strain relative
to its counterpart specimens at the same load level. This is consistent with the previously
reported lower stiffness of this specimen. It should be noted that, for the entire test specimens
except G-V, all strain gauges on the longitudinal reinforcement halted at a lateral load ranging
from 60% to 70% of the ultimate strength. Therefore, the specimens exhibited higher strain
than that plotted in Fig. 8. In the case of G-V, however, the strain gauges worked properly up
to the ultimate strength, at which point the maximum measured strain was 11200 (μɛ).
-4000
-2000
0
2000
4000
6000
8000
10000
12000
14000
0 300 600 900 1200 1500
0.25%0.50%0.75%1.00%1.50%
-4000
-2000
0
2000
4000
6000
8000
10000
12000
14000
0 300 600 900 1200 1500
0.25%
0.50%
0.75%
Distance along wall (mm) Distance along wall (mm)
Str
ain
(με)
Str
ain
(με)
G-V G-H

105
Figure 5.11 – Maximum measured vertical strain (με)
5.3.4. Strains in Horizontal Reinforcement
Figure 5.12 shows the strain distribution in horizontal bars along the wall height. Note that
these values represent the maximum recorded strain along each instrumented horizontal bar.
The plot demonstrates that the maximum measured strain was recorded at a level almost equal
to 1/3 of the wall height. The maximum measured strain at failure was 9830, 6650, 4840,
2670, and 6820 (με) for G4-250, G4-160, G4-80, G6-80, and G-H, respectively. The lower
measured strain in G4-80 and G6-80 can be attributed to flexural failure with no sign of shear
distress owing to the high horizontal web reinforcement provided in these specimens. It should
be noted that the maximum measured strain in G4-250, which experienced shear failure
associated with straightening of the end hooks, corresponds to 49% of the straight-bar rupture
strain. That value is consistent with the ACI 440.1R (2015) guidelines, which anticipate failure
at the bent portion at 50% of the straight-bar strength. Therefore, it can be concluded that the
specimen nearly achieved its ultimate shear capacity.
Apparently, due to the elastic nature of GFRP bars, shear strain was distributed along the wall
height and increased progressively with drift levels, supporting the finding of Mohamed et al.
(2014b). In contrast, due to the effect of steel yielding in steel RC squat walls, the shear strain
and deformations was localized at the plastic-hinge zone and subsequently accelerated shear
compression failure (Sittipunt et al. 2001).
Strain (με)
Loa
d (k
N)
0
100
200
300
400
500
600
0 3000 6000 9000 12000 15000
G4-250G4-160G4-80G6-80G-VG-H
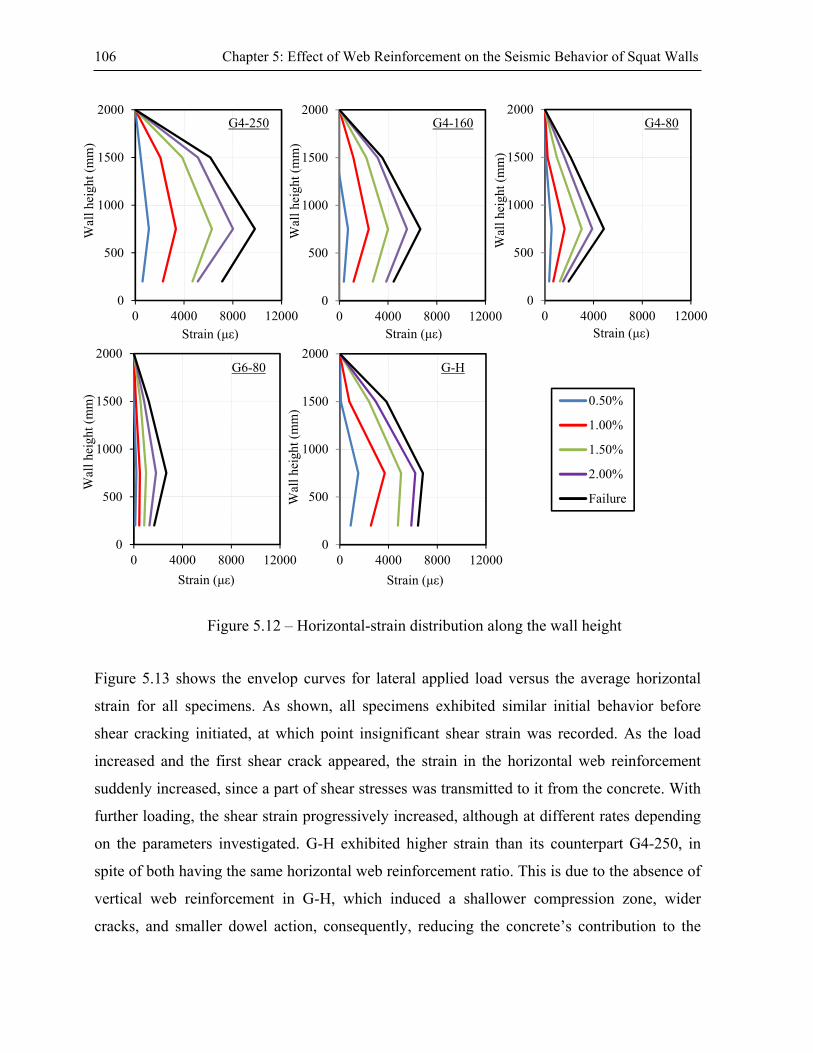
106 Chapter 5: Effect of Web Reinforcement on the Seismic Behavior of Squat Walls
Figure 5.12 – Horizontal-strain distribution along the wall height
Figure 5.13 shows the envelop curves for lateral applied load versus the average horizontal
strain for all specimens. As shown, all specimens exhibited similar initial behavior before
shear cracking initiated, at which point insignificant shear strain was recorded. As the load
increased and the first shear crack appeared, the strain in the horizontal web reinforcement
suddenly increased, since a part of shear stresses was transmitted to it from the concrete. With
further loading, the shear strain progressively increased, although at different rates depending
on the parameters investigated. G-H exhibited higher strain than its counterpart G4-250, in
spite of both having the same horizontal web reinforcement ratio. This is due to the absence of
vertical web reinforcement in G-H, which induced a shallower compression zone, wider
cracks, and smaller dowel action, consequently, reducing the concrete’s contribution to the
0
500
1000
1500
2000
0 4000 8000 120000
500
1000
1500
2000
0 4000 8000 12000
0
500
1000
1500
2000
0 4000 8000 120000
500
1000
1500
2000
0 4000 8000 12000
0
500
1000
1500
2000
0 4000 8000 12000
Wal
l hei
ght (
mm
) W
all h
eigh
t (m
m)
Strain (με) Strain (με) Strain (με)
Strain (με) Strain (με)
Wal
l hei
ght (
mm
)
Wal
l hei
ght (
mm
)
Wal
l hei
ght (
mm
)
G-H G6-80
G4-250 G4-80G4-160
0.50%
1.00%
1.50%
2.00%
Failure

107
lateral shear-resistance mechanism. This reduction increased the shear load carried by the
horizontal web reinforcement, so that higher shear strain was recorded. This indicates that
vertical web reinforcement impacted shear resistance by enhancing the concrete’s shear
resistance.
Figure 5.13 – Load–average horizontal strain envelope curves
5.3.5. Shear-Crack Width
As shown in Figure 5.14, the presence of either horizontal or vertical web reinforcement had a
clear effect on controlling the shear-crack width, especially in the case of horizontal web
reinforcement. For instance, G-V and G4-250 differ in that the latter had a horizontal web
reinforcement ratio of 0.51%. A comparison of the crack width at the same load level in each
specimen revealed the shear-crack width of G4-250 decreased by 89%. Similarly, the
difference between G-H and G4-250 is a vertical web reinforcement ratio of 0.59%, yielding a
decrease in crack width of 41% at the same load level. A possible explanation for this could be
that the vertical web reinforcement contributes to the flexural-resistance mechanism, which
would expose them to high strains. This, in turn, would make them less effective in resisting
the transverse tensile stresses between cracks; which limits crack width. This is clear in Figure
5.15, which shows the hysteretic relationship for the measured vertical strain versus horizontal
Loa
d (k
N)
Strain (με)
0
200
400
600
800
1000
0 2000 4000 6000 8000
G4-80
G4-160 G4-250
G-H
G6-80

108 Chapter 5: Effect of Web Reinforcement on the Seismic Behavior of Squat Walls
strain at the same location in G4-250 as an example. The figure clearly demonstrates that the
measured strain in the horizontal reinforcement was significantly lower than that in the
vertical reinforcement at all load levels.
Higher horizontal web reinforcement (Figure 5.14) provided better control over the shear-
crack width: the greater the horizontal web reinforcement, the lower the recorded shear-crack
width at the same load level. This is consistent with the lower measured shear strain in
specimens with higher horizontal web reinforcement ratios.
Figure 5.14 – Load–shear-crack-width envelope curves
Figure 5.15 – Vertical strain versus horizontal strain at the same location (G4-250)
-2000
0
2000
4000
6000
8000
-500 0 500 1000 1500 2000
Ver
tica
l str
ain
(με)
Horizontal strain (με)
Crack width (mm)
Loa
d (k
N)
0
200
400
600
800
1000
0 1 2 3 4 5 6 7 8
G4-80
G4-160 G4-250
G-H G-V
G6-80
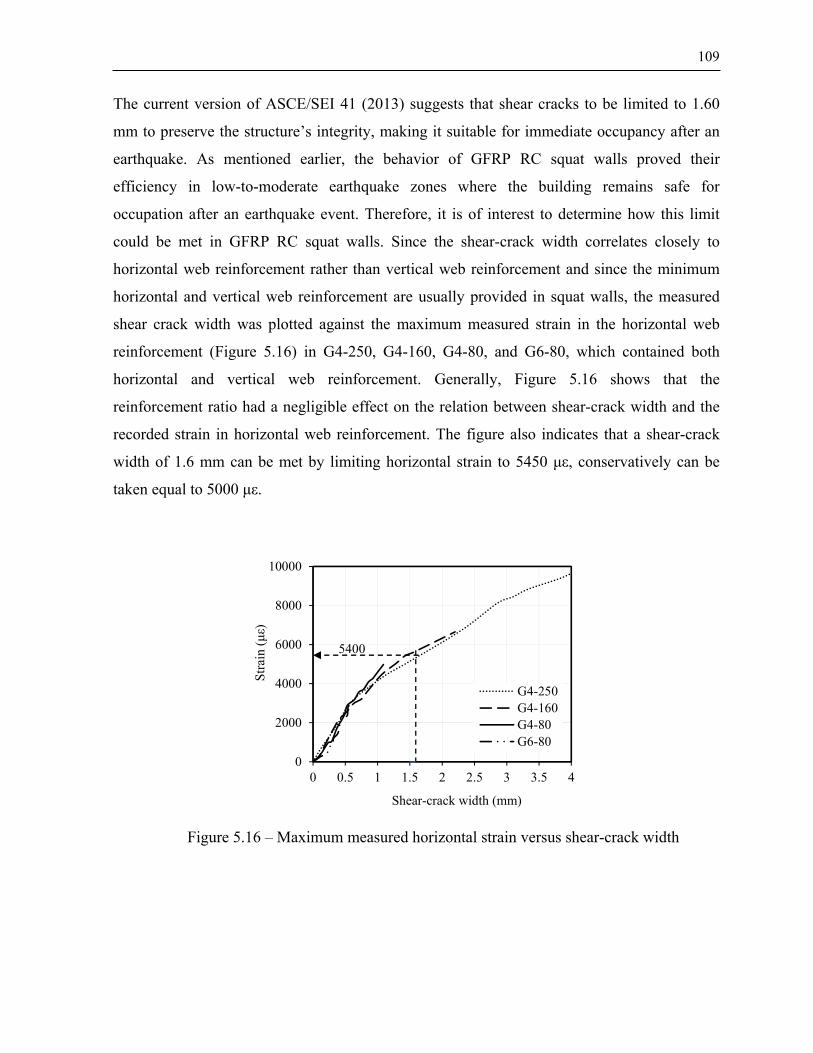
109
The current version of ASCE/SEI 41 (2013) suggests that shear cracks to be limited to 1.60
mm to preserve the structure’s integrity, making it suitable for immediate occupancy after an
earthquake. As mentioned earlier, the behavior of GFRP RC squat walls proved their
efficiency in low-to-moderate earthquake zones where the building remains safe for
occupation after an earthquake event. Therefore, it is of interest to determine how this limit
could be met in GFRP RC squat walls. Since the shear-crack width correlates closely to
horizontal web reinforcement rather than vertical web reinforcement and since the minimum
horizontal and vertical web reinforcement are usually provided in squat walls, the measured
shear crack width was plotted against the maximum measured strain in the horizontal web
reinforcement (Figure 5.16) in G4-250, G4-160, G4-80, and G6-80, which contained both
horizontal and vertical web reinforcement. Generally, Figure 5.16 shows that the
reinforcement ratio had a negligible effect on the relation between shear-crack width and the
recorded strain in horizontal web reinforcement. The figure also indicates that a shear-crack
width of 1.6 mm can be met by limiting horizontal strain to 5450 με, conservatively can be
taken equal to 5000 με.
Figure 5.16 – Maximum measured horizontal strain versus shear-crack width
Shear-crack width (mm)
Str
ain
(με)
0
2000
4000
6000
8000
10000
0 0.5 1 1.5 2 2.5 3 3.5 4
G4-250G4-160G4-80G6-80
5400

110 Chapter 5: Effect of Web Reinforcement on the Seismic Behavior of Squat Walls
5.3.6. Influence of Web Reinforcement on Concrete Shear Resistance
Some current codes for steel RC structures, such as ACI 318 (2014), assume that the concrete
contribution to wall shear strength remains unchanged after the first shear crack initiates,
regardless of the amount or distribution of web reinforcement. Therefore, it is interesting to
examine the concrete contribution after the first shear crack and determine whether this
contribution would be affected by web reinforcement. In doing so, the concrete contribution
was calculated by subtracting the contribution of the horizontal web reinforcement from the
total applied shear force [ACI 318 (2014) and CSA A23.3 (2014)]. The contribution of the
horizontal web reinforcement to the total shear resistance was calculated based on the truss
analogy as follows (SI units):
s
dfAV
vfvvsf
cot (5.1)
where; Vsf is the shear resistance provided by the horizontal web reinforcement, Av is the area
of horizontal web reinforcement within the distance s, ffv is the stress in horizontal web
reinforcement and was calculated as the modulus of elasticity multiplied by the measured
average horizontal strain shown in Figure 5.13, dv is the effective shear depth equal to the
greater of 0.9d or 0.72 lw but not less than 0.8 lw, θ is the measured shear crack angle, and s is
the spacing of the horizontal web reinforcement.
It should be noted that, for specimens exhibiting flexural failure, θ was taken as an average
measured angle of 58.5° for specimens that failed in shear (G4-250 and G-V). The concrete
shear contribution was calculated and plotted against top displacement in Figure 5.17a for all
specimens. The test results indicate that the concrete contribution was higher than that
corresponding to the first shear crack at any load level. The concrete contribution to shear at
failure ranged from 51% to 110% higher than that at the onset of shear cracking; the ratio is a
function of web reinforcement. Specimens with both horizontal and vertical web
reinforcement showed the best performance, while G-H performed the worst. The provision of
horizontal reinforcement (G-V compared to G4-250) induced confinement of the cross section
and controlled shear cracks, while the provision of vertical web reinforcement (G-H compared
to G4-250) resulted in a longer compression zone and greater dowel action, thereby increasing
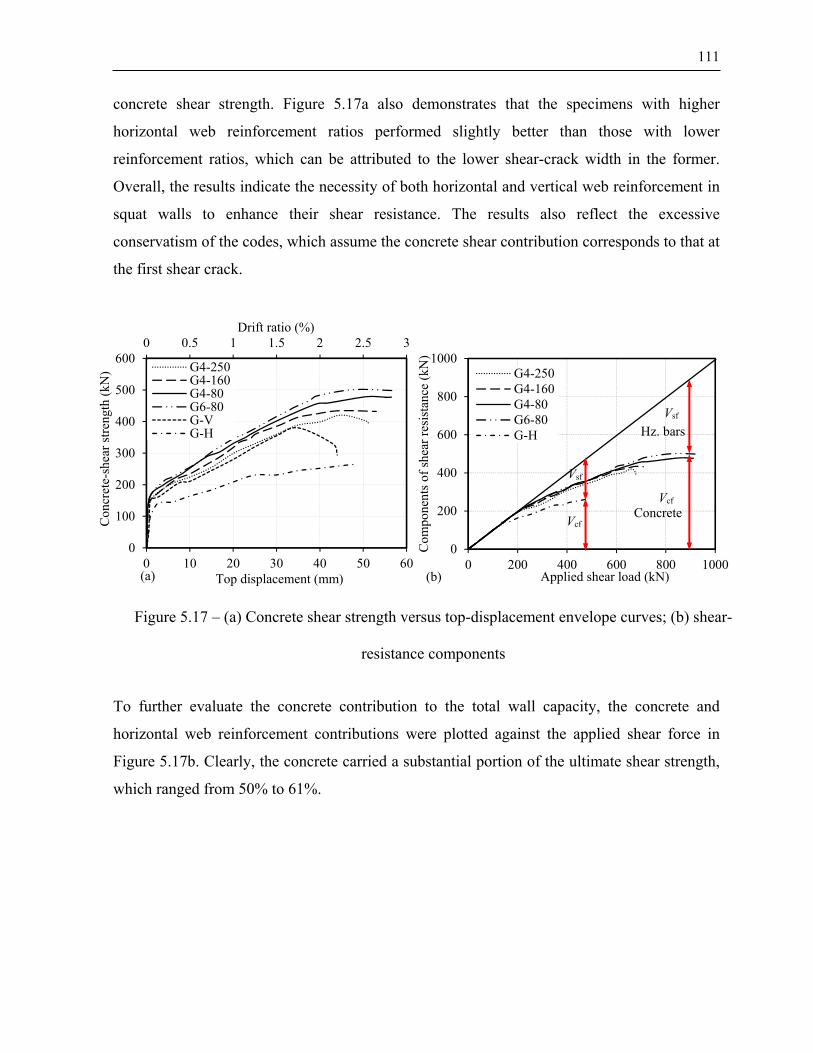
111
concrete shear strength. Figure 5.17a also demonstrates that the specimens with higher
horizontal web reinforcement ratios performed slightly better than those with lower
reinforcement ratios, which can be attributed to the lower shear-crack width in the former.
Overall, the results indicate the necessity of both horizontal and vertical web reinforcement in
squat walls to enhance their shear resistance. The results also reflect the excessive
conservatism of the codes, which assume the concrete shear contribution corresponds to that at
the first shear crack.
Figure 5.17 – (a) Concrete shear strength versus top-displacement envelope curves; (b) shear-
resistance components
To further evaluate the concrete contribution to the total wall capacity, the concrete and
horizontal web reinforcement contributions were plotted against the applied shear force in
Figure 5.17b. Clearly, the concrete carried a substantial portion of the ultimate shear strength,
which ranged from 50% to 61%.
0
200
400
600
800
1000
0 200 400 600 800 1000
G4-250G4-160G4-80G6-80G-H
(a) (b)
Vcf
Vsf
Vsf
Vcf
Hz. bars
Concrete
Con
cret
e-sh
ear
stre
ngth
(kN
)
Drift ratio (%)
Top displacement (mm) Applied shear load (kN)
Com
pone
nts
of s
hear
res
ista
nce
(kN
)
0 0.5 1 1.5 2 2.5 3
0
100
200
300
400
500
600
0 10 20 30 40 50 60
G4-250G4-160G4-80G6-80G-VG-H

112 Chapter 5: Effect of Web Reinforcement on the Seismic Behavior of Squat Walls
5.4. Prediction of Specimens’ Ultimate Strength
The safety of squat walls reinforced with a relatively new material such as GFRP having
different characteristics than the conventional steel depends on the designer’s ability to
successfully predict how such structures behave under seismic loading and reasonably
predicting the ultimate strength and mode of failure. Whereas the foregoing sections shed the
light on some key features of GFRP RC squat walls response under seismic loading in terms
of ultimate strength, drift ratio, failure mode and the efficiency of web reinforcement, the
question still remains about predicting the ultimate strength and failure mode. Currently;
however, no seismic provisions are available in the FRP design codes and guidelines [CSA
S806 (2012); ACI 440.1R (2015)] due to the lack of experimental tests in FRP RC squat walls.
Hence, in an attempt to predict the theoretical ultimate strength of the investigated walls,
similar formulas that are being used the CSA A23.3 (2014) and the ACI 318 (2014) will be
used considering the differences between FRP and steel reinforcement. A summary for these
methods in flexural and shear strengths prediction is given in the following sections. This is
followed by the evaluation of such equations by comparing their prediction with the
experimental results.
It should be noted that material reduction factors are intentionally omitted from the following
code expressions since the specimen dimensions and material strengths are accurately
estimated.
5.4.1. Flexural Strength
Both ACI 318 (2014) and CSA A23.3 (2014) allow the use of plane sectional analysis in
predicting the flexural strength of squat walls. In implementing this method, we adopted the
corresponding provisions in ACI 440.1R (2015) and CSA S806 (2012) pertaining to plane
sectional analysis. The main difference between them is the permissible stress and strain for
the concrete compression block. ACI 440.1R (2015) limits the compressive strain to 0.003 and
the compressive stress to 0.85 fc', which is assumed to be uniformly distributed over a distance
a = β1c from the extreme compressed fiber (where c is the distance from the extreme
compression fiber to the neutral axis and β1 is taken as 0.85 for concrete strength (fc′) up to 28

113
MPa). For strengths above 28 MPa, this factor is incrementally reduced by 0.05 for each 7
MPa of strength more than 28 MPa, but not taken as less than 0.65. CSA S806 (2012),
however, limits the compressive strain to 0.0035 and the compressive stress to (α1fc'),
uniformly distributed over a distance β1c, where α1 and β1 are expressed as follows:
67.00025.097.0,67.00015.085.0 '1
'1 cc ff (5.2)
It should be noted that the factors reported above are used when failure is initiated by concrete
crushing (i.e., the concrete has attained its ultimate compressive strain). If failure begins with
the tensile bars rupturing, however, the factors are different since concrete compressive strain
is less than ultimate. In this case, CSA S806 (2012) provides curves to obtain α1 and β1 as a
function of concrete compressive strain, which can be calculated from the strain compatibility
based on the ultimate strain of the FRP bars. This process requires iteration until equilibrium is
satisfied. This has been simplified in ACI 440.1R (2015), which allows the use of the same as
factors for compression failure but equating the neutral-axis depth with the value of the
balanced case.
The calculations in our study were made considering all the reinforcement crossing the wall
base, including the vertical component of the bidiagonal sliding reinforcement. The
contribution of the GFRP bars in compression was considered by assuming a compressive
strength equal to 50% of the tensile strength, while the modulus of elasticity was considered
the same in tension and compression (Deitz et al. 2003).
5.4.2. Shear Strength
The ACI 318 (2014) shear estimation assumes a shear-crack angle of 45° across the wall’s
shear depth and consists of two superimposed shear-resisting components; concrete shear
strength and horizontal web reinforcement shear strength. The concrete shear contribution is
estimated as the shear capacity corresponding to the first shear crack propagated and was
empirically obtained from experimental results, while the horizontal web reinforcement
contribution is estimated by considering equilibrium of forces at a typical joint of a 45° truss
model. In accordance with this concept, the concrete shear strength was estimated based on the

114 Chapter 5: Effect of Web Reinforcement on the Seismic Behavior of Squat Walls
current test results. The shear stress corresponding to the first shear crack was calculated and
formulated as a function of 'cf according to the format used in ACI 318 (2014). As shown in
Table 5.3, the concrete shear strength could be taken as equal to 0.12 'cf as an average value.
According to ACI 318 (2014), in the case of steel RC squat walls, the concrete shear strength
is equal to 0.25 'cf . The lower average value measured in this study could be attributed to the
absence of axial loading. The horizontal web-reinforcement contribution was calculated based
on the shear provisions in the ACI 440.1R (2015). Generally, owing to the unidirectional
properties of the material, bending FRP to form stirrups substantially reduces strength in the
bent portion. The current practice with FRP RC elements limits the ultimate stress in shear
reinforcement to avoid rupture at the bent portion and maintain the shear transfer via aggregate
interlock. The first criterion is satisfied by limiting stress to the bent portion’s ultimate
strength, while the second is satisfied by limiting the ultimate tensile strain. Considering the
ACI 440.1R (2015) limitation for the ultimate stress in shear reinforcement and using 0.12
'cf as concrete shear strength, the following equations were used:
)12.0( '
sb
fAfAV vv
ccvsr
(5.3)
where the first term is the concrete contribution and the second term is the horizontal web-
reinforcement contribution, Acv is cross-sectional area of the wall, fc′ is the concrete
compressive strength, Av is total cross-sectional area of the horizontal web reinforcement on
spacing s, b is the wall thickness, and fv is the permissible stress in the horizontal web
reinforcement, which is calculated as follows:
FRPbendfvv fEf 004.0 , fufub
BFRPbend ff
d
rf )3.005.0( (5.4)
where Efv is the modulus of elasticity of the horizontal web reinforcement, fFRPbend is the bent
portion’s ultimate strength, rB is the internal bend radius, and db is the horizontal bars
diameter.

115
CSA A23.3 (2014) provides a shear-design method based on the modified compression-field
theory (MCFT). In this theory, the angle of the diagonal shear crack is estimated as a function
of the wall depth, longitudinal-reinforcement axial rigidity, and the internal forces applied at
the section of interest. In contrast to ACI 318 (2014), which recognizes the shear contribution
of concrete in squat walls, the CSA A23.3 (2014) specifies that no dependence should be
placed on the concrete in contributing towards squat-wall shear strength. Consequently, the
shear force should be resisted only by horizontal web reinforcement. The CSA A23.3 (2014)
provision is justified by some experimental tests that revealed the shear strength of squat wall
is adversely affected by horizontal displacement cycles. Another difference relates to effective
shear depth: ACI 318 (2014) assumes that the entire length is effective in shear resistance,
while CSA A23.3 (2014) defines the effective shear depth (dv) as the greater of 0.9d (d is
effective flexural depth) or 0.8 lw (lw is wall length).
The shear strength of the test specimens was estimated based on the horizontal web-
reinforcement contribution according to CSA A23.3 (2014); the CSA S806 (2012) limitations
for the allowable stress in FRP shear reinforcement were considered as follows:
s
dfAVV vvv
sfsr
cot (5.5)
fuFRPbendfvv ffEf 4.0005.0 , l 700029 60°, ff
fvfl AE
VdM
2
(5.6)
where Mf and Vf are, respectively, the moment and shear applied at the critical section of shear
taken at the wall base; Ef and Af are the elastic modulus and the total cross-sectional area of
longitudinal tension reinforcement at the same section; and the other terms as described above.
5.4.3. Comparison of Predicted Ultimate Strength to Test Results
Table 5.3 provides the calculated ultimate flexural and shear strength for the test specimens.
The lowest value of the calculated flexural and shear strengths was considered as the ultimate
strength corresponding to failure and compared with the test results in the same table. It should
be noted that material reduction factors were taken equal to unity. Generally,
ACI 440.1R (2015) predicted the same failure mode as the experimental results. Moreover, the

116 Chapter 5: Effect of Web Reinforcement on the Seismic Behavior of Squat Walls
used equations yielded conservative estimations, although with different accuracies in terms of
failure mode. The ultimate shear strength of G4-250, which failed in shear, was
underestimated by almost 24%. While this level of conservatism might be reasonable in the
design, the ACI 440.1R (2015) shear estimation method still has some shortcomings that can
be summarized as follows:
1. The assumption of a 45° shear-crack angle appears to be inappropriate since the angle
measured was greater than 45°; the angle measured in G4-250 was 58° (Figure 5.7). This
indicates that the horizontal web-reinforcement contribution to shear resistance was
overestimated by approximately 60%. Although this shortcoming did not affect
conservatism in this study, which was attributed to other shortcomings, it might lead to
unsafe predictions in some cases, given the fact that the shear-crack angle in FRP RC
elements can significantly deviate from 45° and, in some cases, be as much as 70°
(Razaqpur and Spadea. 2015).
2. It is assumed that the concrete contribution is equal to the shear strength when the first
shear crack is initiated. As mentioned, however, the concrete contribution was significantly
higher than that (Figure 5.17b). This shortcoming is clear in predicting the ultimate strength
of G-V, which is underestimated by 44%.
3. Excessive underestimation of the shear strain. Whereas the ultimate shear strain was limited
to 4000 με, the test results showed that G4-250 attained an average horizontal strain equal
to 7710 με (Figure 5.13) which is almost double the specified value.
4. The method does not account for reinforcement at the boundary elements, which
demonstrated their effectiveness in controlling shear-crack width and inclination at the wall
edges. Moreover, ACI 440.1R (2015) neglects the effect of other parameters that might be
crucial to behavior such as vertical web reinforcement, aspect ratio, and axial loading. More
investigation is required to clarify their effects.
Table 5.3 also shows that ACI 440.1R (2015) underestimated the ultimate flexural capacity of
G4-80 and G6-80 by almost 36%, as it does not account for the confinement effect, which will
be discussed later.

117
Table 5.3 – Ultimate strength prediction
Wall
Experimental ACI 440.1R-15 CSA S806-12 CSA S806-12*
'cc
cr
fA
V Vexp (kN)
FM Vf
(kN) Vs
(kN) Vpred
(kN)F.M
Vf (kN)
Vs =Vsf (kN)
θ °Vpred
(kN)F.M
Vc
(kN)Vsf
(kN) θ
Vs*
(kN)Vpred
*
(kN)F.M
G4-250 0.13 678 DT 540 517 517 DT 587 206 56 206 DT 312 177 60 489 489 DT
G4-80 0.12 912 FC 563 1178 563 FC 623 549 60 549 DT 334 549 60 883 623 FC
G6-80 0.12 935 FC 570 2368 570 FC 630 1234 60 630 FC 338 1234 60 1572 630 FC
G-V 0.12 398 DT 558 222 222 DT 609 0.0 0.0 0.0 DT 163 0.0 51 163 163 DT
G-H 0.10 482 FT 464 517 464 FT 479 176 60 176 DT 312 176 60 488 479 FT
Notes: Vcr = shear cracking load; Ac = gross sectional area; Vexp = experimental ultimate strength; FM = failure mode; DT = diagonal tension failure; FT = flexural tension failure; FC = flexural compression failure; Vf = flexural strength; Vs = shear strength against diagonal tension; θ = angle between the shear crack and the longitudinal axis of the wall; Vpred = the lower of Vf and Vs; the notation * represents the prediction after considering the concrete contribution to shear resistance (Eq. 6).
The deficiency of the 45° shear crack angle assumption was rectified in CSA S806 (2012)
based on the MCFT calculation method that produced a reasonable estimation of the shear-
crack angle of 56°, compared to an average experimental value of 58° in G4-250. However,
due to omitting the concrete contribution from the wall shear resistance and limiting shear
strain (5000 με), CSA S806 (2012) unduly underestimated the ultimate shear strength. For
instance, the ultimate shear strength for G4-250 was underestimated by 70% and G-V was
expected to carry a load equal to zero, which is contrary to the test results. Furthermore, as
result of excessive conservatism, CSA S806 (2012) predicted pure shear failure for G4-80 and
G-H, although the former experienced flexural compressive failure and the latter flexural
tensile failure.
Neglecting the concrete component in resisting shear would be reasonable in squat walls
reinforced with steel in which the shear cracks have not properly closed by the onset of plastic
deformations, accordingly, by cycling they expose to abrasive rubbing along their asperities.
This phenomenon takes part in deteriorating the aggregate-interlock shear-resistance
mechanism, which depends on the roughness of crack asperities. This, however, was not the
case with the GFRP RC walls, in which the cracks realigned and closed between load reversals
due to the elastic nature of GFRP bars. Therefore, neglecting the concrete contribution appears
to be inappropriate in GFRP RC squat walls. To overcome this shortcoming, the shear strength
was recalculated, considering the concrete contribution (Vc) calculated with the formula

118 Chapter 5: Effect of Web Reinforcement on the Seismic Behavior of Squat Walls
proposed by Razaqpur and Isgor (2006) that is being used in CSA S806 (2012) for FRP RC
elements:
vwcsarmc dbfkkkkV 3/1' )(05.0 , vwccvwc dbfVdbf '' 22.011.0 (5.7)
2/1)/( ffm MdVk , 3/1)(1 ffr Ek , 5.2/)5.2( ffa MdVk , 0.1)450
750(
dks (5.8)
fu
wcvF f
sbfA
4.007.0 ' (5.9)
where km represents the effect of moment on shear strength at the section of interest, kr
accounts for the effect of reinforcement rigidity on shear resistance, ka accounts for the effect
of arch action, and ks accounts for the effect of member size on its shear strength (if the
effective depth is greater than 300 mm with transverse shear reinforcement less than AvF; e.g.,
specimen G-V).
Table 5.3 presents the recalculated shear strengths according to Eq. 5.5 in addition to Eq. 5.7.
Considering concrete contribution (Eq. 5.7) resulted in more reasonable yet conservative
results. The shear strength underestimation in G4-250 changed from 70% to 28%, while the
predicted ultimate strength of G-V changed from 0.0 kN to 163 kN, which is still significantly
lower than the experimental ultimate strength. The modification also made it possible to
predict the failure mode of G4-80 and G-V. Similar to ACI 440.1R (2015) which omits the
confinement effect in flexural strength estimation, the ultimate flexural strengths of G4-80 and
G6-80 are highly underestimated using the CSA S806-12.
5.4.4. Confinement Influence on Wall Response
Since the test specimens were properly detailed at the boundary elements and enough
transverse reinforcement was provided, the confinement effect should be taken into
consideration. This effect is evident especially for the specimens that experienced flexural
compression failure (G4-80 and G6-80). Test observations revealed that, despite the concrete-
cover splitting with initiation of cover spalling, the specimens continued to sustain loading and
underwent substantially large deformations. This indicates the effectiveness of the transverse
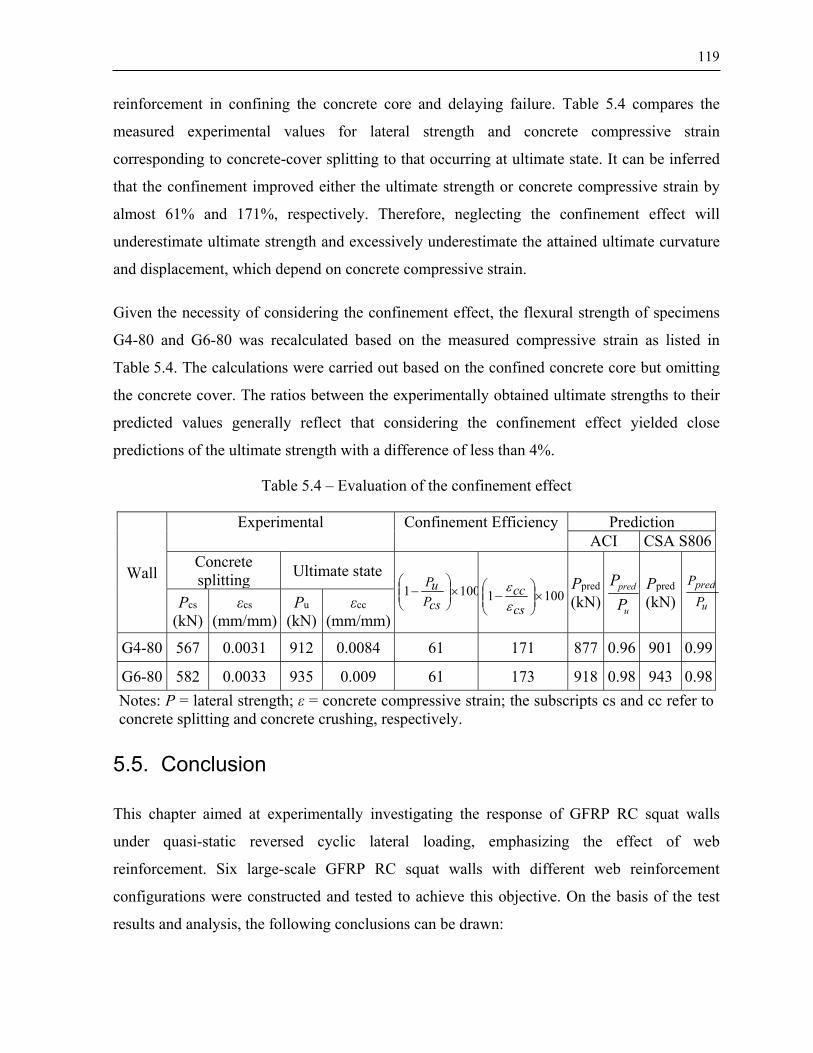
119
reinforcement in confining the concrete core and delaying failure. Table 5.4 compares the
measured experimental values for lateral strength and concrete compressive strain
corresponding to concrete-cover splitting to that occurring at ultimate state. It can be inferred
that the confinement improved either the ultimate strength or concrete compressive strain by
almost 61% and 171%, respectively. Therefore, neglecting the confinement effect will
underestimate ultimate strength and excessively underestimate the attained ultimate curvature
and displacement, which depend on concrete compressive strain.
Given the necessity of considering the confinement effect, the flexural strength of specimens
G4-80 and G6-80 was recalculated based on the measured compressive strain as listed in
Table 5.4. The calculations were carried out based on the confined concrete core but omitting
the concrete cover. The ratios between the experimentally obtained ultimate strengths to their
predicted values generally reflect that considering the confinement effect yielded close
predictions of the ultimate strength with a difference of less than 4%.
Table 5.4 – Evaluation of the confinement effect
5.5. Conclusion
This chapter aimed at experimentally investigating the response of GFRP RC squat walls
under quasi-static reversed cyclic lateral loading, emphasizing the effect of web
reinforcement. Six large-scale GFRP RC squat walls with different web reinforcement
configurations were constructed and tested to achieve this objective. On the basis of the test
results and analysis, the following conclusions can be drawn:
Wall
Experimental Confinement Efficiency PredictionACI CSA S806
Concrete splitting
Ultimate state
1001
csPuP
1001
cs
cc Ppred
(kN)
u
pred
P
P
Ppred
(kN)
u
pred
P
P
Pcs
(kN) εcs
(mm/mm) Pu
(kN) εcc
(mm/mm)
G4-80 567 0.0031 912 0.0084 61 171 877 0.96 901 0.99
G6-80 582 0.0033 935 0.009 61 173 918 0.98 943 0.98
Notes: P = lateral strength; ε = concrete compressive strain; the subscripts cs and cc refer to concrete splitting and concrete crushing, respectively.

120 Chapter 5: Effect of Web Reinforcement on the Seismic Behavior of Squat Walls
1. Web reinforcement had no significant effect on either initial flexural or initial shear-
cracking load. The slight differences observed can be attributed to the difference in
concrete strength.
2. Horizontal web reinforcement had a direct impact on increasing squat wall ultimate shear
strength and drift ratio as long as the failure was preceded by diagonal tension. Using
horizontal web reinforcement in excess of the amount required for resisting the ultimate
flexural capacity, however, had no effect.
3. The presence of either horizontal or vertical web reinforcement in the wall specimen
significantly enhanced the concrete contribution after formation of the first shear crack.
However, this enhancement is conservatively neglected by the ACI 318 (2014).
4. The presence of horizontal and vertical web reinforcement was essential in crack recovery
between load reversals.
5. In contrast to steel RC squat walls, the shear strain was distributed along the wall height
due to the elastic nature of GFRP bars.
6. The provision of horizontal or vertical web reinforcement had a clear effect on controlling
shear-crack width, although horizontal web reinforcement proved to be more effective.
7. Limiting strain to 5000 με in the horizontal web reinforcement is recommended to control
the shear-crack width in GFRP RC squat walls.
8. The shear estimation method adopted by ACI 440.1R (2015) yielded a conservative
estimation of the ultimate shear strength. An accurate estimation of the concrete shear
contribution to account for the increase after the first shear crack and modifying the
assumption of a 45° shear-crack angle adapted for walls with different properties might,
however, be necessary.
9. The shear method in CSA S806 (2012) was shown to closely predict the shear-crack angle.
Since it neglects the concrete’s contribution to shear strength, this method unduly
underestimates ultimate shear strength, which could lead to reinforcement congestion.
Therefore, the ultimate shear strength was recalculated using the concrete shear strength
calculated with the Razaqpur and Isgor (2006) equation, which yielded more reasonable
yet conservative estimations.

121
10. The reinforcement for detailing at the boundary improved concrete confinement,
improving the predicted ultimate strength. Therefore, the confinement effect should be
considered in the design.
Further studies are needed to shed more light on the effect of vertical web reinforcement on
ultimate shear strength and clarify the effect of other parameters, such as aspect ratio, and the
effect of boundary elements on shear response.


CHAPTER 6
Evaluation of Flexural and Shear Stiffness of
Concrete Squat Walls Reinforced with Glass-Fiber-
Reinforced-Polymer (GFRP) Bars
Foreword
Authors and Affiliation
o Ahmed Arafa: PhD candidate, Department of Civil Engineering, University of
Sherbrooke.
o Ahmed Sabry Farghaly: Postdoctoral Fellow, Department of Civil Engineering,
University of Sherbrooke, and Associate Professor, Assiut University, Egypt.
o Brahim Benmokrane: Department of Civil Engineering, University of Sherbrooke,
Sherbrooke.
Journal: ACI Structural Journal
Paper status: Submitted on March 3, 2017
Reference: Arafa, A., Farghaly, A. S., Benmokrane, “Evaluation of Flexural and Shear
Stiffness of Concrete Squat Walls Reinforced with Glass-Fiber-Reinforced-Polymer (GFRP)
Bars,” ACI Structural Journal.
122

123
Contribution in Thesis:
The test results presented in chapter 4 and 5 have proven the applicability of GFRP RC squat
walls in resisting lateral loads and strongly suggested the necessity of proposing a design
procedure for them. One of the most important aspects in the design of structural walls is
evaluating its lateral displacement and limiting it to an acceptable threshold for serviceability
and other limit state criteria. This requires a proper estimation of the lateral stiffness that is the
main scope of the present chapter. It should be noted that only specimens, G4-250, G4-160,
G4-80 and G6-80 (that are the most practical test specimens) in addition to the steel reference
specimen are included in the estimation.
Abstract
Estimating the flexural and shear stiffness of concrete squat walls reinforced with glass-fiber-
reinforced-polymer (GFRP) bars is important in order to evaluate the lateral displacement. To
address this issue, five full-scale concrete squat walls, including four reinforced with GFRP
bars and one reinforced with steel bars, were tested to failure under quasi-static reversed cyclic
lateral loading. Decoupling flexural and shear deformations of the tested specimens showed
the contribution of shear deformation to the lateral displacement. The shear stiffness of the
cracked wall can be estimated based on the truss model with an acceptable level of
conservatism. The shear-crack angle and concrete shear strength were evaluated. The flexural
stiffness was estimated based on the available expressions in the codes and guidelines related
to the design of concrete members reinforced with FRP bars, demonstrating their adequacy
with walls, although they were established for beam and slab elements. Based on regression
analyses of the test results, expressions that correlate flexural and shear stiffness to lateral drift
were proposed. Such expressions would be vital in the context of displacement-based design.
Keywords: GFRP bars, concrete squat walls, stiffness, flexural and shear deformations,
seismic resistance.

124 Chapter 6: Evaluation of Flexural and Shear Stiffness of Concrete Squat Walls
6.1. Introduction
The use of fiber-reinforced-polymer (FRP) materials has been growing to overcome the usual
problems induced by the corrosion of steel reinforcement in concrete structures. These
investigations, however, have focused mainly on the behavior under static-loading conditions,
focusing less frequently on seismic design. The feasibility of using FRP as internal
reinforcement for lateral-resisting systems while preserving the stiffness and deformation
capacity has become prominent. Mohamed et al. (2014a) tested mid-rise shear walls showing
the stable cyclic performance and high level of deformability achieved by GFRP RC shear
walls in comparison to one reinforced with steel. Mohamed et al. (2014b) indicated the
potential of GFRP reinforcement in distributing the shear deformations along the wall height,
owing to its elastic nature, resulting in control shear distortion relatively similar to that in the
steel RC wall in which shear distortion took place simultaneously with occurrence of yielding
of flexural reinforcement and mobilized at the plastic hinge zone, thereby deteriorating shear
resistance.
The test results for the GFRP RC mid-rise walls paved the way for a new experimental series
using GFRP bars in squat walls (height-to-length ratio less than 2.0) in which the shear-
deformation problem is frequently encountered (Paulay et al. 1982, Luna et al. 2015). Arafa et
al. (2016b) reported experimental results on two squat walls: one was reinforced with
conventional steel bars, while the second was reinforced with GFRP bars. The GFRP RC squat
wall attained satisfactory strength and stable cyclic behavior as well as self-centering capacity
that contributed in preventing sliding shear, which occurred in the steel RC counterpart.
One of the most important aspects in squat-wall design is estimating wall’s lateral
displacement and limiting this displacement to an acceptable level. This requires an
appropriate estimation of wall lateral stiffness, which can significantly affect the calculation of
the natural period time and the distribution of lateral forces among structure walls as well.
Accordingly, estimating both the flexural and shear stiffness of GFRP RC squat walls was the
main focus of this study.

125
6.2. Research Significant
This paper focuses mainly on estimating the flexural and shear stiffness of GFRP RC concrete
squat walls as a lateral seismic element. Flexural and shear deformations were decoupled,
showing the significant effect of shear deformation on the total displacement. The flexural and
shear stiffness of the GFRP RC concrete squat walls was evaluated. Herein, these results are
thoroughly discussed and compared to the experimental results. In addition, to gain useful
information within the context of displacement-based seismic design, expressions that directly
correlate the squat-wall flexural and shear stiffness with lateral-drift ratio were proposed.
6.3. Summary of Experimental Program and Results
Five full-scale reinforced-concrete squat walls were constructed and tested to failure under
quasi-static reversed cyclic lateral loading. Four specimens were entirely reinforced with
GFRP bars (G4-250, G4-160, G4-80, and G6-80) and one was reinforced with steel bars (S4-
80). Figures 6.1a and 1b show the concrete dimensions and reinforcement configuration of the
test specimens. The boundary elements’ longitudinal- and transverse-reinforcement ratios and
vertical web reinforcement were 1.43%, 0.89%, and 0.59%, respectively, in all specimens.
Four horizontal web reinforcement ratios equal to 0.51%, 0.79%, 1.58%, and 3.58% were used
in G4-250, G4-160, G4-80, and G6-80 with using two layers of No. 13 GFRP bars spaced at
250, 160, and 80 mm (9.8, 6.3, 3.15 in) or No. 19 GFRP bars spaced at 80 mm (3.15 in),
respectively. Specimen S4-80 served as a reference for G4-80, so both specimens had identical
reinforcement configurations and ratios. One layer of bidiagonal No. 10 GFRP bars with
spacing of 100 mm was added to prevent sliding shear. Figures 6.1c and 1d show the test setup
and loading history, respectively. A series of linear variable differential transducers (LVDTs)
and bar strain gauges were mounted on the specimens (Figure 6.1e). Table 6.1 provides the
mechanical properties of the reinforcement.
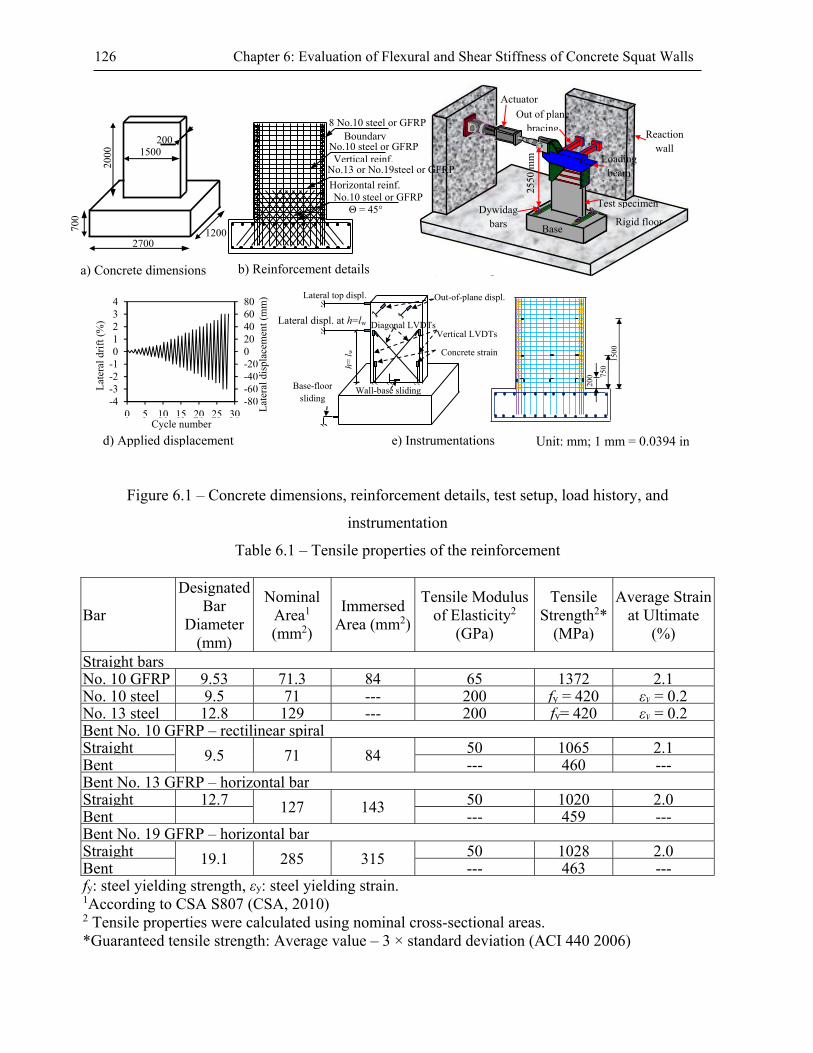
126 Chapter 6: Evaluation of Flexural and Shear Stiffness of Concrete Squat Walls
Figure 6.1 – Concrete dimensions, reinforcement details, test setup, load history, and
instrumentation
Table 6.1 – Tensile properties of the reinforcement
Bar
Designated Bar
Diameter (mm)
Nominal Area1
(mm2)
Immersed Area (mm2)
Tensile Modulus of Elasticity2
(GPa)
Tensile Strength2*
(MPa)
Average Strain at Ultimate
(%)
Straight bars No. 10 GFRP 9.53 71.3 84 65 1372 2.1No. 10 steel 9.5 71 --- 200 fy = 420 εy = 0.2No. 13 steel 12.8 129 --- 200 fy= 420 εy = 0.2Bent No. 10 GFRP – rectilinear spiral Straight 9.5 71 84 50 1065 2.1Bent --- 460 ---Bent No. 13 GFRP – horizontal bar Straight 12.7 127 143 50 1020 2.0Bent --- 459 ---Bent No. 19 GFRP – horizontal bar Straight 19.1 285 315 50 1028 2.0Bent --- 463 ---fy: steel yielding strength, εy: steel yielding strain. 1According to CSA S807 (CSA, 2010) 2 Tensile properties were calculated using nominal cross-sectional areas. *Guaranteed tensile strength: Average value – 3 × standard deviation (ACI 440 2006)
Unit: mm; 1 mm = 0.0394 in
Out-of-plane displ.
Lateral displ. at h=lw
Lateral top displ.
Concrete strain
Diagonal LVDTs Vertical LVDTs
Wall-base sliding Base-floor sliding
h= l w
-4-3-2-101234
-80-60-40-20020406080
0 5 10 15 20 25 30Cycle number
Lat
eral
dis
plac
emen
t (m
m)
Lat
eral
dri
ft (
%)
a) Concrete dimensions
1500 200
1200 2700
700
2000
b) Reinforcement details c) Test setup
d) Applied displacement e) Instrumentations
1500
75
0
200
Reaction wall
Rigid floor Base
Test specimen
Loading beam
Actuator
Out of plane bracing
Dywidag bars
2550
mm
Boundary 8 No.10 steel or GFRP
No.10 steel or GFRP Vertical reinf.
No.13 or No.19steel or GFRP
Horizontal reinf.No.10 steel or GFRP
Θ = 45°

127
Premature sliding failure dominated the behavior of S4-80 due to flexural reinforcement
yielding, which produced a major horizontal crack (Figure 6.2a). Such behavior, however, was
prevented in G4-80, which exhibited flexural compression failure (Figure 6.2b). This was
attributed to the elastic nature of GFRP bars, which helped the cracks to realign and lock up in
the compression zone as well as distributing shear deformations along the wall height. Figure
6.3 illustrates that both specimens exhibited similar initial stiffness. Due to the relatively low
elastic modulus of GFRP bars, however, G4-80 experienced softer behavior than S4-80 after
initiation of the first flexural crack. The two envelopes intersected at 1.35% lateral drift. Then,
the strength of S4-80 deteriorated due to localized sliding-shear deformations, while G4-80’s
strength kept increasing to achieve an ultimate load and drift of almost 71% and 50% higher
than those of S4-80, respectively.
The failure of G6-80 was identified as flexural compression failure (Figure 6.2c). The failure
of G4-250 occurred by sliding along a major diagonal shear crack (Figure 6.2d) due to the
inadequacy of horizontal web reinforcement, while G4-160 experienced sudden flexural
rupture in the longitudinal bars at the boundary element under tension (Figure 6.2e). Figure
6.3 shows that the horizontal web reinforcement ratio had a significant effect on increasing the
ultimate strength and drift ratio. This effect, however, appears to have been insignificant when
the wall was provided with more horizontal web reinforcement than required for flexural
resistance (G6-80 compared to G4-80). Overall, the observed behavior reveals the acceptable
behavior of GFRP-reinforced walls as a lateral-resisting system in low to moderate earthquake
regions. Table 6.2 summarizes the failure progression of the test specimens.
Figure 6.2 – Failure modes of the test specimens
Sliding shear
(a) S4-80 (d) G4-250 (e) G4-160 (b) G4-80 (c) G6-80
Flexural compression
Flexural compression
Diagonal tension shear
Flexural tension

128 Chapter 6: Evaluation of Flexural and Shear Stiffness of Concrete Squat Walls
Figure 6.3 – Load–top-displacement envelope curves
Table 6.2 – Summary of the test results
Wall name
fc' (MPa)
Initial Flexural Crack
Initial Shear Crack
Steel Yielding
Concrete Cover
Splitting
Excessive Cover
Spalling
Peak Capacity
Failure
P (kN)
d (%) P
(kN) d
(%)P
(kN)d
(%)P
(kN)d
(%)P
(kN)d
(%)P
(kN) d
(%) P
(kN) d
(%)
G4-250 35 147 0.025 228 0.39 ---- ---- 510 1.6 615 2.0 678 2.65 678 2.65
G4-160 35 145 0.025 227 0.36 ---- ---- 528 1.5 639 2.0 708 2.8 708 2.8
G4-80 40 164 0.026 234 0.34 ---- ---- 567 1.5 710 2.0 912 2.75 810 3.0
G6-80 41 168 0.026 237 0.29 ---- ---- 582 1.5 739 2.0 935 2.9 815 3.1
S4-80 35 160 0.025 230 0.1 425 0.4 525 1.0 534 1.25 534 1.25 440 2.00
fc' = concrete compressive strength; P = applied lateral load; d = drift ratio Note: 1 MPa = 145 psi; 1 kN = 0.225 kips
6.4. Decoupling of Flexural and Shear Deformations
Oesterle et al. (1979) suggested that the shear deformation of a shear panel can be directly
estimated from the changes in the length of the two diagonals using Eq. 6.1a (Figure 6.4a).
The flexural deformations, on the other hand, can be calculated based on the two vertical
LVDTs mounted at both boundaries with height h using Eq. 6.1b.
hL
ddddddhU originaloriginals 2
)()( /2
/1
(6.1a)
Note: 1 mm = 0.0394 in.; 1 kN = 0.225 kips
0 0.5 1 1.5 2 2.5 3 3.5
0
200
400
600
800
1000
0 10 20 30 40 50 60 70
Lat
eral
load
(kN
)
Lateral top displacement (mm)
Lateral top drift (%)
S4-
80
G4-
250
G4-
160
G4-
80 G
6-80
C
oncr
ete
crus
hing
Ten
sion
fai
lure
Shear failure
Excessive cover spalling
Cover splitting
Yielding
Bars buckling

129
hL
VVhU RL
originalf)(
(6.1b)
where γoriginal is the shear distortion over a height h; d1′ and d2′ are the lengths of the diagonal
LVDTs after deformation; d is the original length of the diagonal before deformation; L and h
are the length and height of the panel, respectively; and θ is the rotation over the height h.
The shear deformation calculated by this method, however, is overestimated because of the
variation in bending moment along the wall height. Hiraishi (1984) demonstrated that this
method is only valid if the center of rotation is located at the element center (Figure 6.4b),
which is not the case of structural walls. Therefore, a portion of the change in diagonal lengths
has to be attributed to flexural deformations (Figure 6.4c). Moreover, Eq. (6.1b) is only valid
if the curvature is concentrated at the wall base, which is not the case in many walls.
Therefore, Hiraishi (1984) suggested the following corrected equations:
hUU originalscorrecteds )5.0( (6.2a)
originalfcorrectedf UhU (6.2b)
h
dyyh
0
)( (6.2c)
The center of rotation (α) accounts for the variation in curvature along the panel height and
can be estimated as shown in Figure 6.5.
Figure 6.4 – Decoupling of flexural and shear deformations
b) Flexural deformations, constant curvature along height
a) Shear deformation c) Flexural deformations, variable curvature along height
Uf1 Uf2
/1d
/1d
/2d
/2d/
2d d
dd
d dd
hhh
Us1 Us2
LLL

130 Chapter 6: Evaluation of Flexural and Shear Stiffness of Concrete Squat Walls
Figure 6.5 – Method for estimating α (rotation profile over the wall height)
Mohamed et al. (2014b) stated that Eq. 6.1 overestimated shear deformations; correcting the
results based on Eq. 2 produced consistent results. This confirms the necessity of involving α
in the calculation to obtain corrected values for decoupled deformations. In our study, the
flexural and shear deformations were calculated over a height h = lw based on the arranged
instrumentation (Figure 6.1e). To assist in calculating the center of rotation, average curvature
and rotations over the wall height were calculated (Figures 6.6a and 6.6b, respectively). α was
found to be 0.62 for S4-80, 0.59 for G6-80, and 0.58 for the other specimens.
Figure 6.6 – Calculated curvature and rotation profiles for the test specimens
hw
h
h dyy
0 )(
area
areaShaded
r Rectangula
0
0.5
1
1.5
2
0 0.01 0.02 0.03
0.25%0.50%0.75%1.00%1.50%Failure
0
0.5
1
1.5
2
0 0.01 0.02 0.03
0.25%0.50%0.75%1.00%1.50%Failure
Wal
l hei
ght (
m)
Wal
l hei
ght (
m)
Curvature (rad/m) Rotation (rad)
G4-250 G4-250
Rotation (rad)
0
0.5
1
1.5
2
0 0.01 0.02 0.03
0.25%0.50%0.75%1.00%1.50%Failure0
0.5
1
1.5
2
0 0.01 0.02 0.03
0.25%0.50%0.75%1.00%1.50%Failure
Wal
l hei
ght (
m)
Wal
l hei
ght (
m)
Curvature (rad/m)
S4-80 S4-80

131
Figure 6.6 – Calculated curvature and rotation profiles for the test specimens (continued)
6.4.1. Original and Corrected Flexural and Shear Deformations
As shown in Figure 6.7, the total displacement was substantially overestimated with Eq. 6.1,
while the results with Eq. 6.2 were in good agreement with the measured lateral displacement.
Figure 6.8 shows plots of the corrected flexural and shear deformations. The behavior of all
specimens was dominated initially by flexural response. With the initiation of the first shear
crack, shear deformations began to contribute in the total displacement. Apparently, the
contribution of shear deformation varied as a function of reinforcement type (steel or GFRP)
and horizontal web reinforcement ratio. In S4-80, the percentage of shear deformation to the
total deformation corresponding to yielding of the longitudinal reinforcement was 22% (0.4%
drift) and increased to 46% after the localization of sliding shear corresponding to concrete
0
0.5
1
1.5
2
0 0.01 0.02 0.03
0.25%0.50%0.75%1.00%1.50%Failure0
0.5
1
1.5
2
0 0.01 0.02 0.03
0.25%0.50%0.75%1.00%1.50%Failure
0
0.5
1
1.5
2
0 0.01 0.02 0.03
0.25%0.50%0.75%1.00%1.50%Failure
0
0.5
1
1.5
2
0 0.01 0.02 0.03
0.25%0.50%0.75%1.00%1.50%Failure
Wal
l hei
ght (
m)
Wal
l hei
ght (
m)
Curvature (rad/m)
Curvature (rad/m) Rotation (rad)
Rotation (rad)
G4-80
G6-80 G6-80
G4-80
Wal
l hei
ght (
m)
Wal
l hei
ght (
m)
0
0.5
1
1.5
2
0 0.01 0.02 0.03
0.25%0.50%0.75%1.00%1.50%Failure0
0.5
1
1.5
2
0 0.01 0.02 0.03
0.25%0.50%0.75%1.00%1.50%Failure
Wal
l hei
ght (
m)
Wal
l hei
ght (
m)
Curvature (rad/m) Rotation (rad)
G4-160 G4-160
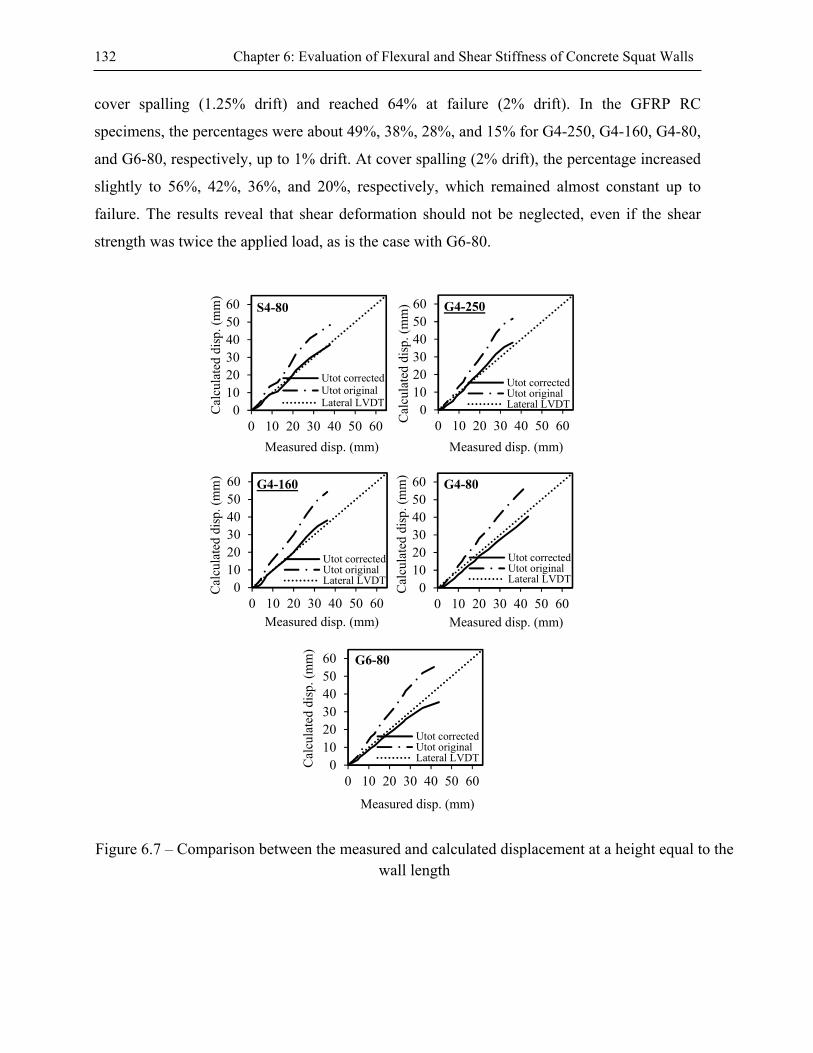
132 Chapter 6: Evaluation of Flexural and Shear Stiffness of Concrete Squat Walls
cover spalling (1.25% drift) and reached 64% at failure (2% drift). In the GFRP RC
specimens, the percentages were about 49%, 38%, 28%, and 15% for G4-250, G4-160, G4-80,
and G6-80, respectively, up to 1% drift. At cover spalling (2% drift), the percentage increased
slightly to 56%, 42%, 36%, and 20%, respectively, which remained almost constant up to
failure. The results reveal that shear deformation should not be neglected, even if the shear
strength was twice the applied load, as is the case with G6-80.
Figure 6.7 – Comparison between the measured and calculated displacement at a height equal to the
wall length
Measured disp. (mm)
Measured disp. (mm)
Cal
cula
ted
disp
. (m
m)
Cal
cula
ted
disp
. (m
m)
Cal
cula
ted
disp
. (m
m)
Measured disp. (mm)
Measured disp. (mm) Measured disp. (mm)
Cal
cula
ted
disp
. (m
m)
Cal
cula
ted
disp
. (m
m)
0102030405060
0 10 20 30 40 50 60
Utot correctedUtot originalLateral LVDT
0102030405060
0 10 20 30 40 50 60
Utot correctedUtot originalLateral LVDT
0102030405060
0 10 20 30 40 50 60
Utot correctedUtot originalLateral LVDT
0102030405060
0 10 20 30 40 50 60
Utot correctedUtot originalLateral LVDT
0102030405060
0 10 20 30 40 50 60
Utot correctedUtot originalLateral LVDT
S4-80 G4-250
G4-160 G4-80
G6-80

133
Figure 6.8 – Displacement components at a height equal to the wall length
All specimens exhibited negligible initial flexural deformation, since the gross flexural
stiffness resisted the deformation, as shown in Figure 6.9a. By the onset of the first flexural
crack, the specimens experienced a reduction in lateral stiffness, resulting in a significant
increase in flexural deformation. The flexural deformation in all GFRP RC specimens
followed a similar trend with the horizontal web reinforcement ratio having no effect. Figure
6.9b shows the normalized secant flexural stiffness to the initial elastic flexural stiffness. Due
to the relatively low modulus of elasticity of GFRP bars, the stiffness loss in the GFRP RC
squat walls was relatively pronounced compared to the steel RC one. It is worth mentioning,
however, that the softer behavior of GFRP RC walls will increase the displacement demand,
which could be considered an advantage, since a softer structure attracts lower seismic forces.
0
10
20
30
40
50
0 1 2 3
0
10
20
30
40
50
0 1 2 30
10
20
30
40
50
0 1 2 3
0
10
20
30
40
50
0 1 2 30
10
20
30
40
50
0 1 2 3
Drift ratio (%) Drift ratio (%)
Ut =
Uf +
Us (
mm
) U
t = U
f +
Us (
mm
)
Ut =
Uf +
Us (
mm
)
Drift ratio (%) Drift ratio (%)
Ut =
Uf +
Us (
mm
)
Drift ratio (%)
Ut =
Uf +
Us (
mm
) G6-80
G4-80G4-160
S4-80 G4-250
Uf
Us
Uf
Us
Us
Uf Uf
Us
Us
Uf

134 Chapter 6: Evaluation of Flexural and Shear Stiffness of Concrete Squat Walls
Figures 6.9c and 6.9d show that, similar to the flexural-deformation response, initial high
shear stiffness was followed by a significant reduction in shear stiffness manifested with the
appearance of the first shear crack. The figures underline the link between steel yielding and
shear deformations in S4-80, which exhibited significant degradation in shear stiffness after a
few cycles of steel yielding associated with substantial increasing in shear deformation. In
contrast, the shear deformation in GFRP RC squat walls increased almost linearly with
loading. The figures also reveal the effectiveness of the horizontal web reinforcement ratio in
reducing shear deformation.
Figure 6.9 – Comparison between flexural and shear deformations in test specimens
6.5. Shear Stiffness
Although predicting the shear stiffness of test specimens beyond shear cracking is necessary,
the FRP design codes and guidelines [CSA S806 (2012), ACI 440.1R (2015)] contain no
seismic provisions. Therefore, the methods used in estimating the cracked shear stiffness of
0.0
0.2
0.4
0.6
0.8
1.0
0.0 0.5 1.0 1.5 2.0 2.5 3.0
S4-80G4-250G4-160G4-80G6-80
Lateral top drift (%)
Lat
eral
load
(kN
)
Flexural deformations (mm)
Shear deformations (mm)
Lat
eral
load
(kN
)
Ks/K
se
Kf/K
fe
Lateral top drift (%) (b)
(c) (d)
(a)
ACI 318 (α = 0.35)
Eurocode 8 (α = 0.5)
NZS 3101 (α = 0.25)
CSA A23.3 (α = 0.65)
0
200
400
600
800
1000
0 5 10 15 20 25
S4-80G4-250G4-160G4-80G6-80
0
200
400
600
800
1000
0 5 10 15 20 25 30
S4-80G4-250G4-160G4-80G6-80
0.0
0.2
0.4
0.6
0.8
1.0
0.0 0.5 1.0 1.5 2.0 2.5 3.0
S4-80
G4-250
G4-160
G4-80
G6-80

135
steel RC squat walls were reviewed and the most appropriate method to apply to GFRP RC
squat walls was selected.
The shear stiffness in S4-80 significantly decreased after the first shear crack and reduced to
58% at the onset of flexural-reinforcement yielding, followed by severe deterioration due to
the development of sliding-shear deformations (Figure 6.9d), confirming past research
outcomes (Salonikios et al. 1999, Massone et al. 2009). According to Eurocode 8 (2004) and
ASCE/SEI 43 (2005), the cracked shear stiffness is taken as 50% of the elastic shear stiffness,
while ACI 318 (2014) and CSA A23.3 (2014) account only for the reduction in flexural
stiffness, allowing no reduction in the cracked shear stiffness. Given this disagreement and
uncertainty, Li and Xiang (2011) proposed and experimentally verified an analytical model
based on truss analogy to predict the cracked shear stiffness corresponding to the yielding
point (Figure 6.10). Tang and Su (2014) undertook further verification of the model.
Figure 6.10 – Truss model for shear deformation estimation
Li and Xiang (2011) model assumes that shear deformation is the summation of tie elongation
(horizontal web reinforcement) and shortening of concrete struts, which could be formulated
as follows:
s
s
h
hs Edb
hVn
..
.
cos.sin
sin22
4
(6.3)
s
AdfV hs
s
.cot. (6.4)
V
H
∆s = ∆truss+∆conc
θ

136 Chapter 6: Evaluation of Flexural and Shear Stiffness of Concrete Squat Walls
where Δs is the shear deformation at a height = h; θ is the angle between the shear crack and
the longitudinal axis of the wall; n is the modular ratio = Es/Ec; Es and Ec are the elastic moduli
of the horizontal web reinforcement and concrete, respectively; ρh is the horizontal web
reinforcement ratio; Vs is the shear force carried by horizontal web reinforcement; b is the wall
thickness; d is the effective shear depth, which could be taken as 0.8 of the wall length; fs is
the stress in horizontal web reinforcement; and Ah is the area of horizontal web reinforcement
within a spacing s.
The shear stiffness is calculated as the ratio between the applied load (V) and Δs, as follows:
hV
VEdb
n
VK
s
s
h
h
ss .
...
sin
cos.sin4
22
(6.5)
Whereas the prescribed model is readily applicable in steel RC walls to calculate cracked
shear stiffness corresponding to horizontal web reinforcement yielding, since the stress in
horizontal web reinforcement is equal to the yield stress and the angle θ can be conservatively
assumed equal to 45o, the application of this formula is not a straightforward task for the case
of GFRP RC walls. This is mainly due to the absence of yielding point and the assumption of
angle θ that has been demonstrated in many test series to deviate significantly from 45o.
Therefore, two issues are encountered, the shear components carried by the horizontal web
reinforcement and calculation of angle θ.
Current concept for calculation shear resistance in most guidelines and codes is that a portion
of shear is carried by concrete while the rest is carried by shear reinforcement. Hence, if it is
found a proper calculation for concrete shear resistance, the other component resisted by shear
reinforcement can be readily calculated (Vs). In this regard, some codes such as ACI 318
(2014) assumes that concrete shear resistance is equal to applied load corresponding to the
first shear crack and kept constant while others (ACI 440.1R-15, CSA S6-10, and CSA S806-
12) provide some formula for concrete shear strength estimation along with formulae for shear
crack estimation. In the following subsections; a summary for these methods is presented.
Evaluation of the calculated shear deformations using the mentioned codes’ shear crack angles
is then performed; from which the most appropriate angle for shear deformation estimation is
recommended. This is followed by exploring different codes’ concrete shear strengths together

137
with using the recommended shear angle to attain a reasonable estimation for shear
deformations and stiffness.
6.5.1. Design Codes and Guides for Shear-Strength Predictions
ACI Guide Provision (ACI440.1R-15)
The estimation of Vc in ACI 440.1R-15 for FRP RC concrete elements is based on assuming
that θ is 45° and that Vc can be calculated as follows:
cbfV wcc'52 ; c = kd , ffffff nnnk 22 , and cf EEn (6.6)
where bw is the wall thickness, c is the neutral-axis depth of the cracked transformed section,
and d is the effective flexural depth.
CSA Code Provisions (S806-12 and S6-14)
According to CSA S806 (2012), the Vc of flexural members can be evaluated as follows:
vwcsarmc dbfkkkkV 3 '05.0 (6.7)
where vwccvwc dbfVdbf '' 22.011.0 , 0.1 ffm MdVk , 31 ffr Ek ,
0.15.2 dVMk ffa , and 0.1450750 dks
where dv is the effective shear depth, taken as the greater of 0.9d or 0.72lw and not less than
0.8lw according to CSA A23.3-14; and Mf and Vf are the moment and shear applied at the
critical section of shear, respectively.
In contrast to ACI 440.1R-15, CSA S806-12 provides Eq. 9 to estimate θ.
ol 6070003030o ;
ff
fvfl AE
VdM
2
(6.8)
According to CSA S6-14, the Vc of flexural members using FRP as the main reinforcement
can be evaluated as follows:
vwccxex
c dbfs
V '
1000
1300
15001
4.0
(6.9)

138 Chapter 6: Evaluation of Flexural and Shear Stiffness of Concrete Squat Walls
where 003.02
ff
fvfx AE
VdM , v
g
vxe d
a
ds 85.0
15
35
, and ag is the aggregate size. (6.10)
CSA S6-14 provides an equation similar to that in CSA S806-12 to calculate θ as follows:
)2500/88.0)(700029( zex S (6.11)
It should be noted that θ in Eq. 6.11 is limited to 50° based on the limitation of εx in Eq. 6.10.
6.5.2. Evaluation of the Shear-Crack Angle (θ)
ACI 440.1R-15 assumes θ to be 45°, while the calculation of θ based on CSA S6-14 and CSA
S806-12 resulted in 50° and 60°, respectively. A unified method for calculating Vs was used
(ACI 318, 2014) in which the concrete shear strength (Vc) was set to be equal to the
experimental cracking load (Vcr) (given in Table 6.2). The shear deformation prior to cracking
was calculated using the elastic shear stiffness defined by Park and Paulay (1975) for
prismatic elements as follows:
w
shcse hf
AGK
.
(6.12)
where Gc is the concrete shear modulus (= 0.4 Ec); Ash is the effective shear area of an
uncracked element (=(5+5ν)/(6+5ν)Ag), where Ag is the gross-section area and ν is Poisson’s
ratio; f accounts for non-uniform distribution of the shear stresses and is equal to 1.2 for
rectangular cross sections.
Figure 6.11 shows that adopting a shear-crack angle of 45° and 50° as proposed in ACI
440.1R-15 and CSA S6-14 underestimated the shear deformations by 53% and 35%,
respectively, since the experimentally measured angles ranged from 55° to 59°. Thus, θ < 50°
could lead to unsafe predictions. Increasing this limitation to 60° as proposed in CSA S806-
12, however, yielded higher shear displacement than the experimental results with a mean
value of 36%. This revealed that 56° was the angle that produced the best fit with the
experimental results (Figure 6.11). However, this angle might lead to unsafe predictions in
other test series. Therefore, the shear-crack angle based on CSA S806-12 (θ =60°) is
conservatively recommended in this study.

139
`
Figure 6.11 – Lateral load versus experimental and predicted shear deformations using
different shear crack angles
6.5.3. Evaluation of Concrete Shear Strength (Vc)
The Vc was predicted based on ACI 440.1R-15, CSA S6-14, and CSA S806-12 as well as Vc =
Vcr while setting θ to 60°. Figure 6.12 shows that the predictions according to ACI 440.1R-15
and CSA S6-14 overestimated shear deformations with mean values of 74% and 64%,
respectively. While the predicted Vc based on CSA S806-12 resulted in closer agreement with
the mean value of 13%, the prediction may lead to unsafe estimation at elastic stage prior to
shear cracking load, which is significantly lower than the calculated shear strength and
resulted in underestimated shear deformation (Figure 6.12).
0
200
400
600
800
1000
0 10 20 30 40
ExperimentalACI 440.1R-15CSA S6-14CSA S806-12Best fitting
0
200
400
600
800
1000
0 10 20 30 40
ExperimentalACI 440.1R-15CSA S6-14CSA S806-12Best fitting
0
200
400
600
800
1000
0 10 20 30 40
ExperimentalACI 440.1R-15CSA S6-14CSA S806-12Best fitting
0
200
400
600
800
1000
0 10 20 30 40
ExperimentalACI 440.1R-15CSA S6-14CSA S806-12Best fitting
Lat
eral
load
(kN
) L
ater
al lo
ad (
kN)
Lat
eral
load
(kN
) L
ater
al lo
ad (
kN)
Shear displacement (mm) Shear displacement (mm)
Shear displacement (mm) Shear displacement (mm)
G4-250 G4-160
G6-80 G4-80

140 Chapter 6: Evaluation of Flexural and Shear Stiffness of Concrete Squat Walls
Figure 6.12 – Lateral load versus experimental and predicted shear deformations using
different concrete shear strength (θ = 60o)
The experimental concrete shear strength Vc was calculated as Vc = V − VFRP, where V is the
applied load and VFRP is the contribution of the FRP horizontal web reinforcement calculated
using the truss analogy (Eq. 6.4) with the average measured shear–strain values. Although
using a constant value for Vc is not representative in estimating shear deformation as Vc varies
with loading (Figure 6.13), it could be conservatively assumed that Vc = Vcr is equal to the first
shear cracking load. Therefore, it would be appropriate to determine a formula to estimate Vcr.
In this regard, the ACI 318 (2014) procedure for concrete shear strength was followed in
which the cracking load is normalized to bw lw fc’0.5. Based on the experimental shear-
cracking-load values (Table 6.2), the concrete shear strength (Vc) could be estimated as an
average value equal to 0.12 bw lw fc’0.5.
0
200
400
600
800
1000
0 10 20 30 40 50
ExperimentalCracking LoadACI 440.1R-15CSA S6-14CSA S806-12
0
200
400
600
800
1000
0 10 20 30 40 50
ExperimentalCracking LoadACI 440.1R-15CSA S6-14CSA S806-12
0
200
400
600
800
1000
0 10 20 30 40 50
ExperimentalCracking LoadACI 440.1R-15CSA S6-14CSA S806-12
0
200
400
600
800
1000
0 10 20 30 40 50
ExperimentalCracking LoadACI 440.1R-15CSA S6-14CSA S806-12
Lat
eral
load
(kN
) L
ater
al lo
ad (
kN)
Lat
eral
load
(kN
) L
ater
al lo
ad (
kN)
Shear displacement (mm) Shear displacement (mm)
Shear displacement (mm) Shear displacement (mm)
G4-250 G4-160
G4-80 G6-80

141
Figure 6.13 – Concrete shear strength versus top displacement
Figure 6.14 confirms the underestimation using the equation in ACI 440.1R-15 and CSA S6-
14, while the CSA S806-12 equation initially overestimated the shear stiffness degradation
and got noticeably better predictions at high load levels exceeding Vcr. Furthermore, the
calculation based on Vc = 0.12 bw lw fc’0.5 produced better estimations with an acceptable level
of conservatism.
Figure 6.14 – Shear stiffness degradation normalized with gross shear stiffness versus drift
ratio
0.0
0.2
0.4
0.6
0.8
1.0
0.0 0.5 1.0 1.5 2.0 2.5 3.0
ExperimentalCracking LoadACI 440.1R-15CSA S6-14CSA S806-12
0.0
0.2
0.4
0.6
0.8
1.0
0.0 0.5 1.0 1.5 2.0 2.5 3.0
ExperimentalCracking LoadACI 440.1R-15CSA S6-14CSA S806-12K
s/Kse
Ks/K
se
Drift ratio (%) Drift ratio (%)
G4-250 G4-160
0 0.5 1 1.5 2 2.5 3
0
100
200
300
400
500
600
0 10 20 30 40 50 60
G4-250G4-160G4-80G6-80
Con
cret
e sh
ear
stre
ngth
(kN
)
Lateral displacement (mm)
Lateral drift (%)
Vc CSA S806-12
Vcr experiemental
Vc CSA S6-10
Vc ACI 440-1R

142 Chapter 6: Evaluation of Flexural and Shear Stiffness of Concrete Squat Walls
Figure 6.14 – Shear stiffness degradation normalized with gross shear stiffness versus drift
ratio (continued)
6.5.4. Proposed Shear-Stiffness Model
Seismic-design practice worldwide is moving toward displacement-based design methods.
Therefore, the seismic demands of a structural system should be evaluated using an effective
natural period of a structure based on the effective secant stiffness connected to a targeted
displacement point on the load–displacement envelope curve. Hence, it would be preferable,
within the context of a displacement-based design method, to develop a simple model that
directly correlates the shear-stiffness degradation of a wall to its lateral drift. Accordingly, we
predicted the normalized shear-stiffness degradation based on regression analysis.
The results in Figure 6.15a generally reflect strong correlation between normalized shear
stiffness and drift ratio (R2 = 0.87). Interpretation of the results also revealed that normalized
shear-stiffness degradation is a function of horizontal web reinforcement ratio. As shown in
Figure 6.15b, the degradation decreased almost linearly with increasing reinforcement ratio at
the same drift level. The relation appears, however, to have significantly deviated with
increasing drift. This is clear in Figures 6.15c and d, which show the nonlinear variation of
relation constants A and B with the drift ratio, indicating the interrelation between the drift
ratio and horizontal web reinforcement ratio.
0.0
0.2
0.4
0.6
0.8
1.0
0.0 0.5 1.0 1.5 2.0 2.5 3.0
ExperimentalCracking LoadACI 440.1R-15CSA S6-14CSA S806-12
0.0
0.2
0.4
0.6
0.8
1.0
0.0 0.5 1.0 1.5 2.0 2.5 3.0
ExperimentalCracking LoadACI 440.1R-15CSA S6-14CSA S806-12
Ks/K
se
Drift ratio (%) Drift ratio (%)
G4-80 G6-80
Ks/K
se

143
Based on the above discussion, the normalized shear-stiffness degradation was set as a
function of top drift ratio and horizontal web reinforcement ratio as follows:
yx
se
s baK
K ... (6.13)
where Ks is the secant shear stiffness at a lateral top drift equal to δ; Kse is the elastic shear
stiffness and can be calculated with Eq. 6.12; ρ is the horizontal web reinforcement ratio; and
a, b, x, and y are constants. For our experimental data, the coefficients a, b, x, and y, which
correlate between experimental and analytical results, were found to be equal to 0.04, 0.03, -1,
and -1.6, respectively. Therefore, the normalized shear stiffness (Ks/Kse) can be rewritten as
follows:
6.1
03.004.0
se
s
K
K (6.14)
Figure 6.15 – Validation of the proposed model for shear stiffness degradation
0
0.02
0.04
0.06
0.08
0.1
0.12
0.14
0.0 1.0 2.0 3.00
0.04
0.08
0.12
0.16
0.2
0.0 1.0 2.0 3.0
0.0
0.2
0.4
0.6
0.8
1.0
0 1 2 3 40.0
0.2
0.4
0.6
0.8
1.0
0.0 1.0 2.0 3.0Drift ratio (%)
Drift ratio (%)
Shear reinforcement
Ks/K
se
Ks/K
e
Drift ratio (%)
Con
stan
t “A
”
Con
stan
t “B
”
y = 0.1x-1.2 0.1%
0.4%
0.5%
0.75% 1.0% 2.0% 3.0%
Dri
ft
ti
(a) (b
(d)(c)

144 Chapter 6: Evaluation of Flexural and Shear Stiffness of Concrete Squat Walls
Figure 6.16 shows good agreement between the experimental results and the proposed
formula. More testing is needed, however, to clarify the effect of other parameters such as
aspect ratio, axial loading, and the presence of boundary elements on the normalized shear
stiffness.
Figure 6.16 – Comparison of predicted normalized shear stiffness (Eq. 15) with experimental
data
6.6. Flexural Stiffness
In practice, code methods employ an effective flexural stiffness to consider the reduction in
stiffness for reinforced-concrete elements caused by cracking. In designing steel RC walls, a
single reduction factor (α) is commonly applied to the gross stiffness to reduce it to effective
0.0
0.2
0.4
0.6
0.8
1.0
0 1 2 30.0
0.2
0.4
0.6
0.8
1.0
0 1 2 3
0.0
0.2
0.4
0.6
0.8
1.0
0 1 2 30.0
0.2
0.4
0.6
0.8
1.0
0 1 2 3
Ks/K
se
Ks/K
se
Ks/K
se
Drift ratio (%) Drift ratio (%)
Drift ratio (%) Drift ratio (%)
Experimental
Predicted
Experimental
Predicted
Experimental
Predicted
Experimental
Predicted
G4-250 G4-160
G4-80 G6-80
Ks/K
se

145
stiffness. For instance, the effective flexural stiffness for a wall under zero axial load is
proposed to be 25%, 35%, and 50% of the gross flexural stiffness by New Zealand code (NZS
1995), ACI 318-14, and Eurocode 8 (2004), respectively. CSA A23.3-14 links α to the
ductility- and over strength-related force modification factor (Rd and Ro) as follows:
)1(35.01 wod RR , 15.0 (6.15)
where γw is the wall overstrength factor and can be taken equal to Ro. According to CSA
A23.3-14 and NBCC (2010), Rd and Ro for moderately ductile steel RC squat walls are 2 and
1.4, respectively. Substituting these values in Eq. 16 results in α = 0.65.
As previously mentioned, the measured secant flexural stiffness for specimen S4-80 was
almost 30% of the gross flexural stiffness corresponding to steel yielding. Comparing the
value at yielding with the above suggestions for stiffness-reduction values reveals that
Eurocode 8 (2005) and CSA A23.3 (2014) overestimated α by 67% and 116%, while ACI 318
(2014) and NZS 3101 (1995) yielded better estimations, with differences of 17% higher and
lower than the measured stiffness, respectively. Based on Figure 6.9b, however, it would
appear inappropriate to use the same reduction factors to estimate the effective flexural
stiffness of GFRP RC walls. This was expected and can be attributed to the different
mechanical and bond characteristics between steel and GFRP bars. Instead, the methods for
estimation flexural stiffness for FRP RC elements specified in ACI440.1R-15 and CSA S806-
12 were employed.
ACI 440.1R-15 provides an expression for estimating the effective moment of inertia (Ie) to
calculate the deflection of FRP RC concrete elements; the formula is given as follows:
g
gcracr
cre I
IIMM
II
11 2 (6.16)
where Icr is the cracked moment of inertia, γ is a function of the cracking moment (Mcr)
relative to the applied moment (Ma) and equal to [3-2(Mcr/Ma)] for a cantilever with end-point
load, and Ig is the gross moment of inertia.

146 Chapter 6: Evaluation of Flexural and Shear Stiffness of Concrete Squat Walls
The method proposed in CSA S806-12 is based on integrating the moment–curvature relation,
which is assumed to stay linear under increased loading with a flexural rigidity of EcIg in the
uncracked stage and EcIcr in the cracked stage, whereas there is no tension stiffening in the
cracked zone of a beam element. The effective moment of inertia can be calculated as follows:
gg
cre I
LL
II
3)/(1 (6.17)
where η equals (1-Icr/Ig), Lg is the distance from the free end to the point at which M = Mcr.
Knowing the effective moment of inertia (Eqns. 6.16 and 6.17), the flexural deformations at
any load level can be calculated using the elastic-deflection equation as follows:
)3(6
. 2
xlEI
xP
e
(6.18)
where P is the applied load, δ is the lateral displacement; E is the elastic modulus for concrete,
which can be calculated as '4700 cf MPa ( '57000 cf psi); x is the distance from the support
to the point at which the displacement is calculated and equal to 1500 mm (59 in); and l is the
shear span equal to 2550 mm (100.4 in).
The predicted flexural deformations using the effective moment of inertia specified by
ACI440.1R-15 and CSA S806-12 were calculated at different load levels and plotted together
in Figure 6.17a along with the results obtained experimentally. Using the calculated flexural
deformations, the secant flexural stiffness at different drift levels was also calculated and
normalized to the gross flexural stiffness and plotted in Figure 6.17b. It should be noted that
calculations were made using the experimentally obtained cracking moment corresponding to
the first flexural crack, as given in Table 6.2. It can be inferred from the figure that using
either ACI440.1R-15 or CSA S806-12 in calculating flexural deformation and the consequent
normalized flexural stiffness yielded good agreement with the experimental results, although
CSA S806-12 appears to be more conservative.

147
Figure 6.17 – Comparison of Predicted (a) flexural displacement (b) normalized flexural
stiffness with experimental data.
G4-250 G4-250
Lat
eral
Loa
d (k
N)
Flexural displacement (mm)
Kf/K
fe
Drift ratio (%)
0.0
0.2
0.4
0.6
0.8
1.0
0.0 0.5 1.0 1.5 2.0 2.5 3.0
Exp.
ACI 440.1R-15
CSA S806-12
0
200
400
600
800
1000
0 5 10 15 20 25 30
Exp.
ACI 440.1R-15
CSA S806-12
0.0
0.2
0.4
0.6
0.8
1.0
0.0 0.5 1.0 1.5 2.0 2.5 3.0
Exp.
ACI 440.1R-15
CSA S806-12
0
200
400
600
800
1000
0 5 10 15 20 25 30
Exp.
ACI 440.1R-15
CSA S806-12
0.0
0.2
0.4
0.6
0.8
1.0
0.0 0.5 1.0 1.5 2.0 2.5 3.0
Exp.
ACI 440.1R-15
CSA S806-12
0
200
400
600
800
1000
0 5 10 15 20 25 30
Exp.
ACI 440.1R-15
CSA S806-12
0.0
0.2
0.4
0.6
0.8
1.0
0.0 0.5 1.0 1.5 2.0 2.5 3.0
Exp.
ACI 440.1R-15
CSA S806-12
0
200
400
600
800
1000
0 5 10 15 20 25 30
Exp.
ACI 440.1R-15
CSA S806-12
G4-80 G4-80
G6-80 G6-80
Flexural displacement (mm)
Lat
eral
Loa
d (k
N)
Lat
eral
Loa
d (k
N)
Flexural displacement (mm)
Drift ratio (%)
Drift ratio (%)
Kf/K
fe
Kf/K
fe
(a) (b)
Drift ratio (%) Flexural displacement (mm)
G4-160 G4-160
Lat
eral
Loa
d (k
N)
Kf/K
fe

148 Chapter 6: Evaluation of Flexural and Shear Stiffness of Concrete Squat Walls
Similar to shear stiffness and based on regression analysis, the normalized flexural stiffness
could be formulated as in Eq. 6.19. Figure 6.18 verifies the proposed equation.
6.01.0 eff KK (6.19)
Figure 6.18 – Normalized flexural stiffness versus drift ratio
6.7. Conclusions
The main purpose of this chapter was to evaluate the flexural and shear stiffness of GFRP RC
concrete squat walls. The evaluation process and its outcomes can be concluded as follows:
1. Decoupling flexural and shear deformation without considering curvature variation can lead
to overestimated deformation, while correcting the deformations based on the estimated
center of rotation produced consistent results.
2. Shear deformation contributed significantly to the total deformation and cannot be omitted,
even if the shear strength is greater than the applied load.
3. The cracked shear stiffness of GFRP RC concrete squat walls can be estimated based on the
truss model with an acceptable level of conservatism. To ensure this conservatism, the
shear-crack angle should be estimated based on CSA S806-12 and the concrete shear
strength is recommended to be equal to 0.12 bw lw fc’0.5.
0.0
0.2
0.4
0.6
0.8
1.0
0.0 0.5 1.0 1.5 2.0 2.5 3.0
Drift ratio (%)
Kf/K
fe
y = 0.1x0.6
R2 = 0.95

149
4. In calculating flexural deformation and the consequent normalized flexural stiffness, both
ACI440.1R-15 and CSA S806-12 yielded results in good agreement with the experimental
results, although CSA S806-12 appears to be more conservative.
5. Within the context of displacement-based design method, a simple model that correlates the
flexural and shear stiffness degradation of the test walls to their drift was proposed.


CHAPTER 7
CONCLUSIONS AND RECOMMENDATIONS
7.1. General Conclusion
This study was carried out on concrete squat walls in order to prove the validity of using
GFRP bars in reinforcing such element to resist lateral loads induced by earthquake. Nine
reinforced concrete squat walls – one reinforced with steel and eight with GFRP bars, were
presented. The test variables were chosen to examine the effect of bidiagonal reinforcement
and different configurations and ratios of web reinforcement. Strength, deformation, energy
dissipation and failure mode of the tested specimens were investigated. Evaluation of the
ultimate strength using current FRP guidelines and codes was introduced from which some
recommendations were provided. Decoupling the total deformations into flexural and shear
were conducted showing the difference of deformations behavior between GFRP and steel-
reinforced walls. This was followed by the evaluation of the walls’ flexural and shear
stiffness. Based on the conducted analysis for test results, the following concluding remarks
can be drawn:
The GFRP reinforcement provided the laterally loaded squat walls with stable behavior
through the hysteretic response, as no strength degradation or signs of premature shear
failure was observed in comparison to the steel RC squat wall.
The elastic nature of the GFRP bars helped the cracks realign and close between load
reversals and distribute shear deformations along the wall height. This assisted in
avoiding premature sliding failure in GFRP RC wall.
The GFRP RC walls exhibited reasonable levels of energy dissipation associated with
relatively small residual displacements compared to the steel RC wall as a result of the
plastic deformations of concrete.
Bidiagonal web reinforcement was more effective than conventional web
reinforcement in controlling shear-crack width. Eliminating the out-of-plane buckling
150

151
in the diagonally reinforced wall could be achieved by using transverse links, or by
prestressing the diagonal grids, but this might entail construction issues.
Using bidiagonal sliding reinforcement has insignificant effect in GFRP RC squat
walls; further investigation is needed to address the elastic nature of GFRP bars.
The shear stresses induced by the lateral load were not carried only by the horizontal
web reinforcement as indicated in CSA A23.3 (2014). Further studies, therefore, are
required to clarify this point.
All of the GFRP RC walls safely attained the maximum allowable drift ratio required
by both the NBCC (2010) and CSA A23.3 (2014) with no strength degradation, while
the residual deformation was insignificant. This indicates the applicability of GFRP
RC squat walls in resisting lateral loads in earthquake-prone regions.
Web reinforcement had no significant effect on either initial flexural or initial shear-
cracking load. The slight differences observed can be attributed to the difference in
concrete strength.
Horizontal web reinforcement had a direct impact on increasing squat wall ultimate
shear strength and drift ratio as long as the failure was preceded by diagonal tension.
Using horizontal web reinforcement in excess of the amount required for resisting the
ultimate flexural capacity, however, had no effect.
The presence of either horizontal or vertical web reinforcement in the wall specimen
significantly enhanced the concrete contribution after formation of the first shear crack.
This is in contradiction with ACI 318 (2014), which assumes the concrete shear
strength does not increase after the first shear crack appears.
The presence of horizontal and vertical web reinforcement was essential in crack
recovery between load reversals.
In contrast to steel RC squat walls, the shear strain was distributed along the wall
height due to the elastic nature of GFRP bars.
The provision of horizontal or vertical web reinforcement had a clear effect on
controlling shear-crack width, although horizontal web reinforcement proved to be
more effective.

152 Chapter 7: Conclusions and Recommendations
Limiting strain to 5000 με in the horizontal web reinforcement is recommended to
control the shear-crack width in GFRP RC squat walls.
The shear estimation method adopted by ACI 440.1R (2015) yielded a conservative
estimation of the ultimate shear strength. An accurate estimation of the concrete shear
contribution to account for the increase after the first shear crack and modifying the
assumption of a 45° shear-crack angle adapted for walls with different properties,
however, might be necessary.
The shear method in CSA S806 (2012) was shown to closely predict the shear-crack
angle. Since it neglects the concrete’s contribution to shear strength, this method
unduly underestimates ultimate shear strength, which could lead to reinforcement
congestion. Therefore, the ultimate shear strength was recalculated using the concrete
shear strength calculated with the Razaqpur and Isgor (2006) equation, which yielded
more reasonable yet conservative estimations.
The reinforcement for detailing at the boundary improved concrete confinement, thus,
improving the predicted ultimate strength. Therefore, the confinement effect should be
considered in the design.
Decoupling flexural and shear deformation without considering curvature variation can
lead to overestimated deformation, while correcting the deformations based on the
estimated center of rotation produced consistent results.
Shear deformation contributed significantly to the total deformation and cannot be
omitted, even if the shear strength is greater than the applied load.
The cracked shear stiffness of GFRP RC concrete squat walls can be estimated based
on the truss model with an acceptable level of conservatism. To ensure this
conservatism, the shear-crack angle should be estimated based on CSA S806-12 and
the concrete shear strength is recommended to be equal to 0.12 bw lw fc’0.5.
In calculating flexural deformation and the consequent normalized flexural stiffness,
both ACI440.1R-15 and CSA S806-12 yielded results in good agreement with the
experimental results, although CSA S806-12 appears to be more conservative.
Within the context of displacement-based design method, a simple model that
correlates the flexural and shear stiffness degradation of the test walls to their lateral
drift was proposed.

153
The conducted results may be affected by changing the wall’s aspect ratio. Further
investigations are therefore needed to assess the effect of this parameter.
7.2. Recommendations for Future Work
Results of the current study represent a promising step toward implementing GFRP bars as
internal reinforcement in squat walls in zones prone to low-to-moderate earthquake. Even
though the number of test specimens in our study is limited to suggest the behavior of different
types of squat walls, it is expected to set the direction for further research to investigate other
parameters as well as the possibility of developing new applications of GFRP bars, resulting in
more durable, economic, and competitive structures. Based on the findings of the current
study, additional researches are recommended to cover the following points:
1. Elaborating more experimental works is highly needed to generate data with emphasis on
the following points;
Different levels of concrete confinement including, different tie spacing and
reinforcement ratio, and horizontal length of the confined area;
More wide range of horizontal and vertical web reinforcement ratios;
Effect of openings on squat walls behavior;
Effect of lap splice at wall-base connection;
Squat walls with different aspect ratios; and
Existence of boundary elements (barbell or flanges).
2. Dynamic analysis of GFRP RC structures is necessary to obtain the damping and natural
period of such structures;
3. Development of confinement model for FRP RC members is in critical need;
4. Development of analytical model that can reasonably predict squat walls’ hysteretic
response;
5. Evaluation of the ductility-related factor (Rd) and the over-strength-related factor (Ro)
required for calculating the seismic loads on GFRP RC low rise buildings; and

154 Chapter 7: Conclusions and Recommendations
6. The test results demonstrated the advantage of GFRP bars in realign and close cracks with
load reversals and distribute strain along the wall, consequently, avoiding sliding failure
and control residual deformations. Therefore, it is expected that using GFRP beside steel in
squat wall located in high earthquake region could be practical. In such case steel will
provide the structure with the needed energy dissipation, while the GFRP bars will assist in
control residual deformation as well as prevent premature sliding failure. This calls for new
investigations for using GFRP beside steel in high earthquake region to control the potential
damage.
These proposed studies would allow better assessment of the demand on such type of shear
walls and buildings using GFRP reinforcement as well as establishing the design guidelines
required for GFRP RC squat walls. This facilitate for widely utilization of GFRP bars in many
constructions in which squat walls are needed as a lateral-resisting system.
7.3. Conclusion Générale
Cette étude a porté sur des voiles courts en béton armé dans le but de montrer la validité quant
à l’utilisation de barres d’armature en PRFV comme renforcement pour résister aux charges
latérales dues aux séismes. Neuf voiles courts en béton armé ont été utilisés – l’un renforcé
avec de l’acier conventionnel et les huit autres avec des barres d’armature en PRFV. Les
paramètres d’essai ont été retenus pour examiner l’effet du renforcement bidiagonal, des
différentes configurations et le pourcentage d’armature. La résistance, la déformation,
l’énergie de dissipation et les modes de rupture des spécimens testés ont été investigués.
L’évaluation de la résistance ultime en utilisant les guides et codes de design des PRF a été
menée et des recommandations ont été présentées. Le découplage des déformations totales en
flexion et en cisaillement a été mené montrant ainsi la différence du comportement des
déformations entre les voiles renforcés de PRFV et ceux renforcés d’acier. Sur la base des
analyses menées pour les résultats d’essai, les remarques suivantes peuvent être présentées:
L'armature en PRFV a fourni aux voiles chargés latéralement un comportement de
stabilité à travers la réponse hystérésis, car aucune perte de résistance ni aucun signe de
rupture de cisaillement prématurée n'a été observé par rapport au voile renforcé avec de
l'acier.

155
La nature élastique des barres d’armature en PRFV a aidé les fissures à se réorienter et
à se fermer entre les inversions de charge et à répartir les déformations de cisaillement
le long de la hauteur du voile.
Les voiles renforcés de barres d’armature en PRFV présentaient des niveaux
raisonnables de dissipation d'énergie associés à des déplacements résiduels
relativement faibles par rapport aux voiles renforcés d'acier en raison des déformations
plastiques du béton.
Le renforcement bidiagonal de l’âme était plus efficace que le renforcement
conventionnel pour contrôler la largeur des fissures de cisaillement. L'élimination du
flambement hors-plan dans le mur renforcé diagonalement pourrait être obtenue en
utilisant des liaisons transversales ou des diagonales précontraintes, mais cela pourrait
entraîner des problèmes de construction.
L'utilisation de renforcements glissants bidiagonaux a un effet non significatif dans les
voiles renforcés de PRFV; Une recherche plus poussée est nécessaire pour répondre à
la nature élastique des barres d’armature en PRFV.
Les contraintes de cisaillement induites par la charge latérale n'ont été reprises que par
l'armature horizontale de l’âme comme indiqué dans le code CSA A23.3 (2014).
D'autres études sont nécessaires pour clarifier ce point.
Tous les murs renforcés de barres d’armature en PRFV ont atteint le pourcentage
maximum de déplacement admissible requis par les codes NBCC (2010) et CSA A23.3
(2014) sans perte de résistance, alors que la déformation résiduelle était insignifiante.
Cela indique l'applicabilité des voiles renforcés de PRFV pour résister aux charges
latérales dans les régions sujettes au séisme.
L'armature de l’âme n'a aucun effet significatif sur la flexion initiale ou sur la charge
initiale de fissuration par cisaillement. Les légères différences observées peuvent être
attribuées à la différence de résistance du béton.
Horizontal web reinforcement had a direct impact on increasing squat wall ultimate
shear strength and drift ratio as long as the failure was preceded by diagonal tension.
Using horizontal web reinforcement in excess of the amount required for resisting the
ultimate flexural capacity, however, had no effect.

156 Chapter 7: Conclusions and Recommendations
L'armature horizontale de l’âme a eu un impact direct sur l'augmentation de la
résistance ultime de cisaillement et du rapport de déplacement du voile, tant que la
rupture a été précédée d'une tension diagonale. L'utilisation d'un renforcement
horizontal de l’âme dépassant la quantité requise pour résister à la capacité ultime de
flexion, cependant, n'a eu aucun effet.
La présence d'un renforcement horizontal ou vertical de l’âme dans le voile a
considérablement amélioré la contribution du béton après la formation de la première
fissure de cisaillement. Ceci est en contradiction avec le code ACI 318 (2014), ce qui
suppose que la résistance au cisaillement du béton n'augmente pas après l'apparition de
la première fissure de cisaillement.
La présence d'un renforcement horizontal et vertical de l’âme était essentielle dans la
récupération des fissures entre les inversions de charge.
Contrairement aux voiles renforcés d’acier, la déformation en cisaillement a été
répartie le long de la hauteur du voile en raison de la nature élastique des barres en
PRFV.
La présence d'un renforcement horizontal ou vertical de l’âme a eu un effet net sur le
contrôle de la largeur de la fissure en cisaillement, bien que l'armature horizontale de
l’âme soit plus efficace.
La limitation de la contrainte à 5000 με dans l'armature horizontale de l’âme est
recommandée pour contrôler la largeur des fissures en cisaillement dans les voiles
renforcés de barres d’armature en PRFV.
La méthode d'estimation du cisaillement adoptée par le code ACI 440.1R (2015) a
donné une estimation conservatrice de la résistance ultime au cisaillement. Une
estimation précise de la contribution de cisaillement du béton pour tenir compte de
l'augmentation après la première fissure de cisaillement et la modification de
l'hypothèse d'un angle de fissure de cisaillement de 45 ° adapté pour les voiles avec
différentes propriétés pourraient cependant être nécessaires.
La méthode de cisaillement du code CSA S806 (2012) a montré une très bonne
prédiction de l'angle de la fissure de cisaillement. Comme elle néglige la contribution
du béton à la résistance au cisaillement, cette méthode sous-estime indûment la
résistance au cisaillement, ce qui pourrait entraîner une congestion du renforcement.

157
Par conséquent, la résistance ultime au cisaillement a été recalculée en utilisant la
résistance au cisaillement du béton calculée avec l'équation de Razaqpur et Isgor
(2006), ce qui a donné des estimations plus raisonnables mais conservatrices.
Le renforcement pour les détails aux limites a permis de confiner le béton, en
améliorant la résistance ultime prédite. Par conséquent, l'effet de confinement devrait
être pris en considération dans la conception.
Le découplage de la déformation en flexion et en cisaillement sans tenir compte de la
variation de courbure peut conduire à une déformation surestimée, tout en corrigeant
les déformations en fonction du centre de rotation estimé produit des résultats
cohérents.
La déformation par cisaillement a contribué de manière significative à la déformation
totale et ne peut être omise, même si la résistance au cisaillement est supérieure à la
charge appliquée.
La rigidité de cisaillement des voiles en béton armé de barres d’armature en PRFV peut
être estimée en fonction du modèle de treillis avec un niveau de conservatisme
acceptable. Pour assurer ce conservatisme, l'angle de fissure de cisaillement doit être
estimé en fonction du code CSA S806-12 et la résistance au cisaillement du béton est
recommandée pour être égale à 0,12 bw lw fc'0,5.
Dans le calcul de la déformation en flexion et de la rigidité à la flexion normalisée qui
en a résulté, les codes ACI440.1R-15 et CSA S806-12 ont donné des résultats en
accord avec les résultats expérimentaux, bien que le code CSA S806-12 semble plus
conservateur.
Dans le cadre de la méthode de conception basée sur le déplacement, un modèle simple
qui corrèle la dégradation de la rigidité en flexion et en cisaillement des murs d'essai au
déplacement latéral a été proposé.
7.4. Recommandations pour des Travaux Futurs
Les résultats de cette étude considèrent une étape prometteuse vers la mise en œuvre des
barres d’armature en PRF comme renforcement interne dans les voiles dans une zone propice

158 Chapter 7: Conclusions and Recommendations
à un séisme de faible intensité à modérée. Bien que le nombre de spécimens d'essai dans notre
étude soit limité pour suggérer le comportement de différents types de voiles, il est montré de
façon évidente certains aspects qui pourraient être considérés dans la prédiction comme la
résistance à la flexion et au cisaillement, ainsi qu'à la flexion Et la raideur de cisaillement. Des
travaux de recherche supplémentaires sont recommandés, en fonction des résultats de cette
étude, pour couvrir les points suivants:
1. L'élaboration de plus de travaux expérimentaux est nécessaire pour générer des données en
mettant l'accent sur les points suivants;
Différents niveaux de confinement de béton, y compris le rapport d'espacement, le
pourcentage de renforcement, et la longueur horizontale de la zone confinée,
Plus large gamme de pourcentage de renforcement horizontal et vertical de l’âme,
Effet de l'utilisation de GFRP à côté de l'acier dans des murs accroupis pour être utilisé
dans une grande région sismique,
Effet des ouvertures sur le comportement des voiles,
Effet du chevauchement à la convection de la base du voile,
Les voiles avec différents pourcentages, et
Existence d'éléments de frontière. Une analyse dynamique des structures renforcées de
barres d’armature en PRFV est nécessaire pour obtenir l'amortissement et la période
propre de ces structures,
2. L'analyse dynamique des structures renforcées de barres d’armature en PRFV est
nécessaire pour obtenir l'amortissement et la période propre de ces structures.
3. Le développement d’un modèle de confinement pour les éléments renforcés de PRF est
plus que nécessaire.
4. Le développement d’un modèle analytique qui peut prédire d’une façon raisonnable une
réponse hystérésis des voiles.
5. Évaluer le facteur lié à la ductilité (Rd) et le facteur de surcharge(Ro) requis pour calculer
les charges sismiques sur les bâtiments à faible hauteur renforcés de barres d’armature en
PRFV.
6. Les résultats des essais ont démontré l'avantage des barres d’armature en PRFV dans le
réalignement et la fermeture des fissures avec des inversions de charge et la répartition de

159
la déformation le long du mur, évitant ainsi la rupture par glissement et contrôlant les
déformations résiduelles. Par conséquent, on s'attend à ce que l'utilisation des barres
d’armature en PRFV par rapport à l’acier dans un voile situé dans une région à forte
intensité sismique soit vitale. Dans ce cas, l'acier fournira à la structure la dissipation
d'énergie nécessaire, tandis que l’armature en PRFV aidera à contrôler la déformation
résiduelle ainsi qu'à prévenir une rupture prématurée par glissement. Cela nécessite de
nouvelles investigations pour l'utilisation de barres en PRFV à côté de l'acier dans une
région sismique à forte intensité pour contrôler des dégâts potentiels.
Ces études proposées permettraient une meilleure évaluation de la demande sur des murs en
cisaillement et des bâtiments utilisant le renforcement en PRFV, tout en établissant les
directives de conception nécessaires pour des voiles renforcés de PRFV. Ceci facilitera
l’utilisation des barres en PRFV dans plusieurs constructions dans lesquelles les voiles sont
nécessaires comme système résistant à des efforts latéraux.
REFERENCES
Ali, M. and El-Salakawy, E. (2016). “Seismic Performance of GFRP-Reinforced Concrete
Rectangular Columns.” Journal of Composites for Construction, 20(3): 04015074.
ACI Committee 318. (2014) “Building Code Requirements for Structural Concrete and
Commentary (ACI 318-14),” American Concrete Institute, Farmington Hills, MI, 503 pp.
ACI Committee 440 (2004). “Guide Test Methods for Fiber-Reinforced Polymers (FFRPs) for
Reinforcing or Strengthening Concrete Structures.” ACI 440.3R-04, Farmington Hills, MI.
ACI Committee 440 (2007). “Report on Fiber-Reinforced Polymer (FRP) Reinforcement
Concrete Structures.” ACI 440R-07, Farmington Hills, MI.
ACI Committee 374. (2005). “Acceptance criteria for moment frames based on structural
testing and commentary.” ACI 374.1-05, American Concrete Institute, Farmington Hills,
Detroit, 9.
ACI Committee 374. (2013). “Guide for Testing Reinforced Concrete Structural Elements
Under Slowly Applied Simulated Seismic Loads.” ACI 374.2R-13, Farmington Hills, MI.
ACI Committee 440. (2015). “Guide for the Design and Construction of Structural Concrete
Reinforced with Fiber-Reinforced Polymer (FRP) Bars.” ACI 440.1R-15, Farmington Hills,
MI.
ASCE/SEI 41 (2013). “Seismic Evaluation and Retrofit of Existing Buildings.” American
Society of Civil Engineers, Virginia, USA, 518.
ASCE/SEI 43. (2005). “Seismic Design Criteria for Structures, Systems, and Components in
Nuclear Facilities (ASCE/SEI 43-05),” American Society of Civil Engineers, Reston, VA.
ASTM D7205. (2011). “Standard Test Method for Tensile Properties of Fiber Reinforced
Polymer Matrix Composite Bars.” D7205 / D7205M, West Conshohocken, PA.
160

161
ACI-ASCE Committee 445 on Shear Torsion. (1998). “Recent approaches to shear design of
structural concrete.” Journal of Structural Engineering, 124(12), 1375–1417.
Adimi, M.R., Rahman, A.H., and Benmokrane, B. (2000). “New Methods for Testing Fiber-
reinforced Polymer Rods under Fatigue.” Journal of Composites for Construction, 4(4),
206-213.
Alsayed, S.H., AL-Salloum, and Almusallam. (2000). “Performance of Glass Fiber Reinforced
Plastic Bars as Reinforcing Materials for Concrete Structures.” Composite Journal
Composites Part B, Vol. 31, 555-567.
Arafa, A., Farghaly, A., Ahmed, E., and Benmokrane, B. (2016a). “Laboratory Testing of
GFRP-RC Panels with UHPFRC Joints of the Nipigon River Cable-Stayed Bridge in
Northwest Ontario, Canada.” J. Bridge Eng., 10.1061/(ASCE)BE.1943-5592.0000943,
05016006.
Arafa, A., Farghaly, A., and Benmokrane, B. (2016b). “Experimental Investigation of GFRP-
Reinforced Concrete Squat Walls Subjected to Lateral Load.” Proceedings of the 7th
International Conference on Advanced Composite Materials in Bridges and Structures,
(ACMBS-VII), Vancouver, BC, August 22-24, 7 p.
Barda, F., Hanson, J. M., and Corley, G. W. (1977). “Shear Strength of Low-Rise Walls with
Boundary Elements.” ACI Special Publication, 53(8), 149-202.
Bedard, C. (1992). “Composite Reinforcing Bars: Assessing their Use in Construction.”
Concrete International, 14(1), 55-59.
Beekhuis, W. J. (1971). “An Experimental Study of Squat Shear Walls”, M.E. Report,
Department of Civil Engineering, University of Canterbury, Christchurch, New Zealand,
132p.
Benmokrane, B., El-Salakawy, E., El-Ragaby, A., and Lackey, T. (2006). “Designing and
Testing of Concrete Bridge Decks Reinforced with Glass FRP Bars.” Journal of Bridge
Engineering, 11(2), 217–229.

162 References
Benmokrane, B., El-Salakawy, E., El-Ragaby, A., and El-Gamal, S. (2007). “Performance
Evaluation of Innovative Concrete Bridge Deck Slabs Reinforced with Fibre Reinforced
Polymer Bars.” Can. J. Civ. Eng., 34(3), 298–310.
Birkeland, P. W., and Birkeland, H. W. (1966). “Connections in Precast Concrete
Construction.” ACI Journal, 63(3), 345-368.
Cardenas, A. E., Russell, H. G., and Corley, W. G. (1980). “Strength of Low-Rise Structural
Walls.” Reinforced Concrete Structures Subjected to Wind and Earthquake Forces.” ACI
Special Publication, Farmington Hills, MI, SP 63, 221-242.
Canadian Standards Association (CAN/CSA). (2012). “Design and Construction of Building
Components with Fiber-Reinforced Polymers.” S806, CSA, Mississauga, ON, Canada, 208
pp.
Canadian Standards Association (CAN/CSA). (2014). “Design of concrete structures
standard.” A23.3, CSA, Mississauga, ON, Canada, 240.
Canadian Standards Association S6. (2014). “Canadian Highway Bridge Design Code (CSA
S6-14)”, Mississauga, ON, Canada, 2014, 732 pp.
Chaallal, O., and Benmokrane, B. (1993). “Physical and Mechanical Performance of an
Innovative Glass-Fibre-Reinforced Plastic Rod.” Canadian Journal of Civil Engineering,
20(2), 254-268.
Y. J. Chiou, Y. L. Mo, F. P. Hsiao, Y. W. Liou, and M. S. Sheu. (2004). “Behavior of High
Seismic Performance Walls.” Proceeding of the 13th World Conference on Earthquake
Engineering, Vancouver, B.C., Canada, August 1-6, 2004, Paper No. 3180
De Luca, A., Matta, F., and Nanni, A. (2009). “Behavior of Full-Scale Concrete Columns
Internally Reinforced with Glass FRP Bars under Pure Axial Load.” COMPOSITES &
POLYCON 2009, American Composites Manufacturers Association, January 15-17,
Tampa, FL USA, 1-10.

163
Deitz, D. H.; Harik, I. E.; and Gesund, H. (2003). “Physical Properties of Glass Fiber
Reinforced Polymer Rebars in Compression,” Journal of Composites in Construction,
ASCE, 7(4), 363-366.
Deiveegan, A., and Kumaran, G. (2009). “Reliability analysis of concrete columns reinforced
internally with glass fibre reinforced polymer reinforcement.” ICFAI Univ. J. Struct. Eng.,
2(2), 49–59.
Demers, C.E. (1998). “Tension-tension Axial Fatigue of E-glass Fiber Reinforced Polymeric
Composites; Fatigue Life Diagram.” Journal of Construction and Building Materials, No.
12, 303-310.
Doostdar, H. M. (1994). “Behaviour and Design of Earthquake Resistant Low-Rise shear
walls.” Phd Thesis, University of Ottawa, Canada, 250 pp.
El-Ragaby, A., El-Salakawy, E. and Benmokrane, B. (2007). “Fatigue Analysis of Concrete
Bridge Deck Slabs Reinforced with E-Glass/Vinyl Ester FRP Reinforcing Bars.” Elsevier
Composites Journal, Part B: Engineering, 38(5-6), 703-711.
El-Salakawy, E., Benmokrane, B., El-Ragaby, A., and Nadeau, D. (2005). “Field Investigation
on the First Bridge Deck Slab Reinforced with Glass FRP Bars Constructed in Canada.”
Journal of Composites for Construction, 9(6), 470–479.
Emamy Farvashany, F., Foster, S. J., and Rangan, B. V. (2008). “Strength and Deformation of
High-Strength Concrete Shear walls” ACI Structural Journal, 105(1), 21-29.
Erki, M. A., and Rizkalla, S. (1993). “FRP Reinforcements for Concrete Structures: A Sample
of International Production.” Concrete International, 15(6), 48-53.
Eurocode 8. (2004). “Design of Structures for Earthquake Resistance, Part 1: General Rules,
Seismic Actions and Rules for Buildings, ENV 1998-1:2003”, Comité Européen de
Normalisation, Brussels, Belgium.

164 References
Faza, S. S., and Gangarao, H. V. S. (1993). “Glass FRP Reinforcing Bars for Concrete.” Fiber-
Reinforced-Plastic (FRP) Reinforcement for Concrete Structures: Properties and
Applications, Developments in Civil Engineering, A. Nanni, ed., Elsevier, Amsterdam, V.
42, 167-188.
Fintel, M. (1995). “Performance of Buildings with Shear Walls in Earthquakes of The Last
Thirty Years.” PCI Journal, 40(3), 62-80.
Fukuyama H., and Masuda Y. (1995). “Structural Performances of Concrete Frame
Reinforced with FRP Reinforcement.” Non-Metallic (FRP) Reinforcement for Concrete
Structures. Edited by Taerwe. E&FN Spon, London, pp. 275-286.
Gulec, C. K., and Whittaker, A. S. (2009). “Performanced-Based Assessment and Design of
Squat Reinforced Concrete Shear Walls.” Technical Report MCEER-09-0010, State
University of New York at Buffalo, Buffalo, NY, 291 pp.
Gupta, A., and Rangan, B. V. (1996). “Studies on Reinforced Concrete Structural Walls.”
Research Report No. 2/96, School of Civil Engineering, Curtin University of Technology,
Perth, Australia, 165 pp.
Hasaballa, M. H. (2009). “Seismic Behavior of Exterior GFRP Reinforced Concrete Beam-
Column Joints.” M.Sc. thesis, Univ. of Manitoba, Winnipeg, Manitoba, Canada.
Hidalgo, P. A., Jordan, R. M., and Martinez, M. P. (2001). “An Analytical Model to Predict
the Inelastic Seismic Behavior of Shear Wall, Reinforced Concrete Structures.” Journal of
Engineering Structures, 24(1), 85-98.
Hidalgo, P. A., Ledezma, C. A., and Jordan, R. M. (2002). “Seismic Behavior of Squat
Reinforced Concrete Shear Walls.” Earthquake Spectra, EERI, 18(2), 287-308.
Hiraishi, H. (1984). “Evaluation of shear and flexural deformations of flexural type shear
walls.” Bull. New Zealand National Soc. Earthquake Eng., 17(2), 135-144.
Hsu TTC, Mo YL. (1985). “Softening of concrete in low-rise shear walls.” ACI Journal,
82(6), 883–9.

165
Hwang, S. J., Fang, W. H.; Lee, H. J., and Yu, H., W., (2001). “Analytical Model for
Predicting Shear Strength of Squat Walls” Journal of Structural Engineering, 127(1), 43-
50.
Iliya, R., Bertero, V. V. (1980). “Effects of Amount and Arrangement of Wall-Panel
Reinforcement on Hysteretic Behavior of Reinforced Concrete Walls.” Report No
UCB/EERC-80/04, University of California Berkeley (CA): Earthquake Engineering
Research Center.
ISIS Canada. (2007). “Reinforcing concrete structures with fiber-reinforced polymers –
Design Manual No. 3.” ISIS Canada Corporation, Manitoba, Canada.
Issa, M. S., Metwally, I. M., and Elzeiny, S. M. (2011). “Structural performance of
eccentrically loaded GFRP reinforced concrete columns.” Int. J. Civil Struct. Eng., 2(1),
395–404.
Jaeger, L. G., Mufti, A., and Tadros, G. (1997). “The Concept of the Overall Performance
Factor in Rectangular- Section Reinforced Concrete Beams.” Proce., the Third International
Symposium on Nonmetallic (FRP) Reinforcement for Concrete Structures (FRPRCS-3),
Japan Concrete Institute, Sapporo, Japan, Vol. 2, 551-558.
Kassem, C., Farghaly, A. S. and Benmokrane, B. (2011). “Evaluation of flexural behavior and
serviceability performance of concrete beams reinforced with FRP Bars.” Journal of
Composites for Construction, 15 (5), 682-695.
Kassem, W. (2015). “Shear strength of squat walls: A Strut-and-Tie Model and Closed-Form
Design Formula.” Engineering Structures, 84: 430-438.
Kuang, J. S., and Ho, Y. B. (2008). “Seismic Behavior and Ductility of Squat Reinforced
Concrete Shear Walls with Nonseismic Detailing.” ACI Structural Journal, 105(2), 225-
231.

166 References
Lefas, L. D., Kostsovos, M. D., and Ambraseys, N. N. (1990). “Behavior of Reinforced
Concrete Structural Walls: Strength, Deformation, Characteristics and Failure Mechanism.”
ACI Structural Journal, 87(1), 23-31.
Liao W-I, Zhong J, Lin CC, Mo YL, Loh C-H. (2004). “Experimental studies of high seismic
performance shear walls.” Proce., the 13th World Conference on Earthquake Engineering
(WCEE), Vancouver, B.C., Canada, No. 501.
Li, B. and Xiang, W. (2011). “Effective Stiffness of Squat Structural Walls.” Journal of
Structural Engineering, 137(12), 1470-1479.
Li, B., PAN, Z., and XIANG, W. (2014).” Experimental Evaluation of Seismic Performance
of Squat RC Structural Walls with Limited Ductility Reinforcing Details.” Journal of
Earthquake Engineering, DOI: 10.1080/13632469.2014.962669.
Luna, B. N., Rivera, J. P., Whittaker, A. S. (2015). “Seismic Behavior of Low-Aspect-Ratio
Reinforced Concrete Shear Walls.” ACI Structural Journal, 112 (5), 593-604.
Mady, M., El-Ragaby, A., and El-Salakawy, E. (2011). ”Seismic Behavior of Beam-Column
Joints Reinforced with GFRP Bars and Stirrups.” Journal of Composites for Construction,
ASCE, 15(6), 875–886.
Maier, J., and Thürlimann, B. (1985). “Bruchversuche an Stahlbetonscheiben.” Institut für
Baustatik und Konstruktion, Eidgenössische Technische Hochschule (ETH) Zürich, Zürich,
Switzerland, 130 pp.
Massone, L. M., Orakcal, K. and Wallace, J. W. (2009). “Modeling of Squat Structural Walls
Controlled by Shear.” ACI Structural Journal, 106 (5): 646-655.
Mast, R. F. (1968). “Auxiliary Reinforcement in Precast Concrete Connections,” Journal of
the Structural Division, 94(6), 1485-1504.
Mattock, A. H. (1974). “Shear Transfer in Concrete Having Reinforcement at an Angle to the
Shear Plane," American Concrete Institute, Publication SP-42, Shear in Reinforced
Concrete, pp. 17-42.

167
Mattock, A. H.; Johal, L.; and Chow, H. C. (1975) “Shear Transfer in Reinforced Concrete
with Moment or Tension Acting Across the Shear Plane.” PCI Journal, 20(4), pp. 76-93.
Mattock, A. H. (1977). “discussion of Considerations for the Design of Precast Concrete
Bearing Wall Buildings to Withstand Abnormal Loads.” PCI Journal, 22(3), 105-106.
Mohamed, N., Farghaly, A. S., Benmokrane, B. and Neale, K. W. (2014a). “Experimental
Investigation of Concrete Shear Walls Reinforced with Glass-Fiber-Reinforced Bars under
Lateral Cyclic Loading.” Journal of Composites for Constructions, 18 (3): 04014001.
Mohamed, N., Farghaly, A. S., Benmokrane, B., and Neale, K. W. (2014b). “Flexure and
Shear Deformation of GFRP-Reinforced Shear Walls.” Journal of Composites for
Constructions, 18(2): 04013044.
Morphy, R., Shehata, E., and Rizkalla, S. (1997). “Bent Effect on Strength of CFRP Stirrups.”
Proce., the Third International Symposium on Nonmetallic (FRP) Reinforcement for
Concrete Structures (FRPRCS-3), Sapporo, Japan, Vol.2, 19-26.
Nanni, A. (1993). “Flexural Behavior and Design of Reinforced Concrete Using FRP Rods.”
Journal of Structural Engineering, 119(11), 3344-3359.
Naqvi, S., and El-Salakawy, E. (2016). “Lap Splice in GFRP-RC Rectangular Columns
Subjected to Cyclic-Reversed Loads” Journal of Composites for Construction, 21(4):
04016117.
National Building Code of Canada (2010). “Canadian Commission on Building and Fire
Codes.” National Research Council of Canada (NBCC), Canada.
Oesterle, R. G., Aristizabal-Ochoa, J. D., Fiorato, A. E., Russell, H. G., and Corley, W. G.
(1979). “Earthquake Resistant Structural Walls-Tests of Isolated Walls: Phase 2.” PCA
Construction Technology Laboratories National Science Foundation, Washington, DC, 327
pp.

168 References
Oesterle, R. G., Fiorato, A. E., Aristizabal-Ochoa, J. D., and Corley, W. G. (1980). “Hysteretic
Response of Reinforced Concrete Structural Walls.” ACI Special Publication, SP-63, 243-
273.
Park R., and Paulay T. (1975).” Reinforced Concrete Structures.” John Wiley and Sons, Inc.,
New York.
Paulay, T. (1972). “Some Aspects of Shear Wall Design.” Bulletin of N.Z. Society for
Earthquake Engineering, 5(3).
Paulay, T. (1988). “Seismic Design in Reinforced Concrete – the State of the Art in New
Zealand.” Bulletin of the New Zealand National Society for Earthquake Engineering, 21(3),
208-232.
Paulay T., and Priestley M. J. N. (1995). Seismic Design of Reinforced Concrete and Masonry
Buildings. John Wiley and Sons, Inc.
Paulay, T., Priestley, M. J. N. and Synge, A. J. (1982). “Ductility in Earthquake Resisting
Squat Shear walls.” ACI Journal, 79 (4): 257-269.
Phillips, L.N. (1989). “Design with Advanced Composite Materials.” Springer- Verlag.
Pilakoutas, K., Elnashai, A. (1995). “Cyclic Behavior of RC Cantilever Walls, Part I:
Experimental Results” ACI Structural Journal, 92(3), 271-281.
Porter, M. L., Hughes, B. W., Barnes, B. A., and Viswanath, K. P. (1993). “Non-Corrosive Tie
Reinforcing and Dowel Bars for Highway Pavement Slabs.” Report No. HR-343, Iowa
Highway Research Board and Iowa Department of Transportation, Ames, Iowa.
Razaqpur, A. G., Isgor, O. B., Cheung, M. S., and Wiseman, A. (2001). “Background to shear
design provisions of the proposed Canadian standard for FRP reinforced concrete
structures.” Proc., International Conference on Composites in Construction, Porto, Portugal,
403–408.

169
Razaqpur, A. G., Isgor, O. B., Greenaway, S., and Selley, A. (2004). “Concrete Contribution
to the Shear Resistance of FRP Reinforced Concrete Members.” Journal of Composites in
Construction, ASCE, 8(5), 452-460.
Razaqpur, A. G., and Isgor, O. B. (2006). “Proposed Shear Design Method for FRP-
Reinforced Concrete Members without Stirrups.” ACI structural Journal, 103(1), 93-102.
Razaqpur, A. and Spadea, S. (2015). “Shear Strength of FRP Reinforced Concrete Members
with Stirrups.” Journal of Composites for Constructions, 19(1): 04014025.
Rizkalla, S., Hassan, T., and Hassan, N., (2003). “Design Recommendations for the use of
FRP for Reinforcement and Strengthening of Concrete Structures.” Journal of Progress in
Structural Engineering and Materials, 5(1), 16-28.
Saatcioglu, M. (1991). “Hysteretic Shear Response of Low-Rise Walls.” Proceedings of
International Workshop on Concrete Shear in Earthquake, The National Science
Foundation, University of Houston, Houston, Texas, 105-114.
Said A. M. and Nehdi M. L. (2004). “Use of FRP for RC Frames in Seismic Zones: Part II.
Performance of Steel-Free GFRP-Reinforced Beam-Column Joints.” Applied Composite
Materials, 11, 227-245.
Salonikios, T. N., Kappos, A. J., Tegos, I. A. and Penelis, G. G. (1999). “Cyclic Load
Behavior of Low-Slenderness Reinforced Concrete Walls: Design Basis and Test Results.”
ACI Structural Journal, 96 (4), 649-660.
Salonikios, T. N., Kappos, A. J., Tegos, I. A., and Penelis, G. G. (2000). “Cyclic Load
Behavior of Low-Slenderness Reinforced Concrete Walls: Failure Modes, Strength
Analysis, and Design Implications.” ACI Structural Journal, 97(1), 132-141.
Sánchez-Alejandre, A., and Alcocer, S., M. (2010). “Shear strength of squat reinforced
concrete walls subjected to earthquake loading - trends and models.” Engineering
Structures, Vol. 32(8), 2466-2476.

170 References
Shaingchin, S., Lukkunaprasit, P., Wood S. L. (2007). “Influence of diagonal web
reinforcement on cyclic behavior of structural walls.” Engineering Structures, 29(4), 498-
510.
Sharbatdar, M. K., and Saatcioglu, M. (2009). “Seismic Design of FRP Reinforced Concrete
Structures.” Asian Journal of Applied Sciences, 2(3), 211-222.
Shehata, E., Morphy, R. and Rizkalla, S. (2000). “Fibre Reinforced Polymer Shear
Reinforcement for Concrete Members.” Behaviour and Design Guidelines. Canadian
Journal of Civil Engineering. Vol. 27, 859-872.
Sheikh, S. A., and Khoury, S. S. (1993). “Confined Concrete Columns with Stubs.” ACI
Structural Journal, 90(4), 414-431.
Sittipunt, C., and Wood, S. L. (1995). “Influence of Web Reinforcement on Cyclic Response
of Structural Walls.” ACI Structural Journal, 92(6), 745-756.
Sittipunt, C., Wood, S. L., Lukkunaprasit, P. and Pattararattanakul, P. (2001). “Cyclic
Behavior of Reinforced Concrete Structural Walls with Diagonal Web Reinforcement.”
ACI Structural Journal, 98 (4), 554-562.
Standards New Zealand (NZS). (1995). “Code of Practice for the Design of Concrete
Structures, part 1.” NZS 3101, Wellington, New Zealand.
Takahashi, S., Yoshida, K., Ichinose, T., Sanada, Y., Matsumoto, K., Fukuyama, H. and
Suwada, H. (2013). “Flexural Drift Capacity of Reinforced Concrete Wall with Limited
Confinement.” ACI Structural Journal, 110 (1), 95-104.
Tang, TO., and Su, RKL., (2014). ”Shear and flexural Stiffnesses of Reinforced Concrete
Shear Walls Subjected to Cyclic Loading.” The Open Construction and Building
Technology Journal, V. 8, 104-121.
Tavassoli, A., Liu, J., and Sheikh, S. (2015). “Glass fiber-reinforced polymer-reinforced
circular columns under simulated seismic loads” ACI Structural Journal, 112(10), 103–
114.
171
Theriault, M., and Benmokrane, B. (1998). “Effects of FRP Reinforcement Ratio and Concrete
Strength on Flexural Behavior of Concrete Beams.” Journal of Composites for
Construction, ASCE, 2(1), 7-16.
Tobbi, H., Farghaly, A. S., and Benmokrane, B. (2012). “Concrete Columns Reinforced
Longitudinally and Transversally with Glass Fiber-Reinforced Polymer Bars.” ACI
Structural Journal, 109(4), 551-558.
Tobbi, H., Farghaly, A. S., and Benmokrane, B. (2014). “Behavior of Concentrically Loaded
Fiber-Reinforced Polymer Reinforced Concrete Columns with Varying Reinforcement
Types and Ratios” ACI Structural Journal, 111(2), 375-386.
Uomoto, T. and Ohga, H. (1996). “Performance of Fiber Reinforced Plastics for Concrete
Reinforcement.” Proceedings of the 2nd International Conference on Advance Composite
Materials in Bridges and Structures (ACMBS-11), Canadian Society of Civil Engineers,
Montreal, Quebec, 121-129.
Vecchio, F. J., Collins, M. P. (1986). “Modified Compression Field Theory for Reinforced
Concrete Elements Subjected to Shear.” ACI Structural Journal, 83(2), 219-231.
Wasiewicz, Z. F. (1988). “Sliding Shear in Low-Rise Shear Walls under Lateral Load
Reversals.” M.Sc. Thesis, University of Ottawa, Canada, 127 pp.
Whyte, C. A. and Stojadinovic, B. (2013). “Hybrid Simulation of the Seismic Response of
Squat Reinforced Concrete Shear Walls.” PEER Report 2013/02, Pacific Earthquake
Engineering Research Center, University of California, Berkeley, CA.
Whyte, C. and Stojadinovic, B. (2014). “Effect of Ground Motion Sequence on Response of
Squat Reinforced Concrete Shear Walls.” Journal of Structural Engineering, 140 (8):
4014004.
Wood, S. L. (1990). “Shear Strength of Low-Rise Reinforced Concrete Walls.” ACI Structural
Journal, 87(1), 99-107.

172 References
Woods, J., Cruz-Noguez, C., Lau, D., Khabra, J. (2015). “Seismic Strengthening of
Reinforced Concrete Squat Walls Using Externally Bonded CFRP Sheets” CSCE 2015
Regina Conference “Building on Our Growth Opportunities” Regina,
Wu, W. P. (1990). “Thermomechanical Properties of Fiber Reinforced Plastic (FRP) Bars.”
Ph.D Thesis, West Virginia University, Morgantown, W.Va., 292 pp.
Wyllie, L.A., Abrahamson, N., Bolt, B., Castro, G., and Durkin, M. E. (1986). “The Chile
Earthquake of March 3, 1985- Performance of Structures.” Earthquake Spectra, 2(2), 93-
371.
Yamakawa, T., and Fujisaki, T. (1995). “A Study on Elasto-Plastic Behavior of Structural
Walls Reinforced by CFRP Grids”, Proceedings of the Second International Symposium on
Non-metallic (FRP) Reinforcement for Concrete Structures (FRPRCS-2), RILEM
proceedings 29, 267-274.
Zhong, JX., Mo, YL., and Liao, WI. (2009). “Reversed Cyclic Behavior of Reinforced
Concrete Shear Walls with Diagonal Steel Grids.” ACI, Special Publication, Vol. 265, 47-
72.


173
APPENDIX
This chapter represents the calculations of the specimens’ strengths in flexural, shear, and
sliding shear that were reported and discussed in chapter 4 (Table 4.1).
1.1. Specimen S4-80
1.1.1. Material and Sectional Properties
Concrete Properties
- Mpaf c 35' 0.1c
- 80.00015.085.0 '1 cf 88.00025.097.0 '
1 cf
Reinforcement Properties
- longitudinal bars: No. 10 (fy = 420 MPa, Es = 200 GPa, As = 71 mm2)
- Horizontal bars: No. 13 (fy = 420 MPa, Es = 200 GPa, As = 129 mm2)
Cross Section Properties
- Thickness = 200 mm
- Length = 1500 mm
- Shear Span = 2550 mm
1.1.2. Flexural Strength
The predicted flexural strength was calculated based on plane sectional analysis. The analysis
was based on strain compatibility, internal force equilibrium, and the controlling mode of
failure. The calculation was carried out considering unconfined and confined concrete section.
All the reinforcement crossing the wall base was considered, including the vertical component
of the bidiagonal sliding reinforcement.

174 Appendix
Unconfined Section
The calculation was carried out assuming concrete compressive strain (εc) = 0.0035 based on
the CSA A23.3 (2014). Figure A.1 shows the strain and stress distribution along the wall
length.
Figure A.1 – Strain and stress distribution along the wall length
Assume the neutral axis location (c) is less than 254.94 mm (location of "F9’").
Based on strain compatibility, the strain in reinforcement can be obtained as follows:
c
c 500035.01
c
c 1000035.02
c
c 1500035.03
c
c2700035.04
c
c3900035.05
c
c5100035.06
c
c6300035.07
c
c7500035.08
c
c8700035.09
α1fc
'
Stress distribution
єc
a=β1c
Cross‐section
c
Strain distribution
M
x
50
50
50
120
120
120
120
120
120
120
120
120
120
50
50
50
141.4200
F1
F1'
єf
F2
F3 F4 F5
F6
F7
F8
F9
F10
F11
F12
F2'
F3'
F4'
F5'
F6'
F7'
F8'
F9'
F10
'

175
c
c9900035.010
c
c11100035.011
c
c12300035.012
c
c13500035.013
c
c14000035.014
c
c14500035.015
c
c 5.1130035.0'
1
c
c94.2540035.0'
2
c
c38.3960035.0'
3
c
c82.5370035.0'
4
c
c26.6790035.0'
5
c
c7.8200035.0'
6
c
c14.9620035.0'
7
c
c58.11030035.0'
8
c
c12450035.0'
9
c
c46.13860035.0'
10
Compression force in concrete (Cc) = /cf bc
Cc = 0.80 × 0.88 × 35 × 200 × C = 4928 c
Figure A.2 – Idealized stress strain curve for steel
Based on the idealized stress strain curve for steel (Figure A.2), the forces in steel
reinforcement can be estimated as follows:
).(10
... ysyssE
AEAF [In the yielded reinforcement]
yss EAF .. [In the un-yielded reinforcement]
strain
E
0.1E
εy = 0.002
Stress

176 Appendix
The procedure needs more iteration until the preliminary assumptions are satisfied. In the
following sections, the final iteration is only shown.
Assume that all reinforcement yielded except longitudinal reinforcement number “3, 4”, and
sliding reinforcement number “1, 2”. Accordingly, the compression and tension forces in the
reinforcement can be estimated as follow:
Compression force in reinforcement (Cs) = sss AE + 707.0' sss AE
Cs =
2131020002.050
0035.021310200002.0 33
c
c +
1421020002.0100
0035.014210200002.0 33
c
c +
21310200150
0035.0 3
c
c+
707.0142102005.113
0035.0 3
c
c
Tension force in reinforcement (Ts) = sss AE + 707.0' sss AE
Tf=
14210200270
0035.0 3
c
c +
1421020002.0390
0035.014210200002.0 33
c
c +
1421020002.0510
0035.014210200002.0 33
c
c +
1421020002.0630
0035.014210200002.0 33
c
c +
1421020002.0750
0035.014210200002.0 33
c
c +
1421020002.0870
0035.014210200002.0 33
c
c +
1421020002.0990
0035.014210200002.0 33
c
c +

177
1421020002.01110
0035.014210200002.0 33
c
c +
1421020002.01230
0035.014210200002.0 33
c
c +
2131020002.01350
0035.021310200002.0 33
c
c +
1421020002.01400
0035.014210200002.0 33
c
c +
2131020002.01450
0035.021310200002.0 33
c
c +
707.01421020094.254
0035.0 3
c
c+
707.01421020002.038.396
0035.0707.014210200002.0 33
c
c
+
707.01421020002.082.537
0035.0707.014210200002.0 33
c
c
+
707.01421020002.026.679
0035.0707.0142200002.0 3
c
c
+
707.01421020002.07.820
0035.0707.014210200002.0 33
c
c
+
707.01421020002.014.962
0035.0707.014210200002.0 33
c
c
+
707.01421020002.058.1103
0035.0707.014210200002.0 33
c
c
+
707.01421020002.01245
0035.0707.014210200002.0 33
c
c
+

178 Appendix
707.01421020002.046.1386
0035.0707.014210200002.0 33
c
c
Apply the first equilibrium equation as follows:
sc TCsC
c = 243.81 mm < 254.94 mm, as assumed. So, back substitute to calculate strain in
reinforcement.
0028.01 (yielded) 0019.0'1 (did not yield)
0021.02 (yielded) 00016.0'2 (did not yield)
0013.03 (did not yield) 0022.0'3 (yielded)
0004.04 (did not yield) 004.0'4 (yielded)
0021.05 (yielded) 006.0'5 (yielded)
0038.06 (yielded) 008.0'6 (yielded)
0056.07 (yielded) 01.0'7 (yielded)
0073.08 (yielded) 012.0'8 (yielded)
0089.09 (yielded) 014.0'9 (yielded)
011.010 (yielded) 016.0'10 (yielded)
012.011 (yielded)
014.012 (yielded)
0159.013 (yielded)
0166.014 (yielded)
0173.015 (yielded)

179
The preliminary assumption is right; hence, we can continue to obtain the forces in
reinforcement.
Forces in Longitudinal Steel Bars
F1 = 88.53 kN (Comp.), F2 = 56.98 kN (Comp.), F3 = 57.37 kN (Comp.), F4 = 10.77 kN
(Ten.), F5 = 57.10 kN (Ten.), F6 = 61.97 kN (Ten.), F7 = 66.90 kN (Ten.), F8 = 71.79 kN
(Ten.), F9 = 76.69 kN (Ten.), F10 = 81.59 kN (Ten.), F11 = 86.49 kN (Ten.), F12 = 91.38 kN
(Ten.), F13 = 144.43 kN (Ten.), F14 = 98.32 kN (Ten.), F15 = 150.55 kN (Ten.)
Forces in Sliding Steel Bars
F1’ = 37.53 kN (Comp.), F2
’ = 3.29 kN (Ten.), F3’ = 40.56 kN (Ten.), F4
’ = 44.64 kN (Ten.),
F5’ = 48.72 kN (Ten.), F6
’ = 52.80 kN (Ten.), F7’ = 56.88 kN (Ten.), F8
’ = 60.96 kN (Ten.), F9’
= 65.05 kN (Ten.), F10’ = 69.13 kN (Ten.).
Force in Concrete
Cc = 1199.76 kN
Apply the second equilibrium equation by taking the moment about the extreme compression
fiber.
12
n
u c si si i
aM C c A f c x
Mu = 1494 KN.m
Flexural strength (Vf) = kNSpanShear
Mu 58655.2
1494
Confined Section
Since the concrete compressive strain at the preliminary design of specimen is not known, we
used the measured concrete compressive strain in the literature. Paulay and Preistly (1995)
found experimentally that, under cyclic loads, crushing was delayed until strains reached
0.006. Furthermore, Thomsen and Wallace (2004) estimated the ultimate compression strains
for rectangular section walls as 0.0055. Similarly, Mohamed et al. (2014a) reported that

180 Appendix
concrete compressive strain, in the tested steel RC wall, attained almost 0.0055. In the present
study, the author, conservatively, used a concrete compressive strain equal to 0.0055. In
calculation, the concrete cover was omitted since the confinement efficiency begin by the
onset of concrete cover spalling.
Assume the neutral axis location (c) is less than 365 mm (location of "F11").
Based on strain compatibility, the strain in reinforcement can be obtained as follows:
c
c 250055.01
c
c 750055.02
c
c 1250055.03
c
c 2450055.04
c
c3650055.05
c
c4850055.06
c
c6050055.07
c
c7250055.08
c
c8450055.09
c
c9650055.010
c
c10850055.011
c
c12050055.012
c
c13250055.013
c
c13750055.014
c
c14250055.015
c
c 50.880055.0'
1
c
c 94.2290055.0'
2
c
c39.3710055.0'
3
c
c83.5120055.0'
4
c
c27.6540055.0'
5
c
c71.7950055.0'
6
c
c16.9370055.0'
7
c
c6.10780055.0'
8
c
c12200055.0'
9
c
c48.13610055.0'
10
Compression force in concrete (Cc) = /cf bc
Cc = 0.80 × 0.88 × 35 × 200 × C = 4928 c
Compression force in reinforcement (Cs) = sss AE + 707.0' sss AE
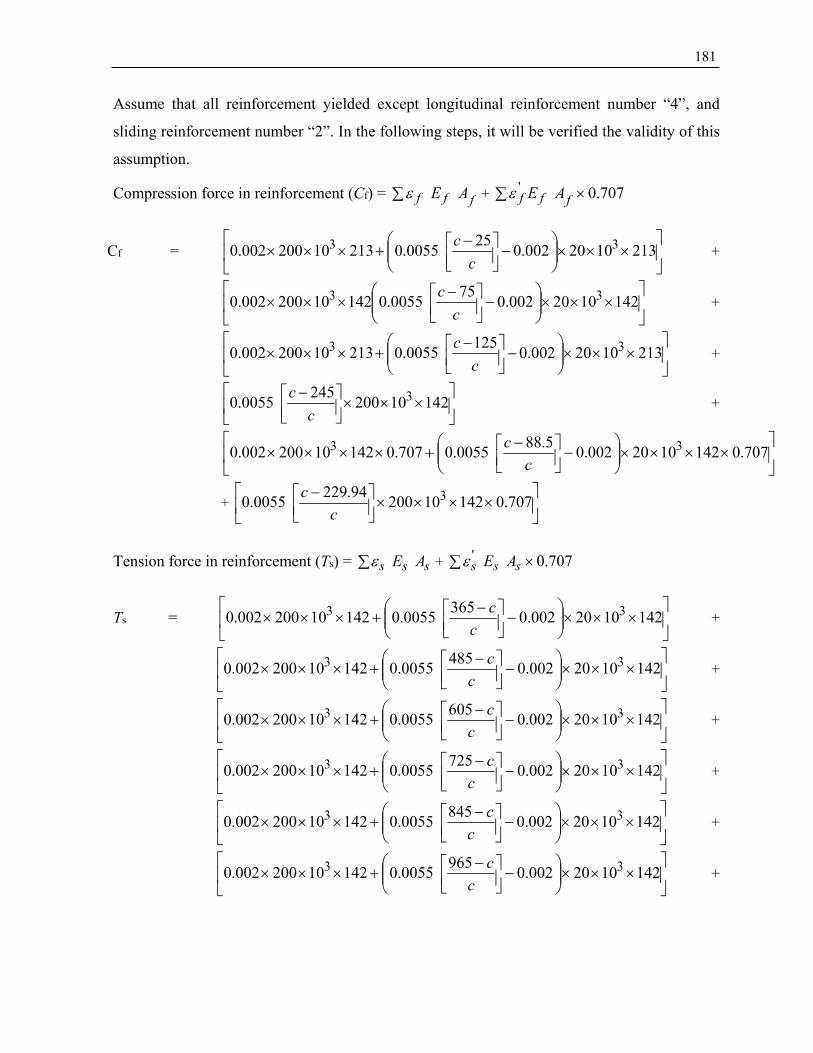
181
Assume that all reinforcement yielded except longitudinal reinforcement number “4”, and
sliding reinforcement number “2”. In the following steps, it will be verified the validity of this
assumption.
Compression force in reinforcement (Cf) = fff AE + 707.0' fff AE
Cf =
2131020002.025
0055.021310200002.0 33
c
c +
1421020002.075
0055.014210200002.0 33
c
c +
2131020002.0125
0055.021310200002.0 33
c
c+
14210200245
0055.0 3
c
c+
707.01421020002.05.88
0055.0707.014210200002.0 33
c
c
+
707.01421020094.229
0055.0 3
c
c
Tension force in reinforcement (Ts) = sss AE + 707.0' sss AE
Ts =
1421020002.0365
0055.014210200002.0 33
c
c +
1421020002.0485
0055.014210200002.0 33
c
c+
1421020002.0605
0055.014210200002.0 33
c
c +
1421020002.0725
0055.014210200002.0 33
c
c +
1421020002.0845
0055.014210200002.0 33
c
c +
1421020002.0965
0055.014210200002.0 33
c
c +

182 Appendix
1421020002.01085
0055.014210200002.0 33
c
c +
1421020002.01205
0055.014210200002.0 33
c
c +
2131020002.01325
0055.021310200002.0 33
c
c +
1421020002.01375
0055.014210200002.0 33
c
c +
2131020002.01425
0055.021310200002.0 33
c
c +
707.01421020002.039.371
0055.0707.014210200002.0 33
c
c
+
707.01421020002.083.512
0055.0707.014210200002.0 33
c
c
+
707.01421020002.027.654
0055.0707.014210200002.0 33
c
c
+
707.01421020002.071.795
0055.0707.014210200002.0 33
c
c
+
707.01421020002.016.937
0055.0707.014210200002.0 33
c
c
+
707.01421020002.06.1078
0055.0707.014210200002.0 33
c
c
+
707.01421020002.01220
0055.0707.014210200002.0 33
c
c
+
707.01421020002.048.1361
0035.0707.014210200002.0 33
c
c
Apply the first equilibrium equation as follows:
ssc TCC

183
c = 263.5 mm
The assumption that c is less than 365 mm is right, so, back substitute to obtain strain in
reinforcement.
005.01 (yielded) 0037.0'1 (yielded)
0039.02 (yielded) 0007.0'2 (did not yield)
0029.03 (yielded) 0023.0'3 (yielded)
0004.04 (did not yield) 0052.0'4 (yielded)
0021.05 (yielded) 0082.0'5 (yielded)
0046.06 (yielded) 011.0'6 (yielded)
0071.07 (yielded) 014.0'7 (yielded)
0096.08 (yielded) 017.0'8 (yielded)
012.09 (yielded) 02.0'9 (yielded)
015.010 (yielded) 023.0'10 (yielded)
017.011 (yielded)
02.012 (yielded)
022.013 (yielded)
023.014 (yielded)
024.015 (yielded)
The preliminary assumption is right; hence, we can continue to obtain the forces in
reinforcement.

184 Appendix
Forces in Longitudinal Steel Bars
F1 = 97.89 kN (Comp.), F2 = 62.29 kN (Comp.), F3 = 89 kN (Comp.), F4 = 10.95 kN (Comp.),
F5 = 57.14 kN (Ten.), F6 = 64.25 kN (Ten.), F7 = 71.37 kN (Ten.), F8 = 78.48 kN (Ten.), F9 =
85.60 kN (Ten.), F10 = 92.71 kN (Ten.), F11 = 99.82 kN (Ten.), F12 = 106.94 kN (Ten.), F13 =
171.08 kN (Ten.), F14 = 117.02 kN (Ten.), F15 = 179.97 kN (Ten.)
Forces in Sliding Steel Bars
F1’ = 43.48 kN (Comp.), F2
’ = 14.06 kN (Comp.), F3’ = 40.67 kN (Ten.), F4
’ = 46.60 kN
(Ten.), F5’ = 52.52 kN (Ten.), F6
’ = 58.45 kN (Ten.), F7’ = 64.38 kN (Ten.), F8
’ = 70.31 kN
(Ten.), F9’ = 76.24 kN (Ten.), F10
’ = 82.17 kN (Ten.)
Cc = 1298 kN
Apply the second equilibrium equation by taking the moment about the extreme compression
fiber.
12
n
u c si si i
aM C c A f c x
Mu = 1591 KN.m
Flexural strength (Vf) = kNSpanShear
Mu 62455.2
1591
1.1.3. Shear Strength
The shear strength was calculated based on the CSA A23.3 (2014). Clause 21.5.10.8 specifies
that, under seismic loading, the shear force is to be resisted by horizontal web reinforcement
only, with no reliance on the concrete contribution to shear strength due to the effect of criss
cross shear cracks pattern and the associated degradation of concrete shear resistance. The
shear strength of the steel-reinforced wall was determined as follows:
s
dfAVV vyvs
ssr
cot
where Vr is the shear strength, Vss is the shear resistance provided by the horizontal web

185
reinforcement, s is the material resistance factor for steel = 1.0, Av is the area of horizontal
web reinforcement within the distance s = 258 mm2, fy is the specified yield strength of the
horizontal web reinforcement = 420 MPa, dv is the effective shear depth equal to the greater of
0.9d or 0.72 lw but not less than 0.8 lw = 1200 mm, θ is the angle of inclination of diagonal
compressive stresses to the longitudinal axis of the wall and conservatively assumed 45°, and s
is the spacing of the horizontal web reinforcement measured along the longitudinal axis of the
wall = 80 mm.
162580
)45cot(12004202581
ssr VV kN
1.1.4. Sliding Strength
The sliding shear strength (MPa) was calculated based on the CSA A23.3 (2014) (Clause
11.5.1) as follows:
cosr c s v y fv c f
According to Clause 11.5.4, the values of σ can be calculated as follows:
sinv y fg
Nf
A
vfv
cv
A
A
The area of longitudinal reinforcement = 34 × 71 = 2414 mm2
The reinforcement ratio (ρv(v)) = 524148.05 10
1500 200
38.3)90sin(4201005.8 3 v MPa
The area of bidiagonal sliding reinforcement = 20 × 71 = 1420 mm2
The reinforcement ratio (ρv(d)) = 314204.73 10
1500 200
4.1)45sin(4201073.4 3 v MPa
c = 0.25, and µ = 0.6 (the surface was not roughened), λ = 1.0 (normal concrete)
528.4)45cos(4201073.41)41.138.3(6.025.011 3 rv MPa

186 Appendix
13581500200528.4 wwrr lbvV kN
1.2. Specimen G4-80
1.2.1. Material and Sectional Properties
Concrete Properties
- Mpafc 40' 0.1c
- 79.00015.085.0 '1 cf 87.00025.097.0 '
1 cf
Reinforcement Properties
- longitudinal bars: No. 10 (ffu = 1372 MPa, Ef = 65 GPa, Af = 71.3 mm2)
- Horizontal bars: No. 13 (for straight portions: ffu = 1020 MPa, Ef =50 GPa, Af = 126.7
mm2; for bent portions: ffu = 459 MPa)
Cross Section Properties
- Thickness = 200 mm
- Length = 1500 mm
- Shear Span = 2550 mm
1.2.2. Flexural Strength
The predicted flexural strength was calculated based on plane sectional analysis (Figure A.1).
The contribution of the GFRP bars in compression was considered by assuming a compressive
strength equal to 50% of the tensile strength, while the modulus of elasticity was considered
the same in tension and compression (Deitz et al. 2003).
Unconfined Section
The calculation was carried out assuming concrete compressive strain (εc) = 0.0035 based on
the CSA S806-12.
Assume the neutral axis location (c) is less than 270 mm (location of "F12").
Based on strain compatibility, the strain in reinforcement can be obtained as follows:

187
c
c 500035.01
c
c 1000035.02
c
c 1500035.03
c
c2700035.04
c
c3900035.05
c
c5100035.06
c
c6300035.07
c
c7500035.08
c
c8700035.09
c
c9900035.010
c
c11100035.011
c
c12300035.012
c
c13500035.013
c
c14000035.014
c
c14500035.015
c
c 5.1130035.0'
1
c
c 94.2540035.0'
2
c
c38.3960035.0'
3
c
c82.5370035.0'
4
c
c26.6790035.0'
5
c
c7.8200035.0'
6
c
c14.9620035.0'
7
c
c58.11030035.0'
8
c
c12450035.0'
9
c
c46.13860035.0'
10
Compression force in concrete (Cc) = /cf bc
Cc = 0.79 × 0.87 × 40 × 200 × C = 5498.4 c
Compression force in reinforcement (Cf) = fff AE + 707.0' fff AE
Cf = 3.713106550
0035.0 3
c
c + 3.7121065
1000035.0 3
c
c +
3.7131065150
0035.0 3
c
c+
707.03.71210655.113
0035.0 3
c
c +
707.03.712106594.254
0035.0 3
c
c

188 Appendix
Tension force in reinforcement (Tf) = fff AE + 707.0' fff AE
Tf = 23.711065270
0035.0 3
c
c+ 23.711065
3900035.0 3
c
c +
23.711065510
0035.0 3
c
c+ 23.711065
6300035.0 3
c
c +
23.711065750
0035.0 3
c
c + 23.711065
8700035.0 3
c
c +
23.711065990
0035.0 3
c
c + 23.711065
11100035.0 3
c
c +
23.7110651230
0035.0 3
c
c + 33.711065
13500035.0 3
c
c +
23.7110651400
0035.0 3
c
c + 33.711065
14500035.0 3
c
c + +
707.023.71106538.396
0035.0 3
c
c+
707.023.71106582.537
0035.0 3
c
c+
707.023.71106526.679
0035.0 3
c
c+
707.023.7110657.820
0035.0 3
c
c +
707.023.71106514.962
0035.0 3
c
c+
707.023.71106558.1103
0035.0 3
c
c+
707.023.7110651245
0035.0 3
c
c +
707.023.71106546.1386
0035.0 3
c
c
Apply the first equilibrium equation as follows:
ffc TCC
c = 263 mm < 270 mm, as assumed. So, back substitute to calculate the forces in FRP bars and
concrete.

189
Forces in Longitudinal FRP Bars
F1 = 39.41 kN (Comp.), F2 = 20.11 kN (Comp.), F3 = 20.91 kN (Comp.), F4 = 0.86 kN (Ten.),
F5 = 15.67 kN (Ten.), F6 = 30.47 kN (Ten.), F7 = 45.27 kN (Ten.), F8 = 60.08 kN (Ten.), F9 =
74.88 kN (Ten.), F10 = 89.68 kN (Ten.), F11 = 104.48 kN (Ten.), F12 = 119.29 kN (Ten.), F13 =
201.14 kN (Ten.), F14 = 140.26 kN (Ten.), F15 = 219.64 kN (Ten.)
Forces in Sliding FRP Bars
F1’ = 13.04 kN (Comp.), F2
’ = 0.70 kN (Comp.), F3’ = 11.63 kN (Ten.), F4
’ = 23.97 kN (Ten.),
F5’ = 36.30 kN (Ten.), F6
’ = 48.64 kN (Ten.), F7’ = 60.98 kN (Ten.), F8
’ = 73.31 kN (Ten.), F9’
= 85.64 kN (Ten.), F10’ = 97.98 kN (Ten.)
Force in Concrete
Cc = 1446 kN
Apply the second equilibrium equation by taking the moment about the extreme compression
fiber.
12
n
u c si si i
aM C c A f c x
Mu = 1588 KN.m
Flexural strength (Vf) = kNSpanShear
Mu 62355.2
1588
Confined Section
Since it is unknown in the preliminary design of the specimens, the concrete compressive
strain for confined section should be assumed. In our study, we used the measured concrete
compressive strain by Mohamed et al. (2014a) in specimen G15 that equal to 0.009. The
concrete compressive strength and reinforcement details at the boundary element in specimen
G15 is identical to that used in G4-80, hence similar strain is expected. The preliminary
calculated strength was 930 kN, and based on this value the horizontal web reinforcement was
selected. After testing of specimen G4-80, the measured concrete compressive strain was
0.0084 (Figure 4.13) which is close to the preliminary calculations. However, to give more
accurate estimation of the obtained flexural strength and check the validity of using plane

190 Appendix
sectional analysis, the strength was recalculated with using the recorded concrete compressive
strain. Calculation details are given as follows:
Assume that the neutral axis location (c) is located at a distance less than 365 mm (location of
"F11") from the most compressed fiber after omitting the concrete cover.
Based on strain compatibility, the strain in reinforcement can be obtained as follows:
c
c 250084.01
c
c 750084.02
c
c 1250084.03
c
c 2450084.04
c
c3650084.05
c
c4850084.06
c
c6050084.07
c
c7250084.08
c
c8450084.09
c
c9650084.010
c
c10850084.011
c
c12050084.012
c
c13250084.013
c
c13750084.014
c
c14250084.015
c
c 50.880084.0'
1
c
c 94.2290084.0'
2
c
c39.3710035.0'
3
c
c83.5120084.0'
4
c
c27.6540084.0'
5
c
c71.7950084.0'
6
c
c16.9370084.0'
7
c
c6.10780084.0'
8
c
c12200084.0'
9
c
c48.13610084.0'
10
Compression force in concrete (Cc) = /cf bc
Cc = 0.79 × 0.87 × 40 × 200 × C = 5498.4 c
Compression force in reinforcement (Cf) = fff AE + 707.0' fff AE

191
Cf = 3.713106525
0084.0 3
c
c + 3.7121065
750084.0 3
c
c +
3.7131065125
0084.0 3
c
c+ 3.7121065
2450084.0 3
c
c+
707.03.71210655.88
0084.0 3
c
c +
707.03.712106594.229
0084.0 3
c
c
Tension force in reinforcement (Tf) = fff AE + 707.0' fff AE
Tf = 23.711065365
0084.0 3
c
c + 23.711065
4850084.0 3
c
c+
23.711065605
0084.0 3
c
c + 23.711065
7250084.0 3
c
c +
23.711065845
0084.0 3
c
c + 23.711065
9650084.0 3
c
c +
23.7110651085
0084.0 3
c
c + 23.711065
12050084.0 3
c
c +
33.7110651325
0084.0 3
c
c + 23.711065
13750084.0 3
c
c +
33.7110651425
0084.0 3
c
c +
707.023.71106539.371
0084.0 3
c
c+
707.023.71106583.512
0084.0 3
c
c+
707.023.71106527.654
0084.0 3
c
c+
707.023.71106571.795
0084.0 3
c
c +
707.023.71106516.937
0084.0 3
c
c+
707.023.7110656.1078
0084.0 3
c
c+

192 Appendix
707.023.7110651220
0084.0 3
c
c +
707.023.71106548.1361
0084.0 3
c
c
Apply the first equilibrium equation as follows:
ffc TCC
c = 314.39 mm < 365 mm, as assumed. So, back substitute to calculate the forces in FRP bars
and concrete.
Forces in Longitudinal FRP Bars
F1 = 107.50 kN (Comp.), F2 = 59.29 kN (Comp.), F3 = 70.36 kN (Comp.), F4 = 17.19 kN
(Comp.), F5 = 12.53 kN (Ten.), F6 = 42.25 kN (Ten.), F7 = 71.97 kN (Ten.), F8 = 101.69 kN
(Ten.), F9 = 131.40 kN (Ten.), F10 = 161.12 kN (Ten.), F11 = 190.84 kN (Ten.), F12 = 220.56
kN (Ten.), F13 = 375.41 kN (Ten.), F14 = 262.65 kN (Ten.), F15 = 412.56 kN (Ten.)
Forces in Sliding FRP Bars
F1’ = 39.55 kN (Comp.), F2
’ = 14.79 kN (Comp.), F3’ = 9.98 kN (Ten.), F4
’ = 34.74 kN (Ten.),
F5’ = 59.51 kN (Ten.), F6
’ = 84.27 kN (Ten.), F7’ = 109.03 kN (Ten.), F8
’ = 133.80 kN (Ten.),
F9’ = 158.56 kN (Ten.), F10
’ = 183.33 kN (Ten.)
Force Concrete
Cc = 1728.67 kN
Apply the second equilibrium equation by taking the moment about the extreme compression
fiber.
12
n
u c si si i
aM C c A f c x
Mu = 2298 KN.m
Flexural strength (Vf) = kNSpanShear
Mu 90155.2
2298

193
1.2.3. Shear Strength
Due to the absence of seismic provisions for GFRP-reinforced squat walls in CSA S806
(2012), we adopted the concept provided in CSA A23.3 (2014) for steel. The shear capacity of
GFRP-reinforced wall was therefore calculated based on the shear resistance of horizontal web
reinforcement only, as follows:
s
dfAVV vfuvf
sfr
cot4.0 (1)
wheref is the material resistance factor = 1.0, Av is the area of horizontal reinforcement in
spacing (s) = 254 mm2, s (spacing) = 80 mm, ffu is ultimate strength of straight portion = 1020
MPa, dv is the effective shear depth equal to the greater of 0.9d or 0.72 lw but not less than 0.8
lw = 1200 mm, is the shear crack angle = l700030 and range from 30° to 60°, is the
longitudinal strain at mid-depth of the section and can be calculated as follows:
ff
fvfl AE
VdM
2
(2)
where Mf and Vf are, respectively, the moment and shear applied at the critical section of shear
taken at the wall base; Ef and Af are the elastic modulus and the total cross-sectional area of
longitudinal tension reinforcement at the same section; and the other terms as described above.
It should be noted that since our study ignored the shear capacity carried by concrete (in terms
of aggregate interlock and dowel action) as well as the elastic nature of GFRP bars, which
should enable the cracks to realign and close after an earthquake, the ultimate strength of the
GFRP was limited to 0.4fu , while the shear strain limitation was omitted (for more details, see
section 4.2.3).
The shear resistance and longitudinal strain equations are interrelated, accordingly, to be
solved, iteration process should be implemented. Instead, they can be conveniently performed
in a spreadsheet. By doing so, it was found the shear strength (Vf) equal to 895kN.

194 Appendix
1.2.4. Sliding Strength
Due to the lack of provisions in CSA S806 (2012) for calculating sliding shear, we opted to
calculate it for GFRP-reinforced walls based on CSA (2014) (Clause 11.5.1) as follows:
fyvscs fcv cos
where vr is the sliding-shear strength (MPa); λ is a factor to account for low-density concrete =
1.0, c is the resistance factor for concrete = 1.0, c is the cohesion stress = 0.25 since the
surface was not roughened , μ is the coefficient of friction = 0.0 due to the lower strength and
stiffness of GFRP bars in the transverse direction, fy is the yield strength for the steel and can
be replaced with the rupture strength (fu = 1372 MPa) in the case of FRP bars since the bars
are supposed to carry load until rupture occurred, and αf is the angle between the shear-friction
reinforcement and the shear plane = 45o.
86.4707.013721500200
3.7120125.0
sv MPa
1458150020086.4 wwss lbvV kN
1.3. Specimen G6-80
1.3.1. Material and Sectional Properties
Concrete Properties
- f c' 41 MPa 0.1c
- 79.00015.085.0 '1 cf 87.00025.097.0 '
1 cf
Reinforcement Properties
- longitudinal bars: No. 10 (ffu = 1372 MPa, Ef = 65 GPa, Af = 71.3 mm2)
- Horizontal bars: No. 19 (for straight portions: ffu = 1028 MPa, Ef =50 GPa, Af = 285
mm2; for bent portions: ffu = 463 MPa)
Cross Section Properties
- Thickness = 200 mm
- Length = 1500 mm

195
- Shear Span = 2550 mm
1.3.2. Flexural Strength
Unconfined Section
Flexural strength = 630 kN (similar to G4-80’s flexural strength; the minor change is
attributed to the change in concrete compressive strength)
Confined Section
Flexural strength = 943 kN (similar to G4-80’s flexural strength; the minor change is
attributed to the change in concrete compressive strength and the higher measured concrete
compressive strain, 0.009 as shown in Figure 4.13)
1.3.3. Shear Strength
s
dfAVV vfuvf
sfr
cot4.0
203080
60cot1200102857014.0
sfr VV kN
1.3.4. Sliding Strength
1458sV kN (similar to G4-80’s sliding strength)
1.4. Specimen GD
1.4.1. Material and Sectional Properties
Concrete Properties
- f c' 34 MPa 0.1c
- 80.00015.085.0 '1 cf 89.00025.097.0 '
1 cf
Reinforcement Properties
- longitudinal bars: No. 10 (ffu = 1372 MPa, Ef = 65 GPa, Af = 71.3 mm2)
Cross Section Properties
- Thickness = 200 mm
- Length = 1500 mm

196 Appendix
- Shear Span = 2550 mm
1.4.2. Flexural Strength
Unconfined Section
The calculation was carried out assuming concrete compressive strain (εc) = 0.0035 based on
the CSA S806-12.
Figure A.3 – Strain and stress distribution along GD’s length
Assume the neutral axis location (c) is less than 396.5 mm (location of "F8’").
Based on strain compatibility (Figure A.3), the strain in reinforcement can be obtained as
follows:
c
c 500035.01
c
c 1000035.02
c
c 1500035.03
α1fc
'
Stress distribution
єc
a=β1c
Cross‐section
c
Strain distribution
M
x
50
50
50
50
50
50
200
F1
F1'
єf
F2
F3
F2'
F3'
F4'
F5'
F6'
F7'
F8'
F9'
F10
'
141.
4
141.
4
141.
4
141.
4
141.
4
141.
4
141.
4
141.
4
141.
4
113.
7
113.
7

197
c
c13500035.04
c
c14000035.05
c
c14500035.06
c
c 5.1130035.0'
1
c
c 94.2540035.0'
2
c
c38.3960035.0'
3
c
c82.5370035.0'
4
c
c26.6790035.0'
5
c
c7.8200035.0'
6
c
c14.9620035.0'
7
c
c58.11030035.0'
8
c
c12450035.0'
9
c
c46.13860035.0'
10
Compression force in concrete (Cc) = /cf bc
Cc = 0.80 × 0.89 × 34 × 200 × C = 4841.60 c
Compression force in reinforcement (Cf) = fff AE + 707.0' fff AE
Cf = 3.713106550
0035.0 3
c
c + 3.7121065
1000035.0 3
c
c +
3.7131065150
0035.0 3
c
c+
707.03.71410655.113
0035.0 3
c
c +
707.03.714106594.254
0035.0 3
c
c
Tension force in reinforcement (Tf) = fff AE + 707.0' fff AE
Tf = 33.7110651350
0035.0 3
c
c + 23.711065
14000035.0 3
c
c +
33.7110651450
0035.0 3
c
c +
707.043.71106538.396
0035.0 3
c
c+
707.043.71106582.537
0035.0 3
c
c+

198 Appendix
707.043.71106526.679
0035.0 3
c
c+
707.043.7110657.820
0035.0 3
c
c +
707.043.71106514.962
0035.0 3
c
c+
707.043.71106558.1103
0035.0 3
c
c+
707.043.7110651245
0035.0 3
c
c +
707.043.71106546.1386
0035.0 3
c
c
Apply the first equilibrium equation as follows:
ffc TCC
c = 273.65 mm < 396.5 mm as assumed, back substitute to calculate the forces in FRP bars
and concrete.
Forces in Longitudinal FRP Bars
F1 = 39.78 kN (Comp.), F2 = 20.60 kN (Comp.), F3 = 22.01 kN (Comp.), F4 = 191.23 kN
(Ten.), F5 = 133.40 kN (Ten.), F6 = 209 kN (Ten.)
Forces in Diagonal FRP Bars
F1’ = 26.83 kN (Comp.), F2
’ = 3.14 kN (Comp.), F3’ = 20.55 kN (Ten.), F4
’ = 44.23 kN (Ten.),
F5’ = 67.92 kN (Ten.), F6
’ = 92.11 kN (Ten.), F7’ = 115.29 kN (Ten.), F8
’ = 138.97 kN (Ten.),
F9’ = 230.07 kN (Ten.), F10
’ = 186.35 kN (Ten.)
Force in Concrete
Cc = 1316.80 kN
Apply the second equilibrium equation by taking the moment about the extreme compression
fiber.

199
12
n
u c si si i
aM C c A f c x
Mu = 1540 KN.m
Flexural strength (Vf) = kNSpanShear
Mu 60455.2
1540
Confined Section
The measured concrete compressive strain was 0.009 (Figure 4.13).
Based on strain compatibility, the strain in reinforcement can be obtained as follows:
c
c 25009.01
c
c 75009.02
c
c 125009.03
c
c1325009.04
c
c1375009.05
c
c1425009.06
c
c 50.88009.0'
1
c
c 94.229009.0'
2
c
c 39.371009.0'
3
c
c83.512009.0'
4
c
c27.654009.0'
5
c
c71.795009.0'
6
c
c16.937009.0'
7
c
c6.1078009.0'
8
c
c1220009.0'
9
c
c48.1361009.0'
10
Compression force in concrete (Cc) = /cf bc
Cc = 0.79 × 0.87 × 40 × 200 × C = 5498.4 c
Compression force in reinforcement (Cf) = fff AE + 707.0' fff AE
Cf = 3.713106525
009.0 3
c
c + 3.7121065
75009.0 3
c
c +
3.7131065125
009.0 3
c
c+ 707.03.7141065
5.88009.0 3
c
c +

200 Appendix
707.03.712106594.229
009.0 3
c
c+
707.03.714106539.371
009.0 3
c
c
Tension force in reinforcement (Tf) = fff AE + 707.0' fff AE
Tf = 33.7110651325
009.0 3
c
c + 23.711065
1375009.0 3
c
c +
33.7110651425
009.0 3
c
c +
707.043.71106583.512
009.0 3
c
c+
707.043.71106527.654
009.0 3
c
c+
707.043.71106571.795
009.0 3
c
c +
707.043.71106516.937
009.0 3
c
c+
707.043.7110656.1078
009.0 3
c
c+
707.043.7110651220
009.0 3
c
c +
707.043.71106548.1361
009.0 3
c
c
Apply the first equilibrium equation as follows:
ffc TCC
c = 377.34 mm
Forces in Longitudinal FRP Bars
F1 = 116.84 kN (Comp.), F2 = 66.84 kN (Comp.), F3 = 83.86 kN (Comp.), F4 = 314.25 kN
(Ten.), F4 = 220.56 kN (Ten.), F4 = 347.41 kN (Ten.)

201
Forces in Diagonal FRP Bars
F1’ = 90.23 kN (Comp.), F2
’ = 46.03 kN (Comp.), F3’ = 1.82 kN (Comp.), F4
’ = 42.37 kN
(Ten.), F5’ = 86.58 kN (Ten.), F6
’ = 130.78 kN (Ten.), F7’ = 174.98 kN (Ten.), F8
’ = 219.18 kN
(Ten.), F9’ = 372.53 kN (Ten.), F10
’ = 307.58 kN (Ten.)
Force Concrete
Cc = 1814.42 kN
Apply the second equilibrium equation by taking the moment about the extreme compression
fiber.
12
n
u c si si i
aM C c A f c x
Mu = 2343 KN.m
Flexural strength (Vf) = kNSpanShear
Mu 91955.2
2343
1.4.3. Shear Strength
s
dfAVV vfuvf
sfr sincotcot
18514.141
45sin)45cot60(cot120013726.1421
sfr VV kN
1.4.4. Sliding Strength
fyvscs fcv cos
47.9707.013721500200
3.7140125.0
sv MPa
2841150020047.9 wwss lbvV kN
1.5. Specimen G4
1.5.1. Material and Sectional Properties
Concrete Properties
- f c' 39 MPa 0.1c

202 Appendix
- 79.00015.085.0 '1 cf 87.00025.097.0 '
1 cf
Reinforcement Properties
- longitudinal bars: No. 10 (ffu = 1372 MPa, Ef = 65 GPa, Af = 71.3 mm2)
- Horizontal bars: No. 13 (for straight portions: ffu = 1020 MPa, Ef = 50 GPa, Af = 127
mm2; for bent portions: ffu = 459 MPa)
Cross Section Properties
- Thickness = 200 mm
- Length = 1500 mm
- Shear Span = 2550 mm
1.5.2. Flexural Strength
Unconfined Section
Flexural strength = 553 kN (the calculation was similar to specimen G4-80; however, the
effect of sliding reinforcement was removed))
Confined Section
Flexural strength = 776 kN (the calculation was conducted based on the measured concrete
compressive strain, 0.0078 as shown in Figure 4.13)
1.5.3. Shear Strength
895 sfr VV kN (equal to G4-80’s shear strength)
1.5.4. Sliding Strength
75sV kN (since there is no sliding reinforcement was used, all resistance should be
attributed to the cohesion stress only).