Embed Size (px)
Citation preview
ASSESSMENT OF SOLAR ELECTRICITY POTENTIALS IN NORTH AFRICABASED ON SATELLITE DATA AND A GEOGRAPHIC INFORMATION SYSTEM
Hartmut Broesamle†, Hermann Mannstein+, Christoph Schillings*†‡and Franz Trieb*
+Institute of Atmospheric Physics *Institute of Technical Thermodynamics †NEVAG / Enersys GmbHDLR Oberpfaffenhofen DLR Stuttgart Rheingaustr. 184D-82234 Weßling, Germany Pfaffenwaldring 38-40 D-65203 Wiesbaden
D-70569 Stuttgart, Germany
Abstract
Solar thermal power plants will provide a major share of the renewable energy sources needed in the future. STEPS, anEvaluation system for Solar Thermal Power Stations, was designed to calculate the performance of such power stationsas function of direct solar radiation, geographical conditions (land slope, land cover, distance from cooling water re-sources, etc.), infrastructure (pipelines, electricity grids, streets etc.) and the configuration and performance of a selectedsolar thermal power plant concept. A cloud index derived from METEOSAT satellite images is used to calculate thedirect solar radiation resource. A geographic information system (GIS) is used to process all the parameters for siteassessment. In order to demonstrate the concept, an analysis of Northern Africa was performed with STEPS providing aranking of sites with respect to the potential and cost of solar thermal electricity for a particular power plant configura-tion. Results were obtained with high spatial and temporal resolution.
Keywords
Solar electricity cost, geographic information system, solar energy, North Africa, solar radiation
Introduction
Solar thermal power plants use concentrated solar radiation in order to generate high pressure steam forelectricity generation in conventional steam turbines. Because fuel is substituted by solar collectors, an addi-tional investment and additional space at the plant site is required. The evaluation tool STEPS allows theselection and ranking of sites for solar thermal power plant construction, analysing a large region, country oreven a continent (2). Among others, the following services can be provided by STEPS:• Maps of the direct normal irradiation (DNI) resource in high spatial and temporal resolution (best reso-
lution: 2.5 km x 2.5 km, hourly mean values).• Assessment of the technical and economic potential of solar power generation in a defined region.• Ranking and selection of sites for the construction of solar thermal power stations.• Providing the basis for solar power build out scenarios.• Sensitivity analysis of the performance of solar thermal power stations regarding site conditions.
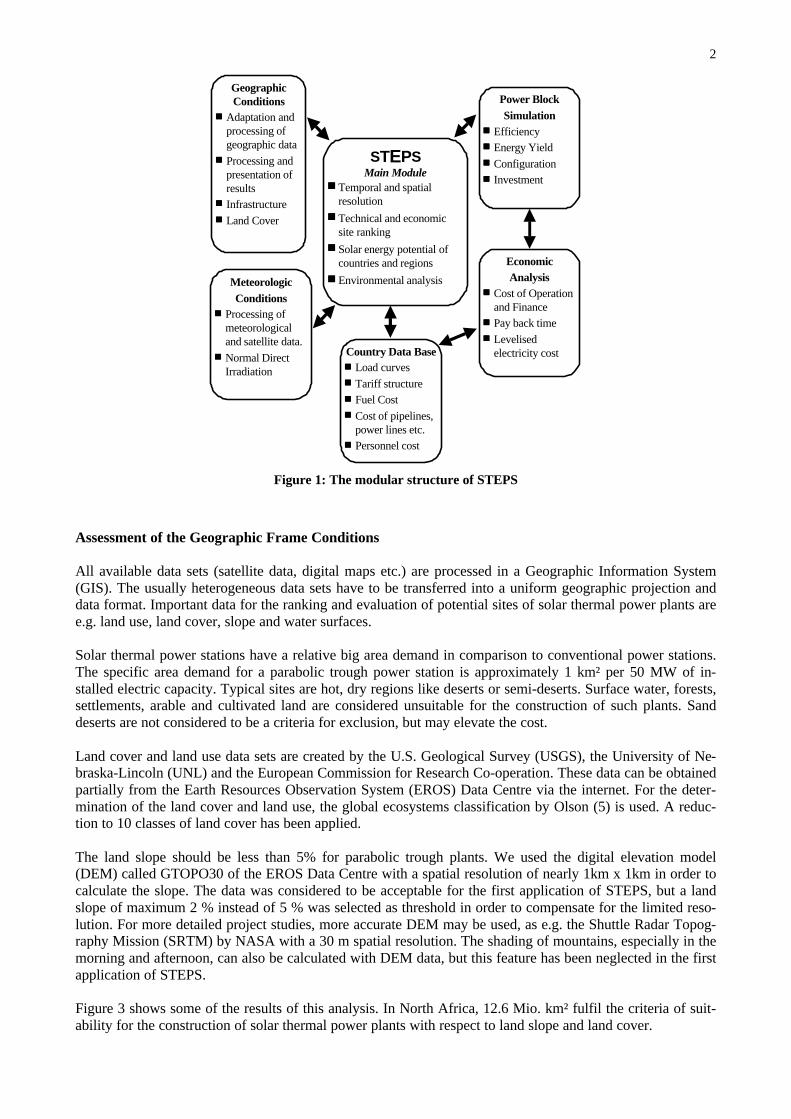
STEPS has a clear modular structure (Figure 1). The main module defines the interaction of all other mod-ules. Temporal and spatial resolution can be varied according to specific needs. Results are typically shownas maps using a geographic information system (GIS). The first application of STEPS was the estimation ofthe potential and present cost of solar thermal power plants in North Africa. The following topics weretreated within the study:• Determination of the geographical and meteorological frame conditions.• Determination of all suitable sites for the construction of solar thermal power plants.• Development of a map of the direct normal irradiation (DNI) for North Africa.• Calculation of the solar electricity yield per km² of land.• Calculation of power generation costs per kWh.
The procedure and the results of this analysis are described in the following.
‡ former affiliation: Geographical Institutes of the University of Bonn, D-53115 BonnCorresponding author e-mail address: [email protected]
2
GeographicConditions
nn Adaptation andprocessing ofgeographic data
nn Processing andpresentation ofresults
nn Infrastructurenn Land Cover
MeteorologicConditions
nn Processing ofmeteorologicaland satellite data.
nn Normal DirectIrradiation
Power BlockSimulation
nn Efficiencynn Energy Yieldnn Configurationnn Investment
EconomicAnalysis
nn Cost of Operationand Finance
nn Pay back timenn Levelised
electricity cost
STEPSMain Module
nn Temporal and spatialresolutionnn Technical and economic
site rankingnn Solar energy potential of
countries and regions
nn Environmental analysis
Country Data Basenn Load curvesnn Tariff structurenn Fuel Costnn Cost of pipelines,
power lines etc.nn Personnel cost
Figure 1: The modular structure of STEPS
Assessment of the Geographic Frame Conditions
All available data sets (satellite data, digital maps etc.) are processed in a Geographic Information System(GIS). The usually heterogeneous data sets have to be transferred into a uniform geographic projection anddata format. Important data for the ranking and evaluation of potential sites of solar thermal power plants aree.g. land use, land cover, slope and water surfaces.
Solar thermal power stations have a relative big area demand in comparison to conventional power stations.The specific area demand for a parabolic trough power station is approximately 1 km² per 50 MW of in-stalled electric capacity. Typical sites are hot, dry regions like deserts or semi-deserts. Surface water, forests,settlements, arable and cultivated land are considered unsuitable for the construction of such plants. Sanddeserts are not considered to be a criteria for exclusion, but may elevate the cost.
Land cover and land use data sets are created by the U.S. Geological Survey (USGS), the University of Ne-braska-Lincoln (UNL) and the European Commission for Research Co-operation. These data can be obtainedpartially from the Earth Resources Observation System (EROS) Data Centre via the internet. For the deter-mination of the land cover and land use, the global ecosystems classification by Olson (5) is used. A reduc-tion to 10 classes of land cover has been applied.
The land slope should be less than 5% for parabolic trough plants. We used the digital elevation model(DEM) called GTOPO30 of the EROS Data Centre with a spatial resolution of nearly 1km x 1km in order tocalculate the slope. The data was considered to be acceptable for the first application of STEPS, but a landslope of maximum 2 % instead of 5 % was selected as threshold in order to compensate for the limited reso-lution. For more detailed project studies, more accurate DEM may be used, as e.g. the Shuttle Radar Topog-raphy Mission (SRTM) by NASA with a 30 m spatial resolution. The shading of mountains, especially in themorning and afternoon, can also be calculated with DEM data, but this feature has been neglected in the firstapplication of STEPS.
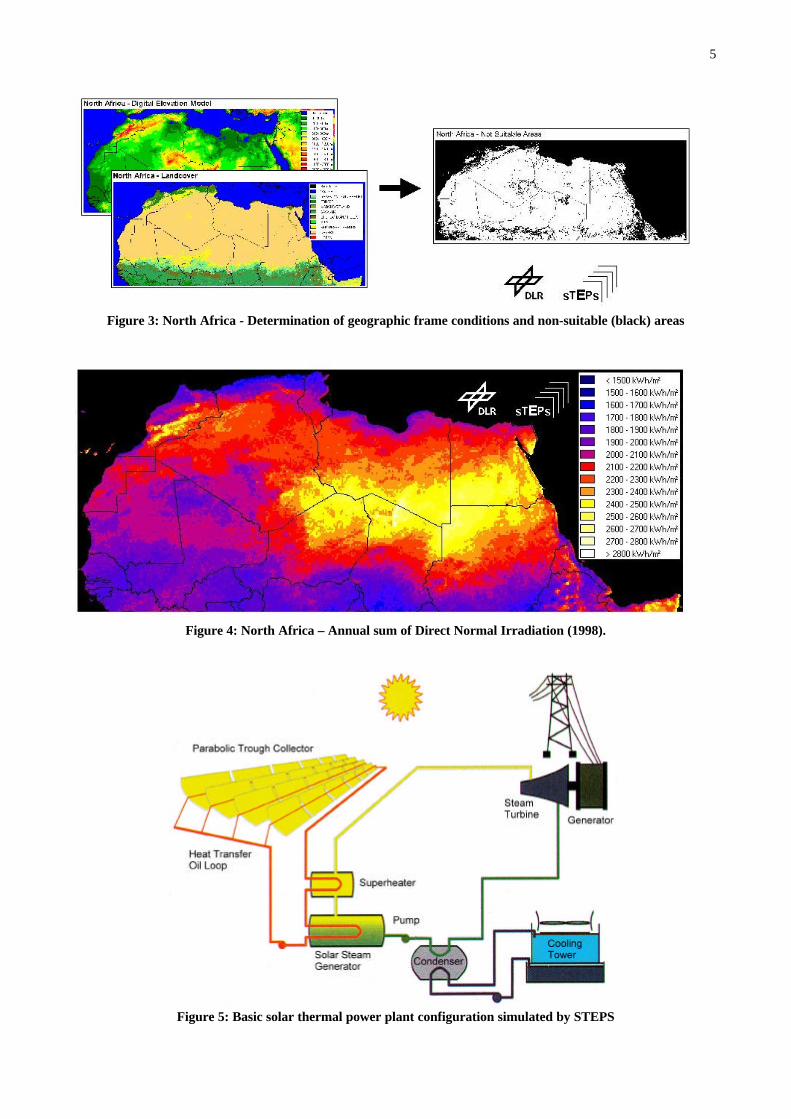
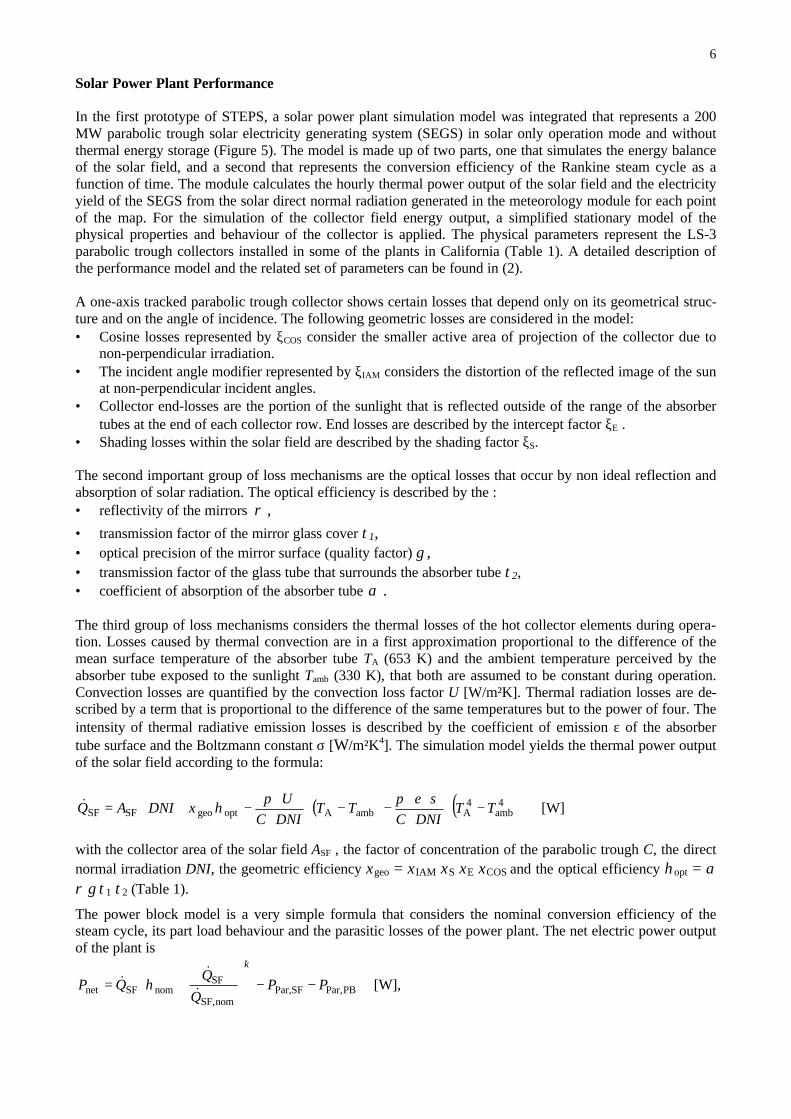
Figure 3 shows some of the results of this analysis. In North Africa, 12.6 Mio. km² fulfil the criteria of suit-ability for the construction of solar thermal power plants with respect to land slope and land cover.
3
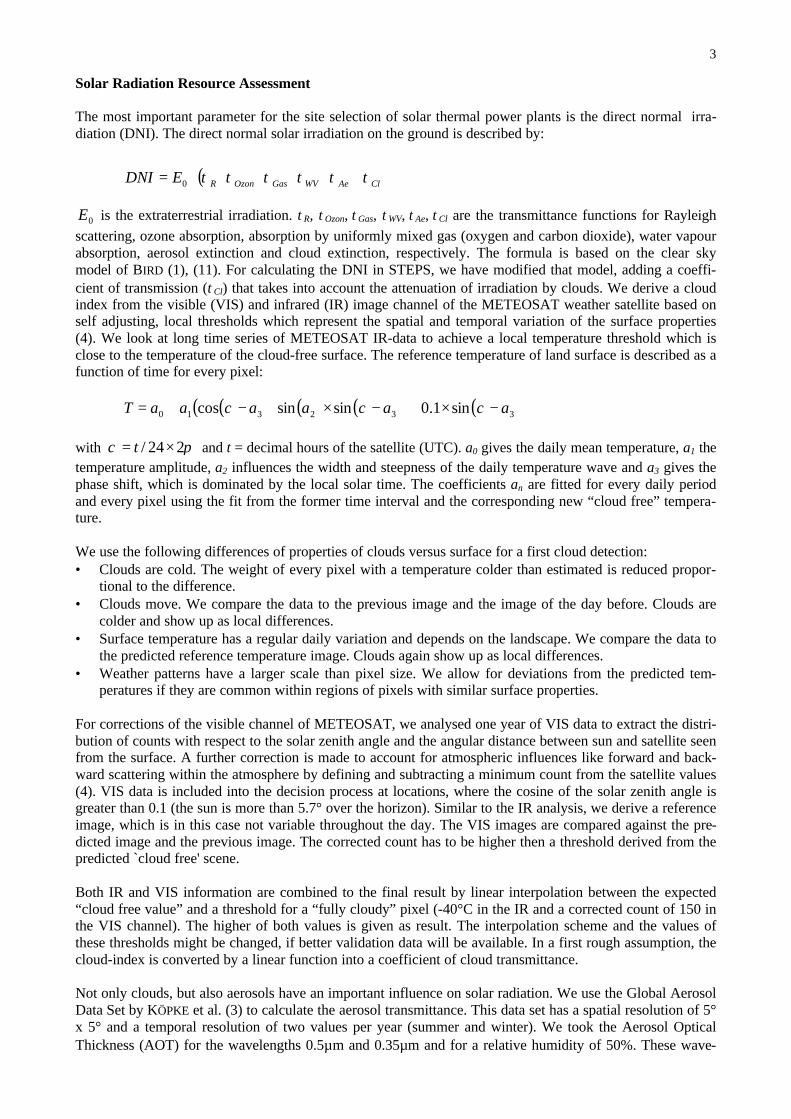
Solar Radiation Resource Assessment
The most important parameter for the site selection of solar thermal power plants is the direct normal irra-diation (DNI). The direct normal solar irradiation on the ground is described by:
( ) ClAeWVGasOzonREDNI ττττττ ⋅⋅⋅⋅⋅⋅= 0
0E is the extraterrestrial irradiation. τR, τOzon, τGas, τWV, τAe, τCl are the transmittance functions for Rayleigh
scattering, ozone absorption, absorption by uniformly mixed gas (oxygen and carbon dioxide), water vapourabsorption, aerosol extinction and cloud extinction, respectively. The formula is based on the clear skymodel of BIRD (1), (11). For calculating the DNI in STEPS, we have modified that model, adding a coeffi-cient of transmission (τCl) that takes into account the attenuation of irradiation by clouds. We derive a cloudindex from the visible (VIS) and infrared (IR) image channel of the METEOSAT weather satellite based onself adjusting, local thresholds which represent the spatial and temporal variation of the surface properties(4). We look at long time series of METEOSAT IR-data to achieve a local temperature threshold which isclose to the temperature of the cloud-free surface. The reference temperature of land surface is described as afunction of time for every pixel:
( ) ( )( ) ( )( )332310 sin1.0sinsincos aaaaaaT −×+−×+−+= χχχ
with πχ 224/ ×= t and t = decimal hours of the satellite (UTC). a0 gives the daily mean temperature, a1 thetemperature amplitude, a2 influences the width and steepness of the daily temperature wave and a3 gives thephase shift, which is dominated by the local solar time. The coefficients an are fitted for every daily periodand every pixel using the fit from the former time interval and the corresponding new “cloud free” tempera-ture.
We use the following differences of properties of clouds versus surface for a first cloud detection:• Clouds are cold. The weight of every pixel with a temperature colder than estimated is reduced propor-
tional to the difference.• Clouds move. We compare the data to the previous image and the image of the day before. Clouds are
colder and show up as local differences.• Surface temperature has a regular daily variation and depends on the landscape. We compare the data to
the predicted reference temperature image. Clouds again show up as local differences.• Weather patterns have a larger scale than pixel size. We allow for deviations from the predicted tem-
peratures if they are common within regions of pixels with similar surface properties.
For corrections of the visible channel of METEOSAT, we analysed one year of VIS data to extract the distri-bution of counts with respect to the solar zenith angle and the angular distance between sun and satellite seenfrom the surface. A further correction is made to account for atmospheric influences like forward and back-ward scattering within the atmosphere by defining and subtracting a minimum count from the satellite values(4). VIS data is included into the decision process at locations, where the cosine of the solar zenith angle isgreater than 0.1 (the sun is more than 5.7° over the horizon). Similar to the IR analysis, we derive a referenceimage, which is in this case not variable throughout the day. The VIS images are compared against the pre-dicted image and the previous image. The corrected count has to be higher then a threshold derived from thepredicted `cloud free' scene.
Both IR and VIS information are combined to the final result by linear interpolation between the expected“cloud free value” and a threshold for a “fully cloudy” pixel (-40°C in the IR and a corrected count of 150 inthe VIS channel). The higher of both values is given as result. The interpolation scheme and the values ofthese thresholds might be changed, if better validation data will be available. In a first rough assumption, thecloud-index is converted by a linear function into a coefficient of cloud transmittance.
Not only clouds, but also aerosols have an important influence on solar radiation. We use the Global AerosolData Set by KÖPKE et al. (3) to calculate the aerosol transmittance. This data set has a spatial resolution of 5°x 5° and a temporal resolution of two values per year (summer and winter). We took the Aerosol OpticalThickness (AOT) for the wavelengths 0.5µm and 0.35µm and for a relative humidity of 50%. These wave-
4
lengths are required by the BIRD aerosol transmittance function. We extended the summer values from Juneuntil November, the winter values from December until May (10).
The low resolution of the available aerosol data has been considered critical for our application. Therefore,aerosol transmittances were selected considering only those values relevant for the main areas of interest(deserts and semi-deserts). Furthermore, aerosol transmittance values were reduced by 20 % for every 1000meters of altitude, taking into consideration the reduced atmospheric turbidity at elevated sites. Values forwater vapour and ozone are taken from the NASA Water Vapour Project (NVAP) and the NASA TotalOzone Mapping Spectrometer project (TOMS), respectively.
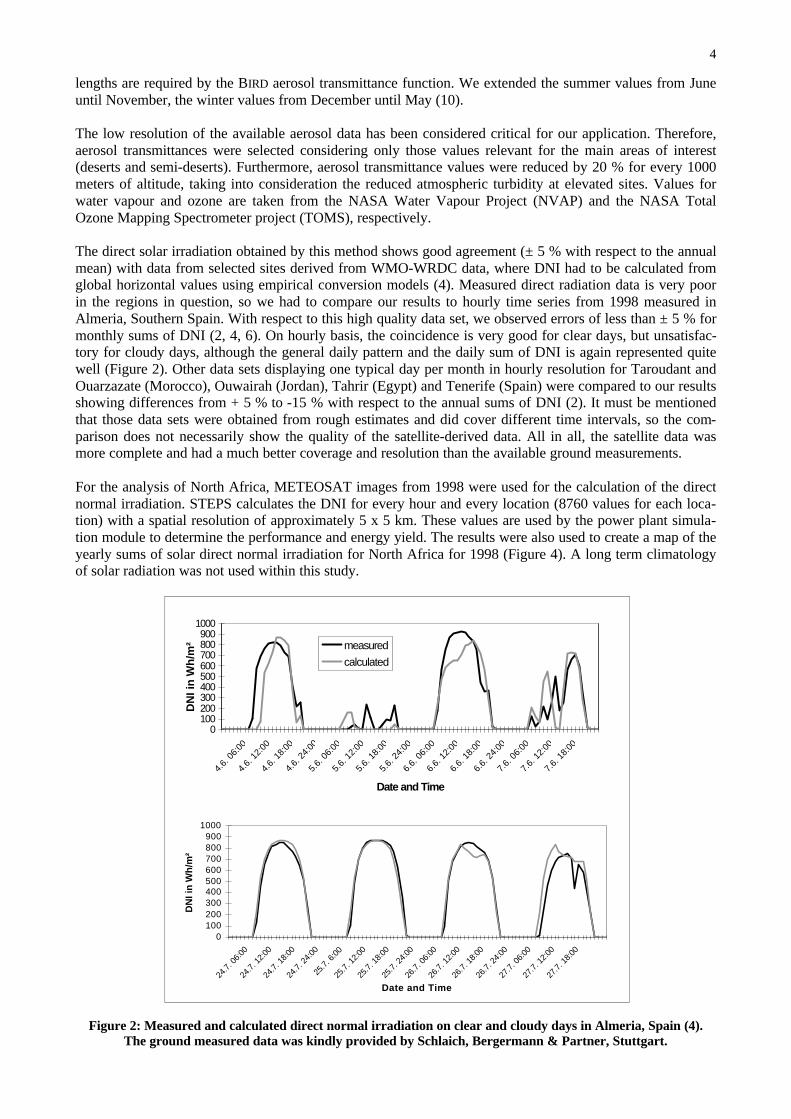
The direct solar irradiation obtained by this method shows good agreement (± 5 % with respect to the annualmean) with data from selected sites derived from WMO-WRDC data, where DNI had to be calculated fromglobal horizontal values using empirical conversion models (4). Measured direct radiation data is very poorin the regions in question, so we had to compare our results to hourly time series from 1998 measured inAlmeria, Southern Spain. With respect to this high quality data set, we observed errors of less than ± 5 % formonthly sums of DNI (2, 4, 6). On hourly basis, the coincidence is very good for clear days, but unsatisfac-tory for cloudy days, although the general daily pattern and the daily sum of DNI is again represented quitewell (Figure 2). Other data sets displaying one typical day per month in hourly resolution for Taroudant andOuarzazate (Morocco), Ouwairah (Jordan), Tahrir (Egypt) and Tenerife (Spain) were compared to our resultsshowing differences from + 5 % to -15 % with respect to the annual sums of DNI (2). It must be mentionedthat those data sets were obtained from rough estimates and did cover different time intervals, so the com-parison does not necessarily show the quality of the satellite-derived data. All in all, the satellite data wasmore complete and had a much better coverage and resolution than the available ground measurements.
For the analysis of North Africa, METEOSAT images from 1998 were used for the calculation of the directnormal irradiation. STEPS calculates the DNI for every hour and every location (8760 values for each loca-tion) with a spatial resolution of approximately 5 x 5 km. These values are used by the power plant simula-tion module to determine the performance and energy yield. The results were also used to create a map of theyearly sums of solar direct normal irradiation for North Africa for 1998 (Figure 4). A long term climatologyof solar radiation was not used within this study.
0100200300400500600700800900
1000
4.6.
06:
00
4.6.
12:
00
4.6.
18:
00
4.6
. 24:
00
5.6.
06:
00
5.6.
12:
00
5.6.
18:
00
5.6.
24:
00
6.6.
06:
00
6.6.
12:
00
6.6.
18:
00
6.6.
24:
00
7.6.
06:
00
7.6.
12:
00
7.6.
18:
00
Date and Time
DN
I in
Wh
/m² measured
calculated
0100200300400500600700800900
1000
24.7.
06:00
24.7.
12:00
24.7.
18:00
24.7.
24:00
25.7.
6:00
25.7.
12:00
25.7.
18:00
25.7.
24:00
26.7.
06:00
26.7.
12:00
26.7.
18:00
26.7.
24:00
27.7.
06:00
27.7.
12:00
27.7.
18:00
Date and Time
DN
I in
Wh
/m²
Figure 2: Measured and calculated direct normal irradiation on clear and cloudy days in Almeria, Spain (4).The ground measured data was kindly provided by Schlaich, Bergermann & Partner, Stuttgart.
5
Figure 3: North Africa - Determination of geographic frame conditions and non-suitable (black) areas
Figure 4: North Africa – Annual sum of Direct Normal Irradiation (1998).
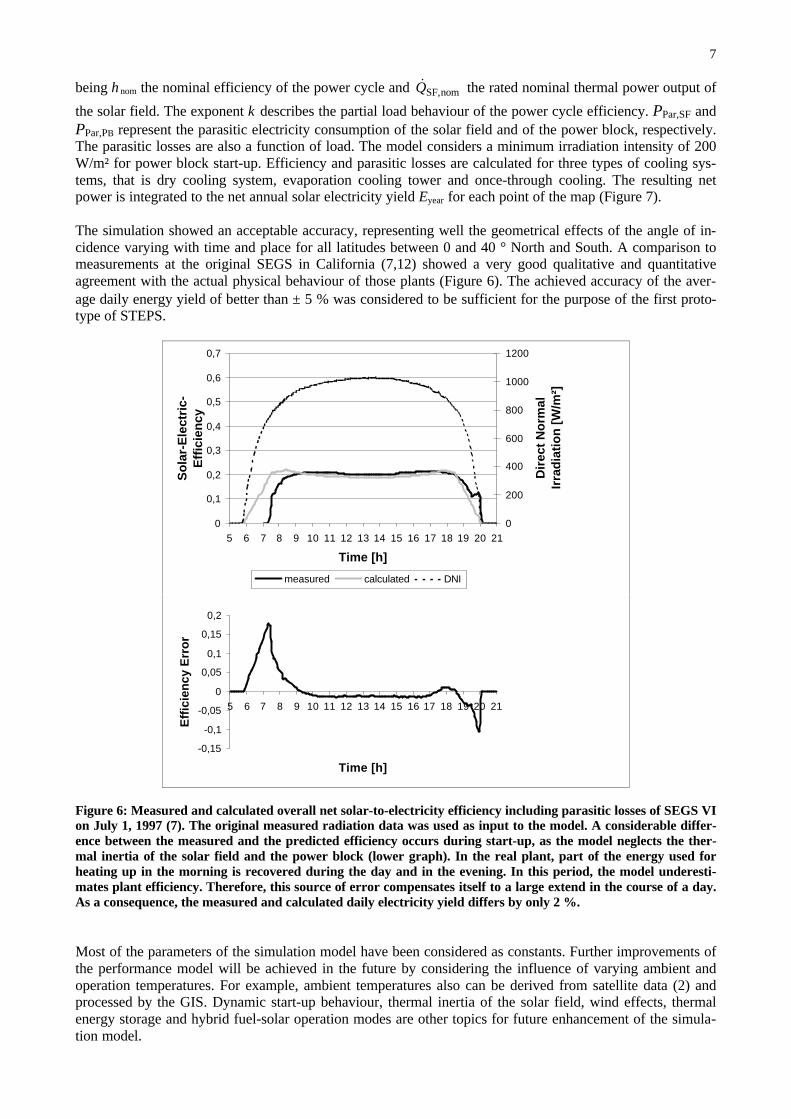
Figure 5: Basic solar thermal power plant configuration simulated by STEPS
6
Solar Power Plant Performance
In the first prototype of STEPS, a solar power plant simulation model was integrated that represents a 200MW parabolic trough solar electricity generating system (SEGS) in solar only operation mode and withoutthermal energy storage (Figure 5). The model is made up of two parts, one that simulates the energy balanceof the solar field, and a second that represents the conversion efficiency of the Rankine steam cycle as afunction of time. The module calculates the hourly thermal power output of the solar field and the electricityyield of the SEGS from the solar direct normal radiation generated in the meteorology module for each pointof the map. For the simulation of the collector field energy output, a simplified stationary model of thephysical properties and behaviour of the collector is applied. The physical parameters represent the LS-3parabolic trough collectors installed in some of the plants in California (Table 1). A detailed description ofthe performance model and the related set of parameters can be found in (2).
A one-axis tracked parabolic trough collector shows certain losses that depend only on its geometrical struc-ture and on the angle of incidence. The following geometric losses are considered in the model:• Cosine losses represented by ξCOS consider the smaller active area of projection of the collector due to
non-perpendicular irradiation.• The incident angle modifier represented by ξIAM considers the distortion of the reflected image of the sun
at non-perpendicular incident angles.• Collector end-losses are the portion of the sunlight that is reflected outside of the range of the absorber
tubes at the end of each collector row. End losses are described by the intercept factor ξE .• Shading losses within the solar field are described by the shading factor ξS.
The second important group of loss mechanisms are the optical losses that occur by non ideal reflection andabsorption of solar radiation. The optical efficiency is described by the :• reflectivity of the mirrors ρ ,
• transmission factor of the mirror glass cover τ1,• optical precision of the mirror surface (quality factor) γ ,• transmission factor of the glass tube that surrounds the absorber tube τ2,• coefficient of absorption of the absorber tube α .
The third group of loss mechanisms considers the thermal losses of the hot collector elements during opera-tion. Losses caused by thermal convection are in a first approximation proportional to the difference of themean surface temperature of the absorber tube TA (653 K) and the ambient temperature perceived by theabsorber tube exposed to the sunlight Tamb (330 K), that both are assumed to be constant during operation.Convection losses are quantified by the convection loss factor U [W/m²K]. Thermal radiation losses are de-scribed by a term that is proportional to the difference of the same temperatures but to the power of four. Theintensity of thermal radiative emission losses is described by the coefficient of emission ε of the absorbertube surface and the Boltzmann constant σ [W/m²K4]. The simulation model yields the thermal power outputof the solar field according to the formula:
( ) ( )
−⋅
⋅⋅⋅
−−⋅⋅
⋅−⋅⋅= ⋅
4amb
4AambAoptgeoSFSF TT
DNICTT
DNIC
UDNIAQ
σεππηξ& [W]
with the collector area of the solar field ASF , the factor of concentration of the parabolic trough C, the directnormal irradiation DNI, the geometric efficiency ξgeo = ξIAM ξS ξE ξCOS and the optical efficiency ηopt = αρ γ τ1 τ2 (Table 1).
The power block model is a very simple formula that considers the nominal conversion efficiency of thesteam cycle, its part load behaviour and the parasitic losses of the power plant. The net electric power outputof the plant is
PBPar,SFPar,nomSF,
SFnomSFnet PP
Q
QQP −−
⋅⋅=
κ
η&
&& [W],
7
being ηnom the nominal efficiency of the power cycle and nomSF,Q& the rated nominal thermal power output of
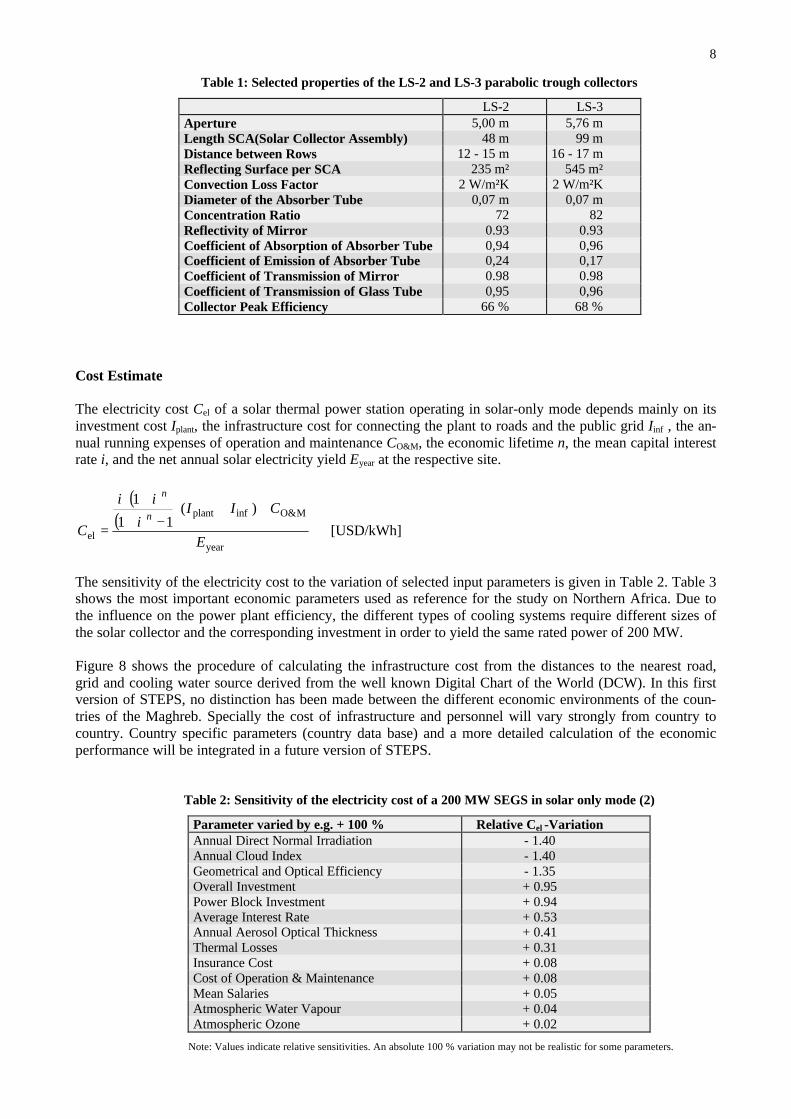
the solar field. The exponent κ describes the partial load behaviour of the power cycle efficiency. PPar,SF andPPar,PB represent the parasitic electricity consumption of the solar field and of the power block, respectively.The parasitic losses are also a function of load. The model considers a minimum irradiation intensity of 200W/m² for power block start-up. Efficiency and parasitic losses are calculated for three types of cooling sys-tems, that is dry cooling system, evaporation cooling tower and once-through cooling. The resulting netpower is integrated to the net annual solar electricity yield Eyear for each point of the map (Figure 7).
The simulation showed an acceptable accuracy, representing well the geometrical effects of the angle of in-cidence varying with time and place for all latitudes between 0 and 40 ° North and South. A comparison tomeasurements at the original SEGS in California (7,12) showed a very good qualitative and quantitativeagreement with the actual physical behaviour of those plants (Figure 6). The achieved accuracy of the aver-age daily energy yield of better than ± 5 % was considered to be sufficient for the purpose of the first proto-type of STEPS.
0
0,1
0,2
0,3
0,4
0,5
0,6
0,7
5 6 7 8 9 10 11 12 13 14 15 16 17 18 19 20 21
Time [h]
So
lar-
Ele
ctri
c-E
ffic
ien
cy
0
200
400
600
800
1000
1200
Dir
ect
No
rmal
Ir
rad
iati
on
[W
/m²]
measured calculated DNI
-0,15
-0,1
-0,05
0
0,05
0,1
0,15
0,2
5 6 7 8 9 10 11 12 13 14 15 16 17 18 19 20 21
Time [h]
Eff
icie
ncy
Err
or
Figure 6: Measured and calculated overall net solar-to-electricity efficiency including parasitic losses of SEGS VIon July 1, 1997 (7). The original measured radiation data was used as input to the model. A considerable differ-ence between the measured and the predicted efficiency occurs during start-up, as the model neglects the ther-mal inertia of the solar field and the power block (lower graph). In the real plant, part of the energy used forheating up in the morning is recovered during the day and in the evening. In this period, the model underesti-mates plant efficiency. Therefore, this source of error compensates itself to a large extend in the course of a day.As a consequence, the measured and calculated daily electricity yield differs by only 2 %.
Most of the parameters of the simulation model have been considered as constants. Further improvements ofthe performance model will be achieved in the future by considering the influence of varying ambient andoperation temperatures. For example, ambient temperatures also can be derived from satellite data (2) andprocessed by the GIS. Dynamic start-up behaviour, thermal inertia of the solar field, wind effects, thermalenergy storage and hybrid fuel-solar operation modes are other topics for future enhancement of the simula-tion model.
8
Table 1: Selected properties of the LS-2 and LS-3 parabolic trough collectors
LS-2 LS-3Aperture 5,00 m 5,76 mLength SCA(Solar Collector Assembly) 48 m 99 mDistance between Rows 12 - 15 m 16 - 17 mReflecting Surface per SCA 235 m² 545 m²Convection Loss Factor 2 W/m²K 2 W/m²KDiameter of the Absorber Tube 0,07 m 0,07 mConcentration Ratio 72 82Reflectivity of Mirror 0.93 0.93Coefficient of Absorption of Absorber Tube 0,94 0,96Coefficient of Emission of Absorber Tube 0,24 0,17Coefficient of Transmission of Mirror 0.98 0.98Coefficient of Transmission of Glass Tube 0,95 0,96Collector Peak Efficiency 66 % 68 %
Cost Estimate
The electricity cost Cel of a solar thermal power station operating in solar-only mode depends mainly on itsinvestment cost Iplant, the infrastructure cost for connecting the plant to roads and the public grid Iinf , the an-nual running expenses of operation and maintenance CO&M, the economic lifetime n, the mean capital interestrate i, and the net annual solar electricity yield Eyear at the respective site.
( )( )
year
M&Oinfplant
el
)(11
1
E
CIIi
ii
Cn
n
++⋅−+
+⋅
= [USD/kWh]
The sensitivity of the electricity cost to the variation of selected input parameters is given in Table 2. Table 3shows the most important economic parameters used as reference for the study on Northern Africa. Due tothe influence on the power plant efficiency, the different types of cooling systems require different sizes ofthe solar collector and the corresponding investment in order to yield the same rated power of 200 MW.
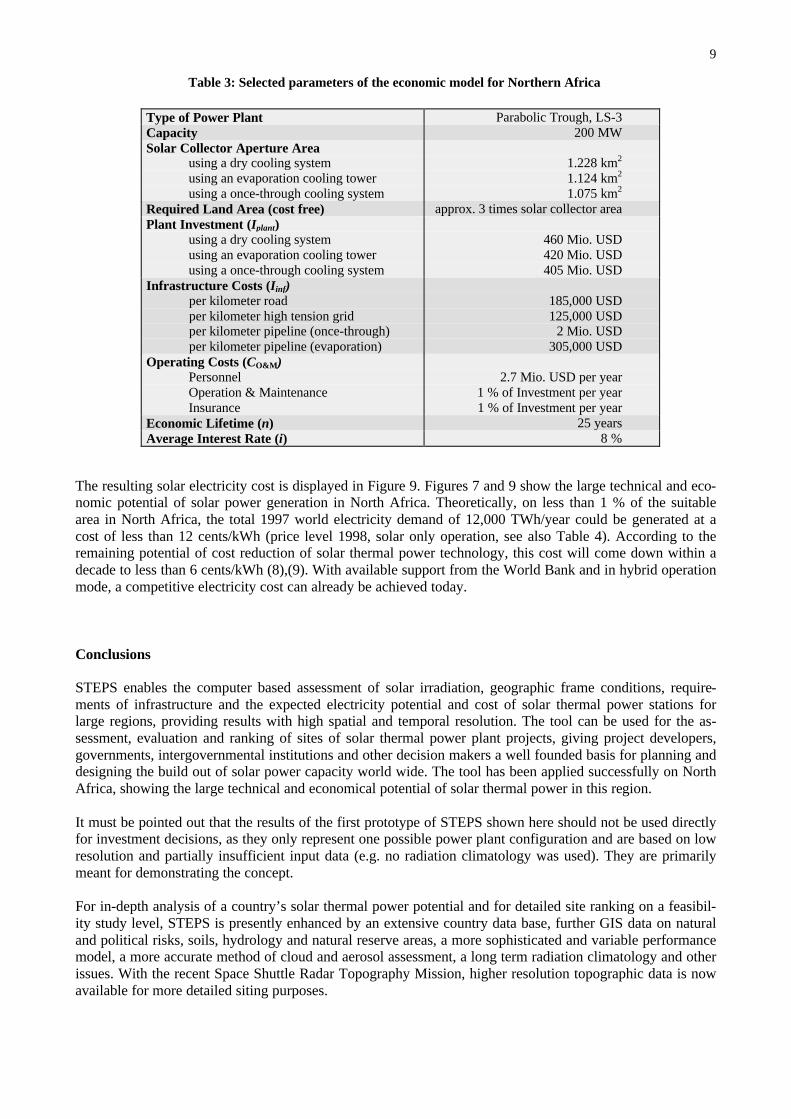
Figure 8 shows the procedure of calculating the infrastructure cost from the distances to the nearest road,grid and cooling water source derived from the well known Digital Chart of the World (DCW). In this firstversion of STEPS, no distinction has been made between the different economic environments of the coun-tries of the Maghreb. Specially the cost of infrastructure and personnel will vary strongly from country tocountry. Country specific parameters (country data base) and a more detailed calculation of the economicperformance will be integrated in a future version of STEPS.
Table 2: Sensitivity of the electricity cost of a 200 MW SEGS in solar only mode (2)
Parameter varied by e.g. + 100 % Relative Cel -VariationAnnual Direct Normal Irradiation - 1.40Annual Cloud Index - 1.40Geometrical and Optical Efficiency - 1.35Overall Investment + 0.95Power Block Investment + 0.94Average Interest Rate + 0.53Annual Aerosol Optical Thickness + 0.41Thermal Losses + 0.31Insurance Cost + 0.08Cost of Operation & Maintenance + 0.08Mean Salaries + 0.05Atmospheric Water Vapour + 0.04Atmospheric Ozone + 0.02
Note: Values indicate relative sensitivities. An absolute 100 % variation may not be realistic for some parameters.
9
Table 3: Selected parameters of the economic model for Northern Africa
Type of Power Plant Parabolic Trough, LS-3Capacity 200 MWSolar Collector Aperture Area
using a dry cooling systemusing an evaporation cooling towerusing a once-through cooling system
1.228 km2
1.124 km2
1.075 km2
Required Land Area (cost free) approx. 3 times solar collector areaPlant Investment (Iplant)
using a dry cooling systemusing an evaporation cooling towerusing a once-through cooling system
460 Mio. USD420 Mio. USD405 Mio. USD
Infrastructure Costs (Iinf)per kilometer roadper kilometer high tension gridper kilometer pipeline (once-through)per kilometer pipeline (evaporation)
185,000 USD125,000 USD
2 Mio. USD305,000 USD
Operating Costs (CO&M)PersonnelOperation & MaintenanceInsurance
2.7 Mio. USD per year1 % of Investment per year1 % of Investment per year
Economic Lifetime (n) 25 yearsAverage Interest Rate (i) 8 %
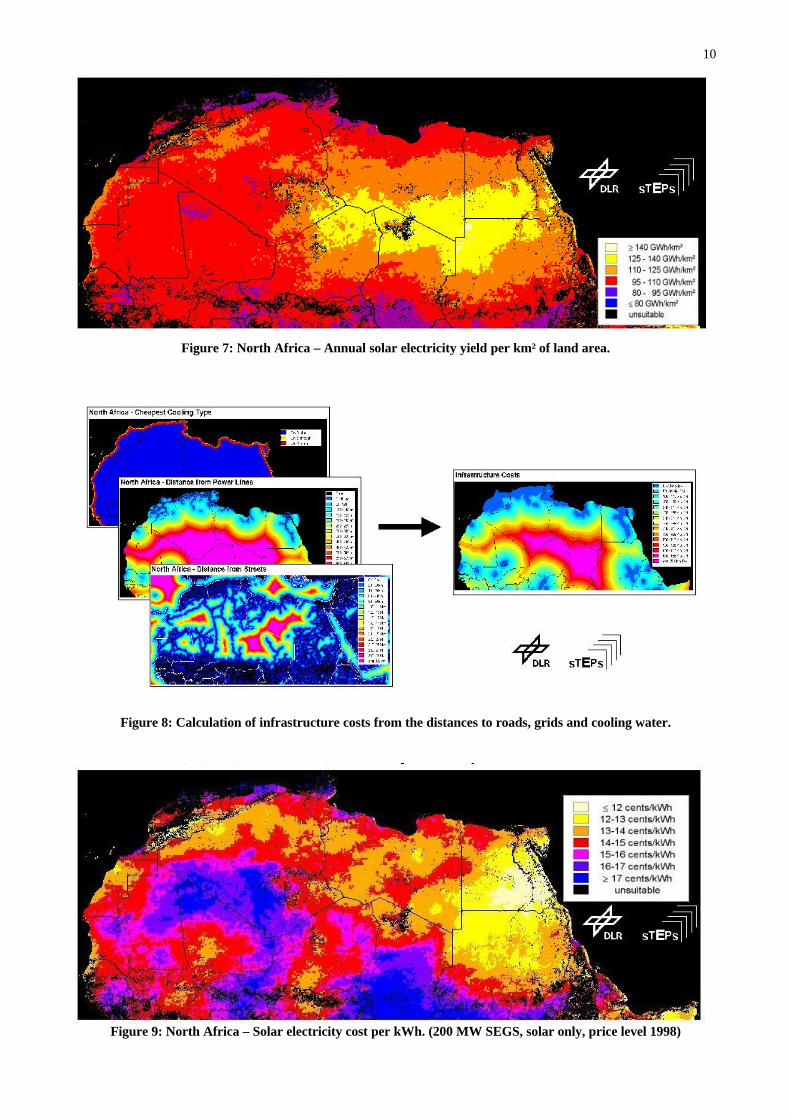
The resulting solar electricity cost is displayed in Figure 9. Figures 7 and 9 show the large technical and eco-nomic potential of solar power generation in North Africa. Theoretically, on less than 1 % of the suitablearea in North Africa, the total 1997 world electricity demand of 12,000 TWh/year could be generated at acost of less than 12 cents/kWh (price level 1998, solar only operation, see also Table 4). According to theremaining potential of cost reduction of solar thermal power technology, this cost will come down within adecade to less than 6 cents/kWh (8),(9). With available support from the World Bank and in hybrid operationmode, a competitive electricity cost can already be achieved today.
Conclusions
STEPS enables the computer based assessment of solar irradiation, geographic frame conditions, require-ments of infrastructure and the expected electricity potential and cost of solar thermal power stations forlarge regions, providing results with high spatial and temporal resolution. The tool can be used for the as-sessment, evaluation and ranking of sites of solar thermal power plant projects, giving project developers,governments, intergovernmental institutions and other decision makers a well founded basis for planning anddesigning the build out of solar power capacity world wide. The tool has been applied successfully on NorthAfrica, showing the large technical and economical potential of solar thermal power in this region.
It must be pointed out that the results of the first prototype of STEPS shown here should not be used directlyfor investment decisions, as they only represent one possible power plant configuration and are based on lowresolution and partially insufficient input data (e.g. no radiation climatology was used). They are primarilymeant for demonstrating the concept.
For in-depth analysis of a country’s solar thermal power potential and for detailed site ranking on a feasibil-ity study level, STEPS is presently enhanced by an extensive country data base, further GIS data on naturaland political risks, soils, hydrology and natural reserve areas, a more sophisticated and variable performancemodel, a more accurate method of cloud and aerosol assessment, a long term radiation climatology and otherissues. With the recent Space Shuttle Radar Topography Mission, higher resolution topographic data is nowavailable for more detailed siting purposes.
10
Figure 7: North Africa – Annual solar electricity yield per km² of land area.
Figure 8: Calculation of infrastructure costs from the distances to roads, grids and cooling water.
Figure 9: North Africa – Solar electricity cost per kWh. (200 MW SEGS, solar only, price level 1998)
11
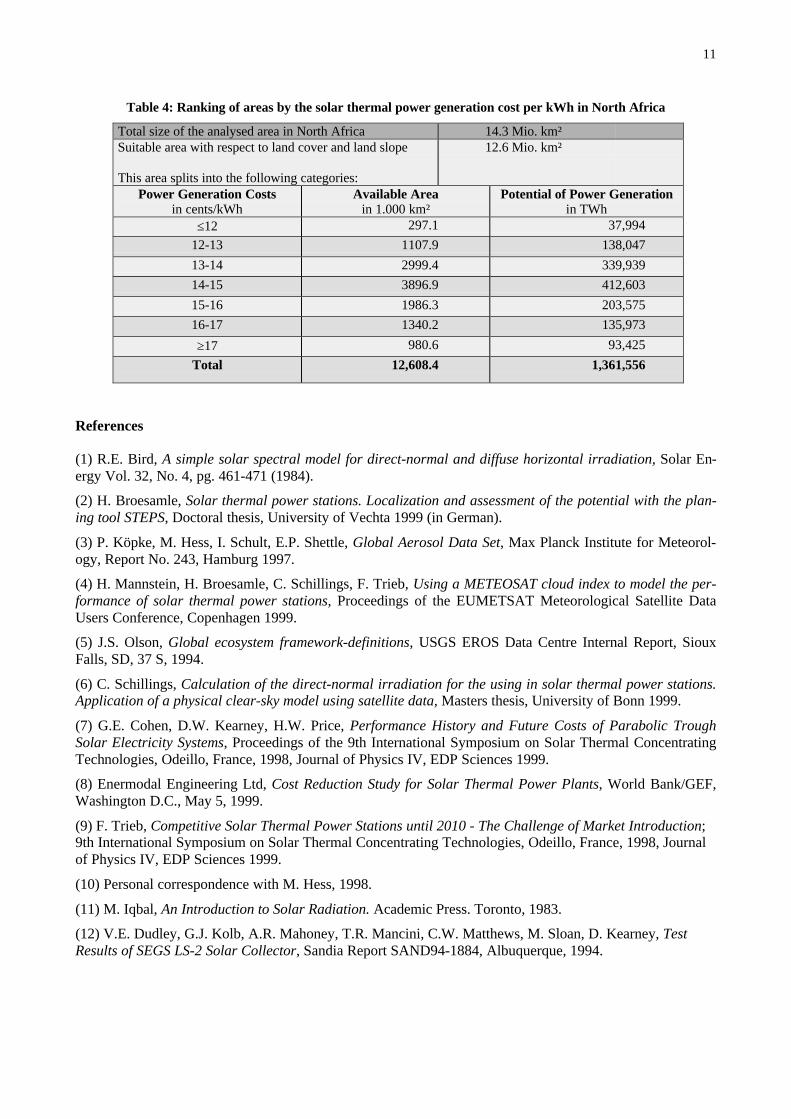
Table 4: Ranking of areas by the solar thermal power generation cost per kWh in North Africa
Total size of the analysed area in North Africa 14.3 Mio. km²Suitable area with respect to land cover and land slope
This area splits into the following categories:
12.6 Mio. km²
Power Generation Costsin cents/kWh
Available Areain 1.000 km²
Potential of Power Generationin TWh
≤12 297.1 37,994
12-13 1107.9 138,047
13-14 2999.4 339,939
14-15 3896.9 412,603
15-16 1986.3 203,575
16-17 1340.2 135,973
≥17 980.6 93,425
Total 12,608.4 1,361,556
References
(1) R.E. Bird, A simple solar spectral model for direct-normal and diffuse horizontal irradiation, Solar En-ergy Vol. 32, No. 4, pg. 461-471 (1984).
(2) H. Broesamle, Solar thermal power stations. Localization and assessment of the potential with the plan-ing tool STEPS, Doctoral thesis, University of Vechta 1999 (in German).
(3) P. Köpke, M. Hess, I. Schult, E.P. Shettle, Global Aerosol Data Set, Max Planck Institute for Meteorol-ogy, Report No. 243, Hamburg 1997.
(4) H. Mannstein, H. Broesamle, C. Schillings, F. Trieb, Using a METEOSAT cloud index to model the per-formance of solar thermal power stations, Proceedings of the EUMETSAT Meteorological Satellite DataUsers Conference, Copenhagen 1999.
(5) J.S. Olson, Global ecosystem framework-definitions, USGS EROS Data Centre Internal Report, SiouxFalls, SD, 37 S, 1994.
(6) C. Schillings, Calculation of the direct-normal irradiation for the using in solar thermal power stations.Application of a physical clear-sky model using satellite data, Masters thesis, University of Bonn 1999.
(7) G.E. Cohen, D.W. Kearney, H.W. Price, Performance History and Future Costs of Parabolic TroughSolar Electricity Systems, Proceedings of the 9th International Symposium on Solar Thermal ConcentratingTechnologies, Odeillo, France, 1998, Journal of Physics IV, EDP Sciences 1999.
(8) Enermodal Engineering Ltd, Cost Reduction Study for Solar Thermal Power Plants, World Bank/GEF,Washington D.C., May 5, 1999.
(9) F. Trieb, Competitive Solar Thermal Power Stations until 2010 - The Challenge of Market Introduction;9th International Symposium on Solar Thermal Concentrating Technologies, Odeillo, France, 1998, Journalof Physics IV, EDP Sciences 1999.
(10) Personal correspondence with M. Hess, 1998.
(11) M. Iqbal, An Introduction to Solar Radiation. Academic Press. Toronto, 1983.
(12) V.E. Dudley, G.J. Kolb, A.R. Mahoney, T.R. Mancini, C.W. Matthews, M. Sloan, D. Kearney, TestResults of SEGS LS-2 Solar Collector, Sandia Report SAND94-1884, Albuquerque, 1994.