Embed Size (px)
Citation preview
* Corresponding author: [email protected]
Assessment of soil erosion using two spatial approaches: RUSLE and SWAT Model
Soufiane Taia1, *, Lamia Erraioui1, Noella Claire Mbrenga1, Jamal Chao1, Bouabid El Mansouri1, Souad Haida1, and Kamal Taj-Eddine2 1 Laboratory of Geosciences of Natural Resources, Ibn Tofail University, BP. 133, Kenitra, Morocco 2 Dept.of Geology Faculty of science Semlalia University Caddi Ayad Marrakech, Morocco
Abstract. In this paper, we attempted to review the erosion in the Ouergha watershed by applying two spatial approaches. The Ouergha watershed has an area of around 7300 km² representing approximately 18.2% of the Sebou basin of which it is the main tributary. In order to develop the erosion map using the SWAT model, it was important to prepare a large spatial database describing basin proprieties, furthermore, the daily hydro-climatic data. This model integrates MUSLE equation for the estimation of specific degradation. In addition, the estimation of erosion through SWAT was consolidated by constructing an erosion mapping through RUSLE method. This method was applied following an approach based on the use of remote sensing data and GIS tools to produce the major factors involved in the erosive process and their integration into RUSLE. The results obtained, in cartographic form, make it possible to target areas that require priority action for a larger-scale analysis, with a view to finding appropriate solutions to fight against erosion and protect the natural environment. Soil degradation in the Ouergha watershed is around 27 ton/ha/year (SWAT_MUSLE) and 25 ton/ha/year (RUSLE). Average sediment yield was estimated for Al Wahda dam of 10.4 Million tons.
1 Introduction Morocco has a fairly diverse climate. From north to center, the climate is first sub-humid then semi-arid or arid, in the south it has a Saharan character. In the Ouergha Watershed, precipitation has inherited this diverse climate. This gives it a strong spatiotemporal irregularity of precipitation, from 1300 mm in the extreme north and center to about 600 mm in the south. Following stream shortages, the management of these resources has become essential in Morocco in order to support sustainable development from an environmental and economic standpoint.
The construction and monitoring of dams against drought is necessary for better management of water resources. However, the durability of these needed constructions rest on the problem of siltation. This natural phenomenon caused by water erosion is related to watershed characteristics in relations with topography, pedology, lithology, hydrology, vegetation cover, and human activities. Water erosion is increasing aggressively due to climate change effects and torrential rains during extreme events.
To quantify erosion Wischmeier and Smith developed the Universal Soil Loss Equation (USLE) model in 1965, based on the data collected from more than 10000 test plot-years across the US in 20 years [1].
A lot of efforts have been made by academic researchers in the last decades to developpe and improve the USLE model. Several models represent great
improvements, such the Modified Universal Soil Loss Equation (MUSLE) developed by [2], the Areal Nonpoint Source Watershed Environmental Resources Simulation. (ANSWERS) [3], the Guelph Model for evaluating the effects of Agriculture Management Systems on Erosion and Sedimentation (GAMES) [4], the Unit Stream Power – based Erosion Deposition (USPED) [5], and the Revised Universal Soil Loss Equation (RUSLE) [6].
In this study we attempt to estimate the erosion amount and its spatial distribution along the Ouergha Watershed. The RUSLE Model, MUSLE integrated in the physically based semi-distributed hydrological model (SWAT), are used. The Ouergha basin, the subject of this study, supplies the largest dam in the country. Modeling of this watershed by SWAT-MUSLE and RUSLE made it possible to assess the capacity of the models to contribute to the understanding of the erosion phenomena in this region.
2 Materials and methods
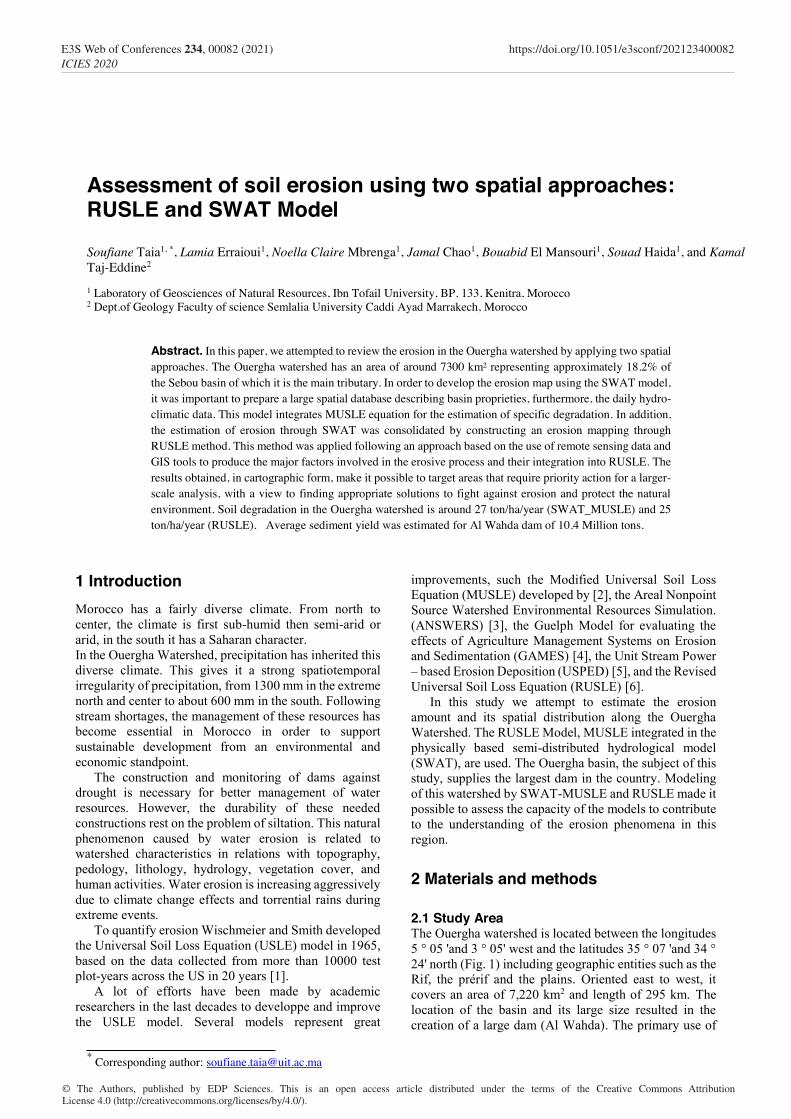
2.1 Study Area The Ouergha watershed is located between the longitudes 5 ° 05 'and 3 ° 05' west and the latitudes 35 ° 07 'and 34 ° 24' north (Fig. 1) including geographic entities such as the Rif, the prérif and the plains. Oriented east to west, it covers an area of 7,220 km2 and length of 295 km. The location of the basin and its large size resulted in the creation of a large dam (Al Wahda). The primary use of
E3S Web of Conferences 234, 00082 (2021) https://doi.org/10.1051/e3sconf/202123400082ICIES 2020
© The Authors, published by EDP Sciences. This is an open access article distributed under the terms of the Creative Commons Attribution License 4.0 (http://creativecommons.org/licenses/by/4.0/).
ICIES’2020
it, is to produce hydroelectricity. It was created in 1996 and it is 19 km long and has a full volume of 3800.106 𝑚𝑚3 for an area of 6190 km2.
Fig. 1. Location map of Ouergha watershed
2.2 Soil and Water Assessment Tool (SWAT)
2.2.1 Principles of SWAT Model
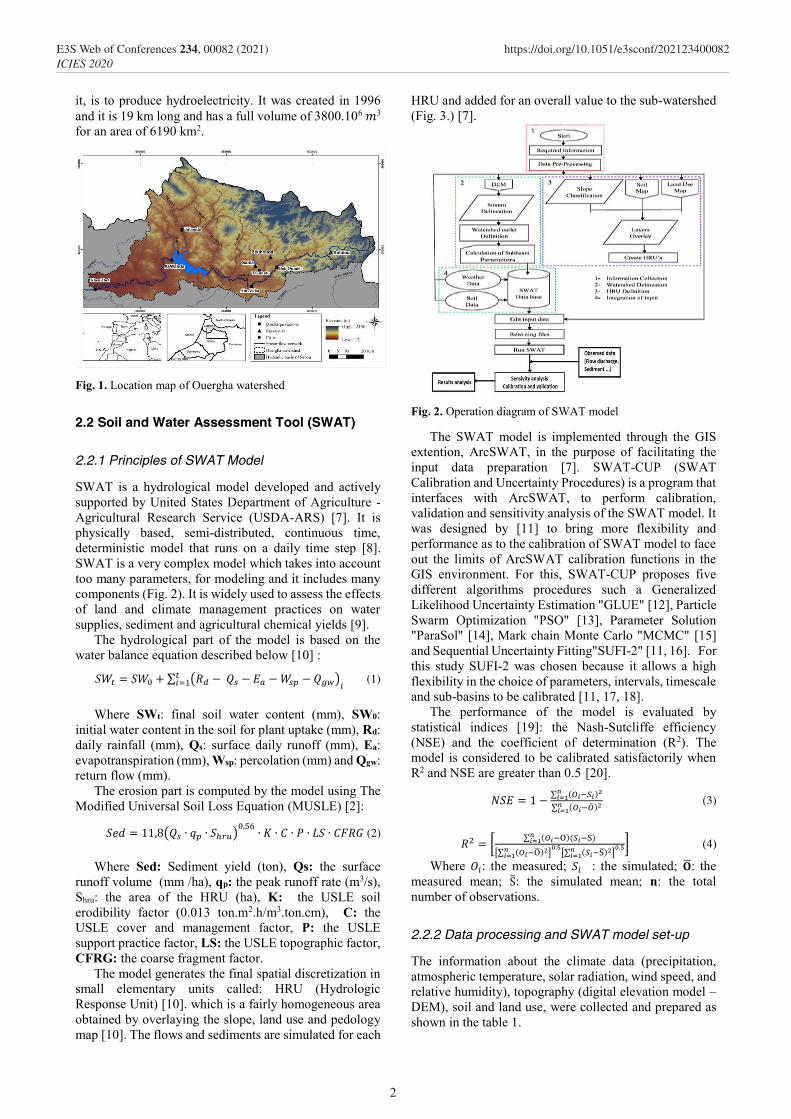
SWAT is a hydrological model developed and actively supported by United States Department of Agriculture - Agricultural Research Service (USDA-ARS) [7]. It is physically based, semi-distributed, continuous time, deterministic model that runs on a daily time step [8]. SWAT is a very complex model which takes into account too many parameters, for modeling and it includes many components (Fig. 2). It is widely used to assess the effects of land and climate management practices on water supplies, sediment and agricultural chemical yields [9].
The hydrological part of the model is based on the water balance equation described below [10] :
𝑆𝑆𝑆𝑆𝑡𝑡 = 𝑆𝑆𝑆𝑆0 + ∑ (𝑅𝑅𝑑𝑑 − 𝑄𝑄𝑠𝑠 − 𝐸𝐸𝑎𝑎 − 𝑆𝑆𝑠𝑠𝑠𝑠 − 𝑄𝑄𝑔𝑔𝑔𝑔)𝑖𝑖
𝑡𝑡𝑖𝑖=1 (1)
Where SWt: final soil water content (mm), SW0: initial water content in the soil for plant uptake (mm), Rd: daily rainfall (mm), Qs: surface daily runoff (mm), Ea: evapotranspiration (mm), Wsp: percolation (mm) and Qgw: return flow (mm).
The erosion part is computed by the model using The Modified Universal Soil Loss Equation (MUSLE) [2]:
𝑆𝑆𝑆𝑆𝑆𝑆 = 11,8(𝑄𝑄𝑠𝑠 ∙ 𝑞𝑞𝑠𝑠 ∙ 𝑆𝑆ℎ𝑟𝑟𝑟𝑟)0,56
∙ 𝐾𝐾 ∙ 𝐶𝐶 ∙ 𝑃𝑃 ∙ 𝐿𝐿𝑆𝑆 ∙ 𝐶𝐶𝐶𝐶𝑅𝑅𝐶𝐶 (2)
Where Sed: Sediment yield (ton), Qs: the surface runoff volume (mm /ha), qp: the peak runoff rate (m3/s), Shru: the area of the HRU (ha), K: the USLE soil erodibility factor (0.013 ton.m2.h/m3.ton.cm), C: the USLE cover and management factor, P: the USLE support practice factor, LS: the USLE topographic factor, CFRG: the coarse fragment factor.
The model generates the final spatial discretization in small elementary units called: HRU (Hydrologic Response Unit) [10]. which is a fairly homogeneous area obtained by overlaying the slope, land use and pedology map [10]. The flows and sediments are simulated for each
HRU and added for an overall value to the sub-watershed (Fig. 3.) [7].
Fig. 2. Operation diagram of SWAT model
The SWAT model is implemented through the GIS extention, ArcSWAT, in the purpose of facilitating the input data preparation [7]. SWAT-CUP (SWAT Calibration and Uncertainty Procedures) is a program that interfaces with ArcSWAT, to perform calibration, validation and sensitivity analysis of the SWAT model. It was designed by [11] to bring more flexibility and performance as to the calibration of SWAT model to face out the limits of ArcSWAT calibration functions in the GIS environment. For this, SWAT-CUP proposes five different algorithms procedures such a Generalized Likelihood Uncertainty Estimation "GLUE" [12], Particle Swarm Optimization "PSO" [13], Parameter Solution "ParaSol" [14], Mark chain Monte Carlo "MCMC" [15] and Sequential Uncertainty Fitting"SUFI-2" [11, 16]. For this study SUFI-2 was chosen because it allows a high flexibility in the choice of parameters, intervals, timescale and sub-basins to be calibrated [11, 17, 18].
The performance of the model is evaluated by statistical indices [19]: the Nash-Sutcliffe efficiency (NSE) and the coefficient of determination (R2). The model is considered to be calibrated satisfactorily when R2 and NSE are greater than 0.5 [20].
𝑁𝑁𝑆𝑆𝐸𝐸 = 1 − ∑ (𝑂𝑂𝑖𝑖−𝑆𝑆𝑖𝑖)2𝑛𝑛𝑖𝑖=1
∑ (𝑂𝑂𝑖𝑖−�̅�𝑂)2𝑛𝑛𝑖𝑖=1
(3)
𝑅𝑅2 = [ ∑ (𝑂𝑂𝑖𝑖−O)(𝑆𝑆𝑖𝑖−S)𝑛𝑛𝑖𝑖=1
[∑ (𝑂𝑂𝑖𝑖−O̅)2𝑛𝑛𝑖𝑖=1 ]
0.5[∑ (𝑆𝑆𝑖𝑖−S̅)2𝑛𝑛
𝑖𝑖=1 ]0.5] (4)
Where 𝑂𝑂𝑖𝑖: the measured; 𝑆𝑆𝑖𝑖 : the simulated; �̅�𝐎: the measured mean; S̅: the simulated mean; n: the total number of observations.
2.2.2 Data processing and SWAT model set-up
The information about the climate data (precipitation, atmospheric temperature, solar radiation, wind speed, and relative humidity), topography (digital elevation model – DEM), soil and land use, were collected and prepared as shown in the table 1.
2
E3S Web of Conferences 234, 00082 (2021) https://doi.org/10.1051/e3sconf/202123400082ICIES 2020
ICIES’2020
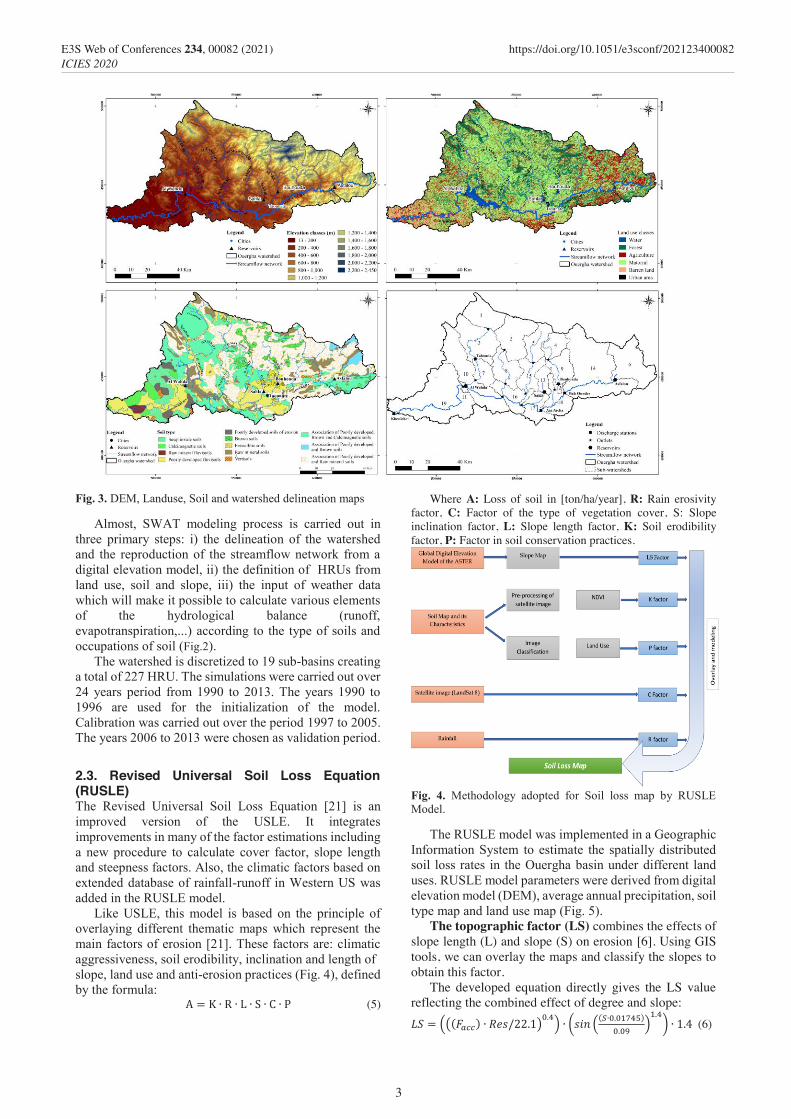
Fig. 3. DEM, Landuse, Soil and watershed delineation maps
Almost, SWAT modeling process is carried out in three primary steps: i) the delineation of the watershed and the reproduction of the streamflow network from a digital elevation model, ii) the definition of HRUs from land use, soil and slope, iii) the input of weather data which will make it possible to calculate various elements of the hydrological balance (runoff, evapotranspiration,...) according to the type of soils and occupations of soil (Fig.2).
The watershed is discretized to 19 sub-basins creating a total of 227 HRU. The simulations were carried out over 24 years period from 1990 to 2013. The years 1990 to 1996 are used for the initialization of the model. Calibration was carried out over the period 1997 to 2005. The years 2006 to 2013 were chosen as validation period.
2.3. Revised Universal Soil Loss Equation (RUSLE) The Revised Universal Soil Loss Equation [21] is an improved version of the USLE. It integrates improvements in many of the factor estimations including a new procedure to calculate cover factor, slope length and steepness factors. Also, the climatic factors based on extended database of rainfall-runoff in Western US was added in the RUSLE model.
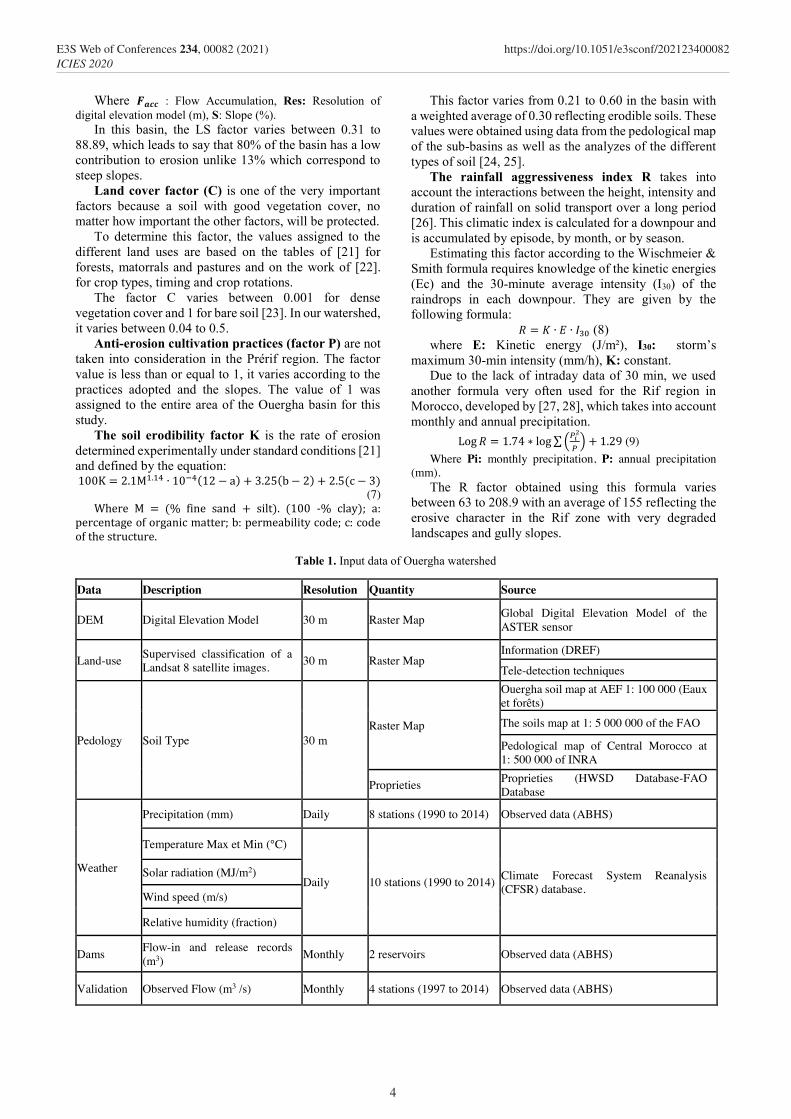
Like USLE, this model is based on the principle of overlaying different thematic maps which represent the main factors of erosion [21]. These factors are: climatic aggressiveness, soil erodibility, inclination and length of slope, land use and anti-erosion practices (Fig. 4), defined by the formula:
A = K ∙ R ∙ L ∙ S ∙ C ∙ P (5)
Where A: Loss of soil in [ton/ha/year], R: Rain erosivity factor, C: Factor of the type of vegetation cover, S: Slope inclination factor, L: Slope length factor, K: Soil erodibility factor, P: Factor in soil conservation practices.
Fig. 4. Methodology adopted for Soil loss map by RUSLE Model.
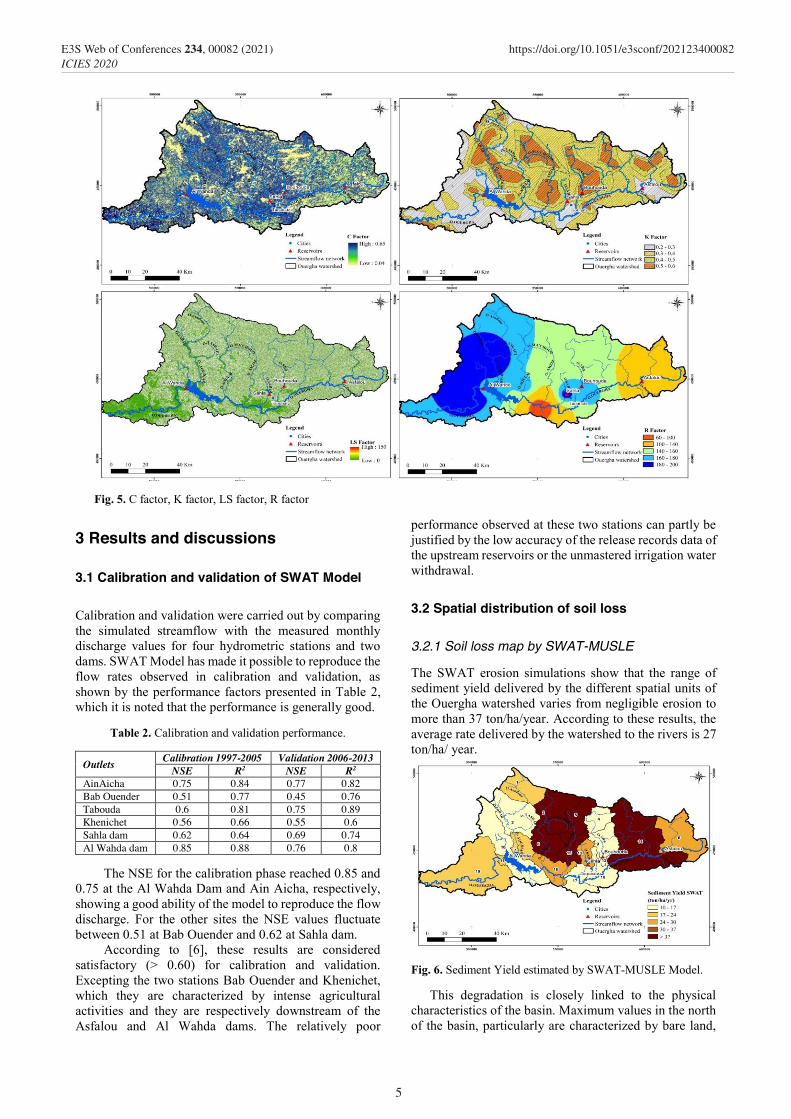
The RUSLE model was implemented in a Geographic Information System to estimate the spatially distributed soil loss rates in the Ouergha basin under different land uses. RUSLE model parameters were derived from digital elevation model (DEM), average annual precipitation, soil type map and land use map (Fig. 5).
The topographic factor (LS) combines the effects of slope length (L) and slope (S) on erosion [6]. Using GIS tools, we can overlay the maps and classify the slopes to obtain this factor.
The developed equation directly gives the LS value reflecting the combined effect of degree and slope: 𝐿𝐿𝐿𝐿 = (((𝐹𝐹𝑎𝑎𝑎𝑎𝑎𝑎) ∙ 𝑅𝑅𝑅𝑅𝑅𝑅/22.1)
0.4) ∙ (𝑅𝑅𝑠𝑠𝑠𝑠 ((𝑆𝑆∙0.01745)
0.09)
1.4) ∙ 1.4 (6)
3
E3S Web of Conferences 234, 00082 (2021) https://doi.org/10.1051/e3sconf/202123400082ICIES 2020
ICIES’2020
Where 𝑭𝑭𝒂𝒂𝒂𝒂𝒂𝒂 : Flow Accumulation, Res: Resolution of digital elevation model (m), S: Slope (%).
In this basin, the LS factor varies between 0.31 to 88.89, which leads to say that 80% of the basin has a low contribution to erosion unlike 13% which correspond to steep slopes.
Land cover factor (C) is one of the very important factors because a soil with good vegetation cover, no matter how important the other factors, will be protected.
To determine this factor, the values assigned to the different land uses are based on the tables of [21] for forests, matorrals and pastures and on the work of [22]. for crop types, timing and crop rotations.
The factor C varies between 0.001 for dense vegetation cover and 1 for bare soil [23]. In our watershed, it varies between 0.04 to 0.5.
Anti-erosion cultivation practices (factor P) are not taken into consideration in the Prérif region. The factor value is less than or equal to 1, it varies according to the practices adopted and the slopes. The value of 1 was assigned to the entire area of the Ouergha basin for this study.
The soil erodibility factor K is the rate of erosion determined experimentally under standard conditions [21] and defined by the equation: 100K = 2.1M1.14 ∙ 10−4(12 − a) + 3.25(b − 2) + 2.5(c − 3)
(7) Where M = (% fine sand + silt). (100 -% clay); a:
percentage of organic matter; b: permeability code; c: code of the structure.
This factor varies from 0.21 to 0.60 in the basin with a weighted average of 0.30 reflecting erodible soils. These values were obtained using data from the pedological map of the sub-basins as well as the analyzes of the different types of soil [24, 25].
The rainfall aggressiveness index R takes into account the interactions between the height, intensity and duration of rainfall on solid transport over a long period [26]. This climatic index is calculated for a downpour and is accumulated by episode, by month, or by season.
Estimating this factor according to the Wischmeier & Smith formula requires knowledge of the kinetic energies (Ec) and the 30-minute average intensity (I30) of the raindrops in each downpour. They are given by the following formula:
𝑅𝑅 = 𝐾𝐾 ∙ 𝐸𝐸 ∙ 𝐼𝐼30 (8) where E: Kinetic energy (J/m²), I30: storm’s
maximum 30-min intensity (mm/h), K: constant. Due to the lack of intraday data of 30 min, we used
another formula very often used for the Rif region in Morocco, developed by [27, 28], which takes into account monthly and annual precipitation.
Log 𝑅𝑅 = 1.74 ∗ log∑(𝑃𝑃𝑖𝑖2
𝑃𝑃) + 1.29 (9)
Where Pi: monthly precipitation, P: annual precipitation (mm).
The R factor obtained using this formula varies between 63 to 208.9 with an average of 155 reflecting the erosive character in the Rif zone with very degraded landscapes and gully slopes.
Table 1. Input data of Ouergha watershed
Data Description Resolution Quantity Source
DEM Digital Elevation Model 30 m Raster Map Global Digital Elevation Model of the ASTER sensor
Land-use Supervised classification of a Landsat 8 satellite images. 30 m Raster Map
Information (DREF)
Tele-detection techniques
Pedology Soil Type 30 m Raster Map
Ouergha soil map at AEF 1: 100 000 (Eaux et forêts) The soils map at 1: 5 000 000 of the FAO
Pedological map of Central Morocco at 1: 500 000 of INRA
Proprieties Proprieties (HWSD Database-FAO Database
Weather
Precipitation (mm) Daily 8 stations (1990 to 2014) Observed data (ABHS)
Temperature Max et Min (°C)
Daily 10 stations (1990 to 2014) Climate Forecast System Reanalysis (CFSR) database.
Solar radiation (MJ/m2)
Wind speed (m/s)
Relative humidity (fraction)
Dams Flow-in and release records (m3) Monthly 2 reservoirs Observed data (ABHS)
Validation Observed Flow (m3 /s) Monthly 4 stations (1997 to 2014) Observed data (ABHS)
4
E3S Web of Conferences 234, 00082 (2021) https://doi.org/10.1051/e3sconf/202123400082ICIES 2020
ICIES’2020
Fig. 5. C factor, K factor, LS factor, R factor
3 Results and discussions
3.1 Calibration and validation of SWAT Model
Calibration and validation were carried out by comparing the simulated streamflow with the measured monthly discharge values for four hydrometric stations and two dams. SWAT Model has made it possible to reproduce the flow rates observed in calibration and validation, as shown by the performance factors presented in Table 2, which it is noted that the performance is generally good.
Table 2. Calibration and validation performance.
Outlets Calibration 1997-2005 Validation 2006-2013 NSE R2 NSE R2
AinAicha 0.75 0.84 0.77 0.82 Bab Ouender 0.51 0.77 0.45 0.76 Tabouda 0.6 0.81 0.75 0.89 Khenichet 0.56 0.66 0.55 0.6 Sahla dam 0.62 0.64 0.69 0.74 Al Wahda dam 0.85 0.88 0.76 0.8
The NSE for the calibration phase reached 0.85 and 0.75 at the Al Wahda Dam and Ain Aicha, respectively, showing a good ability of the model to reproduce the flow discharge. For the other sites the NSE values fluctuate between 0.51 at Bab Ouender and 0.62 at Sahla dam.
According to [6], these results are considered satisfactory (> 0.60) for calibration and validation. Excepting the two stations Bab Ouender and Khenichet, which they are characterized by intense agricultural activities and they are respectively downstream of the Asfalou and Al Wahda dams. The relatively poor
performance observed at these two stations can partly be justified by the low accuracy of the release records data of the upstream reservoirs or the unmastered irrigation water withdrawal.
3.2 Spatial distribution of soil loss
3.2.1 Soil loss map by SWAT-MUSLE
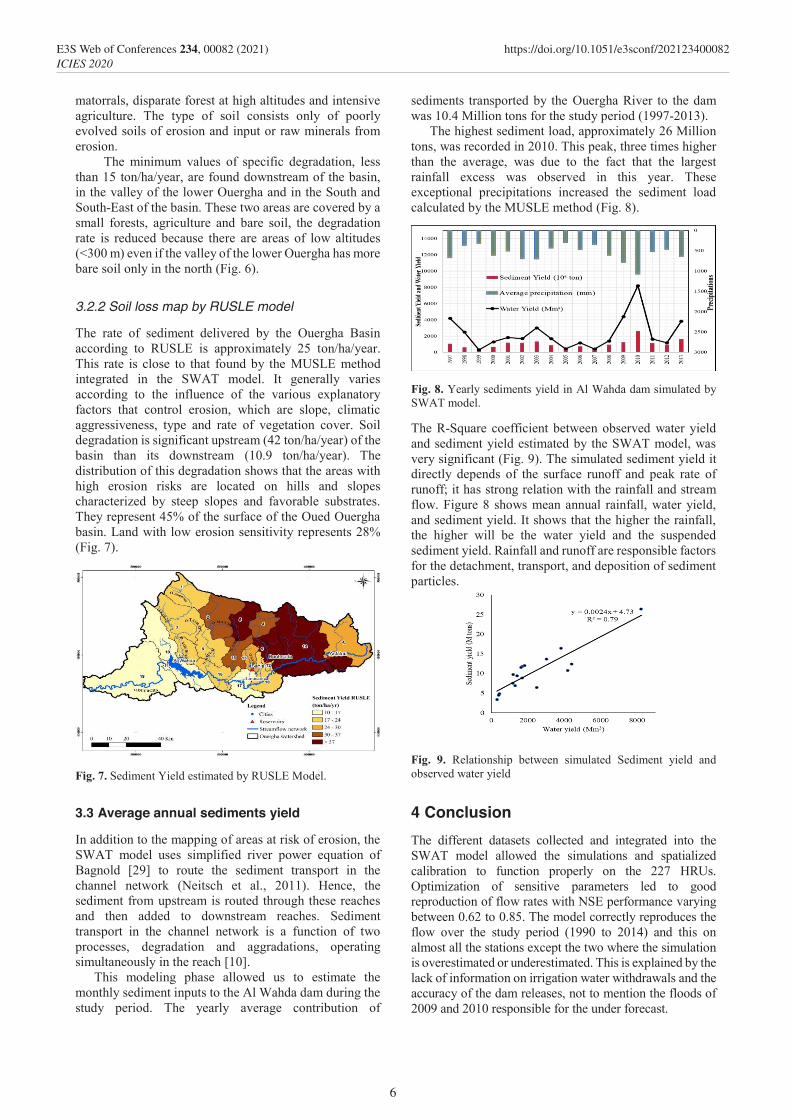
The SWAT erosion simulations show that the range of sediment yield delivered by the different spatial units of the Ouergha watershed varies from negligible erosion to more than 37 ton/ha/year. According to these results, the average rate delivered by the watershed to the rivers is 27 ton/ha/ year.
Fig. 6. Sediment Yield estimated by SWAT-MUSLE Model.
This degradation is closely linked to the physical characteristics of the basin. Maximum values in the north of the basin, particularly are characterized by bare land,
5
E3S Web of Conferences 234, 00082 (2021) https://doi.org/10.1051/e3sconf/202123400082ICIES 2020
ICIES’2020
matorrals, disparate forest at high altitudes and intensive agriculture. The type of soil consists only of poorly evolved soils of erosion and input or raw minerals from erosion.
The minimum values of specific degradation, less than 15 ton/ha/year, are found downstream of the basin, in the valley of the lower Ouergha and in the South and South-East of the basin. These two areas are covered by a small forests, agriculture and bare soil, the degradation rate is reduced because there are areas of low altitudes (<300 m) even if the valley of the lower Ouergha has more bare soil only in the north (Fig. 6).
3.2.2 Soil loss map by RUSLE model
The rate of sediment delivered by the Ouergha Basin according to RUSLE is approximately 25 ton/ha/year. This rate is close to that found by the MUSLE method integrated in the SWAT model. It generally varies according to the influence of the various explanatory factors that control erosion, which are slope, climatic aggressiveness, type and rate of vegetation cover. Soil degradation is significant upstream (42 ton/ha/year) of the basin than its downstream (10.9 ton/ha/year). The distribution of this degradation shows that the areas with high erosion risks are located on hills and slopes characterized by steep slopes and favorable substrates. They represent 45% of the surface of the Oued Ouergha basin. Land with low erosion sensitivity represents 28% (Fig. 7).
Fig. 7. Sediment Yield estimated by RUSLE Model.
3.3 Average annual sediments yield
In addition to the mapping of areas at risk of erosion, the SWAT model uses simplified river power equation of Bagnold [29] to route the sediment transport in the channel network (Neitsch et al., 2011). Hence, the sediment from upstream is routed through these reaches and then added to downstream reaches. Sediment transport in the channel network is a function of two processes, degradation and aggradations, operating simultaneously in the reach [10].
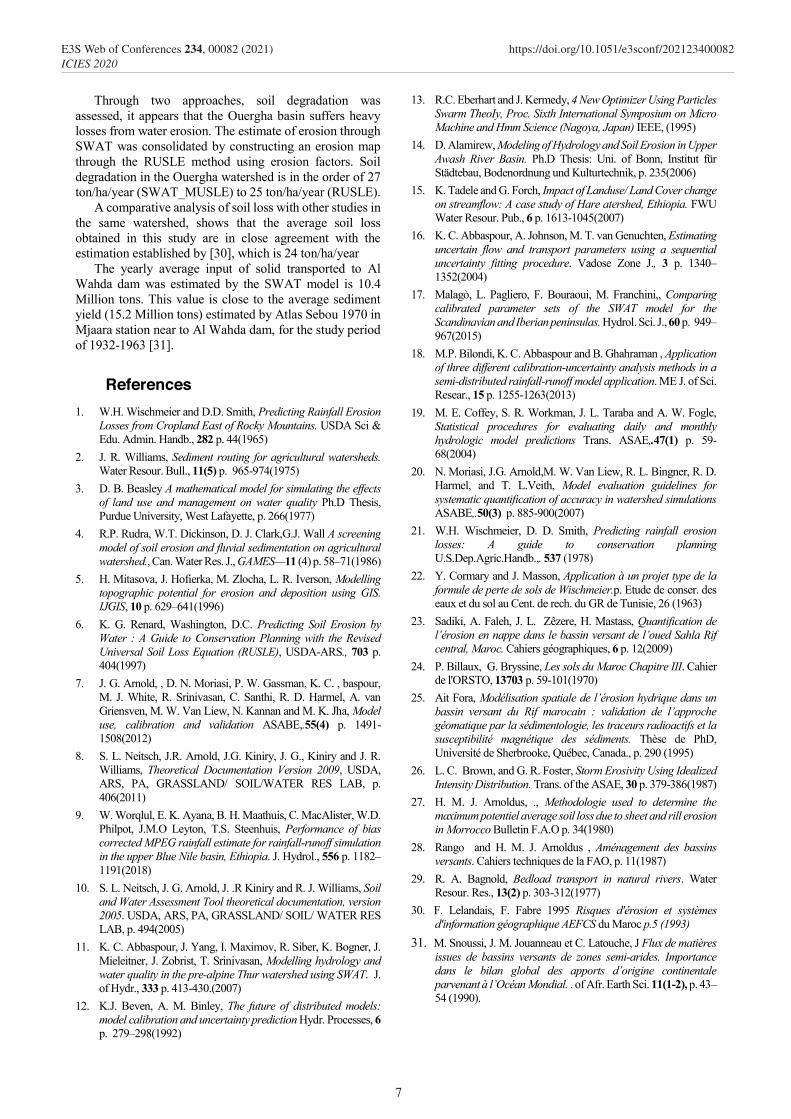
This modeling phase allowed us to estimate the monthly sediment inputs to the Al Wahda dam during the study period. The yearly average contribution of
sediments transported by the Ouergha River to the dam was 10.4 Million tons for the study period (1997-2013).
The highest sediment load, approximately 26 Million tons, was recorded in 2010. This peak, three times higher than the average, was due to the fact that the largest rainfall excess was observed in this year. These exceptional precipitations increased the sediment load calculated by the MUSLE method (Fig. 8).
Fig. 8. Yearly sediments yield in Al Wahda dam simulated by SWAT model.
The R-Square coefficient between observed water yield and sediment yield estimated by the SWAT model, was very significant (Fig. 9). The simulated sediment yield it directly depends of the surface runoff and peak rate of runoff; it has strong relation with the rainfall and stream flow. Figure 8 shows mean annual rainfall, water yield, and sediment yield. It shows that the higher the rainfall, the higher will be the water yield and the suspended sediment yield. Rainfall and runoff are responsible factors for the detachment, transport, and deposition of sediment particles.
Fig. 9. Relationship between simulated Sediment yield and observed water yield
4 Conclusion The different datasets collected and integrated into the SWAT model allowed the simulations and spatialized calibration to function properly on the 227 HRUs. Optimization of sensitive parameters led to good reproduction of flow rates with NSE performance varying between 0.62 to 0.85. The model correctly reproduces the flow over the study period (1990 to 2014) and this on almost all the stations except the two where the simulation is overestimated or underestimated. This is explained by the lack of information on irrigation water withdrawals and the accuracy of the dam releases, not to mention the floods of 2009 and 2010 responsible for the under forecast.
6
E3S Web of Conferences 234, 00082 (2021) https://doi.org/10.1051/e3sconf/202123400082ICIES 2020
ICIES’2020
Through two approaches, soil degradation was assessed, it appears that the Ouergha basin suffers heavy losses from water erosion. The estimate of erosion through SWAT was consolidated by constructing an erosion map through the RUSLE method using erosion factors. Soil degradation in the Ouergha watershed is in the order of 27 ton/ha/year (SWAT_MUSLE) to 25 ton/ha/year (RUSLE).
A comparative analysis of soil loss with other studies in the same watershed, shows that the average soil loss obtained in this study are in close agreement with the estimation established by [30], which is 24 ton/ha/year
The yearly average input of solid transported to Al Wahda dam was estimated by the SWAT model is 10.4 Million tons. This value is close to the average sediment yield (15.2 Million tons) estimated by Atlas Sebou 1970 in Mjaara station near to Al Wahda dam, for the study period of 1932-1963 [31].
References 1. W.H. Wischmeier and D.D. Smith, Predicting Rainfall Erosion
Losses from Cropland East of Rocky Mountains. USDA Sci & Edu. Admin. Handb., 282 p. 44(1965)
2. J. R. Williams, Sediment routing for agricultural watersheds. Water Resour. Bull., 11(5) p. 965-974(1975)
3. D. B. Beasley A mathematical model for simulating the effects of land use and management on water quality Ph.D Thesis, Purdue University, West Lafayette, p. 266(1977)
4. R.P. Rudra, W.T. Dickinson, D. J. Clark,G.J. Wall A screening model of soil erosion and fluvial sedimentation on agricultural watershed., Can. Water Res. J., GAMES—11 (4) p. 58–71(1986)
5. H. Mitasova, J. Hofierka, M. Zlocha, L. R. Iverson, Modelling topographic potential for erosion and deposition using GIS. IJGIS, 10 p. 629–641(1996)
6. K. G. Renard, Washington, D.C. Predicting Soil Erosion by Water : A Guide to Conservation Planning with the Revised Universal Soil Loss Equation (RUSLE), USDA-ARS., 703 p. 404(1997)
7. J. G. Arnold, , D. N. Moriasi, P. W. Gassman, K. C. , baspour, M. J. White, R. Srinivasan, C. Santhi, R. D. Harmel, A. van Griensven, M. W. Van Liew, N. Kannan and M. K. Jha, Model use, calibration and validation ASABE,.55(4) p. 1491-1508(2012)
8. S. L. Neitsch, J.R. Arnold, J.G. Kiniry, J. G., Kiniry and J. R. Williams, Theoretical Documentation Version 2009, USDA, ARS, PA, GRASSLAND/ SOIL/WATER RES LAB, p. 406(2011)
9. W. Worqlul, E. K. Ayana, B. H. Maathuis, C. MacAlister, W.D. Philpot, J.M.O Leyton, T.S. Steenhuis, Performance of bias corrected MPEG rainfall estimate for rainfall-runoff simulation in the upper Blue Nile basin, Ethiopia. J. Hydrol., 556 p. 1182–1191(2018)
10. S. L. Neitsch, J. G. Arnold, J. .R Kiniry and R. J. Williams, Soil and Water Assessment Tool theoretical documentation, version 2005. USDA, ARS, PA, GRASSLAND/ SOIL/ WATER RES LAB, p. 494(2005)
11. K. C. Abbaspour, J. Yang, I. Maximov, R. Siber, K. Bogner, J. Mieleitner, J. Zobrist, T. Srinivasan, Modelling hydrology and water quality in the pre-alpine Thur watershed using SWAT. J. of Hydr., 333 p. 413-430.(2007)
12. K.J. Beven, A. M. Binley, The future of distributed models: model calibration and uncertainty prediction Hydr. Processes, 6 p. 279–298(1992)
13. R.C. Eberhart and J. Kermedy, 4 New Optimizer Using Particles Swarm TheoIy, Proc. Sixth International Symposium on Micro Machine and Hmm Science (Nagoya, Japan) IEEE, (1995)
14. D. Alamirew, Modeling of Hydrology and Soil Erosion in Upper Awash River Basin. Ph.D Thesis: Uni. of Bonn, Institut für Städtebau, Bodenordnung und Kulturtechnik, p. 235(2006)
15. K. Tadele and G. Forch, Impact of Landuse/ Land Cover change on streamflow: A case study of Hare atershed, Ethiopia. FWU Water Resour. Pub., 6 p. 1613-1045(2007)
16. K. C. Abbaspour, A. Johnson, M. T. van Genuchten, Estimating uncertain flow and transport parameters using a sequential uncertainty fitting procedure. Vadose Zone J., 3 p. 1340–1352(2004)
17. Malagò, L. Pagliero, F. Bouraoui, M. Franchini,, Comparing calibrated parameter sets of the SWAT model for the Scandinavian and Iberian peninsulas. Hydrol. Sci. J., 60 p. 949–967(2015)
18. M.P. Bilondi, K. C. Abbaspour and B. Ghahraman , Application of three different calibration-uncertainty analysis methods in a semi-distributed rainfall-runoff model application. ME J. of Sci. Resear., 15 p. 1255-1263(2013)
19. M. E. Coffey, S. R. Workman, J. L. Taraba and A. W. Fogle, Statistical procedures for evaluating daily and monthly hydrologic model predictions Trans. ASAE,.47(1) p. 59-68(2004)
20. N. Moriasi, J.G. Arnold,M. W. Van Liew, R. L. Bingner, R. D. Harmel, and T. L.Veith, Model evaluation guidelines for systematic quantification of accuracy in watershed simulations ASABE,.50(3) p. 885-900(2007)
21. W.H. Wischmeier, D. D. Smith, Predicting rainfall erosion losses: A guide to conservation planning U.S.Dep.Agric.Handb.,. 537 (1978)
22. Y. Cormary and J. Masson, Application à un projet type de la formule de perte de sols de Wischmeier.p. Etude de conser. des eaux et du sol au Cent. de rech. du GR de Tunisie, 26 (1963)
23. Sadiki, A. Faleh, J. L. Zêzere, H. Mastass, Quantification de l’érosion en nappe dans le bassin versant de l’oued Sahla Rif central, Maroc. Cahiers géographiques, 6 p. 12(2009)
24. P. Billaux, G. Bryssine, Les sols du Maroc Chapitre III. Cahier de l'ORSTO, 13703 p. 59-101(1970)
25. Ait Fora, Modélisation spatiale de l’érosion hydrique dans un bassin versant du Rif marocain : validation de l’approche géomatique par la sédimentologie, les traceurs radioactifs et la susceptibilité magnétique des sédiments. Thèse de PhD, Université de Sherbrooke, Québec, Canada., p. 290 (1995)
26. L. C. Brown, and G. R. Foster, Storm Erosivity Using Idealized Intensity Distribution. Trans. of the ASAE, 30 p. 379-386(1987)
27. H. M. J. Arnoldus, ., Methodologie used to determine the maximum potentiel average soil loss due to sheet and rill erosion in Morrocco Bulletin F.A.O p. 34(1980)
28. Rango and H. M. J. Arnoldus , Aménagement des bassins versants. Cahiers techniques de la FAO, p. 11(1987)
29. R. A. Bagnold, Bedload transport in natural rivers. Water Resour. Res., 13(2) p. 303-312(1977)
30. F. Lelandais, F. Fabre 1995 Risques d'érosion et systèmes d'information géographique AEFCS du Maroc p.5 (1993)
31. M. Snoussi, J. M. Jouanneau et C. Latouche, J Flux de matières issues de bassins versants de zones semi-arides. Importance dans le bilan global des apports d’origine continentale parvenant à l’Océan Mondial. . of Afr. Earth Sci. 11(1-2), p. 43–54 (1990).
7
E3S Web of Conferences 234, 00082 (2021) https://doi.org/10.1051/e3sconf/202123400082ICIES 2020