Embed Size (px)
Citation preview
Virus Research 113 (2005) 132–142
Assessment of sequence diversity in the 5′-terminal region ofCitrus tristeza virus from India
Avijit Roy a, K.L. Manjunathb, R.H. Brlanskya,∗a University of Florida, IFAS, Plant Pathology Department, Citrus Research and Education Center, 700,
Experiment Station Road, Lake Alfred, FL 33850-2299, USAb University of Florida, IFAS, Plant Pathology Department, 1453 Fifield Hall, P.O. Box 110680, Gainesville, FL 32611-0680, USA
Received 22 January 2005; received in revised form 22 April 2005; accepted 23 April 2005Available online 15 June 2005
Abstract
Twenty-oneCitrus tristeza virus (CTV) isolates from India were characterized, using genotype-specific multiple molecular markers (MMM)from the 54′-terminal region and two other overlapping primer pairs (CN487/489 and CN488/491) from ORF1a (697–1484 nucleotides (nt)).The 5′-terminal genotype-specific primer pairs amplified about 500 bases from the 5′-end of the CTV genomic RNA (gRNA). With the three
and thefied withlates intopresentedroducts andequences ofTV gRNA.
are three
ely2teini ets5
ua
-likeT)an
ainthethevia
different MMM, the VT genotype-specific primers amplified 19 Indian CTV isolates. The T30-specific primers amplified five isolates,T36 primer amplified only one isolate T36. All isolates were amplified with CN488/491 primers; however, only 20 isolates were ampliCN487/489 pair. A phylogenetic tree, derived from the sequences of the different MMM primer-amplified products, placed all the isofour distinct genogroups. Three of these four groups were typified by the reference isolates T30, T36, and VT. The fourth group, reby the isolate BAN-2, was considered as a new genogroup. A phylogenetic tree based on sequences of the CN487/491 amplified pother published sequences placed all of the isolates in eight genogroups. Phylogenetic correlation over the three different regions sthese CTV isolates showed more sequence variability between 1082 and 1484 nt than between 1 and 500 or 697–1105 nt of the CBased on three different 5′ regions sequences and phylogenetic analysis, it is hypothesized that isolates BAN-1, BAN-2, and B165naturally occurring variants that add to the complexity of the CTV populations in India.© 2005 Elsevier B.V. All rights reserved.
Keywords: Citrus tristeza virus; Genogrouping; Multiple molecular markers, Phylogenetic analysis; Recombination
1. Introduction
Citrus tristeza virus (CTV), the largest known (19.3 kb)monopartite, positive-stranded RNA virus of plants, causesone of the most economically important diseases of citrus(Bar-Joseph et al., 1989). The virus, a member of thegenusClosterovirus within the family Closteroviridae, isphloem-limited, and is transmitted by infected buds and byvarious aphid species.Toxoptera citricida (Kirkaldy) andAphis gossypii (Glover) are the most efficient aphid vectorsand transmit CTV in a semipersistent manner (Bar-Josephet al., 1989). CTV virions are filamentous flexuous particles,2000 nm× 11 nm in size, with two coat proteins (CP, CPm)
∗ Corresponding author. Tel.: +1 863 956 1151; fax: +1 863 956 4631.E-mail address: [email protected] (R.H. Brlansky).
covering 95 and 5% of the particle length, respectiv(Febres et al., 1996). The CTV genome is organized into 1open reading frames (ORFs), encoding at least 19 proproducts (Karasev, 2000; Karasev et al., 1995; Mawassal., 1996; Pappu et al., 1994) and two untranslated region(UTRs) of about 107 and 273 nucleotides (nt) at the′and 3′ termini, respectively (Karasev et al., 1995; Pappet al., 1994). The 5′ proximal ORF 1a encodes a 349 kDpolyprotein that includes two cysteine papain proteinase(P-Pro) domains as well as methyltransferase-like (Mand helicase-like (HEL) domains. ORF1b encodesRNA-dependent RNA polymerase (RdRp)-like domand is thought to allow the continued translation ofpolyprotein by a + 1 frameshift. ORFs 2–11, located in3′ moiety of the genomic-RNA (gRNA), are translatedsubgenomic RNAs (sgRNAs), which are 3′ co-terminal (Hilf
0168-1702/$ – see front matter © 2005 Elsevier B.V. All rights reserved.doi:10.1016/j.virusres.2005.04.023
A. Roy et al. / Virus Research 113 (2005) 132–142 133
et al., 1995). Infected plants may contain defective RNA(dRNA) molecules, which may have both gRNA termini butlack variable portions of the central region (Ayllon et al.,1999; Mawassi et al., 1995).
Complete genomic sequences from CTV isolates T36 andT30 from Florida (Albiach-Marti et al., 2000; Karasev et al.,1995), VT from Israel (Mawassi et al., 1996), T385 fromSpain (Vives et al., 1999), SY568 from California (Yang etal., 1999), NUagA from Japan (Suastika et al., 2001), andQaha from Egypt (GenBank accession no. AY340974) havebeen determined. The gRNAs of these seven isolates varyfrom 19,226 to 19,302 nt in size. An unexpected sequencerelationship between T36 and VT isolates of tristeza viruswas reported (Mawassi et al., 1995, 1996). The 3′ half of thegRNA is relatively conserved (approximately 90% identity);however, less than 70% identities were found in the 5′-end.Hilf et al. (1999)classified various Florida CTV isolates intwo sequence groups (VT and T36 types) based on hybridiza-tion with probes for the 5′- and 3′-terminal regions of T3,T30, and T36 CTV isolates. The authors had also classifiedfour genotypes using three sets of molecular markers locatedin the 5′ half of the genome (Hilf and Garnsey, 2000). Furtheranalysis suggested the existence of additional genotypes,which do not react with any of the multiple molecularmarkers (MMM) described byHilf and Garnsey (2000). The
ns-
ss
perees
te
of
itrundnt.eR
her
eten-
woA
V
and ORF1a separated the sequences into three groups, whichrepresented the sequences of T36, VT, and clone 8 of isolateT317. Some isolates yielded clones that were placed into mul-tiple groups, illustrating the presence of different sequencevariants in infected plants (Lopez et al., 1998). Extended anal-ysis of the variability of the 284 nt from 5′-terminal regionof the CTV gRNA showed four conserved regions. Theseregions were used to develop four sets of primers to determinethe group-specificity of tristeza virus (Ayllon et al., 2001).These results confirmed the presence of three types of CTVpopulations from at least 9 of the 12 countries from whichsamples were taken.
The MMM approach (Hilf and Garnsey, 2000) is onemethod currently used for CTV isolate classification. Thismethod utilizes genotype-specific primers from three differ-ent regions of the genome. CTV isolates are classified intofour groups (T3, T30, T36, and VT) based on the presenceor absence of RT-PCR amplifications. The purpose of thepresent study was to find the sequence variability of 21 CTVisolates from India in the 5′-terminal region using universaland the genotype-specific MMM primer pairs (Hilf et al.,1999). The relationship of the Indian CTV isolates to the dif-ferent CTV genotypes (Ayllon et al., 2001; Lopez et al., 1998)was studied by the sequencing and phylogenetic analyses.
y,
c-
e.
nit-
hend
i-
MMM were successfully used to analyze subisolates tramitted by aphids from different CTV isolates (Brlansky et al.,2003). Recent work using MMM primer pairs in the regionof POL and k17 of CTV genome of Indian CTV isolate(Roy and Brlansky, 2004) showed that amplifications werenot always genotype-specific. For example, the T3 genotyspecific primer amplified product of some isolates had mosequence similarity with either the T30 or SY568 genotyprather than with the T3 genotype (Roy and Brlansky, 2004).
CTV belongs to the genusClosterovirus in the familyClosteroviridae. Speciation in the genusClosterovirus isbased on particle size, sequence and size of the coat progene, serological, and vector-specificities (Martelli et al.,2002). Even though CTV isolates exhibit a high degreesequence diversity in the 5′ half of their genomes, they areplaced under one genus based on the above criteria. Cplants can be infected with multiple genotypes of CTV, aproper identification is important for disease managemeGenome fragments in different parts of the CTV genomhave been utilized to classify CTV isolates based on PCamplifications, sequencing, SSCP, hybridization, and ottechniques.
Comparison of isolates may be accomplished by complsequencing of the 19.3 kb CTV genome but this is time cosuming and difficult.Lopez et al. (1998)developed anotherapproach based on the analysis of total 1250 nt from the tterminal regions. Sequence comparison of multiple cDNclones of both gRNA terminal regions from several CTisolates showed that the 3′ untranslated region was highlyconserved (97% nt) identity, whereas 5′ UTRs were less con-served (44–88%). The variability observed in the 5′ UTR
-
in
s
2. Materials and methods
2.1. Virus isolates
The 21 CTV isolates from India used in this stud(Table 1), from three different citrus growing areas of Indiahave been previously described (Roy and Brlansky, 2004).All of the isolates, except for CTV-B, CTV-D, CTV N, andCTV-P, are maintained at the Exotic Citrus Pathogen Colletion at Beltsville, MD, in Mexican lime [Citrus aurantifolia(Christm.) Swing.] and in sweet orange [C. sinensis (L.) Osb.]plants. The work on isolates CTV-B, D, N, and P was donat Indian Agricultural Research Institute, New Delhi, India
2.2. Nucleic acid extraction and reversetranscription-polymerase chain reaction (RT-PCR)
Total RNA from plants infected with each of the 21 IndiaCTV isolates was extracted using RNeasy Plant Mini K(QIAGEN, Valencia, CA) following the manufacturer’s protocol. The MMM primer pairs used to amplify the 5′-terminalregions were derived from the analogous sites within tgenomes of T30 (nt 6–26 and 580–600), T36 (nt 1–20 a481–500), and VT (nt 1–22 and 471–492) isolates (Hilf etal., 1999). Other regions of ORF1a were amplified with unversal primers, CN487/489 (6975′-GCG TTG GAT GAT ATCCTT CGC TGG-3′720/10825′-AAT TRT TCC GCS CAG GACGGA ACA-3′1105) and CN488/491 (10825′-TGT TCC GTCCTG SGC GGA AYA ATT-3′1105/14615′-GTG TAR GTCCCR CGC ATM GGA ACC-3′1484) primer pairs. Nucleotide
134 A. Roy et al. / Virus Research 113 (2005) 132–142
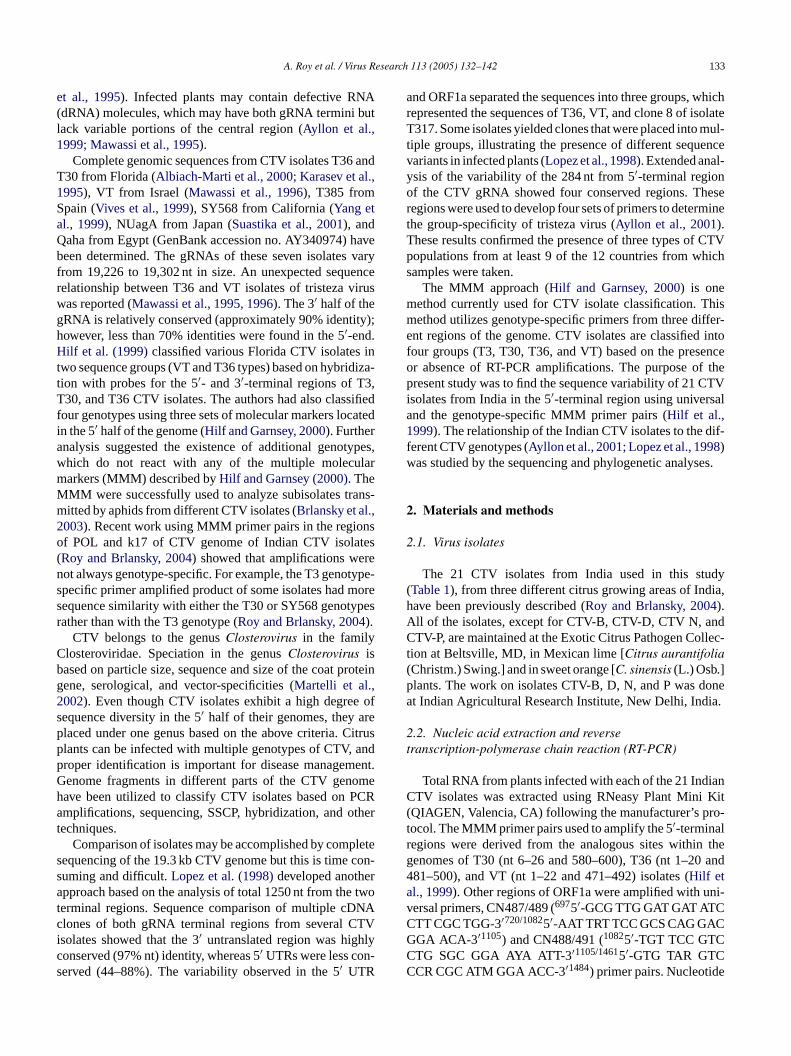
Table 1Genogrouping ofCitrus tristeza virus (CTV) isolates based on RT-PCR amplification by MMM, phylogenetic analysis of sequences of two regions of the CTVgenome (from 1 to 500 nt and 697 to 1105 nt)
Isolatesa MMM-based genogroupsb Genogrouopingc based on sequence from nt 1–500 Genogrouping based on sequence from nt 697–1484
(Dendrogram) Accession no.d (Dendrogram) Accession no.
BAN-1 II II AY295920 VII AY572216
BAN-2 II II AY295917 IV AY572217III IV AY295912
CTV-D III III AY295905 III AY572218
CTV-N II III AY295918 III AY572219III III AY295914
CTV-P II III AY295919 III AY572220III III AY295913
B165 III III AY295911 VIII AY572201B166 III III N/Se III AY572202B167 III III N/S III AY572203B184 III III AY295907 III AY572204
B194 II II AY295916 III AY572205III III AY295910
B195 III III AY295906 III AY572206
B219 I I AY295915 III AY572207III III AY295909
B220 III III N/S III AY572208B221 III III N/S III AY572209B222 III III N/S III AY572210B224 III III N/S III AY572211B225 III III N/S III AY572212B225.1 III III N/S III AY572213B226 III III AY295908 III AY572214B227 III III N/S III AY572215CTV-B ?f N.Ag – III h AY572221
a Isolates used in this study.b Genogrouping based on multiple molecular marker used for RT-PCR amplification.c Genogroup designation based on phylogenetic analysis of nucleotide sequences.d Accession no. indicates the isolate-specific nucleotide sequences submitted in the Gene Bank.e N/S: gene sequences not submitted in GenBank.f ‘?’: group not determined since no amplification was obtained.g N.A: not amplified.h Only partial sequence (697–1105) was obtained using primers CN488 and CN491. Shaded area shows the differences between the genogroups based on
MMM and phylogenetic analysis.
numbering is based on the genome of T36 isolate (NC001661). Reverse transcription-polymerase chain reactionwas conducted as described previously (Roy and Brlansky,2004; Roy et al., 2003). The PCR products were resolved on0.8% agarose gels.
2.3. Nucleotide sequence analysis
The nucleotide sequences of the 5′-terminal regionwere determined for 21 Indian CTV isolates. Genotype-specific cDNAs from MMM primer pairs and CN487/489,CN488/491, and CN487/491 primer pairs amplified RT-PCRproducts were eluted using a gel purification kit (QIAGEN,Valencia, CA) and were directly ligated into a pGEM-T EasyVector (Promega, Madison, WI) according to the manufac-turer’s protocol. The nucleotide sequence of the inserts wasdetermined at the University of Florida DNA Sequencing
Core Laboratory using ABI Prism Big Dye Terminator cyclesequencing protocols (Applied Biosystems, Perkin-ElmerCorp., Foster City, CA). The dye terminator method was usedto analyze the fluorescent-labeled extension products in anApplied Biosystems Model 3100 genetic analyzer (Perkin-Elmer Corp.). Four to five clones from the PCR amplifiedproducts of each isolate were used to analyze the sequencevariation within the isolate.
2.4. Phylogenetic analysis
The nucleotide sequences of the selected clones were usedfor searching identical sequences in the database with theprograms of the GCG package (Devereux et al., 1984) andBLAST. Amino acid (aa) translation was done using theExpasy Translate Tool (http://us.expasy.org/tools/dna.html).Nucleotide and aa sequences were aligned using the program
A. Roy et al. / Virus Research 113 (2005) 132–142 135
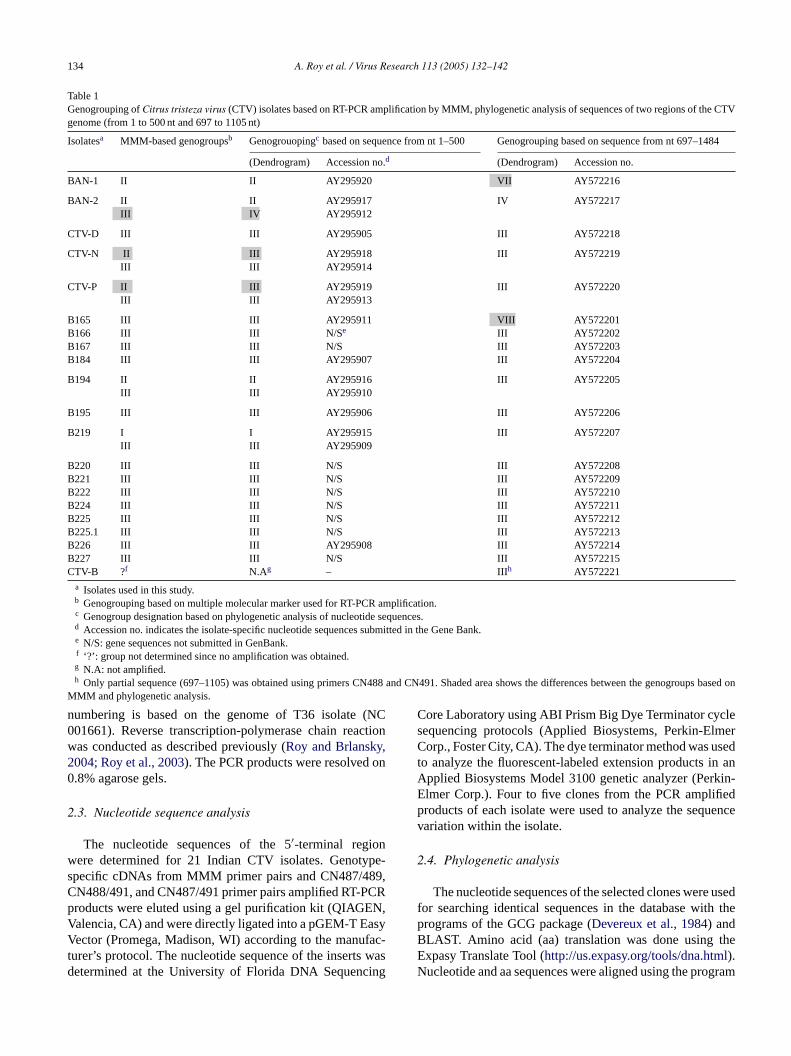
Table 2Percent nucleotide (above diagonal) and amino acid (below diagonal) identities between the selected Indian CTV isolates (A–E) and type isolates (F–H) basedon 5′-terminal region (nt 1–500) of the genomic RNA
Categorys Isolate/MMM/genogroupa Genogroupb Percent identity of nucleotide sequence
A B C D E F G H
A B219/T36/I I * 68 72 72 75 94 69 71B B194/T30/II II 67 * 89 87 83 69 98 85C CTV-N/T30/II III 70 90 * 97 84 72 89 94D B194/VT/III III 69 90 97 * 86 72 87 96E BAN-2/VT/III IV 72 83 83 85 * 75 84 83F T36/T36/I I 72 51 53 51 54 * 69 70G T30/T30/II II 68 97 92 93 86 51 * 86H VT/VT/III III 65 86 92 93 80 50 88 *
Percent identity of amino acid sequence
The nucleotide identity was based on the 5′ UTR and the partial region of ORF1a. The amino acid identity was based on the partially translated region(108–500 nt) of ORF1a. The asterisks are used for the homologous identities of A with A and B with B which would be 100% and also are used as a diagonalfor dividing the table so that two sets of data can be presented in the same table.
a The isolate names are followed by the MMM primer used for amplification and grouping based on PCR amplifications.b Grouping is based on analysis of actual sequences. Sequences with over 94% identity are placed in the same genogroup. There was one sequence that
belonged to Category A (B219 using T36 MMM), three belonged to category B (B194, BAN-1, and BAN-2 using T30 MMM), two belonged to category C(CTV-P and CTV-N using T30 MMM), one belonged to category E (BAN-2 using VT MMM), and the rest belonged to category D (CTV-D, CTV-N, CTV-P,B165, B166, B167, B184, B194, B195, B219, B220, B221, B222, B224, B225, B226, and B227 using VT MMM). SY568 and NUagA isolates were notincluded in this table.
Clustal-X (Thompson et al., 1997). Percent identity matrices,and nt and aa sequence alignments for each isolate were gen-erated using GeneDoc (Nicholas and Nicholas, 1997). Thephylogenetic relationships of all the Indian isolates with iso-late T3 (GenBank accession no. AY986484), and the sevenfully sequenced CTV isolates [T30 (GenBank accession no.AF260651), T36 (Accession no. U16304), T385 (Accessionno. Y18420), VT (Accession no. U56902), SY568 (Acces-sion no. AF001623), NUagA (Accession no. AB046398),Qaha from Egypt (Accession no. AY340974)], were deducedusing the Bootstrap Neighbor-Joining (N-J) methods in thePhylip formatted labels node tree. A ‘phb’ file was cre-ated in the program Clustal-X and the tree was visualizedusing the program TreeView (Win32) Version 1.6.6. The 5′-terminal sequences of gRNA of the 12 CTV isolates andeight clones under EMBL accession numbers from AJ401190to AJ401201 (Ayllon et al., 2001) and Y16838 to Y16845(Lopez et al., 1998) were aligned with all the Indian isolatesusing Clustal-X (Thompson et al., 1997) and were comparedwith MMM primer pairs amplified cloned products usingGeneDoc (Nicholas and Nicholas, 1997). Dendrograms weredisplayed using the TreeView. In order to detect putativerecombinant isolates, the phylogeny of gene segments wasdetermined using PHYLPRO (Weiller, 1998). The genes werescanned using 40 nucleotide-sliding windows. Each genetic
ue
r
were used for analysis of Indian isolates (Table 1). RT-PCRamplified products were obtained from 20 of the Indian iso-lates but not from the isolate CTV-B which did not give anamplification product with any of the three primer pairs;19 isolates were amplified by the VT-specific MMM, 5 byT30 and 1 by T36-specific MMM (Table 1). Two pairsof genotype-specific primers amplified each of the isolatesBAN-2, CTV-N, CTV-P, B194, and B219, indicating thepresence of mixtures of different CTV genotypes in theseplants. Throughout this paper, the amplified products are des-ignated as genogroups I–III which represents T36, T30, andVT isolate-specific genogroups, respectively.
The 5′-terminal sequences of 20 Indian CTV isolates dif-fered from each other by up to 69% (Table 2) and groupedthem into four different genotypes (Fig. 1). Most of the ampli-fication products had sequences belonging to their expectedgenogroups. However, the sequences of BAN-2 amplified byVT MMM, and those of CTV-N and CTV-P amplified by T30MMM belonged to other groups. The isolates BAN-1, BAN-2, and B194 amplified with the T30 MMM had 97–98% ntidentity with the T30 group while the isolates CTV-N andCTV-P amplified by the same T30 MMM had only 89% ntsequence identity with CTV isolates in that group. The twolatter sequences were closely related to those in the VT groupshowing about 94–96% nt identity with the VT and SY568
Pp
0-5or-%)ne%to
group consensus sequence was used as the reference seqfor the recombinant isolates.
3. Results
3.1. Analysis of CTV isolates using multiple molecularmarkers at the 5′-end of the genome by sequencing
Three pairs of genotype-specific MMM primer pairs fothe 5′-terminal region of CTV described byHilf et al. (1999)
nceand NUagA isolates. The nt identity of CTV-N and CTV-was over 97% with several Indian isolates in the VT grouand the isolate SY568 which suggested that these two T3′amplification products are more closely related to the Califnia isolate SY568 than to either the Japanese NUagA (96or the Israeli VT (94%) isolates. B219 was the only IndiaCTV isolate that produced an amplification product with thT36-5′-terminal region genotype primers and showed 94nt sequence identity with T36 decline isolate as compared69–71% nt identity with the two other groups (Table 2).
136 A. Roy et al. / Virus Research 113 (2005) 132–142
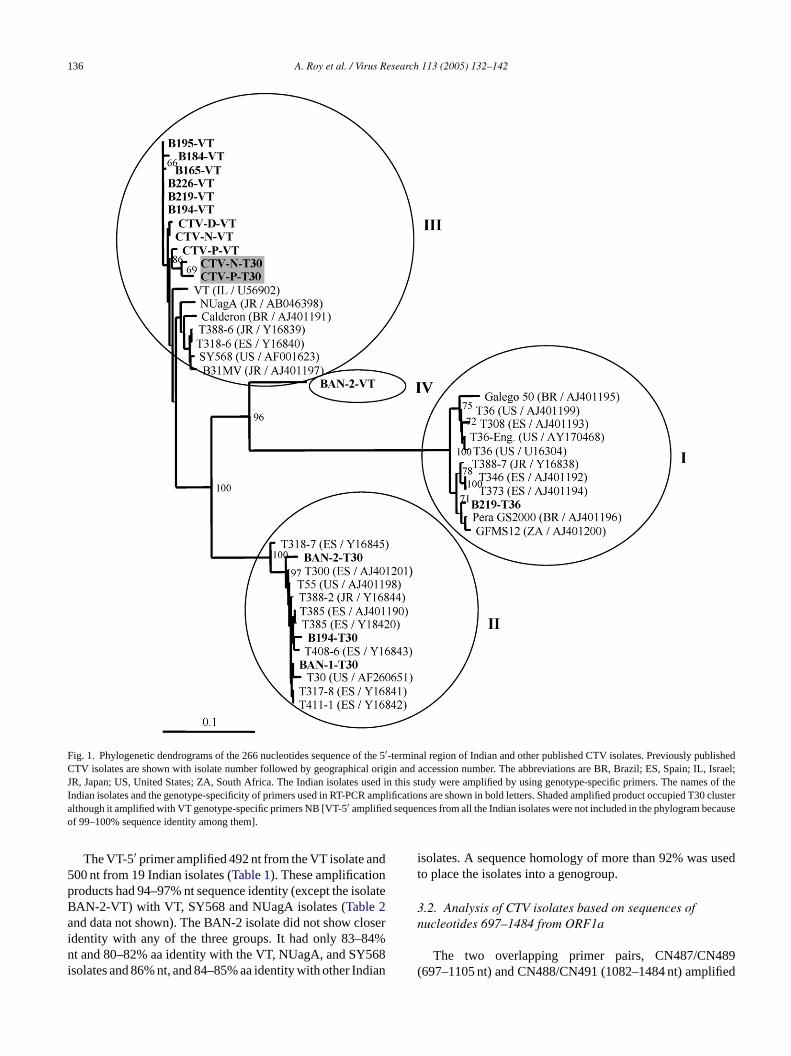
Fig. 1. Phylogenetic dendrograms of the 266 nucleotides sequence of the 5′-terminal region of Indian and other published CTV isolates. Previously publishedCTV isolates are shown with isolate number followed by geographical origin and accession number. The abbreviations are BR, Brazil; ES, Spain; IL, Israel;JR, Japan; US, United States; ZA, South Africa. The Indian isolates used in this study were amplified by using genotype-specific primers. The names of theIndian isolates and the genotype-specificity of primers used in RT-PCR amplifications are shown in bold letters. Shaded amplified product occupied T30clusteralthough it amplified with VT genotype-specific primers NB [VT-5′ amplified sequences from all the Indian isolates were not included in the phylogram becauseof 99–100% sequence identity among them].
The VT-5′ primer amplified 492 nt from the VT isolate and500 nt from 19 Indian isolates (Table 1). These amplificationproducts had 94–97% nt sequence identity (except the isolateBAN-2-VT) with VT, SY568 and NUagA isolates (Table 2and data not shown). The BAN-2 isolate did not show closeridentity with any of the three groups. It had only 83–84%nt and 80–82% aa identity with the VT, NUagA, and SY568isolates and 86% nt, and 84–85% aa identity with other Indian
isolates. A sequence homology of more than 92% was usedto place the isolates into a genogroup.
3.2. Analysis of CTV isolates based on sequences ofnucleotides 697–1484 from ORF1a
The two overlapping primer pairs, CN487/CN489(697–1105 nt) and CN488/CN491 (1082–1484 nt) amplified
A. Roy et al. / Virus Research 113 (2005) 132–142 137
Table 3Percent nucleotide identities among the Indian CTV isolates and selected published full-length sequences based on sequences from nt 697–1105 (above thediagonal) and nt 1082–1484 (below the diagonal)
Category Isolates Genogroupa (409nt/403nt) Percent nucleotide identity of CN487/489 primer pair amplified product
A B C D E F G H I J
A T36 I/I * 78 73 76 77 89 77 78 76 77B T30 II/II 82 * 88 90 91 79 92 90 91 92C VT III/III 80 90 * 93 94 76 88 89 94 95D CTV-N III/III 82 92 94 * 96 78 89 90 96 96E B195 III/III 82 91 95 96 * 79 90 91 97 98F BAN-2 IV/IV 91 83 81 84 83 * 78 78 78 79G T3 V/V 81 89 87 90 90 81 * 91 90 91H NUagA VI/VI 81 90 87 88 88 83 88 * 91 92I BAN-1 III/VII 81 90 90 92 92 82 87 92 * 97J B165 III/VIII 80 86 83 85 85 81 83 84 84 *
Percent nucleotide identity of CN488/491 primer pair amplified product
Indian isolates with over 94% identity at the nucleotide level are represented by one type isolate. The asterisks are used for the homologous identities of A withA and B with B which would be 100% and also are used as a diagonal for dividing the table so that two sets of data can be presented in the same table.
a Genogroups based on sequences of two different regions of CTV genome; 697–1105 and 1082–1484 nt. Shaded areas show differences in genotyping basedon the sequences of two regions described above. [There were four Indian CTV isolates in category D (BAN-1, CTV-D, CTV-N, and CTV-P), 15 in E (B165,B166, B167, B184, B194, B195, B219, B220, B221, B222, B224, B225, B225.1, B226, and B227), one in F (BAN-2) from CN487/489 genogroup. Therewere three Indian CTV isolates in category D (CTV-D, CTV-N, and CTV-P), 14 in E (B166, B167, B184, B194, B195, B219, B220, B221, B222, B224, B225,B225.1, B226, and B227), one in I (BAN-1), and one in J (B165) CN488/491 genogroup.]
RT-PCR products from most of the 21 Indian isolates. Theonly exception was that no product was obtained with theisolate CTV-B using the CN487/CN489 primer pair.Table 3summarizes the nt identity data for all the Indian isolatesfrom these product sequences. Except for the BAN-2 iso-late, all other Indian CTV isolates had a 96–98% nt identitybetween themselves and were closely related (93–95%) to theVT isolates in the region of nt 697–1105. However, the sub-sequent overlapping sequences (nt 1082–1484) of the sameisolates showed some interesting differences. Most isolatesshowed similar nt identity with the VT isolate in this region.But the sequences of BAN-1 and B165 which showed only90% nt and 83% nt identity, respectively, with the VT isolatein the sequence of nt 1082–1484. The sequence of the BAN-2isolate in this region had a 79–80% identity with the otherIndian CTV isolates and 88–89% identity with Qaha and T36isolate (Table 3).
Since the sequence divergence in the 1082–1484 ntregion was much higher than the 697–1105 nt region,further analysis was done by sequencing the 788 nt products(697–1484 nt) amplified by CN487/491 pair for all the iso-lates (except CTV-B). Complete sequencing of cDNA cloneswas done to check if the sequences in two regions belongedto same RNA strand or not. Analysis of these sequencesshowed that the above sequence divergences were actually
omt.titentin
mian
3.3. Phylogenetic relationships of CTV sequences at the5′ proximal end
A phylogenetic tree was constructed using the nucleotidesequences of the genotype-specific 5′-terminal region(1–500 nt) from the Indian CTV isolates and other sequencesavailable in the database using Clustal-X and Treeview pro-grams (data not shown). Since a larger number of sequenceswere available in the database for the 5′-terminal 266nucleotides, another phylogenetic tree was developed usingonly this region (Fig. 1). Four main clusters of CTV areidentified in both the dendrograms. Most of the amplifi-cation products from the MMM genotype-specific primersamplified from only the specific genotypes, as expected. TheT30-5′-specific primer produced amplification products fromfive of the Indian isolates. Three of these five isolates, BAN-1, BAN-2, and B194 formed a cluster along with the mildisolates T30 and T385 (Fig. 1) and belonged to genogroup II.Two other isolates, CTV-N, and CTV-P, formed a differentcluster with the Californian SY568, Japanese NUagA, andIsraeli VT isolate sequences (Fig. 1, genogroup III). Exceptfor BAN-2 isolate, amplification products from the VT-5′primer grouped together in the same branch with the VT iso-late (Fig. 1, genogroup III). The sequence of isolate BAN-2was unique and was placed in between the branch of the
6-
,
bytheed
present in the same RNA strands and did not result framplification of different virus populations from same planOut of 20 isolates, 17 isolates had 96% nt sequence idenwith California SY568 isolate and a 95% nt identity with thIsraeli VT isolate. The unique BAN-2 isolate shared 90%identity with T36. Sequence differences in the last 403 ntthe BAN-1 and B165 isolates lowered its nt identity fro96–98 to 91–94 and 83–86%, respectively, with other Indisolates.
y
T36 and T30 isolates (Fig. 1, genogroup IV). The B219 wasthe only isolate that gave an amplification product with T35′ primer and was clustered with the T36 isolate (Fig. 1,genogroup I).
In the previous studies (Ayllon et al., 2001; Lopez et al.1998) 94 clones of the 5′ proximal end of the CTV gRNAclustered into three groups. We expanded this work heresequencing 125 clones from 25 amplified products of20 Indian CTV isolates. Most of the isolates were assign
138 A. Roy et al. / Virus Research 113 (2005) 132–142
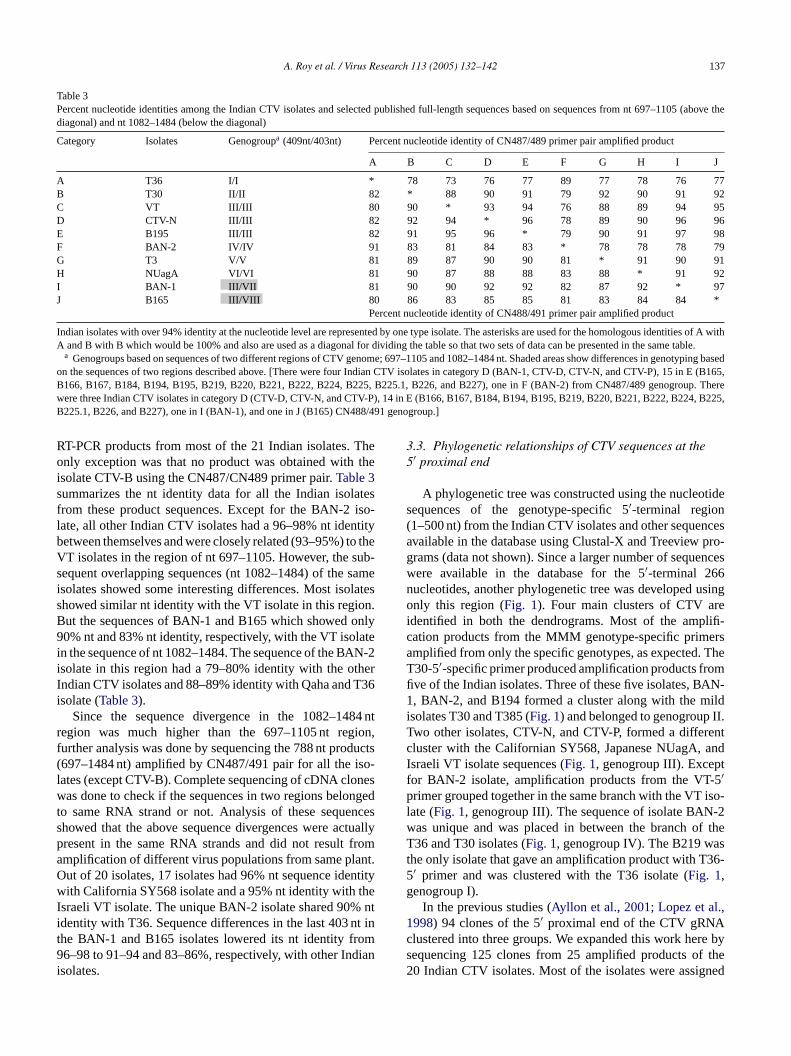
Fig. 2. Phylogenetic dendrograms based on nucleotide sequences of different regions of CTV gRNA from ORF1a: (A) 409 bases, 697–1105 nt; (B) 403 bases,1082–1484 nt; (C) 788 bases, 697–1484 nt. Sequences with about 95% nucleotide identity are grouped together (groups designated I–VIII).
to one of the three groups, except for the BAN-2 VT-5′sequence, which was placed in a new fourth group. Maxi-mum variability in the nucleotide sequence of CTV genomeshas been reported in the 5′ untranslated region (Ayllon et al.,2001; Lopez et al., 1998). Phylogenetic analysis using 266nucleotide sequences from all of the experimental isolates(from GenBank data) ofLopez et al. (1998)andAyllon etal. (2001)and the Indian CTV isolates under study displayedfour distinct clusters (Fig. 1). The analysis of either 266 or500 nt sequences from 5′ proximal end showed the presenceof four genogroups in the Indian CTV population insteadof three groups as previously reported (Ayllon et al., 2001;Lopez et al., 1998).
3.4. Phylogenetic relationship of Indian CTV isolatesbased on 788 nucleotides (697–1484 nt) in the 5′ region
A 788-nucleotide region (697–1484 nt) of CTV genomeswas analyzed by using two sets of primers amplifyingoverlapping regions. Only six genogroups were displayed inthe phylogram when the sequences of 409 nt (697–1105 nt;
with primers CN487/CN489) from the first half of the 788 ntregion were compared. But the sequences of amplifiedproducts in the second half of the region (nt 1082–1484;primers CN487/491) suggested that all the isolates couldbe clustered into eight genogroups (Fig. 2). The isolatesBAN-1 and B165 represented two new branches in thephylogenetic tree (Fig. 2). Although isolate CTV-B occu-pied the same genogroup with SY568 and VT isolates,this isolate was not amplified with genotype-specific5′-terminal MMM primers or with CN487/489 primerpairs, which indicated sequence diversity in the first halfof the 788 nt. Differences in genogrouping in the den-drograms based on sequences of these two overlappingregions indicated possible recombinations in some of theisolates.
The computer program PHYLPRO was utilized to graph-ically display the sequence relationships among the CTVisolates studied. The program determines pairwise distancesof all sequences, evaluates which patterns of distances inregions agree, and detects recombinant sequences. Resultsshowed no evidence of recombination when the 5′-end
A. Roy et al. / Virus Research 113 (2005) 132–142 139
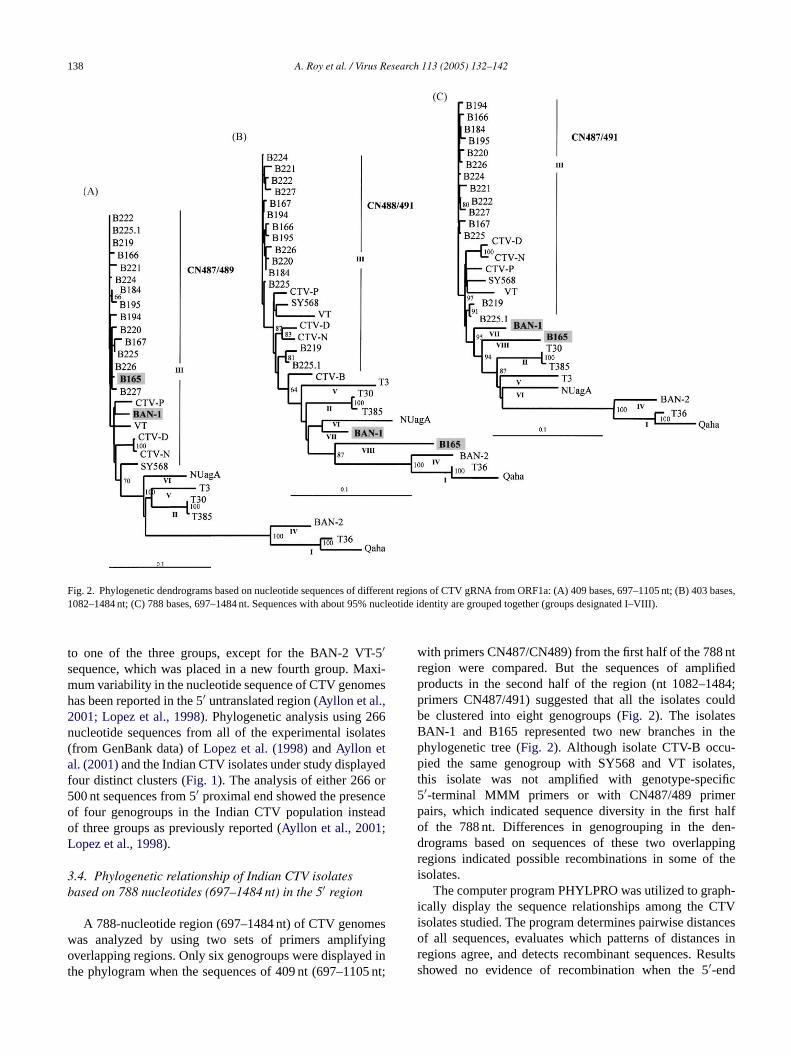
Fig. 3. Phylogenetic correlation profiles over the entire length of aligned 5′-end sequence (697–1484 nt) of 20 Indian CTV isolates. Phylogenetic correlation(y-axis) was obtained at each variable site from pairwise distance analysis of all aligned sequences by using the program PHYLPRO, with a fixed window of40 bp. Numbers under low phylogenetic correlation areas indicated possible recombination signals by arrows. In the graphx-axis is represented the value ofcorrelation coefficient [colours black lines represent isolates from genogroup III, aqua for genogroup IV, green for genogroup VII, and red for genogroup VIII].
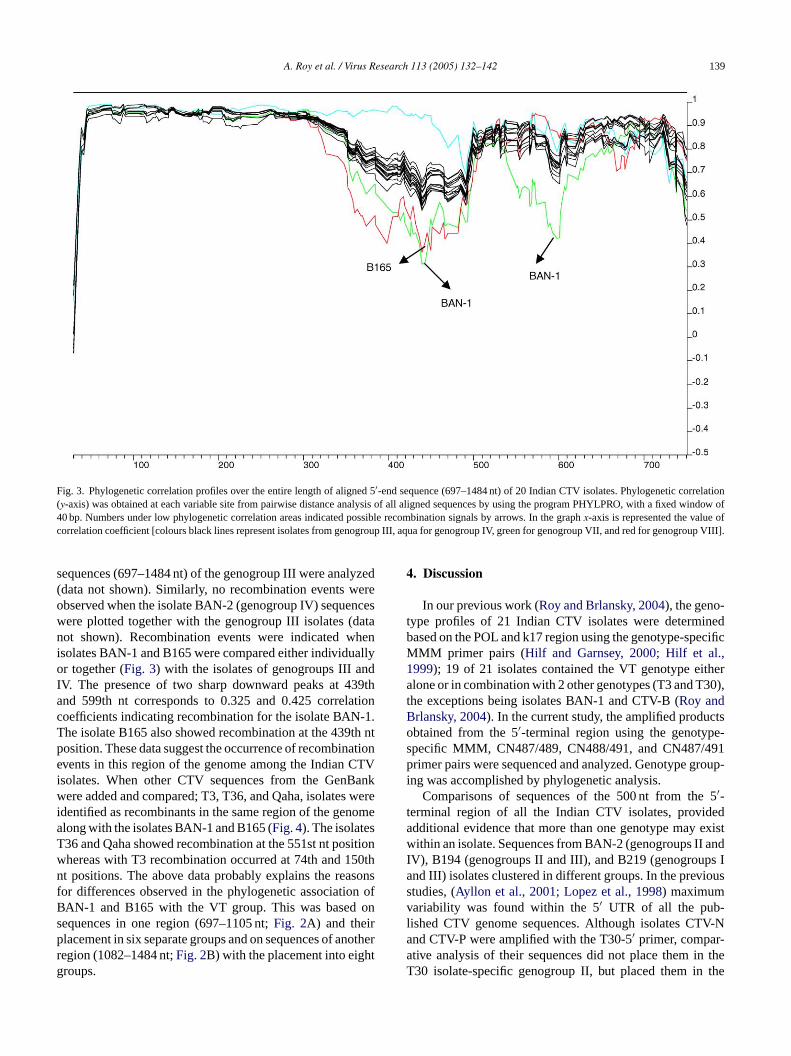
sequences (697–1484 nt) of the genogroup III were analyzed(data not shown). Similarly, no recombination events wereobserved when the isolate BAN-2 (genogroup IV) sequenceswere plotted together with the genogroup III isolates (datanot shown). Recombination events were indicated whenisolates BAN-1 and B165 were compared either individuallyor together (Fig. 3) with the isolates of genogroups III andIV. The presence of two sharp downward peaks at 439thand 599th nt corresponds to 0.325 and 0.425 correlationcoefficients indicating recombination for the isolate BAN-1.The isolate B165 also showed recombination at the 439th ntposition. These data suggest the occurrence of recombinationevents in this region of the genome among the Indian CTVisolates. When other CTV sequences from the GenBankwere added and compared; T3, T36, and Qaha, isolates wereidentified as recombinants in the same region of the genomealong with the isolates BAN-1 and B165 (Fig. 4). The isolatesT36 and Qaha showed recombination at the 551st nt positionwhereas with T3 recombination occurred at 74th and 150thnt positions. The above data probably explains the reasonsfor differences observed in the phylogenetic association ofBAN-1 and B165 with the VT group. This was based onsequences in one region (697–1105 nt;Fig. 2A) and theirplacement in six separate groups and on sequences of anotherregion (1082–1484 nt;Fig. 2B) with the placement into eight
4. Discussion
In our previous work (Roy and Brlansky, 2004), the geno-type profiles of 21 Indian CTV isolates were determinedbased on the POL and k17 region using the genotype-specificMMM primer pairs (Hilf and Garnsey, 2000; Hilf et al.,1999); 19 of 21 isolates contained the VT genotype eitheralone or in combination with 2 other genotypes (T3 and T30),the exceptions being isolates BAN-1 and CTV-B (Roy andBrlansky, 2004). In the current study, the amplified productsobtained from the 5′-terminal region using the genotype-specific MMM, CN487/489, CN488/491, and CN487/491primer pairs were sequenced and analyzed. Genotype group-ing was accomplished by phylogenetic analysis.
Comparisons of sequences of the 500 nt from the 5′-terminal region of all the Indian CTV isolates, providedadditional evidence that more than one genotype may existwithin an isolate. Sequences from BAN-2 (genogroups II andIV), B194 (genogroups II and III), and B219 (genogroups Iand III) isolates clustered in different groups. In the previousstudies, (Ayllon et al., 2001; Lopez et al., 1998) maximumvariability was found within the 5′ UTR of all the pub-lished CTV genome sequences. Although isolates CTV-Nand CTV-P were amplified with the T30-5′ primer, compar-ative analysis of their sequences did not place them in the
the
groups. T30 isolate-specific genogroup II, but placed them in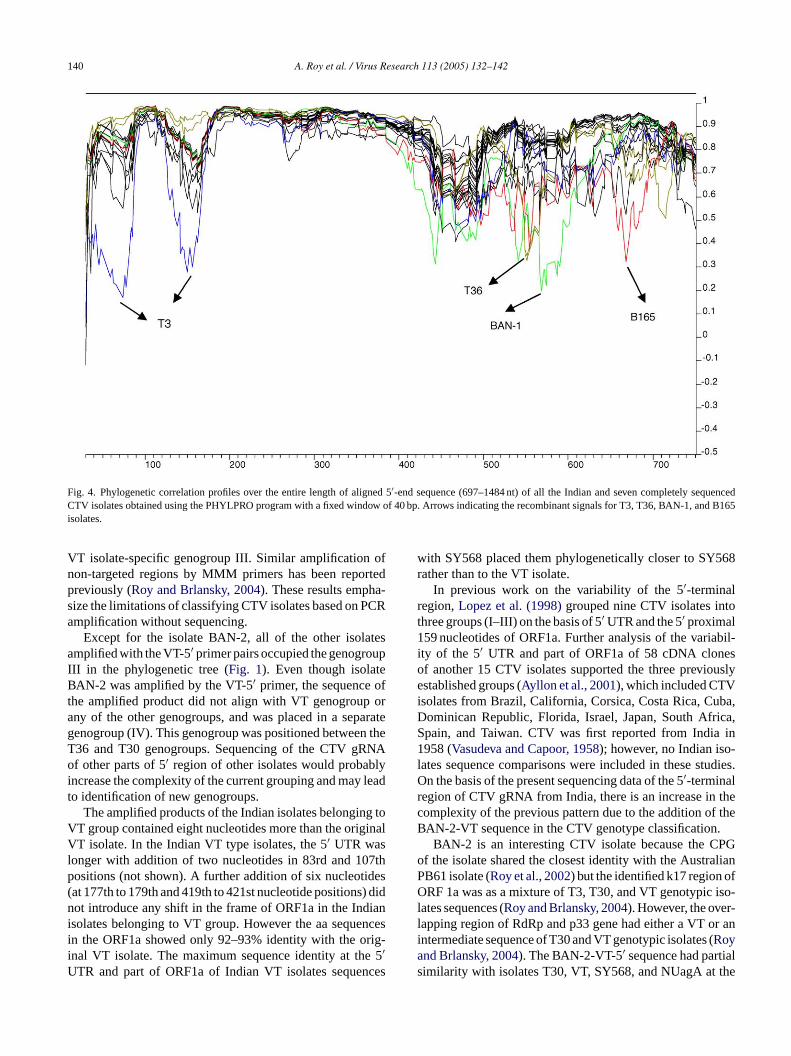
140 A. Roy et al. / Virus Research 113 (2005) 132–142
Fig. 4. Phylogenetic correlation profiles over the entire length of aligned 5′-end sequence (697–1484 nt) of all the Indian and seven completely sequencedCTV isolates obtained using the PHYLPRO program with a fixed window of 40 bp. Arrows indicating the recombinant signals for T3, T36, BAN-1, and B165isolates.
VT isolate-specific genogroup III. Similar amplification ofnon-targeted regions by MMM primers has been reportedpreviously (Roy and Brlansky, 2004). These results empha-size the limitations of classifying CTV isolates based on PCRamplification without sequencing.
Except for the isolate BAN-2, all of the other isolatesamplified with the VT-5′ primer pairs occupied the genogroupIII in the phylogenetic tree (Fig. 1). Even though isolateBAN-2 was amplified by the VT-5′ primer, the sequence ofthe amplified product did not align with VT genogroup orany of the other genogroups, and was placed in a separategenogroup (IV). This genogroup was positioned between theT36 and T30 genogroups. Sequencing of the CTV gRNAof other parts of 5′ region of other isolates would probablyincrease the complexity of the current grouping and may leadto identification of new genogroups.
The amplified products of the Indian isolates belonging toVT group contained eight nucleotides more than the originalVT isolate. In the Indian VT type isolates, the 5′ UTR waslonger with addition of two nucleotides in 83rd and 107thpositions (not shown). A further addition of six nucleotides(at 177th to 179th and 419th to 421st nucleotide positions) didnot introduce any shift in the frame of ORF1a in the Indianisolates belonging to VT group. However the aa sequencesin the ORF1a showed only 92–93% identity with the orig-
5es
with SY568 placed them phylogenetically closer to SY568rather than to the VT isolate.
In previous work on the variability of the 5′-terminalregion,Lopez et al. (1998)grouped nine CTV isolates intothree groups (I–III) on the basis of 5′ UTR and the 5′ proximal159 nucleotides of ORF1a. Further analysis of the variabil-ity of the 5′ UTR and part of ORF1a of 58 cDNA clonesof another 15 CTV isolates supported the three previouslyestablished groups (Ayllon et al., 2001), which included CTVisolates from Brazil, California, Corsica, Costa Rica, Cuba,Dominican Republic, Florida, Israel, Japan, South Africa,Spain, and Taiwan. CTV was first reported from India in1958 (Vasudeva and Capoor, 1958); however, no Indian iso-lates sequence comparisons were included in these studies.On the basis of the present sequencing data of the 5′-terminalregion of CTV gRNA from India, there is an increase in thecomplexity of the previous pattern due to the addition of theBAN-2-VT sequence in the CTV genotype classification.
BAN-2 is an interesting CTV isolate because the CPGof the isolate shared the closest identity with the AustralianPB61 isolate (Roy et al., 2002) but the identified k17 region ofORF 1a was as a mixture of T3, T30, and VT genotypic iso-lates sequences (Roy and Brlansky, 2004). However, the over-lapping region of RdRp and p33 gene had either a VT or anintermediate sequence of T30 and VT genotypic isolates (Roy
inal VT isolate. The maximum sequence identity at the′UTR and part of ORF1a of Indian VT isolates sequenc
and Brlansky, 2004). The BAN-2-VT-5′ sequence had partialsimilarity with isolates T30, VT, SY568, and NUagA at the
A. Roy et al. / Virus Research 113 (2005) 132–142 141
5′ UTR regions of the gRNA and a maximum aa relatednesswith T30 (86%), and placed the isolate in a new genogroup inthe phylogenetic tree. Based on sequence data from variousregions of the gRNA, BAN-2 is a mixture of strains. Ampli-fication with any of the genotype-specific 5′ MMM was nota predictor of the sequence homology. Similar results werefound in the POL and k17 primer amplified sequencing data(Roy and Brlansky, 2004). Although the amplified sequenceof BAN-2 isolate from ORF1a (697–1484 nt) shared the max-imum relatedness with T36 genotype (89–90%), it was posi-tioned in a different clade in the phylogenetic tree.
The 5′ region of the CTV genome is the most variableand a maximum of 70% identities among the nucleotidesequences have been found (Mawassi et al, 1995, 1996). Thevariable 5′region includes ORFs 1a, 1b, and 2. The genomesize of ORF1a is∼9.4 kb and more variability occurs inthis region than ORFs 1b and 2. Comparison and analy-sis of different regions of ORF1a were used in this studyin an attempt to standardize the CTV genogrouping. In anearlier study, we showed the presence of five genogroupsin 21 Indian CTV isolates from the k17 region of ORF1a(∼4850–5230 nt) and the overlapping region of ORFs 1b and2 (Roy and Brlansky, 2004). In this current study, an anal-ysis of the 5′-end (1–500 nt) MMM amplified products alsogrouped all the isolates into four genogroups (Fig. 1). The
weirsolelatnt-om
-o
inon
onN-reothhehata-w
s thtlso
rat
tses
ncetlyon
sible for symptom development may have co-evolved with the5′-terminal end sequence. In a previous study (Satyanarayanaet al., 1999), it was found that an engineered T36 isolateRNA replicon, had reduced replication levels inNicotianabenthamiana protoplasts when the T36 5′ UTR was substi-tuted individually by the isolates T30 (type II) or VT (typeIII). This result indicated that the T36 replicase interacts lessefficiently with heterologous 5′ UTRs.
In summary, four to eight genogroups of CTV isolateswere identified based on sequences from different regionsof ORF1a. The degrees of variation and genetic relationshipwith other reported CTV isolates were shown by phyloge-netic analysis. The sole member of the fourth genogroup, theBAN-2 isolate, proposed that a new genotype is present inIndia. Detection of recombinant events in the sequence ofsome isolates suggests that recombination may have playeda significant role in evolution of CTV isolates since it is com-mon to find mixtures of genotypes in infected plants (e.g.,isolates BAN-1, BAN-2, and others in this study).
Acknowledgements
The authors are grateful to Dr. Padma Ramachandran,Indian Agricultural Research Institute, New Delhi, for pro-viding the BAN-1 and BAN-2 CTV isolates at the Exotic
rsificngida-
lf,i,0.
e
.,
l.
nge.-
t of2,
.,s
e
fg
r
e
e
-
Citrus Pathogen Collection at Beltsville, MD. The authoacknowledge the financial assistance from the USDA SpecCooperative Agreement Exotic Citrus Disease Grant durithis investigation. This research was supported by the FlorAgricultural Experiment Station, and approved for publication as Journal Series No. R-09958.
References
Albiach-Marti, M.R., Mawassi, M., Gowda, S., Satyanarayana, T., HiM.E., Shankar, S., Almira, E.C., Vives, M.C., Lopez, C., GuerrJ., Flores, R., Moreno, P., Garnsey, S.M., Dawson, W.O., 200Sequences ofCitrus tristeza virus separated in time and space aressentially identical. J. Virol. 74, 6856–6865.
Ayllon, M.A., Rubio, L., Moya, A., Guerri, J., Moreno, P., 1999. Thehaplotype distribution of two genes ofCitrus tristeza virus is alteredafter host change in aphid transmission. Virology 255, 32–39.
Ayllon, M.A., Lopez, C., Navas-Castillo, J., Garnsey, S.M., Guerri, JFlores, R., Moreno, P., 2001. Polymorphism of the 5′ terminal regionof Citrus tristeza virus (CTV) RNA: incidence of three sequencetypes in isolates of different origin and pathogenicity. Arch. Viro146, 27–40.
Bar-Joseph, M., Marcus, R., Lee, R.F., 1989. The continuous challeof Citrus tristeza virus control. Annu. Rev. Phytopathol. 27, 291–316
Brlansky, R.H., Damsteegt, V.D., Howd, D.S., Roy, A., 2003. Molecular analyses ofCitrus tristeza virus subisolates separated by aphidtransmission. Plant Dis. 87, 397–401.
Devereux, J., Haeberli, P., Smithies, O., 1984. A comprehensive sesequence analysis programmes for the VAX. Nucl. Acids Res. 1387–395.
Febres, V.J., Ashoulin, L., Mawassi, M.E., Frank, A., Bar-Joseph, MManjunath, K.L., Lee, R.F., Niblett, C.L., 1996. The p27 protein ipresent at the end of theCitrus tristeza virus particles. Phytopathology86, 1331–1335.
number of genogroups increased from four to six whenanalyzed the amplified products of CN487/489 primer pa(697–1105 nt). The two additional clades contained the smembers isolate T3 from Florida and the Japanese isoNUagA, respectively. When we analyzed the 1082–1484amplified products, the number of genogroups increased frsix to eight (Fig. 2B) and an additional two Indian isolates BAN-1 and B165 were separated. Further analysisthe 697–1484 nt products did not change the genogroup(Fig. 2C). Genogrouping was affected by the particular regifrom the 5′ half of the CTV genome.
Phylogenetic analysis of the CN487/491 amplified regishowed the existence of three new genotypes (BAN-1, BA2, and B165) in the Indian CTV population. Mutations athe basis of all the known genotypes where we see bsilent (synonymous) and nonsynonymous mutations. Furtanalysis of the 697–1484 nt using PHYLPRO showed tBAN-1 and B165 CTV isolates were evolved by recombintion (Fig. 3). This finding supports the existence of three nesequence types among the studied isolates and explaintopology of the phylogenetic tree (Fig. 2). These data suggesthat in addition to mutations, recombination may have aplayed an important role in evolution of CTV genotypes.
Isolates under study cause a wide range of mild, modeand severe symptoms in different host plants (Roy and Brlan-sky, 2004). Symptom expression on different citrus hosmight depend on the relative titer of different sequence typof the mixture (Ayllon et al., 2001). Correlation of symp-tom expression in different hosts to a particular sequedoes not mean that 5′-end sequences under study are direcinvolved in the pathogenesis. Regions in the genome resp
142 A. Roy et al. / Virus Research 113 (2005) 132–142
Hilf, M.E., Garnsey, S.M., 2000. Characterization and classification ofCitrus tristeza virus isolates by amplification of multiple molecu-lar markers. In: Proceedings of the 14th Conference on InternationalOrgan Citrus Virology, Brazil 1998, IOCV, Riverside, CA, pp. 18–27.
Hilf, M.E., Karasev, A.N., Albiach-Marti, R.M., Dawson, W.O., Garnsey,S.M., 1999. Two paths of sequence divergence in theCitrus tristezavirus complex. Phytopathology 89, 336–342.
Hilf, M.E., Karasev, A.V., Pappu, H.R., Gumpf, D., Niblett, C.L., Gar-nsey, S.M., 1995. Characterization ofCitrus tristeza virus subgenomicRNAs in infected tissue. Virology 208, 576–582.
Karasev, A.V., 2000. Genetic diversity and evolution of closteroviruses.Annu. Rev. Phytopathol. 38, 293–324.
Karasev, A.V., Boyko, V.P., Gowda, S., Nikolaev, O.N., Hilf, M.E.,Koonin, E.V., Niblett, C.L., Cline, K., Gumpf, D., Lee, R.F., Garnsey,S.M., Lewandowski, D.J., Dawson, W.O., 1995. Complete sequenceof Citrus tristeza virus genome. Virology 208, 511–520.
Lopez, C., Ayllon, M.A., Navas-Castillo, J., Guerri, J., Moreno, P., Flores,R., 1998. Molecular variability of the 5′- and 3′-terminal regions ofCitrus tristeza virus RNA. Phytopathology 88, 685–691.
Martelli, G.P., Agranovsky, A.A., Bar-Joseph, M., Boscia, D., Candresse,T., Coutts, R.H., Dolja, V.V., Falk, B.W., Gonsalves, D., Jelkmann,W., Karasev, A.V., Minafra, A., Namba, S., Vetten, H.J., Wisler, G.C.,Yoshikawa, N., 2002. The family Closteroviridae revised. Arch. Virol.147, 2039–2044.
Mawassi, M.E., Karasev, A.V., Mietkiewska, E., Gafny, R., Lee, R.F.,Dawson, W.O., Bar-Joseph, M., 1995. Defective RNA molecules asso-ciated withCitrus tristeza virus. Virology 208, 383–387.
Mawassi, M.E., Mietkiewska, E., Gofman, R., Yang, G., Bar-Joseph, M.,1996. Unusual sequence relationships between two isolates ofCitrustristeza virus. J. Gen. Virol. 77, 2359–2364.
as.
.,,,ce
and organization of eight 3′ open reading frames of theCitrus tristezaclosterovirus genome. Virology 199, 35–46.
Roy, A., Ramachandran, P., Brlansky, R.H., 2002. Molecular character-ization of Indian Citrus tristeza virus isolates. Phytopathology 92,71.
Roy, A., Ramachandran, P., Brlansky, R.H., 2003. Grouping and compari-son of IndianCitrus tristeza virus isolates based on coat protein genesequences and restriction analysis patterns. Arch. Virol. 148, 707–722.
Roy, A., Brlansky, R.H., 2004. Genotype classification and molecularevidence for the presence of mixed infections in IndianCitrus tristezavirus isolates. Arch. Virol. 149, 1929.
Satyanarayana, T., Gowda, S., Boyko, V.P., Albiach-Martı́, M.R.,Mawassi, M., Navas Castillo, J., Karasev, A.V., Dolja, V., Hilf, M.E.,Lewandowski, D.J., Moreno, P., Bar-Joseph, M., Garnsey, S.M., Daw-son, W.O., 1999. An engineered closterovirus RNA replicon andanalysis of heterologous terminal sequences for replication. Proc. Natl.Acad. Sci. U.S.A. 96, 7433–7438.
Suastika, G., Natsuaki, T., Terui, H., Kano, T., Ieki, H., Okuda, S., 2001.Nucleotide sequence ofCitrus tristeza virus seedling yellow isolate.J. Gen. Plant Pathol. 67, 73–77.
Thompson, J.D., Gibson, T.J., Plewniak, F., Jeanmougin, F., Higgins,D.G., 1997. The Clustal X windows interface: flexible strategies formultiple sequence alignment aided by quality analysis tools. Nucl.Acids Res. 24, 4876–4882.
Vasudeva, R.S., Capoor, S.P., 1958. Citrus disease in Bombay State. Bull.Plant Prot. 6, 91.
Vives, M.C., Rubio, L., Lopez, C., Navas-Castillo, J., Albiach Marti,M.R., Dawson, W.O., Guerri, J., Flores, R., Moreno, P., 1999. Thecomplete genome sequence of the major component of a mildCitrus
ct-ol.
r
Nicholas Karl, B., Nicholas Hugh, Jr., B., 1997. GeneDoc:tool for editing and annotating multiple sequence alignmentwww.psc.edu/biomed/genedoc.
Pappu, H.R., Karasev, A.V., Anderson, E.J., Pappu, S.S., Hilf, M.EFebres, V.J., Eckloff, R.M.G., McCaffery, M., Boyko, V., GowdaS., Dolja, V.V., Koonin, E.V., Gumpf, D., Cline, K.C., Garnsey, S.M.Dawson, W.O., Lee, R.F., Niblett, C.L., 1994. Nucleotide sequen
tristeza virus isolate. J. Gen. Virol. 80, 811–816.Weiller, G.F., 1998. Phylogenetic profiles: a graphical method for dete
ing genetic recombinations in homologous sequences. Mol. Biol. Ev15, 326–335.
Yang, Z.N., Mathews, D.H., Doods, J.A., Mirkov, T.E., 1999. Moleculacharacterization of an isolate ofCitrus tristeza virus that causes severesymptoms in sweet orange. Virus Genes 19, 131–142.