Embed Size (px)
Citation preview
Assessment of seasonal and climatic effects Assessment of seasonal and climatic effects on the incidence and species composition of on the incidence and species composition of
malaria by using GIS methodsmalaria by using GIS methods
Ali-Akbar Haghdoost
Neal Alexander (supervisor)
Main objectives
1. Assessment of the feasibility of an early warning system based on ground climate and remote sensing data
2. Assessment of the interaction between Plasmodium spp from different points of view: meta-analysis, modelling, and extended analysis of a large epidemiological dataset
Climate effects on malaria
1. The rate at which mosquitoes develop into adults
2. Frequency of blood feeding
3. Adult mosquito survival
4. The incubation time of parasites in the mosquito
Other considerations related to climate
1. Deforestation
2. Migration and urbanisation
3. Changing human behaviour
4. Natural disaster and conflict
GIS and malaria
Sipe (2003) reviewed the GIS and malaria literature and divided the publications into the five categories outlined below:
1. Mapping malaria incidence/prevalence
2. Mapping the relationships between malaria incidence/prevalence and other potential related variables
3. Using innovative methods of collecting data such as remote sensing (e.g., GIS)
4. Modelling malaria risks
5. General commentary and reviews of GIS used in malaria control and research
Modelling of malaria (1)
1. Modelling of the abundance of vectors
2. Modelling of the frequency of malaria cases/infections
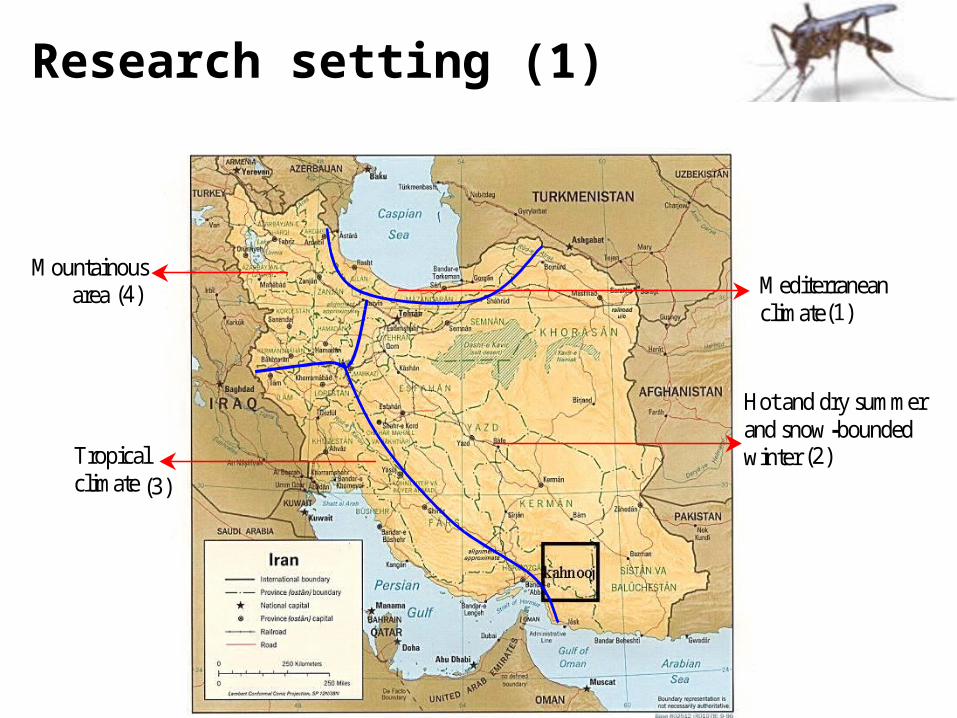
Research setting (1)
Mediterraneanclimate
Hot and dry summer and snow -boundedwinter
Mountainousarea
Tropicalclimate
(4)
(2)
(1)
(3)
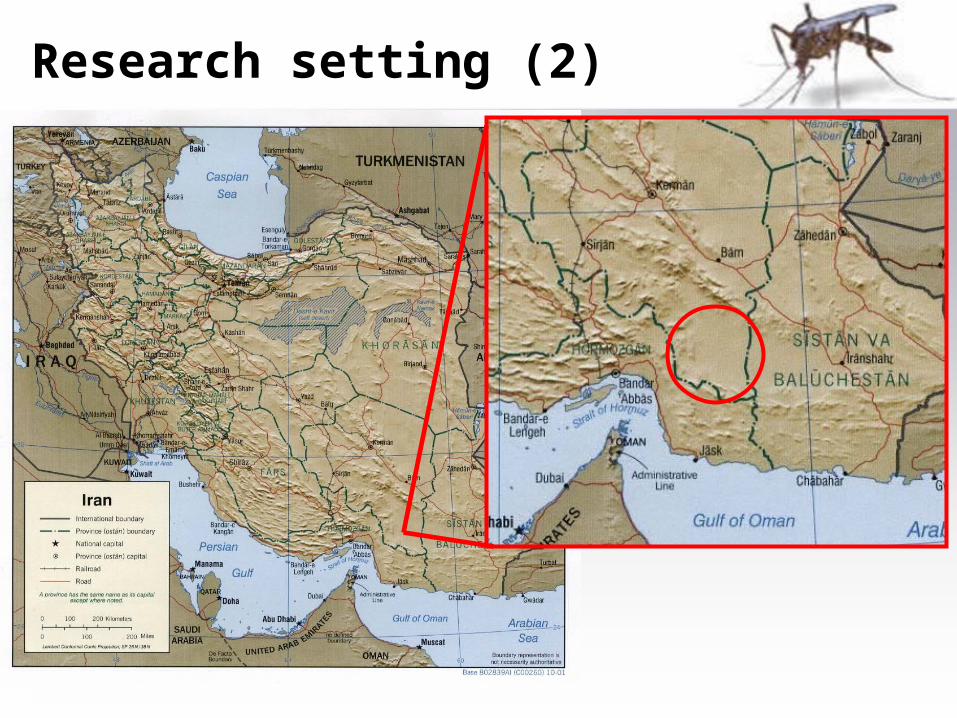
Research setting (2)
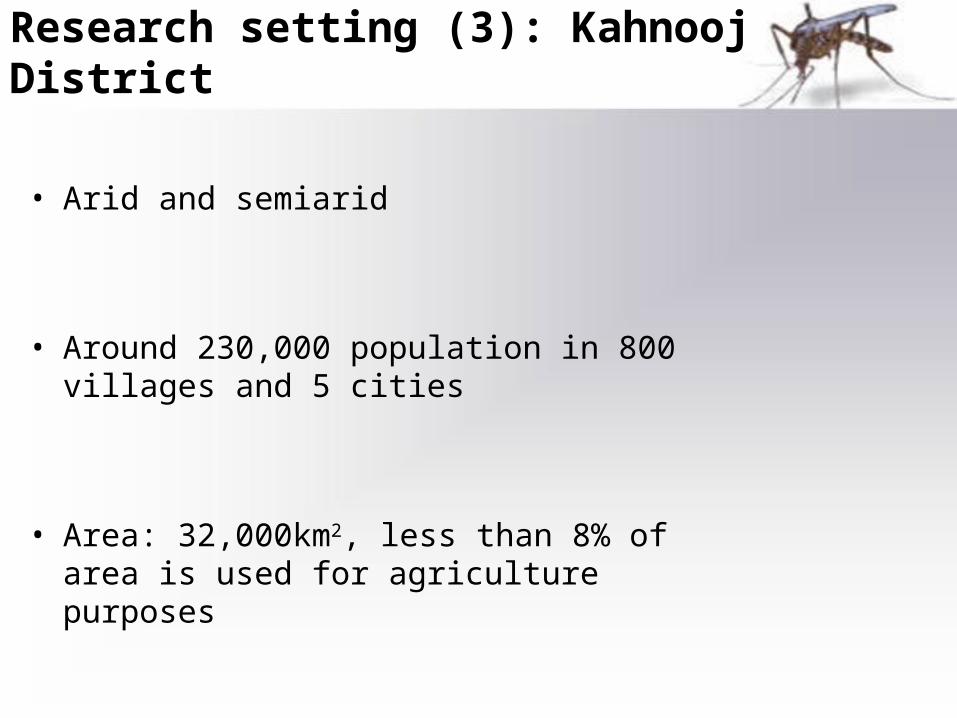
Research setting (3): Kahnooj District
• Arid and semiarid
• Around 230,000 population in 800 villages and 5 cities
• Area: 32,000km2, less than 8% of area is used for agriculture purposes
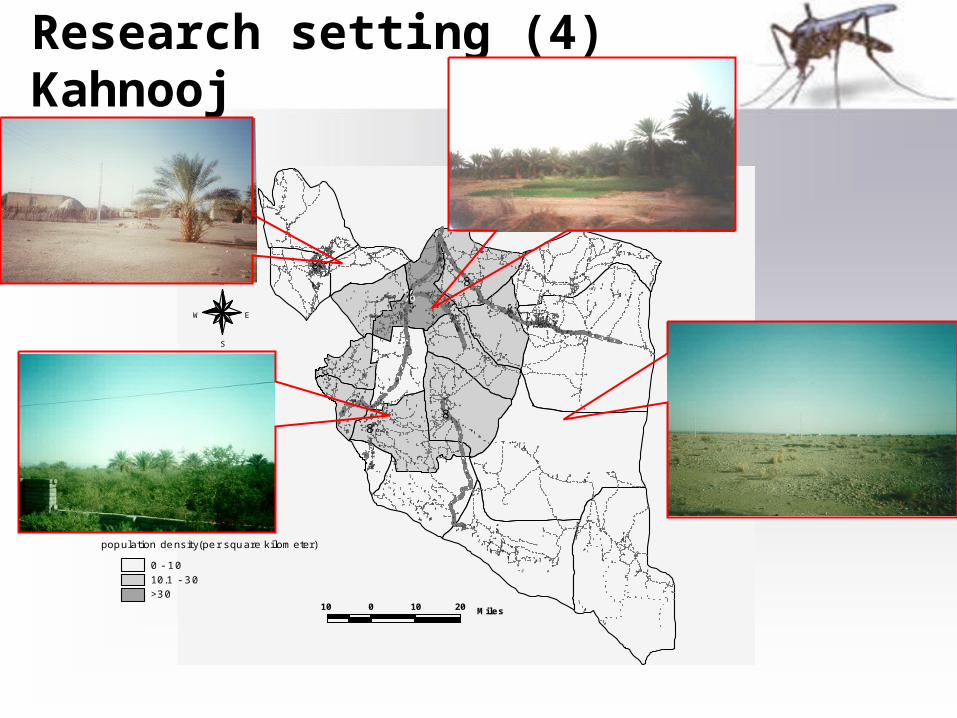
Research setting (4) Kahnooj
"8
"8"8"8
"8
"8
"8 "8
"8 "8 "8"8"8 "8 "8
"8"8 "8"8"8 "8"8 "8
"8"8"8"8"8"8 "8
"8"8
"8 "8"8 "8"8"8 "8"8 "8"8 "8 "8"8 "8"8"8"8"8"8 "8 "8"8 "8"8 "8"8"8"8"8 "8 "8"8 "8 "8"8 "8"8 "8"8 "8 "8"8"8 "8 "8"8 "8"8 "8"8"8"8
"8
"8"8
"8"8"8"8 "8"8"8 "8 "8"8 "8"8 "8"8 "8"8 "8"8
"8"8"8 "8"8 "8
"8"8 "8 "8"8 "8"8"8 "8"8"8 "8
"8 "8"8"8"8 "8 "8"8"8 "8 "8"8
"8"8"8 "8
"8 "8"8"8"8 "8 "8"8"8 "8"8
"8"8"8 "8"8 "8
"8"8
"8"8"8 "8
"8 "8"8"8"8"8 "8"8 "8 "8"8 "8 "8"8"8 "8 "8"8"8"8 "8 "8 "8"8"8 "8"8"8 "8
"8"8 "8"8"8 "8"8 "8"8 "8"8 "8"8"8 "8 "8"8"8 "8 "8"8 "8"8"8 "8"8 "8"8 "8"8 "8"8"8"8 "8"8 "8 "8"8"8 "8 "8 "8"8 "8 "8"8"8"8 "8"8 "8"8 "8 "8"8 "8 "8"8 "8"8 "8"8 "8"8"8"8 "8"8
"8"8
"8
"8"8"8 "8"8"8"8"8
"8"8"8 "8"8"8"8 "8"8 "8"8"8 "8
"8"8"8
"8
"8"8 "8
"8 "8"8
"8 "8"8
"8"8"8 "8"8"8 "8 "8 "8 "8"8 "8"8"8"8 "8"8 "8 "8"8"8 "8"8 "8"8 "8 "8 "8 "8"8"8 "8 "8 "8"8"8 "8"8"8"8 "8"8"8"8 "8"8 "8"8 "8"8"8"8"8"8"8 "8"8"8 "8 "8"8"8 "8"8 "8"8"8"8 "8"8 "8 "8"8"8 "8"8 "8"8"8 "8"8 "8 "8"8 "8 "8 "8"8"8
"8"8"8 "8"8"8 "8
"8
"8
"8 "8"8 "8"8 "8"8 "8"8 "8"8 "8 "8"8 "8"8 "8 "8"8"8 "8 "8"8 "8"8 "8"8"8 "8"8 "8 "8"8"8"8 "8"8"8 "8 "8"8 "8"8"8"8"8 "8 "8"8 "8 "8"8 "8 "8"8"8 "8"8"8 "8"8 "8 "8"8"8 "8 "8"8"8 "8"8"8 "8"8"8 "8 "8"8"8"8"8"8"8 "8"8"8 "8"8 "8"8"8"8"8 "8"8"8"8"8 "8"8"8"8"8 "8
"8
"8
"8
"8
"8"8"8
"8"8"8"8"8 "8"8 "8"8"8 "8 "8"8 "8"8 "8 "8"8 "8 "8
"8"8"8"8"8 "8"8
"8"8"8 "8 "8"8 "8 "8"8"8 "8 "8 "8"8 "8"8 "8"8"8 "8 "8"8 "8"8 "8"8"8"8 "8"8"8 "8 "8"8 "8"8 "8"8"8 "8 "8"8"8"8"8 "8"8 "8 "8"8 "8"8"8 "8"8 "8"8 "8"8"8 "8 "8"8"8"8"8 "8"8 "8"8 "8 "8 "8 "8"8 "8"8"8"8"8 "8 "8"8 "8"8"8"8 "8 "8 "8"8 "8"8"8 "8 "8 "8"8 "8 "8"8"8"8"8 "8 "8"8"8 "8"8 "8"8"8"8 "8 "8"8"8 "8 "8"8 "8 "8"8 "8"8 "8"8 "8"8"8 "8"8 "8"8 "8 "8"8 "8"8 "8"8"8 "8 "8"8"8 "8 "8"8 "8
"8"8"8 "8 "8 "8"8"8 "8
"8"8
"8
"8 "8
"8
"8
"8
"8
"8
"8"8
"8
"8
"8"8 "8 "8
"8 "8"8 "8"8"8 "8 "8"8"8 "8"8 "8"8 "8"8"8 "8"8"8"8 "8"8"8 "8
"8"8"8"8
"8 "8"8 "8"8"8 "8"8"8"8"8"8
"8
"8 "8
"8
"8
"8"8 "8 "8"8 "8"8"8 "8 "8"8 "8"8"8 "8"8 "8"8 "8"8"8"8"8 "8"8"8"8 "8 "8"8"8"8"8 "8 "8"8"8"8"8 "8 "8
"8 "8 "8"8
"8"8
"8 "8"8 "8"8 "8"8 "8
"8
"8
"8"8 "8"8
"8"8"8
"8
"8
"8"8"8 "8"8"8 "8 "8"8 "8"8 "8 "8"8 "8"8 "8 "8"8"8"8"8"8 "8"8"8 "8"8"8 "8"8 "8 "8
"8"8 "8"8"8 "8"8"8 "8"8 "8"8 "8"8"8 "8"8 "8"8"8 "8"8 "8"8
"8 "8"8 "8"8
"8"8 "8 "8
"8"8 "8"8 "8
"8 "8
"8 "8"8 "8"8
"8
"8
"8
"8
"8
"8 "8"8"8"8 "8 "8
"8"8"8 "8"8 "8"8"8 "8
"8 "8"8 "8 "8"8 "8
"8 "8
"8 "8"8 "8
"8"8 "8"8"8 "8"8 "8
"8"8 "8 "8"8
"8"8
"8"8"8"8 "8"8"8 "8"8"8"8"8
"8"8
"8"8"8"8 "8"8"8"8
"8"8"8 "8 "8"8"8"8 "8"8"8 "8 "8"8"8
"8"8"8 "8"8"8 "8"8 "8 "8"8 "8"8 "8 "8 "8"8"8 "8 "8"8 "8 "8"8"8"8
"8"8
"8
"8
"8 "8"8"8
"8
"8 "8"8 "8"8 "8"8
"8"8"8 "8 "8
"8"8"8 "8
"8"8 "8"8"8"8"8"8"8 "8 "8"8 "8
"8"8 "8"8"8"8"8
"8 "8"8"8"8 "8"8"8 "8"8"8
"8"8"8
"8"8
"8
"8
"8"8 "8 "8"8"8"8 "8"8 "8"8 "8 "8"8"8"8 "8"8 "8
"8"8"8 "8 "8"8 "8"8"8 "8"8 "8"8 "8"8 "8"8
"8"8"8 "8 "8"8 "8"8
"8"8"8"8
"8"8"8
"8
"8"8
"8"8
"8
"8 "8"8 "8 "8"8 "8"8 "8"8"8 "8"8 "8"8"8"8 "8"8"8"8 "8"8
"8 "8 "8"8"8"8"8 "8 "8"8 "8 "8"8"8"8 "8"8"8 "8"8 "8"8 "8 "8 "8"8 "8"8"8 "8"8 "8"8"8 "8 "8"8 "8"8 "8 "8 "8"8"8 "8"8"8 "8"8"8 "8"8 "8"8 "8"8"8 "8 "8"8 "8"8 "8
"8 "8 "8"8"8 "8"8 "8"8"8 "8"8"8"8
"8"8"8"8 "8"8 "8"8"8
"8"8 "8 "8 "8
"8"8 "8"8
"8
"8"8"8
"8"8
"8"8"8"8"8"8"8 "8 "8"8
"8"8"8
"8
"8
"8 "8
"8
"8 "8"8"8 "8"8
"8"8"8"8 "8"8"8 "8"8"8"8"8"8"8 "8
"8
"8"8
"8"8"8
"8"8"8
"8 "8 "8"8 "8
"8"8"8 "8"8 "8
"8"8 "8"8"8 "8"8"8 "8"8 "8 "8 "8"8"8 "8 "8 "8 "8"8 "8"8
"8 "8"8"8"8 "8"8"8 "8"8"8 "8
"8
"8
"8
"8"8 "8"8"8"8"8 "8 "8"8 "8"8 "8"8 "8"8 "8"8"8 "8 "8"8 "8"8
"8"8 "8 "8"8 "8"8 "8 "8"8 "8"8 "8"8 "8"8 "8"8"8 "8"8
"8"8 "8 "8"8 "8"8"8 "8 "8"8 "8"8 "8 "8 "8 "8"8"8 "8"8"8 "8"8 "8"8 "8 "8 "8"8"8 "8"8"8 "8"8 "8
"8"8
"8"8 "8
"8"8 "8"8 "8
"8"8 "8"8
"8 "8"8 "8"8 "8"8"8"8 "8 "8
"8 "8 "8"8"8 "8"8"8
"8 "8"8 "8"8 "8
"8"8 "8"8 "8 "8
"8"8"8"8"8 "8
"8"8 "8"8 "8
"8
"8
"8
"8
"8
"8"8
"8
"8
"8
"8 "8
"8
"8
"8
"8
"8
"8
"8
"8
"8
"8
"8
"8
"8
"8
"8
"8
"8
"8
"8"8"8
"8
"8"8
"8 "8 "8
"8"8
"8
"8"8 "8"8"8
"8"8"8
"8
"8
"8
"8"8
"8
"8"8 "8
"8
"8
"8"8
"8"8
"8
"8
"8"8
"8
"8"8
"8
"8"8 "8
"8"8"8"8 "8"8
"8
"8"8
"8
"8 "8
"8
"8
"8"8"8
"8
"8
"8"8"8
"8
"8"8
"8
"8
"8
"8
"8
"8
"8"8
"8"8
"8
"8
"8
"8
"8"8
"8
"8
"8
"8
"8
"8
"8"8
"8
"8
"8
"8
"8
"8"8
"8"8
%[N
EW
S
10 0 10 20 Miles
population density(per square kilometer)
0 - 1010.1 - 30>30
road types
paved (asfalt)
gravel
dirt
"8 villages
"8 Sub-district centres
%[ District centre
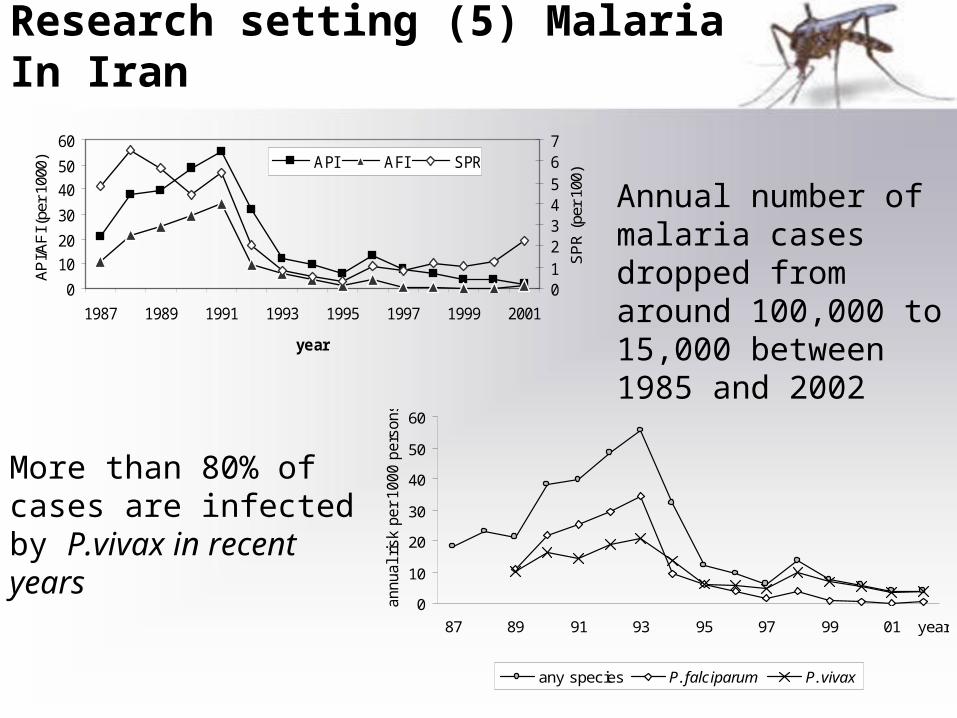
Research setting (5) Malaria In Iran
0
10
20
30
40
50
60
1987 1989 1991 1993 1995 1997 1999 2001
year
AP
I/AF
I (pe
r 10
00)
01234567
SP
R (
per
100)
API AFI SPR
0
10
20
30
40
50
60
87 89 91 93 95 97 99 01 year
ann
ual
ris
k per
100
0 pe
rson
s
any species P.falciparum P.vivax
Annual number of malaria cases dropped from around 100,000 to 15,000 between 1985 and 2002
More than 80% of cases are infected by P.vivax in recent years
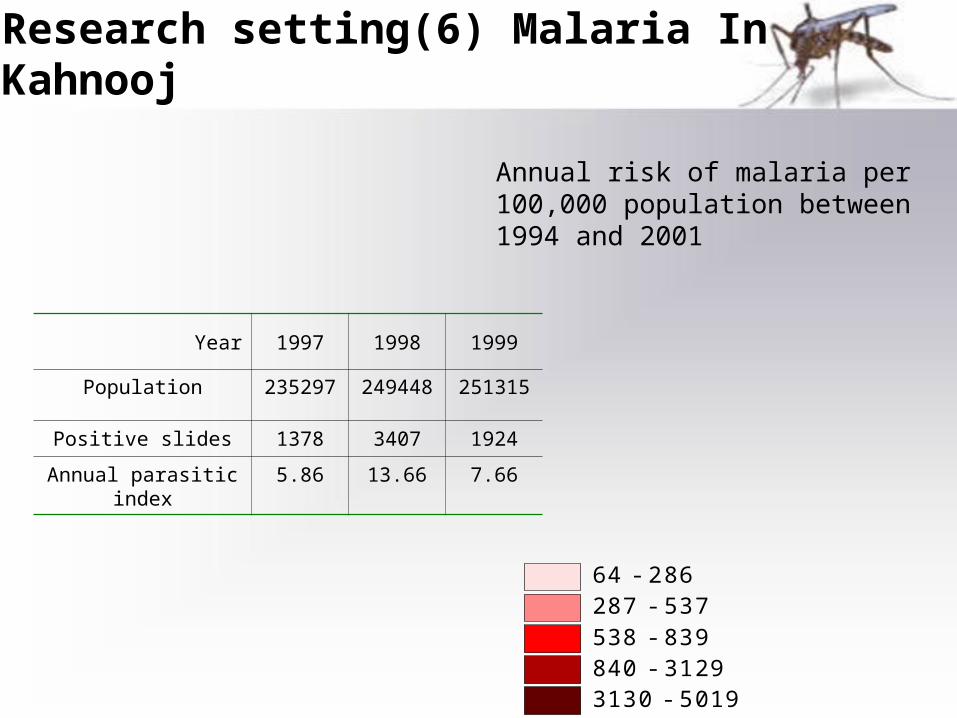
Research setting(6) Malaria In Kahnooj
Annual risk of malaria per 100,000 population between 1994 and 2001
64 - 286287 - 537538 - 839840 - 31293130 - 5019
Year 1997 1998 1999
Population 235297 249448 251315
Positive slides 1378 3407 1924
Annual parasitic index 5.86 13.66 7.66
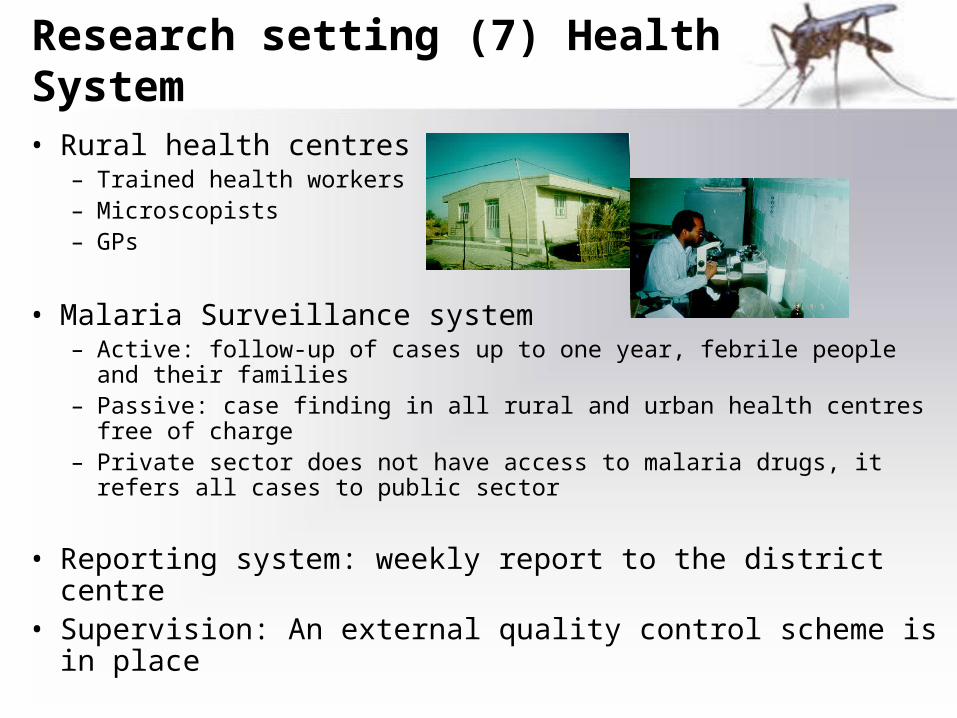
Research setting (7) Health System
• Rural health centres– Trained health workers– Microscopists– GPs
• Malaria Surveillance system– Active: follow-up of cases up to one year, febrile people and their
families– Passive: case finding in all rural and urban health centres free of
charge– Private sector does not have access to malaria drugs, it refers all
cases to public sector
• Reporting system: weekly report to the district centre• Supervision: An external quality control scheme is in place
Research setting (8) Treatment Of Malaria
• GPs Prescribe medicine– P.falciparum: chloroquine (3 days) + primaquine (with
the second dose of chloroquine) – P.vivax: chloroquine (3 days) + primaquine (weekly
does for eight weeks, or daily dose for two weeks)
• Health works supervise that patients take drugs completely, also take follow-up slides
Objective
Assessment of the feasibility of an early warning system
based on ground climate and remote sensing data
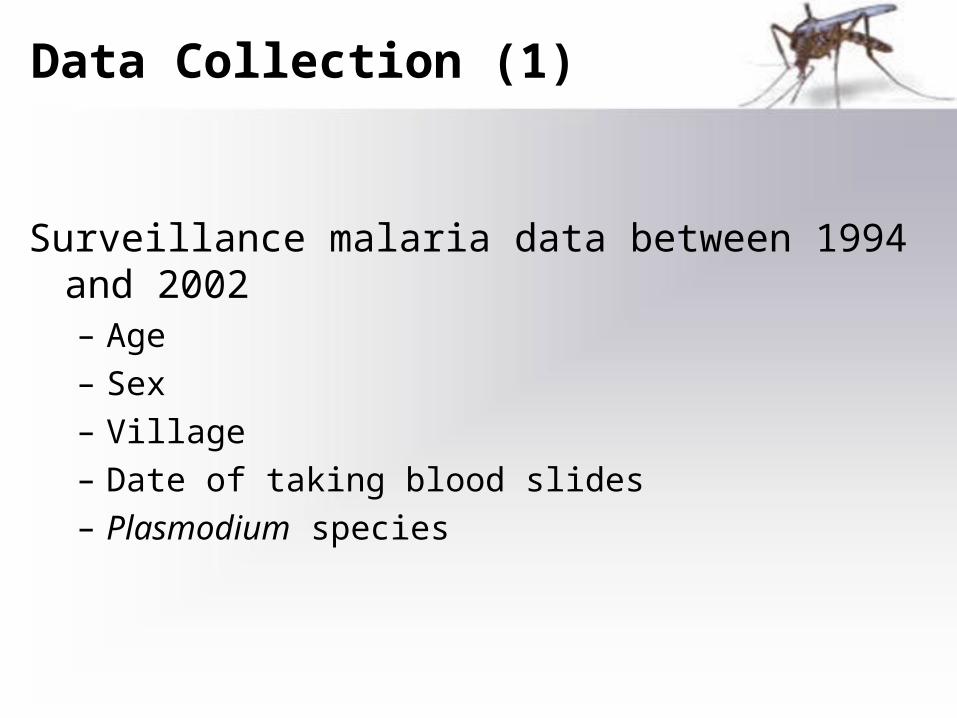
Data Collection (1)
Surveillance malaria data between 1994 and 2002– Age– Sex– Village– Date of taking blood slides– Plasmodium species
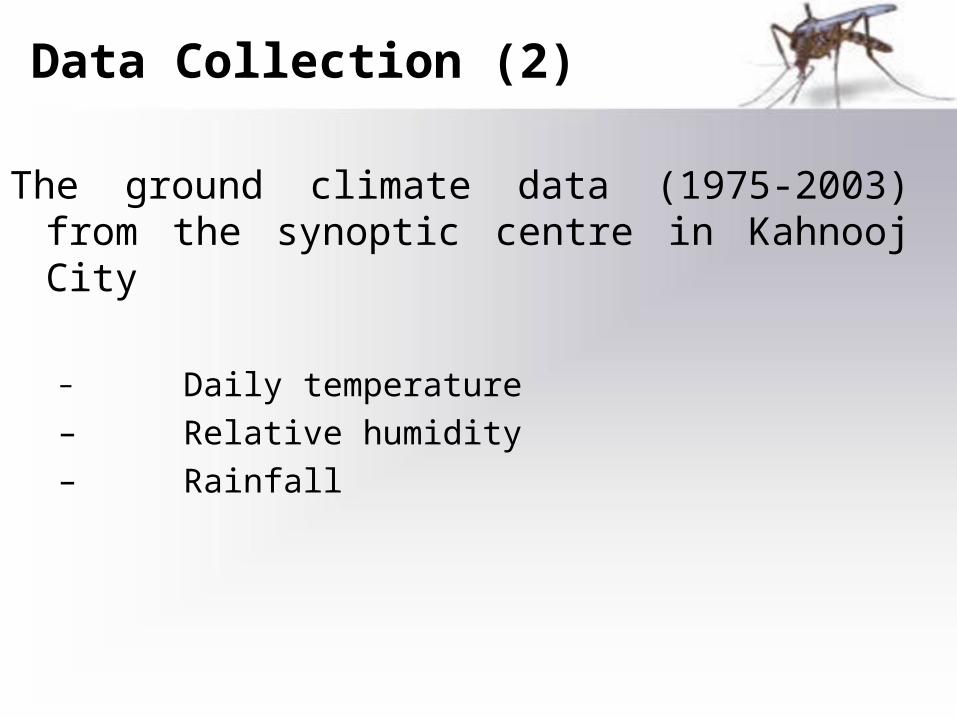
Data Collection (2)
The ground climate data (1975-2003) from the synoptic centre in Kahnooj City
– Daily temperature– Relative humidity– Rainfall
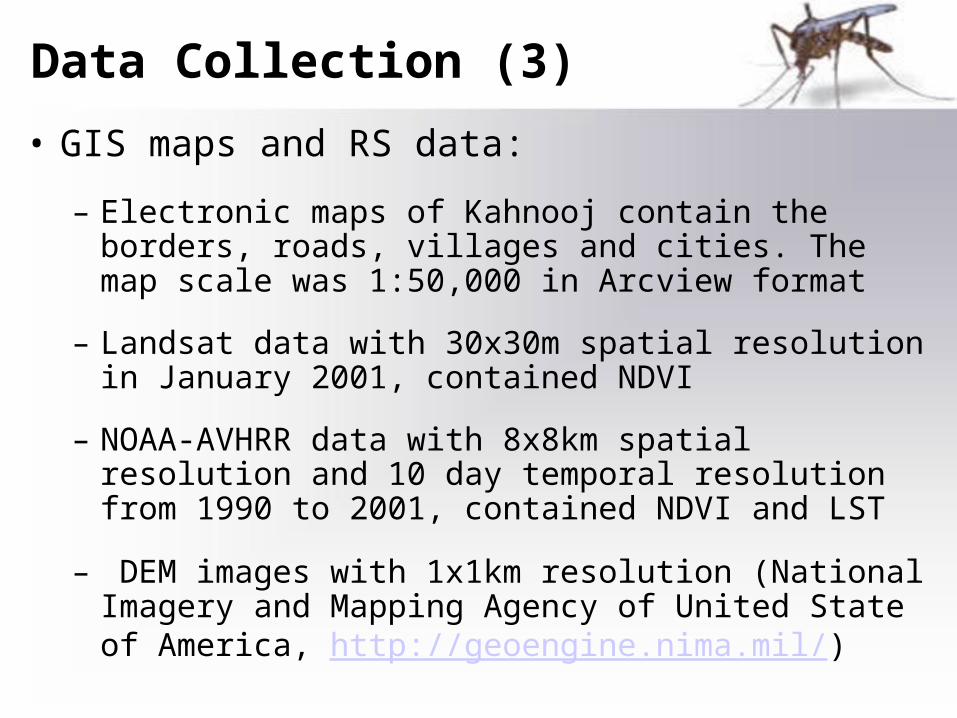
Data Collection (3)
• GIS maps and RS data:
– Electronic maps of Kahnooj contain the borders, roads, villages and cities. The map scale was 1:50,000 in Arcview format
– Landsat data with 30x30m spatial resolution in January 2001, contained NDVI
– NOAA-AVHRR data with 8x8km spatial resolution and 10 day temporal resolution from 1990 to 2001, contained NDVI and LST
– DEM images with 1x1km resolution (National Imagery and Mapping Agency of United State of America, http://geoengine.nima.mil/)
Statistical methods (1)
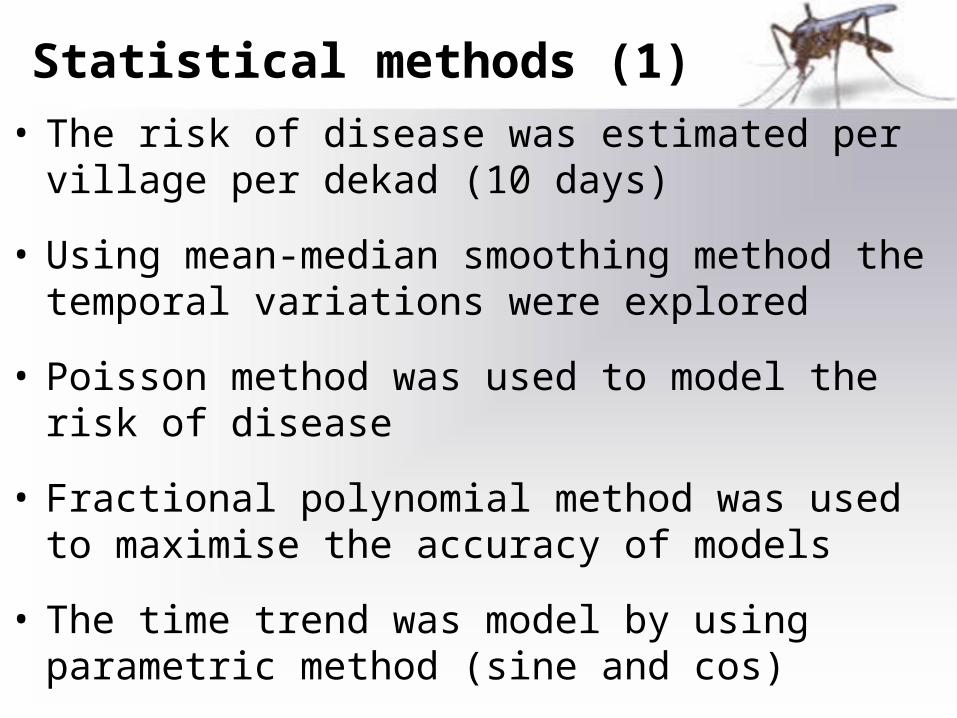
• The risk of disease was estimated per village per dekad (10 days)
• Using mean-median smoothing method the temporal variations were explored
• Poisson method was used to model the risk of disease
• Fractional polynomial method was used to maximise the accuracy of models
• The time trend was model by using parametric method (sine and cos)
Statistical methods (2)
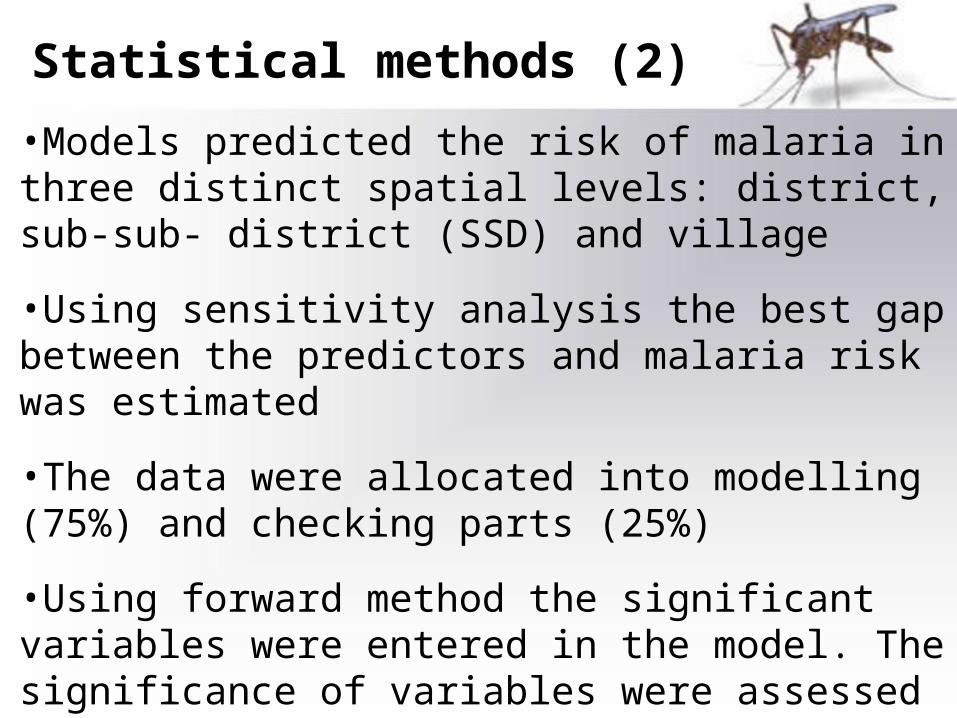
•Models predicted the risk of malaria in three distinct spatial levels: district, sub-sub- district (SSD) and village
•Using sensitivity analysis the best gap between the predictors and malaria risk was estimated
•The data were allocated into modelling (75%) and checking parts (25%)
•Using forward method the significant variables were entered in the model. The significance of variables were assessed by likelihood ratio test and pseudo-R2
Statistical methods (3)
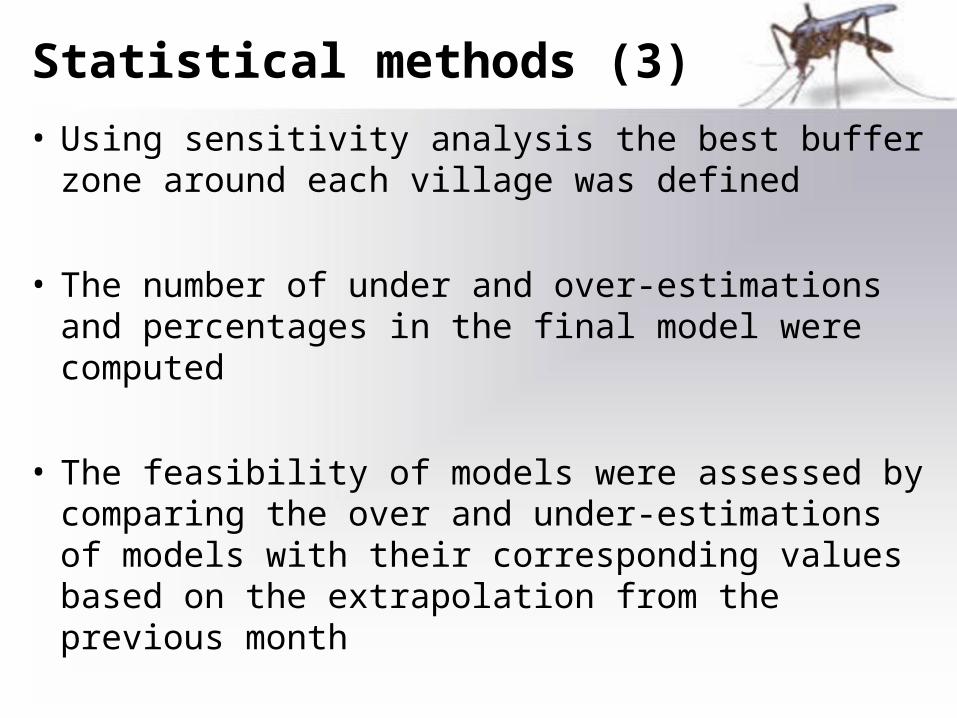
• Using sensitivity analysis the best buffer zone around each village was defined
• The number of under and over-estimations and percentages in the final model were computed
• The feasibility of models were assessed by comparing the over and under-estimations of models with their corresponding values based on the extrapolation from the previous month
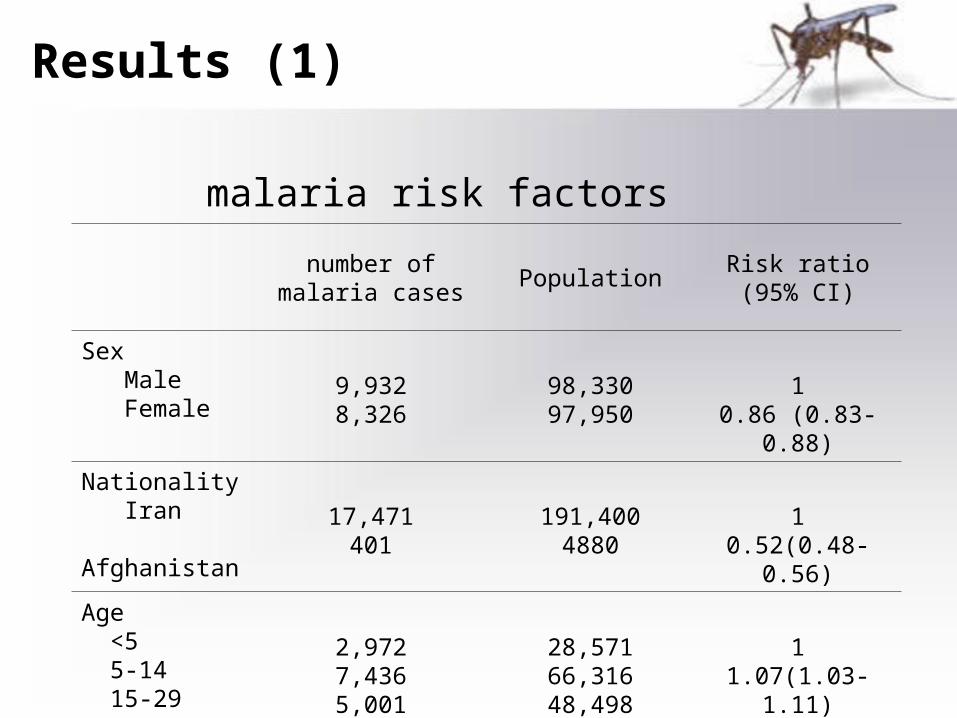
Results (1)
number of malaria cases
PopulationRisk ratio(95% CI)
Sex Male Female
9,9328,326
98,33097,950
10.86 (0.83-0.88)
Nationality Iran Afghanistan
17,471401
191,4004880
10.52(0.48-0.56)
Age <5 5-14 15-29 >=30
2,9727,4365,0012,84
28,57166,31648,49850,962
11.07(1.03-1.11)0.99(0.95-1.04)0.56(0.53-0.59)
malaria risk factors

Results (2)
Pearson correlation coefficients between the annual risk of malaria and meteorological variables in Kahnooj 1887-2001
Meteorological factor API AFI AVI
Minimum temperature -0.02 -0.01 -0.04
Maximum temperature 0.40 0.33 0.46
Mean temperature 0.18 0.15 0.19
Humidity -0.12 -0.09 -0.14
Rainfall 0.45* 0.54* 0.40*
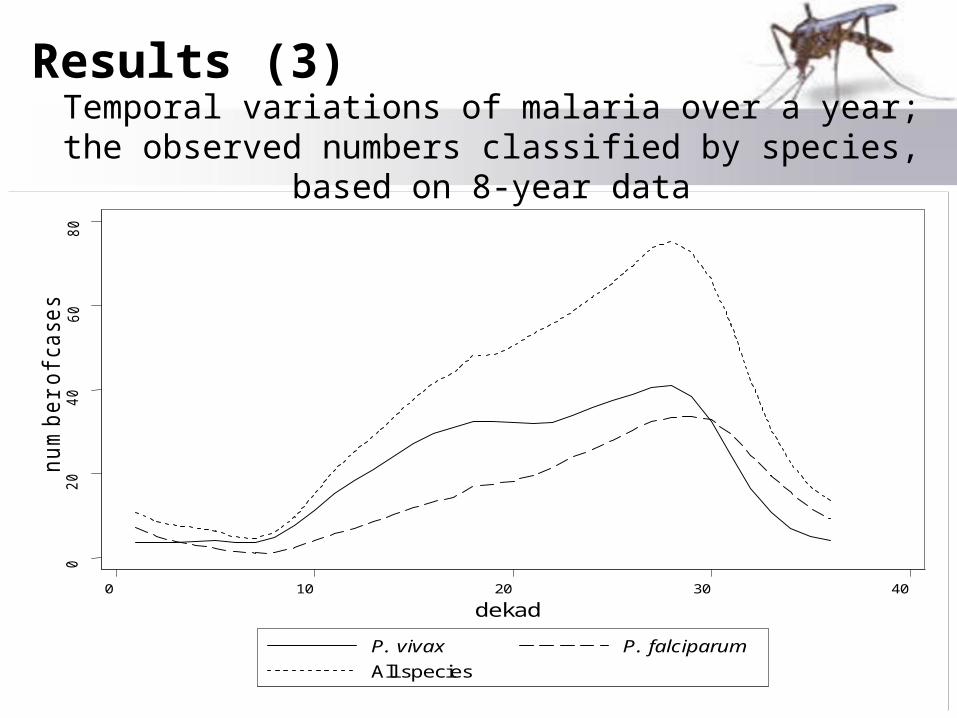
Results (3)0
20
40
60
80
nu
mb
er
of
ca
se
s
0 10 20 30 40
dekad
P. vivax P. falciparum
All species
Temporal variations of malaria over a year; the observed numbers classified by species, based on 8-year data
Results (4)0
100
200
300
Jun 00Jun 98Jun 96Jun 94date
fitted value ppv
0100
200
Jun 00Jun 98Jun 96Jun 94date
fitted value ppf
0200
400
Jun 00Jun 98Jun 96Jun 94date
fitted value all species
se
as
on
alit
y
0100
200
300
Jun 00Jun 98Jun 96Jun 94date
fitted value ppv
0100
200
Jun 00Jun 98Jun 96Jun 94date
fitted value ppf
0200
400
Jun 00Jun 98Jun 96Jun 94date
fitted value all species
se
as
on
alit
y a
nd t
ime
tre
nd
nu
mbe
r o
f ca
se
s
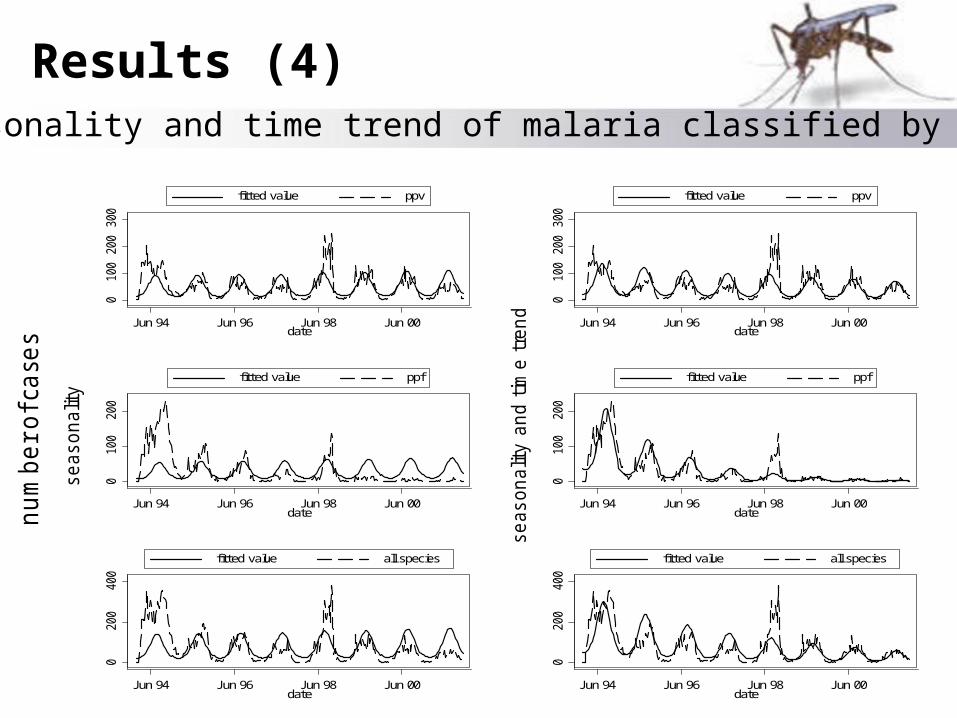
The seasonality and time trend of malaria classified by species
Results (5)0
100
200
300
Jun 00Jun 98Jun 96Jun 94date
fitted value ppv
0100
200
300
Jun 00Jun 98Jun 96Jun 94date
fitted value ppf
0500
Jun 00Jun 98Jun 96Jun 94date
fitted value all species
num
ber of cases
P. vivax P. falciparum
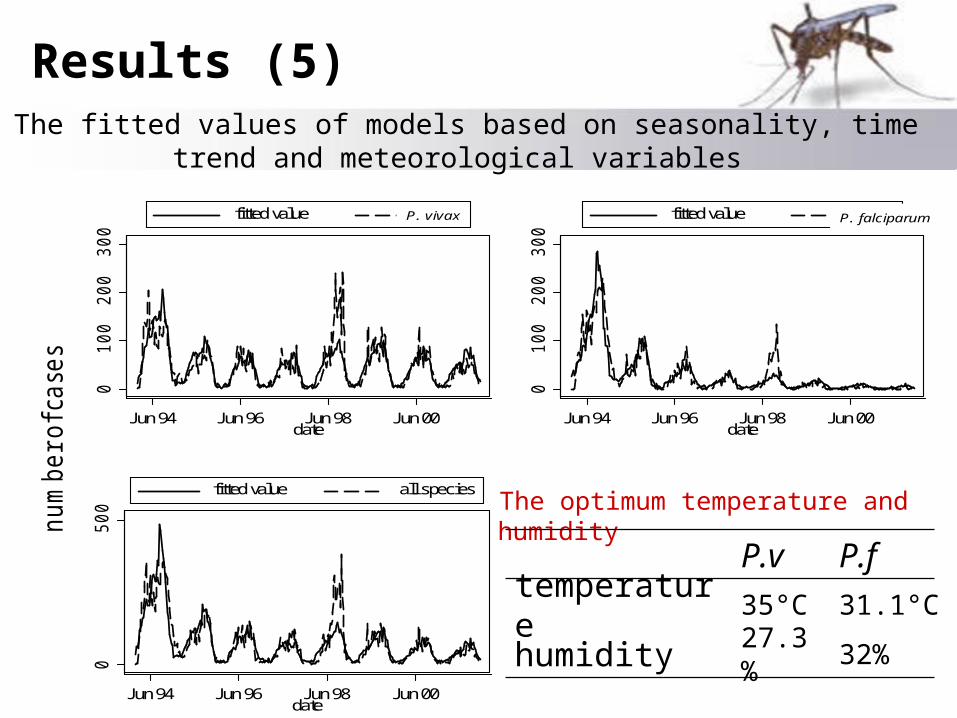
The fitted values of models based on seasonality, time trend and meteorological variables
The optimum temperature and humidity
32%27.3%humidity
31.1°C35°Ctemperature
P.fP.v
Results (6)
-0.4
-0.2
0.0
0.2
0.4
0.6
Au
to
co
rr
ela
ti
on
0 10 20 30 40Lag
-0.2
-0.0
0.2
0.4
0.6
Pa
rt
ia
l
au
to
co
rre
la
tio
n
0 10 20 30 40Lag
P.
fa
lcip
aru
m
-0.2
-0.0
0.2
0.4
0.6
Au
to
co
rr
ela
ti
on
0 10 20 30 40Lag
-0.2
0.0
0.2
0.4
0.6
Pa
rt
ia
l
au
to
co
rre
la
tio
n
0 10 20 30 40Lag
P.
viv
ax
-0.2
-0.0
0.2
0.4
0.6
Au
to
co
rr
ela
ti
on
0 10 20 30 40Lag
-0.2
0.0
0.2
0.4
0.6
Pa
rt
ia
l
au
to
co
rre
la
tio
n
0 10 20 30 40Laga
ll
sp
ec
iesR
es
idu
als
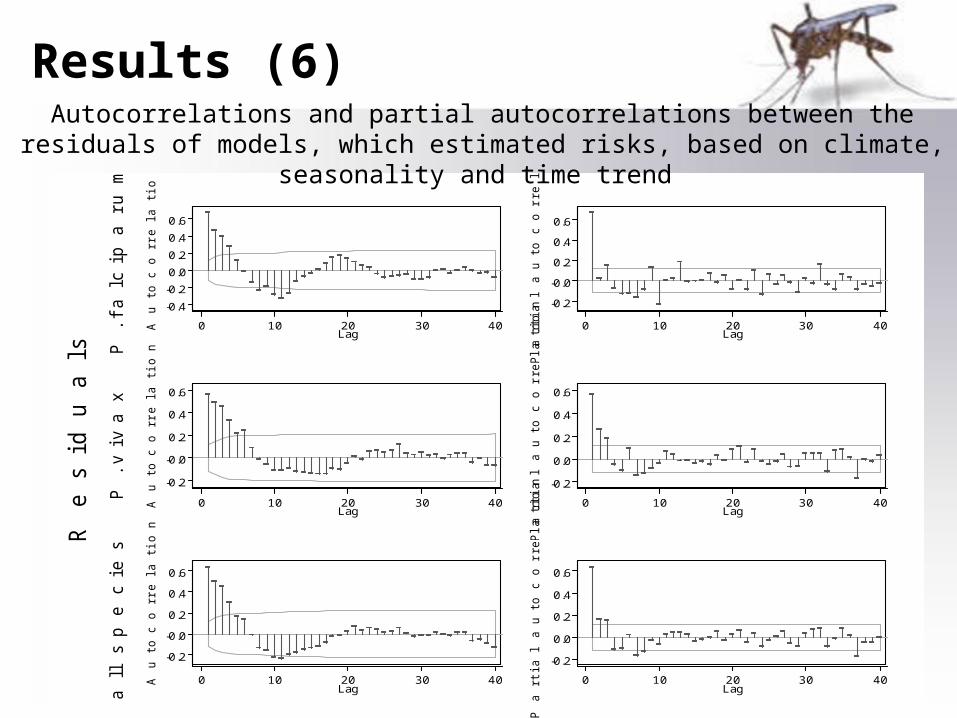
Autocorrelations and partial autocorrelations between the residuals of models, which estimated risks, based on climate, seasonality and time trend
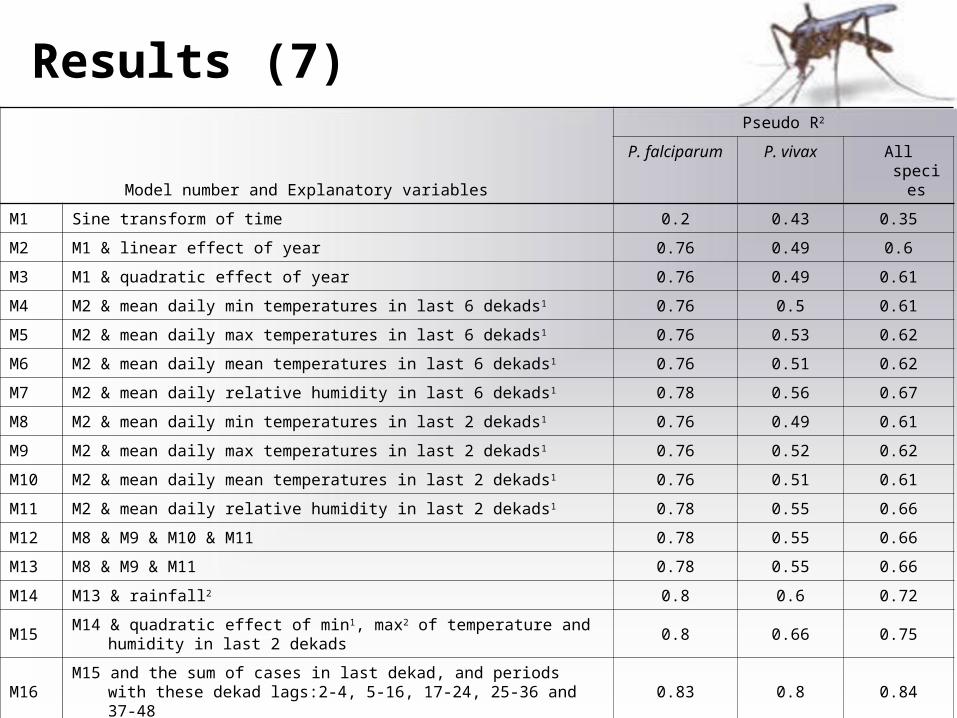
Results (7)
Model number and Explanatory variables
Pseudo R2
P. falciparum P. vivax All species
M1 Sine transform of time 0.2 0.43 0.35
M2 M1 & linear effect of year 0.76 0.49 0.6
M3 M1 & quadratic effect of year 0.76 0.49 0.61
M4 M2 & mean daily min temperatures in last 6 dekads1 0.76 0.5 0.61
M5 M2 & mean daily max temperatures in last 6 dekads1 0.76 0.53 0.62
M6 M2 & mean daily mean temperatures in last 6 dekads1 0.76 0.51 0.62
M7 M2 & mean daily relative humidity in last 6 dekads1 0.78 0.56 0.67
M8 M2 & mean daily min temperatures in last 2 dekads1 0.76 0.49 0.61
M9 M2 & mean daily max temperatures in last 2 dekads1 0.76 0.52 0.62
M10 M2 & mean daily mean temperatures in last 2 dekads1 0.76 0.51 0.61
M11 M2 & mean daily relative humidity in last 2 dekads1 0.78 0.55 0.66
M12 M8 & M9 & M10 & M11 0.78 0.55 0.66
M13 M8 & M9 & M11 0.78 0.55 0.66
M14 M13 & rainfall2 0.8 0.6 0.72
M15M14 & quadratic effect of min1, max2 of temperature and
humidity in last 2 dekads 0.8 0.66 0.75
M16M15 and the sum of cases in last dekad, and periods with these
dekad lags:2-4, 5-16, 17-24, 25-36 and 37-480.83 0.8 0.84
M17 M15 and the sum of cases in last dekad 0.83 0.79 0.84
M18 M15 and the sum of cases in 2-4 dekad ago 0.82 0.75 0.79
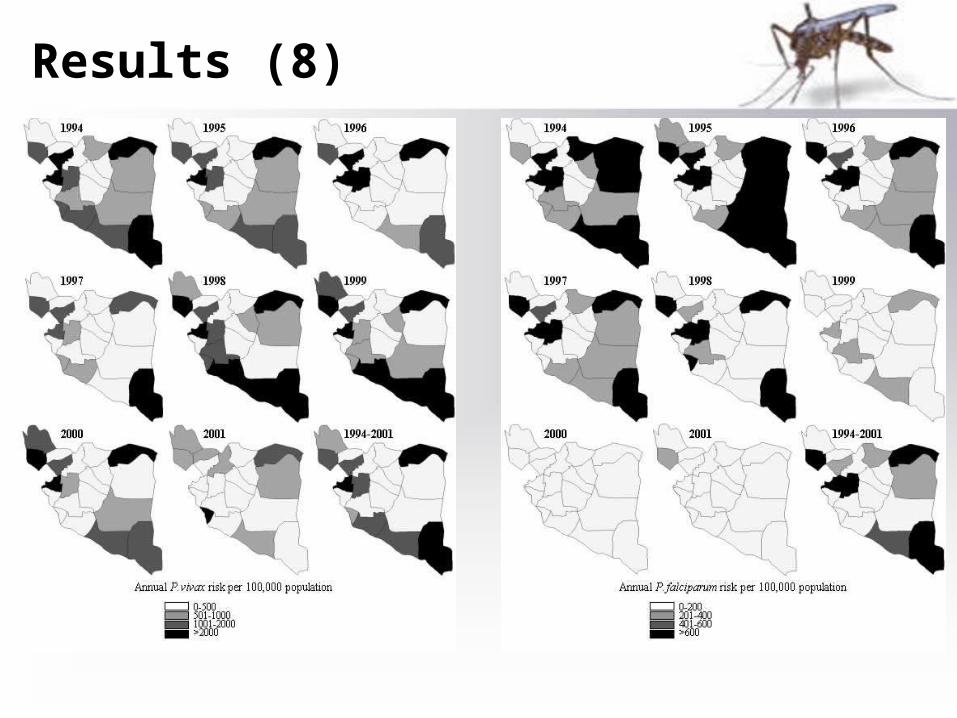
Results (8)
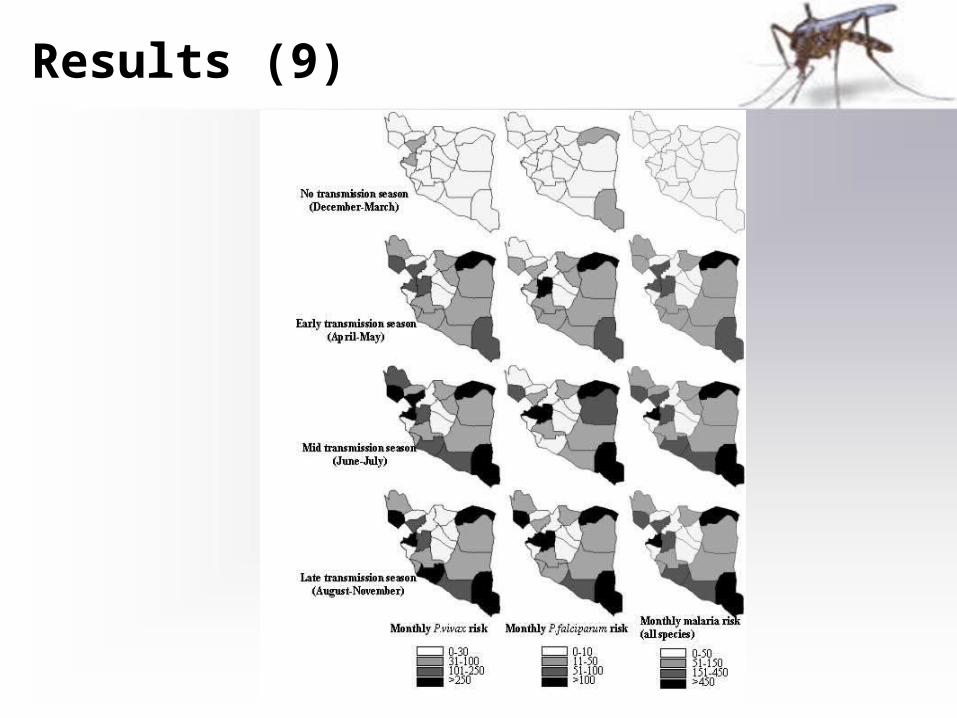
Results (9)
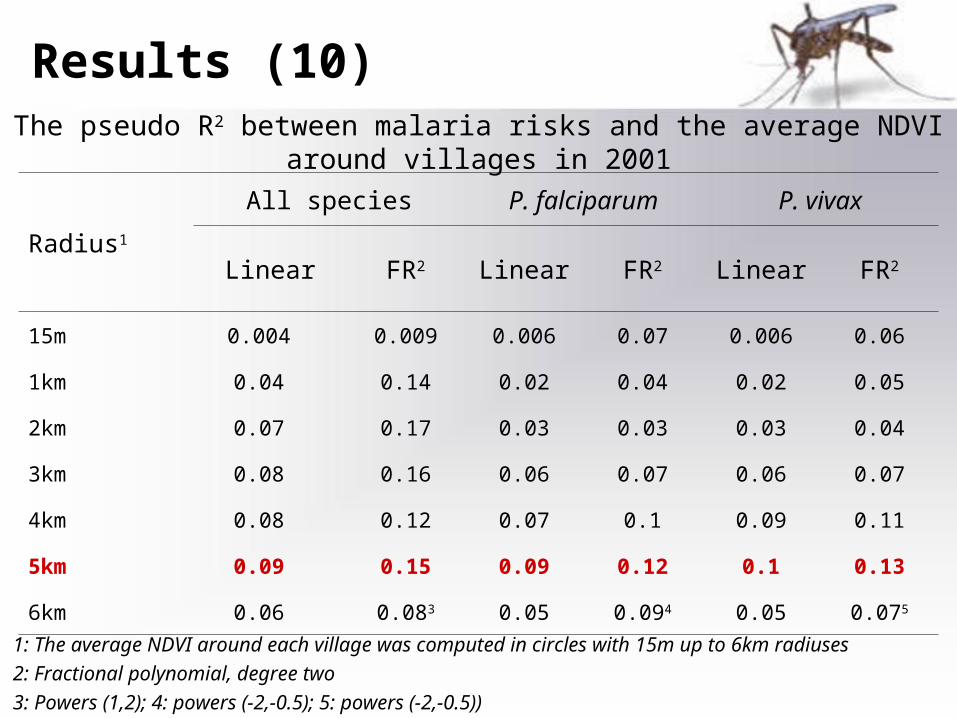
Results (10)The pseudo R2 between malaria risks and the average NDVI around
villages in 2001
1: The average NDVI around each village was computed in circles with 15m up to 6km radiuses
2: Fractional polynomial, degree two
3: Powers (1,2); 4: powers (-2,-0.5); 5: powers (-2,-0.5))
Radius1
All species P. falciparum P. vivax
Linear FR2 Linear FR2 Linear FR2
15m 0.004 0.009 0.006 0.07 0.006 0.06
1km 0.04 0.14 0.02 0.04 0.02 0.05
2km 0.07 0.17 0.03 0.03 0.03 0.04
3km 0.08 0.16 0.06 0.07 0.06 0.07
4km 0.08 0.12 0.07 0.1 0.09 0.11
5km 0.09 0.15 0.09 0.12 0.1 0.13
6km 0.06 0.083 0.05 0.094 0.05 0.075
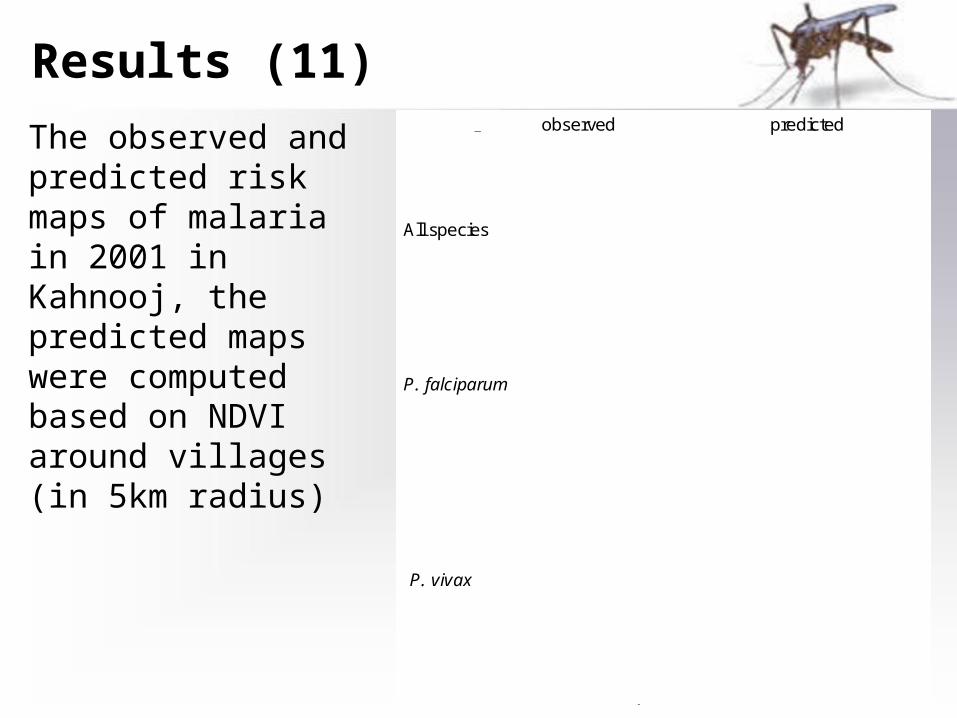
Results (11)observed predicted
All species
P. falciparum
P. vivax
###
##
# #### ### ###
### ## ### # #### #### ## ##### ### ## ## ## #############
##### ## ### ### ## ### ## #
# ## ## ### ## ## ## # ### # ## #### ## # ##########
###### ## # ## #### # # ### ### ##
# ## # # ### ### ### ## ### ## # ## ### #### #### #### ##### ###
### ########
###
###### ## #### ## #### ### ### # ### ### #### ## #### ### # #####
###### ###### #### ####### ### # #### ####### ## ## ## #### ### #######
##
# ## # ## ##### ### ###
### ## #### ### ###### ### # ### ## # #### #### ### ### # ## ### ## ## ## #### # ## #### ### # ## ### # # ## ### ###
##### ###########
# ############
#### ## ### ## ### ## ## ######## ##### # ##### # ## ###
## #
#####
## ## ###
#### ## ###### ## ##### #### ### ## ## #
### # ## #### ## # ###
#
#
# ### ####
#####
## ###
#####
##
####### # ###
##
# ## # ## ## #
######## # ## ### ##
## #### ### #####
##
########### ###
## #
##
##
# ## #### # ###### ####### #### ### # ### #### ### # #### #
# ### ## ## ###
##
## # ## ####
###
#####
#
#
###
###
####
###
##
######
## # ###
#
## #### # ###### ## #
# # #### ## # ### # #### #### ### ### ###
## ### ### ### ### ### #
### ### ### ## # #
##### #
#
#
#
#
Risk in 2001# very low# low# moderate# high
##
# #### ### ###
### ##### # #### #### ## ##### ### ## #### #############
##### ## ### ### ## ### ## #
# ## ## ### ## ## ## # ### # ## #### ## # ##########
##### # ## # ## #### # # ### ### #
### ## # # ### ### ### ## ### ## # ## ### #### #### #### ##### ###
### ##########
###
#### ## #### ## #### ### ### # ### ### #### ## ####### # #####
###### ########## ####### ### ## #### ####### ## ## ## ##### ### #######
##
# ## # ## ### ##### ###### ## #### ### ###### ### # ### ## # #### #### ### ### # ## ### ## ## ## #### # ## #### ### # ## ### # ### ### ###
################# ##### #######
#### ## ### ##### ## ## ######## ##### # ##### # ## ####
# # #####
## ## ###
###### ### ### ####### #### ### ## ## #### ### ###
# ## # ###
#
## ##
# ####
####### ## # ##
#####
##
####### # ###
##
### ### ## ######### # ## ####### #### ### ### ##
##
############## #
####
##
# ###### # ###### ####### #### ### # ### #### #
## # #### ## ### ##
## ###
##
## # ## ####### ##
####
#
###
###
####
##
### ##
######
# ###
#
## ## ## # #### ## ## ## # #### ## # ### # #### ## ## ### ### ###
## ### ### ### ### ### #
### ### ### ## # # ###### #
#
#
#
#
###
##
# #### ### ###
#
## ## ### # #### #### ## ##### ### ## ## ## #############
##### ## ### ### ## ### ## #
# ## ## ### ## ## ## # ### # ## #
### ## # ##########
##### # ## # ## #### # # ### ### #### ## # # ### ### ### ## ### ## # ## ### #### #### #### ##### #
##
### ########
###
# ##### ## #### ## #### ### ### # ### ### #### ## #### ### # #####
###### ###### #### ####### ### ## #### ####### ## ## ## ##### ### #######
##
# ## # ## #### ### ###
### ## #### ### ###### ### # ### ## # #### #### ### ### # ## ### ## ## ## #### # ## # ### ### # ## ### # # ## ####
#
##### ###########
# ##### #######
#### ## ### ## ### ## ## ######## ##### # ##### # ## ###
## #
#####
## ## ###
#### ## ###### ## ##### #### ### ## ## #
## # ## #### ## # ###
#
## ##
# ####
## #
###### # ##
#####
##
####### # ###
##
# ## # ## ## #
##### ### # ## ### #### #### ### ###
###
#
########### ###
## #
##
##
# ## #### # ###### ####### #### ### # ## #### ##
# #### ## ### ## ## #
####
## # ## ####
###
#####
#
#
###
###
####
###
##
######
## # ###
#
## #### # ###### ## #
# # #### ## # ### # #### ## ## ### ### ###
## ### ## # ### ### ##
# ###
# ### #### # #
###### #
#
#
#
#
Risk in 2001# very low# low# moderate# high
### ####### ###
### ## ### # #### #### ## ##### ### ## ## ## #############
##### ## ### ### ## ### ## #
# ## ## ### ## ## ## # ### # ## #### ## # ##########
##### # ## # ## #### # # ### ### #
### ## # # ### ### ### ## ### ## # ## ### #### #### #### ##### ###
### ##########
###
#### ## #### ## #### ### ### # ### ####### ## #### ### # #####
###### ########## ####### ### ## #### ####### ## ## ## ##### ### #######
##
# ## # ## ### ## ### ###### ## #### ### ###### ### # ### ## # #### #### ### ### # ## ### ## ## ## #### # ## #### ### # ## ### # # ## ### ###
##### ###########
# ##### #######
#### ## ### ## ### ## ## ######## ##### # ##### # ## ####
# # #####
## ## ###
###### ### ### ## ##### #### ### ## ## #
### ### #### ## # ###
#
## ##
# ####
####### ## # ##
#####
##
####### # ###
##
# ## # ## ## #
##### ### # ## ####### #### ### ### ##
##
#
########## ### #
# #
##
##
# ## #### # ###### ####### #### ### # ### #### ### # #### #
# ### #### #
####
## # ## ####
###
#####
#
#
###
###
####
##
###
######
### ##
#
#
## ## ## # #### ## ## ## # #### ## # ### # #### ## ## ### ### ###
## ### ### ### ### ### #
### ### ### ## # #####
## #
#
#
#
#
###
##
# #### ### ###
### ## ### # #### #### ## ##### ### ## ## ## #############
##### ## ### ### ## ### ## #
# ## ## ### ## ## ## # ### # ## #
### ## # ##########
#
##### ## # ## #### # # ### ### ### ## # # ### ### ### ## ### ## # ## ### #### #### #### ##### ###
### ##########
#
###### ## #### ## #### ### ### # ### ### #### ## #### ### # #####
###### ###### #### ####### ### # #### ####### ## ## ## #### ### #######
##
# ## # ## ##### ### ###
### ## #### ### ###### ### # ### ## # #### #### ### ### # ## ### ## ## ## #### # ## #### ### # ## ### # # ## ### ##
#
##### ###########
# ############
#### ## ### ## ### ## ## ######## ##### # ##### # ## ###
## #
#####
## ## ###
#### ## ###### ## ##### #### ### ## ## #
### # ## #### ## # ###
#
#
# ### ####
####### ###
#####
##
####### # ###
##
# ## # ## ## ######### # ## ### ##
## #### ### ######
#
########### ###
## #
##
##
# ## #### # ###### ####### #### ### # ### #### ### # #####
# ### ## ## ### ##
## # ## ####
###
#####
#
#
###
###
####
###
##
######
## # ###
#
## #### # #### ## ## ## # #### ## # ### # #### #### ### ### ###
## ### ### ### ### ### #
### ### ### ## # #
##### #
#
#
#
#
Risk in 2001# very low# low# moderate# high
##
# #### ### ###
### ##### # #### #### ## ##### ### ## #### #############
##### ## ### ### ## ### ## #
# ## ## ### ## ## ## # ### # ## #### ## # ##########
##### # ## # ## #### # # ### ### #
### ## # # ### ### ### ## ### ## # ## ### #### #### #### ##### ###
### ##########
###
#### ## #### ## #### ### ### # ### ### #### ## ####### # #####
###### ########## ####### ### ## #### ####### ## ## ## ##### ### #######
##
# ## # ## ### ## ### ###### ## #### ### ###### ### # ### ## # #### #### ### ### # ## ### ## ## ## #### # ## #### ### # ## ### # ### ### ###
################ # ##### #######
#### ## ### ##### ## ## ######## ##### # ##### # ## ####
# # #####
## ## ###
###### ### ### ####### #### ### ## ## #### ### ###
# ## # ###
#
## ##
# ####
####### ## # ##
#####
##
####### # ###
##
### ### ## ######### # ## ####### #### ### ### ##
##
############## #
# ###
##
# ###### # ###### ####### #### ### # ### #### #
## # #### ## ### ##
## ###
##
### ## #######
#####
#
#
###
###
####
##
###
######
### ##
#
#
## ## ## # #### ## ## ## # #### ## # ### # #### ## ## ### ### ###
## ### ### ### ### ### #
### ### ### ## # #####
## #
#
#
#
#
The observed and predicted risk maps of malaria in 2001 in Kahnooj, the predicted maps were computed based on NDVI around villages (in 5km radius)
Results (12)
##
# ### ### ###
## ##### # #### ### ## ### ### #### ## ### #########
### ## ### ### ## ### ## #
# ## ## ### ## ## ## # ### # ## #### ## # #########
##### # ## # ## #### # # ### ### #
### ## # # ### ### ## ## ## ## # ## ###### #### #### #### ###
## ##########
## #
#### ## #### # ### ## ### ## ###### ## ###### # ####
###### ####### #### ### ## ### ###### ## ## ## ##### ## #####
##
# ## # #### ##### ###### ## ### ### ###### ## #### # ### #### ## ### # ## ### ## ## ## ### # ## # ### ### # ## ### # # ## ### #
#
#
###############
# #### #######
#### ## ### ## ##### ###### #### ##### # ## ####
# # #####
## ## ###
#### ## ### ### ## #### ## ### ## ## #
## # ### #### ## # ###
#
## ##
# ###### ##### ## # ##
#####
##
###### # ###
##
# ##
# ## ## #
#### ### # ## ### #### #### ## ### ##
##
#
######### ### #
# #
##
##
# ##### # ##### ####### #### ### # ## #### #
## # #### ## ### ##
## ###
##
## # ## ####
###
####
#
#
###
###
####
##
### ##
######
# ###
#
## ## ## # #### # ## ## # ### ## # ## # ### ## ## ### ### #
##
## ### ## ### ## ### #
### ### ### ## # #####
## #
#
#
#
#
##
# ### ### ###
#
# ##### # #### ### ## ##### ###### ### ########
### ## ### ### ## ### ## #
# ## ## ### ## ## ## # ### # ## #### ## # #########
##### # ## # ## #### # # ### ### #
### ## # # ### ### ## ## ## ## # ## ###### #### #### #### ###
## ##########
## #
#### ## #### # ### ## ### # ## ###### ## ###### # ####
###### ####### #### ### ## ### ###### ## ## ###### ## #####
##
# ## # #### ##### ###### ## ### ### ###### ## #### # ### #### ## ### # ## ### ## ## ## ### # ## # ### ### # ## ### # # ## ### #
#
#
###############
# ##########
#### ## ### ## ##### ###### #### ##### # ## ####
# # #####
## ## ###
#### ## ### ### ## #### ## ### ## ## #
### ### #### ## # ###
#
## ##
# ###### #### ## # ##
#####
##
####### # ###
##
# ##
# ## ## #
#### ### # ## ### #### #### ## ### ##
##
#
######### ### #
# #
##
##
# ##### # ####
####### #### ### # ## #### ### # #### #
# ### #### #
###
## # ## ####
###
#####
#
#
###
###
####
##
### ##
######
# ###
#
## ## ## # #### # ## ## # ### ## # ## # ### ## ## ### ### #
##
## ### ## ### ## ### #
### ### ### ## # #####
## #
#
#
#
#
##
# ### ### ###
## ##### # #### #### ## ### ### #### ## ### #########
### ## ### ### ## ### ## #
# ## ## ### ## ## ## # ### # ## #### ## # #########
##### # ## # ## #### # # ### ### #
### ## # # ### ### ## ## ## ## # ## ###### #### #### #### ###
## ##########
## #
#### ## #### # ### ## ### # ## ###### ## ###### # ####
###### ####### #### ### ## ### ###### ## ## ## ##### ## #####
##
# ## # #### ##### ###### ## ### ### ###### ## #### # ### #### ## ### # ## ### ## ## ## ### # ## ### ### # ## ### # # ## ### #
#
#
###############
# #### #######
#### ## ### ## ##### ###### #### ##### # ## ####
# # #####
## ## ###
#### ## ### ### ## #### ## #### ## #
## # ### #### ## # ###
#
## ##
# ###### ##### ## # ##
#####
##
####### # ###
##
# ##
# ## ## #
#### ### # ## ### #### #### ## ### ##
##
#
######### ### #
# #
##
##
# ##### # ##### ####### #### ### # ## #### #
## # #### ## ### ##
## ###
##
## # ## ####
###
#####
#
#
###
###
###
##
### ##
######
# ###
#
## ## ## # #### # ## ## # ### ## # ## # ### ## ## ### ### #
##
## ### ## ### ## ### #
### ### ### ## # #####
## #
#
#
#
#
###
##
# #### ### ###
### ## ### # #### #### ## ##### ### ## ## ## #############
##### ## ### ### ## ### ## #
# ## ## ### ## ## ## # ### # ## #### ## # ##########
##### # ### ## #### # #### ### #
### ## # # ### ### ### ## ### ## # ## ### #### #### #### ##### ###
### ##########
###
#### ## #### ## #### ### ### # ### ####### ## #### ### # #####
###### ########## ####### ### ## #### ####### ## ## ## ##### ### #######
##
# ## # ## ##### ### ###### ## #### ### ###### ### # ### ## # #### #### ### ### # ## ### ## ## ## #### # ## #### ### # ## ### # # ## ### #
#
#
##### ########
#### ##### #######
#### ## ### ##### ## ## ######## ##### ###### # ## ####
# # #####
## ## ###
#### ## ### ### ## ##### #### ### ## ## #
## # ### #### ## # ###
#
## ##
# ####
####### ### ##
#####
########## ###
##
# ##
# ## ## #
######## # ## ####### #### ### ### ##
##
########### ### #
# #
##
##
# ###### # ###### ####### #### ### # ### #### #
## # ###### ### ##
## ### ##
## # ## ####
###
#####
#
#
###
###
####
##
###
######
### ##
#
#
## ## ## # #### ## ## ## # #### ## # ### # #### ## ## ### ### #
##
## ### ### ### ### ### #
### ### ### ## # #
###### #
#
#
#
#
Risks in 1994-2001# very low# low# moderate# high
observed predicted
All species
###
##
# #### ### ###
### ## ### # #### #### ## ##### ### ## ## ## #############
##### ## ### ### ## ### ## #
# ## ## ### ## ## ## # ### # ## #### ## # ##########
##### # ## # ## #### # # ### ### #
### ## # # ### ### ### ## ### ## # ## ### #### #### #### ##### ###
### ##########
## #
#### ## #### ## #### ### ### # ### ####### ## #### ### # #####
###### ###### #### ####### ### ## #### ####### ## ## ## ##### ### #######
##
# ## # ## ##### ### ###### ## #### ### ###### ### # ### ## # #### #### ### ### # ## ### ## ## ## #### # ## #### ### # ## ### # # ## ### ##
#
##### ########
#### ##### #######
#### ## ### ## ### ## ## ######## ##### # ##### # ## ####
# # #####
## ## ###
#### ## ### ### ## ##### #### ### ## ## #
## # ### #### ## # ###
#
## ##
# ####
####### ## ###
#####
##
####### # ###
##
# ##
# ## ## #
##### ### # ## ### #### #### ### ### ##
##
########### ### #
# #
##
### ##
#### # ###### ####### #### ### # ### #### ### # #### #
# ### #### #
####
## # ## ####
###
#####
#
#
###
###
####
##
###
######
### ##
#
#
## ## ## # #### ## ## ## # ## ## ## # ### # #### ## ## ### ### ###
## ### ### ### ### ### #
### ### ### ## # #
###### #
#
#
#
#
Risks in 1994-2001# very low# low# moderate# high
P. falciparum
###
##
# #### ### ###
### ## ### # #### #### ## ##### ### ## ## ## #############
##### ## ### ### ## ### ## #
# ## ## ### ## ## ## # ### # ## #### ## # ##########
##### # ## # ## #### # # ### ### #
### ## # # ### ### ### ## ### ## # ## ### #### #### #### ##### ###
### ##########
## #
#### ## #### ## #### ### ### # ### ####### ## #### ### # #####
###### ###### #### ####### ### ## #### ####### ## ## ## ##### ### #######
##
# ## # ## ######## ###### ## #### ### ###### ### # ### ## # #### #### ### ### # ## ### ## ## ## #### # ## #### ### # ## ### # # ## ### #
#
#
##### ########
#### ##### #######
#### ## ### ##### ## ## ######## ##### # ##### # ## ####
# # #####
## ## ###
#### ## ### ### ## ##### #### ### ## ## #
## # ### #### ## # ###
#
## ##
# ####
####### ## # ##
#####
########## ###
##
# ##
# ## ## #
######## # ## ### #### #### ### ### ##
##
########### ### #
# #
##
##
# ###### # ###### ####### #### ### # ### #### #
## # #### ## ### ##
## ### ##
## # ## ####
###
#####
#
#
###
###
####
##
### ##
######
# ###
#
## ## ## # #### ## ## ## # #### ## # ### # #### ## ## ### ### #
##
## ### ### ### ### ### #
### ### ### ## # ####### #
#
#
#
#
Risks in 1994-2001# very low# low# moderate# high
P. vivax
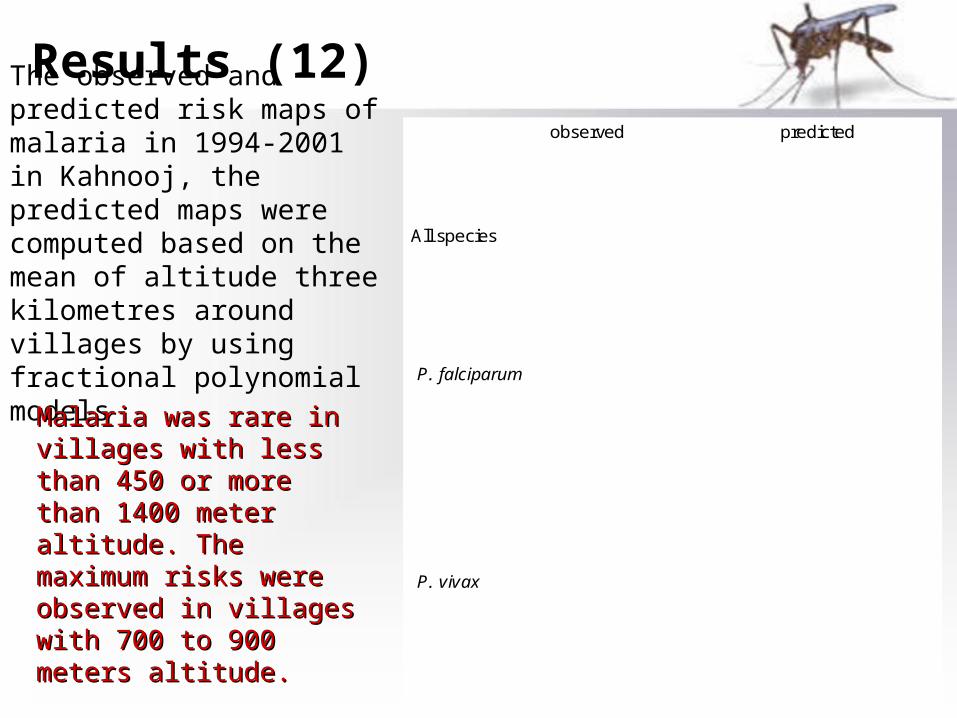
The observed and predicted risk maps of malaria in 1994-2001 in Kahnooj, the predicted maps were computed based on the mean of altitude three kilometres around villages by using fractional polynomial models
Malaria was rare in villages Malaria was rare in villages with less than 450 or more with less than 450 or more than 1400 meter altitude. than 1400 meter altitude. The maximum risks were The maximum risks were observed in villages with observed in villages with 700 to 900 meters altitude. 700 to 900 meters altitude.
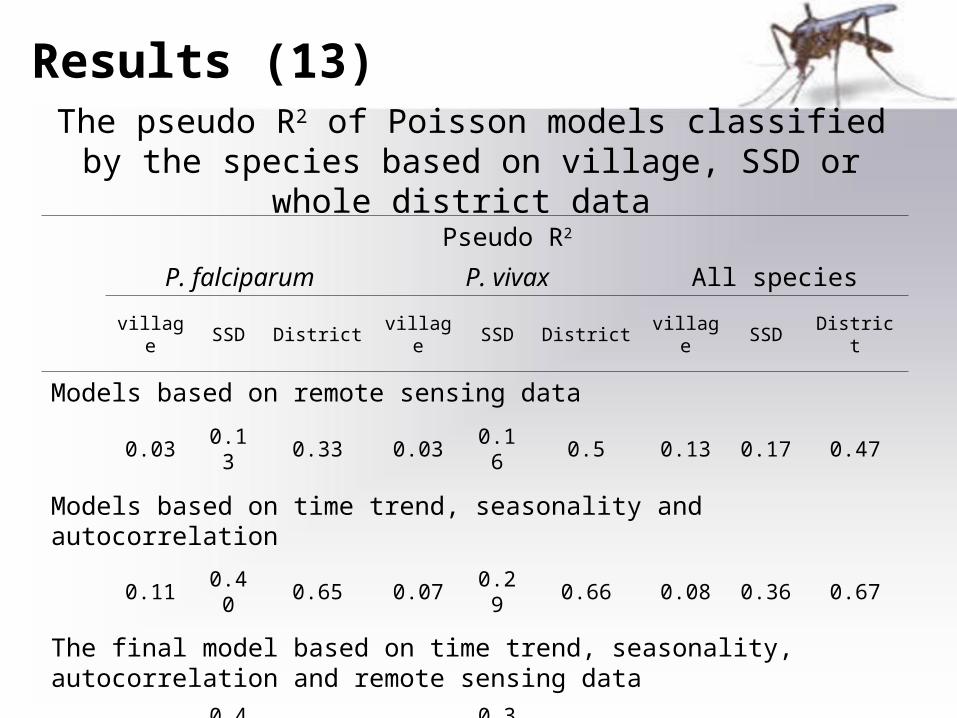
Results (13)
Pseudo R2
P. falciparum P. vivax All species
village SSD District village SSD District village SSD District
Models based on remote sensing data
0.03 0.13 0.33 0.03 0.16 0.5 0.13 0.17 0.47
Models based on time trend, seasonality and autocorrelation
0.11 0.40 0.65 0.07 0.29 0.66 0.08 0.36 0.67
The final model based on time trend, seasonality, autocorrelation and remote sensing data
0.17 0.46 0.77 0.12 0.32 0.73 0.14 0.4 0.75
The pseudo R2 of Poisson models classified by the species based on village, SSD or whole district data
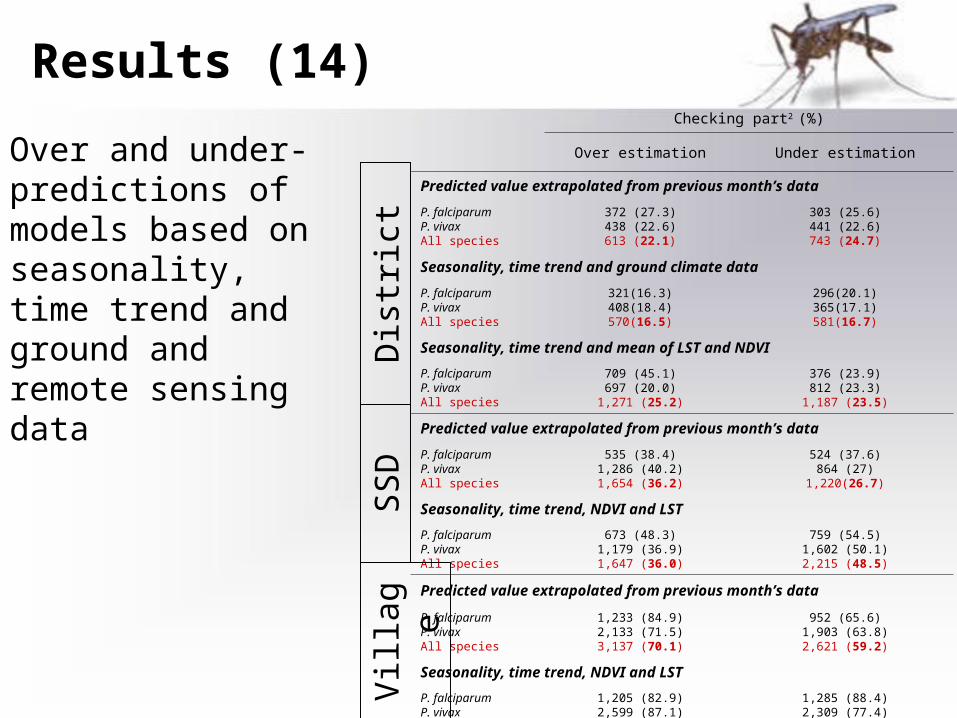
Results (14)Checking part2 (%)
Over estimation Under estimation
Predicted value extrapolated from previous month’s data
P. falciparumP. vivaxAll species
372 (27.3)438 (22.6)613 (22.1)
303 (25.6)441 (22.6)743 (24.7)
Seasonality, time trend and ground climate data
P. falciparumP. vivaxAll species
321(16.3)408(18.4)570(16.5)
296(20.1)365(17.1)581(16.7)
Seasonality, time trend and mean of LST and NDVI
P. falciparumP. vivaxAll species
709 (45.1)697 (20.0)
1,271 (25.2)
376 (23.9)812 (23.3)
1,187 (23.5)
Predicted value extrapolated from previous month’s data
P. falciparumP. vivaxAll species
535 (38.4)1,286 (40.2)1,654 (36.2)
524 (37.6)864 (27)
1,220(26.7)
Seasonality, time trend, NDVI and LST
P. falciparumP. vivaxAll species
673 (48.3)1,179 (36.9)1,647 (36.0)
759 (54.5)1,602 (50.1)2,215 (48.5)
Predicted value extrapolated from previous month’s data
P. falciparumP. vivaxAll species
1,233 (84.9)2,133 (71.5)3,137 (70.1)
952 (65.6)1,903 (63.8)2,621 (59.2)
Seasonality, time trend, NDVI and LST
P. falciparumP. vivaxAll species
1,205 (82.9)2,599 (87.1)3,592 (81.2)
1,285 (88.4)2,309 (77.4)3,424 (77.4)
Dis
tric
tS
SD
Vill
age
Over and under-predictions of models based on seasonality, time trend and ground and remote sensing data
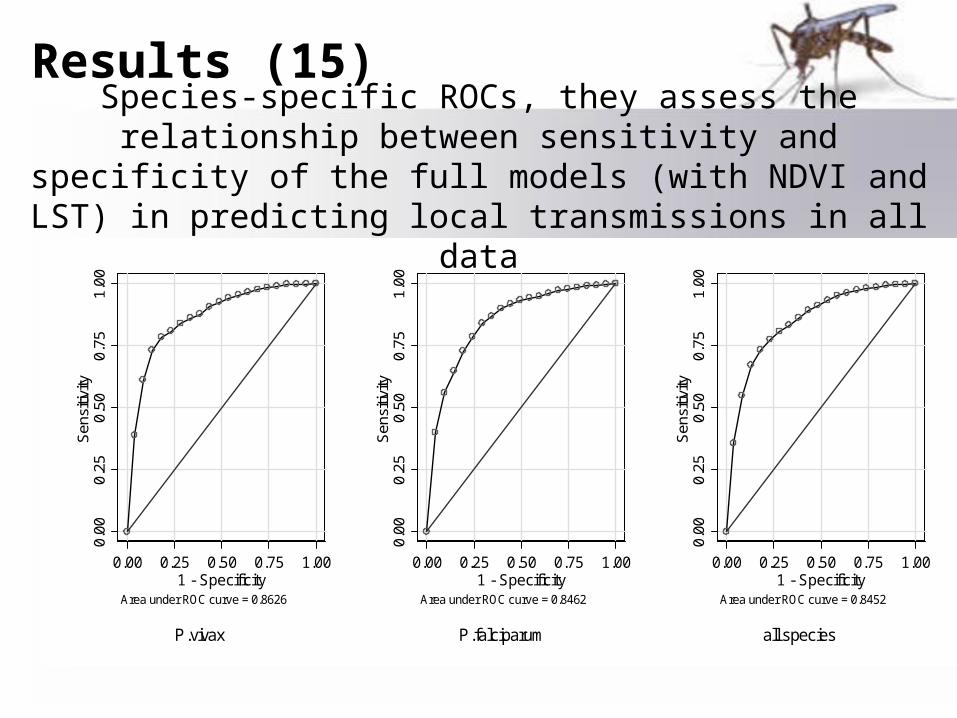
Results (15)0.
000.
250.
500.
751.
00S
ensi
tivity
0.00 0.25 0.50 0.75 1.001 - Specificity
Area under ROC curve = 0.8626
P.vivax
0.00
0.25
0.50
0.75
1.00
Sen
sitiv
ity
0.00 0.25 0.50 0.75 1.001 - Specificity
Area under ROC curve = 0.8462
P.falciparum
0.00
0.25
0.50
0.75
1.00
Sen
sitiv
ity
0.00 0.25 0.50 0.75 1.001 - Specificity
Area under ROC curve = 0.8452
all species
Species-specific ROCs, they assess the relationship between sensitivity and specificity of the full models (with NDVI and LST)
in predicting local transmissions in all data
Results (16)
###
##
# #### ### ###
#
## ## ### # #### #### ## ##### ##### ## ## ###### #######
##### ## ### ### ## ### ## #
# ## ## ### ## ##
## # ### # ## #### #
# # ##########
#
#### # ## ### #### # # ### ### ##
## ## # # ### ### ### ## ### ## # ## ### #### #### #### ## ### #
##
### ########
##
#
# #### # ## #### ## #### ## # ### # ### ###
#### ## ### #### # #####
###### ###### #### ####### ### ## #### ####### ## ## ## ##### ### #######
#
#
# ## # ## ### ##### ##
#### ## #### ### # ##### ### # ### ## # #### ## ## ### ### # ## ### ## ## ## #### # ## # ## # ### # ## ### # # ## ### ##
#
#
#############
### ##### #######
#
### ## ### ## ### ## ## ######## ##### # ##### # ## ##### # ####
##
# ## ###
#### ## ###
### ## ##### #### ### ## #
# #
## # ### #### ## # ###
#
#
# ##
# ####
#
# #
###### # ##
#####
##
### #### # ###
##
# ## # ## ## #
####
# ### # ## ### #### #### ### ###
###
#
#
##### ##### ### #
# #
#
#
##
# ## #### # ####### ##### # #### ### # ### #### #
## # #### #
# ### ## ## #
## ##
## # ## ####
###
#####
#
#
#
#
#
##
#
####
##
###
##
####
### ##
#
#
## #### # #### ## ## ## # ## ## ## # ### # #### ## ## ### ### ###
## ### ## # ### ### ### #
### ### #
## ## # #
####
## #
#
#
#
#
Frequency of local transmission
# <=15%# 16-35%# 36-55%# >55%
###
##
# #### #
## ###
#
## ## ### # #### #### ## ##### ##### ## ## ###### #######
##### ## ### ### ## ### ## #
# ## ## ### ## ## ## # ### # ## #### ## # ##########
#
#### # ## # ## #### # # ### ### #
### ## # # ### ### ### ## ### ## # ## ### #### #### #### ##### ###
### ########
##
#
# #
#### ## #### ## #### ### ### # ### ####### ## ### # ### # #### #
###### ###### #### ####### ### ## #### ## ##### ## ## ## ##### ### #######
#
#
# ## # ## ### ## ### ##
#### ## #### ### ###### ### # ### ## # #### #### ### ### # ## ### ## ## ## #### # ## # ## # ### # ## ### # # ##
### ##
#
#
#### ###########
# ##### #######
#
### ## ### ## ### ## ## ######## ##### # ##### # ## ##### # ### #
##
# ## ###
###### ###### ## ##### #### #
## ## ## #
## # ### #### ## # ###
#
#
# ##
# ####
## #
###### # ##
#####
##
### ##
## # ###
##
# ### ## ## ##
#### ### # ## ### ##
## #### ### #####
##
#
########## ### #
# #
#
#
#
## ## #### # ###### ####### #### ### # ### #### #
## # #### #
# ### ## ## #
## ##
## # #####
#
###
#####
#
#
#
#
#
##
#
####
##
##
#
###
##### # ##
#
#
## ## ## # ### # ## ## ## # ## ## ## # ### # #### ## ## ### ### ###
## ##
# ## # ### ### ### ## ## ### #
## ## # #
###### #
#
#
#
#
###
##
# #### ### ###
#
## ## ### # #### #### ## ##### ### ## ## ## #############
#
#### ## ### ### ## ### ## ## ## ## ### #
# #### # ### # ## #### ## # ##########
#
#### # ## # ## #### # # ### ### #### ## # # ### ### ### ## ### ## # ## ### #### #### #### ##### #
##
### ########
##
#
# #
### # ## #### ## #### ## # ### # ### ### #### ## ### #### # #####
###### ###### #### ####### ### ## #### ####### ## ## ## ##### ### #######
#
#
# ## # ## ### ## ### ##
#### ## #### ### # ##### ### # ### ## # ### # ## ## ### ### # ## ### ## ## ## #### # ## # ### ### # ## ### # # ## ### ##
#
##### #######
####
# ##### #######
#
### ## ### ## ### ## ## ######## ##### # ##### # ## ####
# # ####
##
# ## ###
#### ## ###
### ## ##### #### ### ## #
# #
## # ### #### ## # ###
#
#
# ##
# ####
## ##### ## # ##
#####
##
### ##
## # ###
##
# ### ## #
# ##
#### ### # ## ### #### #### ### ### #
##
#
#
########## ### #
# #
#
#
#
## ###### # ###### # ##### # #### ### # ### #### #
## # #### #
# ### #### #
####
## # # # ####
##
#
#####
#
#
#
#
#
##
#
####
##
###
##
####
## # ##
#
#
## #### # ###### ## #
# # ## ## ## # ### # #### ## ## ### ### ###
## ##
# ## # ### ### ### ## ## ### #
## ## # #
###### #
#
#
#
#
Frequency of local transmission
# <=5%# 6 -15%# 16 - 25%
# >25%
###
##
# #### #
## ###
#
## ## ### # #### #### ## ##### ### ## ## ## #############
#
#### ## ### ### ## ### ## ## ## ## ### ## ## ## # ### # ## #### ## # ##########
#
#### # ## # ## #### # # ### ### #
### ## # # ### ### ### ## ### ## # ## ### #### #### #### ## ### ###
### ########
##
#
# #### # ## #### ## #### ## # ### # ### ### #### ## ### # ### # #####
###### ###### #### ####### ### ## #### ####### ## ## ## ##### ### #######
#
#
# ## # ## ### ## ### ##
#### ## #### ### ###### ### # ### ## # #### #### ### ### # ## ### ## ## ## #### # ## # ## # ### # ## ### # # ## ### ##
#
############
##### ##### ######
#
#### ## ### ## ### ## ## ######## ##### # ##### # ## ####
# # ### #
##
# ## ###
######### ### ## ##### #### #
## ## ## ### # #
## #### ## # ##
#
#
#
# ##
# ####
## #
###### # ##
#####
#######
## # ###
##
# ## # ## ## #
####
#### # ## ### ##
## #### ### ### ##
##
#
########## ### #
# #
#
#
#
## ## #### # ###### ####### #### ### # ### #### #
## # #### #
# ### ## ## ###
##
## # #####
#
##
#
## ###
#
#
##
#
###
####
##
###
##
###### # ##
#
#
## ## ## # ###### ## #
# # ## ## ### ### # #### ## ## ### ### ###
## ### ## # ### ### ##
# #
### ### ### ##
# #####
## #
#
#
#
#
###
##
# #### ### ###
#
## ## ### # #### #### ## ##### ### ## ## ## ###### #######
#
#### ## ### ### ## ### ## #
# ## ## ### ## ## ## # ### # ## #
### ## # ####
######
#
#### # ## # ## #### # # ### ### ##
## ## # # ### ### ### ## ### ## # ## ### #### #### #### ##### #
##
### ######
##
##
#
# #### # ## #### ## #### ## # ### # ### ###
#### ## ### # ### # #####
###### ###### #### ####### ### ## #### ##### ## ## ## ## ##### ### #######
#
#
# ## # ## ### ##### ##
#### ## #### ### ###### ### # ### ## # ### # ## ## ### ### # ## ### ## ## ## #### # ## # ## # ### # ## ### # # ## ### ##
#
#
#### ###########
# ##### #######
#
### ## ### ## ### ## ## ######## ##### # ##### # ## ####
# # ### #
##
# ## ###
###### ### ### ##
##### #### ### ## #
# #
## # ### #### ## # ###
#
#
# ##
# ## ##
#
# #
###### # ##
#####
##
#####
## ####
##
# ##
# ## ## #
#
#### ### # ##
### #### #### ### ###
##
##
#
########## ####
# #
#
#
#
## ###### # ######
# ###### #### ### # ### #### #
## # #### #
# ### #### #
####
## # ## ####
###
#####
#
#
#
#
#
##
#
####
##
##
#
##
####
### ##
#
#
## #### # ###### ## #
# # ## ## ## # ### # #### ## ## ### ### ###
## ### ## # ### ### ##
# ## ## ### #
## ## # #
###### #
#
#
#
#
Frequency of local transmission
# <10%# 11-30%# 31-55%# >55%
###
##
# #### ### ###
#
## ## ### # #### #### ## ##### ### ## ## ## #### #########
#
#### ## ### ### ##### ## #
# ## ## ### ## ##
## # ### # ## #### ## # ####
######
#
#### # ## # ## #### # # ### ### #
### ## # # ### ### ### ## ### ## # ## ### #### #### #### ##### #
##
### ########
##
#
# #
#### ## #### ## #### ### ### # ### ### #### ## ### # ### # #####
###### ########## ####### ### ## #### ####### ## ## ## ##### ### #######
#
#
# ## # ## ### ## ### ###
### ## #### ### ###### ### # ### ## # ### # #### ### ### # ## ### ## ## ## #### # ## # ### ### # ## ### # # ##### ##
#
##### ########
#### ##### #######
#
### ## ### ## ### ## ## ######## ##### # ##### # #
# ####
# # ####
##
# ## ###
#### ## ###
### ## ##### #### ### ## #
# ### # #
## ###
# ## # ###
#
#
# ##
# ####
## #
###### # ##
#####
##
### ##
## # ###
##
# ## # ## ## ##
###
# ### # ## ### #### #### ### ### #
##
#
#
########## ####
# #
#
#
#
## ###### # ###### ###### # #
### ### # ### #### ### # #### #
# ### #### #
####
## # ## ###
###
#
#####
#
#
#
##
##
#
####
##
##
#
##
######
# ##
#
#
## #### # ###### ## #
# # ## ## ## # ### # #### ## ## ### ### ###
## ##
# ### ### ### ### #
### ### ### ## # #
###### #
#
#
#
#
observed fitted
All species
P.falciparum
P.vivax
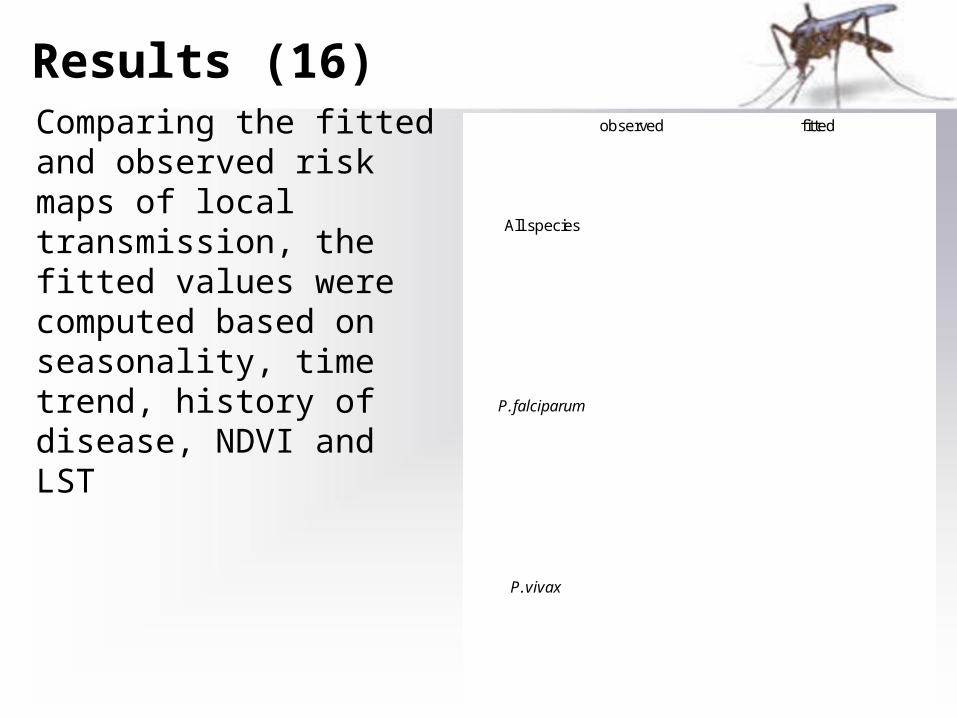
Comparing the fitted and observed risk maps of local transmission, the fitted values were computed based on seasonality, time trend, history of disease, NDVI and LST
Summary of main findings (1)
1. Ground climate data explained around 80% of P. vivax and 75% of P. falciparum variations one month ahead
2. Comparing to the extrapolation of data from previous month, ground climate data improve the accuracies around 10%; but remote sensing data does not improve
3. The ground climate data are freely available in the filed; therefore, it was concluded that the models based on ground climate data are feasible.
Summary of main findings (2)
4. Ground climate data improved predictions around 10% one month ahead in district level
5. NDVI and LST (with 8x8km resolution) did not improve the prediction
6. Elevation (with 1x1km resolution) improved predictions around 15%
7. NDVI (with 30x30m resolution) did not improve the predictions
Summary of main findings (3)
8. Elevation (with 1x1km resolution) improved predictions around 15%
9. NDVI (with 30x30m resolution) did not improve the predictions
10. P. falciparum and P. vivax models had different parameters.
11. The accuracy of temporal P. vivax variations was less than that in P. falciparum
conclusion
• Ground climate data (which are available free of charge)
improved the model accuracies around 10% and it seems that early warning system based on
these models is feasible

Time for your comments
Thanks for you kind attention