Embed Size (px)
Citation preview

Assessment of quantitative and genetic molecular variation of Acacia karroo
in two extreme populations
By
Georges Bayonne Mboumba
Thesis presented in partial fulfilment of the requirements for the degree of
Master of Science in Conservation Ecology
at the
Faculty of Agricultural and Forestry Sciences
University of Stellenbosch
Supervisor: Professor David Ward
April 2006

Declaration
I, the undersigned, hereby declare that the work contained in this thesis is my own
original work and that I have not previously in its entirety or part submitted it at any
university for a degree.
Signature:
Georges Bayonne Mboumba
Date:

Abstract
Abstract
Acacia karroo is widespread in southern Africa and displays remarkable
phenotypic plasticity over its geographical range. However, it is currently unknown
whether this phenomenon is merely phenotypic variation due to environmental variance
or whether such plasticity represents adaptation to different habitats (known as adaptive
phenotypic plasticity). Adaptive phenotypic plasticity implies that genotypes differ and
that there is local adaptation to the local environment. To shed light on this phenomenon,
we used a common-garden experiment to investigate among-population variation in
plastic responses to simulated rainfall and browsing in two populations originating from
contrasting environments, namely arid Karoo (Leeu Gamka) and subtropical coastal
forest (Richards Bay). We also studied genetic variation among populations by means of
allozyme markers. The results suggest that the populations investigated are both
genetically distinct and phenotypically plastic. In addition, there were high levels of
polymorphism within populations and great differences in their range of plastic responses
to treatments. Of the two populations investigated, the slow-growing one (Leeu Gamka)
was phenotypically more plastic with regard to defence-related traits (longer spines, more
tannin) while the fast-growing one (Richards Bay) was phenotypically more plastic
regarding growth-related traits (taller, with longer leaves). Patterns of performance
revealed that the populations have pure strategies of either growth (forest) or defence
(arid). The interactions between populations and environments in some traits indicated
genetic differentiation in plastic responses between populations and, consequently, that
phenotypic plasticity is locally adaptive and not merely due to environmental differences.
The two populations appear to have pure strategies; when environmental conditions were
i

Abstract
improved by addition of water, the forest population increased investment in growth but
not defence, while the arid populations increased defence production but not growth.
ii

Opsomming
Opsomming
Acacia karroo is wydverspreid in suidelike Afrika and vertoon merkwaardige
fenotipiese plastisiteit dwarsoor die spesie se geografiese verspreidingsgebied. Nietemin
is dit tans nie bekend of hierdie verskynsel maar net fenotipiese variasie as gevolg van
omgewingsverskille is, of dat hierdie plastisiteit aanpassings aan verskillende habitatte
(bekend as fenotipiese plastisiteit) verteenwordig nie. Aanpaslike fenotipiese plastisiteit
dui daarop dat genotipes van mekaar verskil en dat plaaslike aanpassings aan die
plaaslike omgewing voorkom. Om meer ingligting te verkry oor dié verskynsel het ons 'n
gemeenskaplike-tuin eksperiment gebruik om tussen-die-populasie variasie in plastiese
reaksies op nagebootste reënval en weiding te bestudeer in twee populasies afkomstig van
kontrasterende omgewings, naamlik droë Karoo (Leeu Gamka) en subtropiese kusbos
(Richards bay). Ons het ook genetiese variasie binne populasies bestudeer deur die
gebruik van allosiemmerkers. Die uitslae dui daarop dat die populasies wat ondersoek is
terselfdertyd geneties verskillend en fenotipies plasties is. Daar was boonop hoë vlakke
van polimorfie binne verskillende populasies en groot verskille in die omvang van die
plastiese reaksies op behandelings. Tussen die twee studie populasies was die stadig-
groeiende een (Leeu Gamka) meer fenotipies plasties ten opsigte van verdedigings-
verwante kenmerke (langer dorings, meer tannien) terwyl die vinnig-groeiende een
(Richards bay) fenotipies meer plasties was ten opsigte van groei-verwante kenmerke
(langer groei vorm, met langer blare). Die manier waarop populasies vertoon het, het
duidelike strategiëe van óf groei (bos) óf verdediging (droë omgewing) tussen die
populasies aangedui. Die wisselwerking tussen populasies en die omgewing het, ten
opsigte van sekere kenmerke, daarop gewys dat genetiese verskille in die plastiese
iii

Opsomming
reaksies tussen populasies bestaan en, gevolglik, dat fenotipiese plastisiteit plaaslik
aanpasbaar en nie net 'n gevolg van omgewingsverskille is nie. Dit blyk dat die twee
populasies suiwer strategiëe volg; die verbetering van omgewings-omstandighede deur
die toevoeging van water, het in die bos populasie gelei na verhoogde belegging in
groeivermoë maar nie in verdediging nie, terwyl die droë omgewing populasies ’n
verbetering in verdedigingsvermoë getoon het, maar nie in groei nie.
iv

Acknowledgements
Acknowledgements
I would like to thank all those people who helped me all along the tortuous route
towards the realization of this work. Nir Peleg and Gavin Gouws for teaching me the gel
electrophoresis of allozymes, Dr Theron for technical advice on greenhouse experiment,
Michiel Meets from Omnia Specialities for providing me with guidance in the use of
Vitagro (fertilizers), Heidi Thunemann, Cara Nieuwoudt, Khanysile Mbatha for technical
assistance in the laboratory and, Jack Kambatuku, Christina Potgieter and Dr Megan
Griffiths for the proofreading of manuscripts. By the time I was losing hope about my
work some people gave me extremely good advice that is the reason for which I would
like to single them out and thank them sincerely: Graziella Ntolo, my dad Georges
Mboumba Snr., my sisters and brothers. To you mom, Issope Jacqueline, may your soul
rest in peace. To Robert and Morean Aling I extend my heartfelt gratitude for the
wonderful environment in which I wrote this manuscript. This would not have been done
without the funding of the National Research Foundation to Prof David Ward and the
Gabonese Government towards my studies. A special thank to my Supervisor Prof David
Ward for believing in me knowing that I was in the process of learning this new language
(English). Many thanks to you and Dr Megan Griffiths for making me feel at home in
your house.
v

Foreword
Foreword
This study aims to investigate the apparent phenotypic plasticity displayed by
Acacia karroo growing in different habitats in order to contribute towards a more
comprehensive understanding of this phenomenon. The main objective is to determine
whether such a phenomenon is due to environmental variance or whether it represents
adaptation to different habitats (i.e. adaptive phenotypic plasticity). To achieve this aim,
we therefore compared the performances of two populations experiencing a variety of
selection pressures in controlled conditions and measured the amount of genetic
population differentiation.
This thesis encompasses the procedures, processes and outcomes of our
investigations and is presented in four chapters. Chapter 1 is an introduction to the
themes related to the study and explains the theoretical concepts of phenotypic plasticity
and adaptive phenotypic plasticity. It also introduces standard methodological approaches
for experimental evaluations of adaptive phenotypic plasticity and measurements of the
amount of genetic population differentiation. The chapter further provides insights into
stable environment vs. variable environment models, phenotypic plasticity of Acacia
karroo, phenology, breeding system, morphological and genetic variation in the species
and the objectives of this study. Chapters 2 and 3 have both been submitted for
publication to and hence follow the format of the Journal of Forest Ecology and
Management. Chapter 2 presents the findings on the genetic variation in both
populations. Chapter 3 deals with phenotypic plasticity and local adaptation in both
populations. The general conclusions are given in Chapter 4.
vi

Contents
Contents
Abstract............................................................................................................................... i Opsomming....................................................................................................................... iii Acknowledgements ........................................................................................................... v Foreword........................................................................................................................... vi Contents ........................................................................................................................... vii
Chapter 1
Introduction........................................................................................................... 1 Phenotypic plasticity........................................................................................... 1 Adaptive phenotypic plasticity ............................................................................ 3 Experimental evaluations of adaptive phenotypic plasticity .............................. 5 Measuring the amount of genetic population differentiation ............................. 7 Stable environment vs. variable environment................................................... 10 Phenotypic plasticity of Acacia karroo ............................................................. 11 Phenology and breeding system of Acacia karroo ............................................ 13 Morphological and genetic variation in Acacia karroo.................................... 15
General aims and methodology ......................................................................... 17 Objectives.......................................................................................................... 17 Study sites.......................................................................................................... 17
References............................................................................................................ 21 Chapter 2
Genetic variation in two extreme populations of phenotypically-plastic Acacia karroo ....................................................................................................................... 33
Introduction......................................................................................................... 35 Phenotypic and genotypic variation in Acacia karroo...................................... 37
Materials and methods ....................................................................................... 40 Population sampling ......................................................................................... 40 Allozyme electrophoresis .................................................................................. 41 Data analysis .................................................................................................... 42
Results .................................................................................................................. 43 Within-population polymorphisms.................................................................... 43 Among- population polymorphisms .................................................................. 45
Discussion............................................................................................................. 47 Population genetic variation............................................................................. 47
Acknowledgements ............................................................................................. 50 References............................................................................................................ 51
Chapter 3
Phenotypic plasticity and local adaptation in two extreme populations of Acacia karroo ....................................................................................................................... 57
Abstract................................................................................................................ 58 Introduction......................................................................................................... 60
vii

Contents
Strategies of growth and defence...................................................................... 61 Materials and methods ....................................................................................... 63
Study site and populations ................................................................................ 63 Data analysis .................................................................................................... 66
Results .................................................................................................................. 66 Phenotypic plasticity......................................................................................... 66 Trade-offs between growth and defence ........................................................... 72 Genotypic by environment interactions among populations ............................ 73
Discussion............................................................................................................. 78 Acknowledgements ............................................................................................. 81 References............................................................................................................ 82
Chapter 4
Conclusions.......................................................................................................... 88 References............................................................................................................ 92
viii
Chapter 1
Introduction
Phenotypic plasticity
A species can display marked variation and differences in attributes and
appearances as a result of adaptive responses to dissimilar environmental conditions
(Briggs and Walters, 1997). Environmentally imposed variations in a species may
manifest themselves in the forms, sizes or patterns of growth. Such an ability by a single
genotype to produce an array of phenotypes depending on the environmental scope is
termed phenotypic plasticity (Bradshaw, 1965; Schlichting & Levin, 1984; Via et al.,
1995; Macdonald and Chinnappa, 1989). This definition of phenotypic plasticity
encompasses physically discernible morphological growth or development of organs, as
well as physiological changes at the cellular level. Woltereck (1909) experimentally
documented the nonlinear relationship between environmental variation in food
availability and phenotypic variation in traits for different varieties of Hyalodaphnia and
referred to it as a reaction norm. This term has subsequently been revived by
Schmalhausen (1949) as a synonym for phenotypic plasticity; however, reaction norm is
not an entirely appropriate alternate term to phenotypic plasticity given that not all
reaction norms are necessarily plastic. A genotype exhibiting a constant phenotype across
different environments is not plastic but is a reaction norm (Fig. 1). To maintain clarity of
meaning and avoid confusions, phenotypic plasticity and reaction norms will not be used
interchangeably in this work.
Although the phenomenon of phenotypic plasticity occurs in both animals and
plants, it is more frequent and prominent in plant species because of (i) their relative
1

Chapter 1
immobility once established, which confines them to a given environment, as well as (ii)
the continuity of organ development during their life history (e.g. Bradshaw, 1965;
Agrawal et al., 1999; Novoplansky, 2002). Continual growth of plants means that new
organs produced during a particular growth season will constantly be tailored to the
environmental conditions and pressures prevailing at the time. As a result, a plant may
exhibit phenotypic characteristics of its spatial locality as well as the cumulative effect of
temporal environmental changes. The literature is replete with evidence of phenotypic
plasticity observed as variation in the expression of phenotypic plasticity within
(Jasienski et al., 1996; Schlichting and Pigliucci, 1998) and among populations of the
same plant species (Turesson, 1961; Briggs and Walters, 1984; Bradshaw, 1965; Counts,
1993; Jasienski et al., 1996; Schlichting and Pigliucci, 1998) and in related taxa
(Bradshaw, 1965; Cook, 1974). The capacity for phenotypic plasticity varies such that a
marked differentiation in ability of plasticity is found within plants. Widespread species
such as weeds and invasive plants are known to be highly plastic relative to plants with a
narrow distribution range (e.g. Baker, 1974; Williams et al., 1995; Linhart and Grant,
1996).
Our understanding of the ecological and evolutionary significance of phenotypic
plasticity is incomplete. Some studies have shown phenotypic plasticity to fulfil an
adaptive role (e.g. Jefferies, 1984; Schlichting, 1986; Sultan, 1987; Macdonald and
Chinnappa, 1989) by the plants to the environment. The role of plasticity in plants is best
elucidated in studies by Caldwell et al. (1991) who suggested that plasticity of organs
increases a plant’s opportunistic ability in variable environments. Thus, the plasticity of a
plant’s organs augments the plant’s performance under varying conditions of resource
2

Chapter 1
abundance (Bilbrough and Caldwell, 1997). By extension, the flexibility of plants to
adjust the development and growth of organs in accordance with temporal and spatial
changes in resource availability enables them to maximise their acquisition of available
resources in their environments. Sultan and Bazzaz (1993) suggested that plasticity of
organs helps plants to remain functional despite limiting and stressful environmental
conditions. These viewpoints are not necessarily mutually exclusive because varying
resource availability on a spatial and temporal scale is among the factors contributing to
environmental limitation and stress. As such, adaptive opportunism based on phenotypic
plasticity would allow a plant to retain its vitality in a variably limiting environment.
Phenotypically plastic responses involve an amount, which refers to the magnitude of
response to the environmental change (small or large) and a pattern, referring to the
shape of response (monotonic increase/decrease, or curves) (Bradshaw, 1965; Schlichting
and Levin, 1984), a speed of response (Kuiper and Kuiper, 1988), as well as a
reversibility, referring to the ability of switching between alternative states (Piersma and
Lindstrom, 1997) that are under genetic control and, consequently, subject to influence
by evolutionary forces.
Adaptive phenotypic plasticity
Alpert and Simms (2002) argued that phenotypic plasticity could be adaptive “…
plasticity in a trait that results from direct selection”, detrimental “… plasticity in a trait
due to inability to maintain a constant phenotype despite fitness reduction due to
variation” or neutral “… plasticity in a trait resulting from a lack of selection either for
or against variation accumulated through processes such as mutation or selection on
3

Chapter 1
other traits that are functionally related”. Whatever the outcome or consequence of
adaptive phenotypic plasticity, it is a phenomenon of considerable evolutionary and
ecological interest. Indeed, adaptive phenotypic plasticity implies that genotypes differ in
their genetic make-up and that there is local adaptation (also known as genotype-by-
environment (G×E) interaction) (e.g. Schlichting and Levin, 1984; Winn, 1996).
Adaptation can take the form of location-specific phenotypic expression through selective
pressures that produce the morphology and structure best suited to exploit local
conditions. Simply put, local adaptation can be defined as the evolution, through natural
selection, of traits that have high fitness in the environmental conditions specific to a
population (Freeman and Herron, 2001). The question of perennial interest is why this
occurs. Ridley (1996) and Freeman and Herron (2001) agreed that the degree to which
local adaptation can occur in a species depends on the potential for populations to evolve
differences from each other and the potential for natural selection to occur within each
population. The basis for adaptive flexibility of populations is the presence of variant
alleles in a population’s genome on which environmental factors will act and interact to
bring about morphological adjustment. This would mean that populations with a high
level of genetic drift (i.e. random change in allele frequencies), a phenomenon related to
small population size, or with high rates of gene flow preventing genetic differentiation
of populations would have lower potential for local adaptation than larger populations or
those with a low rate of gene flow. Examples of local adaptation include morphological
differences between aerial and aquatic leaves in plants (Bradshaw, 1965; Cook, 1974),
differences in growth and defence between plants growing in very poor environmental
conditions and those growing in rich environments (e.g. Coley et al., 1985). Evidence of
4
Chapter 1
local adaptation has also been demonstrated within populations of clonal species
(Turkington and Harper, 1979; Fisher et al., 2000; Alpert et al., 2003; Knight and Miller,
2004) as well as within subpopulations in non-clonal species that are separated by large
distances (Sork et al., 1993) or that have other barriers preventing gene flow (Shrestha et
al., 2002). The study conducted by Shrestha et al. (2002), on isolated populations of
Acacia raddiana in the Negev desert suffering from high mortality and limited
recruitment, showed that there was local adaptation in some morphological traits, with
water availability acting as the main selection pressure with regard to genetic
differentiation among the populations studied.
Experimental evaluations of adaptive phenotypic plasticity
Reaction norms are measures of the extent to which genotypes can be plastic and,
consequently, are indices of the nature of adaptive phenotypic plasticity. If one measures
the same trait in two or more different environments, the following results can be
obtained (Stearns 1992 - see Figure 1):
(a) parallel reaction norms indicate differences in the mean response (e.g.
genotypes 3 and 4).
(b) non-parallel or crossing reaction norms indicate genotype by environment
interaction (that is genetic variation in the plastic response in the trait of interest (e.g.
genotypes 2 and 3, 2 and 4)). Note that, while crossing reaction norms are typically used
to represent genotype by environment interactions, these reaction norms need only be
non-parallel (i.e. in an ANOVA, there must be a significant interaction effect) (Stearns
1992, Lynch and Walsh 1998).
5

Chapter 1
0
2
4
6
8
10
env 1 env 2
Environment
Phen
otyp
egenotype 1genotype 2genotype 3genotype 4
Figure 1: Reaction norms of imaginary genotypes of plants in two distinct environments.
Two types of experiments are efficient and informative for detecting genetic basis
of phenotypic plasticity and adaptive phenotypic plasticity (see e.g. Platenkamp and
Shaw 1992). Common-garden and reciprocal transplant experiments have been successful
in early studies (e.g. Kerner, 1895; Johannsen, 1909; Bonnier, 1920; see Briggs and
Walters, 1984) and more recently (e.g. Shaver et al., 1986; Schmid, 1992; Schmidtling,
1994; Shrestha et al., 2002; Volis et al, 2003; Knight and Miller, 2004). In general, they
include replicates of genetically-related individuals (e.g. full or half sib families, clones)
and focus on different traits such as growth (Sultan, 1992; Sultan and Bazzaz, 1993) or
physiological responses (Chapin and Shaver, 1996). Indeed, reciprocal transplant
experiments consist of growing these replicates from different populations of different
provenances in switched environments. Results from such experiments give an idea about
how critical evolutionary differences are to the persistence of a population at a site
6

Chapter 1
(MacGraw and Antonovics, 1983; Schwaegerle, 1996). Common garden experiments
can also be used to assess genetic differences in traits relevant to environmental change
(e.g. Corn and Hiesey, 1973). There is sufficient evidence for genetic variation in plastic
responses both within (van Kleunen et al., 2000; Smekens and van Tienderen, 2001;
Schlichting and Smith, 2002; Shrestha et al., 2002) and between conspecific plant
populations (Leiss and Muller-Scharer, 2001; Wilson, 2001; Botto and Smith, 2002;
Schlichting and Smith, 2002). Although these quantitative genetic experiments detect
genetic variation in plastic responses of traits among populations they do not directly
indicate the genetic variation existing within populations, which can be measured
indirectly with genetic markers that show the extent to which populations differentiate
genetically. Thus far, most studies carried out on the topic have considered quantitative
genetics experiments and genetic marker-based assessments separately. However, in
order to show that phenotypic plasticity is locally adaptive there is a need to combine
both types of assessment.
Measuring the amount of genetic population differentiation Molecular studies of plants provide insights into patterns of genetic diversity in natural
populations, variation in the mating system and genes controlling quantitative traits that
can be utilized for genetic improvement (e.g. Butcher, 2002, Parker et al., 1998). The
earliest study to use molecular markers reported that protein electrophoresis was able to
measure molecular variations in animals (e.g. Lewontin and Hubby, 1966). Since then, an
enormous number of studies have employed protein electrophoresis and other molecular
markers to examine population differentiation in plants and animals (e.g. Cheliak and
7

Chapter 1
Pitel, 1984; Soltis and Soltis, 1989; Godt and Hamrick, 1998; Joly et al., 1992; Oballa,
1993; Paschke et al., 2002; Shrestha et al., 2002 and so forth). A variety of molecular
tools capable of efficiently detecting differences among individuals exist to date
(reviewed by Parker et al. 1998). DNA-based techniques such as DNA sequencing,
random amplified polymorphic DNA (RAPDs), restriction fragment length
polymorphisms (RFLPs), microsatellite DNA (SSRs), and amplified fragment length
polymorphisms (AFLPs) are now widely employed. Although new methods of probing
the molecular basis of genetic variation have been developed, protein (enzyme)
electrophoresis remains a useful tool for population genetics and systematics because of
its reliability, modest cost and ease of application (Grant, 1989). An allozyme is an
enzyme that is the product of a particular allelic form of a gene (Hedrick, 1985) and an
isozyme is any of the distinct forms of enzyme that have identical or nearly identical
chemical properties but are encoded by different loci (Li and Graur, 1991). A number of
studies using allozymes as markers have been successful in demonstrating how
phenotypically-plastic conspecific populations differ. For example, Macdonald and
Chinnappa (1989) investigated population differentiation for phenotypic plasticity in the
Stellaria longipes complex and found that populations differed genetically. However, the
degree of plasticity was not related to the degree of isozyme variability in the five
populations. Strong similarities between patterns of variation for isozymes and
morphology among populations of Norway spruce (Picea abies) were found in a study by
Lagercrantz and Ryman (1990). Similar results were also found among populations of
Petrorbagia prolifera (Lonn and Prentice, 1990). Morphometric and allozymic studies in
populations of a montane herb, Ipomopsis aggregate, from three localities showed
8

Chapter 1
differentiation of floral morphology and allozymes among populations (Wolf and
Campbell, 1995). The amount of differentiation was different for allozymes and for floral
morphology; the variance component of allozymes decreased monotonically on an
increasing spatial scale, whereas the variance component of morphological characters
among localities was higher than among populations within localities. Interesting results
have been obtained by studies that show both genetic differentiation (that is, molecular
genetic variation) and genetic variation in plastic responses of traits among populations,
as they provide different approaches to exploring adaptive phenotypic plasticity.
However, it is unfortunate that few studies of this nature have been conducted on plants
(e.g. Ritland and Jain (1984) and Shrestha et al. (2002)). The discrepancy between neutral
and adaptive variation resides in the fact that neutral variations have effect when
evolutionary processes that impact individuals, populations and species, that is drift and
migration, occur; while adaptive variations involve when selection operate on molecular
variation by means of phenotype. As a consequence, there is a dilemma when using
neutral markers and then make conclusions with reference to adaptation. Forms of neutral
or nearly neutral markers like allozymes and macrosatellites are unlikely to precisely
foretell patterns of variation in quantitative traits when selection, rather than drift, is the
most important force acting, for illustration local adaptation and speciation (Reed and
Frankham, 2001). Quantitative trait loci (QTLs) are advanced markers that are
satisfactory tools for detecting adaptation and fitness.
9

Chapter 1
Stable environment vs. variable environment
The basic features of a variable environment are the instability and
unpredictability of environmental factors and conditions in space and time. In such an
environment, abrupt and inconsistent changes in physical conditions, resource
availability, climatic and biological factors are found within a short space of time and
location. The heterogeneity in a variable environment is often associated with the level of
stress experienced by organisms inhabiting such an environment. As an example, arid
regions are both highly stressed and highly variable in terms of availability of resources
in space and time (e.g. Noy-Meir, 1973). In contrast, stable environments such as forests
are relatively less stressed and less variable in terms of resource availability (e.g. Grime,
1979). Differences between variable and stable environments result in and are reflected in
a variety of acquired features and characteristics among the species inhabiting the
different environments. This is much more prominent in plant species and may be
manifested in greater plasticity as well as greater genetic variation (e.g. Hedrick et al.,
1976; Hedrick, 1986; Via and Lande, 1987). These studies serve to show that genetic
variation is related to the spatial heterogeneity of environments and that phenotypic
plasticity should also be more distinct in environments that are highly variable. Clearly, if
a comparison has to be made, plants from variable environments should be more
phenotypically variable (i.e. have higher phenotypic plasticity) and have relatively high
genetic variability. In a variable environment, each individual in a genotype has to adapt
to a mosaic of diverse biophysical conditions that are dissimilar in both time and space.
There would likely be more than one selective pressure per variable factor in a variable
10

Chapter 1
environment giving rise to the selection for a variety of different traits in a population.
This would, in turn, increase phenotypic plasticity (Via and Lande, 1987).
Phenotypic plasticity of Acacia karroo
Acacia karroo is the most widespread Acacia species in southern Africa and
displays remarkable phenotypic plasticity over its geographical range (Ross, 1975). It
grows variously as a multi-stemmed shrub, a slim and thinly branched shrub, or a tree up
to 40 m in height (e.g. Ross, 1975) and occurs from sea level to an altitudinal limit of
1524 m in the Drakensberg Mountains (Gordon-Gray and Ward, 1975) with the frost-line
as its upper limit. Dry thornveld, river valley scrub, bushveld woodland, grassland, the
banks of dry water courses, river banks of perennial courses, coastal dunes and coastal
scrub are all within the extensive range of different habitat types that A. karroo occupies
(Ross, 1979; Goldsmith and Carter, 1981, Acocks, 1988). The species can grow on
shallow soils of very low water-holding capacity and on weathering bedrock within 400
mm of surface (Hansley and Laker, 1979; Oballa, 1993). Additionally, it has high
tolerance to arsenic soils, which has attracted huge interest in its use for revegetating
abandoned old mining sites (Wild, 1974; Oballa, 1993). Because of its wide geographical
range, the species is subject to diverse climatic conditions and influences. On the
southern and south-western coast of South Africa, it is found within a Mediterranean
climate with winter rainfall. However, in other parts of South Africa, A. karroo grows in
a sub-tropical climate with summer rainfall (Barnes et al., 1996). According to Ross
(1979), there are eight major phenotypic varieties of A. karroo, which can be classified as
entities. More recently, Swartz (1982) considered these entities to perhaps be at the level
11

Chapter 1
of sub-species and even species (see Coates Palgrave, 2002). However, there is still
confusion in distinguishing A. karroo from its variants in the field. The eight variations of
the species are listed below. Note should be taken of the fact that the description here is
summarized following Oballa (1993). For detailed descriptions, see Ross (1971; 1979) or
Acocks (1988):
(1) The typical form of A. karroo grows in the arid Karoo region and drier
parts of the Cape Province as a shrub or tree with dark bark, with usually
(1) 2-3 (5) pinnae pairs per leaf.
(2) A form referred to as A. natalitia (Meyer, 1836) is a small-to-medium
sized tree with white bark, monoliform pods, and 4-7 (13) pinnae pairs per
leaf (von Breitenbach, 1989).
(3) Small slender shrubs up to 1 m high found in the Kei River.
(4) A fire-resistant shrubby form grows widely in the Nongoma District of
South Africa (A. inconflagrabilis).
(5) Slim, scarcely-branched trees up to 6 m occurring in the Hluhluwe and
Umfolozi Game Reserve (“spindle A. karroo”). These trees possess bright
reddish-brown minutely-flaking bark, glaucous foliage, with or without
large flattened petiolar glands.
(6) Large trees of A. karroo with greyish-white bark, with spines up to
25 cm long and long moniliform pods as described by Gordon-Gray and
Ward (1975), and distributed along the KwaZulu-Natal Coast, from the
Thukela River Mouth to Mozambique.
12

Chapter 1
(7) The A. karroo from Pretoria (Tswane) eastwards, characterized by sparse
indumentum on the young branchlets, leaves, peduncles and pods (A.
karroo var. transvaalensis).
(8) The shrubby form which resembles A. tenuispina, but lack spinulose-
mucronate leaflet apices and glandular pods.
Phenology and breeding system of Acacia karroo
The biology of the species is well documented. Phenologically, A. karroo is
deciduous apart from coastal and other communities in frost-free areas where it has
leaves throughout the year according to Teague (1988). He also reported that the optimal
day and night temperatures for growth of the species are between 25oC and 35oC and,
10oC and 15oC, respectively. The leaf growth is initiated at the beginning of the season
(September-October) by the emergence of two to three leaves at each node, depending on
the availability of subsoil moisture. Shoots start growing once leaves have reached their
full size. Flowering starts in October and can continue until January-February, depending
on the conditions of the environment (Poynton, 1984; Teague, 1988). The seeds of A.
karroo are contained in pods, which develop once they are filled with seeds because it is
believed that this delay protects against animals feeding on them (Coe and Coe, 1987).
Investigations on the breeding system have revealed that the species is zoomophilous; the
main pollinators are insects (Gordon-Gray and Ward, 1975; Coe and Coe, 1987). In
addition, there is evidence that the species exhibits sexual reproduction, and is mainly an
outcrosser as it is self-incompatible and is tetraploid with 2n = 4x = 52 chromosomes
(Oballa, 1993; Oballa and Olng’otie, 1994). In its natural range, A. karroo regenerates by
13
Chapter 1
coppicing and seed; however, the most frequent mode is by seed (Teague, 1988). Pods
dry when they reach the maturity, and then release seeds that are dispersed either by wind
or animals (Milton, 1987). Seeds of acacias possess hard coats, which need to be broken
to allow their germination (Doran et al., 1983). Dormancy is broken by micro-organisms,
soil acids, temperature fluctuations and herbivores that feed on the pods (e.g. Miller,
1993). It has also been found that bushfires sometimes help in scarification of seeds of A.
karroo (Coates-Palgrave, 1977); after fire, seeds germinate in 2 to 8 days. This gives the
species the opportunity to develop as pioneer or secondary species (e.g. Weisser and
Muller, 1983).
14

Chapter 1
Morphological and genetic variation in Acacia karroo
The remarkable phenotypic plasticity of A. karroo throughout the contrasting
environments in which it occurs has attracted the attention of researchers such as
Archibald and Bond (2003) who studied its architecture and allometry in forest, savanna,
and arid environments. Their investigation of the effects on the phenotype of
environmental factors other than light, has shown that adult trees in open environments
evolved different forms to those in forests. Furthermore, trees exposed to mammal
browsing differ in form from those exposed to frequent burning.
Swartz (1982) examined six purported variants of A. karroo using 19
morphological characters. In this study, she claimed that the results of her Principal
Component Analysis (PCA) of these characters supported the differentiation of these
taxa, perhaps at the subspecies level. She later (in Coates Palgrave, 2002) raised these
taxa to the level of species, without any indication that new research had been done in the
interim. Examination of the original work (Swartz, 1982) indicates that there is much
overlap between these variants and that cluster analyses revealed inconsistent groupings
of individuals among the groups she recognised. Unfortunately, no overall analysis (PCA
or cluster analysis) was performed. While we recognize that her study reveals interesting
variation among geographic groupings of A. karroo populations, it is difficult to assess
whether such variation represents anything more than broad phenotypic variability with
some local geographic variation.
Brain (1985; 1989; 1996) found variation in a leaf peroxidase among populations
of different environments, as did Oballa (1993) in a study using 12 enzyme systems
(allozymes). Brain suggested the existence of distinct geographic races and the
15

Chapter 1
correlation of isozyme phenotypes with environmental factors such as low temperature
and rainfall. Oballa’s study revealed that all populations surveyed expressed a high level
of genetic diversity. Unweighted pair-group and rooted dendrogram analyses clustered
the populations into three phylogenetic groups, which he characterized as the northern,
eastern and south-central-eastern groups. He also found that the distributions of some
common alleles at the shikimate dehydrogenase and alcohol dehydrogenase loci were
significantly correlated with some geographical factors, viz. latitude, longitude and
rainfall.
Despite the attempts by Swartz (1982), Archibald and Bond (2003), Brain (1996)
and others to shed light on striking phenotypic variations in A. karroo and associated
population differentiation, no conclusive experiments have been conducted to establish
whether this phenomenon is merely phenotypic variation due to environmental variance
or whether such apparent plasticity represents adaptation to different habitats (i.e.
adaptive phenotypic plasticity). No experiments where proper quantitative genetic
approaches involving the growing of full sib or half sib families within populations from
various environments in controlled conditions (such as common-garden experiments)
have been carried out for the species. Additionally, these studies should be combined
with population genetic studies, which would focus on a larger number of loci (see e.g.
Hamrick and Godt, 1989) than was the case in Brain’s (1985; 1989; 1996) studies.
16

Chapter 1
General aims and methodology
Objectives
The main objectives of the study were to establish whether the outstanding
phenotypic variations displayed in A. karroo between populations at two extremes of its
distribution are merely due to environmental variance or whether such plasticity
represents adaptation to different habitats (known as adaptive phenotypic plasticity).
To achieve these objectives, the study sought answers to two questions:
1. Are there genetic differences between populations?
To elucidate these differences, nine enzyme systems were assayed using starch gel
electrophoresis. The specific objective was to determine allozyme variation within and
between sampled populations (genetic population differentiation).
2. Are the observed phenotypic differences adaptive?
A common-garden experiment, in which seeds from different environments were
grown at two different levels of water availability and browsing by mammals, assessed
whether these genetic differences affect phenotypic plasticity and whether this plasticity
is potentially adaptive in their original environments
Study sites
Two populations of A. karroo likely to be under different selective pressures (that
is, climatic and environmentally different conditions consequently causing variability in
their phenotypes) for local adaptation were chosen for this study: one population in a
17

Chapter 1
semi-arid environment (Karoo) and the other one in subtropical coastal forest (KwaZulu-
Natal) (Figure 2).
In semi-arid environments such as in the Karoo, where plants encounter difficult
conditions such as limited resources and heavy herbivory, plants have slow growth and
high amounts of physical and chemical defences (e.g. Coley et al., 1985; Cooper and
Owen-Smith, 1985; Milewski et al., 1991; Milton, 1991). Attention was focused on the
shrubby Leeu Gamka population of A. karroo (32.3oS, 22.3oE), which faces heavy
grazing by livestock (sheep, cattle and goats) and wild herbivores such as kudu
Tragelaphus strepsiceros. This population also receives a low mean annual rainfall of
150 mm and experiences minimum monthly temperatures of 5˚C and mean maximum of
32˚C (Archibald and Bond, 2003).
In tropical or subtropical forest environments, where there are unlimited resources
and nonexistent herbivory by large mammals, plants have rapid growth and generally
display low amounts of physical and chemical defences (e.g. Coley et al., 1985;
Archibald and Bond, 2003). The dune coastal forest population of Richards Bay in the
east coast of KwaZulu-Natal (28.46˚S, 32.06˚E), which experiences a mean annual
rainfall of 1200 mm and respective mean minimum and maximum monthly temperatures
of 10˚C and 28˚C (Archibald and Bond, 2003) formed the second component of the
comparative study. The dominant forms at this location are trees reaching heights over 30
m and which face low or nonexistent grazing (Brain et al., 1996; Boyes, 2004), which
makes them very good candidates for such a study.
18

Chapter 1
Expected results and outcomes from this study were as follows:
(1) Populations should be genetically divergent because, according to Volis et al.
(2001), “under natural selection, populations or groups of populations that are
distant in space but environmentally alike should be genetically more similar than
those that are distant both spatially and environmentally”. This implies that the
likelihood of having similar genotypes should be higher in environmentally
similar populations or groups of populations as opposed to environmentally
dissimilar populations.
(2) The Leeu Gamka population should have a higher genetic variation because this
environment (Leeu Gamka) is highly variable (in the sense of form of selection as
mentioned in page 17) in comparison with Richards Bay, which is in a more
stable environment (see e.g. Hedrick et al., 1976; Hedrick, 1986). Furthermore,
the population with the higher genetic variation should be more variable in their
plasticity. This can be assessed by comparing the coefficients of variation of each
trait within populations.
(3) Both populations should have distinct strategies of investment; the Leeu Gamka
population is expected to invest more in defence and Richards Bay population in
growth. Therefore, there should be trade-offs between growth- and defence-
related traits (e.g. Coley et al., 1985).
19

Chapter 1
Figure 1: Map showing location of study sites (Richards Bay and Leeu Gamka) and other sites listed in the text.
20

Chapter 1
References Acocks, J.P.H., 1988. Veld types of South Africa. 3rd Edition. Mem. Bot. Surv. S. Afr.
57 Botanical Research Institute, South Africa. pp. 146.
Agrawal, A.A., Laforsch, C., Tollrian, R., 1999. Transgenerational induction of defences
in animals and plants. Nature 401, 60-63.
Archibald S., Bond, W.J., 2003. Growing tall vs. growing wide: tree architecture and
allometry of A. karroo in forest, savanna, and arid environments. Oikos 102, 3-14.
Alpert, P., Holzapfel, C., Slominski, C., 2003. Differences in performance between
genotypes of Fragaria chiloensis with different degrees of resource sharing. J.
Ecol. 91, 27-35.
Alpert, P., Simms, E.L., 2002. The relative advantages of plasticity and fixity in different
environments: when is it good for a plant to adjust? Evol. Ecol. 16, 285-297.
Baker, H.G., 1974. The evolution of weeds. Ann. Rev. Ecol. Syst. 5, 1-24.
Barnes, R.D., Filer, D.L., Milton S.J., 1996. Acacia karroo: monograph and annotated
bibliography. Trop. For. Pap. 32. Oxford Forestry Institute, UK.
Bilbrough, C.J., Caldwell, M.M., 1997. Exploitation of springtime ephemeral N pulses by
six Great Basin species. Ecology 78, 231-243.
Bonnier, G., 1920. New observations on experimental cultures at various altitudes and
cultures by sowing. Rev. Gen. Bot. 32, 305-326. [Nouvelles observations sur les
cultures expérimentales à diverses altitudes et cultures par semis.]
Botto, J.F., Smith, H., 2002. Differential genetic variation in adaptive strategies to a
common environmental signal in Arabidopsis accessions: phytochrome-mediated
shade avoidance. Plant Cell Env. 25, 53-63.
21

Chapter 1
Boyes, L.J., 2004. Regeneration failure and the Acacia karroo successional pathway in
coastal dune forest in KwaZulu-Natal. Unpubl. BSc (Hons) thesis, University of
KwaZulu-Natal, Pietermaritzburg.
Brain, P., 1985. Leaf peroxidase types in Acacia karroo. Geographical distribution and
influence of the environment. S. Afr. J. Bot. 52, 47-52.
Brain, P., 1989. Genetic races in a ring species of Acacia karroo. S. Afr. Sci. 85, 181-
185.
Brain, P., Harris, S.A., Barnes, R.D., 1996. Leaf peroxidase types in Acacia karroo
Hayne (Acacieae, Leguminosae): a range-wide study. Silvae Genet. 46, 88-94.
Bradshaw, A.D., 1965. Evolutionary significance of phenotypic plasticity in plants. Adv.
Genet. 13, 115-155.
Briggs, D., Walters, S.M., 1984. Plant variation and evolution. 2nd Edition. Cambridge
University Press, Cambridge, UK.
Briggs, D., Walters, S.M., 1997. Plant variation and evolution. 3rd Edition. Cambridge
University Press, Cambridge, UK.
Butcher, P.A., 2002. Molecular breeding of tropical trees. In: Rimbawanto, A., Susanto,
M. (Eds.), Proceedings of the international conference on advances in genetic
improvement of tropical trees species, 1-3 October 2002. Yogyakarta, Indonesia.
pp, 59-66.
Caldwell, M.M., Manwaring, J.H., Jackson, R.B., 1991. Exploitation of phosphate from
fertile soil microsites by three Great Basin perennials when in competition. Funct.
Ecol. 5, 757-764.
22

Chapter 1
Chapin, F.S. III, Shaver, G.R., 1996. Physiological and growth responses of arctic plants
to a field experiment simulating climatic change. Ecology 77, 822-840.
Cheliak, W.M., Pitel, J.A., 1984. Techniques for starch gel electrophoresis of enzymes
from forest tree species. Petawawa National Forestry Institute, Canada.
Coates-Palgrave, K., 1977. Trees of southern Africa. Struik, Cape Town. pp. 59.
Coates-Palgrave, K., 2002. Trees of southern Africa. 3rd Edition, Struik, Cape Town. pp.
19, 286.
Coe, M., Coe, C., 1987. Large herbivores, acacia trees and bruchid beetles. S. Afr. J. Sci.
83, 624-635.
Coley, P.D., Bryant, J.P. and Chapin, F.S. III, 1985. Resource availability hypothesis and
plant antiherbivore defence. Science 230, 895-899.
Cook, C.D.K., 1974. Waterplants of the world. The Hague: Junk.
Cooper, S.M., Owen-Smith, N., 1985. Condensed tannins deter feeding by browsing
ungulates in a South African savanna. Oecologia 67, 142-146.
Corn, C.A., Hiesey, W.M., 1973. Altitudinal variation in Hawaiian Metrosideros. Am. J.
Bot. 60, 991-1002.
Counts, R.L., 1993. Phenotypic plasticity and genetic variability in Zizania spp. along a
latitudinal gradient. Can. J. Bot. 71, 145-154.
Doran, J.C., Turnbull, J.W., Boland, D.J., Gunn, B.V., 1983. Hand book of seeds of dry-
zone acacias. FAO, Rome. pp. 92.
Fisher, M., Husi, R., Prati, D., Peintinger, M, van Kleunen, M., Schmid, B., 2000. RAPD
variation among and within small and large populations of the rare clonal plant
Ranunculus reptans (Ranunculaceae). Am. J. Bot. 87, 1128-1137.
23

Chapter 1
Freeman, S., Herron, J.C., 2001. Evolutionary analysis, 2nd Edition. Prentice Hall, Upper
Saddle River, NJ.
Godt, M.J.W., Hamrick, J.L., 1998. Allozyme diversity in the endangered pitcher plant
Sarracenia ssp. alabamensis (Sarraceniaceae) and its close relative S. rubra ssp.
rubra. Am. J. Bot. 85, 802-810.
Goldsmith, B., Carter, D.T., 1981. The indigenous timbers of Zimbabwe. Forest
Commission, Zimbabwe. Res. Bull. 9, 9.
Gordon-Gray, K.D., Ward, C.J., 1975. A contribution to the knowledge of floral variation
in Acacia karroo in eastern South Africa. Boissiera 24, 279-284.
Grant, W.S., 1989. Animal protein electrophoresis: Laboratory methods and statistics.
University of Witwatersrand Press, Johannesburg.
Grime, P., 1979. Plant strategies and vegetation process. Wiley and Sons, Chichester.
Hamrick, J.L., Godt, M.J.W., 1989. Allozyme diversity in plant species. In: Brown,
A.H.D., Clegg, M.T., Kahler, A.L., Weir, B.S. (Eds), Plant population, breeding,
and genetic resources. Sinauer Associates, Sunderland, Massachusetts, pp. 43-63.
Hedrick, P.W., Ginevan, M.E., Ewing, E.P., 1976. Genetic polymorphism in
heterogeneous environments. Annu. Rev. Ecol. Syst. 7, 1-32.
Hedrick, P. W., 1985. Genetics of populations. Jones and Bartlett, Inc., Boston. Partolla
Valley. pp. 629.
Hedrick, P.W., 1986. Genetic polymorphism in heterogeneous environments: a decade
later. Annu. Rev. Ecol. Syst. 17, 535-566.
Hansley, M., Laker, M.C., 1979. Land resources of Ciskei. In: Laker, M.C. (Ed), The
agricultural potential of Ciskei-Amended Report. University of Fort Hare, Alice.
24

Chapter 1
Jasienski, M., Francisco, J.A., Bazzaz, F.A., 1996. Phenotypic plasticity and similarity of
DNA among genotypes of an annual plant. Heredity 78, 176-181.
Jefferies, R.L., 1984. The phenotype: its development, physiological constraints, and
environmental signal. In: Dirzo, R., Sarukhan, J., (Eds), Plant Population
Ecology. Sinauer Associates, Sunderland, Massachusetts. pp. 347-358.
Johannsen, W., 1909. Elemente der exakten Erblichkeitslehre. Fisher, Jena.
Joly, H.I., Zeh-Nlo, M., Danthu, P., Aygalent, C., 1992. Population genetics of an
African acacia, Acacia albida. I. Genetic diversity of populations from West
Africa. Aust. J. Bot. 40, 59-73.
Kerner, A., 1895. The natural history of plants, their forms, growth, reproduction and
distribution. Blackie, London.
Knight, T.M., Miller, T.E., 2004. Local adaptation within a population of Hydrocotyle
bonariensis. Evol. Ecol. Res. 6, 103-114.
Kuiper, D., Kuiper, P.J.C., 1988. Phenotypic plasticity in a physiological perspective.
Oecol. Plant 9, 43-59.
Lagercrantz, U., Ryman, N., 1990. Genetic structure of Norway spruce (Picea abies):
concordance of morphological and allozymic variation. Evolution, 44, 38-53.
Leiss, K.A., Muller-Scharer, H., 2001. Performance of reciprocally sown populations of
Senecio vulgaris from ruderal and agricultural habitats. Oecologia 128, 210-216.
Lewontin, R.C., Hubby, J.L., 1966. A molecular approach to the study of genetic
heterozygosity in natural populations. II. Amount of variation and degree of
heterozygosity in natural populations of Drosophila pseudoobscura. Genetics 54,
595-609.
25

Chapter 1
Li, W. H., Graur, D., 1991. Fundamentals of molecular evolution. Sinauer Associates,
Sunderland, Massachussetts. pp. 284.
Linhart, Y.B., Grant, M.C., 1996. Evolutionary significance of local genetic
differentiation in plants. Annu. Rev. Ecol. Syst. 27, 237-277.
Lonn, M., Prentice, H.C., 1990. Mosaic variation in Swedish Petrorbagia prolifera: the
partitioning of morphometric and electrophoretic diversity. Biol. J. Linn. Soc. 41,
353-373.
Lynch, M., Walsh, B., 1997. Genetics and analysis of quantitative traits. Sinauer
Associates, Sunderland, Massachusetts.
MacGraw, J.B., Antonovics, J., 1983. Experimental ecology of Dryas octopetala
ecotypes. 1. Ecotypic differentiation and life-cycle stages of selection. J. Ecol. 71,
879-897.
Macdonald, E.S., Chinnappa, C.C., 1989. Population differentiation for phenotypic
plasticity in the Stellaria longipes complex. Am. J. Bot. 76, 1627-1637.
Meyer, E.H.F., 1836. Acacia natalitia. Comm. Pl. Afr. Austr. 1, 167.
Milewski, A.V., Young, T.P., Madden, D., 1991. Thorns as induced defences:
Experimental evidence. Oecologia 86, 70-75.
Miller, M.F., 1993. Is it advantageous for Acacia seeds to be eaten by ungulates? Oikos
66, 365-368.
Milton, S.J., 1987. Phenology of seven Acacia species in South Africa. S. Afr. J. Wildl.
Res. 17, 1-6.
Noy-Meir, I., 1973. Desert ecosystems: environment and producers. Annu. Rev. Ecol.
Syst. 4, 25-41.
26

Chapter 1
Novoplansky, A., 2002. Developmental plasticity in plants: implications of non-cognitive
behavior. Evol. Ecol. 16, 177-188.
Oballa, P.O., 1993. Genetic variation within Acacia karroo Hayne. Unpubl. D. Phil.
Oxford University, Oxford England.
Oballa, P.O., Olng’otie, P.A.S., 1994. Chromosome numbers in two African Acacia
species. Kew Bulletin 49, 107-113.
Parker, P.G., Snow, A.A., Schug, M.D., Booton, G.C., Fuerst, P.A., 1998. What
molecules can tell us about populations: choosing and using a molecular marker.
Ecology 79, 361-382.
Paschke, M., Abs, C., Schmidt, B., 2002. Relationaship between population size,
allozyme variation, and plant performance in the narrow endemic Cochlearia
bavarica. Conserv. Genet. 3, 131-144.
Piersma, T., Lindstrom, A., 1997. Rapid reversible changes in organ size as a component
of adaptive behaviour. Trends Ecol. Evol. 12, 134-138.
Platenkamp, G.A., Shaw, R.G., 1992. Environmental and genetic constraints on adaptive
population differentiation in Anthoxanthum odoratum. Evolution 46, 341-352.
Poynton, R.J., 1984. Characteristics and uses of selected trees and shrubs cultivated in
South Africa. Government Printer, Pretoria. pp. 201.
Quattro, J.M., Vrijenhoek, R.C., 1989. Fitness differences in remnant populations of the
endangered Sonoran topminnow. Science 245, 976-978.
Reed, D.H., Frankham, R., 2001. How closely correlated are molecular and quantitative
measures of genetic variation? A meta- analysis. Evolution 55, 1095-1103.
27

Chapter 1
Ridley, M., 1996. Evolution: Adaptive explanation. 2nd Edition. Blackwell Science, Inc,
Atlanta, Georgia. pp 338-368.
Ritland, K., Jain, S., 1984. A comparative study of floral and electrophoretic variation
with life history variation in Limnanthes alba (Limnanthaceae). Oecologia 63,
243-251.
Ross, J.H., 1971. Acacia karroo in Southern Africa. Bothalia 10, 385-401.
Ross, J.H., 1975. Notes on African Acacia species. Bothalia 11, 443-447.
Ross, J.H., 1979. A conspectus of the African Acacia species. Mem. Bot. Surv. S. Afr.
44, 93-95.
Schlichting, C.D., Levin, D.A., 1984. Phenotypic plasticity of annual Phlox: tests of some
hypotheses. Am. J. Bot. 71, 252-260.
Schlichting, C.D., 1986. The evolution of phenotypic plasticity in plants. Annu. Rev.
Ecol. Syst. 17, 667-693.
Schlichting, C.D., Pigliucci, M., 1998. Phenotypic evolution, a reaction norm perspective.
Sinauer Associates, Sunderland, Massachusetts.
Schlichting, C.D., Smith, H., 2002. Phenotypic plasticity: linking molecular mechanisms
with evolutionary outcomes. Evol. Ecol. 16, 189-211.
Schmalhausen, I.I., 1949. Factors of evolution: the theory of stabilizing selection.
University of Chicago Press, Chicago.
Schmid, B., 1992. Phenotypic variation in plants. Evol. Trends Plants 6, 55-60.
Schmidtling, R.C., 1994. Use of provenance tests to predict response to climate change:
loblolly pine and Norway spruce. Tree Physiol. 14, 805-817.
28

Chapter 1
Schwaegerle, K.E., 1996. Evolutionary response. 2nd Edition. In: Molau, U., Molgaard,
P. (Eds), International Tundra Experiment (ITEX) manual. Danish Polar Center,
Copenhagen. pp 49-50.
Shaver, G.R., Fetcher, N., Chapin, F.S. III, 1986. Growth and flowering in Eriophorum
vaginatum: annual and altitudinal variation. Ecology 67, 1524-1535.
Shrestha, M.K., Golan-Goldhirsh, A., Ward, D., 2002. Population genetic structure in
isolated populations of Acacia raddiana investigated by random amplified
polymorphic DNA (RAPD) markers. Biol. Conserv. 108, 119-127.
Smekens, M.J., van Tienderen, P.H., 2001. Genetic variation and plasticity of Plantago
coronopus under saline conditions. Acta Oecol. 22, 187-200.
Soltis, D.E., Soltis, P.S., 1989. Isozymes in plant biology. Department of Botany,
Washington State University.
Sork, V.L., Stowe, K.A., Hochwender, C., 1993. Evidence for local adaptation in closely
adjacent subpopulations of northern red oak (Quercus rubra L.) expressed as
resistance to leaf herbivores. Am. Nat. 142, 928-936.
Stearns, S.C., 1992. The evolution of life histories. Cambridge University Press,
Cambridge, UK.
Sultan, S.E., 1987. Evolutionary implications of phenotypic plasticity in plants. Evol.
Biol. 21, 127-178.
Sultan, S.E., 1992. What has survived of Darwin’s theory? Evol. Trends Plants 6, 61-71.
Sultan, S.E., Bazzaz, F.A., 1993. Phenotypic plasticity in Polygonium persicaria. III. The
evolution of ecological breadth for nutrient environment. Evolution 47, 1050-
1071.
29

Chapter 1
Swartz, P.P., 1982. A numerical-taxonomical evaluation of the taxon Acacia karroo
Hayne in southern Africa. Unpl. MSc thesis, University of Pretoria South Africa.
[‘n Numeries-taksonomiese evaluering van die takson Acacia karroo Hayne in
suidelike Afrika.]
Teague, W.R., 1988. The response of Acacia karroo plants to defoliation by hand
compared to defoliation by goats. J. Grassl. Soc. Sth. Afr. 5, 122-124.
Turesson, G., 1961. Habitat modifications in some widespread plant species. Bot. Not.
114, 435-452.
Turkington, R., Harper, J.L., 1979. The growth, distribution and neighbour relationships
of Trifolium repens in a permanent pasture. J. Ecol. 67, 245-254.
van Kleunen, M., Fisher, M., Schmid, B., 2000. Costs of plasticity in foraging
characteristics of the clonal plant Ranunculus reptans. Evolution 54, 1947-1955.
Via, S., Gomulkiewicz, R., De Jong, G., Scheiner, S.M., Schlichting, C.D., Van
Tienderen, P., 1995. Adaptive phenotypic plasticity: consensus and controversy.
Trends Ecol. Evol. 10, 212-217.
Via, S., Lande, R., 1987. Evolution of genetic variability in a spatially heterogeneous
environment: effects of genotype-environment interaction. Genet. Res. 49, 147-
156.
Volis, S., Shulgina, I., Ward, D., Mendlinger, S., 2003. Regional subdivision in wild
barley allozyme variation: adaptive or neutral? J. Hered. 94, 341-351
von Breitenbach, F., 1989. The lost Natal thorn for a reinstatement of Acacia natalia E.
Mey. J. Dendrol. 12, 1-10.
30

Chapter 1
Walters, M., Milton, S.J., 2003. The production, storage and viability of seeds of Acacia
karroo and A. nilotica in a grassy savanna in KwaZulu-Natal, South Africa. Afr.
J. Ecol. 41, 211-217.
Weisser, P.J., Muller, R., 1983. Dune vegetation dynamics from 1937-76 in Mlalazi-
Richards Bay of Natal, South Africa. Bothalia 14, 661-667.
Wild, H., 1974. Arsenic tolerant plant species established on arsenical mine dumps in
Rhodesia. Geobotanical anomalies in Rhodesia. The vegetation of arsenical soils.
Kirkia 9, 265-278.
Williams, D.G., Mack, R.N., Black, R.N., 1995. Ecophysiology of introduced
Pennisetum setaceum on Hawaii: the role of phenotypic plasticity. Ecology 76,
1569-1580.
Wilson, R.S., 2001. Geographic variation in thermal sensitivity of jumping performance
in the frog Lymnodynastes peronii. J. Exp. Biol. 204, 4227-4236.
Winn, A.A., 1996. Adaptation to fine-grained environmental variation: an analysis of
within-individual leaf variation in an annual plant. Evolution, 50, 1111-1118.
Wolf, P.G., Campbell, D.R., 1995. Hierarchical analysis of allozymic and morphometric
variation in a montane herb Ipomopsis aggregata (Polemoniaceae). J. Hered. 86,
386-394.
Woltereck, R., 1909. Further experimental investigations in relation to specie changes,
particularly over the quantitative traits differences in Daphnia. Attempt. German
zool. Soc. 19, 110-172. [Weitere experimentelle Untersuchungen über
31

Chapter 1
Artveränderung, speziell über das Wesen quantitativer Artunderscheide bei
Daphniden Versuch. Deutsch. Zool. Ges.]
32
Chapter 2
Genetic variation in two extreme populations of phenotypically-plastic
Acacia karroo
Submitted as:
Mboumba, G.B., Ward, D. Genetic variation in two extreme populations of
phenotypically-plastic Acacia karroo. Journal of Forest Ecology and Management.
33

Chapter 2
Abstract
Genetic variation of Acacia karroo was compared by allozyme electrophoresis for
two populations from extreme environments in South Africa: arid Karoo (Leeu Gamka)
and wet coastal forest (Richards Bay). These populations display remarkable phenotypic
differentiation: in the arid Karoo, adult trees are <4 m tall and have large thorns and in
coastal forests they may be as much as 40 m tall and invest little in defence. Of the nine
enzymes analyzed by horizontal starch gel electrophoresis, 10 enzyme-coding loci were
scored. Both populations exhibited higher genetic diversity (Richards Bay, H = 0.45 and
Leeu Gamka, H = 0.27) than in many other species studied to date. Principal Coordinate
analysis (PCoA) revealed little genetic overlap among populations, which is consistent
with the high Nei’s genetic distance value obtained (D = 0.26), as well as the significant
population differentiation (Φst = 0.422, p < 0.001) revealed by AMOVA. The high level
of genetic diversity may be due to the predominantly-outcrossing breeding system of the
species, and the degree of differentiation probably to their geographic isolation as well as
local adaptation to their environments.
Keywords: Acacia karroo, genetic variation, allozyme, starch gel electrophoresis.
34

Chapter 2
Introduction
Phenotypic diversity in widespread plant species is considered as an adaptation to
the variable environmental conditions in which they live (e.g. Bradshaw, 1965; Via et al.,
1995). The need to understand whether this diversity is the result of local adaptation is of
particular importance as it will provide insights into the ability of populations to adapt to
particular environments as well as predict their fate in the long-term. The ability of
species to occupy a variety of habitats has also been linked to genetic diversity as it is the
raw material of evolutionary changes (e.g. Pigliucci and Schlichting, 1997); there may be
much hidden genetic diversity in phenotypically-plastic species. From a conservation
viewpoint, it is judicious to differentiate adaptive phenotypic plasticity, which implies
that individuals differ genetically and that there is local adaptation, and phenotypic
plasticity, which is the ability of genotypes to modify their morphologies and
physiologies to changing environmental conditions (Schlichting, 1986). In terms of
conservation of genotypes, those populations that are genetically differentiated and that
exhibit significant genotype-by-environment interactions (i.e. are locally adapted), should
be conserved separately. It might be said that the objective of conservation is to preserve
genotype-by-environment interactions rather than populations or species per se.
There is abundant evidence that genetic differentiation is low in widely-
distributed plant species (Hamrick et al., 1981; Hamrick and Godt, 1989) while in small
isolated populations it is most likely to be high as it is enhanced by genetic drift (Moran
and Hopper, 1987), and selection in local environments. Contrastingly, genetic diversity
should be higher in widely-distributed plant species than in small isolated populations
(see e.g. Hamrick and Godt, 1989; 1998; Hamrick et al., 1992; Kang and Shang, 2000).
35

Chapter 2
Allozymes
The assessment of genetic diversity at the molecular level has rapidly improved
over the last 20 years, allowing us to answer questions relating to breeding system,
speciation, taxonomic boundaries, dispersal ability and so forth (Jeffrey and Gavin,
2000). There are three major kinds of genetic markers: (1) morphological markers that
display Mendelian inheritance (e.g. chlorophyll deficiency), (2) biochemical markers at
the protein level (e.g. isozymes, also known as allozymes) and, more recently (3) DNA-
based markers (Jeffrey and Gavin, 2000). The choice of a technique depends on the aims
of the study, the sensitivity and convenience of the technique and, of course, the
availability of resources (Oballa, 1993).
Allozymes are variants of the same enzyme encoded by different alleles at the
same locus. Because of amino acid charge differences, allozymes can be differentiated by
their relative migration speed during gel electrophoresis. Many enzymes are invariant
within populations (or even between species), and most polymorphic enzymes have only
a few variants. Although this limits the power of allozyme analysis to resolve genetic
diversity, they are time- and cost-efficient for research (Mueller and Wolfenbarger,
1999). Although less informative than DNA sequencing, randomly amplified
polymorphic DNA (RAPDs), and restriction fragment length polymorphisms (RFLPs),
allozymes were chosen for the ease with which one can address questions dealing with
genetic variation and for the low cost. Despite their lower efficiency in detecting
variation than some DNA markers (ca. 30 % - Van Straalen and Timmermans, 2002),
they have been found to be successful (since 1966) in quantifying genetic variation in
36

Chapter 2
many plant populations (see e.g. Brain, 1985 and 1989; Oballa, 1993; Yu et al., 2001;
Mateu-Andres and Segarra-Moragues, 2002).
Phenotypic and genotypic variation in Acacia karroo
Acacia karroo is the most widespread and most phenotypically-plastic Acacia tree
species in southern Africa and occupies a diverse range of habitats including dry
thornveld, river valley scrub, bushveld, woodland, grassland, the banks of dry
watercourses, riverbanks, coastal dunes and coastal scrub (Ross, 1979). There is evidence
that the large phenotypically-plastic variation is regional; plants in various parts of the
species’ geographical range often have different phenotypes (Ross, 1971). The typical
form of A. karroo grows in the arid Karoo and in the drier parts of the Western Cape
Province as a shrub or tree with dark rough bark (Figure 1). Others forms are
recognizable within the species; in the eastern Cape, KwaZulu-Natal, and Mpumulanga
provinces of South Africa, and in adjacent Swaziland, Zimbabwe and Mozambique, they
grow as white-barked trees or shrubs with short spines. Small slender shrubs up to 1 m
high are found in some parts of the Eastern Cape Province. “Fire resistant” shrubs are
found in some regions of northern KwaZulu-Natal province. Slender trees up to 6 m high
with few branches are found in KwaZulu-Natal province north of the Tugela River. Large
trees with greyish-white bark and spines up to 25 cm long are found along the KwaZulu-
Natal coast from the mouth of the Tugela River northwards into Mozambique (Ross,
1979). On the east coast of KwaZulu-Natal, particularly in the Richards Bay area, tall
trees up to 40 m with short thorns dominate the coastal dune forest community. On the
Gauteng highveld from Pretoria (Tshwane) eastwards, there is a local tendency for the
production of a sparse indumentum on the young branchlets, leaves, peduncles and pods.
37

Chapter 2
Finally, on the Springbok Flats (North West Province), they grow as small shrubby plants
(Ross, 1979).
Figure 1: Map showing location of study sites (Richards Bay and Leeu Gamka) and other sites listed in the text.
38

Chapter 2
The variability observed in phenotypes within the range of A. karroo may have a
genetic basis. Brain (1985; 1989), in a study of leaf peroxidase variation in South African
populations of A. karroo, revealed interesting patterns of variation among them,
suggesting the existence of distinct geographic races and the correlation of isozyme
phenotypes with environmental factors such as low temperature and rainfall.
Unfortunately, only one enzyme system was used by Brain (1989), which cannot be
considered a sufficient basis for differentiation among populations (Hamrick and Godt,
1989). A similar correlation of allele distribution and environmental factors in A. karroo
has also been shown for shikimate dehydrogenase and alcohol dehydrogenase loci
(Oballa, 1993). Hedrick et al. (1976) pointed out that when populations are sampled over
space, there is always a clinal pattern in one or more loci that correlates with some
environmental parameter, e.g. rainfall, temperature, or salinity (see also Volis et al.
2001). It is generally considered than 10-20 loci is the minimum for detecting population
differentiation (e.g. Hamrick and Godt, 1989). Provenance trials on A. karroo have also
shown genetic differences in growth form among populations (Barnes et al., 1996).
Archibald and Bond (2003) have shown large phenotypic differences in growth and
defence among A. karroo populations in the wild but, unfortunately, did not differentiate
between phenotypic and genotypic variability.
We attempted to remedy some of the shortcomings of earlier studies of genetic
differentiation in A. karroo by studying a large number of allozyme loci in two
populations from extreme environments. Leeu Gamka (arid Karoo of central South
Africa) and Richards Bay (coastal forest) populations differ considerably in phenotype
39

Chapter 2
(Figure 1). In the arid Karoo, adult trees are <4 m tall and have large thorns and in coastal
forests they may be as much as 40 m tall and invest little in defence.
Leeu Gamka is characterized by a very dry environment with a mean annual
rainfall of 150 mm with winter peak in rainfall, minimum monthly temperature of 5˚C
and maximum 32˚C (Archibald and Bond, 2003). At this location, the dominant forms of
A. karroo are shrubs and face heavy browsing by livestock and kudu Tragelaphus
strepsiceros. At Richards Bay, the environment is subtropical coastal forest (Richards
Bay) with a mean annual rainfall of 1200 mm. Monthly, the minimum and maximum
temperatures are respectively 10˚C and 28˚C (Archibald and Bond, 2003). The dominant
forms are trees reaching heights of over 30 m and face low or nonexistent browsing
(Brain et al., 1996; Boyes, 2004). The aim of the present study was to investigate genetic
variation within and between these two populations using allozymes as markers.
Materials and methods
Population sampling
Seeds were collected from 15 trees in each population. Trees were at least 10 m
apart to ensure that each tree represented a unique individual. Seeds were put in paper
bags and then brought to the laboratory. They were dried at 25˚C in order to remove all
unwanted organisms and kept in the refrigerator at 2-8˚C.
40

Chapter 2
Allozyme electrophoresis
Extraction of enzymes was done using a homogenizing buffer; placed in 400 μl of
0.01 M Tris buffer (pH 8). Seeds were ground, homogenized and centrifuged for 30 s at
12000 rpm. Thereafter, samples were kept in the refrigerator at -80˚C. However, because
of the poor state of most seeds collected, leaves were used for the rest of the study. A
number of enzyme systems were tried, with a focus on enzymes that showed inter-
individual variability between populations. Enzymes were extracted from one seed per
tree for nine trees randomly chosen out of 15 per population. Starch gel (13%)
electrophoresis was used and run with fresh samples either with TC buffer pH 7.5
(following Soltis et al., 1983) or HC pH 6.5 (Cardy et al., 1981) or RW pH 8.1 (Ridgway
et al., 1970) and MF pH 8.1 buffer (Markert and Faulhaber 1965)(enzymes and their
buffer systems are listed in Table 1).
Table 1: Enzymes and buffers used for staining.
Codes Stain EC. NO Gel Buffer Adh Alcohol dehydrogenase 1.1.1.1 Tris-citrate (TC) Dia Diaphorase 1.6.4.3 Histidine-citrate (HC) Est Esterase (alpha) 3.1.1.1 Tris-citrate-borate-lithium hydroxide
(RW) Idh Isocitrate dehydrogenase 1.1.1.42 Tris-borate-EDTA (MF) Mdh Malate dehydrogenase 1.1.1.37 Histidine-citrate (HC) Me Malic enzyme 1.1.1.40 Tris-citrate-borate-lithium hydroxide
(RW) Pgd Phosphogluconate dehydrogenase 1.1.1.44 Tris-citrate (TC) Pgi Phosphoglucose Isomerase 6.3.1.9 Histidine-citrate (HC) Sdh Shikimate dehydrogenase 1.1.1.25 Tris-borate-EDTA (MF)
Proteins were transferred to the gel in two ways: (1) via pipette into combs that
were filled with 20 μl of the sample, and (2) via filter paper wicks that were impregnated
41

Chapter 2
with the supernatant and inserted into the starch gel. The gels were covered with plastic
and run for 4-5 h at 50 mA in the refrigerator (2-8˚C). After electrophoresis, the gels were
cut into thin horizontal slices and each slice was stained using specific protein-staining
solutions. The chemical composition of each staining solution depended on the locus to
be stained (Cheliak and Pitel, 1984; Soltis and Soltis, 1989). After each electrophoresis
run, the allozymes were alphabetically scored (Soltis and Soltis, 1989).
Data analysis
The interpretation of allozyme patterns in Acacia karroo is extremely difficult
because of its ploidy level (tetraploid with 2n = 4x = 52 chromosomes), as indicated by
Oballa (1993) and, Oballa and Olng’otie (1994). Data were treated as phenotypes,
scoring the presence or absence of bands representing alleles (e.g. Brain, 1985, 1989;
Brain et al., 1996; Shrestha et al., 2002). The following parameters indicating genetic
diversity were described:
(1) the proportion of polymorphic loci (% P), obtained by counting the number of
loci with ≥ 2 bands (alleles) for total number of loci within each population;
(2) mean number of alleles per polymorphic locus (AP), and
(3) mean number of alleles per locus (A).
χ2 tests were used to test for significant differences in allele frequencies among
populations. We used POPGENE 1.31 (Yeh et al., 1998) to calculate the Shannon index
of gene diversity (H) and Nei’s genetic distance (D) (1972). Partitioning of genetic
diversity within and among populations was also investigated by an analysis of molecular
variance (AMOVA; WINAMOVA 1.55 program-Excoffier et al., 1992). The multivariate
42

Chapter 2
relationships among individuals and between populations was analyzed using a Principal
Coordinate Analysis (PCoA) using the Multi-Variate Statistical Package (MSVP-
Kovach, 1999).
Results
Within-population polymorphisms
Ten enzyme coding loci were consistently scored. In the two populations
analyzed, we found a total of 32 alleles. Four of these loci were monomorphic in the Leeu
Gamka population (Sdh, Idh, Me and Pgd); the remaining six loci were polymorphic
(Mdh, Dia, Adh, Pgi, α Est-1, and α Est-2). Two loci were monomorphic in the Richards
Bay population (Idh and Pgd); the remaining eight loci were polymorphic (Sdh, Mdh, Me,
Dia, Adh, Pgi, α Est-1, and α Est-2). All loci segregated at most four (rarely five) alleles
in a population (Table 2).
43

Chapter 2
Table 2: Allele frequencies at 10 loci in two populations of A. karroo.
Locus Allele Leeu Gamka Richards Bay Est-1 a 0.300 -
b 0.450 0.462 c 0.100 0.385 d 0.150 0.154
Est-2 a 0.409 0.556 b 0.091 -
c 0.273 0.444 d 0.227 -
Adh a 0.167 0.250 b 0.167 0.250 c 0.333 0.250 d 0.333 0.250
Pgi a - 0.310 b 0.053 0.241
c 0.474 0.276 d 0.474 0.172
Dia a - 0.192 b - 0.231 c 0.500 0.077 d 0.444 0.192 e 0.056 0.269
f - 0.038 Pgd a 1.000 1.000 Me a 0.600 0.462
b 0.400 0.538 Sdh a - 0.600
b 1.000 0.400 Mdh a 0.182 -
b 0.818 0.750 c - 0.250
Idh a 1.000 0.250 b - 0.750
44

Chapter 2
The Leeu Gamka population had lower genetic polymorphism than the Richards
Bay population for all indices measured. For the Leeu Gamka population, the percentage
of polymorphic loci (%P) was 60, mean number of alleles per locus (A) = 2.3, mean
number of alleles per polymorphic locus (AP) = 2.86 and Shannon index (H) = 0.27. In
the Richards Bay population, % P = 80, A = 2.8, AP = 3, and H = 0.45.
Among- population polymorphisms
Of the 32 bands found in both populations, two (namely Pgd and Mdh-b) were
removed from the analysis because they were fixed in both populations. For 17 bands, χ2
tests for heterogeneity were significantly different between populations (p values ranged
from 0.045 - 0.001). Leeu Gamka population had several private alleles, namely Mdh-a,
Est-1a, Est-2a and Est-2b (13.33 % private alleles) while alleles Sdh-a, Mdh-c, Pgi-a,
Dia-a, Dia-b and Dia-f were private to the Richards Bay population (20 % private
alleles). Principal Coordinate Analysis (PCoA; Hogbin and Peakall, 1999) illustrates the
multivariate relationships among individuals as well as among populations (Figure 2).
45

Chapter 2
-1.5
-0.9
-0.3
0.3
0.9
1.5
-3 1
Axis 1
Axi
s 2Leeu Gamka Richards Bay
Figure 2: Principal Coordinate Analysis (PCoA) of Acacia karroo (18 individuals). Axis 1 extracted 37.79% of the variance among individuals and Axis 2 extracted 13.15% of the variance. Note that one individual from Leeu Gamka overlaps on both axes with individuals from Richards Bay. The first two axes extracted a total of 50.94 % of the variation among individuals (Axis
1: 37.79 %; Axis 2: 13.15 %), revealing little genetic overlap among populations.
Similarly, an AMOVA revealed that 42.24% of the total variance occurred among
populations and 57.76% occurred within populations (Table 3). AMOVA showed that
there was significant population differentiation (Φst = 0.422, p < 0.001), which is
consistent with the high Nei’s unbiased genetic distance (D = 0.26).
46
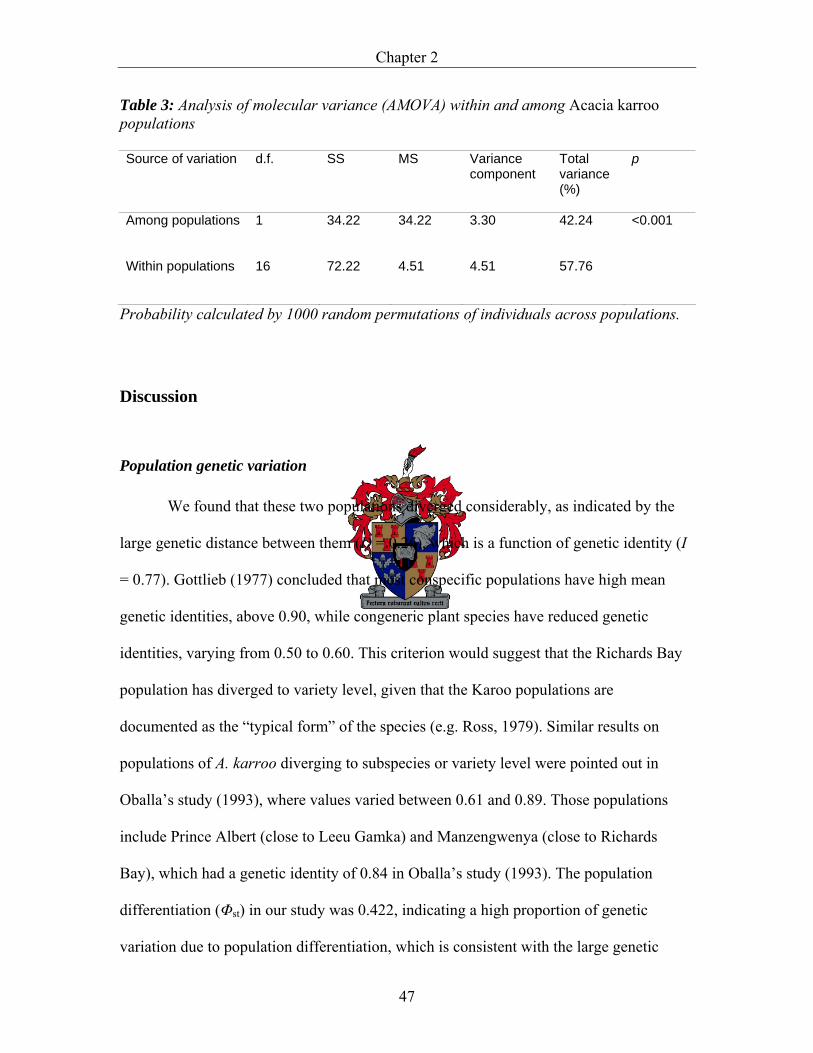
Chapter 2
Table 3: Analysis of molecular variance (AMOVA) within and among Acacia karroo populations Source of variation d.f.
SS
MS
Variance component
Total variance (%)
p
Among populations
1 34.22 34.22 3.30 42.24 <0.001
Within populations
16 72.22 4.51 4.51 57.76
Probability calculated by 1000 random permutations of individuals across populations.
Discussion
Population genetic variation
We found that these two populations diverged considerably, as indicated by the
large genetic distance between them (D = 0.26), which is a function of genetic identity (I
= 0.77). Gottlieb (1977) concluded that most conspecific populations have high mean
genetic identities, above 0.90, while congeneric plant species have reduced genetic
identities, varying from 0.50 to 0.60. This criterion would suggest that the Richards Bay
population has diverged to variety level, given that the Karoo populations are
documented as the “typical form” of the species (e.g. Ross, 1979). Similar results on
populations of A. karroo diverging to subspecies or variety level were pointed out in
Oballa’s study (1993), where values varied between 0.61 and 0.89. Those populations
include Prince Albert (close to Leeu Gamka) and Manzengwenya (close to Richards
Bay), which had a genetic identity of 0.84 in Oballa’s study (1993). The population
differentiation (Φst) in our study was 0.422, indicating a high proportion of genetic
variation due to population differentiation, which is consistent with the large genetic
47

Chapter 2
distance of 0.26. As with other plant species studied by Hamrick and Godt (1989) and
Macdonald et al. (2001), most genetic variation was found within populations, as
indicated by the analysis of molecular variance (57.76% variation within populations)
and which is consistent with the results of the Principal Coordinate analysis (Figure 2).
Interestingly, higher genetic diversity was observed in the Richards Bay
population (H = 0.45) than in Leeu Gamka (H = 0.27). This result is paradoxical because
the more stable forest environment at Richards Bay might be expected to have lower
genetic diversity than the highly variable arid Leeu Gamka environment (see e.g. Volis et
al. 2001; Hedrick et al., 1976; Hedrick, 1986). Both populations displayed very high
gene diversity compared with that found in tropical rainforest trees (mean H = 0.11 -
Hamrick and Loveless, 1986) and in the Australian Acacia species, A. crassicarpa (H =
0.13) and A. auriculiformis (H = 0.15) (Moran et al., 1989). An African species, Acacia
tortilis (Olngótie, 1992; see Oballa, 1993) and the closely-related Faidherbia albida (Joly
et al., 1992) have been shown to have high gene diversity (H = 0.45 in both cases), which
is similar to that recorded in the Richards Bay population. The Leeu Gamka population
had a gene diversity value approximately similar to what has been recorded in conifers (H
= 0.27 - Mitton, 1983) and in Acacia brevispica (H = 0.27, Harsh, 2003). The level of
polymorphism within each population (% P = 80 for Richards Bay and % P = 60 for
Leeu Gamka) was larger than those found in plant species in general (50%) (Hamrick and
Godt, 1989). This high level of genetic diversity is expected from widespread species, as
they occupy various habitats and encounter a variety of biotic and abiotic factors. It is
assumed that the level of genetic variation reflects an ability to adapt to changing
environmental conditions (Pigliucci and Schlichting, 1997). In another study, we (See
48

Chapter 2
Chapter 3) found that the coefficient of variation of a number of growth- and defence-
related traits was higher in Richards Bay than in Leeu Gamka. The reason for this is
uncertain but may reflect differences in spatial and temporal variability between these
habitats (see also Volis et al. 2001).
Recent reviews of the plant allozyme literature have shown that rare, endemic, or
narrowly-distributed plants tend to contain less allozyme variation than species with a
widespread distribution (Hamrick and Godt, 1989; Hamrick et al., 1992; Kang and
Chung, 2000). These results are particularly interesting because the efficiency of
allozymes in detecting variation is often considered to be low (ca. 30 % - Van Straalen
and Timmermans, 2002). Thus, the high population-level diversity recorded in this study
may be explained by the fact that A. karroo is predominantly an outcrosser, even though
it shows a high level of effective selfing (Ross, 1979; Oballa, 1993). In conservation
terms, the high level of genetic diversity observed within these populations is considered
to be encouraging because genetic diversity and fitness are often considered to be
positively correlated (Reed and Frankham 2003).
Divergence among populations has been established to be the result of many
factors, among which are genetic drift due to limited gene flow, breeding system of the
species (e.g. Barrett and Kohn, 1991; Hogbin and Peakall, 1999), and local adaptation via
genotype-by-environment interactions (e.g. Shrestha et al., 2002; Volis et al., 2002a,
2002b, 2002c). The Leeu Gamka population faces heavy grazing by livestock and wild
antelopes and low rainfall while the Richards Bay population occurs in an area of high
rainfall and has low or nonexistent grazing because they are in forest (Boyes, 2004). All
49

Chapter 2
these factors may have an impact on the genetic structure of these populations and may
lead to local adaptation via genotype-by-environment interactions.
In general, our evidence that these extreme populations differ genetically and
show a high level of genetic diversity conforms with the results of a study by Oballa
(1993) where high levels of genetic diversity between A. karroo populations of different
localities were detected, as well as Brain’s studies (1985; 1989) which showed genetic
differences between certain populations in different environments with a single enzyme
system. Inferences can now be drawn on the possible genetic basis of the phenomenal
phenotypic plasticity observed in populations of A. karroo by Archibald and Bond
(2003). Appropriate common-garden and reciprocal transplant experiments will be
needed to establish whether local adaptation is the main cause of population
differentiation (See Chapter 3).
Acknowledgements
We gratefully acknowledge funding for this research provided by the National
Research Foundation (to David Ward) and the Gabonese Government (to Georges
Bayonne Mboumba). Nir Peleg, Heidi Thunemann, Cara Nieuwoudt for technical
assistance in the laboratory. We especially thank Gavin Gouws and Sergei Volis for
helpful discussions.
50

Chapter 2
References
Archibald S., Bond, W.J., 2003. Growing tall vs. growing wide: tree architecture and
allometry of A. karroo in forest, savanna, and arid environments. Oikos 102, 3-14.
Barrett, S.C.H., Kohn, J.R., 1991. Genetics and evolutionary consequences of small
population size in plants: Implications for conservation. Falk, D. A. and Holsinger
K. E. (Eds). Genetics and conservation of rare plants. Oxford University Press.
New York, USA, pp. 3-30.
Barnes, R.D., Filer, D.L., Milton S.J., 1996. Acacia karroo: monograph and annotated
bibliography. Trop. For. Pap. 32. Oxford Forestry Institute.
Oxford, UK.
Boyes, L.J., 2004. Regeneration failure and the Acacia karroo successional pathway in
coastal dune forest in KwaZulu-Natal. Unpubl. BSc (Hons) thesis, University of
KwaZulu-Natal, Pietermaritzburg.
Bradshaw, A.D., 1965. Evolutionary significance of phenotypic plasticity in plants. Adv.
Genet. 13, 115-155.
Brain, P., 1985. Leaf peroxidase types in Acacia karroo. Geographical distribution and
influence of the environment. S. Afr. J. Bot. 52, 47-52.
Brain, P., 1989. Genetic races in a ring species of Acacia karroo. S. Afr. J. Sci. 85, 181-
185.
Brain, P., Harris, S.A., Barnes, R.D., 1996. Leaf peroxidase types in Acacia karroo
Hayne (Acacieae, Leguminosae): a range-wide study. Silvae Genet. 46, 88-94.
51

Chapter 2
Cardy, B.J., Stuber, C.W., Goodman, M.M., 1981. Techniques for starch gel
electrophoresis of enzymes from maize (Zea mayz L.). Institute of Statistics
Mimeograph Series No 1317. North Carolina State University, Raleigh, NC.
Cheliak, W.M., Pitel, J.A., 1984. Techniques for starch gel electrophoresis of enzymes
from forest tree species. Petawawa National Forestry Institute, Canada.
Excoffier L, Smouse PE, and Quattro JM (1992) Analysis of molecular variance inferred
from metric distances among DNA haplotypes : Application to human
mitochondrial DNA data. Genetics 131:479.491.
Hamrick, J.L., Mitton, J.B., Linhart, Y.B., 1981. Levels of genetic variation in trees:
influence of life history characteristics. In: Conkle, M.T. (Ed.), Proceeding of the
symposium on isozymes of North American forest trees and forest insects. July
27, 1979, Berkeley, California. pp. 35-41.
Hamrick, J.L., Godt, M.J.W., 1989. Allozyme diversity in plant species. In: Plant
population, breeding, and genetic resources. Brown, A.H.D., Clegg, M.T., Kahler,
A.L., Weir, B.S. (Eds). Sinauer Associates, Sunderland, Massachusetts, pp. 43-63.
Hamrick, J.L., Godt, M.J.W., Sherman-Broyles, S.L., 1992. Factors influencing levels of
genetic diversity in woody plant species. New Forests 6, 95-124.
Hamrick, J.L., Loveless, M.D., 1986. Isozyme variation in tropical trees: Procedures and
preliminary results. Biotropica 18, 201-207.
Harsh, J., 2003. Population genetic structure of Acacia brevispica from east Africa.
http://www.iusb.edu./~journal/2000/harsh.html, accessed on: 2003/05/16
52
Chapter 2
Hedrick, P.W., Ginevan, M.E., Ewing, E.P., 1976. Genetic polymorphism in
heterogeneous environments. Annu. Rev. Ecol. Syst. 7, 1-32.
Hedrick, P.W., 1986. Genetic polymorphism in heterogeneous environments: a decade
later. Annu. Rev. Ecol. Syst. 17, 535-566.
Hogbin, P.M., Peakall, R., 1999. Evaluation of the contribution of genetic research to the
management of the endangered plant Zieria prostrata. Conserv. Biol. 13, 514-
522.
Jeffrey, C.G., Gavin, F.M., 2000. Genetic tools: The use of biochemical and molecular
markers. In: Young, A., Boshier, D., Boyle, T., (Eds.), Forest conservation
genetics: principles and practice. CSIRO, Collinwood, Australia. pp 39-59.
Joly, H.I., Zeh-Nlo, M., Danthu, P., Aygalent, C., 1992. Population genetics of an
African acacia, Acacia albida. I. Genetic diversity of populations from West
Africa. Aust. J. Bot. 40, 59-73.
Kang, S.S., Chang, M.G., 2000. High levels of allozyme variation within populations and
low allozyme divergence within and among species of Hemerocallis (Liliaceae).
Am. J. Bot. 87, 1634-1646.
Kovach, W. 1999. Multi-variate Statistical Package 3.11b. Kovach Computing Services,
Aberystwyth, Wales, UK.
Macdonald, S.E., Thomas, B.R., Cherniawsky, D.M., Purdy, B.G., 2001. Managing
genetic resources of lodgepole pine in west-central Alberta: patterns of isozyme
variation in natural populations and effects of forest management. For. Ecol.
Manage. 152, 45-58.
53

Chapter 2
Markert, C.L., Faulhaber, I., 1965. Lactate dehydrogenase isozyme patterns of fish. J.
Exp. Zool. 159, 319-332.
Mateu-Andres, I., Segarra-Moragues, J.G., 2002. Patterns of genetic diversity in related
taxa of Antirrhinum L. assessed using allozymes. Biol. J. Linn. Soc. 79, 299-307.
Mitton, J.B., 1983. Conifers. In: Tanksley, S.D., Orton, T.J. (Eds), Isozymes in plant
genetics and breeding. Part B. Elsevier Science Publishers B.V., Amerstam. pp.
443-472.
Moran, G.F., Hopper, S.D., 1987. Conservation of the genetic resources of rare and
widespread eucalypts in remnant vegetation. In: Saunders, D.A., Arnold, G.W.,
Burbidg, A.A., Hopkins, A.J.M. (Eds), Nature conservation: the role of remnants
native vegetation. CSIRO and CALM. Australia. pp. 151-162.
Mueller, U.G., Wolfenbarger, L.L., 1999. AFLP genotyping and fingerprinting. Trends
Ecol. Evol. 14, 389-393.
Nei, M., 1972. Genetic distance between populations. Am. Nat. 106, 283-292.
Oballa, P.O., 1993. Genetic variation within Acacia karroo Hayne. Oxford England,
Unpubl. D. Phil. Oxford University, Oxford, UK.
Oballa, P.O., Olng’otie, P.A.S., 1994. Chromosome numbers in two African Acacia
species. Kew Bulletin 49, 107-113.
Olngótie, P.A.S., 1992. Acacia tortilis (Forsk) Hayne: A study of genetic diversity and
breeding systems. Unpub. D.Phil. Thesis, University of Oxford, Oxford, UK.
Pigliucci, M., Schlichting, C.D., 1997. On the limits of quantitative genetics for the study
of phenotypic evolution. Acta Biotheoret. 45, 143-160.
54

Chapter 2
Quilichini, A., Debussche, M., Thompson, J.D., 2003. Geographic differentiation of
morphological traits and isozymes in the mediterranean island endemic Anchusa
crispa: implications for the conservation of a protected species. Biol. Conserv.
118, 651-660.
Reed, D.H., Frankham, R., 2003. Correlation between fitness and genetic diversity.
Conserv. Biol. 17, 230-237.
Ridgeway, G.J., Sherburne S.W., Lewis R.D., 1970. Polymorphism in the esterase of
Atlantic herring. Trans. Am. Fish. Soc. 99, 147-151.
Ross, J.H., 1971. Acacia karroo in southern Africa. Bothalia 10, 385-401.
Ross, J.H., 1979. A conspectus of the African Acacia species. Mem. Bot. Surv. S. Afr.
44, 93-95.
Schlichting, C.D., 1986. The evolution of phenotypic plasticity in plants. Annu. Rev.
Ecol. Syst. 17, 667-693.
Shrestha, M.K., Golan-Goldhirsh, A., Ward, D., 2002. Population genetic structure in
isolated populations of Acacia raddiana investigated by random amplified
polymorphic DNA (RAPD) markers. Biol. Conserv. 108, 119-127.
Soltis, D.E., Haufler, C.H., Darrow, D.C., Gastony, G.J., 1983. Starch gel electrophoresis
of ferns: a compilation of grinding buffers, gel and electrode buffers, and staining
schedules. Am. Fern. J. 73, 9-26.
Soltis, D.E., Soltis, P.S., 1989. Isozymes in plant biology. Department of Botany,
Washington State University.
55

Chapter 2
Van Straalen, N.M., Timmermans, M.J.T.N., 2002. Genetic variation in toxicant stressed
populations: An evaluation of the "genetic erosion" hypothesis. Hum. Ecol. Risk
Assess. 8, 983-1002.
Via, S., Gomulkiewicz, R., De Jong, G., Scheiner, S.M., Schlichting, C.D., Van
Tienderen, P., 1995. Adaptive phenotypic plasticity: consensus and controversy.
Trends Ecol. Evol. 10, 212-217.
Volis, S. Yakubov, B. Shulgina, I., Ward, D., Zur, V., Mendlinger, S., 2001. Tests for
adaptive RAPD variation in population genetic structure of wild barley, Hordeum
spontaneum Koch. Biol. J. Linn. Soc. 74, 289-303.
Volis, S., Mendlinger, S., Ward, D., 2002a. Adaptive traits of wild barley plants of
Mediterranean and desert origin. Oecologia 133, 131-138.
Volis, S., Mendlinger, S., Ward, D., 2002b. Differentiation in populations of Hordeum
spontaneum Koch along a gradient of environmental productivity and
predictability: life history and local adaptation. Biol. J. Linn. Soc. 77, 479-490.
Volis, S., Mendlinger, S., Turuspekov, Y., Esnazarov, U., 2002c. Phenotypic and
allozyme variation in Mediterranean and desert populations of wild barley,
Hordeum spontaneum. Evolution 56, 1403-1415.
Yeh, F.C., Rong-Cai, Y., Boyle, T., 1998. POPGENE version 1.31. Edmonton, Alberta,
Canada, University of Alberta, Center for International Forestry Research.
Yu, J., Mosjidis, J.A., Klingler, K.A., Woods, F.M., 2001. Isozyme diversity in North
American cultivated red clover. Crop Sci. 41, 1625-1628.
56

Chapter 3
Phenotypic plasticity and local adaptation in two extreme populations of
Acacia karroo
Submitted as:
Mboumba, G.B., Ward, D. Phenotypic plasticity and local adaptation in two extreme
populations of Acacia karroo. Journal of Forest Ecology and Management.
57

Chapter 3
Abstract
We investigated differences in plasticity as well as local adaptations of two
extreme (i.e. ecologically and geographically extreme) populations of the extremely
phenotypically-plastic tree species Acacia karroo (Leeu Gamka, arid Karoo and Richards
Bay, subtropical coastal forest) in a common-garden experiment. Seeds were grown at
different levels of water availability with respect to their original environments and
browsing by mammals was simulated in the greenhouse by clipping plants (leaves and
twigs). The results suggest that the populations investigated are phenotypically plastic in
response to these factors. In addition, there were large differences between populations in
their range of plastic responses to treatments. Of the two populations investigated, the
slow-growing one (Leeu Gamka) was phenotypically more plastic with regard to
defence-related traits (longer spines, more tannin) while the fast-growing one (Richards
Bay) was phenotypically more plastic regarding growth-related traits (taller, with longer
leaves). Patterns of performance revealed that the populations have pure strategies of
either growth (forest) and defence (arid). The interactions between populations and
environments in some traits indicated genetic differentiation in plastic responses between
populations and, consequently, that phenotypic plasticity is locally adaptive and not
merely due to environmental differences. The two populations appear to have pure
strategies; when environmental conditions were improved by addition of water, the forest
population increased investment in growth but not defence while the arid populations
increased defence production but not growth.
58

Chapter 3
Keywords: Acacia karroo, phenotypic plasticity, trade-off, local adaptation, G×E
interaction.
59

Chapter 3
Introduction
Adaptive phenotypic plasticity is the ability of a single genotype to produce an
array of phenotypes depending on the environmental extent (Schlichting & Levin, 1984;
Via et al., 1995). Plasticity is expressed continuously in all plants and is an essential part
of the mechanisms by which plants survive, capture resources, deter herbivores and
pathogens and produce offspring (Grime and Mackey, 2002). Many studies suggest
correlations between variation in phenotypic plasticity and genetic differentiation among
individuals within populations (Jasienski et al., 1996) and between populations of
conspecific species (Counts, 1993). However, morphological variation among
populations does not necessarily correlate with genetic variation because some species
lacking genetic variation display high variation in phenotypic plasticity (Taylor and
Aarssen, 1988; Cordell et al., 1998). Understanding the functional or adaptive nature of
phenotypic plasticity necessitates an assessment of variability in plant morphology and
physiology (Bloom et al, 1985; Sultan 1987; Tilman, 1988; Campbell and Grime, 1992).
Indeed, adaptive phenotypic plasticity implies that genotypes differ and that there is local
adaptation “where fitness is maximized in the local environment” (Schlichting and Levin,
1984).
Acacia karroo is widespread throughout Southern Africa and displays a
remarkable phenotypic plasticity over its geographical range (Ross, 1975, Archibald and
Bond, 2003). Previous studies suggest that the species is phenotypically very plastic with
regard to various selection pressures (Barnes et al., 1996; Archibald and Bond, 2003);
and is highly differentiated genetically (Brain, 1985; 1989; Oballa, 1993). It occupies a
wide range of different habitats from subtropical forest to semi-desert (Ross, 1979;
60

Chapter 3
Goldsmith and Carter, 1981, Acocks, 1988), is therefore exposed to temperature and
rainfall extremes (Brain et al., 1996) and is thus likely to be under considerable selective
pressure for local adaptation to particular parts of its geographical range. It is yet to be
established whether the genetic differentiation recorded is associated with local
adaptation and whether the phenotypic variation recorded in adult plants in the field (i.e.
not under controlled conditions - e.g. Archibald and Bond 2003) is related to genotypic
differentiation. We set out to test whether adaptive phenotypic plasticity occurs in this
species and whether phenotypic variation is consistent with local adaptation.
Strategies of growth and defence
African acacias evolved as savanna trees under intense pressure from mammalian
herbivores (Ross, 1979; Scholes and Walker, 1993; Ward and Young, 2002; Shrestha et
al., 2002). In general, plants occupying savannas experience slow growth due to nutrient-
poor soils and thus maintain high levels of secondary metabolites (tannins or alkaloids),
which make them less palatable to browsers than fast-growing plants on nutrient-rich
soils (Bryant et al., 1989). Studies on Acacia responses to herbivory have focused on dry,
tropical savannas, where the importance of browsing ungulates on plants is well
documented (Pellew, 1983; 1984, Gowda, 1997). Additionally, Acacia species are known
to have long thorns and high polyphenol (especially condensed tannins) contents that help
them to deter mammalian herbivores (Wrangham and Waterman, 1981; Cooper and
Owen-Smith, 1985, Ward and Young 2002). It is generally assumed that defence is costly
because investments in defence come at the expense of investments in growth and
reproduction (Briggs and Schultz, 1990; Palo et al., 1993; Ward and Young, 2002). This
61

Chapter 3
is also supported by a number of studies on Acacia drepanolobium, A. seyal (Young,
1987; Milewski et al., 1991), A. tortilis (Gowda, 1996; Rohner and Ward, 1997), and A.
raddiana (Rohner and Ward, 1997).
The aims of this study were twofold: (1) to investigate how plastic two
populations from extreme environments (semi-desert and coastal sub-tropical forest) are,
and (2) to investigate adaptation of the populations to local conditions. Coastal sub-
tropical forest populations grow up to 40 m tall and have small spines, and the semi-
desert populations are short (and are within the browsing height of mammals for most, if
not all, of their lives) and have large thorns (Ross, 1979). Chemical defences of these
populations have not yet been studied. A common-garden experiment was used to
address the question of local adaptation as such experiments have frequently been used to
demonstrate local adaptation for species from geographically-separated populations
(Bradshaw, 1984). We used the widely-supported resource availability hypothesis of
plant defence to develop predictions about the level of investment in defence and growth
in A. karroo populations (Coley et al., 1985). According to this hypothesis, resource
availability is the major factor affecting the amount and type of plant defence. When
plants are resource-limited, plants with inherently low growth rates will be favoured over
those with fast growth rates and that slow growth rates favour heavy investments in
defence. Thus, the optimal levels of defence investment should increase as the potential
growth rate declines (Coley et al., 1985). Accordingly, we predicted the following
differences between the populations:
(1) Individuals from the coastal subtropical forest (Richards Bay) population
encounter little mammalian herbivory and experience high environmental quality with a
62

Chapter 3
mean annual rainfall of 1200 mm. Therefore, they should be able to easily regrow parts
lost to herbivory. These individuals should thus grow fast and invest little in defence.
(2) In contrast, individuals from the semi-desert (Leeu Gamka) population are
browsed regularly by large mammalian herbivores and experience poor environmental
conditions with low rainfall and low soil nutrients, making the cost of regrowth high for
individuals in this population. Therefore, they should grow slowly, and invest heavily in
defence mechanisms based on secondary plant compounds
Materials and methods
Study site and populations
Acacia karroo plants from Leeu Gamka in the semi-desert Karoo in the centre of
South Africa (32.3˚S, 22.3˚E), grow under poor environmental conditions, with a mean
annual rainfall of 150 mm that mostly falls in winter, minimum monthly temperature of
5˚C and a maximum of 32˚C (Archibald and Bond, 2003). At this location, A. karroo
predominantly forms shrubs (with an approximate mean height of 3 m) that are grazed
heavily by livestock (sheep, cattle and goats) and wild herbivores such as kudu
Tragelaphus strepsiceros. The second population, from Richards Bay on the east coast of
South Africa (28.46˚S, 32.06˚E), grows in a subtropical coastal forest, a moist
environment with a mean annual rainfall of 1200 mm, with rain falling throughout the
year. Monthly, the minimum and maximum temperatures are respectively 10˚C and 28˚C
(Archibald and Bond, 2003). Individuals in this population grow into trees reaching
63

Chapter 3
heights of over 30 m, and face low or nonexistent browsing when adults (Brain et al.,
1996; Boyes, 2004).
Experimental treatment
Seeds were collected from 15 trees (randomly chosen) in each population in July
2003. Trees sampled were at least 10 m apart from each other to ensure that each tree
represented a unique genotype and that the individuals were not closely related to each
other. Seeds were placed in paper bags and brought to the laboratory one the same day.
Seeds were then dried at 25˚C to remove all unwanted organisms such as fungi or
bacteria, which may cause deterioration in seed quality. After drying, seeds were kept in
the fridge at 2- 8˚C. From each population, 30 seeds (from each mother tree) were tested
for viability and were pre-treated in boiling water for two hours and left for a day in tap
water to scarify the hard seed coat. In nature, the seed coat is broken by a number of
biotic and abiotic agents, such as mammals, microorganisms, soil acids, temperature
fluctuations, rain and winds (Barnes et al., 1996). After the pre-treatments described
above, seeds were planted into trays containing vermiculite and left in the nursery to
germinate. Watering was done once a day, until seedlings were large enough to undergo
the experimental treatments. In each, 12 seedlings from each of the ten selected from the
15 trees sampled per population were transplanted in plastic bags to undergo the
treatments (in total 240 seedlings). To simulate the major ecological differences between
the two populations investigated, water availability and browsing were manipulated. A
completely crossed experimental design was used, and seedlings were randomly allocated
to the four treatments. Of the 12 offspring per tree sampled, six (three clipped and three
64
Chapter 3
unclipped) were watered every three days (high water availability) and the remainder
every 10 days (low water availability). Clipping of the plants was used to imitate
browsing by mammals. The use of real herbivores is often laborious and may be virtually
impossible in many experimental setups (Lehtilä and Boalt, 2004). Plants were clipped 1
cm from the tip of leaves and young branches. Water soluble fertilizer “Vitagro” (N-P-K-
S-Zn-B: 254-30-89-24-0.445-0.405 g/kg) was used as a soil nutrient to maximize growth
rate. It was provided to all bags at a 1% concentration (0.5kg to 50l of water) for the first
4 weeks, 1.5% concentration for the 2 next weeks (until 6 weeks stage) and then at 2%
concentration for the remainder of the time.
The experiment was terminated after a year when above- and below-ground
biomasses were harvested. Soil was removed from the roots by washing before below-
ground biomass was determined, and plants were dried in oven at 70˚C for 24 h. The
following parameters were measured before harvesting the plants: plant height (vertically
from ground to highest leaf (cm)), stem diameter (greatest diameter of the main stem
above the ground (cm)), leaf length (mean of five leaves on a randomly-chosen branch),
spine number (total for each tree) and spine length (cm) (mean length of all spines on a
randomly-selected branch). All these parameters were measured according to Archibald
and Bond (2003).
Condensed tannins were determined by the proanthocyanidin method (Hagerman,
1995). We ground 0.02 g of dried plant material with a Wiley mill to pass through a 0.6
mm sieve and the absorbance was read at 550 nm with a spectrophotometer. The
concentration of condensed tannins as quebracho equivalents was calculated using this
65

Chapter 3
formula: = [{(0.0049*abs) – 0.0004}/ mass] * 100 mg/ml. Quebracho for the standard
was obtained from A. Hagerman (Miami University, Oxford, Ohio, USA).
Data analysis
StatSoft, Inc. (2004) software was used for all statistical analyses. To examine the
overall significance of the treatments, MANOVA was used to protect experiment-wise
error when examining many traits. Subsequently, a full factorial ANOVA (General
Linear Model), with mother tree (nested within populations) as a random effect, was
conducted on each dependent variable. Some variables were transformed to satisfy
assumptions of the analysis. Thus, plant height, leaf length, spine number, and above and
below ground biomass were log10-transformed and tannin concentrations were arcsine-
square root transformed. Stem diameter and spine length required no transformation. The
level of significance was 0.05. Correlations between various traits were obtained using a
Pearson’s product-moment correlation.
Results
For the sake of brevity, we describe below only those results where a significant
effect was detected.
Phenotypic plasticity
The overall multivariate analysis of variance (MANOVA) indicated significant
phenotypic plasticity for both growth-related and defence-related traits (Table 1). The
66

Chapter 3
traits that were the most plastic (i.e. showed greatest differences among treatment means)
were above- and below-ground biomass, and spine length. The least plastic traits were
stem diameter and spine number.
Table 1: Results of MANOVA on all quantitative traits measured.
Factor d.f. Wilks’ λ F P
Clipping 8 .894 1.95 .058
Populations 8 .431 21.64 <0.001
Watering 8 .823 3.52 .001
Clipping*Populations 8 .857 2.73 .008
Clipping*Watering 8 .962 .66 .730
Populations*Watering 8 .807 3.93 <.001
Clipping*Populations*Watering 8 .922 1.39 .208
Mother(Populations) 144 .195 1.69 <.001
Error 131
A significant population effect was observed for plant height (F = 38.54, p =
0.001), stem diameter (F = 8.11, p < 0.001), leaf length (F = 115.58, p < 0.001), spine
length (F = 41.61, P < 0.001), below-ground biomass (F = 76.36, p < 0.001) and tannin
concentration (F = 20.23, p = 0.001) (Table 2 (a and b)).
67

Chapter 3
Table 2 (a): Mean squares, F values and significance (p) in the analyses of variance of the two populations of A. karroo under different treatments. Tannin concentration Leaf length Factor d.f. F Mean Squares (p) d.f. F Mean squares (p)
Clipping 1 0.71 58 (0.4) 1 0.03 0.001 (0.870)
Population 1 13.81 1630 (0.001) 1 115.58 4.406 (0.001)
Water 1 1.28 103 (0.261) 1 1.44 0.033 (0.249)
Clipping*Pop 1 4.29 346 (0.040) 1 0.55 0.014 (0.459)
Clipping*Water 1 0.93 75 (0.34) 1 0.07 0.002 (0.796)
Pop*Water 1 0.7 56 (0.41) 1 0.56 0.014 (0.457)
Clip*Pop*Water 1 0.34 28 (0.560) 1 0 0.00001 (0.986)
Mother(Pop) 18 1.5 121 (0.098) 18 1.57 0.039 (0.076)
Error 138 80.58 156 0.025 Stem diameter Spine length Factor d.f. F Mean squares (p) d.f. F Mean squares (p)
Clipping 1 2.15 0.023 (0.145) 1 1.12 0.094 (0.291)
Population 1 8.11 0.220 (0.001) 1 41.61 8.688 (<0.001)
Water 1 5.92 0.064 (0.016) 1 3.06 0.256 (0.082)
Clipping*Pop 1 1.67 0.018 (0.198) 1 0.01 0.001 (0.908)
Clipping*Water 1 1.77 0.019 (0.185) 1 0.32 0.027 (0.571)
Pop*Water 1 1.56 0.017 (0.213) 1 7.87 0.658 (0.006)
Clip*Pop*Water 1 4.38 0.047 (0.038) 1 0.15 0.013 (0.698)
Mother(Pop) 18 2.62 0.028 (<0.001) 18 2.61 0.218 (<0.001)
Error 156 0.011 156 0.084
68

Chapter 3
Table 2 (b): Mean squares, F values and significance (p) in the analyses of variance of the two populations of A. karroo under different treatments.
Spine number Belowground biomass Factor d.f. F Mean squares (p) d.f. F Mean squares (p)
Clipping 1 0.14 0.003 (0.709) 1 0 0 (0.992)
Population 1 0.36 0.007 (0.617) 1 76.36 10.88 (<0.001)
Water 1 0.02 0.001 (0.881) 1 29.84 2.14 (<0.001)
Clipping*Pop 1 3.27 0.060 (0.073) 1 0.25 0.02 (0.618)
Clipping*Water 1 1.12 0.021 (0.292) 1 0.25 0.02 (0.62)
Pop*Water 1 6.09 0.113 (0.015) 1 0.87 0.06 (0.352)
Clip*Pop*Water 1 5.01 0.093 (0.027) 1 0.56 0.04 (0.475)
Mother(Pop) 18 1.44 0.027 (0.121) 18 2.06 0.15 (0.01)
Error 156 0.019 156 0.072 Aboveground biomass Plant height Factor d.f. F Mean squares (p) d.f. F Mean squares (p)
Clipping 1 0.04 0.002 (0.85) 1 8.25 0.131 (0.005)
Population 1 4.2 0.331 (0.054) 1 38.54 0.612 (0.001)
Water 1 21.17 1.087 (<0.001) 1 2.88 0.046 (0.092)
Clipping*Pop 1 0.08 0.004 (0.782) 1 1.54 0.024 (0.217)
Clipping*Water 1 1.64 0.084 (0.202) 1 3.85 0.061 (0.051)
Pop*Water 1 4.94 0.254 (0.028) 1 3.07 0.049 (0.082)
Clip*Pop*Water 1 0.61 0.031 (0.435) 1 1.81 0.029 (0.180)
Mother(Pop) 18 1.57 0.081 (0.073) 18 2.73 0.043 (<0.001)
Error 156 0.051 156 0.016
69

Chapter 3
Richards Bay plants were taller and had greater leaf length than Leeu Gamka
plants. Leeu Gamka plants had greater stem diameter, spine length, below-ground
biomass, and tannin concentration (Table 3).
Table 3: Phenotypic differences in various morphological traits between the two populations. Values are means (± 1 SD).
Populations Leeu Gamka Richards Bay p
Plant height (log10 ,cm) 1.311 (0.164) 1.443 (0.123) 0.001
Stem diameter (cm) 0.456 (0.125) 0.389 (0.108) 0.001
Spine length (cm) 1.259 (0.358) 0.801 (0.282) < 0.001
Spine number (log10) 1.739 (0.131) 1.761 (0.151) 0.617
Leaf length (log10 ,cm) 0.344 (0.206) 0.670 (0.114) 0.001
Aboveground biomass (log10, g) 0.23 (0.228) 0.141 (0.263) 0.054
Belowground biomass (log10, g) 0.232 (0.322) -0.28 (0.284) < 0.001
Condensed Tannin Concentration ( % Q.E.) 15.92 (10.92) 8.72 (7.36) 0.0014
A significant clipping effect was observed for plant height only (F = 8.25, p =
0.005). Clipped plants had lower mean height (22.39 cm) than unclipped ones (26.30
cm). There was a significant watering effect on stem diameter (F = 5.92, p = 0.016),
above-ground biomass (F = 21.17, p < 0.001) and belowground biomass (F= 29.84, p <
0.001) (Table 2 a and b) only. Plants had greater stem diameter with an increase in water
availability (high watering: 0.44 ± 0.013 cm vs. low watering: 0.40 ± 0.012 cm). Higher
70

Chapter 3
above- and below-ground biomass means were recorded when the level of water
increased (respectively high watering: 1.66 g ± 1.05 vs. low watering: 1.38 g ±1.07 and
1.12 g ±1.09 vs. 0.70 g ±1.09).
Coefficients of variation of growth- and defence-related traits within populations
were measured in the four treatments. The trend was for higher variation in Richards Bay
plants for spine length, spine number, tannin, stem diameter, above- and below-ground
biomass while Leeu Gamka plants exhibited higher variation in plant height and leaf
length (Table 4).
Table 4: Coefficients of variation (CV %) for growth- and defence-related traits
Plant height
Stem diameter
Leaf length
Spine length
Spine number
Above biomass
Below biomass
Tannin
Herbivory
RB 10 10.04 26.30 16.75 28.75 8.16 58.60
76.44
80.23
Herbivory
LG 10 14.83 29.95 83.01 28.37 6.29 43.04
54.87
61.31
Control
RB 10 7.69 32.91 14.90 39.77 7.87 53.51
41.83
74.99
Control
LG 10 10.73 26.49 50.06 22.74 6.42 47.82
52.63
79.59
Herbivory
RB 3 8.72 24.17 18.73 34.57 10.59 40.97
56.91
71.24
Herbivory
LG 3 11.02 24.43 35.65 32.37 7.91 44.85
59.39
62.53
Control
RB 3 5.16 25.12 16.82 36.26 7.21 53.79
86.88
99.47
Control
LG 3 10.66 23.19 49.82 22.43 7.67 48.49
64.12
61.76
71

Chapter 3
Trade-offs between growth and defence
The resource availability hypothesis predicts that there will be trade-offs in
investment between growth and defence-related traits (Coley et al., 1985). Consequently,
correlations between various traits were tested. There was a significantly negative
correlation between spine length and leaf length (r = -0.27, F = 13.64, p < 0.001).
However, spine length was strongly and positively correlated with other traits, viz. stem
diameter (r = 0.46, F = 47.70, p < 0.001), above-ground biomass (r = 0.44, F = 43.10, p <
0.001) and below-ground biomass (r = 0.59, F = 93.88, p < 0.001). No correlation was
found between spine length and plant height (r = 0.1, F = 1.74, p = 0.19). There was a
positive correlation between spine length and other defence-related traits, viz. tannin
concentration (r = 0.21, F = 7.51, p = 0.007) and spine number (r = 0.24, F = 10.54, p =
0.001).
There was a significant positive correlation between spine number and stem
diameter (r = 0.21, F = 8.2, p = 0.005). There was a significant positive correlation
between spine number and leaf length (r = 0.17, F = 5.2, p = 0.024). There was a
significant positive correlation between spine number and above-ground biomass (r =
0.54, F = 74.8, p < 0.001). There was a significant positive correlation between spine
number and below ground biomass (r = 0.24, F = 10.9, p = 0.001), and between spine
number and plant height (r = 0.44, F = 44.07, p < 0.001).
There was no significant correlation between tannin concentration and plant
height (r = 0.1, F = 1.48, p < 0.226) as well as between tannin concentration and stem
diameter (r = 0.05, F = 0.5, p = 0.46). However, there was a significant negative
correlation between leaf length and tannin concentration (r = -0.23, F = 9.00, p = 0.003).
72

Chapter 3
Tannin concentration was weakly positively correlated with above-ground biomass (r =
0.16, F = 4.3, p = 0.04). There was a significant positive correlation between tannin
concentration and below-ground biomass (r = 0.32, F = 18.44, p < 0.001). There was no
correlation between tannin concentration and spine number (r = 0.02, F = 0.04, p = 0.84).
Genotypic by environment interactions among populations
Reaction norms of populations for a number of traits cross. These results suggest
that there are significant genotype-by-environment interactions for these traits (Stearns,
1992; Schlichting and Pigliucci, 1998). There was a significant population*water
interaction effect on spine number (F = 6.10, p = 0.015), spine length (F = 7.87, p =
0.006) and above-ground biomass (F = 4.94, p < 0.028) (Table 2). The response with
regard to spine number for both populations was not significant (Figure 1).
High Low
Watering
1.66
1.72
1.78
1.84
log(
Spi
ne n
umbe
r)
Leeu Gamka Richards Bay
Figure 1: Interaction between populations and water levels for spine number.
73
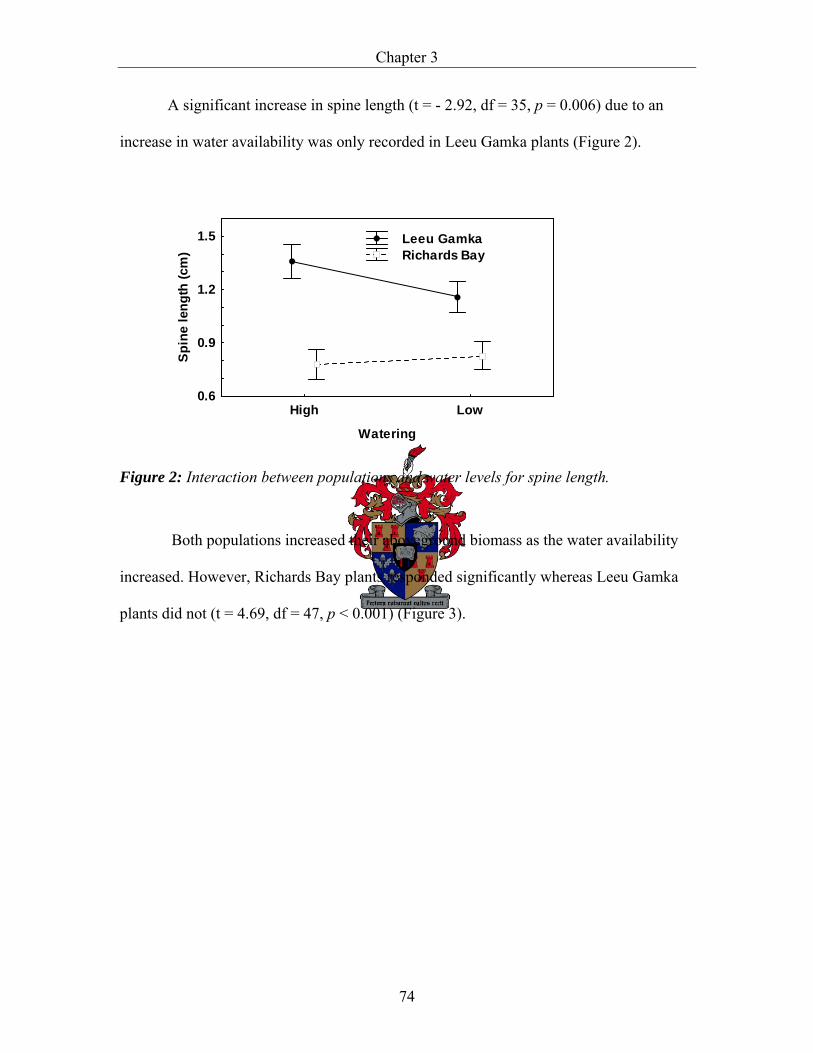
Chapter 3
A significant increase in spine length (t = - 2.92, df = 35, p = 0.006) due to an
increase in water availability was only recorded in Leeu Gamka plants (Figure 2).
High Low
Watering
0.6
0.9
1.2
1.5
Spin
e le
ngth
(cm
)
Leeu Gamka Richards Bay
Figure 2: Interaction between populations and water levels for spine length.
Both populations increased their aboveground biomass as the water availability
increased. However, Richards Bay plants responded significantly whereas Leeu Gamka
plants did not (t = 4.69, df = 47, p < 0.001) (Figure 3).
74

Chapter 3
High LowWatering
-0.1
0.0
0.1
0.2
0.3
0.4
Log
(Abo
vebi
omas
s, g
) Richards Bay Leeu Gamka
Figure 3: Interaction between populations and water levels for aboveground biomass.
There was a population* clipping interaction effect on tannin concentration (F =
4.29, p = 0.04). Leeu Gamka had higher tannin concentrations in the control than when
clipped whereas Richards Bay had slightly higher tannin concentrations when clipped
than in the control (Figure 4). However, there was no significant difference between
treatments in both populations (this can be interpreted as the range of plasticity being
narrow) as indicated by a t test (Richards Bay population: t = 1.12, df = 35, p = 0.27;
Leeu Gamka: t = 1.46, df = 34, p = 0.15).
75

Chapter 3
Clipping Control
Treatments
4
10
16
22
Asin
(Tan
nin,
%Q
E)
Leeu Gamka Richards Bay
Figure 4: Interaction between populations and clipping for tannin concentration.
There was no clipping*water interaction effect on either morphological traits or
tannin concentration. However, there was a significant population*clipping*water
interaction effect on stem diameter (F = 4.38, p = 0.038) (Figure 5), and spine number (F
= 5.01, p = 0.027) (Figure 6). However, the interaction was stronger with a decrease in
water availability in both traits (Figure 5 and Figure 6). Leeu Gamka plants increased
stem diameter when clipped when water availability was high but decreased stem
diameter when clipped under low water availability. In contrast, Richards Bay plants
increased stem diameter with clipping under low and high water availability (Figure 5).
There were no significant differences between treatments in both populations (p > 0.05),
thus reflecting the narrow range of plasticity in populations for this trait. Neither
population increased spine number when clipped under conditions of high water
availability. However, under low water availability, the Richards Bay population
increased its investment in spine number while the Leeu Gamka population decreased
76

Chapter 3
spine number, although only the change in the Leeu Gamka population was significant (t
= -3.14, p = 0.005).
High watering
Clipping Control0.25
0.40
0.55
Stem
dia
met
er, c
m
Low watering
Clipping Control
Leeu Gamka Richards Bay
Figure 5: Interaction between populations, clipping and water levels for stem diameter.
High watering
Clipping Control1.55
1.65
1.75
1.85
log(
Spin
e nu
mbe
r)
Low watering
Clipping Control
Leeu Gamka Richards Bay
Figure 6: Interaction between populations, clipping and water levels for spine number.
77

Chapter 3
Discussion
The overall results suggest that the populations investigated are phenotypically
plastic. Individuals of the two populations differed greatly in their range of plastic
responses to treatments. Richards Bay plants invested more in plant height and leaf
length whereas Leeu Gamka plants invested more in stem diameter, spine length, below-
ground biomass and tannin concentration. These results are consistent with our
predictions. Archibald and Bond (2003) found similar results (for aboveground
parameters, excluding tannin which they did not measure) when working with wild
populations of A. karroo from arid shrubland and forest. Arid trees invested more in
vertical growth (i.e. plant height), had longer spines and greater stem diameter than forest
trees. It is generally assumed that plants adapted to resource-rich environments should
invest more in growth and plants adapted to resource-poor environments should invest
more in defence (Coley et al., 1985). The relationships found among these traits in A.
karroo are consistent with these strategies of investments. There were trade-offs between
leaf length and spine length, as well as between leaf length and tannin concentration.
However, most other traits were positively correlated, contra the resource availability
hypothesis. Water availability had an effect on two traits, viz. stem diameter and above-
ground biomass. Both traits increased as the water level increased. Contrary to the
findings of Shrestha et al. (2002) that an increase in level of water increased tannin
production in Acacia raddiana, there was no significant water effect on tannin
concentration. In our study, there was a significant clipping effect on plant height;
herbivory significantly decreased plant height.
78

Chapter 3
A significant population*water interaction indicated that an increase in water
availability was related to an increase of performance or investment, indicating that
populations have pure strategies. Richards Bay plants increased aboveground biomass but
not spine length whereas Leeu Gamka plants increased spine length but not aboveground
biomass in response to an increase in environmental condition (as indexed by water
availability); as a result, forest plants have a growth strategy and desert a defence
strategy.
There was a significant interaction between clipping and populations for tannin
concentration. Clipping increased tannin concentration in Richards Bay plants compared
to the control treatment, while it resulted in a decrease in tannin concentration in Leeu
Gamka plants with regard to the control treatment. Note that, even though there was a
decrease in tannin concentration in Leeu Gamka plants, the overall tannin concentration
was still higher than in Richards Bay plants (Figure 4).
The interaction between population*clipping*water for stem diameter as well as
for spine number was more pronounced with a decrease in water availability than for
stem diameter. In both populations, there was an increase in investment in spine number
after being exposed to clipping. Unlike Leeu Gamka plants, Richards Bay plants
increased their stem diameter and spine number after being clipped in the low water
treatment. This suggests that the regrowth of lost parts in Leeu Gamka plants is more
costly than in Richards Bay plants. Evidence for such a response has been demonstrated
in some woody species (e.g. Osteospermum sinuatum, Van der Heyden, 1992; Acacia
tortilis, du Toit et al., 1990) that responded to simulated browsing by rapid regrowth,
while other species had limited regrowth (e.g. Pteronia pallens, Stock et al., 1993; Acacia
79

Chapter 3
nigrescens, du Toit et al., 1990). This is also in accordance with Coley et al. (1985)’s
findings on resources availability of plants concerning fast-growing and slow-growing
plants. Coley and her colleagues suggested that slow-growing plants occur in poor
environments. Thus; the loss of leaves and twigs is associated with a loss of energy and
their replacement is costly. To remedy this situation, these plants tend to reduce the
turnover rate of such parts because it is advantageous in terms of energy wasted. In
contrast, fast-growing plants occurring in rich environments tend to maximize the rapid
turnover of leaves because younger leaves allow higher photosynthetic rates.
The significant interactions between populations and water, and between
populations, clipping and water indicate that there were genotype by environment
interactions. Consequently, local adaptation is likely for these traits. Leeu Gamka plants
showed local adaptation with regard to spine number, spine length and above-ground
biomass with an increase in water availability. They performed better in a richer
environment. Furthermore, performance in both environments for spine number and
above-ground biomass were not significantly different although performance differed
among environments for spine length. Our results agree with the results of Milton (1991),
who found that moisture might mediate selection for spinescence in moist, nutrient-rich
habitats in arid areas because mammalian herbivores concentrate there and plants are
consequently heavily broken, trampled and browsed. Richards Bay plants showed local
adaptation of the same traits. However, they performed well in the rich environment
(except for spine length and spine number where there were no significant differences).
Both populations showed local adaptation in terms of tannin concentration under the
clipping treatment. Leeu Gamka plants produced less tannin after being browsed than
80

Chapter 3
when browsing did not occur, while Richards Bay plants produced relatively more tannin
after browsing by herbivores. Finally, local adaptation was observed for stem diameter
and spine number in a three way interaction (populations*clipping *water). Leeu Gamka
plants performed better in a poor environment in terms of spine number with the absence
of herbivores than when they were present. While Richards Bay plants performed better
with the presence of herbivores than when they were absent. However, performances for
both populations were similar in a rich environment regardless of the treatment. Similar
performances were also observed with regard to stem diameter.
Of the two populations investigated, the slow-growing one (Leeu Gamka) was
phenotypically more plastic with regard to defence-related traits (longer spines, more
tannin) while the fast-growing one (Richards Bay) was phenotypically more plastic
regarding growth-related traits (taller, longer leaves). Furthermore Leeu Gamka plants
did not exhibit a large amount of variability in their phenotypes (see coefficient of
variation, CV %) as would be expected from plant population such as this from a highly
variable environment (e.g. Hedrick et al., 1976; Hedrick, 1986). However, this
observation is in accordance with the results of a previous study on molecular genetic
variation (See Chapter 2), which showed a lower genetic diversity in Leeu Gamka
population than in the Richards Bay population.
Acknowledgements
We would like to thank Dr Theron, Khanysile Mbatha, Donald Midocko Iponga
for technical assistance and all those who provided us with valuable suggestions and
81

Chapter 3
comments. This study was funded by National Research Foundation (NRF) South Africa
and the Gabonese Government.
References
Acocks, J.P.H., 1988. Veld types of South Africa. 3rd Edition. Mem. Bot. Surv. S. Afr.
57 Botanical Research Institute, South Africa. pp. 146.
Archibald, S. Bond, W. J., 2003. Growing tall vs. growing wide: tree architecture and
allometry of A. karroo in forest, savanna, and arid environments. Oikos 102, 3-14.
Barnes, R.D., Filer, D.L., Milton S.J., 1996. Acacia karroo: monograph and annotated
bibliography. Trop. For. Pap. 32. Oxford Forestry Institute, UK.
Bloom, A.J., Chapin, F.S. III, Mooney, H.A., 1985. Resource limitation in plants- an
economic analogy. Annu. Rev. Ecol. Syst. 16, 363-392.
Boyes, L.J., 2004. Regeneration failure and the Acacia karroo successional pathway in
coastal dune forest in KwaZulu-Natal. Unpubl. BSc (Hons) thesis, University of
KwaZulu-Natal, Pietermaritzburg.
Bradshaw, A.D., 1984. Ecological significance of genetic variation between populations.
In: Dirzo, R. and Sarukhan, J. (Eds), Perspectives in Plant Population Ecology.
Sinauer Associates, Sunderland, MA. pp. 213-228.
Brain, P., 1985. Leaf peroxidase types in Acacia karroo. Geographical distribution and
influence of the environment. S. Afr. J. Bot. 52, 47-52.
Brain, P., 1989. Genetic races in a ring species of Acacia karroo. S. Afr. Sci. 85, 181-
185.
82

Chapter 3
Brain, P., Harris, S.A., Barnes, R.D., 1996. Leaf Peroxidase Types in Acacia karroo
Hayne (Acacieae, Leguminosae): a range-wide study. Silvae Genet. 46, 88-94.
Briggs, M.A., Schultz, J.C., 1990. Chemical defence production in Lotus corniculatus. II.
Trade-offs among growth, reproduction, and defence. Oecologia 83, 32-37.
Bryant, J.P., Kuropat, P., Cooper, S.M., Frisby, K., Owen-Smith, N., 1989. Resource
availability hypothesis of plant antiherbivore defence tested in a South Africa
savanna ecosystem. Nature 340, 227-229.
Campbell, B.D., Grime, J.P., 1992. An experimental test of plant strategy theory. Ecology
73, 15-29.
Coley, P.D., Bryant, J.P. and Chapin, F.S. III, 1985. Resource availability hypothesis and
plant antiherbivore defence. Science 230, 895-899.
Cooper, S.M., Owen-Smith, N., 1985. Condensed tannins deter feeding by browsing
ungulates in a South African savanna. Oecologia 67, 142-146.
Cordell, S., Goldstein, G., Mueller-Dombois, D., Webb, D., Vitousek, P.M., 1998.
Physiological and morphological variation in Metrosideros polymorpha, a
dominant Hawaiian tree species, along an altitudinal gradient: the role of
phenotypic plasticity. Oecologia 113, 188-196.
Counts, R.L., 1993. Phenotypic plasticity and genetic variability in Zizania spp. along a
latitudinal gradient. Can. J. Bot. 71, 145-154.
Du Toit, J.T., Bryant, J.P., Frisby, K., 1990. Regrowth and palatability of Acacia shoots
following pruning by afican savanna browsers. Ecology 71, 149-154.
Goldsmith, B., Carter, D.T., 1981. The indigenous timbers of Zimbabwe. Forest
Commission, Zimbabwe. Res. Bull. 9, 9.
83

Chapter 3
Gowda, J.H., 1996. Plant defences: Influence on plant –animal interactions in eastern
Africa. PhD thesis. Swedish University of Agricultural Sciences, Umea.
Gowda, J.H., 1997. Physical and chemical response of juvenile Acacia tortilis trees to
browsing. Experimental evidence. Funct. Ecol. 11, 106-111.
Grime, J.P, Mackey, J.M.L., 2002. Role of plasticity in resource capture by plants. Evol.
Ecol. 16, 299-307.
Hagerman, A.E., 1995. Tannin analysis. Unpublished laboratory manual, Miami
University, Oxford, Ohio. pp 66.
Hedrick, P.W., Ginevan, M.E., Ewing, E.P., 1976. Genetic polymorphism in
heterogeneous environments. Annu. Rev. Ecol. Syst. 7, 1-32.
Hedrick, P.W., 1986. Genetic polymorphism in heterogeneous environments: a decade
later. Annu. Rev. Ecol. Syst. 17, 535-566.
Jasienski, M., Francisco, J.A., Bazzaz, F.A., 1996. Phenotypic plasticity and similarity of
DNA among genotypes of an annual plant. Heredity 78, 176-181.
Lehtilä, K., Boalt, E., 2004. The use and usefulness of artificial herbivory in plant-
herbivore studies. Ecol. Stud. 173, 257-275
Milewski, A.V., Young, T.P., Madden, D., 1991. Thorns as induced defences:
experimental evidence. Oecologia 86, 70-75.
Milton, S.J., 1991. Plant spinescence in arid southern Africa: does moisture mediate
selection by mammals? Oecologia 87, 279-287.
Oballa, P.O., 1993. Genetic variation within Acacia karroo Hayne. Unpubl. D. Phil.
Oxford University. Oxford England.
84

Chapter 3
Palo, R.T., Gowda, J., Hogberg, P., 1993. Species height and root symbiosis, two factors
influencing antiherbivore defence of woody plants in East African savanna.
Oecologia 93, 322-326.
Pellew, R.A., 1983. The impacts of elephant, giraffe and fire upon the Acacia tortilis
woodlands of the Serengeti. Afr. J. Ecol. 21, 41-74.
Pellew, R.A., 1984. The feeding ecology of a selective browser, the giraffe (Giraffa
camelopardalis tippelskirchi). J. Zool. London 202, 57-81.
Rohner, C., Ward, D., 1997. Chemical and mechanical defence against herbivory in two
sympatric species of desert Acacia. J. Veg. Sci. 8, 717-726.
Ross, J.H., 1975. Notes on African Acacia species. Bothalia 11, 443-447.
Ross, J.H., 1979. A conspectus of the African Acacia species. Mem. Bot. Surv. S. Afr.
44, 93-95.
Schlichting, C.D., Levin, D.A., 1984. Phenotypic plasticity of annual Phlox: tests of some
hypotheses. Am. J. Bot. 71, 252-260.
Schlichting, C.D., Pigliucci, M., 1998. Phenotypic evolution, a reaction morm
perspective. Sinauer, Sunderland, MA.
Scholes, R.J., Walker, B.H., 1993. An African Savanna: Synthesis of the Nylsvley Study.
Cambridge University Press, Cambridge, UK.
Shrestha, M.K., Golan-Goldhirsh, A., Ward, D., 2002. Population genetic structure in
isolated populations of Acacia raddiana investigated by random amplified
polymorphic DNA (RAPD) markers. Biol. Conserv. 108, 119-127.
StatSoft, Inc., 2004. STATISTICA (data analysis software system), version 7.
www.statsoft.com.
85
Chapter 3
Stearns, S.C., 1992. The evolution of life histories. Cambridge University Press,
Cambridge, UK.
Stock, W.D., Le Roux, D., Van der Heyden, F., 1993. Regrowth and tannin production in
woody and succulent Karoo shrubs in response to simulated browsing. Oecologia
96, 562-568.
Sultan, S.E., 1987. Evolutionary implications of phenotypic plasticity in plants. Evol.
Biol. 21, 127-178.
Taylor, D.R., Aarssen, L.W., 1988. An interpretation of phenotypic plasticity in
Agropyron repens (Graminae). Am. J. Bot. 75, 401-413.
Tilman, D., 1988. Plant strategies and the dynamics and structure of plant communities.
Princeton University Press, Princeton, NJ.
Van der Heyden, F., 1992. Effects of defoliation on regrowth and carbon budgets three
semi-arid karoo shrubs. Ph.D. thesis, University of Cape Town.
Via, S., Gomulkiewicz, R., De Jong, G., Scheiner, S.M., Schlichting, C.D., Van
Tienderen, P., 1995. Adaptive phenotypic plasticity: consensus and controversy.
Trends Ecol. Evol. 10, 212-217.
Ward, D., Young, T.P., 2002. Effects of large mammalian herbivores and ant symbionts
on condensed tannins of Acacia drepanolobium in Kenya. J. Chem. Ecol. 28, 921-
937.
Wrangham, R.W., Waterman, P.G., 1981. Feeding behaviour of vervet monkeys on
Acacia tortilis and Acacia xanthophloea: With special reference to reproductive
strategies and tannin production. J. Anim. Ecol. 50, 715-731.
86
Chapter 3
Young, T.P., 1987. An increased thorn length in Acacia drepanolobium- an induced
response to browsing. Oecologia 71, 434-438.
87

Chapter 4
Conclusions
Previous studies investigating phenotypic plasticity and population differentiation
in Acacia karroo have approached the topic from a variety of different angles (e.g. Brain
1986, 1989, Archibald and Bond 2003). We acknowledge that these approaches will
endow the literature with some substantiation of adaptive phenotypic plasticity in local
populations, although it remains difficult to gauge the precise effect of each factor, owing
to a large number of interacting variables that typify each environment. Our perceptions
of the nature of adaptive phenotypic plasticity in populations experiencing a variety of
selection pressures dictates that due consideration should be given to the age of the
individuals in addition to the environment under consideration. That is, inferences from
field observations are limited in their ability to discern the adaptive nature of phenotypic
plasticity (particularly in long-lived trees - cf. Archibald and Bond 2003) and require
controlled studies such as we have done (i.e. growing seeds of different provenance under
identical conditions or by reciprocal transplanting). The current study is also innovative
because it remedies the shortcomings of earlier studies of genetic differentiation (Brain,
1986; 1989) that merely considered a single protein. Additionally, it is the first attempt to
combine studies of phenotypic differentiation and genetic variation. Thus, this study
bridges the gaps in research on population differentiation based on phenotypic and
genetic variation by not only assessing differentiation at a large number of allozyme loci
but also by combining molecular genetic research with a common-garden experiment to
provide a better understanding of the phenomenon of adaptive phenotypic plasticity
88
Chapter 4
under controlled conditions. We do not claim to have covered all possible loopholes in
the study of phenotypic plasticity, but have certainly opened the door towards a fuller
understanding of this fascinating natural laboratory of the evolution of phenotypic
plasticity.
Our conclusions can be summarized according to our two main questions:
1) Do both populations differ genetically?
The analysis of the genetic variation within and between populations, at the
allozyme level (proteins), indicated that the two study populations are genetically highly
differentiated. The high genetic diversity uncovered falls in the range of populations on
the verge of moving towards species or variant level (e.g. Gottlieb, 1977). This is an
outstanding result in that it supports Swartz’s (1982) findings based on 19 morphological
characters, affirming that the Richards Bay population is a variety of A. karroo, although
our results do not show the complete differentiation of these extreme populations that
might be sufficient to raise the populations to species status (i.e. contra Swartz in Coates
Palgrave, 2002). We concluded that the degree of differentiation between these
populations is for the most part due to their geographic isolation as well as adaptation to
their local environments.
An argument has been put forward that maintains that allozyme markers detect
only 30% of genetic variation (Van Straalen and Timmermans, 2002). Our study used a
number of loci within the range usually considered to be sufficient to show significant
differentiation should it exist (12-20 loci; reviewed by Hamrick and Godt, 1989).
Consequently, we are confident that our results reliably represent significant
89

Chapter 4
differentiation of these populations. Future studies using more powerful techniques, and
with more populations, could determine more precisely the degree of population
differentiation and could examine the specific status of these populations. Nonetheless,
our results provide considerable evidence that the populations of A. karroo represent a
fascinating opportunity to examine evolution by natural selection in progress.
2) Do populations differ in phenotypic plasticity in response to experimental
manipulation?
The controlled experiments in the greenhouse demonstrated that the differences in
strategies of investments observed in the wild between the two populations did not
change under altered conditions. This implies that these investment strategies are
genetically based. The populations we studied have pure strategies of growth and
defence. That is, when environmental quality was improved (i.e. when water was added),
Richards Bay plants (mesic subtropical forest environment) increased investments in
growth (as indexed by aboveground biomass) and not defence (spine length) while Leeu
Gamka plants (arid environment) did the reverse i.e. they increased investments in
defence (spine length) and not growth (aboveground biomass). This reflects the broad-
spectrum trend of investment of forest and desert plants (in growth and defence,
respectively) as indicated by the resource availability hypothesis (Coley et al., 1985),
although that hypothesis specifically predicts a trade-off between growth and defence
(which we did not find). We also found significant interactions between populations and
environments in some traits, which indicate genetic differentiation in plastic responses
90
Chapter 4
between populations and therefore that phenotypic plasticity in the two A. karroo
populations is locally adaptive and not merely due to environmental differences.
Acacia karroo is not a species threatened by extinction and is unlikely to
disappear, unlike numerous other plant species that are overexploited. A causative factor
that frequently leads to the extermination of species is the loss of or very low genetic
diversity, which lessens the propensity to evolve and respond to environmental change
(e.g. Pigliucci and Schlichting, 1997). Our results show relatively high levels of genetic
diversity in A. karroo, leading us to conclude that there is no urgent need for the
conservation and genetic preservation of these populations. On the other hand, if there
was a need to set up a management plan, the results discussed here indicate that each
population should be conserved separately because they are genetically differentiated and
show evidence of significant genotype-by-environment interactions (i.e. are locally
adapted). Mixing populations would result in the loss of genotypes that are well adapted
to specific environments.
91

Chapter 4
References
Archibald, S. Bond, W. J., 2003. Growing tall vs. growing wide: tree architecture and
allometry of A. karroo in forest, savanna, and arid environments. Oikos 102, 3-14.
Brain, P., 1985. Leaf peroxidase types in Acacia karroo. Geographical distribution and
influence of the environment. S. Afr. J. Bot. 52, 47-52.
Brain, P., 1989. Genetic races in a ring species of Acacia karroo. S. Afr. Sci. 85, 181-
185.
Coates-Palgrave, K., 2002. Trees of southern Africa. 3rd Edition, Struik, Cape Town. pp.
19, 286.
Coley, P.D., Bryant, J.P. and Chapin, F.S. III, 1985. Resource availability hypothesis and
plant antiherbivore defence. Science 230, 895-899.
Gottlieb, L. DL, 1977. electrophoretic evidence and plant systematics. Ann. Missouri
Bot. Gard. 64, 161-180.
Hamrick, J.L., Godt, M.J.W., 1989. Allozyme diversity in plant species. In: Plant
population, breeding, and genetic resources. Brown, A.H.D., Clegg, M.T., Kahler,
A.L., Weir, B.S. (Eds). Sinauer Associates, Sunderland, Massachusetts, pp. 43-63.
Pigliucci, M., Schlichting, C.D., 1997. On the limits of quantitative genetics for the study
of phenotypic evolution. Acta Biotheoret. 45, 143-160.
Swartz, P.P., 1982. A numerical-taxonomical evaluation of the taxon Acacia karroo
Hayne in southern Africa. Unpl. MSc thesis, University of Pretoria South Africa.
[‘n Numeries-taksonomiese evaluering van die takson Acacia karroo Hayne in
suidelike Afrika.]
92

Chapter 4
Van Straalen, N.M., Timmermans, M.J.T.N., 2002. Genetic variation in toxicant stressed
populations: An evaluation of the "genetic erosion" hypothesis. Hum. Ecol. Risk
Assess. 8, 983-1002.
93