Embed Size (px)
Citation preview
I/e Journal of'Agriculture, Volume 26. 2013
ASSESSMENT OF POVERTY STATUS AMONG COCOA FARMERS IN OSUN STATE OF NIGERIA
OGUNTADE, A. E. Department ofAgricultura1 Economics and Extension,
Federal University of Technology, l? M.B 704, Akure, Nigeria. E-mail: oguntadeade@yahoo. co. uk
ABSTRACT
Tl~ere lzas been an increase in the level of poverty in Nigeria over the past years and the people living in rzrral arpeas wlzo are mostly engaged in agriculture are more aflected This studji examinedpoverty status ofcocoa farming households in Osun State, Southwest Nigeria as well as examined some of the fai-m and.farmer characteristics that afect pover-ty among the farmers. Data were collected from 1200 cocoa .farming households in four cocoa growing Local Government Areas o f the state in 2009. The data were ar~alysed using the FGT poverty indices and logistics r.egre.sslon. The interiiational p o v e r ~ line and double the ttational nlii~inllrnt wage in Nigeria were used as pover-01 thre.rho1d.r jot- determining poverty status. FGT I-erzrlts sho~v that 82% of tlie cocoa farntets were lit~ing belotti the international y o v e r ~ lirle ~tlhile 43% of them were earning /CS.F tl~an the llatio~ial nzir~in~zrni wage. Logistic ~.egl-es.~ion 1.esu1t.s show that the iiumber oj conlpllnterttar~~ crops cultivafed by the.farn?er:r itlcr.cased tlie log likelihood o f being poor ~vhile liter-crcv stcrtlrs crrid familj? size i-educed it. With the curl-ent level of poverty in the cocoa ecSononlv, rt inn?; he difficult to clttt-act yozriig
people with alternative sources of employment into cocoa fai*ming. Increasing literacy level among cocou farmers, specialisation in a few conzplimentary of cr-ops and the introciuction of labour saving technologies that will reduce tlze extent of dependence on family labour will help to reduce poverty among cocoa farmers.
Key words: Cocoa farmers, Socio-economics, Poverty status, Logistic regression, Nigeria
INTRODUCTION Cocoa (Theobroma cacao) is the principal source of income for millions offarm workers in the cocoa producing states of Nigeria. It is a source of employment generation, a significant contr ibutor to socia l infrastructural development, a source of raw materials for Agro-Industries (Salami, 2000), a foreign exchange earner and a source of revenue to cocoa producing states in particular and Nigeria in general (Folayan, 2005). Nigeria accounts for about 6 percent of the world cocoa production and it is the fifth largest cocoa producer (ICCO, 2008). The quantity of cocoa beans exported from Nigeria between 1976177 and 200212003
Ife Journal ofAgriculfure. Volume 26, 2013
was an average of 166,813 tonnes annually (Folayan, 2005). For the year 2007, cocoa beans export was 174,900 tonnes. At an average price of US$ 1,630 per tonne, the value of the cocoa export in 2008 was US$ 285.1 million (FAOSTAT, 20 10).
Cocoa Farmers in Nigeria were considered more well-off in the 1960s than they did in the 1990s. The fortunes of cocoa farming and farmers have declined as a result of the general decline in the socio-economic conditions in the country (Onyeiwu et.al., 2009). There has been an increase in the level of poverty in Nigeria over the past 25 years; 28.1 % in 1980 and 54.4% in 2008 (NPC, 2004; NBS, 2008).
The reduction in the proportion of people whose income is less than a US$ 1.00 day by halve between 1990 and 20 15 is one of the targets set as the millennium development goals. To monitor the progress towards the achievement of this target, there is a need to measure the level of poverty in the nation as well as know the causes of poverty in the different segments of the society. This paper uses the Foster, Greer and Thorbecke (FGT) indices to assess the poverty status among cocoa farmers in Osun State, Nigeria. It also examines some of the farm and farmer characteristics that affect poverty among the farmers.
CONCEPTUAL FRAME WORK The Nigerian cocoa farmers are mostly small- scale farmers who grow cocoa as a cash crop and some arable crops for household consumption. The farmers sometimes offer the small excess of arable crops to the market for additional cash income. The cocoa farm is a long-term asset and over 60% of cocoa farmers' cash income is derived from cocoa. If the term of trade turns against cocoa farming, the farmer finds it difficult to cut down his cocoa trees and switch to another crop in the short run because of the hope that the price may improve in subsequent years (Olayemi and Oni, 1972).
In absolute Naira terms, producer price of cocoa has increased significantly since the abolition of the Cocoa Board and the devaluation of the Naira in 1986 (Folayan, 2005). In relative terms, the price of cocoa has fallen significantly since the collapse of the cocoa agreements and the decline in international cocoa prices (Konnig & Jongeneel, 2006). The devaluation of the Naira must have masked the decline in cocoa farmers' real incomes. Post devaluation, Nigerian cocoa farmers have experienced a deterioration in their welfare status (Onyeiwu et.al., 2009).
Determination of poverty line The International Poverty Line (IPL) set by the World Bank has been used as the standard for assessing poverty. The IPL combined with household survey of income or consumption has been used in determining and comparing the level of poverty across countries. Measures of poverty based on the IPL and a number of others are used to give a picture of the extent of poverty at national level and are often aggregated internationally (Maxwell, 1999). Over the last few years, there have been some critics of the use of the World Bank standard of one US Dollar per day for absolute poverty and two US Dollar per day for moderate poverty. It has been argued that an appropriate measure of poverty should reflect the most basic requirements of human beings and have the same meaning everywhere and at every point in time; and that the use of the IPL as done by the World Bank does not meet these criteria (Pogge & Sanjay, 2003). In some instances, arbitrary cut-off point such as one half of the median income is used as the poverty line (Lanjouw, 2001; Chen & Ravallion, 2004). It has also been argued that considerations should be given to other measures of poverty such as deprivations in health, educational attainment and enjoyment of citizenship rights, life expectancy at birth but that these measures cannot easily be meaningfully combined with income to derive a single indicator (Srinivasan, 2001). Kakwani (2007) demonstrated that it is also possible to
Ife Journal ofAgricul~ure, Volume 26, 2013
construct international POL crty threshold based on the food requirements to ensure adequate calorie intake for thc world's poorest using the caloric norms developed by the Food and Agriculture Organization (FAO).
Overall. it could be _said that po\.erty is a complex issue that defiles a specific definition. Various studies (Rozcllc et al., 1997: Okunmadewa, 1999; Aigbokhan, 2000) have shown that the common practice is to view poverty either in absolute or in relative term depending on how it is being measured. Poverty is more easily recognized than defined (Aboyade, 1975). Poverty is viewed in absolute terms when there is low calorie intake, or poor housing condition, or inadequate health facilities, and poor quality of educational facilities, low life expectancy, high infant mortality, low income, unemployment and under-employment (Ravallion, 1998; Oladunni, 1999). Also absolute poverty can be related to condition of life degraded by diseases, illiteracy, malnutrition, deprivation and squalor (Ravallion and Datt, 2002). Relative poverty exists when the household has a per capita income of less than one-third of the average per capita income that exists in that domain or country (Oladunni, 1999). For this study, two poverty thresholds were set, namely; the World Bank IPL and double the current national minimum wage of N7,500 per month for the purpose of comparative analysis. The assumption here is that a couple have the opportunity to either work on the farm or seek paid employment and earn, at least, the minimum wage. This is the justification for using twice the minimum wage as the poverty line.
The assessment of poverty can proceed through the use of incomes or consumption expenditure surveys. Generally, it is believed that respondents in income surveys tend to under- estimate incomes, hence the preference for the use of consumption expenditure (Meyer & Sullivan, 2003). In a society with low literacy
level, the information provided on either incomes or expenditures will be through memory recall and is largely unreliable. Thus whenever it is possible to verify information on incomes, the use of incomes, which largely determines expenditure, should be preferable. The cocoa farmers covered in this study dispose off their cocoa through their cooperative societies hence there is fairly reliable source of information on income from cocoa which account for the bulk of their incomes. For this study therefore, the assessment of poverty was carried out via incomes estimated from farm output and farm gate price data.
METHODOLOGY
Area of study This study was carried out in Osun State, Nigeria. Osun State is located approximately between longitude 30 56'and 50 47' East and between latitude 70 1 1 ' and 80 2 1 ' North. The State has 15 Local Government Areas (LGAs) and is one of the major cocoa producing states in Nigeria. The study covered four of the LGAs in the state. These are Atakumosa West, Ife East, Ife North and Ife South which are the major cocoa growing LGAs in the state. Osun State is the second highest producer of cocoa in Southwest Nigeria. The livelihood of most of the tree crop farmers in the cocoa growing areas of the state is dependent on cocoa revenues which accounts for about 68% of total revenues (Gockwoski and Oduwole, 200 1).
Sampling procedure and method of data collection The study used multistage sampling technique. In thc first stage, the four LGAs that are major producers of cocoa were purposively selected. A total of 47 primary cocoa cooperative marketing societies were selected randomly across the local government areas from a list of cooperative societies obtained from Osun State Department of Cooperatives and all cocoa farmer members of the selected primary societies were targeted for questionnaire

(/e Journal of Agriculture. Volume 26, 2013
administration. A total 1202 cocoa farmers were covered by the survey. The information requested in the questionnaire include name of village, local government area, name of farmer, sex, family size, age of farmer, cocoa and other crops production data, literacy, among others. The data collected were for 2008 production season. The questionnaire was administered in 2009.
Analytical Framework Measures of poverty There are a number of poverty measures. These include the headcount index, the Sen- Shorrocks-Thon index and FGT index. The FGT index has the advantage of measuring Headcount, Poverty Gap, Squared Poverty Gap or Severity indices within the same analytical framework. These poverty measures are discussed as follows:
Headcount Index The index measures the incidence of poverty. It is the proportion of the population whose standard of living is less than the poverty line to the total number of individuals or households (World Bank, 1990). This could be represented as:
.............. (equation 1)
Where N =total population I(.) = an indicator function that takes on a value of 1 (poor); if (yi < z) is true, and otherwise, 0 (non-poor) yi = income or expenditure z = poverty line. Np = number of individuals living below the
poverty line Po = headcount index It is however important to note that the headcount cannot account for the intensity of poverty. In other words, it cannot capture the extent to which individual income (or expenditure) falls below the poverty line.
The Sen-Shorrocks- Thon index This is a modification of the Sen index and it takes into account the distribution of income among the poor. It is the product of the headcount index, the poverty gap index (applied to the poor only), and a term with the Gini coefficient of the poverty gap ratios (i.e. of the Gn's) (Haugton and Khandker, 2009). This index can be expressed as:
..................... equation 2)
Where Po = headcount index; P 1 P = poverty gap index; and GP is the Gini coefficient of the poverty gap ratios.
The Foster, Greer and Thorbecke (FGT) indices According to (Aigbokhan, 2000, Haugton and Khandker, 2009) the FGT can be expressed as
Where: n = the sample size, q = number of households with income below poverty line, z =
poverty line (to be determined based on pre- specified criteria), Yi = the income of the ith poor household, and a = parameters of the FGT index; which can take three values namely; 0, 1 or 2. This implies that poverty measures can be calculated based on the three values of a. When a is equal to 0, the FGT yields the incidence of poverty or the Head Count Index as.
4 Po = - ........................................ equation 4) N
When a is equal to 1, the FGT yields the poverty gap in the sampled households as:
The poverty gap reflects the intensity of poverty since it measures the total amount of income required to remove the poverty. It however does not take cognizance of the number of people who are below the poverty line.
ffe Journal ~fAgriculture. Volume 26, 2013
When a is equal to 2, the FGT measures the severity of poverty gap. It gives more weights to the poorest ofthe households. It is calculated as:
In this study, the FGT is calculated for each of the three states of a. This index has been widely used to explore the levels of poverty (Aigbokhan, 2000, Haugton and Khandker, 2009)
Determinants of Poverty Generally it is understood that some of the factors that can cause poverty could also be the result of poverty; meaning that the causality in the relat ionship could be in e i ther direction.(Sabir, et.al., 2006, World Bank Institute, 2005) The peculiar characteristic of a geographic location may contribute to poverty among the people living there while the poverty of the people living in a location may contribute to the peculiar characteristic of the location. One of such characteristics is the available socio-economic infrastructure. Similarly, poverty can be the cause of a large household while a large household can cause poverty.
To determine the correlates of poverty in this study, the binary logistic model was used. This is in line with Sabir, et.al., (2006) and Yusuf et.al. (2008). Mathematically, the model is specified as:
Pi= P(Yl = I ) = F(x, P) ..................... equation 7)
Where: P = probability estimate; F =
distribution function; x = vector of explanatory variable and P = set of parameters to be estimated which reflect the effect of the changes in x on the probability.
The response variable in this model is binary. It takes values of one if the household is poor and zero otherwise. Following Greene (2003) and assuming that the cumulative distribution was logistic, a logistic model was employed. The
probability of being poor was estimated by using the logistic probability model given as: Prob (Yi = 1) = exp (X' ip)
1 + exp (X' ip) ........( equation 8)
Where: Prob (Yi = 1) = the probability that farming household falls below the poverty line; X'i = vector of explanatory variable and P = set of parameters to be estimated which reflect the effect ofthe changes in X'i on the probability.
For this study, the definition and description of the variables included in the model are:
Poverty status: This is the dependent variable and is defined as a binary variable which takes the value of one if household income is below the poverty line and zero if otherwise. The values of this variable are determined by those of the independent variables.
The independent variables are: LGA: This variable identifies the geo-political location of the farming household. There are four different LGAs covered by the study. Sex: This variable identifies the gender of the household head. There are female and male- headed households in the sample, measured as a dummy (male, 1 ; female 0). Family size: This variable captures the number of people in the household. Age: The variable captures the age of the household head in years. Literacy: This is a binary variable which takes the value of 1 if household head is literate and 0 if otherwise. Number of complementary crops: This variable captures the number of other crops cultivated by the household.
The geo-political location of the farming household is expected to impact on income and hence poverty level via variations in the productivity of the soil and other climatic factors which affect cocoa yield (Agboola, 1979) as well as through infrastructure which affects farmgate prices (Cook, 2005, Sabir et.

(/e Journal ofAgriculture, I+~l~rne 26, 2013
al., 2006). Generally, locations that have poor road connection and are far from the cities, the farmgate prices are usually lower while inputs costs are higher. For this study, the expectation is that the soil and climatic conditions will be fairly the same across the LGAs but the status of the road network to the farm locations may be different. Thus a positive relationship is hypothesized.
Some of .the cultural operations in cocoa production such as pruning of chupons, spraying and slashing are better performed by men because they are strenuous. Women cocoa farmers may therefore be less capable of performing these operations Also, past studies have shown that poverty is more prevalent in female-headed households (Vecchio and Roy, 1998). A positive relationship is therefore hypothesized for the variable sex in this study.
Literacy and level of education aids adoption of improved farming techniques (Afolabi, 1987; Okunade, 2006) which in turn leads to better yields and higher farm income. Also, literacy and the level of education have been shown to be negatively correlated with poverty (Oxaal, 1997). The a priori expectation therefore is that there will be a negative relationship between the literacy variable and poverty in this study.
Members of the family serve as labour in cocoa production thus facilitating timely execution of cultural operatiom that will ensure good yield and increased income (Amos, 2007; Oluyole and Sanusi, 2009). To this extent, one expects negative relationship between family size and the log livelihood of being poor. On the other, some studies (Yusuf et. al., 2008; Virola and Martinez, 2007; Akande et.al. 2009; Aigbokhan, 2008) have found positive relationship between family size and poverty. For this study, there is no compelling justification to expcct either a positive or negative justification a priori.
Some studies (Ali et. al. 2002; Yusuf et. al.,
2008) have found positive relationship between farmers' age and poverty. For this study, a positive relationship between age and poverty is also expected a priori because some of the critical cultural operations of cocoa farming such as pruning, slashing and spraying cannot be easily carried out by old farmers.
The cultivation of complementary crops along with cocoa could be regarded as a risk mitigating strategy by cocoa farmers such that if cocoa fails the farmer can obtain income from other sources and this is more important to the poorer farmers (Hussein and Nelson, 1998; Schreckenberg et. al., 2006). For this study, it is expected that poorer farmers will diversify into several other crops, thus a positive relationship is hypothesized between the number of complementary crops and poverty.
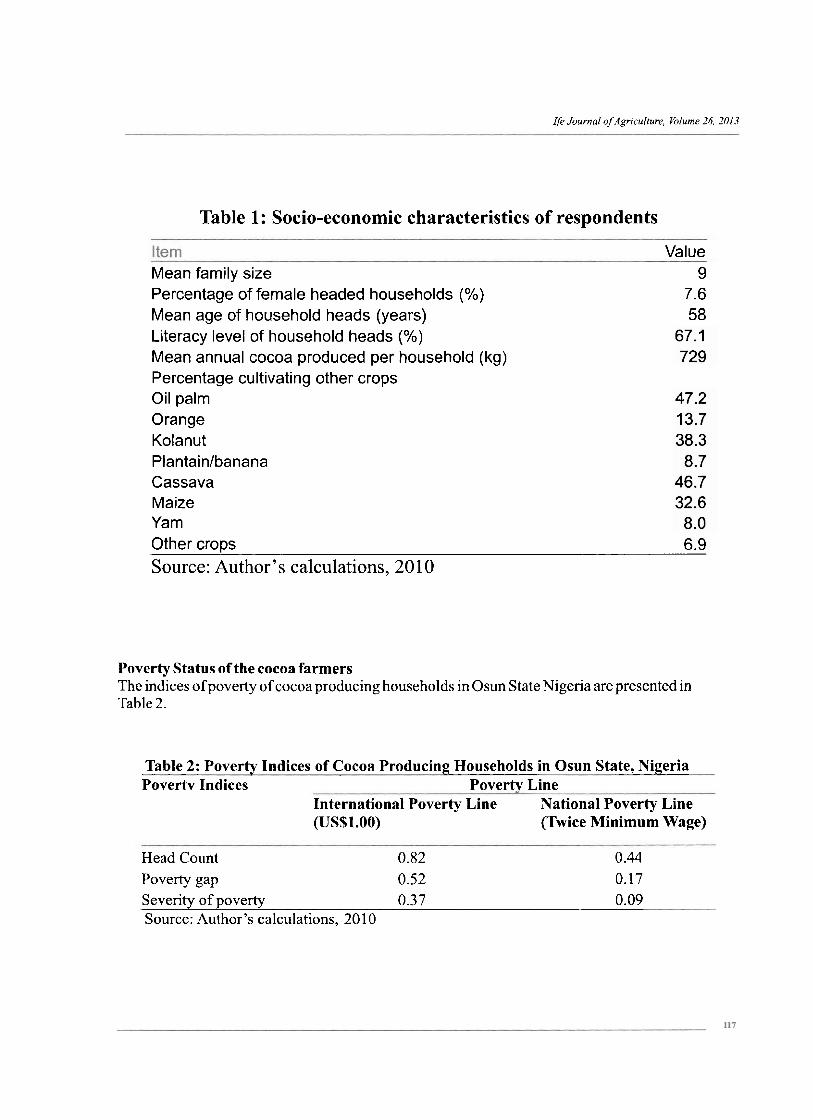
RESULTSAND DISCUSSION Socio-economic characteristics of the cocoa farming households in Osun state, Nigeria The socio-economic characteristics of the sampled cocoa producing households are presented in Table 1 .About 93% of the household heads were male with a mean age of 58 years, while mean family size was 9. One of the major problems being faced by the cocoa economy in Southwest Nigeria is that of ageing cocoa farmers. For instance. over 65% of the cocoa farmers in two of the cocoa producing states of Ekiti and Ondo were found to be above 50 years old (Folayan, 2005). However, there is a growing need to make cocoa farming attractive to the younger labour force for the economy to be renewed; hence, cocoa production must be able to offer incomes comparable to what is obtainable in other sectors of the economy. The mean annual cocoa produced per household was 729 kg. At a producer price of about N350.000 per tonne obtainable at the time of the survey, this translates into a mean annual gross revenue ofN255.150. This revenue figure gives an indication of the le\lel of income the farmers were deriving from cocoa annually. The households also cultivated other tree and food crops such as oil palm, orange, kolanut, plantainbanana, cassava, maize and yam (Table 1).
Ire Journal of'Agriculture, Volume 26. -7013
Table 1: Socio-economic characteristics of respondents
Value Mean family size 9 Percentage of female headed households (%) 7.6 Mean age of household heads (years) 58 Literacy level of household heads (%) Mean annual cocoa produced per household (kg) Percentage cultivating other crops Oil palm Orange Kolanut Plantainlbanana Cassava Maize Yam Other crops 6.9 Source: Author's calculations, 20 10
Poverty Status of the cocoa farmers The indices ofpoverty of cocoa producing households in Osun State Nigeria are presented in Table 2.
Table 2: Poverty Indices of Cocoa Producing Households in Osun State, Nigeria Povertv Indices Povertv Line
International Poverty Line National Poverty Line (US$l.OO) (Twice Minimum Wage)
Head Count 0.82 0.44 Poverty gap 0.52 0.17 Severity of poverty 0.37 0.09 Source: Author's calculations, 20 10
Journal of'Agriculture, Volume 26. 2013
There are variations in the poverty indices depending on the setting of the poverty line. The headcount was 0.82 for the international poverty line and 0.44 for twice the national minimum wage. The headcount based on the international poverty line indicates that 82% of the cocoa farming households were living below the poverty line given the World Bank Standard of US$l .OO per capita. On the other hand, the headcount based on the minimum wage shows that 44% of the cocoa farming households were earning less than what a couple would have earned if they both had taken up paid employment. This shows that poverty is more prevalent among the cocoa farmers based on the international standard compared with the use of the national minimum wage.
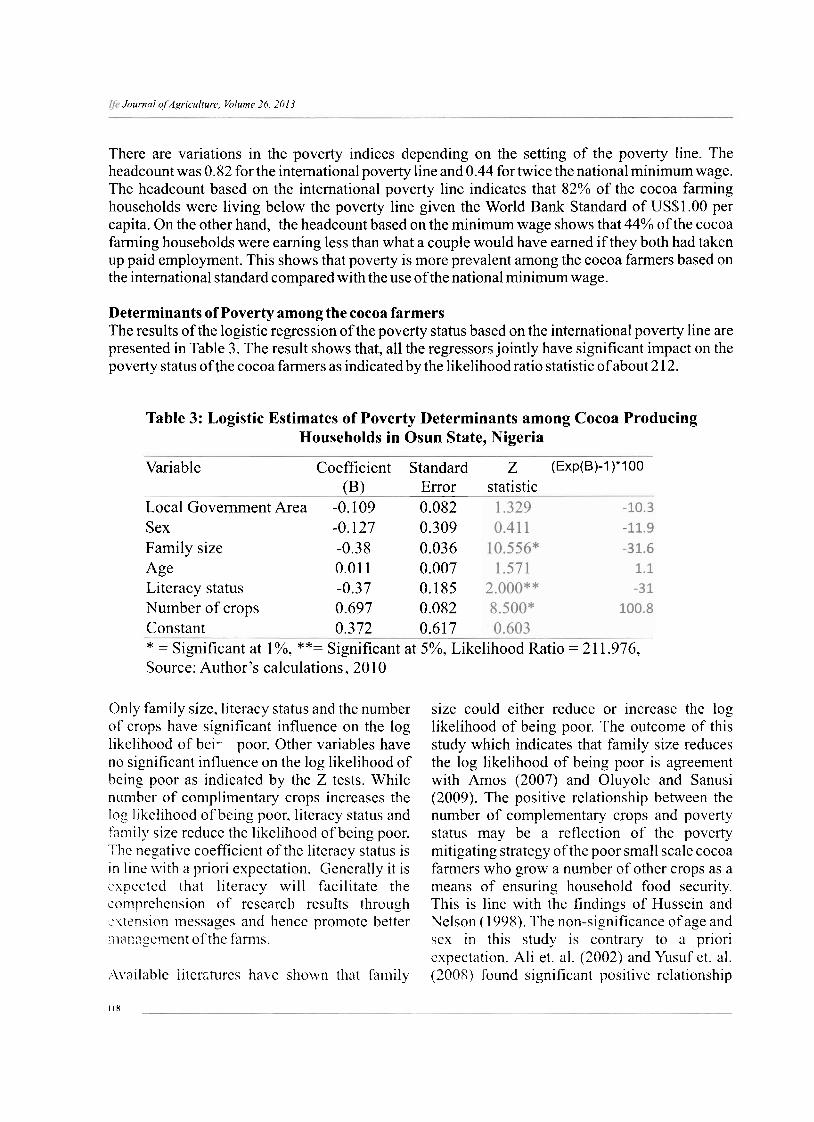
Determinants of Poverty among the cocoa farmers The results of the logistic regression of the poverty status based on the international poverty line are presented in Table 3. The result shows that, all the regressors jointly have significant impact on the poverty status of the cocoa farmers as indicated by the likelihood ratio statistic of about 2 12.
Table 3: Logistic Estimates of Poverty Determinants among Cocoa Producing Households in Osun State, Nigeria
Variable Coefficient (B)
Local Government Area -0.109 Sex -0.127 Family size -0.38
Age 0.01 1 Literacy status -0.37 Number of crops 0.697 Constant 0.372
Standard Error 0.082 0.309 0.036 0.007 0.185 0.082 0.617
z (Exp(B)-l)*l00
statistic
* = Significant at I%, **= Significant at 5%, Likelihood Ratio = 21 1.976, Source: Author's calculations, 20 10
Only family size, literacy status and the number of crops have significant influence on the log likelihood of bei.- poor. Other variables have no significant influence on the log likelihood of being poor as indicated by the Z tests. While number of complimentary crops increases the log likelihood of being poor, literacy status and family size reduce the likelihood of being poor. Thc negative coefficient of the literacy status is it1 line with a priori expectation. Generally it is cxncctcd that literacy will facilitate the comprehension of research results through x.ttmrion messages and hence promote better
r ~lann_cclnent of the farms.
,-lvailable litercturcs have shown that fanlily
size could either reduce or increase the log likelihood of being poor. The outcome of this study which indicates that family size reduces the log likelihood of being poor is agreement with Amos (2007) and Oluyole and Sanusi (2009). The positive relationship between the number of complementary crops and poverty status may be a reflection of the poverty mitigating strategy of the poor small scale cocoa farmers who grow a number of other crops as a means of ensuring household food security. This is line with the findings of Hussein and Nelson (1 998). The non-significance of age and sex in this study is contrary to a priori cxpectation. Ali et. al. (2002) and Yusuf et. al. (2008) found significant positive relationship
I I X
between age and po\.erty while Vccchio and Roy (1998) also support a positi\.e relationship is between sex and po\.ert>,.
The log likclihood of becoming poor due to one unit change in the \.aluc of the regressors is prcsented in the last column of Table 3. A unit increase in family size will lead to about 3 1.6 percent reduction in the log likelihood of being poor while the acquisition of literacy capability by farmers will lead to about 31 percent reduction in their log likelihood of being poor. On the other hand, a unit increase in the number of complementary crops being cultivated by farmers will lead to about 100.8 percent increase in their log likelihood ofbeing poor.
CONCLUSION This study assessed the poverty status among cocoa farmers in Osun State, Nigeria as well as examined some of the farm and farmer characteristics that affect poverty among the farmers. The paper established that there is a significant level of poverty among cocoa farmers. At the present level of poverty in the cocoa economy, cocoa may find it difficult to attract young people who could secure alternative employments that can at least pay the national minimum wage. Illiteracy may aggravate poverty among cocoa farmers. While large family size may reduce poverty among them by serving as a source of labour. Over time, however, research should d e v e l o p l abour - sav ing and c h e a p e r technologies for handling operations such as slashing, pruning, spraying and harvesting that will reduce the labour rcquirements for various operations on the cocoa farm. This will enable farmers to operate larger cocoa farms without having to maintain large families or be dependent on hired labour. Farmers will hence be able to specialise on cocoa and a few complimentary crops rather than cultivate several other crops which seems to incrcase the log likelihood of poverty among cocoa farmers in the state.
REFERENCES
Aboyade, 0. (1975). On the need for an operational specification of poverty in the Nigerian economy. Poverty in Nigeria. Journal of the Nigerian Economic Society. 2: 25-34
Afolabi, J.O. (1 987). Factors of poultry farming adoption in Oyo State, Nigeria: A study in agency- and infrastructure-based diffusion, GeoJolrrnal15: 1,83-90
Agboola, S.A., 1979. An Agricultural Atlas of Nigeria. Oxford University Press, Ibadan, 248 pp.
Aigbokhan, B.E. (2000). poverty, growth and inequality in Nigeria: A case study. AERC Research Paper 102. Nairobi. African Economic Research Consortium, 63 pp.
Aigbokhan, B.E. (2008). Growth, Income and Inequality in Nigeria. Economic Commission for Africa, ACGSMPAMS D i s c u s s i o n P a p e r N o . 3 , 3 3 p p . http://www.uneca.org/acgd/mdgs/Growt hInequalityPoverty.pdf
Akande, S.O., A.S. Olomola, T.O. Olomola and B. W. Adeoye. (2009). Impacts of price changes on poverty: The Nigerian experience. The Nigerian Institute of Social and Economic Research, (NISER), I b a d a n . 5 3 ~ ~ . h t t p : / / d e p o t . g d n e t . o r g / n e w k b / s u b m i s s i o n s / NISER Paperl-FINAL.pdf
Ali, A.G.A.,-G. Nwabu and R.K. Gesami. (2002). Poverty reduction in Africa: Challenges and policy options. AERC Special Paper 36 , 48pp. African Economic Research Consortium, N a i r o b i . h t tp : / /www.af r i ca4a l l - p r o j e c t . e u / w o r k s h o p / d o c u m e n t s /SP36.pdf
Amos, T.T. (2007). An Analysis of productivity and technical effficiency of smallholder cocoa farmers in Nigeria. J. Soc. Sci., 15(2): 127-133
Chen, S. and M. Ravallion. (2004). How have the world's poorest fared since the early
I/e Journal o/;lgriciculture, L+olunre 26, ,7013
1980s? World Bank Research O b s e w e ~ 1 9 ( 2 ) : 1 4 1 - 1 6 9 ; doi: 10.1093/wbro/lkh020
Cook, C.C. (2005). Assessing the impact of transport and energy infrastructure on poverty reduction. Asian Development Bank, 262 pp.
FAOSTAT (2010). Statistical Database, Food andAgricultura1 Organization, Rome.
Folayan, J.A. (2005). Economic analysis of cocoa marketing in Ondo and Ekiti state of Nigeria. Unpublished PhD Thesis, Department of Agricultural Economics and Extension, Federal University of Technology, Akure
Gockwoski, J. and S. Oduwole. (2001). Labor practices in the cocoa sector of southwest Nigeria with a focus on the role of children. Findings from a 200 1 survey of c o c o a p r o d u c i n g h o u s e h o l d s . http://www.treecrops.org/links/publicati o n s / L a b o r - P r a c t i c e s - south-west-Nigeria.pdf
Greene, W.H. (2003). Econometric Analysis (5th edition). Dorling Kindersley, Patparganj, Delhi, India. 1026pp.
Haughton, J. and S.R.. Khandker, (2009) . Handbook on Poverty and Inequality. The World Bank, Washington DC. http://siteresources.worldbank.org/ I N T P A / R e s o u r c e s / 4 2 9 9 6 6 - 1259774805724/Poverty_Inequality~Ha ndbook Ch04.pdf
Hussein K. and J. Nelson. (1998). Sustainable L i v e l i h o o d s a n d L i v e l i h o o d Diversification, IDS Working Paper 69, 32pp. IDS, University of Sussex, B r i g h t o n , http://www.uvg.edu.gt/instituto/centros/ cea/cafe/ HusseinNelson.pdf
ICCO (2008). Optimal export taxes in cocoa producing countries. Consultative Board on the World Cocoa Economy, Fifteenth m e e t i n g , I n t e r n a t i o n a l C o c o a O r g a n i z a t i o n ( I C C O ) , L o n d o n . www. icco. org/Attachment. aspx?id=3y26 408 7
Kakwani, N. (2007). New global poverty counts. Asian Development Review, Asian Development Bank, vol. 24, no. 2: 17-36
Konnig, N. & R. Jongeneel. 2006. Food Sovereignty and Export Crops: Could ECOWAS c r e a t e a n O P E C f o r Sustainable Cocoa? Regional Forum on Food Sovereignty, Niamey, 7 - 10 November
Lanjouw, P. (2001). Non-farm employment and poverty in rural El Salvador. World Development, volume 29, No. 3529-547.
Maxwell, S. (1999). The meaning and measurement of poverty. Poverty Briefings 2 Overseas Development Institute, http://www.oneworld.org/odi/
Meyer, B. D. and J. X. Sullivan. (2003). Measuring the well-being of the poor using income and consumption. The Journal of Human Resources XXXVIII Supplement 1 18 1 - 1220
NBS (2008) Facts and figures about Nigeria, National Bureau of Statistics, Federal Republic of Nigeria pp 62
NPC (2004). Nigeria: Draft National Economic Empowerment and Development Strategy-NEEDS, National Planning Commission, Abuja, 125 pp.
Okunade, E.O. (2006). Factors influencing adoption of improved farm practices among women farmers in Osun State. J. Hum. Ecol., 19(1): 45-49
Okunrnadewa, F. (1 999). International agencies response to poverty situation in Nigeria. CBNBullion 23.4: 66-70
Oladunni, E.B.I. (1999). The Dimensions of poverty in Nigeria: Spatial, sector, gender . CBNBullion 23: 4: 17-30
Olayemi, J.K. and S. Oni (1972). Asymmetry in price response: a case study of Western Nigerian Cocoa farmers. Nigerian Journal of Economic and Social Studies, 14: 347-55.
Oluyole, K.A. and R.A. Sanusi. (2009). Socio- economic variables and cocoa production
If;? Journal ofAgricu1ture. Volume 26. 2013
in Cross River State, Nigeria. J Hum Ecol, 25(1): 5-8
Onyeiwu, S., E. Pallant and M. Hanlon 2009. S u s t a i n a b l e a n d U n s u s t a i n a b l e Agriculture in Ghana and Nigeria: 1960 - 2009
Oxaal, Z. 1997. Education and Poverty: A Gender Analysis. Report prepared for the Gender Equal i ty Unit , Swedish International Developmcnt Cooperation Agency (Sida), BRIDGE (development - gender), Institute of Development Studies
University of Sussex, Brighton BN1 9RE, UK. h t t p : / / w w w . b r i d g e . i d s . a c . u k //bridge/reports/re53 .pdf
Pogge, T. W. and G. R. Sanjay. 2003. Unknown: The Extent, Distribution and Trend of G l o b a l I n c o m e P o v e r t y . www.socialanalysis.org
Ravallion, M. (1998). Expected poverty under risk-induced welfare viability Economic Journal, 36: 11 73- 1 183
Ravallion, M. and Datt, G. (2002). "Why has Economic growth been more pro-poor in some states of India than others? Journal ofDevelopment Economics 68: 382-400
Rozelle, S.J., Huang and Zxhang, L. (1997). Poverty, population and environmental degradation in China, Foodpolicy 22. 3: 29-25 1
Sabir, H. M., Z. Hussain and A. Saboor. (2006). Determinants of small farmers poverty in the Central Punjab, (Pakistan). Journal of Agricultul-e & S o c i a l S c i e n c e s 1 8 13-2235/2006/02-1-10-12
Salami, A. 2000. Cocoa marketing under regulated and deregulated regime in Nigeria PhD Thesis in the Department of Agricultural Economics, University of
Ibadan, Nigeria Schreckenberg, K, A. Awono, A. Degrande, C.
Mbosso, 0. Ndoye and Z. Tchoundjeu, (2006). Domesticating indigenous fruit trees as a contribution to poverty reduction. Forests, Trees and Livelihoods, Vol. 16, pp. 35-5 1
Srinivasan, T. N. (2001). Comment on 'Counting the world's poor,' by Angus Deaton", The World Bank Research Observel; 1 6 (2 ) 157- 168
Vecchio, N. and K. C. Roy. 1998. Poverty, Female-Headed Households, and Sustainable Economic Development. Westport, Connecticut: Greenwood Press, 130pp.
Virola, R.A. and A. M. Martinez, Jr. 2007. Population and Poverty Nexus: Does Family Size Matter? Paper presented during the 10th National Convention on Statistics at the EDSA Shangri-la Plaza Hotel, Mandaluyong City, Philippines on 1 - 2 O c t o b e r 2 0 0 7 . http://www.nscb.gov.ph/ncs/ 1 OthNCSIpa perslcontributed %20papers/ cps- 12/cps 12-03 .pdf
World Bank. 1990. World Development Report 1990: Poverty World Development Indicators. Oxford University Press, Oxford 260 pp
World Bank Institute 2005 Introduction to p o v e r t y a n a l y s i s h t tp : / / sa l i ses . mona.uwi.edu/sem2~08~09/SALI603 1 /P overtyManual.pdf
Yusuf, S.A., A. 0. Adesanoye and D. 0 . Awotide (2008). Assessment of poverty among urban farmers in lbadan Metropolis, Nigeria. J. Hum. Ecol., 24(3): 201 -207