Embed Size (px)
Citation preview

Submitted to: The Division Chief Project Finance Division Caribbean Development Bank P.O. Box 408, Wildey St. Michael, Barbados Tel.: (246) 431-1600; Fax: (246) 426-7269 SSuubbmmiitttteedd bbyy:: KKaaiirrii CCoonnssuullttaannttss LLiimmiitteedd 1144 CCoocchhrraannee SSttrreeeett,, TTuunnaappuunnaa TTrriinniiddaadd aanndd TToobbaaggoo,, WW..II.. TTeell..:: ((886688)) 666633--22667777;; FFaaxx:: ((886688)) 666633--11444422 EE--mmaaiill:: mmaaiill@@kkaaiirrii..ccoomm AAuugguusstt 22000066


DRAFT REPORT: Volume III - Quantitative Assessment of Poverty in St. Lucia ii
TABLE OF CONTENTS
LIST OF TABLES.................................................................................................................................................... IV ACRONYMS............................................................................................................................................................. VI EXECUTIVE SUMMARY ................................................................................................................................... VIII 1.0 INTRODUCTION.........................................................................................................................................1
1.1 SLC/HBS OBJECTIVE AND METHODOLOGY................................................................................................2 2.0 THE MAGNITUDE OF POVERTY....................................................................................................................4
2.1 POVERTY AND LABOUR FORCE PARTICIPATION ..........................................................................................9 2.2 POVERTY BY DISTRICT ..............................................................................................................................11 2.3 UNEMPLOYMENT BY DISTRICT..................................................................................................................13
3.0 POVERTY BY FUNCTIONAL SUB-POPULATIONS AND DISTRICT.....................................................16 3.1 CHILDREN .................................................................................................................................................16 3.2 WOMEN.....................................................................................................................................................16 3.3 MEN ..........................................................................................................................................................17 3.4 ELDERLY PERSONS....................................................................................................................................18 3.5 YOUTH ......................................................................................................................................................20
4.0 CHARACTERISTICS OF THE POOR....................................................................................................22 4.1 AGE OF INDIVIDUALS ................................................................................................................................22 4.2 SEX OF INDIVIDUALS.................................................................................................................................23 4.3 ETHNIC CHARACTERISTICS OF INDIVIDUALS .............................................................................................24 4.5 HEAD OF HOUSEHOLD...............................................................................................................................25
4.5.1 Age of Head ........................................................................................................................................25 4.5.2 Sex of Head.........................................................................................................................................26 4.5.3 Educational Attainment of Head ........................................................................................................26 4.5.4 Employment Status of Head................................................................................................................28
4.6 OCCUPATION.............................................................................................................................................30 5.0 EDUCATION AND SOCIO-ECONOMIC STATUS...............................................................................33
5.1 HIGHEST EXAMINATION............................................................................................................................33 5.1.1 Highest Examination Passed by Quintiles..........................................................................................33 5.1.2 Highest Examination Passed by Socio-Economic Status....................................................................35
5.2 ACCESS TO TEXTBOOKS ............................................................................................................................37 6.0 HEALTH, ENVIRONMENT AND SOCIO-ECONOMIC STATUS .....................................................39
6.1 LIFESTYLE DISEASES BY TYPE ..................................................................................................................39 6.2 USE OF HEALTH CARE FACILITIES BY TYPE ..............................................................................................40 6.3 HEALTH INSURANCE COVERAGE...............................................................................................................42
7.0 HOUSING CHARACTERISTICS AND SOCIO-ECONOMIC STATUS.............................................43 7.1 TENANCY OF DWELLING ...........................................................................................................................43

DRAFT REPORT: Volume III - Quantitative Assessment of Poverty in St. Lucia iii
7.2 TYPE OF DWELLING UNIT..........................................................................................................................44 7.3 MAIN ROOFING MATERIAL .......................................................................................................................44 7.4. MATERIAL OF OUTER WALLS....................................................................................................................45 7.5 MAIN COOKING FUEL................................................................................................................................47 7.6 TOILET FACILITIES ....................................................................................................................................47 7.7 MAIN SOURCE OF WATER .........................................................................................................................48
APPENDICES............................................................................................................................................................50 APPENDIX ONE....................................................................................................................................................50 APPENDIX TWO: STATISTICAL TABLES........................................................................................................57

DRAFT REPORT: Volume III - Quantitative Assessment of Poverty in St. Lucia iv
LIST OF TABLES TABLE 2.1: INDIGENCE AND POVERTY 1995 AND 2005/06 (%) ................................................................ 4 TABLE 2.2: COMPARATIVE QUINTILE ESTIMATES 1995/2005................................................................... 6 TABLE 2.3: HEAD COUNT, POVERTY GAP, POVERTY SEVERITY BY DISTRICT........................................... 6 TABLE 2.4: POVERTY BY AGE IN ST LUCIA.................................................................................................. 7 TABLE 2.5: LABOUR FORCE PARTICIPATION BY CONSUMPTION QUINTILE ........................................... 10 TABLE 2.6: EMPLOYMENT STATUS�* SOCIO ECONOMIC STATUS CROSS-TABULATION........................ 11 TABLE 2.7: PERCENTAGE DISTRIBUTION OF POPULATION BY DISTRICT ACCORDING TO SOCIO
ECONOMIC STATUS............................................................................................................................ 12 TABLE 2.8: PERCENTAGE DISTRIBUTION OF POPULATION BY SOCIO ECONOMIC STATUS ACCORDING
TO DISTRICT........................................................................................................................................ 13 TABLE 2.9: DISTRIBUTION OF POOR PERSONS IN THE LABOUR FORCE BY EMPLOYMENT STATUS
ACCORDING TO DISTRICT AND SEX .................................................................................................. 14 TABLE 2.10: DISTRIBUTION OF POOR PERSONS IN THE LABOUR FORCE BY PARISH ACCORDING TO
EMPLOYMENT STATUS AND SEX ....................................................................................................... 15 TABLE 3.1: PERCENTAGE DISTRIBUTION OF CHILDREN AGED 0-14 YEARS BY DISTRICT ACCORDING TO
SOCIO ECONOMIC STATUS ................................................................................................................ 16 TABLE 3.2: PERCENTAGE DISTRIBUTION OF FEMALES AGED 15 YEARS AND OVER BY DISTRICT
ACCORDING TO SOCIO ECONOMIC STATUS ..................................................................................... 17 TABLE 3.3: PERCENTAGE DISTRIBUTION OF MALES AGED 15 YEARS AND OVER BY DISTRICT
ACCORDING TO SOCIO ECONOMIC STATUS ..................................................................................... 18 TABLE 3.4: DISTRIBUTION OF ELDERLY PERSONS 65 YEARS AND OVER BY DISTRICT AND SOCIO
ECONOMIC STATUS ACCORDING TO SEX.......................................................................................... 19 TABLE 3.5: DISTRIBUTION OF YOUNG PERSONS AGED 15-24 YEARS BY DISTRICT AND SOCIO
ECONOMIC STATUS ACCORDING TO SEX.......................................................................................... 21 TABLE 4.1: DISTRIBUTION OF POPULATION BY FIVE-YEAR AGE GROUP ACCORDING TO SOCIO-
ECONOMIC STATUS............................................................................................................................ 22 TABLE 4.2: DISTRIBUTION OF POPULATION BY SEX ACCORDING TO SOCIO-ECONOMIC STATUS......... 24 TABLE 4.4: DISTRIBUTION OF POPULATION BY ETHNICITY ACCORDING TO SOCIO-ECONOMIC STATUS
............................................................................................................................................................ 24 TABLE 4.5: DISTRIBUTION OF HOUSEHOLD HEADS BY AGE GROUP ACCORDING TO SOCIOECONOMIC
STATUS................................................................................................................................................ 25 TABLE 4.6: DISTRIBUTION OF HOUSEHOLD HEADS BY SEX ACCORDING TO SOCIOECONOMIC STATUS
............................................................................................................................................................ 26 TABLE 4.7: DISTRIBUTION OF HOUSEHOLD HEADS BY HIGHEST EDUCATIONAL ATTAINMENT
ACCORDING TO SOCIO-ECONOMIC STATUS AND SEX ..................................................................... 27 TABLE 4.8: DISTRIBUTION OF HOUSEHOLD HEADS BY LABOUR FORCE PARTICIPATION ACCORDING
TO SOCIO-ECONOMIC STATUS AND SEX ........................................................................................... 29 TABLE 4.9: DISTRIBUTION OF HOUSEHOLD HEADS IN THE LABOUR FORCE BY EMPLOYMENT STATUS
ACCORDING TO SOCIOECONOMIC STATUS AND SEX....................................................................... 30 TABLE 4.10: DISTRIBUTION OF HOUSEHOLD HEADS IN THE OCCUPATION ACCORDING TO
SOCIOECONOMIC STATUS AND SEX.................................................................................................. 31
DRAFT REPORT: Volume III - Quantitative Assessment of Poverty in St. Lucia v
TABLE 5.1: DISTRIBUTION OF THE POPULATION AGED 15 YEARS AND OVER BY HIGHEST EXAMINATION PASSED ACCORDING TO PER CAPITA CONSUMPTION QUINTILES AND SEX ........ 34
TABLE 5.2: DISTRIBUTION OF THE POPULATION AGED 15 YEARS AND OVER BY HIGHEST EXAMINATION PASSED ACCORDING TO SOCIO-ECONOMIC STATUS AND SEX.............................. 36
TABLE 5.3: DISTRIBUTION OF THE POPULATION ATTENDING SCHOOL BY ACCESS TO TEXTBOOKS REQUIRED FOR SCHOOL ACCORDING TO SOCIO-ECONOMIC STATUS AND SEX ............................ 38
TABLE 6.1: PERSONS SUFFERING FROM DISEASE BY TYPE OF DISEASE AND QUINTILES, NUMBER AND PERCENTAGE...................................................................................................................................... 40
TABLE 6.2: PERCENTAGE DISTRIBUTION OF PERSONS WITH MAIN LIFESTYLE DISEASES OR ILLNESS AND INJURY DUE TO ACCIDENTS IN THE PAST 30 DAYS BY TYPE OF PLACE FIRST VISITED FOR MEDICAL ATTENTION ACCORDING TO PER CAPITA CONSUMPTION QUINTILES ......................... 41
TABLE 6.3: PERCENTAGE DISTRIBUTION OF POPULATION BY HEALTH INSURANCE COVERAGE ACCORDING TO PER CAPITA CONSUMPTION QUINTILES................................................................ 42
TABLE 7.1: PERCENTAGE DISTRIBUTION OF HOUSEHOLDS BY TENANCY OF DWELLING ACCORDING TO HOUSEHOLD QUINTILES .............................................................................................................. 43
TABLE 7.2: PERCENTAGE DISTRIBUTION OF HOUSEHOLDS BY TYPE OF DWELLING UNIT ACCORDING TO HOUSEHOLD QUINTILES .............................................................................................................. 44
TABLE 7.3: PERCENTAGE DISTRIBUTION OF HOUSEHOLDS BY MAIN ROOFING MATERIAL OF DWELLING ACCORDING TO HOUSEHOLD QUINTILES ..................................................................... 46
TABLE 7.4: PERCENTAGE DISTRIBUTION OF HOUSEHOLDS BY MATERIAL OF OUTER WALLS OF DWELLING ACCORDING TO HOUSEHOLD QUINTILES ..................................................................... 46
TABLE 7.5: PERCENTAGE DISTRIBUTION OF HOUSEHOLDS BY MAIN COOKING FUEL USED ACCORDING TO HOUSEHOLD QUINTILES......................................................................................... 47
TABLE 7.6: PERCENTAGE DISTRIBUTION OF HOUSEHOLDS BY TOILET FACILITIES USED ACCORDING TO HOUSEHOLD QUINTILES .............................................................................................................. 48
TABLE 7.7: PERCENTAGE DISTRIBUTION OF HOUSEHOLDS BY MAIN SOURCE OF WATER ACCORDING TO HOUSEHOLD QUINTILES .............................................................................................................. 49

DRAFT REPORT: Volume III - Quantitative Assessment of Poverty in St. Lucia vi
ACRONYMS ACP - Africa, Caribbean and Pacific BNTF - Basic Needs Trust Fund CARE - Centre for Adolescent Rehabilitation and Education CARICOM - Caribbean Community CBI - Caribbean Basin Initiative CBO(s) - Community Based Organisation(s) CDB - Caribbean Development Bank CET - Common External Tariff CFCs - Chlorofluorocarbons CIDA - Canadian International Development Agency CRED - Center for Research on the Epidemiology of Disasters CSME - Caribbean Single Market and Economy DFID - UK Department of International Development DOTS - EC - Eastern Caribbean EC - European Commission ECTEL - Eastern Caribbean Telecommunications Authority EDF - European Development Fund EIB - European Investment Bank EM-DAT - Emergency Disasters Data Base EU - European Union FAO - Food and Agriculture Organisation FGT - Foster-Greer-Thorbecke GDP - Gross Domestic Product GOSL - Government of St Lucia HIV/AIDS - Human Immunodeficiency Virus/ Acquired Immunodeficiency Syndrome HDI - Human Development Index HBS - Household Budgetary Survey IBRD - International Bank for Reconstruction and Development ICC - International Cricket Council IDB - Inter-American Development Bank ILO - International Labour Organisation LUCELEC - St. Lucia Electricity Services Ltd MDGs - Millennium Development Goals MoSSaiC - Management of Slope Stability in Communities NAFTA - North American Free Trade Area NAT - National Assistance Team

DRAFT REPORT: Volume III - Quantitative Assessment of Poverty in St. Lucia vii
NELP - National Learning and Enrichment Programme NGO(s) - Non-Government Organisation(s) NIC - National Insurance Corporation OECD - Organization for Economic Cooperation and Development OECS - Organisation of Eastern Caribbean States OFDA - USAID's Office of Foreign Disaster Assistance OPSR - Office of Private Sector Relations PPA - Participatory Poverty Assessment PRF - Poverty Reduction Fund PROUD - Programme for the Rationalisation of Unplanned Developments PSIP - Public Sector Investment Programme PWDs - Persons with Disabilities RC - Roman Catholics REDIP - Rural Economic Diversification Incentives Project SEDU - Small Enterprise Development Unit SFA - Special Framework of Assistance SIDS - Small Island Developing State(s) SLBC - St Lucia Banana Corporation SLBGA - St Lucia Banana Growers Association SMEs - Small and Medium Sized Enterprises SPICES - SLC - Survey of Living Conditions SLADA - St. Lucia Agricultural Diversification Agency Ltd SLBGA - St. Lucia Banana Growers Association TFRs - Total Fertility Rates TRP - Textbook Rental Programme UNDP - United Nations Development Programme UNECLAC - United Nations Economic Commission in Latin America and the Caribbean UNESCO - United Nations' Educational, Scientific and Cultural Organization UNIFEM - United Nations’ Development Fund for Women UNODC - United Nations Office on Drugs and Crime VAT - Value Added Tax WIAP - Windward Islands Action Plan WIBDECO - Windward Islands Banana Development and Exporting Company WINBAN - Windward Islands Banana Grower’s Association WTO - World Trade Organisation

DRAFT REPORT: Volume III - Quantitative Assessment of Poverty in St. Lucia viii
EXECUTIVE SUMMARY

DRAFT REPORT: Volume III - Quantitative Assessment of Poverty in St. Lucia 1
11..00 IINNTTRROODDUUCCTTIIOONN This section of the report provides estimates of the poverty in St. Lucia in 2005/06. It focuses on the social characteristics of the poor that can be derived from the quantitative data that have been collected for the Survey of Living Conditions (SLC)/Household Budgetary Survey (HBS). From a conceptual standpoint cross sectional living conditions surveys of Caribbean society capture, or embody three fundamentally different categories of persons living below the poverty line. These surveys usually are incapable of differentiating and categorizing those who fall under the general rubric of ‘the poor’. The first of these groupings is the chronic poor, or those individuals and households that have been poor for more than one generation. Secondly, there are those individuals, or households living below the poverty line that have only recently come to experience impoverishment as a result of recent changes in the economy. Finally, there are those individuals or households that move into and out of poverty on a seasonal basis.1 The nonexistence of systematic panel data does not make it possible to identify these categories in any definitive way using the data collected from the quantitative surveys. It therefore does not allow for any estimation of the proportions these groups occupy within the totality of the poor as identified by the poverty line. However, qualitative data collected in the PPA, in the form of in-depth interviews, do allow for some understanding of the features associated with chronic or long term poverty, and shall be adduced sparingly in this section, but shall be examined in greater depth in the following sections. The fact that the country conducted a poverty assessment some ten years ago does allow for some comparative analysis of the degree to which there has been change. In addition, there has been a pilot study using welfare indicators derived from a Core Welfare Indicators Questionnaire Survey (CWIQ), completed in 2004 that provide insights into social conditions.2 The chronic or long term poor evince certain features that appear integral to their condition. First of all, they are usually poorly endowed in terms of capabilities that allow them to function adequately in the labour, credit and financial markets. In practical terms, this means that they are lacking in educational and skill certification, have no access to land, or other forms of physical capital, beyond miniscule parcels, and tend not to be richly endowed in terms of social capital. Certainly, they are lacking in terms of social networks that extend outside of their immediate communities and which would place them in good standing for accessing these markets. The fertility behaviour of poor women tends to run counter to national (and regional) trends of decline and this is usually associated with unstable family relationships and single parenthood. Finally, because of their educational and financial capital deficiencies the chronic poor tend to be socially marginalized and disempowered. These social characteristics act as ‘maintainers’ of
1This charaterisation has been developed by C.Y. Thomas. 2While these other surveys provide some sense of the changes taking place, they are not equivalent to studies using panel data: the present survey is based on an SLC/HBS which is far more complete in data than the SLC of 1995, and the CWIQ.
DRAFT REPORT: Volume III - Quantitative Assessment of Poverty in St. Lucia 2
poverty across the generations. The obverse of these features of chronic poverty, where they emerge in the cycle of life that transmits poverty across the generations, tends to act as ‘interrupters.’ 3 The grounds for such attention are two fold. The first is normative. Chronic poverty is, perhaps, the most debilitating of the forms of poverty that afflict Caribbean countries. It is an affront to the dignity of the people of the region and where a substantial section of the population inherits poverty across the generations this makes a mockery of the notion of stable and viable nationhood. The second reason for the emphasis is positive. Its existence represents a long term drag on the efficient working of the economy. Two areas in which this effect can be readily understood to operate is in terms of the cumulative impact of educational investment in the form of the development of technical and cultural skills that would accrue if the chronic poor did not suffer from low endowments in education and the efficiencies of small scale entrepreneurship that might result from the chronic poor having access to credit markets. It is the understanding of the factors that lead to these three forms of poverty that allow researchers to speak to the origins and causes of poverty and to answer the question why some people are poor. St. Lucia has been undergoing one of its most challenging structural changes since the post World War II period. There are people who would have been in poverty before this process started. There are others who have been hard-done by the changes for some of whom this is a temporary set-back while for others is a calamity. There are yet others who suffer episodic events that lead to the collapse of income and well-being. All of these may present under the poverty line. They are also likely to be endowed with a differential capacity to rise above the line. 1.1 SLC/HBS OBJECTIVE AND METHODOLOGY This combined survey addresses two objectives. Firstly as it relates to the SLC, it is a rich source of socio-economic information on the household population and is often regarded as an essential source of data for the determination of social needs and establishment of targets for development planning. Secondly, as it relates to the HBS, it is designed to collect information from the country’s households and families on their buying habits (expenditures), income and other characteristics. The combined survey therefore allows data users to relate the expenditures and income of consumers to the characteristics of those same consumers.
More importantly however, the HBS component of the survey is also used for the purpose of revising the list of goods and services in the “basket” and consequently the weighting patterns of the CPI (Consumer Price Index). A change in the Consumer Price Index (CPI) is sometimes referred to as “the inflation rate” and is one of the key economic indicators. The “inflation rate” measures the changes in the purchasing power of money and is closely monitored by economic planners, policy makers, the business community and labour unions.
3 The terms belong to Hulme, D., K. Moore and A. Shepherd, ‘Chronic Poverty: Meanings and Analytical Frameworks’, CPRC Working Paper 2, Manchester: IDPM, University of Manchester, 2001.

DRAFT REPORT: Volume III - Quantitative Assessment of Poverty in St. Lucia 3
The sample for the SLC/HBS 2005/2006 in St. Lucia was selected from a sample frame derived from the 2001 census of population. It is a ‘grand sample’ from which samples of 2.0 per cent, 4.0 per cent, 6.0 per cent can be selected depending on the number of replicates/sub-samples selected. The sample frame for St. Lucia is made up of two sub-samples/replicates selected from the ‘grand sample’, named a,h. For the SLC/HBS 2005/2006 these two replicates have an expected sample size of 2.78 per cent of the population. For convenience both in selecting the sample and for field enumeration, a two stage stratified systematic random sample selection process was used. At the first stage, Enumeration Districts (EDs) were selected based on a sampling frame constructed from Census Enumeration Districts (EDs), the size of each ED included in the frame was measured in units of clusters of households, of approximately ten households per cluster.

DRAFT REPORT: Volume III - Quantitative Assessment of Poverty in St. Lucia 4
22..00 TTHHEE MMAAGGNNIITTUUDDEE OOFF PPOOVVEERRTTYY The data reveal that 28.8 per cent of the population of St. Lucia fell below the poverty line. The poverty line, as has been outlined above, provides a measure of the value of a lowest cost basket of goods that provide the minimum number of kilocalories needed for proper functioning by human beings on a daily basis. It also consists of the value of all other basic non-dietary needs of the individual or household. Those living below the line cannot afford both sets of items. The data also reveal that 1.6 per cent of the total population existed in a state of indigence. This means that not only did they fall below the poverty line, but unlike the other persons who did so they were not able to afford the consumption of nutrients necessary to maintain ‘life and limb’. In other words, these persons suffered levels of malnutrition that meant they were not obtaining the kilocalories deemed by nutritionists to be basic for the proper functioning of the human organism. Table 2.1 presents a comparison between the SLC of 1995 and the SLC/HBS of 2005/06. It must be emphasised that the SLC of 1995 was based on the recall of expenditures of representatives of 600 households or 2200 persons. The SLC/HBS of 2005/06 is based on data collected from 1,222 households, or 4,319 persons representing 2.78 per cent of the population: the data collected on expenditures came from diaries of the individual spenders in the households. This latter survey is far more robust than the first in terms of the quantum of data collected.
Table 2.1: Indigence and Poverty 1995 and 2005/06 (%)
1995 2005/05 Poor Households 18.7 21.4 Poor Population 25.1 28.8 Indigent Households 5.3 1.2 Indigent Population 7.1 1.6 Gini Coefficient 0.5 0.42
The data suggest that poverty has increased from 25.1 per cent of individuals to 28.8 per cent over the period. However, indigence seemed to have dropped substantially from 7.1 per cent to 1.6 per cent of individuals. In other words, while poverty might have increased, the percentage of the population that was extremely poor had dropped. It must be noted that comparisons of indigence are based on standards derived from outside of the data set, while comparisons of poverty include relative data. Indigence is derived from the costs of securing cheapest food that could provide for bodily requirements. Comparisons of indigence are ‘purer’ in what they stand for, in that they relate to basic bodily survival. The poverty line, on the other hand takes the average non-food expenditure of the poorest 40 per cent of households as the criterion marker and this is added to the indigence line in arriving at poverty. It might well be that the poor in St. Lucia in 2005/06 had a much improved standard
DRAFT REPORT: Volume III - Quantitative Assessment of Poverty in St. Lucia 5
of living and quality of life than in 1995 than are suggested by the data. Thus, food or the indigence component represented a much larger percentage of the poverty line in 1995 compared to 2005/06. Another interesting result is the level of inequality in the society. The Gini coefficient provides an index of inequality. This was estimated to be 0.42 which is lower than the estimated result for the 1995 SLC – 0.5. The lower the Gini, the lower is the level of inequality. In effect then, as incomes grew in the society, the poor were able to secure a larger percentage of the improved income. However, while the decline in the Gini was considerable, inequality was still high. The poorest 20 per cent enjoyed just 5.7 per cent of the expenditures compared to almost 50 per cent enjoyed by the richest 20 per cent. It must be noted as well, that the Gini presents distribution of private expenditure or income, and may not reflect the entire picture on distribution: there are ‘public goods’, the distribution of which could have been even more pro-poor, thus improving the quality of life of poorer citizens. If the poor can access free medication, and highly subsidized goods in much greater quantum than the rich, the differences in their condition need not be as wide as reflected in the Gini. Table 2.2 compares the results on certain critical variables over the two surveys. The average size of households seems to have fallen slightly from 3.8 persons to 3.6 persons. Likewise, the number of children has fallen from 1.5 to 1.1. The number of children falls as income increases in both surveys. Importantly, the number of children in the poorest quintile in 2005 was much lower than in 1995 – 1.9 as compared to 2.7. There was a slightly larger number of earners per household in 2005 than in 1995. A smaller percentage of household heads in the poorest quintile were female in 2005 than were in 1995. Indeed and interestingly, a larger percentage of households were female headed in the two highest quintiles in 2005 than in 1995, even though over the period, the percentage of the households that were male and female headed for the entire population was remarkably similar. Clearly, women who have been able to escape the barriers in the world of work and could rise to the top of their profession or occupational category would be equally likely to be heads of households as men. Table 2.3 provides information on the geographic distribution of poverty and indigence and the poverty gap and poverty severity. While at the national level, indigence fell, there were some districts in the country where indigence was much above the national average. Thus, in Anse-la-Raye and Canaries, 5.3 per cent of the population was indigent. These two areas of the country seemed to have suffered a stasis in the development for more than one generation. Soil and weather did not permit for competitive banana production in those areas, and, therefore they could not participate actively in the banana industry when bananas were ‘green gold’. In Vieux-Fort and Micoud also the rates were much above the average. Vieux-Fort witnessed the collapse of much of its manufacturing sector and Micoud succumbed to a decline in the competitiveness of its banana industry. In effect, there was some change in the geography of poverty as the stagnation that characterized much of the west and south-west of the island, spread to the east of the island. For the country as a whole, the poverty gap in 1995 was 8.6 and the FGT index was 4.4.

DRAFT REPORT: Volume III - Quantitative Assessment of Poverty in St. Lucia 6
Table 2.2: Comparative Quintile Estimates 1995/2005
Per Capita Consumption Quintiles Poorest II III IV Richest All St Lucia
2005 Sex of Head of Household %
Male 57.5 56.6 50.3 53.3 62.0 56.4 Female 42.5 43.4 49.7 46.7 38.0 43.6 Both Sexes 100.0 100.0 100.0 100.0 100.0 100.0
Mean Age of Head 49 50 49 50 53 51 Household Size 4.7 4.3 3.9 3.3 2.6 3.6 Children Per Household 1.9 1.5 1.2 0.9 0.5 1.1 Earners Per Household 1.6 1.5 1.3 1.1 0.7 1.2
1995 Sex of Head of Household %
Male 51.7 49.0 49.1 58.3 67.0 56.7 Female 48.3 51.0 50.9 41.7 33.0 43.3 Both Sexes 100.0 100.0 100.0 100.0 100.0 100.0
Mean Age of Head 49.2 48.7 46.5 44.5 45.7 46.6 Household Size 5.3 4.6 4.2 3.7 2.6 3.8 Children Per Household 2.7 2.0 1.7 1.4 0.7 1.5 Earners Per Household 1.1 1.2 1.4 1.5 1.4 1.3
Table 2.3: Head Count, Poverty Gap, Poverty Severity by District Population Per cent Indigent Per cent Poor Poverty Gap Poverty Severity St Lucia 2005/06 164,842 1.6 28.8 9.0 4.1 St Lucia 1995 144,000 7.1 25.1 8.6 4.4 Castries City 2005/06 16,594 1.7 13.1 3.4 1.8 Castries City 1995 --- 15.2 4.4 1.7 Castries Sub-Urban 51,100 0.6 22.2 6.7 2.9 Castries Sub-Urban 1995 --- 22.6 8.2 3.8 Anse-La-Raye / Canaries 10,287 5.3 44.9 17.7 9.6 Soufriere 9,329 0.4 42.5 12.4 4.8 Choiseul 5,401 38.4 9.7 3.8 Laborie 7,190 42.1 10.6 3.5 Vieux-Fort 14,096 4.8 23.1 10.2 5.9 Micoud 18,071 4.0 43.6 14.1 6.8 Dennery 11,986 34.2 11.4 5.2 Gros-Islet 20,787 0.4 24.4 5.8 2.2
DRAFT REPORT: Volume III - Quantitative Assessment of Poverty in St. Lucia 7
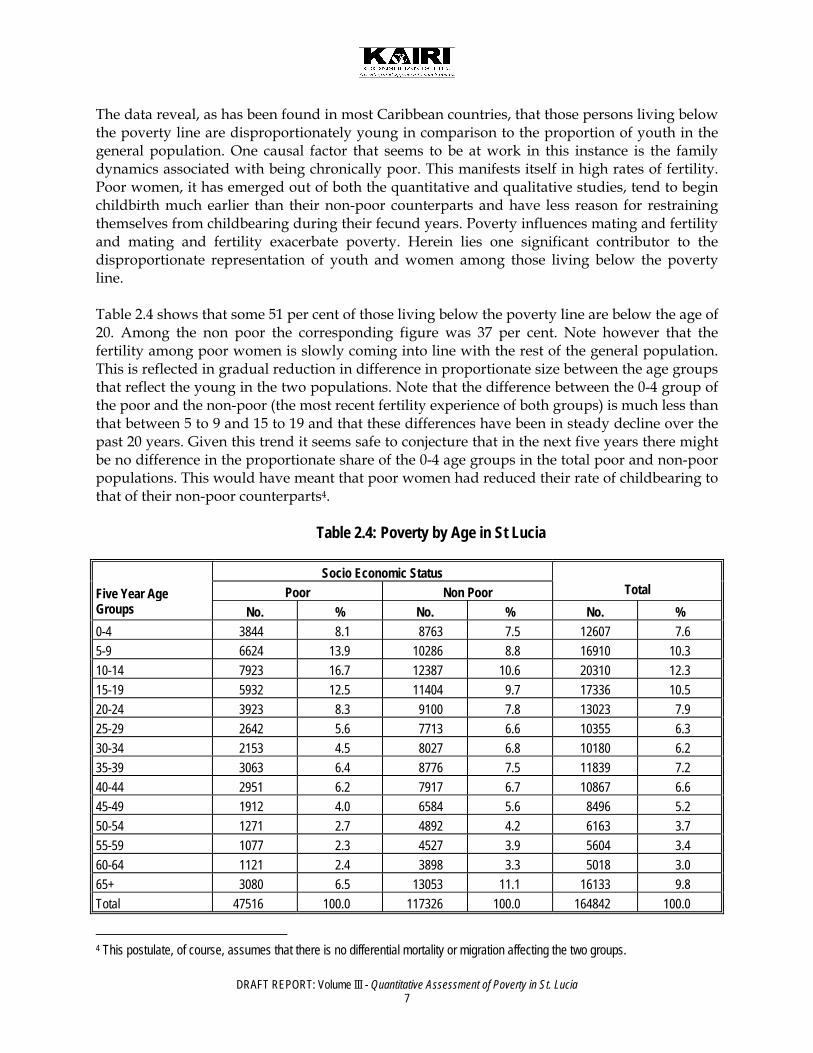
The data reveal, as has been found in most Caribbean countries, that those persons living below the poverty line are disproportionately young in comparison to the proportion of youth in the general population. One causal factor that seems to be at work in this instance is the family dynamics associated with being chronically poor. This manifests itself in high rates of fertility. Poor women, it has emerged out of both the quantitative and qualitative studies, tend to begin childbirth much earlier than their non-poor counterparts and have less reason for restraining themselves from childbearing during their fecund years. Poverty influences mating and fertility and mating and fertility exacerbate poverty. Herein lies one significant contributor to the disproportionate representation of youth and women among those living below the poverty line. Table 2.4 shows that some 51 per cent of those living below the poverty line are below the age of 20. Among the non poor the corresponding figure was 37 per cent. Note however that the fertility among poor women is slowly coming into line with the rest of the general population. This is reflected in gradual reduction in difference in proportionate size between the age groups that reflect the young in the two populations. Note that the difference between the 0-4 group of the poor and the non-poor (the most recent fertility experience of both groups) is much less than that between 5 to 9 and 15 to 19 and that these differences have been in steady decline over the past 20 years. Given this trend it seems safe to conjecture that in the next five years there might be no difference in the proportionate share of the 0-4 age groups in the total poor and non-poor populations. This would have meant that poor women had reduced their rate of childbearing to that of their non-poor counterparts4.
Table 2.4: Poverty by Age in St Lucia
Socio Economic Status Poor Non Poor Total Five Year Age
Groups No. % No. % No. % 0-4 3844 8.1 8763 7.5 12607 7.6 5-9 6624 13.9 10286 8.8 16910 10.3 10-14 7923 16.7 12387 10.6 20310 12.3 15-19 5932 12.5 11404 9.7 17336 10.5 20-24 3923 8.3 9100 7.8 13023 7.9 25-29 2642 5.6 7713 6.6 10355 6.3 30-34 2153 4.5 8027 6.8 10180 6.2 35-39 3063 6.4 8776 7.5 11839 7.2 40-44 2951 6.2 7917 6.7 10867 6.6 45-49 1912 4.0 6584 5.6 8496 5.2 50-54 1271 2.7 4892 4.2 6163 3.7 55-59 1077 2.3 4527 3.9 5604 3.4 60-64 1121 2.4 3898 3.3 5018 3.0 65+ 3080 6.5 13053 11.1 16133 9.8 Total 47516 100.0 117326 100.0 164842 100.0
4 This postulate, of course, assumes that there is no differential mortality or migration affecting the two groups.
DRAFT REPORT: Volume III - Quantitative Assessment of Poverty in St. Lucia 8
In the Caribbean a complex pattern of mating and union formation exists. This has its genesis in the region’s African cultural antecedents and its historical experiences in the era of Plantation slavery. The outcome among the population of African descent has been a system of union formation in which formal marriage often represents the culmination of a mating system, takes place late in life and, more often than not, represents the embellishment of an existing union between a man and a woman rather than its initiation. The majority of women are involved in a socially, but not formally sanctioned relationship with a man at any given point in time. Some of the households counted as being single mother female headed, in fact represent a family spread between two households with the male member of the family living in a separate household. This type of relationship is known as a visiting union. Not all visiting relationships lead to cohabitation and a woman might in the course of her childbearing years enter into a number of visiting or common law relationships without ever entering into formal marriage. A man, on the other hand, may be involved in more than one visiting relationship, or may be involved in a formal marriage or common law relationship even whilst being involved in the visiting relationship. Against this background the fact that many of the chronically poor women with large families are ‘single,’ begins to make sense. The seemingly ‘missing men’ are either involved in simultaneous or serial relationships with these women. The facts of their gender and biology, it can be hypothesised, gives men special favour in the labour market. It also frees them from the constraint of spending their income on nurturing all the children they have had a role of bringing into the world, unlike women. This pattern of family formation and dissolution more often than not, therefore, has an immediately deleterious impact on women and the children that they bear. As the nurturer the woman bears a disproportionate share of the responsibility of providing for family. In addition she is constrained by these responsibilities from participation in the labour market. In the case of the chronically poor woman, lack of educational endowment also acts as a constraining factor. She fails to meet the super-ordinate responsibility of providing for herself and her many children: this attests to the lack of endowment associated with chronic poverty and ensures its continuity. Immediately, this is manifested in terms of negative outcomes as far as satisfying the basic needs of the young are concerned. Their educational attainment and, sometimes, their physiological development are limited because of scarce household resources.5 This in turn affects their future ability to effectively participate in the labour market. If they are female, this fact in itself further limits their labour market options both from the standpoint of the constraints imposed by the personal responsibilities they will have to undertake as women, as well as the opportunity and reward structures of the market itself. The negative effect of poverty through the institutions of mating and family also affects males through their gender roles. As youngsters, educational and physiological needs go unfulfilled because of constraints imposed by scarce household resources. The question of whether or not
5 It also is likely to lead to poor school attendance on the part of the young since oftentimes household resources will not be able to afford transportation costs, books, uniforms and other school related expenses.

DRAFT REPORT: Volume III - Quantitative Assessment of Poverty in St. Lucia 9
they are the beneficiaries of a skewed household distribution of resources because of their gender is a moot point and perhaps is best categorized as an empirical one. In their early manhood, males have the socially expected role of provider, but not that of nurturer. Another ‘socially sanctioned attribute’ of manhood is the ability to impregnate a woman. Low levels of educational endowment in the context of a labour market that is highly segmented (primary and secondary) means that whereas most men are able to meet the second expectation they are oftentimes unable to meet the first. It would be simplistic to argue that poor men seem to excel at the second in order to make up for shortcomings in the first. There are a host of social and cultural factors that have to be taken into account in explaining this behaviour pattern. Certainly though, the way in which the satisfaction of the physiological need for sexual gratification on the part of men is institutionalized ought not to be entirely divorced from a labour market in which poor women are seriously disadvantaged and men from a background of chronic poverty are limited to relatively low paying spasmodic employment. The following subsection examines some labour market issues. First, attention is directed at the extent to which the human resource is prepared for effective participation in this market. Secondly, the nature of this participation is analyzed. 2.1 POVERTY AND LABOUR FORCE PARTICIPATION Since poverty is being measured by income this indicator is particularly important as it tells of the effort made to earn income and how this is in turn related to poverty status. Neither income, nor effort at participating in the labour market, though, tells of the relative advantages that the respective socioeconomic groups bring to the labour market and how this influences the success they achieve as a result of this participation. It is these endowments and the extent to which they are unevenly divided within the population that perhaps reflect the real underlying cause of income poverty. Thus, two labour force participants in the area of agriculture might work equal amounts of time but if one has 20 acres of land whereas the other has two then, all other things being equal, they will have vastly different incomes. Similarly, two labour force participants within the commercial sector with one having access to the credit market whereas the other does not will, all other things being equal, have different levels of income notwithstanding the fact that they make equal levels of effort in participating in the labour force. Similar arguments apply to education as an endowment factor. It is the differential distribution of these endowments within the economy and society of St. Lucia that make the critical difference between the incomes earned by persons and therefore their poverty status. The broader macroeconomic and institutional arrangements in the society are the determinants of this distribution. Some of these issues are addressed in the sections of the report that deal with these two areas. In a sense, the understanding of the determinant role of endowments or capabilities suggests that our conceptual tools have failed to keep pace with our understanding of the phenomenon of poverty. Even though we know of the importance of
DRAFT REPORT: Volume III - Quantitative Assessment of Poverty in St. Lucia 10
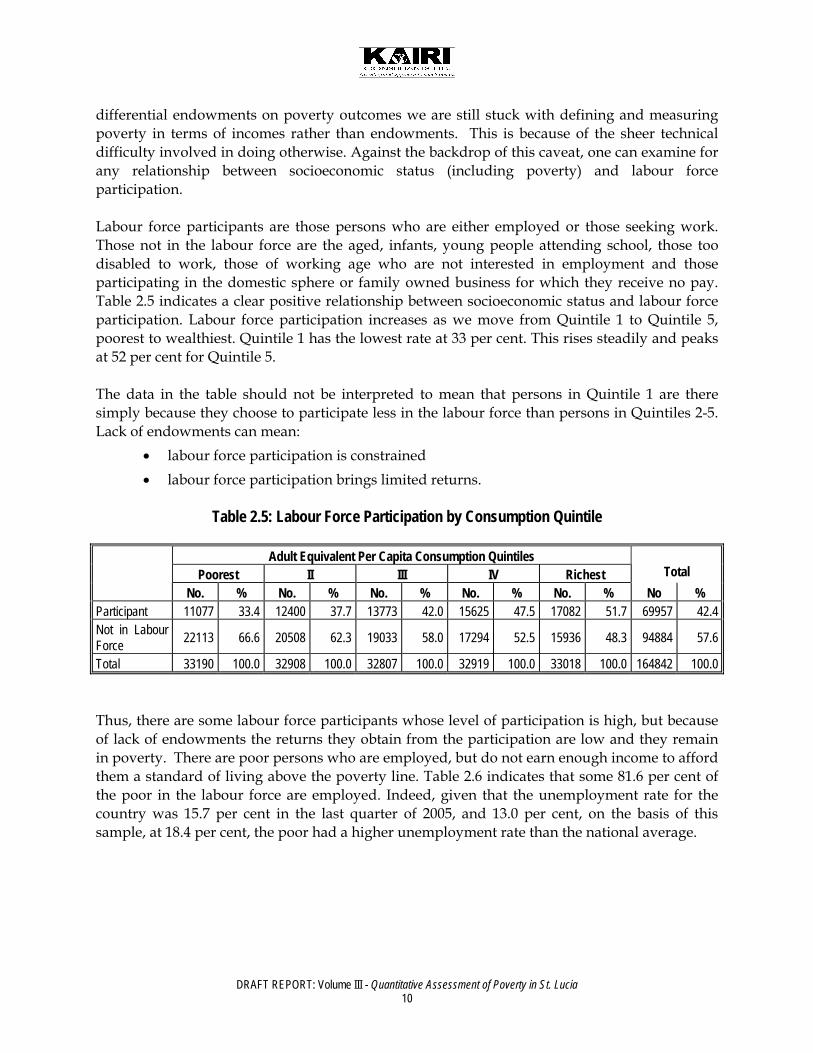
differential endowments on poverty outcomes we are still stuck with defining and measuring poverty in terms of incomes rather than endowments. This is because of the sheer technical difficulty involved in doing otherwise. Against the backdrop of this caveat, one can examine for any relationship between socioeconomic status (including poverty) and labour force participation. Labour force participants are those persons who are either employed or those seeking work. Those not in the labour force are the aged, infants, young people attending school, those too disabled to work, those of working age who are not interested in employment and those participating in the domestic sphere or family owned business for which they receive no pay. Table 2.5 indicates a clear positive relationship between socioeconomic status and labour force participation. Labour force participation increases as we move from Quintile 1 to Quintile 5, poorest to wealthiest. Quintile 1 has the lowest rate at 33 per cent. This rises steadily and peaks at 52 per cent for Quintile 5. The data in the table should not be interpreted to mean that persons in Quintile 1 are there simply because they choose to participate less in the labour force than persons in Quintiles 2-5. Lack of endowments can mean:
• labour force participation is constrained • labour force participation brings limited returns.
Table 2.5: Labour Force Participation by Consumption Quintile
Adult Equivalent Per Capita Consumption Quintiles
Poorest II III IV Richest Total No. % No. % No. % No. % No. % No % Participant 11077 33.4 12400 37.7 13773 42.0 15625 47.5 17082 51.7 69957 42.4 Not in Labour Force 22113 66.6 20508 62.3 19033 58.0 17294 52.5 15936 48.3 94884 57.6
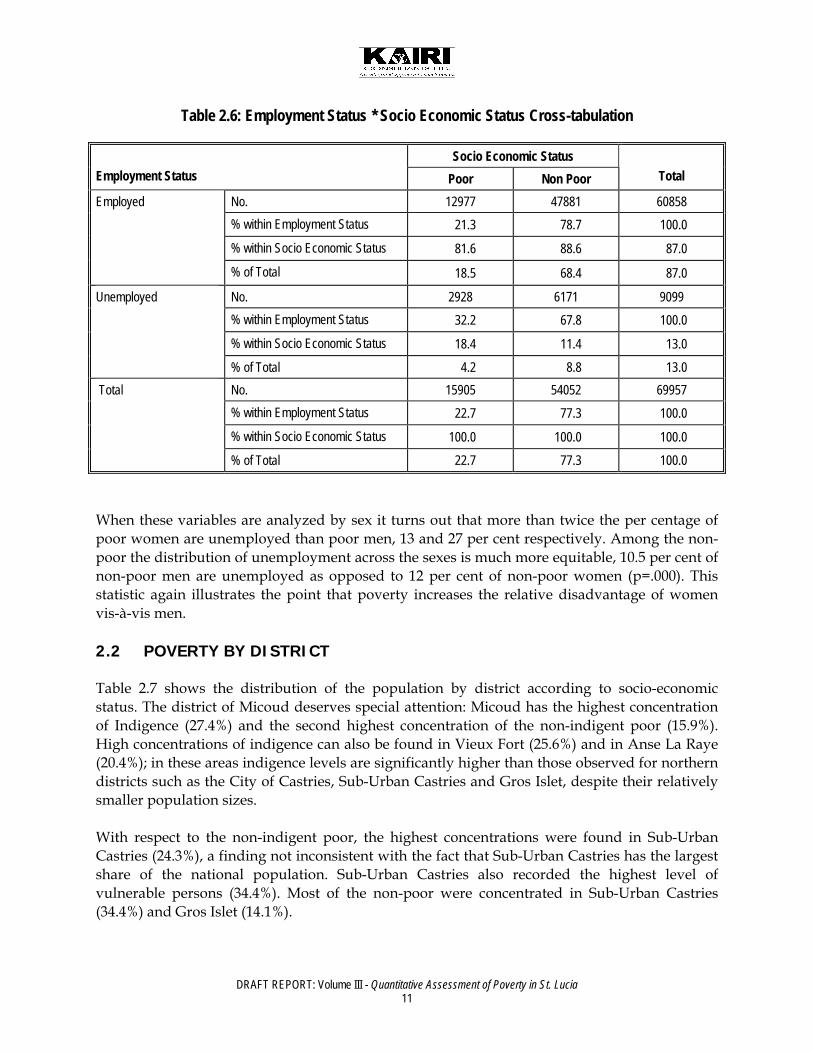
Total 33190 100.0 32908 100.0 32807 100.0 32919 100.0 33018 100.0 164842 100.0 Thus, there are some labour force participants whose level of participation is high, but because of lack of endowments the returns they obtain from the participation are low and they remain in poverty. There are poor persons who are employed, but do not earn enough income to afford them a standard of living above the poverty line. Table 2.6 indicates that some 81.6 per cent of the poor in the labour force are employed. Indeed, given that the unemployment rate for the country was 15.7 per cent in the last quarter of 2005, and 13.0 per cent, on the basis of this sample, at 18.4 per cent, the poor had a higher unemployment rate than the national average.
DRAFT REPORT: Volume III - Quantitative Assessment of Poverty in St. Lucia 11
Table 2.6: Employment Status * Socio Economic Status Cross-tabulation
Socio Economic Status Employment Status Poor Non Poor Total
No. 12977 47881 60858 % within Employment Status 21.3 78.7 100.0
% within Socio Economic Status 81.6 88.6 87.0
Employed
% of Total 18.5 68.4 87.0
No. 2928 6171 9099 % within Employment Status 32.2 67.8 100.0
% within Socio Economic Status 18.4 11.4 13.0
Unemployed
% of Total 4.2 8.8 13.0 No. 15905 54052 69957 % within Employment Status 22.7 77.3 100.0
% within Socio Economic Status 100.0 100.0 100.0
Total
% of Total 22.7 77.3 100.0 When these variables are analyzed by sex it turns out that more than twice the per centage of poor women are unemployed than poor men, 13 and 27 per cent respectively. Among the non-poor the distribution of unemployment across the sexes is much more equitable, 10.5 per cent of non-poor men are unemployed as opposed to 12 per cent of non-poor women (p=.000). This statistic again illustrates the point that poverty increases the relative disadvantage of women vis-à-vis men. 2.2 POVERTY BY DISTRICT Table 2.7 shows the distribution of the population by district according to socio-economic status. The district of Micoud deserves special attention: Micoud has the highest concentration of Indigence (27.4%) and the second highest concentration of the non-indigent poor (15.9%). High concentrations of indigence can also be found in Vieux Fort (25.6%) and in Anse La Raye (20.4%); in these areas indigence levels are significantly higher than those observed for northern districts such as the City of Castries, Sub-Urban Castries and Gros Islet, despite their relatively smaller population sizes. With respect to the non-indigent poor, the highest concentrations were found in Sub-Urban Castries (24.3%), a finding not inconsistent with the fact that Sub-Urban Castries has the largest share of the national population. Sub-Urban Castries also recorded the highest level of vulnerable persons (34.4%). Most of the non-poor were concentrated in Sub-Urban Castries (34.4%) and Gros Islet (14.1%).

DRAFT REPORT: Volume III - Quantitative Assessment of Poverty in St. Lucia 12
Table 2.7: Percentage Distribution of Population by District according to Socio Economic Status
Socio-Economic Status
Indigent Poor But Not
Indigent Vulnerable Non Poor Total District % Castries City 10.9 4.2 13.1 12.1 10.1 Castries Sub-Urban 11.3 24.7 32.1 34.4 31.0 Anse-La-Raye 20.4 9.1 10.1 3.3 6.2 Soufriere 1.5 8.7 4.0 4.7 5.7 Choiseul - 4.6 2.0 3.1 3.3 Laborie - 6.7 3.0 3.7 4.4 Vieux-Fort 25.6 5.7 8.1 9.6 8.6 Micoud 27.4 15.9 8.8 8.6 11.0 Dennery - 9.1 7.6 6.5 7.3 Gros-Islet 2.9 11.1 11.2 14.1 12.6 Total % (100.0) (100.0) (100.0) (100.0) (100.0) No. 2670 44845 26680 90646 164842 Table 2.8 shows the distribution of the population in each district by socio-economic status. For St. Lucia as a whole, 28.8 per cent of the population were estimated to be poor of which, 1.6 per cent was found to be indigent. Another 16.2 per cent were deemed vulnerable of falling into poverty. Generally poverty in St. Lucia appears to be a rural phenomenon as the rural districts such as Anse La Raye (44.9%), Soufriere (42.4%), Choiseul (38.4%), Laborie (42.1%) and Micoud (43.6%) exhibit relatively higher rates of poverty. Moreover, Anse La Raye and Micoud also showed high rates of indigence; 5.3 per cent and 4.1 per cent respectively. Lower rates of poverty have been estimated in the City of Castries, Sub-Urban Castries and Gros Islet, the three predominantly urban districts in the northern part of the island. While the City of Castries recorded the lowest incidence of poverty (13.1%), it is noteworthy that a relatively high proportion of its population is considered vulnerable (21.0%). Similarly, the high prevalence of poverty in Anse La Raye, coupled with the fact that another 26.1 per cent of its population is classified as vulnerable is cause for concern.

DRAFT REPORT: Volume III - Quantitative Assessment of Poverty in St. Lucia 13
Table 2.8: Percentage Distribution of Population by Socio Economic Status according to District
Socio-Economic Status
Indigent Poor But Not
Indigent Vulnerable Non Poor Total District % Castries City 1.7 11.4 21.0 65.9 16594 (100.0)
Castries Sub-Urban 0.6 21.6 16.8 61.0 51100 (100.0)
Anse-La-Raye 5.3 39.6 26.1 29.0 10287 (100.0)
Soufriere 0.4 42.0 11.5 46.0 9329 (100.0)
Choiseul - 38.4 9.9 51.7 5401 (100.0)
Laborie - 42.1 11.1 46.8 7190 (100.0)
Vieux-Fort 4.8 18.2 15.4 61.5 14096 (100.0)
Micoud 4.1 39.5 13.0 43.4 18071 (100.0)
Dennery - 34.2 16.9 48.9 11986 (100.0)
Gros-Islet 0.4 24.0 14.3 61.3 20787 (100.0)
Total 1.6 27.2 16.2 55.0 164842 (100.0) 2.3 UNEMPLOYMENT BY DISTRICT Table 2.9 examines the employment status of poor persons in the labour force by geographic distribution and sex. Overall, a greater proportion of poor females were unemployed (27.4%), compared to poor males (12.7%), with notable exceptions in Choiseul and Vieux Fort. In respect of Vieux Fort, this may be explained by the availability of employment opportunities for women in the manufacturing zone. Table 2.10 shows the concentration of employed and unemployed poor persons in St. Lucia’s labour force. Not surprisingly, variations in the concentrations within the districts are consistent with variations in the number of poor persons in the labour force of the different districts. As such, the greatest concentration of unemployed persons is found in Sub-Urban Castries and is evident irrespective of individuals’ sex. A similar observation emerges in the context of districts such as Micoud and Gros Islet that have relatively high concentrations of unemployed persons who are deemed to be poor.

DRAFT REPORT: Volume III - Quantitative Assessment of Poverty in St. Lucia 14
Table 2.9: Distribution of Poor Persons in the Labour Force by Employment Status according to District and Sex
Employment Status
Employed Unemployed Total District N % N % N %
MALE Castries City 399 100.0 - - 399 100.0 Castries Sub-Urban 2604 85.2 453 14.8 3057 100.0 Anse-La-Raye 800 100.0 - - 800 100.0 Soufriere 578 77.8 165 22.2 743 100.0 Choiseul 179 62.6 107 37.4 286 100.0 Laborie 454 100.0 - - 454 100.0 Vieux-Fort 683 80.9 161 19.1 843 100.0 Micoud 1340 86.8 203 13.2 1543 100.0 Dennery 590 100.0 - - 590 100.0 Gros-Islet 890 85.2 155 14.8 1045 100.0 Total 8517 87.3 1244 12.7 9761 100.0
FEMALE Castries City 182 71.3 73 28.7 254 100.0 Castries Sub-Urban 1245 67.3 604 32.7 1849 100.0 Anse-La-Raye 473 92.9 36 7.1 509 100.0 Soufriere 206 62.4 124 37.6 330 100.0 Choiseul 286 73.5 107 26.5 393 100.0 Laborie 265 69.8 114 30.2 378 100.0 Vieux-Fort 442 84.7 80 15.3 522 100.0 Micoud 447 64.6 244 35.4 690 100.0 Dennery 295 66.6 148 33.4 443 100.0 Gros-Islet 619 80.0 155 20.0 774 100.0 Total 4460 72.6 1684 27.4 6144 100.0
BOTH SEXES Castries City 581 88.9 73 11.1 654 100.0 Castries Sub-Urban 3849 78.5 1057 21.5 4906 100.0 Anse-La-Raye 1272 97.2 36 2.8 1309 100.0 Soufriere 784 73.1 289 26.9 1073 100.0 Choiseul 465 68.4 215 31.6 680 100.0 Laborie 719 86.3 114 13.7 832 100.0 Vieux-Fort 1124 82.3 241 17.7 1365 100.0 Micoud 1787 80.0 447 20.0 2234 100.0 Dennery 885 85.7 148 14.3 1033 100.0 Gros-Islet 1510 83.0 310 17.0 1819 100.0 Total 12977 81.6 2928 18.4 15905 100.0

DRAFT REPORT: Volume III - Quantitative Assessment of Poverty in St. Lucia 15
Table 2.10: Distribution of Poor Persons in the Labour Force by Parish according to Employment Status and Sex
Employment Status
Employed Unemployed Total District N % N % N %
MALE Castries City 399 4.7 - - 399 4.1 Castries Sub-Urban 2604 30.6 453 36.4 3057 31.3 Anse-La-Raye 800 9.4 - - 800 8.2 Soufriere 578 6.8 165 13.3 743 7.6 Choiseul 179 2.1 107 8.6 286 2.9 Laborie 454 5.3 - - 454 4.7 Vieux-Fort 683 8.0 161 12.9 843 8.6 Micoud 1340 15.7 203 16.3 1543 15.8 Dennery 590 6.9 - - 590 6.0 Gros-Islet 890 10.5 155 12.4 1045 10.7 Total 8517 100.0 1244 100.0 9761 100.0
FEMALE Castries City 182 4.1 73 4.3 254 4.1 Castries Sub-Urban 1245 27.9 604 35.9 1849 30.1 Anse-La-Raye 473 10.6 36 2.2 509 8.3 Soufriere 206 4.6 124 7.4 330 5.4 Choiseul 286 6.4 107 6.4 393 6.4 Laborie 265 5.9 114 6.7 378 6.2 Vieux-Fort 442 9.9 80 4.8 522 8.5 Micoud 447 10.0 244 14.5 690 11.2 Dennery 295 6.6 148 8.8 443 7.2 Gros-Islet 619 13.9 155 9.2 774 12.6 Total 4460 100.0 1684 100.0 6144 100.0
BOTH SEXES Castries City 581 4.5 73 2.5 654 4.1 Castries Sub-Urban 3849 29.7 1057 36.1 4906 30.8 Anse-La-Raye 1272 9.8 36 1.2 1309 8.2 Soufriere 784 6.0 289 9.9 1073 6.7 Choiseul 465 3.6 215 7.3 680 4.3 Laborie 719 5.5 114 3.9 832 5.2 Vieux-Fort 1124 8.7 241 8.2 1365 8.6 Micoud 1787 13.8 447 15.3 2234 14.0 Dennery 885 6.8 148 5.0 1033 6.5 Gros-Islet 1510 11.6 310 10.6 1819 11.4 Total 12977 100.0 2928 100.0 15905 100.0

DRAFT REPORT: Volume III - Quantitative Assessment of Poverty in St. Lucia 16
33..00 PPOOVVEERRTTYY BBYY FFUUNNCCTTIIOONNAALL SSUUBB--
PPOOPPUULLAATTIIOONNSS AANNDD DDIISSTTRRIICCTT 3.1 CHILDREN Table 3.1 shows that the largest proportion of children aged 0-14, who have been classified as indigent live in Micoud (32.9%); relatively large concentrations of indigence, within this age group, were also observed in Anse La Raye (26.8%) and Vieux Fort (19.5%). Castries Sub-Urban, which accounted for 30.4 per cent of all children, registered a high concentration of all non-indigent poor (24.2%) and vulnerable (33.8%) children. Disproportionately large concentrations of non-indigent poor children were found in Micoud (14.4%), Anse-La Raye (10.6%), Soufriere (11.3%) and Dennery (10.3%).
Table 3.1: Percentage Distribution of Children Aged 0-14 years by
District according to Socio Economic Status
Socio-Economic Status
Indigent Poor But Not
Indigent Vulnerable Non Poor Total District % % % % % Castries City 11.8 3.6 12.6 10.7 8.6 Castries Sub-Urban 6.1 24.2 33.8 35.1 30.4 Anse-La-Raye 26.5 10.6 11.0 2.9 7.6 Soufriere - 11.3 2.8 4.8 6.5 Choiseul - 4.8 1.2 3.0 3.2 Laborie - 7.1 1.3 3.0 4.0 Vieux-Fort 19.5 4.4 8.5 10.0 8.1 Micoud 32.9 14.4 9.1 10.1 12.0 Dennery - 10.3 11.1 7.5 9.0 Gros-Islet 3.2 9.2 8.7 12.9 10.6 Total 1234
(100.0) 17158 (100.0)
8940 (100.0)
22495 (100.0)
49826 (100.0)
3.2 WOMEN With regard to females 15 years and over, Table 3.2 shows that Micoud (27.5%), Vieux Fort (21.8%) and Sub-Urban Castries (15.3%) have the largest proportions of females who were classified as indigent poor in St. Lucia. With respect to those females who were classified as non-indigent poor, the largest proportions were observed in Sub-Urban Castries (23.2%), Micoud (15.9%) and Gros Islet (12.2%). Disproportionately high proportions of the non-indigent poor females were also found to be living in Anse La Raye (9.3%), Laborie (7.3%) and

DRAFT REPORT: Volume III - Quantitative Assessment of Poverty in St. Lucia 17
Dennery (7.6%). According to Table 3.2, over one half (56.2%) of the female population aged 15 years and over were estimated to have been living in urban areas such as the City of Castries, Sub-Urban Castries and Gros Islet. Whether in the context of the indigent poor, the non-indigent poor or the vulnerable, the spatial distributions observed among females aged 15 years and over are consistent with those observed among children under 14 years and thus, indicative of the co-existence of children and adult females living within specific districts in circumstances where their social and economic well being is either impaired or under threat from external shocks.
Table 3.2: Percentage Distribution of Females Aged 15 years and over by District according to Socio Economic Status
Socio-Economic Status
Indigent Poor But Not
Indigent Vulnerable Non Poor Total District % % % % % Castries City 9.9 5.2 16.6 13.1 11.8 Castries Sub-Urban 15.3 23.2 30.1 35.4 31.6 Anse-La-Raye 14.7 9.3 8.1 3.0 5.4 Soufriere 5.5 6.8 5.3 4.7 5.3 Choiseul - 5.6 2.7 2.8 3.4 Laborie - 7.3 4.4 3.8 4.6 Vieux-Fort 21.8 6.9 7.3 9.3 8.6 Micoud 27.5 15.9 7.8 8.1 10.1 Dennery - 7.6 6.3 6.2 6.5 Gros-Islet 5.3 12.2 11.5 13.5 12.8 Total 739
(100.0) 14009
(100.0) 9405 (100.0)
36962 (100.0)
61114 (100.0)
3.3 MEN Some attention ought to be paid to the socio-economic status of males aged 15 years and over in Vieux Fort. However, with respect to entire population of males who were aged 15 years and over and among the indigent poor, Table 3.3 shows that the largest concentration was estimated to be in Vieux Fort (40.3%) being more than twice as large when compared with concentrations in any of the other districts. Though lower, concentrations of similar magnitudes were observed in Micoud (17.5%), Sub-Urban Castries (16.2%) and Anse La Raye (15.6%). In the remaining districts, the concentrations of indigence did not appear to be as profound. With respect to those males who were classified as non-indigent poor, the largest proportion was observed in Sub-Urban Castries (26.8%). Notably high proportions were observed in Micoud (17.8%) and Gros Islet (12.4%) and to a somewhat lesser extent in Dennery (9.2%) and Soufriere (7.5%). In the context of males aged 15 years and over who were deemed to be vulnerable, the largest concentrations were observed in the two most highly populated districts, namely, Sub-

DRAFT REPORT: Volume III - Quantitative Assessment of Poverty in St. Lucia 18
Urban Castries (32.6%) and Gros Islet (13.5%). Though notably high in Micoud (9.7%), the disproportionately high concentration in Anse La Raye (11.3%) is worthy of attention.
Table 3.3: Percentage Distribution of Males Aged 15 years and over by District according to Socio Economic Status
Socio-Economic Status
Indigent Poor But Not
Indigent Vulnerable Non Poor Total District % % % % % Castries City 10.5 4.0 9.6 11.9 9.5 Castries Sub-Urban 16.2 26.8 32.6 32.7 30.9 Anse-La-Raye 15.6 6.9 11.3 3.8 5.9 Soufriere - 7.5 4.0 4.8 5.3 Choiseul - 3.4 2.1 3.4 3.2 Laborie - 5.8 3.2 4.1 4.4 Vieux-Fort 40.3 6.2 8.7 9.5 8.9 Micoud 17.5 17.8 9.7 8.2 11.0 Dennery - 9.2 5.3 6.0 6.6 Gros-Islet - 12.4 13.5 15.5 14.2 Total 698
(100.0) 13679
(100.0) 8335
(100.0) 31189 (100.0)
53901 (100.0)
3.4 ELDERLY PERSONS Based upon estimates derived from the survey results for elderly persons aged 65 years and over in St. Lucia, Table 3.4 reveals that Vieux Fort and the City of Castries were the two districts that ought to be focus of attention with regard to interventions targeting the indigent poor among the elderly. When examined in the context of individuals’ sex, elderly males in Vieux Fort appeared to be the principal targets of such interventions whereas, in the case of elderly females, similar treatment ought to be meted out in the City of Castries. Being the district with the largest population, it was not surprising that one of the higher concentrations among the non-indigent poor elderly persons was observed in Sub-Urban Castries (15.1%). However, it is worth stating that notable and disproportionately large numbers were classified as non-indigent poor in Micoud (17.6%) and Gros Islet (24.5%). Some attention ought to be directed to disproportionately large numbers in Vieux Fort (9.4%), Dennery (8.6%) and Laborie (7.6%) among non-indigent poor elderly persons. With respect to vulnerable elderly persons, high concentrations were primarily an urban phenomenon that was evident in Sub-Urban Castries (23.5%) and Gros Islet (22.4%). Taking the sex of elderly persons classified a non-indigent poor into account, the spatial distribution among the male and the female populations was observed to be similar to that observed in the context of the entire population of non-indigent poor elderly persons with Gros

DRAFT REPORT: Volume III - Quantitative Assessment of Poverty in St. Lucia 19
Islet and Micoud being districts found to have among the largest concentrations of elderly persons on the island. It is worth noting however that the high concentration of elderly persons in Sub-Urban Castries was due principally to the high concentrations that were evident among the female elderly population rather than among their male counterparts. In terms of vulnerable elderly persons, the observed urban bias persisted in districts such as Sub-Urban Castries and Gros Islet across the sexes.
Table 3.4: Distribution of Elderly Persons 65 years and over by District and Socio Economic Status according to Sex
Socio-Economic Status
Indigent Poor But Not
Indigent Vulnerable Non Poor Total District % % % % % Elderly Females
Castries City 100.0 6.8 5.6 14.2 12.0 Castries Sub-Urban - 18.8 29.0 32.0 29.1 Anse-La-Raye - 4.5 2.8 2.4 2.8 Soufriere - 2.5 6.4 6.1 5.4 Choiseul - 4.5 5.5 2.3 3.1 Laborie - 7.1 8.8 6.1 6.7 Vieux-Fort - 7.5 6.1 4.6 5.3 Micoud - 15.2 9.4 9.9 10.7 Dennery - 6.9 5.7 6.0 6.1 Gros-Islet - 26.4 20.8 16.4 18.7 Total 36
(100.0) 1610 (100.0)
1301 (100.0)
6138 (100.0)
9086 (100.0)
Elderly Males Castries City - 2.6 7.7 10.1 8.2 Castries Sub-Urban - 10.8 15.9 30.7 24.6 Anse-La-Raye - 2.6 11.5 2.3 3.6 Soufriere - 6.0 - 9.7 7.6 Choiseul - 5.2 7.6 3.1 4.1 Laborie - 8.2 8.0 6.5 7.0 Vieux-Fort 100.0 11.6 8.4 7.7 9.1 Micoud - 20.4 8.6 5.2 8.6 Dennery - 10.6 7.8 6.3 7.3 Gros-Islet - 22.3 24.5 18.3 19.8 Total 40
(100.0) 1393 (100.0)
947 (100.0)
4667 (100.0)
7048 (100.0)

DRAFT REPORT: Volume III - Quantitative Assessment of Poverty in St. Lucia 20
Table 3.4: Distribution of Elderly Persons 65 years and over by District and Socio Economic Status according to Sex (Continued)
Socio-Economic Status
Indigent Poor But Not
Indigent Vulnerable Non Poor Total District % % % % % Castries City 47.4 4.8 6.5 12.4 10.4 Castries Sub-Urban - 15.1 23.5 31.4 27.1 Anse-La-Raye - 3.6 6.5 2.4 3.2 Soufriere - 4.1 3.7 7.6 6.4 Choiseul - 4.8 6.4 2.6 3.5 Laborie - 7.6 8.4 6.3 6.8 Vieux-Fort 52.6 9.4 7.2 6.0 7.0 Micoud - 17.6 9.0 7.9 9.8 Dennery - 8.6 6.6 6.1 6.6 Gros-Islet - 24.5 22.4 17.2 19.2 Total 76
(100.0) 3004 (100.0)
2248 (100.0)
10805 (100.0)
16133 (100.0)
3.5 YOUTH According to Table 3.5, the largest proportions of young persons aged 15-24 years and classified as indigent poor were observed in Vieux Fort (42.3%) and Micoud (34.1%). This pattern persisted across the sexes though it is worth stating that noteworthy levels of indigence appeared to be characteristic of young females in Anse La Raye (15.3%). With respect to non-indigent young persons, the highest concentrations were observed in Sub-Urban Castries (22.1%) and Micoud (16.9%). Though lower, notable concentrations of similar magnitudes were observed in Gros Islet (11.6%) and Anse La Raye (10.9%). Districts such as Choiseul and Laborie were observed to have had disproportionately large concentrations among non-indigent young persons (3.8% and 6.4% respectively). With respect to non-indigent young males, the highest concentrations were also observed in Sub-Urban Castries (25.0%) and Micoud (16.3%). Though lower, notable concentrations were also observed in Gros Islet (14.0%) and Dennery (12.8%), the latter being disproportionately high. For non-indigent young females, a similar pattern emerged with the highest concentrations being observed in Sub-Urban Castries (18.9%) and Micoud (17.5%). It is worth noting that Anse La Raye had disproportionately high concentrations of non-indigent young females, an outcome that is consistent with that observed among indigent young females. As in the case of other age-based sub-populations, larger concentrations among vulnerable young persons were evident in urban districts such as the City of Castries, Sub-Urban Castries and Gros Islet though some concern ought to focus on the observed levels of prevalence in rural districts such as Micoud and Anse La Raye. While a similar pattern prevails among young vulnerable males, the pattern that emerges among their female counterparts is similar except that a higher prevalence is evident in Vieux Fort than in Micoud.

DRAFT REPORT: Volume III - Quantitative Assessment of Poverty in St. Lucia 21
Table 3.5: Distribution of Young Persons Aged 15-24 years by District and Socio Economic Status according to Sex
Socio-Economic Status
Indigent Poor But Not
Indigent Vulnerable Non Poor Total District % % % % % All Young Persons
Castries City - 5.0 18.7 12.1 10.9 Castries Sub-Urban 15.8 22.1 25.2 33.9 28.5 Anse-La-Raye 7.6 10.9 11.1 4.3 7.5 Soufriere - 6.6 5.5 4.9 5.4 Choiseul - 3.8 2.0 2.1 2.6 Laborie - 6.4 2.9 3.2 4.1 Vieux-Fort 42.3 6.9 9.2 13.4 11.1 Micoud 34.1 16.9 10.1 11.4 13.2 Dennery - 9.8 3.5 6.8 7.0 Gros-Islet - 11.6 11.8 7.9 9.6 Total 475
(100.0) 9380 (100.0)
5244 (100.0)
15260 (100.0)
30360 (100.0)
Young Males Castries City - 4.4 12.2 10.1 8.4 Castries Sub-Urban 15.9 25.0 28.2 29.3 27.5 Anse-La-Raye - 8.0 10.9 5.6 7.2 Soufriere - 5.8 4.6 4.6 4.9 Choiseul - 2.9 1.3 3.0 2.6 Laborie - 5.3 2.8 4.7 4.5 Vieux-Fort 50.2 5.6 10.5 12.8 10.6 Micoud 33.9 16.3 13.6 13.0 14.5 Dennery - 12.6 1.4 5.1 6.8 Gros-Islet - 14.0 14.5 11.8 12.8 Total 239
(100.0) 4977 (100.0)
2678 (100.0)
7203 (100.0)
15098 (100.0)
Young Females Castries City - 5.8 25.5 14.0 13.3 Castries Sub-Urban 16.1 18.9 22.1 37.9 29.4 Anse-La-Raye 15.3 14.0 11.3 3.2 7.9 Soufriere - 7.5 6.4 5.1 5.9 Choiseul - 4.9 2.8 1.3 2.6 Laborie - 7.7 3.0 1.9 3.7 Vieux-Fort 33.9 8.2 7.8 14.0 11.6 Micoud 34.3 17.5 6.3 10.1 12.0 Dennery - 6.7 5.8 8.2 7.2 Gros-Islet 0.4 8.8 9.0 4.3 6.3 Total 236
(100.0) 4403 (100.0)
2566 (100.0)
8057 (100.0)
15262 (100.0)

DRAFT REPORT: Volume III - Quantitative Assessment of Poverty in St. Lucia 22
44..00 CCHHAARRAACCTTEERRIISSTTIICCSS OOFF TTHHEE PPOOOORR 4.1 AGE OF INDIVIDUALS Despite variations, there is ample evidence suggesting that poverty is characteristic of the lives of all persons irrespective of age, in a given country. According to Table 4.1, an examination of the pattern exhibited according to five-year age groups reveals that the poor consists primarily of children under 14 years (almost 39% collectively) and teenagers (just over 29% collectively). Compared to the national population, larger proportions were found in these age groups among the poor. This might be explained by a dependency phenomenon fueled by the need for larger families including extended family arrangements as means of coping with the vicissitudes associated with poverty and further bolstered within a culture that is associated with higher levels of fertility among women folk. Table 4.1: Distribution of Population by Five-Year Age Group according to Socio-Economic Status
Socio Economic Status
Poor Non Poor Total Age Group N % N % N % 0-4 3844 8.1 8763 7.5 12607 7.6 5-9 6624 13.9 10286 8.8 16910 10.3 10-14 7923 16.7 12387 10.6 20310 12.3 15-19 5932 12.5 11404 9.7 17336 10.5 20-24 3923 8.3 9100 7.8 13023 7.9 25-29 2642 5.6 7713 6.6 10355 6.3 30-34 2153 4.5 8027 6.8 10180 6.2 35-39 3063 6.4 8776 7.5 11839 7.2 40-44 2951 6.2 7917 6.7 10867 6.6 45-49 1912 4.0 6584 5.6 8496 5.2 50-54 1271 2.7 4892 4.2 6163 3.7 55-59 1077 2.3 4527 3.9 5604 3.4 60-64 1121 2.4 3898 3.3 5018 3.0 65+ 3080 6.5 13053 11.1 16133 9.8 Total 47516 100.0 117326 100.0 164842 100.0 Relatively greater proportions in excess of 6.0% have been observed for persons aged 35-39 years, 40-44 years and 65 years and over. This might be indicative of the age profile of persons bearing the responsibility for large families consisting of poor persons. In the case of persons aged 65 years and over, some consideration may have to be given to the impact of their living arrangements on their socio-economic well being. This arises due to the fact that such persons
DRAFT REPORT: Volume III - Quantitative Assessment of Poverty in St. Lucia 23
have a greater prospect of living in extended family settings that threaten individual well being or living alone without adequate means of sustenance. 4.2 SEX OF INDIVIDUALS The demographics of poverty tend to be revealing of important differences within the population. Of the 28.8 per cent of the population living below the poverty line in 2005/06, 51.3 per cent were male and 48.7 per cent were female. This amounts to a fairly even balance of poverty between the sexes, although it does not tell us of the situation regarding men and women. Of the 28.8 per cent of the population living below the poverty line 51.3 per cent were female and 49.7 per cent were male. This reflects the distribution of females and males in the total population (52% and 48% respectively) and amounts to a fairly even balance of poverty between the sexes, although it does not tell us of the situation regarding specific age groups. When the data are broken down by age groups it emerges that in the 0-19 (poor) age group the sexes are distributed in the same proportions as in the general population. However, in the 20-64 age groups the position is reversed with women constituting 52 per cent of the age category. There is, therefore, a greater likelihood that poor persons above the age of 20 will be female than male. However, there is a greater likelihood that a poor child will be male rather than female (p=.000). The greater preponderance of females among the poor 20-64 age grouping probably has a demographic rather than a socioeconomic basis, since the ratio reversal among adults is evident in the non-poor population as well. Still, the greater preponderance of females among the poor adult population ought to be reflected in policy formulation for poverty eradication. In this regard, as will be demonstrated by the qualitative data, special burdens borne by chronically poor women are related to the responsibilities associated with their gender. Thus, for example, their responsibilities relating to reproduction and nurturing creates limitations for them in regard to their ability to participate in the job market. This seems to present a case for policy targeted at young girls in poverty to help them avoid fertility behaviour that acts as a mechanism of transference of poverty across the generations. Based upon Table 4.2 a total of 48% of St. Lucia’s population were male and indicative of a national sex ratio of 92.3 males per 100 females. When compared to the national population, it is worth noting that males were over-represented among the poor. For example, 52% of the indigent poor and 51.3% of the non-indigent poor were estimated to be males. In St. Lucia, sex ratios at birth have traditionally favoured male births to the extent that the higher prevalence of poverty among males could be a function of larger juvenile male cohorts having exposure to poverty in childhood and as teenagers when compared to their female counterparts. As such, it should not be surprising that higher sex ratios are evident among the indigent and non-indigent poor being 108.3 and 105.3 males per 100 females respectively. This could be further compounded insofar as a higher proportion of elderly males is likely to be among the ranks of the poor when compared to elderly females. This could be explained by life time choices of some elderly men who live below subsistence level devoid of care and support from their children and significant others.

DRAFT REPORT: Volume III - Quantitative Assessment of Poverty in St. Lucia 24
Table 4.2: Distribution of Population by Sex according to Socio-Economic Status
Socio-Economic Status Total
Indigent Poor But Not Indigent Vulnerable Non Poor Sex
N % N % N % N % N %
Male 1389 52.0 22998 51.3 12582 47.2 42187 46.5 79157 48.0 Female 1281 48.0 21847 48.7 14098 52.8 48459 53.5 85685 52.0 Total 2670 100.0 44845 100.0 26680 100.0 90646 100.0 164842 100.0 4.3 ETHNIC CHARACTERISTICS OF INDIVIDUALS On examining Table 4.3, a vast majority of almost 86.0% of St. Lucia’s population were of African descent. Much smaller proportions were Mixed (9.3%) or of East Indian descent (2.8%). Each of the other groups such as Amerindians, Caucasians, Syrian/Lebanese and Chinese accounted for less than 1.0% of the islands population. Given the distribution of St. Lucia’s population by ethnic characteristics, it should not be surprising that a similar pattern emerges among the indigent and non-indigent poor except that the population of African descent and to a somewhat lesser extent, that of East Indian descent were observed to be over-represented among the indigent and non-indigent poor.
Table 4.3: Distribution of Population by Ethnicity according to Socio-Economic Status
Socio-Economic Status
Indigent Poor But Not
Indigent Vulnerable Non Poor Total
Ethnicity N % N % N % N % N % African Descent/Negro/Black 2509 94.0 40639 90.6 23393 87.7 74441 82.1 140982 85.5 Indigenous People (Amerindian/Carib)
- - 39 .1 36 .1 1474 1.6 1548 .9
East Indian 80 3.0 1410 3.1 873 3.3 2197 2.4 4560 2.8 Chinese/Asian - - - - - - 39 .0 39 .0 Syrian/Lebanese - - - - - - 423 .5 423 .3 White/Caucasian - - - - - - 877 1.0 877 .5 Mixed 80 3.0 2387 5.3 2193 8.2 10675 11.8 15335 9.3 Other - - - - 73 .3 39 .0 111 .1 Don't know/Not Stated - - 371 .8 113 .4 482 .5 967 .6 Total 2670 100.0 44845 100.0 26680 100.0 90646 100.0 164842 100.0

DRAFT REPORT: Volume III - Quantitative Assessment of Poverty in St. Lucia 25
4.5 HEAD OF HOUSEHOLD This discussion examines the characteristics of poor household heads as opposed to individuals. It focuses specifically on household heads in the context of characteristics such as such as age, sex, educational attainment, employment status and occupation. 4.5.1 Age of Head Table 4.4 shows that the overall age distribution of household heads does not change despite differences in their socio-economic status. In general, the majority of household heads are 65 years and over, an outcome that is likely to be associated with the prevalence of elderly persons among individuals living alone. Among poor households, as much as 21.5% of household heads were 65 years and over. Despite consistency in the age distribution of household heads irrespective of their socio-economic status, it is worthwhile to highlight those age groups that account for notably larger concentrations among the poor heads when compared to non-poor heads. This is the case among poor heads aged 10-14 years, 15-19 years, 20-24 years and especially those aged 40-44 years. This has implications for targeting specific sets of household headed by young persons and juveniles for when mounting poverty alleviation and reduction programmes.
Table 4.4: Distribution of Household Heads by Age Group according to Socioeconomic Status
Socio Economic Status Poor Non Poor
Total Age Group
N % N % N % 10-14 113 1.1 153 .4 266 .6 15-19 78 .8 121 .3 199 .4 20-24 227 2.3 727 2.0 954 2.1 25-29 536 5.3 1963 5.4 2500 5.4 30-34 613 6.1 2882 7.9 3494 7.5 35-39 1224 12.2 4378 12.1 5602 12.1 40-44 1695 16.9 4580 12.6 6274 13.5 45-49 1002 10.0 4338 12.0 5340 11.5 50-54 802 8.0 2878 7.9 3679 7.9 55-59 770 7.7 3066 8.4 3836 8.3 60-64 813 8.1 2326 6.4 3139 6.8 65+ 2154 21.5 8878 24.5 11032 23.8 Total 10025 100.0 36290 100.0 46315 100.0

DRAFT REPORT: Volume III - Quantitative Assessment of Poverty in St. Lucia 26
4.5.2 Sex of Head According to Table 4.5, the sex composition of household heads is indicative of a preponderance of male heads irrespective of socio-economic status. Interestingly, the sex composition in the case of poor and non-poor households is virtually identical suggesting that in poor households, the observed preponderance of male heads persists to the extent that 57.4% of household heads un poor households have been estimated to be male.
Table 4.5: Distribution of Household Heads by Sex according to Socioeconomic Status
Socio Economic Status Poor Non Poor
Total Sex
N % N % N % Male 5756 57.4 20377 56.2 26133 56.4 Female 4269 42.6 15913 43.8 20182 43.6 Total 10025 100.0 36290 100.0 46315 100.0
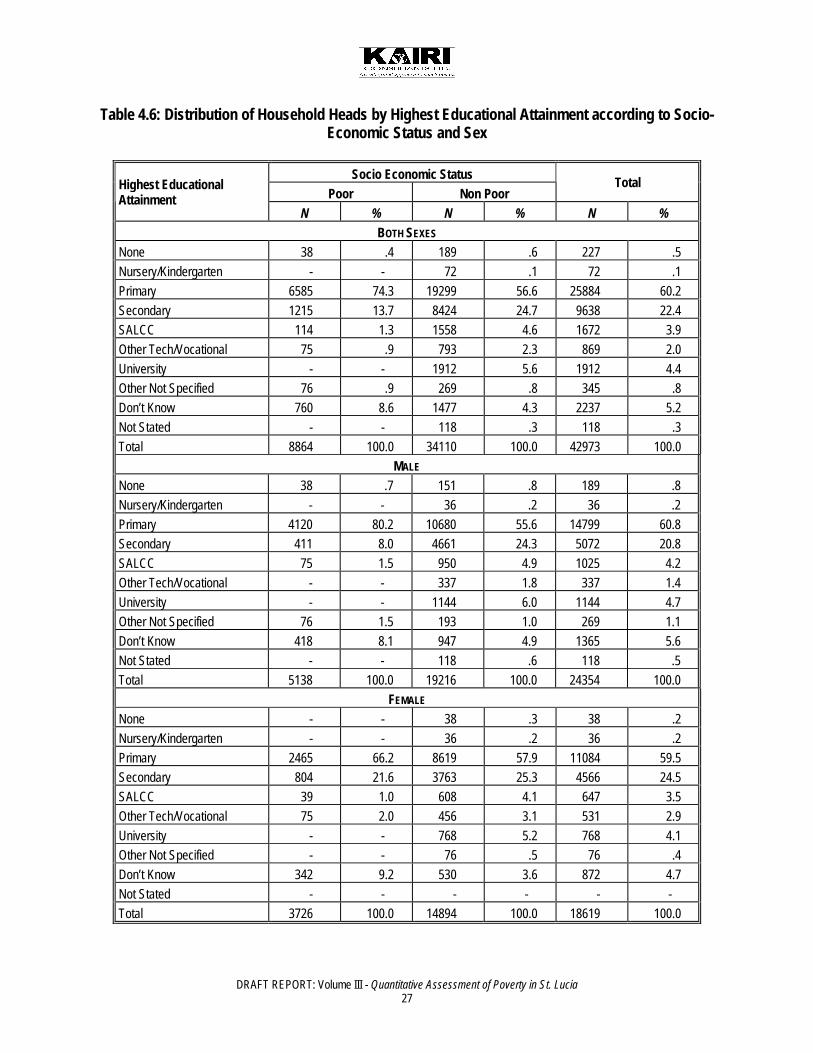
4.5.3 Educational Attainment of Head Table 4.6 examines variations in the educational attainment of household heads according to socio-economic status of sex. In St. Lucia, the majority (approximately 60.0%) of household heads were estimated to have attained a maximum of primary education. This was the case irrespective of sex with the respective estimated proportions for male and female heads being 60.8% and 59.5%. While a maximum of about 22.2% of household heads attained secondary education, just about 4.0% had attained a maximum of a university level education. Interestingly, the observed pattern remained virtually unchanged irrespective of the sex of household heads.
DRAFT REPORT: Volume III - Quantitative Assessment of Poverty in St. Lucia 27
Table 4.6: Distribution of Household Heads by Highest Educational Attainment according to Socio-Economic Status and Sex
Socio Economic Status
Poor Non Poor Total Highest Educational
Attainment N % N % N %
BOTH SEXES None 38 .4 189 .6 227 .5 Nursery/Kindergarten - - 72 .1 72 .1 Primary 6585 74.3 19299 56.6 25884 60.2 Secondary 1215 13.7 8424 24.7 9638 22.4 SALCC 114 1.3 1558 4.6 1672 3.9 Other Tech/Vocational 75 .9 793 2.3 869 2.0 University - - 1912 5.6 1912 4.4 Other Not Specified 76 .9 269 .8 345 .8 Don’t Know 760 8.6 1477 4.3 2237 5.2 Not Stated - - 118 .3 118 .3 Total 8864 100.0 34110 100.0 42973 100.0
MALE None 38 .7 151 .8 189 .8 Nursery/Kindergarten - - 36 .2 36 .2 Primary 4120 80.2 10680 55.6 14799 60.8 Secondary 411 8.0 4661 24.3 5072 20.8 SALCC 75 1.5 950 4.9 1025 4.2 Other Tech/Vocational - - 337 1.8 337 1.4 University - - 1144 6.0 1144 4.7 Other Not Specified 76 1.5 193 1.0 269 1.1 Don’t Know 418 8.1 947 4.9 1365 5.6 Not Stated - - 118 .6 118 .5 Total 5138 100.0 19216 100.0 24354 100.0
FEMALE None - - 38 .3 38 .2 Nursery/Kindergarten - - 36 .2 36 .2 Primary 2465 66.2 8619 57.9 11084 59.5 Secondary 804 21.6 3763 25.3 4566 24.5 SALCC 39 1.0 608 4.1 647 3.5 Other Tech/Vocational 75 2.0 456 3.1 531 2.9 University - - 768 5.2 768 4.1 Other Not Specified - - 76 .5 76 .4 Don’t Know 342 9.2 530 3.6 872 4.7 Not Stated - - - - - - Total 3726 100.0 14894 100.0 18619 100.0

DRAFT REPORT: Volume III - Quantitative Assessment of Poverty in St. Lucia 28
Table 4.6 shows the predominance of primary education as the highest level attained by household heads irrespective of their socio-economic status. Moreover, it shows that poor household heads were much more likely to have attained a maximum of a primary education and less likely to have attained higher levels when compared to their non-poor counterparts. When the sex of household heads is taken into account, this pattern persists especially among male heads for whom it was much more pronounced. In the case of female heads however, sex differentials in educational attainment across socio-economic status were observed but were not as pronounced as in the case of their male counterparts. The difference in the proportions of poor and non-poor female household heads attaining a maximum of secondary education was 3.7 percentage points. The corresponding difference for male heads was 16.3 percentage points. This implies that despite attaining secondary level education, greater proportions of females rather than males end up being the heads of households that may be unable to sustain the well being of its members. Accordingly, the answers to such outcomes may lie in socio-structural arrangements that preclude the fuller participation of some females in labour market activities and restrain specific cross-sections who end up engaging in activities that neither redounds to their material well being nor that of their families. 4.5.4 Employment Status of Head Table 4.7 permits an examination of the relationship between labour force participation, socio-economic status and sex of household heads. Overall, 66.1% of all household heads actively participated in the labour force. Moreover, substantially higher levels of participation were observed among male household heads than among female heads being estimated to be 75.8% and 53.6% respectively. Nevertheless, there were greater rates of participation than non-participation irrespective of the sex of household heads. Among poor heads of households, however, Table 4.7 shows lower levels of participation in the labour force when compared to participation rates observed for all household heads (59.1% as opposed to 66.1%). Upon taking the sex of household heads into account, a greater proportion among male heads appears to have participated than to have not participated in the labour force. Among female heads, however, the situation is reversed with a lower proportion claiming to have participated than to have not participated in the labour force. While 73.7% of poor male household heads participated in the labor force, the corresponding proportion among females was 39.4%. This suggests that poor male heads would have had greater prospects than their female counterparts of obtaining income through employment either because the former were employed or may have exposed themselves to prospects of obtaining work. It also suggests that poor female household heads may have to be more creative in developing coping strategies to obtain income from sources other than employment. There might also be a host of structural and cultural factors that preclude greater participation in the labour force among poor female heads of households.
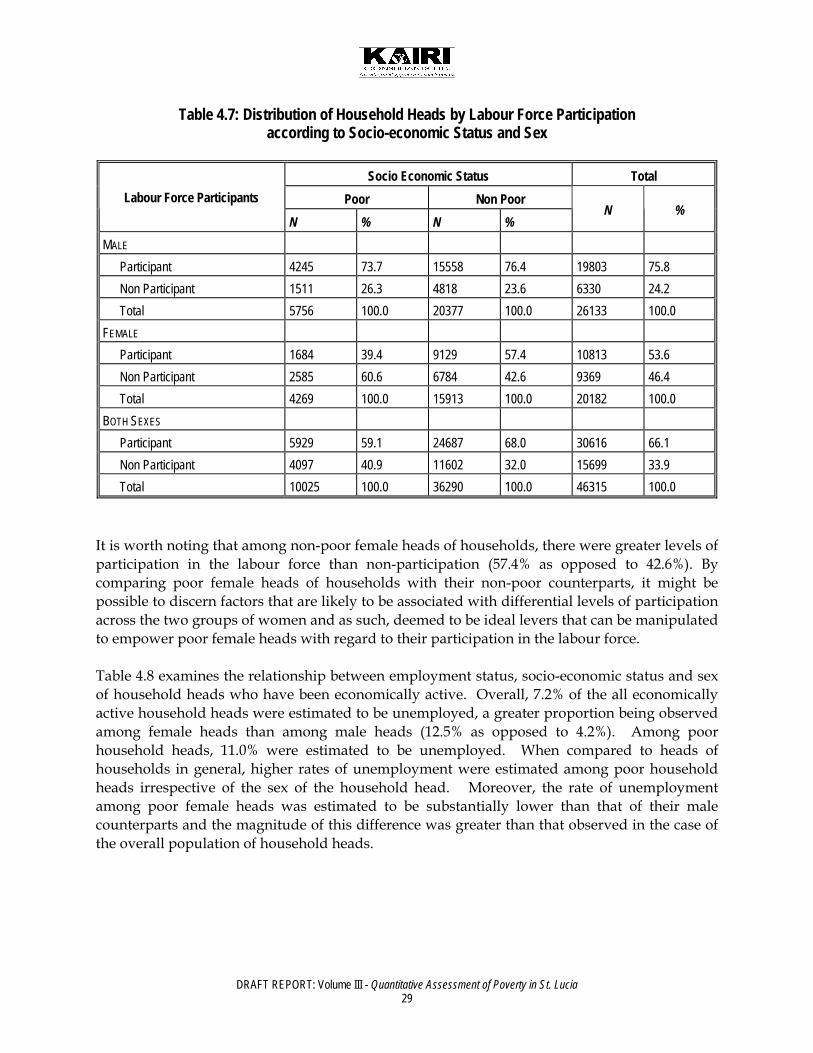
DRAFT REPORT: Volume III - Quantitative Assessment of Poverty in St. Lucia 29
Table 4.7: Distribution of Household Heads by Labour Force Participation according to Socio-economic Status and Sex
Socio Economic Status Total
Poor Non Poor Labour Force Participants
N % N % N %
MALE Participant 4245 73.7 15558 76.4 19803 75.8 Non Participant 1511 26.3 4818 23.6 6330 24.2 Total 5756 100.0 20377 100.0 26133 100.0
FEMALE Participant 1684 39.4 9129 57.4 10813 53.6 Non Participant 2585 60.6 6784 42.6 9369 46.4 Total 4269 100.0 15913 100.0 20182 100.0
BOTH SEXES Participant 5929 59.1 24687 68.0 30616 66.1 Non Participant 4097 40.9 11602 32.0 15699 33.9 Total 10025 100.0 36290 100.0 46315 100.0
It is worth noting that among non-poor female heads of households, there were greater levels of participation in the labour force than non-participation (57.4% as opposed to 42.6%). By comparing poor female heads of households with their non-poor counterparts, it might be possible to discern factors that are likely to be associated with differential levels of participation across the two groups of women and as such, deemed to be ideal levers that can be manipulated to empower poor female heads with regard to their participation in the labour force. Table 4.8 examines the relationship between employment status, socio-economic status and sex of household heads who have been economically active. Overall, 7.2% of the all economically active household heads were estimated to be unemployed, a greater proportion being observed among female heads than among male heads (12.5% as opposed to 4.2%). Among poor household heads, 11.0% were estimated to be unemployed. When compared to heads of households in general, higher rates of unemployment were estimated among poor household heads irrespective of the sex of the household head. Moreover, the rate of unemployment among poor female heads was estimated to be substantially lower than that of their male counterparts and the magnitude of this difference was greater than that observed in the case of the overall population of household heads.

DRAFT REPORT: Volume III - Quantitative Assessment of Poverty in St. Lucia 30
Table 4.8: Distribution of Household Heads in the Labour Force by Employment Status according to Socioeconomic Status and Sex
Socio Economic Status Total
Poor Non Poor Employment Status
N % N % N %
MALE Employed 3935 92.7 15026 96.6 18961 95.8 Unemployed 309 7.3 532 3.4 842 4.2 Total 4245 100.0 15558 100.0 19803 100.0
FEMALE Employed 1341 79.6 8117 88.9 9458 87.5 Unemployed 343 20.4 1012 11.1 1355 12.5 Total 1684 100.0 9129 100.0 10813 100.0
BOTH SEXES Employed 5276 89.0 23143 93.7 28419 92.8 Unemployed 652 11.0 1544 6.3 2196 7.2 Total 5929 100.0 24687 100.0 30616 100.0
These findings reinforce earlier statements suggesting that poor male should have greater prospects than their female counterparts of obtaining income through employment and the need for greater creativity on the part of poor female heads to obtain income from alternative sources. Apart from social and biographical characteristics that may have differential impact upon the economic activity of household heads across socio-economic status, one needs to consider a host of structural and cultural factors that may have implications for gender stereotyping, gender discrimination and other artifacts of gender relations. These would have to be systematically studied to determine their impact upon differential outcomes with regard to outcomes associated with the economic activity across and within sex groups taking into account variations in the socio-economic status of household heads. 4.6 OCCUPATION Table 4.9 addresses the relationship between occupation, socio-economic status and sex of household heads. Overall, the majority of heads who declared having a job were engaged in work related to sales and services. The respective proportions for males, females and all heads were 8.8%, 7.0% and 8.0% indicating that the same pattern persisted across the sexes. Among male heads, work related to craft activities and skilled agricultural pursuits appeared to be popular and were reported by respective proportions of 7.3% and 6.0% of the all household heads. Among female heads, work related to craft activities and elementary tasks appeared to be popular and were reported by respective proportions of 4.5% and 4.3% of all heads.

DRAFT REPORT: Volume III - Quantitative Assessment of Poverty in St. Lucia 31
Table 4.9: Distribution of Household Heads in the Occupation according to Socioeconomic Status and Sex
Socio Economic Status
Poor Non Poor Total
Occupation N % N % N %
MALE Legislator/Manager 111 2.0 1333 6.6 1444 5.6 Professional 38 .7 689 3.4 726 2.8 Technical - - 494 2.4 494 1.9 Clerical - - 489 2.4 489 1.9 Services/Sales 344 6.1 1941 9.6 2286 8.8 Skilled/Agricultural 397 7.0 1149 5.7 1546 6.0 Craft 380 6.7 1522 7.5 1901 7.3 Machine Operator 77 1.4 722 3.6 799 3.1 Elementary 386 6.8 959 4.7 1346 5.2 Not Stated 3909 69.3 11002 54.2 14911 57.5 Total 5642 100.0 20300 100.0 25942 100.0
FEMALE Legislator/Manager 38 .9 309 2.0 347 1.7 Professional - - 683 4.3 683 3.4 Technical - - 263 1.7 263 1.3 Clerical - - 486 3.1 486 2.4 Services/Sales 304 7.2 1107 7.0 1411 7.0 Skilled/Agricultural 192 4.5 155 1.0 347 1.7 Craft 195 4.6 716 4.5 911 4.5 Machine Operator 80 1.9 116 .7 196 1.0 Elementary 150 3.5 719 4.6 870 4.3 Not Stated 3272 77.3 11246 71.2 14519 72.5 Total 4233 100.0 15800 100.0 20032 100.0
BOTH SEXES Legislator/Manager 149 1.5 1642 4.5 1791 3.9 Professional 38 .4 1371 3.8 1409 3.1 Technical - - 757 2.1 757 1.6 Clerical - - 974 2.7 974 2.1 Services/Sales 648 6.6 3048 8.4 3697 8.0 Skilled/Agricultural 589 6.0 1304 3.6 1893 4.1 Craft 575 5.8 2238 6.2 2813 6.1 Machine Operator 157 1.6 838 2.3 995 2.2 Elementary 537 5.4 1679 4.7 2215 4.8 Not Stated 7181 72.7 22248 61.6 29430 64.0 Total 9874 100.0 36100 100.0 45975 100.0

DRAFT REPORT: Volume III - Quantitative Assessment of Poverty in St. Lucia 32
Among all poor household heads, the pattern of occupational activities does not appear to be different from that observed for all heads of households insofar as the most dominant occupational pursuits appeared to be work related to sales and services, craft activities and skilled agricultural pursuits. While the three main occupational activities that were characteristic of all male heads persisted among poor male heads, their order of predominance was different. Specifically, work akin to skilled agricultural pursuits became the most popular activity among poor male heads followed by elementary occupations and craft-related work. To this end, the respective proportions engaged in such activities were 7.0%, 6.8% and 6.7%. Their pattern of occupational activity among poor female heads did not depart too far from that observed among all female heads as the former engaged primarily in work activities associated with sales and services and craft-related tasks, the respective proportions being 7.2% and 4.6%. For poor female household heads, however, there was a notable thrust in the direction of skilled agricultural activities as 4.5% reported engaging in such pursuits as opposed to 1.7% among all female heads. In sum, it appears as though poor male heads were primarily engaged in skilled agricultural work, elementary occupations and craft-related work. In contrast, female heads were primarily engaged in work akin to sales and services, craft-related work and skilled agricultural activities.

DRAFT REPORT: Volume III - Quantitative Assessment of Poverty in St. Lucia 33
55..00 EEDDUUCCAATTIIOONN AANNDD SSOOCCIIOO--EECCOONNOOMMIICC SSTTAATTUUSS
5.1 HIGHEST EXAMINATION Highest examination passed is analyzed for all individuals 15 years and over and has been reclassified to reflect the attainment of tertiary level qualifications “en masse” rather than at specific levels. For the purposes of these analyses, the attainment of tertiary level qualifications is consistent with the certification at different levels including A Level, Diploma, Associate Degree, Undergraduate Degree, Post Graduate Degree and Professional Qualification. Variations associated with lower levels of education have been retained and include None, School Leaving, CXC Basic, CXC 1-4 passes and CXC 5 or more passes. Provision has also been made for two residual categories that have been classified as Other and Not Stated. 5.1.1 Highest Examination Passed by Quintiles Table 5.1 shows that 51.4% of the population aged 15 years and over had no certification and that 10.0% had at least acquired tertiary level certification. Among the male population, 53.1% had attained no certification as opposed to a smaller proportion (49.7%) among the female population. With respect to tertiary certification, the situation was reversed as a higher proportion of the female population had at least acquired tertiary level certification when compared to the corresponding proportion among the male population, the respective proportions being estimated to be 10.4% and 9.7%. With respect to the attainment of different levels of certification at the secondary level, a similar pattern was observed among the male and female populations. Table 5.1 is indicative of a negative association between highest examination passed and per capita consumption quintile. For the population aged 15 years and over, the proportion with no certification decreased with progression to higher consumption quintiles so that while 69.0% of persons from the poorest quintile had attained no certification, a lower proportion amounting to 51.4% had attained no certification in the wealthiest quintile. For those persons who had attained tertiary level qualifications, the pattern was reversed so that while 1.1% from the poorest quintile had attained tertiary level certification, the corresponding proportion in the wealthiest quintile was estimated to be 25.6%. There appears to be little variation in the proportions that attained a maximum of a school leaving certificate as one progresses from the poorest to the wealthiest quintile. This might be a function of age as older persons were more likely to have attained a maximum of a school leaving certificate and at the same time progress differentially per capita consumption quintiles.

DRAFT REPORT: Volume III - Quantitative Assessment of Poverty in St. Lucia 34
Table 5.1: Distribution of the Population Aged 15 years and over by Highest Examination Passed according to Per Capita Consumption Quintiles and Sex
Per Capita Consumption Quintiles
Poorest II III IV Richest Total Highest
Examination Passed N % N % N % N % N % N %
MALE None 7538 71.6 6056 57.6 5654 58.0 5137 48.7 4072 33.3 28457 53.1 School Leaving 1434 13.6 1928 18.3 1527 15.7 1678 15.9 2067 16.9 8634 16.1 CXC Basic 38 .4 190 1.8 233 2.4 450 4.3 304 2.5 1214 2.3 CXC 1-4 Passes 646 6.1 1078 10.3 832 8.5 912 8.6 699 5.7 4168 7.8
CXC 5 and More Passes 298 2.8 540 5.1 710 7.3 1077 10.2 1528 12.5 4154 7.8
Tertiary Certification 36 .3 453 4.3 530 5.4 993 9.4 3158 25.9 5171 9.7
Other 153 1.5 112 1.1 153 1.6 150 1.4 114 .9 682 1.3 Not Stated 389 3.7 153 1.5 117 1.2 152 1.4 270 2.2 1080 2.0 Total 10531 100.0 10510 100.0 9756 100.0 10549 100.0 12213 100.0 53561 100.0
FEMALE None 6673 66.4 5332 53.9 6138 52.8 6040 47.6 4345 33.1 28528 49.7 School Leaving 1302 12.9 2064 20.9 1796 15.4 2324 18.3 2865 21.8 10351 18.0 CXC Basic 76 .8 372 3.8 487 4.2 339 2.7 116 .9 1390 2.4 CXC 1-4 Passes 732 7.3 777 7.8 1289 11.1 911 7.2 909 6.9 4617 8.0
CXC 5 and More Passes 465 4.6 753 7.6 807 6.9 1215 9.6 1264 9.6 4504 7.8
Tertiary Certification 196 2.0 299 3.0 497 4.3 1602 12.7 3328 25.4 5922 10.4
Other 226 2.2 186 1.9 228 2.0 73 .6 151 1.1 863 1.5 Not Stated 387 3.8 112 1.1 382 3.3 197 1.6 151 1.2 1229 2.1 Total 10056 100.0 9895 100.0 11626 100.0 12701 100.0 13127 100.0 57404 100.0
BOTH SEXES None 14211 69.0 11388 55.8 11792 55.1 11177 48.1 8417 33.2 56985 51.4 School Leaving 2736 13.3 3993 19.6 3323 15.5 4002 17.2 4932 19.5 18985 17.1 CXC Basic 114 .6 562 2.8 720 3.4 790 3.4 420 1.7 2605 2.3 CXC 1-4 Passes 1378 6.7 1855 9.1 2121 9.9 1823 7.8 1608 6.3 8785 7.9
CXC 5 and More Passes 763 3.7 1293 6.3 1518 7.1 2293 9.9 2792 11.0 8658 7.8
Tertiary Certification 232 1.1 753 3.4 1028 4.9 2596 10.2 6485 25.6 11093 10.0
Other 379 1.8 298 1.5 381 1.8 223 1.0 265 1.0 1545 1.4 Not Stated 775 3.8 264 1.3 499 2.3 349 1.5 421 1.7 2309 2.1 Total 20587 100.0 20405 100.0 21382 100.0 23251 100.0 25340 100.0 110965 100.0

DRAFT REPORT: Volume III - Quantitative Assessment of Poverty in St. Lucia 35
A further examination of Table 5.1 reveals that the negative association between highest examination passed and per capita consumption quintiles is generally borne out among males and among females aged 15 years and over. This is especially true when one considers persons who had no certification and those who had at least tertiary level certification. Not withstanding these observations, the results contained in Table 3.25 point towards to interesting conclusions. The first relates to the fact that 2.0% of females with tertiary level certification were in the poorest quintile group as opposed to 0.3% among males. Such an outcome points towards an inequitable distribution of resources across the sexes with respect to persons attaining tertiary level certification and at the same time, being among the ranks of the poorest in St. Lucia. In order to undertake such an analysis, it would be necessary to embrace a gender perspective that focuses upon individual and group perspectives pertaining to roles and expectations in the context of living arrangements, duties and responsibilities of the sexes in different spheres such as the household and the workplace, and discriminatory behaviour and labour market segmentation. The second point relates to the fact that relatively more females than males attaining a maximum of school leaving certification had progressed to quintile 4 and the wealthiest quintile. This might be indicative of the resilience of some older women who had no more than a school leaving certificate but the same time, had been able to acquire the means to sustain a standard of living commensurate with that of the two wealthiest quintile group. 5.1.2 Highest Examination Passed by Socio-Economic Status Similar to Table 5.1, Table 5.2 shows variation in highest examination passed but instead focuses on an absolute conception of poverty status in St. Lucia. In particular, it explores variations in the highest examination passed among persons aged 15 years and over who are poor and those who are non-poor. Among poor persons overall, 64.5% had no certification as opposed to a smaller proportion amounting to 46.7% among non-poor persons. With respect to persons who had attained at least tertiary level certification, a substantially lower proportion was observed among the poor than among the non-poor, the respective estimates being 1.7% and 12.0%. A consistent pattern emerged across the sexes. For males who had no certification, 67.2% were poor and 47.8% were non poor. For females, the corresponding proportions were 61.7% and 45.7%. With respect to persons who attained at least tertiary certification, the respective proportions among the poor and the non-poor were 0.9% and 13.0% in the case of males and 2.4% and 13.0% in the case of females. The results contained in Table 5.1 and Table 5.2 reinforce the view that the attainment of certification enhances one’s socio-economic status and facilitates one’s prospects of being among the ranks of the non-poor. Moreover, it emphasizes the value associated with the attainment of tertiary level certification, enhanced socio-economic status and the prospect of not being deprived of basic human needs for engaging in sustainable livelihood.

DRAFT REPORT: Volume III - Quantitative Assessment of Poverty in St. Lucia 36
Table 5.2: Distribution of the Population Aged 15 years and over by Highest Examination Passed according to Socio-Economic Status and Sex
Socio Economic Status
Poor Non Poor Total
Highest Examination Passed
N % N % N % MALE
None 9861 67.2 18596 47.8 28457 53.1 School Leaving 2456 16.7 6178 15.9 8634 16.1 CXC Basic 38 .3 1177 3.0 1214 2.3 CXC 1-4 Passes 990 6.7 3178 8.2 4168 7.8 CXC 5 and More Passes 492 3.4 3661 9.4 4154 7.8 A Level 149 .9 5022 13.0 5171 9.7 Other 229 1.6 454 1.2 682 1.3 Not Stated 466 3.2 614 1.6 1080 2.0 Total 14682 100.0 38878 100.0 53561 100.0
FEMALE None 8911 61.7 19617 45.7 28528 49.7 School Leaving 2488 17.2 7863 18.3 10351 18.0 CXC Basic 112 .8 1278 3.0 1390 2.4 CXC 1-4 Passes 1165 8.1 3452 8.0 4617 8.0 CXC 5 and More Passes 652 4.5 3852 9.0 4504 7.8 A Level 344 2.4 5578 13.0 5922 10.4 Other 337 2.3 526 1.2 863 1.5 Not Stated 424 2.9 805 1.9 1229 2.1 Total 14434 100.0 42971 100.0 57404 100.0
BOTH SEXES None 18773 64.5 38213 46.7 56985 51.4 School Leaving 4944 17.0 14041 17.2 18985 17.1 CXC Basic 150 .5 2455 3.0 2605 2.3 CXC 1-4 Passes 2155 7.4 6630 8.1 8785 7.9 CXC 5 and More Passes 1144 3.9 7514 9.2 8658 7.8 A Level 494 1.7 10599 12.0 11093 10.0 Other 566 1.9 979 1.2 1545 1.4 Not Stated 891 3.1 1418 1.7 2309 2.1 Total 29116 100.0 81849 100.0 110965 100.0

DRAFT REPORT: Volume III - Quantitative Assessment of Poverty in St. Lucia 37
5.2 ACCESS TO TEXTBOOKS For persons attending primary and secondary schools, Table 5.3 permits an examination of the relationship between access to text books, socio-economic status and individuals’ sex. Accordingly, a greater proportion of such persons were observed to have had access to all text books than to have access to some or none of the textbooks. Specifically, it was estimated that 56.2%. On examining the association between access to textbooks and individuals’ sex, the pattern remained virtually unchanged suggesting that there did not appear to be any sex differentials in access to textbooks. However, Table 5.3 is indicative of a relationship between socio-economic status and access to textbooks. Thus, while 60.3% of non-poor school attendees were observed to have had access to all of their textbooks, the corresponding proportion among their poor counterparts was 48.3%. Such findings are consistent with expectations suggesting that non-poor school attendees were more likely than their poor counterparts to have had access to all of their textbooks whether or not shared than to have some or none of the textbooks. In contrast, poor school attendees were more likely than their non-poor counterparts to have some or none of their textbooks than to have all of their textbooks. On taking individuals’ sex into account, some interesting patterns emerge indicating that the observed relationship between access to textbooks and socio-economic status persisted among male school attendees but was somewhat different for their female counterparts. Among the latter, socio-economic status did not appear to impact on access to textbooks as greater proportions of female school attendees irrespective of socio-economic status had access to all textbooks as opposed to having access to some or none. Nonetheless, a slightly greater proportion was observed to have had access to all textbooks among non-poor female attendees than among poor female attendees (59.1% as opposed to 50.4%). The corresponding proportions among non-poor male attendees and poor male attendees were 61.9% and 46.4%).

DRAFT REPORT: Volume III - Quantitative Assessment of Poverty in St. Lucia 38
Table 5.3: Distribution of the Population Attending School by Access to Textbooks Required for School according to Socio-Economic Status and Sex
Socio Economic Status
Poor Non Poor Total Has All Textbooks Required For School No. % No. % No. % Male
Yes, has books for exclusive use 4444 46.0 9807 61.9 14251 55.8 Yes, but shares with other family members
36 .4 36 .1
Has only some books 4721 48.8 4185 26.4 8906 34.9 Has None 427 4.4 1257 7.9 1684 6.6 Not Stated 41 .4 604 3.8 644 2.5 Total 9668 100.0 15853 100.0 25522 100.0
Female Yes, has books for exclusive use 4294 50.0 11415 58.5 15709 55.9 Yes, but shares with other family members
36 .4 113 .6 150 .5
Has only some books 3793 44.2 5111 26.2 8905 31.7 Has None 380 4.4 1174 6.0 1554 5.5 Not Stated 78 .9 1699 8.7 1778 6.3 Total 8582 100.0 19513 100.0 28095 100.0
Both Sexes Yes, has books for exclusive use 8737 47.9 21223 60.0 29960 55.9 Yes, but shares with other family members
73 .4 113 .3 186 .3
Has only some books 8514 46.7 9296 26.3 17811 33.2 Has None 807 4.4 2431 6.9 3238 6.0 Not Stated 119 .7 2303 6.5 2422 4.5 Total 18250 100.0 35366 100.0 53617 100.0

DRAFT REPORT: Volume III - Quantitative Assessment of Poverty in St. Lucia 39
66..00 HHEEAALLTTHH,, EENNVVIIRROONNMMEENNTT AANNDD SSOOCCIIOO--EECCOONNOOMMIICC SSTTAATTUUSS
6.1 LIFESTYLE DISEASES BY TYPE This discussion addresses the prevalence of the main lifetime diseases among persons who have indicated that they are suffering from some disease. The prevalence rates relate to five main lifestyle diseases notably diabetes, high blood pressure, heart disease, cancer and HIV/AIDS. For each lifestyle disease, the prevalence rates are examined in the context of socio-economic status that is predicated upon per capita consumption quintiles. The main thrust of the discussion is compare prevalence rates for the different diseases, and in the context of each disease, to assess variations in prevalence across per capita consumption quintiles. Table 6.1 shows the number of persons suffering from the main lifestyle diseases and their specific prevalence rates relative to all persons who indicated that they were suffering from diseases. However, in order to interpret these results, it is critical that one bears in mind differential levels of awareness, knowledge and pursuit of treatment that are likely to be associated with socio-economic status. Irrespective of per capita consumption quintile, Table 6.1 shows that the high blood pressure is the most prevalent lifestyle disease affecting persons with diseases in St. Lucia. In every quintile group, Table 6.1 also shows that the prevalence of diabetes ranks second to high blood pressure as a lifetime disease affecting persons with diseases in St. Lucia. In each of the quintile groups, more than three fifths of the persons with diseases reported suffering from high blood pressure while more than one quarter reported suffering from diabetes. According to Table 6.1, heart diseases have been observed to be more prevalent than cancer in each of the quintile groups. In conclusion, Table 6.1 indicates that socio-economic status as gleaned from the quintile groups has no impact on the pattern of lifestyle diseases affecting the population of St. Lucia. It is worth noting that data on the prevalence of HIV/AIDS were not forthcoming and as such precluded any further analyses. Table 6.1 presents results that permit assessments of variation in prevalence rates of the different main lifestyle diseases due to individuals’ socio-economic status. With reference to persons who claim to have had a disease, the highest prevalence rates among persons claiming to be living with a heart condition or cancer have been observed for persons in the wealthiest quintile. For persons claiming to be living with diabetes, higher prevalence rates have been observed among persons in wealthier quintiles than among those in the two poorest quintiles.
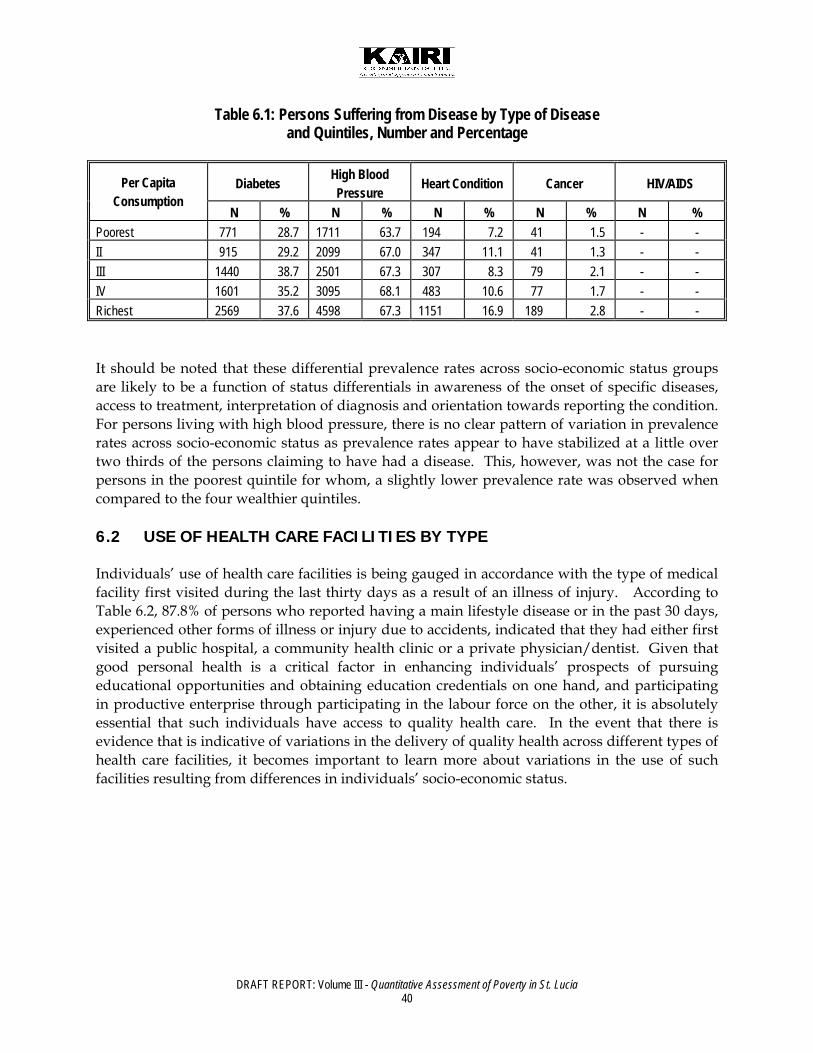
DRAFT REPORT: Volume III - Quantitative Assessment of Poverty in St. Lucia 40
Table 6.1: Persons Suffering from Disease by Type of Disease and Quintiles, Number and Percentage
Diabetes High Blood Pressure Heart Condition Cancer HIV/AIDS Per Capita
Consumption N % N % N % N % N %
Poorest 771 28.7 1711 63.7 194 7.2 41 1.5 - - II 915 29.2 2099 67.0 347 11.1 41 1.3 - - III 1440 38.7 2501 67.3 307 8.3 79 2.1 - - IV 1601 35.2 3095 68.1 483 10.6 77 1.7 - - Richest 2569 37.6 4598 67.3 1151 16.9 189 2.8 - - It should be noted that these differential prevalence rates across socio-economic status groups are likely to be a function of status differentials in awareness of the onset of specific diseases, access to treatment, interpretation of diagnosis and orientation towards reporting the condition. For persons living with high blood pressure, there is no clear pattern of variation in prevalence rates across socio-economic status as prevalence rates appear to have stabilized at a little over two thirds of the persons claiming to have had a disease. This, however, was not the case for persons in the poorest quintile for whom, a slightly lower prevalence rate was observed when compared to the four wealthier quintiles. 6.2 USE OF HEALTH CARE FACILITIES BY TYPE Individuals’ use of health care facilities is being gauged in accordance with the type of medical facility first visited during the last thirty days as a result of an illness of injury. According to Table 6.2, 87.8% of persons who reported having a main lifestyle disease or in the past 30 days, experienced other forms of illness or injury due to accidents, indicated that they had either first visited a public hospital, a community health clinic or a private physician/dentist. Given that good personal health is a critical factor in enhancing individuals’ prospects of pursuing educational opportunities and obtaining education credentials on one hand, and participating in productive enterprise through participating in the labour force on the other, it is absolutely essential that such individuals have access to quality health care. In the event that there is evidence that is indicative of variations in the delivery of quality health across different types of health care facilities, it becomes important to learn more about variations in the use of such facilities resulting from differences in individuals’ socio-economic status.

DRAFT REPORT: Volume III - Quantitative Assessment of Poverty in St. Lucia 41
Table 6.2: Percentage Distribution of Persons with Main Lifestyle Diseases or Illness and Injury due to Accidents in the Past 30 days by Type of Place First Visited for Medical Attention according to
Per Capita Consumption Quintiles
Per Capita Consumption Quintiles Poorest II III IV Richest
All St Lucia Place First Visit Made
% % % % % % Public Hospital 33.7 26.8 34.7 29.3 24.5 29.1 Private Hospital 1.5 - - 7.2 10.8 5.0 Community Health Clinic 30.1 35.2 33.3 26.4 13.9 25.9 Polyclinic 2.8 5.0 - 2.7 2.7 2.6 Private Doctor/Dentist 24.5 30.6 29.9 28.2 43.4 32.8 Out of state hospital - - - 1.8 1.3 .8 Pharmacy/Chemist 2.8 1.2 1.0 1.8 2.6 2.0 Other 3.0 1.2 - 2.7 .7 1.4 Not Stated 1.5 - 1.1 - - .4 All St Lucia 100.0 100.0 100.0 100.0 100.0 100.0 In the poorest quintile group, for instance, the majority of individuals used public hospitals (33.7%) with lower percentages using community health clinics (30.1%) and private physicians/dentists (24.5%). In the case of the wealthiest quintile group, the majority of individuals used private physicians/dentists (43.4%) with lower percentages using public hospitals (24.5%) and community health clinics (13.9%). A few other interesting observations are made in the context of the use of health facilities across socio-economic status groups. First, it is worth noting that the proportion of individuals visiting private physicians/dentists is lower in the poorest quintile than in any or the wealthier quintiles. Second, there is relatively greater use of private hospitals among individuals belonging to the two wealthiest quintiles than among their counterparts from the poorer quintiles. In particular, the use of private hospitals is most pronounced among the members of the wealthiest quintile. Assuming that the individuals have been seeking similar medical services from different sources that may differ in the quality of their service delivery, some attention ought to be placed in redressing any imbalance that might arise in terms of differential access to quality services across socio-economic status groups. The relatively greater use of private physicians/dentists and private hospitals among individuals from wealthier quintiles relative to their counterparts from the poorest quintile is a critical determinant that could facilitate public policy reform geared towards improving health delivery systems. This may have implications for the redistribution of health coverage and resources that could provide better access to quality health care among poorer sub-populations. Moreover, other implications might include building capacity in public hospitals and community health care facilities to render health care services at higher standards that are deemed to be acceptable and in line with best practices.

DRAFT REPORT: Volume III - Quantitative Assessment of Poverty in St. Lucia 42
6.3 HEALTH INSURANCE COVERAGE Health insurance coverage is a function of the extent to which individuals are covered by private health insurance, employee medical plan, National Insurance Scheme or Social Welfare. Table 6.3 shows that the vast majority of individuals, estimated to be in the vicinity of 72.5% of the national population, did not have any medical coverage. This means that just 26.3% had such coverage. Altogether, Table 6.3 suggests that relatively fewer persons had health coverage when compared to those who had no such coverage, a pattern that persisted irrespective of individuals’ socio-economic status group. Not withstanding this, persons belonging to the poorest quintile were the least likely to have had insurance coverage which seem generally increased relatively speaking with a progression to wealthier quintiles, in particular, the two wealthiest quintiles. While just 5.7% of the persons belonging to the poorest quintile were estimated to have had health insurance coverage, the corresponding proportion among persons from the wealthiest cohort was estimated to be 40.9%. Such results should provide further means for explaining and appreciating outcomes indicating relatively greater use of private hospitals among persons belonging to the two wealthiest quintiles.
Table 6.3: Percentage Distribution of Population by Health Insurance Coverage according to Per Capita Consumption Quintiles
Per Capita Consumption Quintiles
Poorest II III IV Richest All St Lucia Covered By Health
Insurance % % % % % %
Yes 5.7 21.7 16.1 31.6 40.9 26.3 No 92.8 75.9 83.9 67.5 57.8 72.5 Not Stated 1.5 2.3 - .9 1.4 1.2 All St Lucia 100.0 100.0 100.0 100.0 100.0 100.0

DRAFT REPORT: Volume III - Quantitative Assessment of Poverty in St. Lucia 43
77..00 HHOOUUSSIINNGG CCHHAARRAACCTTEERRIISSTTIICCSS AANNDD SSOOCCIIOO--EECCOONNOOMMIICC SSTTAATTUUSS
7.1 TENANCY OF DWELLING Home ownership is a means towards the acquisition of wealth. It is the outcome of an investment that provides owners with an asset base that can potentially enhance the well being of household members. Table 7.1 shows that 78.5% of all households lived in dwelling units that were owner-occupied with or without mortgage. Not surprisingly, the greatest proportion of households in owner-occupied dwelling units was evident in the wealthiest household quintile with rates of ownership amounting to 82.8%. In general, rates exceeding 75.0% were observed among households in each of the remaining household quintiles and thus indicative of prospects for owners to have substantial command over one of the most valuable assets of humankind. While the pattern of accommodating owner-occupied dwelling units does not vary much across household quintile groups, the quality of housing and the amenities available to household members are likely to vary across household quintile groups. While this concern will be addressed in the following sections, it will be pursued in the context of standards that persist irrespective of ownership status of dwelling units and not solely in the context of owner-occupied dwelling units.
Table 7.1: Percentage Distribution of Households by Tenancy of Dwelling according to Household Quintiles
Household Quintiles – AE Total
Poorest II III IV V
N % N % N % N % N % N % Owned With Mortgage
338 3.6 559 6.0 686 7.4 1142 12.3 2002 21.3 4727 10.1
Owned Without Mortgage
7115 76.0 6558 70.8 6522 70.3 5897 63.7 5788 61.5 31880 68.4
Rented-Furnished
- - 36 .4 - - 110 1.2 268 2.8 414 .9
Rented-Unfurnished
1223 13.1 1698 18.3 1615 17.4 1733 18.7 1209 12.8 7479 16.1
Rent-free 541 5.8 415 4.5 411 4.4 340 3.7 74 .8 1781 3.8 Squatted 73 .8 - - 38 .4 - - 77 .8 188 .4 Other 38 .4 - - - - 39 .4 - - 76 .2
Tenancy of Dwelling
Not Stated 39 .4 - - - - - - - - 39 .1 Total 9367 100.0 9267 100.0 9272 100.0 9261 100.0 9417 100.0 46584 100.0

DRAFT REPORT: Volume III - Quantitative Assessment of Poverty in St. Lucia 44
7.2 TYPE OF DWELLING UNIT Despite the wide array of dwelling units, Table 7.2 shows that the vast majority (85.2%) of households occupied undivided private houses. Another 8.6% of all households shared a private house while 4.8% occupied a flat, apartment or condominium. It is clear that the occupation of undivided private houses is commonplace in St. Lucia transcending the socio-economic status of households. Notwithstanding such an outcome, the proportion of households occupying undivided private houses increases with declining household socio-economic status. Thus, while 80.7% of all households in the wealthiest quintile occupied undivided private houses, the corresponding proportion for the poorest quintile was 90.2%. Such a pattern suggests that household members from wealthier quintiles may have a wider array of housing options as reflected in the relatively larger proportions sharing private houses, occupying flats, apartments or condominiums, and living in units that assume other forms.
Table 7.2: Percentage Distribution of Households by Type of Dwelling Unit according to Household Quintiles
Household Quintiles – AE Total
Poorest II III IV V
N % N % N % N % N % N % Undivided Private House
8448 90.2 8321 89.8 7765 83.7 7572 81.8 7597 80.7 39703 85.2
Part of a Private House
660 7.0 572 6.2 831 9.0 1049 11.3 905 9.6 4016 8.6
Flat, Apartment, Condominium
221 2.4 259 2.8 563 6.1 526 5.7 682 7.2 2250 4.8
Double House/Duplex
- - - - - - 38 .4 38 .4 75 .2
Combined Business & Dwelling
38 .4 76 .8 76 .8 38 .4 195 2.1 423 .9
Barracks - - 39 .4 - - - - - - 39 .1
Type of Dwelling Unit
Other - - - - 38 .4 39 .4 - - 76 .2 Total 9367 100.0 9267 100.0 9272 100.0 9261 100.0 9417 100.0 46584 100.0 7.3 MAIN ROOFING MATERIAL In St. Lucia, the use of sheet metal as an option for roofing is virtually universal. According to Table 7.3, 96.2% of all households lived in dwelling units that used sheet metal (galvanize) as the main roofing material. At the same time, Table 7.3 also shows that the proportion of households living in dwelling units that use sheet metal as the primary roofing material increases with declining household socio-economic status. While 90.3% of all households in the

DRAFT REPORT: Volume III - Quantitative Assessment of Poverty in St. Lucia 45
wealthiest quintile lived in dwelling units that used sheet metal as the main roofing material, the corresponding proportion for the poorest quintile was 98.4%. The results are interesting and indicate that households belonging to the wealthiest quintile group may have been able to exercise greater choice in the purchase of dwelling units and the use of roofing material. Despite the prevalence of sheet metal across socio-economic status groups, there is virtually no means of evaluating the configuration and resistance of roofing options in providing adequate protection from the elements especially since such a criterion can be used to assess living standards that persist across the different socio-economic status groups. 7.4. MATERIAL OF OUTER WALLS In St. Lucia, dwelling units are built of mainly with materials such as wood, concrete, a combination of wood and concrete or plywood. According to Table 7.3, the majority of households (43.4%) occupied dwelling units with outer walls of concrete. A further 20.2% occupied dwelling units with wooden outer walls while a slightly lower proportion amounting to 18.3% occupied dwelling units with outer walls of wood and concrete. Plywood was used to construct the outer walls of dwelling units that contained 15.5% of all households. Except for households belonging to the poorest quintile, those belonging to wealthier quintile groups occupied dwelling units with outer walls of concrete more frequently than units built with any other materials. Outer walls of concrete are highly likely to enhance the physical strength of dwelling units and provide occupants with a greater sense of security against environmental agents. To this end, Table 7.3 shows that the proportion of households occupying dwelling units with outer walls built of concrete decreases with declining household socio-economic status. While 68.5% of all households in the wealthiest quintile occupied such dwelling units, the corresponding proportion for the poorest quintile was 20.9%. In contrast, the situation was reversed in the context of household occupying dwelling units with outer walls made of plywood. In such cases, the proportion of households living in units with outer walls of plywood has been increasing with declining household socio-economic status. According to Table 7.4, 1.6% of all households in the wealthiest quintile occupied dwelling units with outer walls made of plywood as opposed to a much higher proportion amounting to 30.7% in the case of households belonging to the poorest quintile. Given the inferior quality of plywood as a means of constructing durable outer walls that can maximize protection against environmental and other external agents, considerable attention ought to be placed on this dimension of housing characteristics. The evidence pertaining to materials used for constructing outer walls point towards imbalances that place lower socio-economic status groups at clear disadvantages that have implications for the social and physical well being of group members.
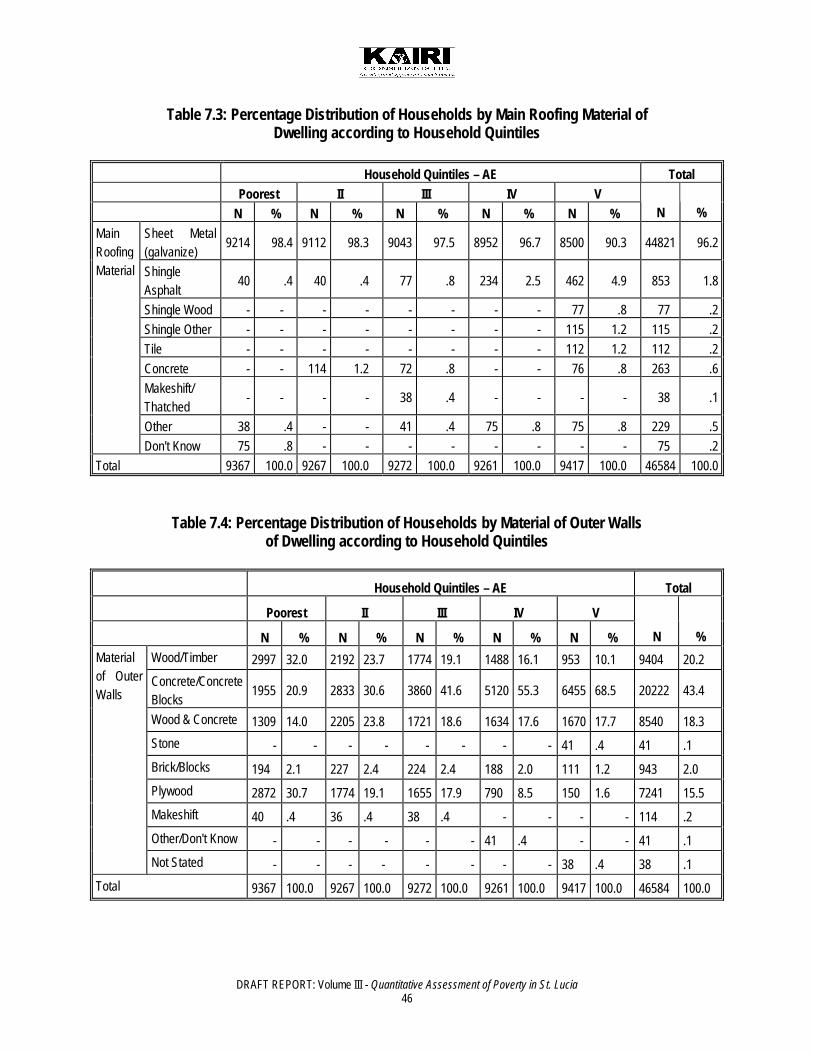
DRAFT REPORT: Volume III - Quantitative Assessment of Poverty in St. Lucia 46
Table 7.3: Percentage Distribution of Households by Main Roofing Material of Dwelling according to Household Quintiles
Household Quintiles – AE Total Poorest II III IV V N % N % N % N % N % N %
Sheet Metal (galvanize)
9214 98.4 9112 98.3 9043 97.5 8952 96.7 8500 90.3 44821 96.2
Shingle Asphalt
40 .4 40 .4 77 .8 234 2.5 462 4.9 853 1.8
Shingle Wood - - - - - - - - 77 .8 77 .2 Shingle Other - - - - - - - - 115 1.2 115 .2 Tile - - - - - - - - 112 1.2 112 .2 Concrete - - 114 1.2 72 .8 - - 76 .8 263 .6 Makeshift/ Thatched
- - - - 38 .4 - - - - 38 .1
Other 38 .4 - - 41 .4 75 .8 75 .8 229 .5
Main Roofing Material
Don't Know 75 .8 - - - - - - - - 75 .2 Total 9367 100.0 9267 100.0 9272 100.0 9261 100.0 9417 100.0 46584 100.0
Table 7.4: Percentage Distribution of Households by Material of Outer Walls of Dwelling according to Household Quintiles
Household Quintiles – AE Total
Poorest II III IV V
N % N % N % N % N % N % Wood/Timber 2997 32.0 2192 23.7 1774 19.1 1488 16.1 953 10.1 9404 20.2 Concrete/Concrete Blocks
1955 20.9 2833 30.6 3860 41.6 5120 55.3 6455 68.5 20222 43.4
Wood & Concrete 1309 14.0 2205 23.8 1721 18.6 1634 17.6 1670 17.7 8540 18.3 Stone - - - - - - - - 41 .4 41 .1 Brick/Blocks 194 2.1 227 2.4 224 2.4 188 2.0 111 1.2 943 2.0 Plywood 2872 30.7 1774 19.1 1655 17.9 790 8.5 150 1.6 7241 15.5 Makeshift 40 .4 36 .4 38 .4 - - - - 114 .2 Other/Don't Know - - - - - - 41 .4 - - 41 .1
Material of Outer Walls
Not Stated - - - - - - - - 38 .4 38 .1 Total 9367 100.0 9267 100.0 9272 100.0 9261 100.0 9417 100.0 46584 100.0

DRAFT REPORT: Volume III - Quantitative Assessment of Poverty in St. Lucia 47
7.5 MAIN COOKING FUEL Cooking gas was the principal cooking fuel of choice in St. Lucia being used by 91.1% of all households as a means of preparing meals. Coal and to a lesser extent, wood, were used by 5.2% and 2.2% of all households. Table 7.5 shows that the proportion of households using cooking gas decreased with declining socio-economic status. While 96.8% of all households in the wealthiest quintile used cooking gas, the corresponding proportion for the poorest quintile was 78.4%. In contrast, the situation was reversed with respect to the use of coal and wood as main fuels, the respective proportions actually increasing with declining socio-economic status within households.
Table 7.5: Percentage Distribution of Households by Main Cooking Fuel Used according to Household Quintiles
Household Quintiles – AE Total
Poorest II III IV V
N % N % N % N % N % N % Coal 1043 11.1 489 5.3 529 5.7 262 2.8 115 1.2 2438 5.2 Wood 742 7.9 116 1.2 111 1.2 36 .4 36 .4 1042 2.2 Gas/LPG/ Cooking Gas
7348 78.4 8662 93.5 8596 92.7 8734 94.3 9112 96.8 42451 91.1
Kerosene - - - - - - 76 .8 - - 76 .2 Electricity 39 .4 - - 36 .4 116 1.3 154 1.6 345 .7
Main Cooking Fuel Used
Other 195 2.1 - - - - 36 .4 - - 231 .5 Total 9367 100.0 9267 100.0 9272 100.0 9261 100.0 9417 100.0 46584 100.0 7.6 TOILET FACILITIES In the main, the majority of households had toilet facilities that assume the form of water closets that are either linked to sewer systems or septic tanks. Altogether, Table 7.6 reveals that 66.6% of all households claimed to have such facilities. Another 28.7% of households relied upon pit latrines while 2.5% had no facilities whatsoever. Table 7.6 shows that the proportion of households with water closets decreased with declining socio-economic status so that while 93.0% of all households in the wealthiest quintile used toilet facilities that assume the form of water closets, the corresponding proportion for the poorest quintile was 31.0%. With respect to the proportion of households with toilet facilities that assume the form of pit latrines or where no toilet facilities were available, proportions actually increased as the socio-economic status of households declined. It is also worth noting that except for households belonging to the poorest quintile, those belonging to wealthier quintile groups claimed that they used water closets more frequently than any other type of toilet facility. In contrast, households in the poorest quintile claimed that they used pit latrines more frequently than any other type of facility. Insofar as the

DRAFT REPORT: Volume III - Quantitative Assessment of Poverty in St. Lucia 48
use of pit latrines is so prevalent among households belonging to the poorest quintile, public health policy has to embrace infrastructural interventions in communities overwhelmed by poverty as a means of reducing the risks of succumbing to infectious and communicable diseases.
Table 7.6: Percentage Distribution of Households by Toilet Facilities Used according to Household Quintiles
Household Quintiles – AE Total
Poorest II III IV V
N % N % N % N % N % N % W.C. Linked to sewer
263 2.8 412 4.4 337 3.6 381 4.1 1377 14.6 2770 5.9
W.C. Linked to Septic tank/Soak-away
2644 28.2 5013 54.1 6136 66.2 7088 76.5 7388 78.4 28269 60.7
Pit-latrine 5415 57.8 3399 36.7 2386 25.7 1524 16.5 652 6.9 13375 28.7 Ventilated Pit-latrine
38 .4 38 .4 75 .8 - - - - 151 .3
Other 300 3.2 293 3.2 183 2.0 77 .8 - - 853 1.8 None 707 7.5 73 .8 154 1.7 192 2.1 - - 1126 2.4
Toilet Facilities Used
Not Stated - - 39 .4 - - - - - - 39 .1 Total 9367 100.0 9267 100.0 9272 100.0 9261 100.0 9417 100.0 46584 100.0 7.7 MAIN SOURCE OF WATER In St. Lucia, the majority of households claimed that they relied mainly upon water being piped into dwelling from a public source (68.6%), piped into yard from public source (19.9%) or obtained from a public standpipe (5.3%). Thus, according to Table 7.7, almost 94.0% of all household relied principally upon public sources for their water supply. Table 7.7 shows that the proportion of households with water piped into their dwelling units from public sources decreased with declining socio-economic status so that while 90.1% of all households in the wealthiest quintile obtained pipe borne water from public sources, the corresponding proportion for the poorest quintile was 40.1%. Altogether, pipe borne water from public sources was the most frequently cited main source of water supply in spite of household socio-economic status. Nonetheless, it is worth noting that in the proportions of households that relied principally on a public supply of water in a yard or standpipe increased with declining socio-economic status. While only 7.0% of all households in the wealthiest quintile reported having their main supply of water piped into a yard from a public source, the corresponding proportion within the poorest quintile was estimated to be 34.4%. With respect to time-consuming means of gathering water, whether by means of a public standpipe, a public well,

DRAFT REPORT: Volume III - Quantitative Assessment of Poverty in St. Lucia 49
tank or truck, or a private catchment area, relatively greater numbers of households from the poorest quintile relied upon such means when compared to households in the wealthier quintile groups.
Table 7.7: Percentage Distribution of Households by Main Source of Water according to Household Quintiles
Household Quintiles – AE Total
Poorest II III IV V
Main Source of Water N % N % N % N % N % N % Public, piped into dwelling 3795 40.5 5546 59.8 6546 70.6 7604 82.1 8488 90.1 31979 68.6 Public, piped into yard 3220 34.4 2408 26.0 2008 21.7 1000 10.8 657 7.0 9293 19.9 Public standpipe 1266 13.5 601 6.5 341 3.7 272 2.9 - - 2480 5.3 Public well/tank or truck 39 .4 - - - - - - - - 39 .1 Private, piped into dwelling 38 .4 221 2.4 109 1.2 112 1.2 110 1.2 590 1.3 Private catchment not piped 38 .4 151 1.6 36 .4 - - 41 .4 266 .6 Private catchment piped 77 .8 - - - - - - 41 .4 117 .3 Other 894 9.5 302 3.3 231 2.5 274 3.0 79 .8 1780 3.8 Not Stated - - 39 .4 - - - - - - 39 .1 Total 9367 100.0 9267 100.0 9272 100.0 9261 100.0 9417 100.0 46584 100.0
In addition to satisfying the daily preparation of meals and individuals’ daily dietary requirements, adequate means of accessing a potential supply of water permits the household members to accomplish a number of other personal daily functions that enhance their quality of life and overall living standards. Thus, Table 7.7 produces results that point towards a greater engagement in more time-consuming water-gathering practices by members of poorer households. Such an allocation of time is likely to reduce the amount of time available for individuals to develop their human capabilities and retard their transition to more favourable conditions and opportunities in life. Altogether, the main sources of water supply are distributed inequitably across household socio-economic status groups and will require infrastructural interventions within the public arena to enhance the quality of service delivery and reduce inequities.

DRAFT REPORT: Volume III - Quantitative Assessment of Poverty in St. Lucia 50
AAPPPPEENNDDIICCEESS APPENDIX ONE THE RISK OF BEING POOR IN ST. LUCIA – LOGISTIC REGRESSION MODEL A logistic regression model was elaborated, using the micro-dataset from the SLC/HBS 2005/06, following similar works by a number of researchers in other parts of the world (Ruben 1996, Ray 1999 and Geda 2001). The logit model attempts to estimate a household’s odds of being poor, given various conditioning factors, including but not restricted to age, gender, adult equivalent family size6, education, sector of employment, region, unemployment and participation in the labour force. The variables in focus “poverty” or alternatively “vulnerability”, take one of two conditions for every household that is, poor or non-poor when the variable in question is “poverty” and “vulnerable” or “not vulnerable” in the case of vulnerability. The choice of exogenous variables was influenced by confounding and effect modifying (interaction) impacts, but the final selection was based on theory, precedent of use in other studies and limitations in the dataset. Several different variable types were used based on inherent natural contrast, as in the case of the unemployed in contrast to the employed; participants versus non participants in the labour force; and female versus male-headed households. Variables such as age, number of persons employed or unemployed in the household or adult equivalent family size are continuous variables and their impact on the condition of poverty or vulnerability was interpreted in terms of the percentage contribution of an additional year or household member to the odds of being poor. The model also utilizes variables with less obvious contrasts, as in the case of regions - urban/rural or north/south. RESULTS/FINDINGS 1. Employment Most research on poverty has identified unemployment as a major contributing factor. Since the issue of employment or unemployment is potentially a problem for all household members we examined this issue in such a way that all household members impact the model from the perspective of how much additional income each member brings to the household. The model concludes that households reduce the risk of poverty by a factor of 96% for every additional $100 EC earned by an employed person in the household. The use of income focuses not only on the availability of employment to eligible household members but it also serves are a proxy for the quality of employment obtained. The model was also tested with both the unemployment status of the head of household as an explanatory variable, but although significant, the presence of this variable adversely affected
6 The use of adult equivalent scales in this study improves the specification of the absolute poverty line when compared to a per capita measure by according higher relative weights to adults over children. This study however does not explore the possibility of economies of household size in consumption which has been show in some studies to be significant (Ranjan Ray 1999).

DRAFT REPORT: Volume III - Quantitative Assessment of Poverty in St. Lucia 51
the model’s overall validity and was consequently dropped in favour of the number of employed persons, which though not significant improved the overall validity of the model. While the inclusion of the number of persons employed masks, to some extent, the effect of specific occupation groups, two such groups were defined and tested in the model: households containing at least one agricultural worker and households containing at least one worker in the construction sector. These two variables were selected/defined due to their significance to the economic dynamics of St Lucia at this time. The construction sector, for example, employs large numbers of unskilled labour but is cyclical: at the moment St Lucia is experiencing a construction “boom” due to increased economic activity in preparation for the hosting of the 2007 Cricket World Cup. The result has been a reduction of unemployment and increasing employment rates in St. Lucia. However, workers in the construction sector are a special group of predominately males coming from either marginal farmers/farm labourers class on the one hand or senior primary/primary school leavers on the other, this variable was thus included in the model. The variable for “at least one member of the household is engaged in employment in the construction sector” is the single most important variable which can be associated with poverty. While persons are employed, and the unemployment rate is 13% nationally, the lowest rate on record, this employment is largely being driven by jobs created by urban construction activity. These jobs require low levels of skill and provide very modest levels of compensation not sufficient to lift person engaged in the sector out of poverty. When household members are employed in the construction sector the odds of a household being “poor” increased by 172%. 2. Housing conditions A variable normally considered as an indicator of “un-met” basic housing needs, the number of persons per bedroom, though not usually considered from precedent set in other studies or by theory was also introduced for two reasons. First, it is intuitively appealing to make an association between the risk of poverty and housing conditions of members of households; and second the statistical properties of this variable in the model are very appealing - it significantly enhances the model’s overall validity based on Wald and log likelihood test results. Overcrowding at the household level was found to be a statistically significant variable affecting the determination of a poor household. The model suggests that improvement of housing conditions can, conditioned on the other variables included in this model, improve the situation of the poor by up to 65%. 3. Family Size and dependents The adult equivalent family size was included as a continuous variable in this model and was found to be significant at the 1% level on the chi square distributed Wald test; for each additional equivalent adult added to the household the risk of poverty increases by 146%. This is not an unexpected result as larger household sizes are associated with greater levels of deprivation, social and material deficiencies.
DRAFT REPORT: Volume III - Quantitative Assessment of Poverty in St. Lucia 52
The model also attempts to make a direct link between the presence of children in a household and poverty. This was found to be one of the most important variables impacting the risk of being “poor”: each additional child adds 120% to the risk of being “poor”. 4. Education The issue of education was introduced as a categorical variable in the model (it was found to be significant at the 1% level) and its components were classified, broadly as none (no education), primary, secondary and tertiary. It was found that households with heads that had primary education were 54% less likely to be poor than households where the head had no education. This finding provides very strong evidence in support of ensuring that poverty reduction should be accompanied by very deliberate and sustained emphasis on primary education. Secondary education is also an important factor: households where household heads had secondary or higher levels of education were generally not poor. 5. District/Region The region variable examines the districts most affected by poverty and the odds associated with the extent of the problem in given districts. Anse-la-raye/Canaries, Choisuel and Laborie appear to have “odds” ratios greater than the reference “Castries City” area by a factor of at least 25% more than the remaining parts of St. Lucia. ANNEX TO LOGISTIC REGRESSION MODEL This logistic regression model for St. Lucia is similar to work done by a number of researchers in other parts of the world (see: Marc Ruben 1996, Ranjan Ray 1999, Alemayehu Geda 2001 etc.). The techniques applied in this exercise have been elaborated in various texts which deal with the specification of models with a dichotomous dependent variable (see: Maddala 1983, Aldrich and Nelson 1984). The variables in focus “poverty” or alternatively “vulnerability”, take one of two conditions for every household in the micro-dataset under consideration (St. Lucia SLC/HBS 2005/06) that is, ‘poor’ or ‘non-poor’ when the variable in question is “poverty” and “vulnerable” or “not vulnerable”, when the variable is “vulnerability”. The general form of the model being tested is given below in the following equation:
LogitP(X) iEi i iV i Ei j jW j where: P(X) =probability of event X occurring =baseline odds i =coefficients of the exposure effect variables Ei i =coefficients of the confounding variables Vi
i =coefficients of the effect modifying variables Wj This equation was defined in the first instance very broadly. Theory and prior research has shown that variables mentioned previously should be included as a matter of model validity, and hence are not removed in every case on the basis of tests of statistical significance since systematic as opposed to random error may result. In specifying the

DRAFT REPORT: Volume III - Quantitative Assessment of Poverty in St. Lucia 53
model, interaction effects between variables are considered and variable removal was done in the case of multiplicative variables which are too complex or which cause a rejection of the null hypothesis at the 5% level. These restrictions ensure the reduction of mutlicollinearity errors and improve the interpretation of odds/risk ratios associated with the equation coefficients. Model Results: In arriving at the “gold standard” logistic regression equation the general hierarchically well formulated (HWF)7 model has been refined by a backward elimination procedure based on chi-squared test if interaction is involved. The vast majority of interaction terms which were not significant at the 10% level or better were eliminated. Variables Definition Symbol in estimated
equation Dependent variable (model I) P=1 if poor, 0 otherwise
Poverty estimate based on consumption per adult equivalent Poor in binary logit model
Dependent variable (model II) I=1 if indigent, 0 otherwise Poverty estimate based on consumption per adult equivalent
Vul in binary logit model
Explanatory variables Sex of Household Head Employed Age Adult Equivalent Education (all) 1)Education(none) 2)Education(primary)
Sex = 1 if Female, 0 Male =1 if unemployed, 0 otherwise Five year age group of household head’s Equivalent number of adults Education at all levels No Education or No Education but OJT=1, 0 otherwise Primary or Primary with training=1, 0 otherwise
fhead employed yr5 adeq EDUCAT1 EDUCAT1(1) EDUCAT1(2)
3)Education(Secondary) 4)Education(Secondary) 5)Head unemployed 6)Head in Labour force 7) Dependants under 15 8) Household Type 9) Construction 10) Persons per Bed 11) District of Residence
1) Castries City 2) Castries Suburban 3) Anse-la-Raye/Canaries 4) Soufriere 5) Choiseul 6) Laborie 7) Vieux-Fort 8) Micoud 9) Dennery
12) Income
Secondary =1, 0 otherwise Tertiary =1, 0 otherwise Unemployed=1, 0 otherwise Head in Labour Force=1, 0 otherwise No of dependants less than 15 years Female head with no adult male=1 Female head with adult male=2 Male headed household=3 In Construction=1, 0 otherwise More than 2 per bed=1, otherwise 0 All regions Castries City =1, otherwise 0 Castries Suburban =1, otherwise 0 Anse-la-Raye/Canaries =1, otherwise 0 Soufriere=1, otherwise 0 Choiseul =1, otherwise 0 Laborie=1, otherwise 0 Vieux-Fort =1, otherwise 0 Micoud =1, otherwise 0 Dennery =1, otherwise 0 Household Income in Hundreds of Dollars
EDUCAT1(3) EDUCAT1(4) hunemp hlforce Depend15 Constr PERBED1 DISTRICT DISTRICT(1) DISTRICT(2) DISTRICT(3) DISTRICT(4) DISTRICT(5) DISTRICT(6) DISTRICT(7) DISTRICT(8) DISTRICT(9) Hinc1
7 Tests about retention of lower order components are independent of coding.

DRAFT REPORT: Volume III - Quantitative Assessment of Poverty in St. Lucia 54
Overall test for the validity of the model follows8. Unlike classical regression analysis, logistic regression does not produce goodness of fit statistics that are unambiguous and universally accepted. While two of these summary model statistics are reported for each of the two models presented, the following is a model of the “poor” versus the “non-poor” followed by a model for the “vulnerable” versus the “not vulnerable”. A more reliable assessment of the validity of the regression equation can be obtained by an examination of the Wald and Likelihood ratio test:
Omnibus Tests of Model Coefficients
276.552 18 .000276.552 18 .000276.552 18 .000
StepBlockModel
Step 1Chi-square df Sig.
Model Summary
950.343a .205 .321Step1
-2 Loglikelihood
Cox & SnellR Square
NagelkerkeR Square
Estimation terminated at iteration number20 because maximum iterations has beenreached. Final solution cannot be found.
a.
The model for the “poor” vs “the non poor” is specified as follows:
Classification Tablea
911 43 95.5171 78 31.3
82.2
Observed01
poor
Overall Percentage
Step 10 1
poor PercentageCorrect
Predicted
The cut value is .500a.
8 When choosing between competing logit models, the decision to reject depends on whether the addition/deletion of some explanatory variable(s) contributes to the model’s overall statistical validity. Both the log likelihood function and the Wald test measure this, and are distributed Chi square.

DRAFT REPORT: Volume III - Quantitative Assessment of Poverty in St. Lucia 55
Variables in the Model of the "Poor"
-.439 .227 3.734 1 .053 .645.187 .084 5.007 1 .025 1.206
29.846 4 .000-.624 .219 8.162 1 .004 .536
-1.503 .292 26.539 1 .000 .222-1.668 .587 8.063 1 .005 .189
-19.395 4784.074 .000 1 .997 .000.542 .219 6.136 1 .013 1.719
28.082 9 .001.764 .379 4.068 1 .044 2.147.944 .477 3.918 1 .048 2.571
1.363 .509 7.173 1 .007 3.9061.632 .522 9.774 1 .002 5.1141.616 .485 11.109 1 .001 5.0331.292 .438 8.709 1 .003 3.6401.709 .424 16.285 1 .000 5.5241.468 .431 11.618 1 .001 4.3391.361 .411 10.962 1 .001 3.902-.045 .007 42.223 1 .000 .956.379 .078 23.652 1 .000 1.461
-2.349 .466 25.393 1 .000 .095
perbed1depend15educateducat(1)educat(2)educat(3)educat(4)constrdistrictdistrict(1)district(2)district(3)district(4)district(5)district(6)district(7)district(8)district(9)hhinc1adeqConstant
Step1
a
B S.E. Wald df Sig. Exp(B)
Variable(s) entered on step 1: perbed1, depend15, educat, constr, district, hhinc1, adeq.a.
The model for the “vulnerable” vs “the non vulnerable” is specified as follows:
Omnibus Tests of Model Coefficients
297.710 18 .000297.710 18 .000297.710 18 .000
StepBlockModel
Step 1Chi-square df Sig.
Model Summary
1258.742a .219 .302Step1
-2 Loglikelihood
Cox & SnellR Square
NagelkerkeR Square
Estimation terminated at iteration number 7 becauseparameter estimates changed by less than .001.
a.

DRAFT REPORT: Volume III - Quantitative Assessment of Poverty in St. Lucia 56
Variables in the Equation for the "Vulnerable"
16.034 9 .066.348 .261 1.781 1 .182 1.416
1.139 .371 9.399 1 .002 3.122.325 .420 .596 1 .440 1.384.831 .410 4.105 1 .043 2.296.919 .390 5.537 1 .019 2.506.629 .327 3.706 1 .054 1.875.693 .322 4.649 1 .031 2.001.688 .326 4.465 1 .035 1.990.688 .296 5.418 1 .020 1.990
-.554 .093 35.672 1 .000 .57528.639 4 .000
-.573 .203 7.974 1 .005 .564-.993 .239 17.250 1 .000 .370
-1.129 .390 8.373 1 .004 .323-3.778 1.054 12.842 1 .000 .023
.072 .079 .842 1 .359 1.075
.562 .194 8.377 1 .004 1.754-.819 .188 18.951 1 .000 .441.455 .082 30.948 1 .000 1.576
-.733 .358 4.197 1 .041 .481
districtdistrict(1)district(2)district(3)district(4)district(5)district(6)district(7)district(8)district(9)employededucateducat(1)educat(2)educat(3)educat(4)depend15constrperbed1adeqConstant
Step1
a
B S.E. Wald df Sig. Exp(B)
Variable(s) entered on step 1: district, employed, educat, depend15, constr, perbed1,adeq.
a.
This model was also tested the unemployment status of the head of household as an explanatory variable; while this variable was significant only at the 5% level, its presence in the model adversely affected the Wald statistic of the household income variable which reduced the model’s overall validity. Consequently it was dropped from the model in favour of the number of employed persons which though not significant improved the overall validity of the model.
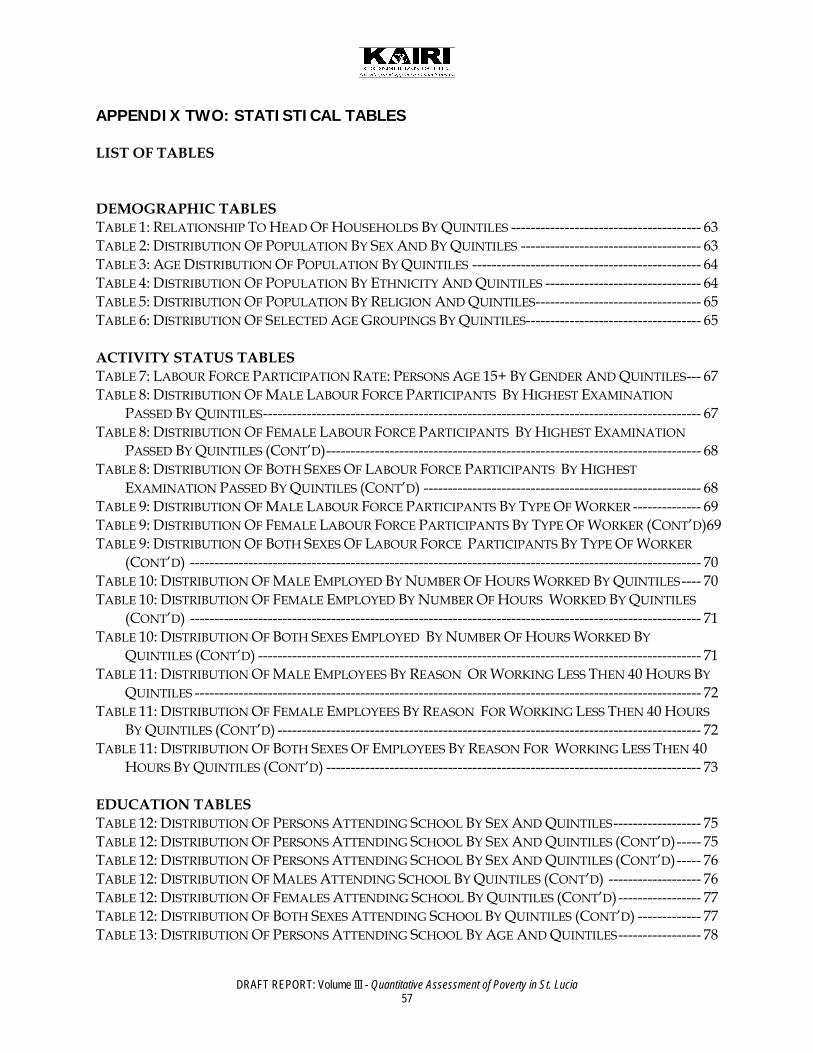
DRAFT REPORT: Volume III - Quantitative Assessment of Poverty in St. Lucia 57
APPENDIX TWO: STATISTICAL TABLES LIST OF TABLES DEMOGRAPHIC TABLES TABLE 1: RELATIONSHIP TO HEAD OF HOUSEHOLDS BY QUINTILES --------------------------------------- 63 TABLE 2: DISTRIBUTION OF POPULATION BY SEX AND BY QUINTILES ------------------------------------- 63 TABLE 3: AGE DISTRIBUTION OF POPULATION BY QUINTILES ----------------------------------------------- 64 TABLE 4: DISTRIBUTION OF POPULATION BY ETHNICITY AND QUINTILES -------------------------------- 64 TABLE 5: DISTRIBUTION OF POPULATION BY RELIGION AND QUINTILES---------------------------------- 65 TABLE 6: DISTRIBUTION OF SELECTED AGE GROUPINGS BY QUINTILES------------------------------------ 65 ACTIVITY STATUS TABLES TABLE 7: LABOUR FORCE PARTICIPATION RATE: PERSONS AGE 15+ BY GENDER AND QUINTILES--- 67 TABLE 8: DISTRIBUTION OF MALE LABOUR FORCE PARTICIPANTS BY HIGHEST EXAMINATION
PASSED BY QUINTILES------------------------------------------------------------------------------------------ 67 TABLE 8: DISTRIBUTION OF FEMALE LABOUR FORCE PARTICIPANTS BY HIGHEST EXAMINATION
PASSED BY QUINTILES (CONT’D)----------------------------------------------------------------------------- 68 TABLE 8: DISTRIBUTION OF BOTH SEXES OF LABOUR FORCE PARTICIPANTS BY HIGHEST
EXAMINATION PASSED BY QUINTILES (CONT’D) --------------------------------------------------------- 68 TABLE 9: DISTRIBUTION OF MALE LABOUR FORCE PARTICIPANTS BY TYPE OF WORKER -------------- 69 TABLE 9: DISTRIBUTION OF FEMALE LABOUR FORCE PARTICIPANTS BY TYPE OF WORKER (CONT’D)69 TABLE 9: DISTRIBUTION OF BOTH SEXES OF LABOUR FORCE PARTICIPANTS BY TYPE OF WORKER
(CONT’D) --------------------------------------------------------------------------------------------------------- 70 TABLE 10: DISTRIBUTION OF MALE EMPLOYED BY NUMBER OF HOURS WORKED BY QUINTILES---- 70 TABLE 10: DISTRIBUTION OF FEMALE EMPLOYED BY NUMBER OF HOURS WORKED BY QUINTILES
(CONT’D) --------------------------------------------------------------------------------------------------------- 71 TABLE 10: DISTRIBUTION OF BOTH SEXES EMPLOYED BY NUMBER OF HOURS WORKED BY
QUINTILES (CONT’D) ------------------------------------------------------------------------------------------- 71 TABLE 11: DISTRIBUTION OF MALE EMPLOYEES BY REASON OR WORKING LESS THEN 40 HOURS BY
QUINTILES -------------------------------------------------------------------------------------------------------- 72 TABLE 11: DISTRIBUTION OF FEMALE EMPLOYEES BY REASON FOR WORKING LESS THEN 40 HOURS
BY QUINTILES (CONT’D) --------------------------------------------------------------------------------------- 72 TABLE 11: DISTRIBUTION OF BOTH SEXES OF EMPLOYEES BY REASON FOR WORKING LESS THEN 40
HOURS BY QUINTILES (CONT’D) ----------------------------------------------------------------------------- 73 EDUCATION TABLES TABLE 12: DISTRIBUTION OF PERSONS ATTENDING SCHOOL BY SEX AND QUINTILES------------------ 75 TABLE 12: DISTRIBUTION OF PERSONS ATTENDING SCHOOL BY SEX AND QUINTILES (CONT’D)----- 75 TABLE 12: DISTRIBUTION OF PERSONS ATTENDING SCHOOL BY SEX AND QUINTILES (CONT’D)----- 76 TABLE 12: DISTRIBUTION OF MALES ATTENDING SCHOOL BY QUINTILES (CONT’D) ------------------- 76 TABLE 12: DISTRIBUTION OF FEMALES ATTENDING SCHOOL BY QUINTILES (CONT’D)----------------- 77 TABLE 12: DISTRIBUTION OF BOTH SEXES ATTENDING SCHOOL BY QUINTILES (CONT’D) ------------- 77 TABLE 13: DISTRIBUTION OF PERSONS ATTENDING SCHOOL BY AGE AND QUINTILES----------------- 78

DRAFT REPORT: Volume III - Quantitative Assessment of Poverty in St. Lucia 58
TABLE 14: DISTRIBUTION OF PERSONS NOT ATTENDING SCHOOL BY AGE AND QUINTILES ---------- 78 TABLE 14: DISTRIBUTION OF MALES BY REPORTED LITERACY STATUS BY QUINTILES ------------------ 79 TABLE 14: DISTRIBUTION OF FEMALES BY REPORTED LITERACY STATUS BY QUINTILES (CONT’D) -- 79 TABLE 14: DISTRIBUTION OF BOTH SEXES BY REPORTED LITERACY STATUS BY QUINTILES (CONT’D)79 TABLE 15: NUMBER OF DAYS MALES ATTENDING SCHOOL WEEKLY BY QUINTILES -------------------- 80 TABLE 15: NUMBER OF DAYS FEMALES ATTENDING SCHOOL WEEKLY BY QUINTILES (CONT’D) ---- 80 TABLE 15: NUMBER OF DAYS BOTH SEXES ATTENDING SCHOOL WEEKLY BY QUINTILES (CONT’D)- 81 TABLE 16: HIGHEST LEVEL OF EDUCATION ATTAINED BY MALE HEADS OF HOUSEHOLDS BY
QUINTILES -------------------------------------------------------------------------------------------------------- 81 TABLE16: HIGHEST LEVEL OF EDUCATION ATTAINED BY FEMALE HEADS OF HOUSEHOLDS BY
QUINTILES (CONT’D) ------------------------------------------------------------------------------------------- 82 TABLE 16: HIGHEST LEVEL OF EDUCATION ATTAINED BY MALE AND FEMALE HEADS OF
HOUSEHOLDS BY QUINTILES (CONT’D)--------------------------------------------------------------------- 82 TABLE 17: HIGHEST LEVEL OF EDUCATION ATTAINED BY MALES COMPLETING SCHOOL BY
QUINTILES -------------------------------------------------------------------------------------------------------- 83 TABLE 17: HIGHEST LEVEL OF EDUCATION ATTAINED BY FEMALES COMPLETING SCHOOL BY
QUINTILES (CONT’D) ------------------------------------------------------------------------------------------- 83 TABLE 17: HIGHEST LEVEL OF EDUCATION ATTAINED BY BOTH SEXES COMPLETING SCHOOL BY
QUINTILES (CONT’D) ------------------------------------------------------------------------------------------- 84 TABLE 18: DISTRIBUTION OF MALES WITH TECHNICAL OR VOCATIONAL TRAINING BY QUINTILES 84 TABLE 18: DISTRIBUTION OF FEMALES WITH TECHNICAL OR VOCATIONAL TRAINING BY QUINTILES
(CONT’D) --------------------------------------------------------------------------------------------------------- 85 TABLE 18: DISTRIBUTION OF BOTH SEXES WITH TECHNICAL OR VOCATIONAL TRAINING BY
QUINTILES (CONT’D) ------------------------------------------------------------------------------------------- 85 TABLE 19: DISTRIBUTION OF MALE YOUTHS WITH TECHNICAL OR VOCATIONAL TRAINING BY
QUINTILES -------------------------------------------------------------------------------------------------------- 85 TABLE 19: DISTRIBUTION OF FEMALE YOUTHS WITH TECHNICAL OR VOCATIONAL TRAINING BY
QUINTILES (CONT’D) ------------------------------------------------------------------------------------------- 86 TABLE 19: DISTRIBUTION OF BOTH SEXES OF YOUTHS WITH TECHNICAL OR VOCATIONAL
TRAINING BY QUINTILES (CONT’D) ------------------------------------------------------------------------- 86 TABLE 20: DISTRIBUTION OF MALES RECEIVING FREE MEALS OR SNACKS FROM MEAL SERVICE BY
QUINTILES -------------------------------------------------------------------------------------------------------- 86 TABLE 20: DISTRIBUTION OF FEMALES RECEIVING FREE MEALS OR SNACKS FROM MEAL SERVICE BY
QUINTILES (CONT’D) ------------------------------------------------------------------------------------------- 87 TABLE 20: DISTRIBUTION OF BOTH SEXES RECEIVING FREE MEALS OR SNACKS FROM MEAL SERVICE
BY QUINTILES (CONT’D) --------------------------------------------------------------------------------------- 87 TABLE 21: REPORTED OWNERSHIP OF SCHOOL BOOKS BY MALES BY QUINTILES------------------------ 87 TABLE 21: REPORTED OWNERSHIP OF SCHOOL BOOKS BY FEMALES BY QUINTILES (CONT’D) -------- 88 TABLE 21: REPORTED OWNERSHIP OF SCHOOL BOOKS BY BOTH SEXES BY QUINTILES (CONT’D) ---- 88 TABLE 22: REPORTED REASONS FOR NOT OWNING ALL TEXT BOOKS BY MALES BY QUINTILES ----- 88 TABLE 22: REPORTED REASONS FOR NOT OWNING ALL TEXT BOOKS BY FEMALES BY QUINTILES
(CONT’D) --------------------------------------------------------------------------------------------------------- 89 TABLE 22: REPORTED REASONS FOR NOT OWNING ALL TEXT BOOKS BY BOTH SEXES BY QUINTILES
(CONT’D) --------------------------------------------------------------------------------------------------------- 89

DRAFT REPORT: Volume III - Quantitative Assessment of Poverty in St. Lucia 59
TABLE 23: DISTRIBUTION OF MALES ATTENDING SCHOOL USING BOOK LOAN FACILITY BY QUINTILES -------------------------------------------------------------------------------------------------------- 89
TABLE 23: DISTRIBUTION OF FEMALES ATTENDING SCHOOL USING BOOK LOAN FACILITY BY QUINTILES (CONT’D) ------------------------------------------------------------------------------------------- 90
TABLE 23: DISTRIBUTION OF BOTH SEXES ATTENDING SCHOOL USING BOOK LOAN FACILITY BY QUINTILES (CONT’D) ------------------------------------------------------------------------------------------- 90
TABLE 24: HIGHEST LEVEL OF EDUCATION OF MALES NOT ATTENDING SCHOOL BY QUINTILES --- 90 TABLE 24: HIGHEST LEVEL OF EDUCATION OF FEMALES NOT ATTENDING SCHOOL BY QUINTILES
(CONT’D) --------------------------------------------------------------------------------------------------------- 91 TABLE 24: HIGHEST LEVEL OF EDUCATION OF BOTH SEXES NOT ATTENDING SCHOOL BY QUINTILES
(CONT’D) --------------------------------------------------------------------------------------------------------- 91 TABLE 25: HIGHEST EXAMINATION PASSED BY MALES NOT ATTENDING SCHOOL BY QUINTILES --- 92 TABLE 25: HIGHEST EXAMINATION PASSED BY FEMALES NOT ATTENDING SCHOOL BY QUINTILES
(CONT’D) --------------------------------------------------------------------------------------------------------- 92 TABLE 25: HIGHEST EXAMINATION PASSED BY BOTH SEXES NOT ATTENDING SCHOOL BY
QUINTILES (CONT’D) ------------------------------------------------------------------------------------------- 93 HEALTH TABLES TABLE 26: DISTRIBUTION OF MALES CONFINED TO BED BY QUINTILES ----------------------------------- 95 TABLE 26: DISTRIBUTION OF FEMALES CONFINED TO BED BY QUINTILES (CONT’D)-------------------- 95 TABLE 26: DISTRIBUTION OF BOTH SEXES CONFINED TO BED BY QUINTILES (CONT’D) ---------------- 95 TABLE 27: TYPE OF ILLNESS OR INJURY CONFINING MALES TO BED BY QUINTILES--------------------- 96 TABLE 27: TYPE OF ILLNESS OR INJURY CONFINING FEMALES TO BED BY QUINTILES (CONT’D) ----- 97 TABLE 27: TYPE OF ILLNESS OR INJURY CONFINING BOTH SEXES TO BED BY QUINTILES (CONT’D) - 98 TABLE 28: MALES REPORTING ILLNESS OR INJURY BY QUINTILES------------------------------------------- 99 TABLE 28: FEMALES REPORTING ILLNESS OR INJURY BY QUINTILES (CONT’D) --------------------------- 99 TABLE 28: BOTH SEXES REPORTING ILLNESS OR INJURY BY QUINTILES (CONT’D) ----------------------- 99 TABLE 29: TYPE OF ILLNESS OR INJURY CONFINING MALES TO BED BY QUINTILES--------------------100 TABLE 29: TYPE OF ILLNESS OR INJURY CONFINING FEMALES TO BED BY QUINTILES (CONT’D) ----101 TABLE 29: TYPE OF ILLNESS OR INJURY CONFINING BOTH SEXES TO BED BY QUINTILES (CONT’D) 102 TABLE 30: DISTRIBUTION OF MALES SUFFERING FROM LIFESTYLE DISEASES BY QUINTILES ----------103 TABLE 30: DISTRIBUTION OF FEMALES SUFFERING FROM LIFESTYLE DISEASES BY QUINTILES
(CONT’D) --------------------------------------------------------------------------------------------------------103 TABLE 30: DISTRIBUTION OF BOTH SEXES SUFFERING FROM LIFESTYLE DISEASES BY QUINTILES
(CONT’D) --------------------------------------------------------------------------------------------------------103 TABLE 31: TOTAL NUMBER OF MALES REPORTING INJURY OR ILLNESS BY QUINTILES ----------------104 TABLE 31: TOTAL NUMBER OF FEMALES REPORTING INJURY OR ILLNESS BY QUINTILES (CONT’D) 104 TABLE 31: TOTAL NUMBER OF BOTH SEXES REPORTING INJURY OR ILLNESS BY QUINTILES (CONT’D)104 TABLE 32: DISTRIBUTION OF MALES SEEKING MEDICAL ATTENTION BY QUINTILES-------------------105 TABLE 32: DISTRIBUTION OF FEMALES SEEKING MEDICAL ATTENTION BY QUINTILES (CONT’D) ---105 TABLE 32: DISTRIBUTION OF BOTH SEXES SEEKING MEDICAL ATTENTION BY QUINTILES (CONT’D)105 TABLE 33: REASONS FOR MALES NOT SEEKING MEDICAL ATTENTION BY QUINTILES-----------------106 TABLE 33: REASONS FOR FEMALES NOT SEEKING MEDICAL ATTENTION BY SEX AND QUINTILES
(CONT’D) --------------------------------------------------------------------------------------------------------106 TABLE 33: REASONS FOR BOTH SEXES NOT SEEKING MEDICAL ATTENTION BY QUINTILES (CONT’D)106

DRAFT REPORT: Volume III - Quantitative Assessment of Poverty in St. Lucia 60
TABLE 34: MEAN DAYS MALES UNABLE TO WORK AND DAYS WITHOUT PAY BY QUINTILES-------107 TABLE 34: MEAN DAYS FEMALES UNABLE TO WORK AND DAYS WITHOUT PAY BY QUINTILES
(CONT’D) --------------------------------------------------------------------------------------------------------107 TABLE 34: MEAN DAYS BOTH SEXES UNABLE TO WORK AND DAYS WITHOUT PAY BY QUINTILES
(CONT’D) --------------------------------------------------------------------------------------------------------107 TABLE 35: PLACE FIRST VISITED BY MALES FOR MEDICAL ATTENTION BY QUINTILES ----------------108 TABLE 35: PLACE FIRST VISITED BY FEMALES FOR MEDICAL ATTENTION BY QUINTILES (CONT’D)-108 TABLE 35: PLACE FIRST VISITED BY BOTH SEXES FOR MEDICAL ATTENTION BY QUINTILES (CONT’D)109 TABLE 36: PERSON PROVIDING MEDICAL ATTENTION TO MALES BY QUINTILES -----------------------109 TABLE 36 (CONT’D): PERSON PROVIDING MEDICAL ATTENTION TO FEMALES BY QUINTILES -------110 TABLE 36 (CONT’D): PERSON PROVIDING MEDICAL ATTENTION TO BOTH SEXES BY QUINTILES----110 TABLE 37: REPORTED LEVEL OF SATISFACTION OF MALES WITH MEDICAL SERVICE BY QUINTILES110 TABLE 37 (CONT’D): REPORTED LEVEL OF SATISFACTION OF FEMALES WITH MEDICAL SERVICE BY
QUINTILES -------------------------------------------------------------------------------------------------------111 TABLE 37 (CONT’D): REPORTED LEVEL OF SATISFACTION OF BOTH SEXES WITH MEDICAL SERVICE
BY QUINTILES ---------------------------------------------------------------------------------------------------111 TABLE 38: REASONS FOR DISSATISFACTION OF MALES WITH REPORTED LEVEL OF SATISFACTION
WITH MEDICAL SERVICE BY QUINTILES -------------------------------------------------------------------112 TABLE 38 (CONT’D): REASONS FOR DISSATISFACTION OF FEMALES WITH REPORTED LEVEL OF
SATISFACTION WITH MEDICAL SERVICE BY QUINTILES------------------------------------------------112 TABLE 38 (CONT’D): REASONS FOR DISSATISFACTION OF BOTH SEXES WITH REPORTED LEVEL OF
SATISFACTION WITH MEDICAL SERVICE BY SEX AND QUINTILES------------------------------------113 TABLE 39: MEAN TIME (MINS.) MALES SPENT WAITING FOR MEDICAL TREATMENT BY QUINTILES113 TABLE 39 (CONT’D): MEAN TIME (MINS.) FEMALES SPENT WAITING FOR MEDICAL TREATMENT BY
SEX AND QUINTILES-------------------------------------------------------------------------------------------113 TABLE 39 (CONT’D): MEAN TIME (MINS.) BOTH SEXES SPENT WAITING FOR MEDICAL TREATMENT
BY SEX AND QUINTILES---------------------------------------------------------------------------------------114 TABLE 40: MEAN TIME SPENT WAITING FOR TREATMENT BY PLACE VISITED FOR MEDICAL CARE 114 TABLE 41: DISTRIBUTION OF MALES COVERED BY MEDICAL INSURANCE BY QUINTILES -------------114 TABLE 41 (CONT’D): DISTRIBUTION OF FEMALES COVERED BY MEDICAL INSURANCE BY QUINTILES115 TABLE 41 (CONT’D): DISTRIBUTION OF BOTH SEXES COVERED BY MEDICAL INSURANCE BY
QUINTILES -------------------------------------------------------------------------------------------------------115 ANTHROPOMETRIC TABLES TABLE 42: CHARACTERISTICS OF CHILDREN UNDER 5 YEARS IN QUINTILES ----------------------------117 TABLE 43: PLACE CHILD DELIVERED BY QUINTILES-----------------------------------------------------------117 TABLE 44: CHILDREN SUFFERING FROM DIARRHOEA BY SOCIO ECONOMIC STATUS BY QUINTILES 117 TABLE 45:CHILDREN PREVIOUSLY BREAST FED BY SOCIO ECONOMIC STATUS --------------------------118 TABLE 46: CHILDREN PRESENTLY BREAST FED BY AGE AND SOCIO ECONOMIC STATUS--------------118 TABLE 47: IMMUNIZATION RECEIVED BY CHILDREN UNDER 5 YEARS BY QUINTILES ------------------118 TABLE 48: IMMUNIZATION RECEIVED BY AGE OF CHILD BY QUINTILES----------------------------------119 HOUSING TABLES TABLE 49: HOUSEHOLD CHARACTERISTICS: MAIN MATERIAL OF OUTER WALLS BY QUINTILES ---121 TABLE 50: HOUSEHOLD CHARACTERISTICS: TYPE OF DWELLING UNIT BY QUINTILES ----------------121

DRAFT REPORT: Volume III - Quantitative Assessment of Poverty in St. Lucia 61
TABLE 51: HOUSEHOLD CHARACTERISTICS: TYPE OF DWELLING UNIT BY DISTRICT ------------------122 TABLE 52: HOUSEHOLD CHARACTERISTICS: MAIN ROOFING MATERIAL BY QUINTILES---------------122 TABLE 53: HOUSEHOLD CHARACTERISTICS: MAIN ROOFING MATERIAL BY DISTRICT-----------------123 TABLE 54: HOUSEHOLD CHARACTERISTICS: TENANCY OF LAND BY QUINTILES------------------------123 TABLE 55: HOUSEHOLD CHARACTERISTICS: TENANCY OF LAND BY DISTRICT--------------------------124 TABLE 56: HOUSEHOLD CHARACTERISTICS: TENANCY OF DWELLING BY QUINTILES -----------------124 TABLE 57: HOUSEHOLD CHARACTERISTICS: TENANCY OF DWELLING BY DISTRICT -------------------125 TABLE 58: HOUSEHOLD CHARACTERISTICS: MAIN COOKING FUEL USED BY QUINTILES -------------125 TABLE 59: HOUSEHOLD CHARACTERISTICS: MAIN COOKING FUEL USED BY DISTRICT----------------126 TABLE 60: HOUSEHOLD CHARACTERISTICS: MAIN COOKING FUEL USED BY QUINTILES -------------126 TABLE 61: HOUSEHOLD CHARACTERISTICS: MAIN COOKING FUEL USED BY DISTRICT----------------127 TABLE 62: HOUSEHOLD CHARACTERISTICS: MAIN COOKING FUEL USED BY QUINTILES -------------127 TABLE 63: HOUSEHOLD CHARACTERISTICS: MAIN COOKING FUEL USED BY DISTRICT----------------128 TABLE 64: HOUSEHOLD CHARACTERISTICS: TOILET FACILITY USED BY QUINTILES --------------------128 TABLE 65: HOUSEHOLD CHARACTERISTICS: TOILET FACILITIES USED BY DISTRICT --------------------129 TABLE 66: HOUSEHOLD CHARACTERISTICS: FACILITIES SHARED BY QUINTILES ------------------------129 TABLE 67: HOUSEHOLD CHARACTERISTICS: MAIN SOURCE OF WATER BY QUINTILES ----------------130 TABLE 68: HOUSEHOLD CHARACTERISTICS: MAIN SOURCE OF WATER BY DISTRICT ------------------130 TABLE 69: HOUSEHOLD CHARACTERISTICS: MAIN FREQUENCY OF WATER SUPPLY BY QUINTILES 131 TABLE 70: HOUSEHOLD CHARACTERISTICS: FREQUENCY OF WATER SUPPLY BY DISTRICT-----------131 TABLE 71: HOUSEHOLD CHARACTERISTICS: MAIN SOURCE OF LIGHTING BY QUINTILES-------------132 TABLE 72: HOUSEHOLD CHARACTERISTICS: MAIN SOURCE OF LIGHTING BY DISTRICT---------------132 TABLE 73: HOUSEHOLD CHARACTERISTICS: AGE OF DWELLING BY QUINTILES ------------------------133 TABLE 74: HOUSEHOLD CHARACTERISTICS: AGE OF DWELLING BY DISTRICT --------------------------133 TABLE 75: SOCIO ECONOMIC RATING OF HOUSEHOLD BY QUINTILES------------------------------------134 TABLE 76: SOCIO ECONOMIC RATING OF HOUSEHOLDS BY DISTRICT-------------------------------------134 TABLE 77: MEAN NUMBER OF ROOMS AND USE OF ROOMS BY QUINTILES -----------------------------135

DRAFT REPORT: Volume III - Quantitative Assessment of Poverty in St. Lucia 62
Demographic Tables

DRAFT REPORT: Volume III - Quantitative Assessment of Poverty in St. Lucia 63
TABLE 1: RELATIONSHIP TO HEAD OF HOUSEHOLDS BY QUINTILES
Per Capita Consumption Quintiles
Poorest II III IV Richest Relationship to Head of Household
%
All St Lucia
Head 20.8 23.3 26.0 30.4 40.0 28.1 Spouse/partner 9.7 11.8 12.1 14.4 18.4 13.3 Child 51.0 43.7 38.9 38.7 29.2 40.3 Son/daughter-in-law .3 .7 .7 .6 .1 .5 Grandchild 11.3 12.9 11.5 8.3 4.8 9.8 Parent/parent-in-law 1.2 .9 1.8 .9 1.3 1.2 Other relative 5.3 5.2 7.8 4.6 5.7 5.7 Non-relative .5 1.4 1.1 1.9 .6 1.1 Not Stated - .1 - .1 - .0 All St Lucia 100.0 100.0 100.0 100.0 100.0 100.0
TABLE 2: DISTRIBUTION OF POPULATION BY SEX AND BY QUINTILES
Per Capita Consumption Quintiles
Poorest II III IV Richest Sex
% Total
Male 52.7 48.6 46.3 45.3 47.1 48.0 Female 47.3 51.4 53.7 54.7 52.9 52.0
Total 100.0 100.0 100.0 100.0 100.0 100.0
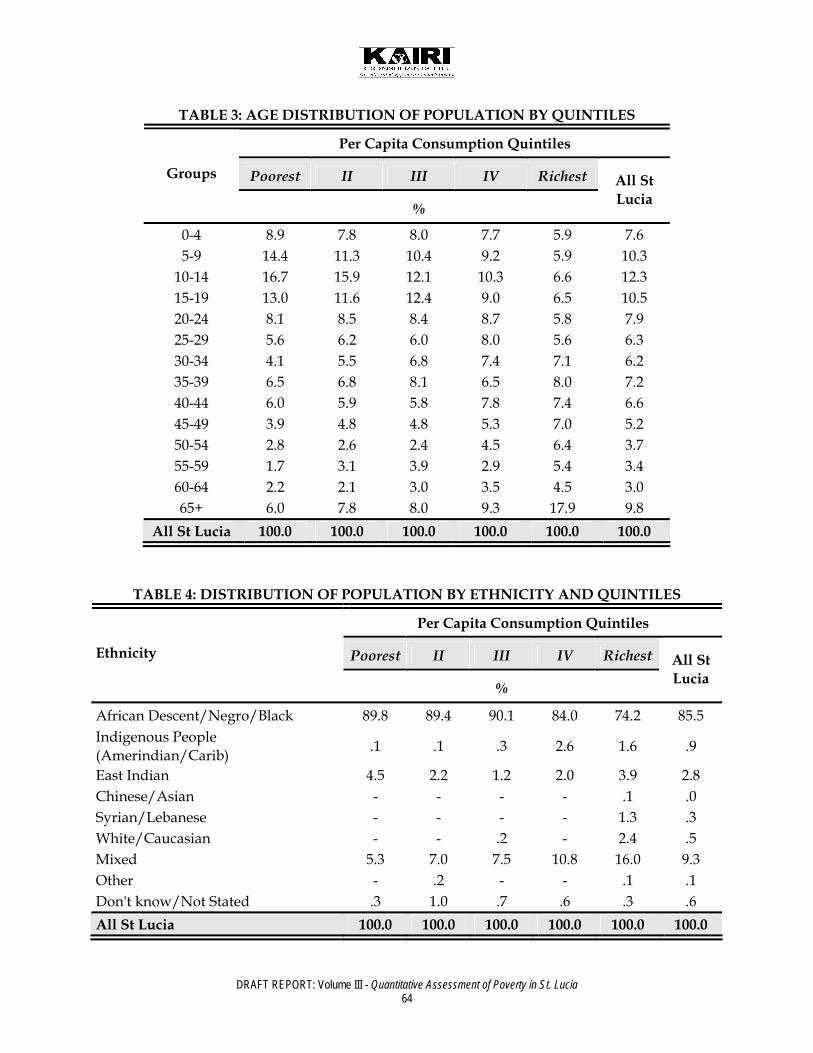
DRAFT REPORT: Volume III - Quantitative Assessment of Poverty in St. Lucia 64
TABLE 3: AGE DISTRIBUTION OF POPULATION BY QUINTILES
Per Capita Consumption Quintiles
Poorest II III IV Richest Groups
%
All St Lucia
0-4 8.9 7.8 8.0 7.7 5.9 7.6 5-9 14.4 11.3 10.4 9.2 5.9 10.3
10-14 16.7 15.9 12.1 10.3 6.6 12.3 15-19 13.0 11.6 12.4 9.0 6.5 10.5 20-24 8.1 8.5 8.4 8.7 5.8 7.9 25-29 5.6 6.2 6.0 8.0 5.6 6.3 30-34 4.1 5.5 6.8 7.4 7.1 6.2 35-39 6.5 6.8 8.1 6.5 8.0 7.2 40-44 6.0 5.9 5.8 7.8 7.4 6.6 45-49 3.9 4.8 4.8 5.3 7.0 5.2 50-54 2.8 2.6 2.4 4.5 6.4 3.7 55-59 1.7 3.1 3.9 2.9 5.4 3.4 60-64 2.2 2.1 3.0 3.5 4.5 3.0 65+ 6.0 7.8 8.0 9.3 17.9 9.8
All St Lucia 100.0 100.0 100.0 100.0 100.0 100.0
TABLE 4: DISTRIBUTION OF POPULATION BY ETHNICITY AND QUINTILES
Per Capita Consumption Quintiles
Poorest II III IV Richest Ethnicity
%
All St Lucia
African Descent/Negro/Black 89.8 89.4 90.1 84.0 74.2 85.5 Indigenous People (Amerindian/Carib) .1 .1 .3 2.6 1.6 .9
East Indian 4.5 2.2 1.2 2.0 3.9 2.8 Chinese/Asian - - - - .1 .0 Syrian/Lebanese - - - - 1.3 .3 White/Caucasian - - .2 - 2.4 .5 Mixed 5.3 7.0 7.5 10.8 16.0 9.3 Other - .2 - - .1 .1 Don't know/Not Stated .3 1.0 .7 .6 .3 .6 All St Lucia 100.0 100.0 100.0 100.0 100.0 100.0

DRAFT REPORT: Volume III - Quantitative Assessment of Poverty in St. Lucia 65
TABLE 5: DISTRIBUTION OF POPULATION BY RELIGION AND QUINTILES
Per Capita Consumption Quintiles
Poorest II III IV Richest Religion
%
All St Lucia
Anglican 1.3 1.3 .5 2.0 5.9 2.2 Baptist 1.2 .9 .8 2.3 2.4 1.5 Brethren - - - .9 .1 .2 Church of God 1.5 1.1 2.1 3.0 1.1 1.8 Evangelical - .7 3.5 2.4 3.0 1.9 Hindu - - - - .6 .1 Jehovah Witnesses .1 1.3 1.6 - 2.8 1.2 Methodist .5 - - .9 .9 .5 Muslim - .6 - - - .1 Pentecostal 6.8 8.8 4.5 8.9 6.6 7.1 Presbyterian - .1 - .2 - .1 Rastafarian 3.1 1.4 .7 1.0 1.3 1.5 Roman Catholic 75.1 67.9 67.5 67.0 66.0 68.7 Salvation Army .2 .2 .2 .2 - .2 Seventh Day Adventist 6.3 11.0 13.0 7.0 4.8 8.4
None 1.9 3.9 4.0 2.2 2.5 2.9 Not Stated .5 .6 .7 .7 .5 .6 Other 1.6 .2 .9 1.3 1.5 1.1 All St Lucia 100.0 100.0 100.0 100.0 100.0 100.0
TABLE 6: DISTRIBUTION OF SELECTED AGE GROUPINGS BY QUINTILES
Per Capita Consumption Quintiles
Poorest II III IV Richest Age Groups
%
All St Lucia
Under 5 8.9 7.8 8.0 7.7 5.9 7.6 Youths (15-24) 21.1 20.1 20.8 17.7 12.3 18.4
Elderly 6.0 7.8 8.0 9.3 17.9 9.8 Other 64.0 64.2 63.2 65.3 64.0 64.1 All St Lucia 100.0 100.0 100.0 100.0 100.0 100.0

DRAFT REPORT: Volume III - Quantitative Assessment of Poverty in St. Lucia 66
ACTIVITY STATUS TABLES

DRAFT REPORT: Volume III - Quantitative Assessment of Poverty in St. Lucia 67
TABLE 7: LABOUR FORCE PARTICIPATION RATE: PERSONS AGE 15+ BY GENDER AND QUINTILES
Per Capita Consumption Quintiles
Poorest II III IV Richest Sex
%
All St Lucia
Male 52.4 46.4 47.9 45.2 49.0 48.0 Female 47.6 53.6 52.1 54.8 51.0 52.0
All St Lucia 100.0 100.0 100.0 100.0 100.0 100.0
TABLE 8: DISTRIBUTION OF MALE LABOUR FORCE PARTICIPANTS BY HIGHEST EXAMINATION PASSED BY QUINTILES
Per Capita Consumption Quintiles
Poorest II III IV Richest Highest Examination Passed
%
All St Lucia
None 81.7 59.8 56.1 58.7 40.3 56.7 School Leaving 7.3 22.5 19.2 20.4 13.3 16.5 CXC Basic - - - 4.4 3.7 1.9 CXC 1-4 Passes 1.9 8.9 5.5 2.9 3.9 4.6 CXC 5 and More Passes 3.6 1.4 8.2 3.0 11.3 6.2 A Level - - - 1.6 1.0 .6 Diploma - 4.5 2.9 6.1 6.5 4.3 Associate Degree - - - - 1.0 .3 Undergraduate Degree - - - - 3.8 1.1 Post Graduate Degree - 1.5 - 1.5 9.4 3.2 Professional Qualification - - 2.7 - 3.8 1.6 Other - - 2.8 1.5 - .8 Not Stated 5.5 1.4 2.7 - 1.9 2.2 All St Lucia 100.0 100.0 100.0 100.0 100.0 100.0

DRAFT REPORT: Volume III - Quantitative Assessment of Poverty in St. Lucia 68
TABLE 8: DISTRIBUTION OF FEMALE LABOUR FORCE PARTICIPANTS BY HIGHEST EXAMINATION PASSED BY QUINTILES (CONT’D)
Per Capita Consumption Quintiles Poorest II III IV Richest
Highest Examination Passed
% All St Lucia
None 69.1 58.8 55.5 47.0 35.1 51.0 School Leaving 17.0 24.0 18.7 23.8 20.5 21.0 CXC Basic - 3.9 4.6 2.2 .9 2.4 CXC 1-4 Passes 5.3 4.0 8.1 9.1 5.4 6.5 CXC 5 and More Passes 3.4 5.3 3.6 11.1 12.1 7.7 A Level 1.8 - - 1.1 1.8 1.0 Diploma - 1.3 2.5 3.4 7.5 3.4 Associate Degree - 1.3 - 1.1 2.7 1.2 Undergraduate Degree - - - - 3.7 1.0 Post Graduate Degree - - - - 2.8 .7 Professional Qualification - - - 1.2 4.7 1.5 Other - 1.3 3.4 - .9 1.2 Not Stated 3.4 - 3.4 - 1.8 1.6 All St Lucia 100.0 100.0 100.0 100.0 100.0 100.0
TABLE 8: DISTRIBUTION OF BOTH SEXES OF LABOUR FORCE PARTICIPANTS
BY HIGHEST EXAMINATION PASSED BY QUINTILES (CONT’D) Per Capita Consumption Quintiles
Poorest II III IV Richest Highest Examination Passed
%
All St Lucia
None 75.3 59.3 55.8 52.1 37.7 53.7 School Leaving 12.3 23.3 18.9 22.3 17.0 18.9 CXC Basic - 2.1 2.5 3.2 2.3 2.1 CXC 1-4 Passes 3.6 6.3 6.9 6.4 4.7 5.6 CXC 5 and More Passes 3.5 3.5 5.7 7.6 11.7 7.0
A Level .9 - - 1.3 1.4 .8 Diploma - 2.8 2.7 4.6 7.0 3.8 Associate Degree - .7 - .7 1.9 .8 Undergraduate Degree - - - - 3.8 1.0
Post Graduate Degree - .7 - .6 6.1 1.9 Professional Qualification - - 1.2 .7 4.2 1.5
Other - .7 3.1 .6 .5 1.0 Not Stated 4.4 .7 3.1 - 1.8 1.9 All St Lucia 100.0 100.0 100.0 100.0 100.0 100.0
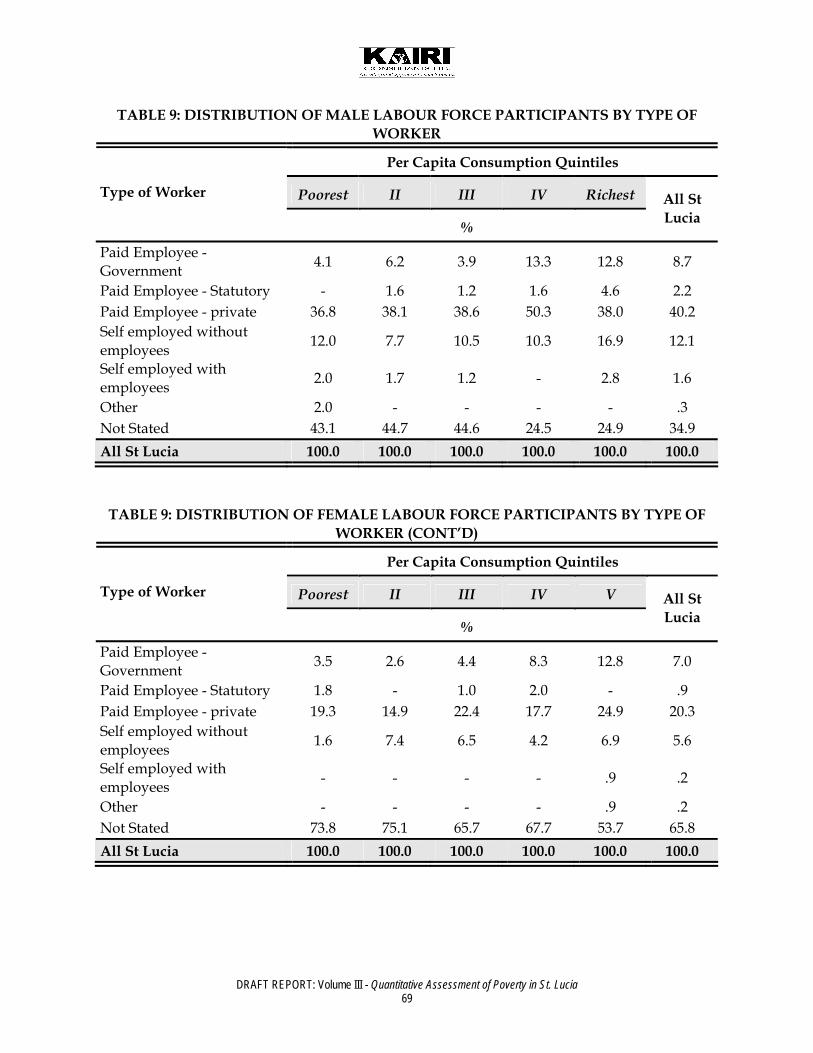
DRAFT REPORT: Volume III - Quantitative Assessment of Poverty in St. Lucia 69
TABLE 9: DISTRIBUTION OF MALE LABOUR FORCE PARTICIPANTS BY TYPE OF WORKER
Per Capita Consumption Quintiles
Poorest II III IV Richest Type of Worker
%
All St Lucia
Paid Employee - Government 4.1 6.2 3.9 13.3 12.8 8.7
Paid Employee - Statutory - 1.6 1.2 1.6 4.6 2.2 Paid Employee - private 36.8 38.1 38.6 50.3 38.0 40.2 Self employed without employees 12.0 7.7 10.5 10.3 16.9 12.1
Self employed with employees 2.0 1.7 1.2 - 2.8 1.6
Other 2.0 - - - - .3 Not Stated 43.1 44.7 44.6 24.5 24.9 34.9 All St Lucia 100.0 100.0 100.0 100.0 100.0 100.0
TABLE 9: DISTRIBUTION OF FEMALE LABOUR FORCE PARTICIPANTS BY TYPE OF WORKER (CONT’D)
Per Capita Consumption Quintiles
Poorest II III IV V Type of Worker
%
All St Lucia
Paid Employee - Government 3.5 2.6 4.4 8.3 12.8 7.0
Paid Employee - Statutory 1.8 - 1.0 2.0 - .9 Paid Employee - private 19.3 14.9 22.4 17.7 24.9 20.3 Self employed without employees 1.6 7.4 6.5 4.2 6.9 5.6
Self employed with employees - - - - .9 .2
Other - - - - .9 .2 Not Stated 73.8 75.1 65.7 67.7 53.7 65.8 All St Lucia 100.0 100.0 100.0 100.0 100.0 100.0

DRAFT REPORT: Volume III - Quantitative Assessment of Poverty in St. Lucia 70
TABLE 9: DISTRIBUTION OF BOTH SEXES OF LABOUR FORCE PARTICIPANTS BY TYPE OF WORKER (CONT’D)
Per Capita Consumption Quintiles
Poorest II III IV Richest Type of Worker
%
All St Lucia
Paid Employee - Government 3.8 4.1 4.2 10.4 12.8 7.7
Paid Employee - Statutory 1.0 .7 1.1 1.9 2.2 1.5 Paid Employee - private 27.6 25.1 29.8 31.2 31.2 29.3 Self employed without employees 6.5 7.5 8.3 6.7 11.7 8.6
Self employed with employees 1.0 .7 .6 - 1.8 .9
Other 1.0 - - - .4 .3 Not Stated 59.2 61.8 56.1 49.8 39.8 51.8 All St Lucia 100.0 100.0 100.0 100.0 100.0 100.0
TABLE 10: DISTRIBUTION OF MALE EMPLOYED BY NUMBER OF HOURS WORKED BY
QUINTILES
Per Capita Consumption Quintiles
Poorest II III IV Richest Hours Worked Past Week
%
All St Lucia
Under 1 Hour 46.5 45.8 42.3 24.0 21.1 34.5 1-8 Hours - - 1.5 - - .3 9-16 Hours - 1.4 - 4.2 1.1 1.3 17-24 Hours - - 4.2 1.4 1.1 1.4 25-34 Hours 5.1 - 2.7 1.3 2.9 2.4 35-40 Hours 24.3 30.6 27.1 32.7 43.1 32.6 41-50 Hours 10.2 17.8 13.9 17.3 8.3 13.2 51-60 Hours 8.8 1.5 6.9 13.3 9.1 8.0 61-70 Hours 1.7 - 1.4 4.3 2.0 1.9 71+ Hours 3.4 2.9 - 1.5 10.2 4.1 Not Stated - - - - 1.1 .3 All St Lucia 100.0 100.0 100.0 100.0 100.0 100.0

DRAFT REPORT: Volume III - Quantitative Assessment of Poverty in St. Lucia 71
TABLE 10: DISTRIBUTION OF FEMALE EMPLOYED BY NUMBER OF HOURS WORKED BY QUINTILES (CONT’D)
Per Capita Consumption Quintiles
Poorest II III IV Richest Hours Worked Past Week
%
All St Lucia
Under 1 Hour 76.0 70.4 62.8 64.6 48.6 63.1 1-8 Hours - - - - 2.0 .5 9-16 Hours 1.8 2.5 3.3 - - 1.4 17-24 Hours 1.7 1.3 - 2.2 .9 1.2 25-34 Hours 5.1 3.8 3.4 2.4 3.0 3.4 35-40 Hours 8.5 12.9 22.9 24.0 29.7 20.8 41-50 Hours 5.2 9.2 5.4 5.7 12.7 7.9 51-60 Hours 1.7 - 2.2 1.1 2.1 1.4 61-70 Hours - - - - .9 .2 71+ Hours - - - - - - Not Stated - - - - - - All St Lucia 100.0 100.0 100.0 100.0 100.0 100.0
TABLE 10: DISTRIBUTION OF BOTH SEXES EMPLOYED BY NUMBER OF HOURS WORKED BY QUINTILES (CONT’D)
Per Capita Consumption Quintiles
Poorest II III IV Richest Hours Worked Past Week
%
All St Lucia
Under 1 Hour 61.2 59.0 53.7 46.5 35.0 49.6 1-8 Hours - - .6 - 1.0 .4 9-16 Hours .9 2.0 1.8 1.9 .5 1.4 17-24 Hours .8 .7 1.9 1.9 1.0 1.3 25-34 Hours 5.1 2.0 3.1 1.9 2.9 2.9 35-40 Hours 16.4 21.1 24.8 27.9 36.4 26.4 41-50 Hours 7.7 13.2 9.2 10.8 10.5 10.4 51-60 Hours 5.2 .7 4.3 6.5 5.6 4.5 61-70 Hours .9 - .6 1.9 1.5 1.0 71+ Hours 1.7 1.4 - .6 5.1 1.9 Not Stated - - - - .5 .1 All St Lucia 100.0 100.0 100.0 100.0 100.0 100.0

DRAFT REPORT: Volume III - Quantitative Assessment of Poverty in St. Lucia 72
TABLE 11: DISTRIBUTION OF MALE EMPLOYEES BY REASON OR WORKING LESS THEN 40 HOURS BY QUINTILES
Per Capita Consumption Quintiles
Poorest II III IV Richest Reason Working For Less Than 35 Years
%
All St Lucia
Own illness/injury - - 5.4 4.3 4.2 2.7 Personal/family responsibilities - - - - - - Job ended in reference week 3.5 3.0 5.7 4.3 - 3.4 Firm not getting enough work - - - - - - Could not find more work 3.3 - 2.7 4.4 3.7 2.7 Part Time Work - - - - - - Other 3.1 - 2.7 - 3.7 2.0 99 90.1 97.0 83.5 86.9 88.4 89.2 All St Lucia 100.0 100.0 100.0 100.0 100.0 100.0
TABLE 11: DISTRIBUTION OF FEMALE EMPLOYEES BY REASON FOR WORKING LESS THEN 40 HOURS BY QUINTILES (CONT’D)
Per Capita Consumption Quintiles
Poorest II III IV Richest Reason Working For Less Than 35 Years - Female
%
All St Lucia
Own illness/injury - - - - - - Personal/family responsibilities - - - - 1.9 .4
Job ended in reference week 8.1 1.8 1.7 3.5 1.7 3.2 Firm not getting enough work 1.9 - - - - .3 Could not find more work 2.1 3.1 1.5 1.6 1.8 2.0 Part Time Work 2.0 3.2 4.6 - 5.6 3.1 Other - 1.5 - 1.6 1.8 1.0 99 86.0 90.4 92.1 93.3 87.2 90.0 All St Lucia 100.0 100.0 100.0 100.0 100.0 100.0

DRAFT REPORT: Volume III - Quantitative Assessment of Poverty in St. Lucia 73
TABLE 11: DISTRIBUTION OF BOTH SEXES OF EMPLOYEES BY REASON FOR WORKING LESS THEN 40 HOURS BY QUINTILES (CONT’D)
Per Capita Consumption Quintiles
Poorest II III IV Richest Reason Working For Less Than 35 Years – All St Lucia
%
All St Lucia
Own illness/injury - - 2.0 1.2 1.3 .9 Personal/family responsibilities - - - - 1.3 .2 Job ended in reference week 6.3 2.2 3.2 3.7 1.2 3.3 Firm not getting enough work 1.2 - - - - .2 Could not find more work 2.6 2.0 2.0 2.4 2.4 2.3 Part Time Work 1.2 2.1 2.9 - 3.8 2.0 Other 1.2 1.0 1.0 1.2 2.4 1.3 Not Stated 87.5 92.7 88.9 91.6 87.6 89.7 All St Lucia 100.0 100.0 100.0 100.0 100.0 100.0

DRAFT REPORT: Volume III - Quantitative Assessment of Poverty in St. Lucia 74
Education Tables

DRAFT REPORT: Volume III - Quantitative Assessment of Poverty in St. Lucia 75
TABLE 12: DISTRIBUTION OF PERSONS ATTENDING SCHOOL BY SEX AND QUINTILES
Attending School
Yes No Not Stated
Groups - Poorest
%
All St Lucia
10-14 100.0 .6 100.0 1.6 15-19 - 1.1 - 1.1 20-24 - 2.8 - 2.8 25-29 - 6.2 - 6.1 30-34 - 3.9 - 3.8 35-39 - 13.6 - 13.5 40-44 - 18.2 - 18.0 45-49 - 10.7 - 10.6 50-54 - 9.0 - 8.9 55-59 - 6.2 - 6.1 60-64 - 7.4 - 7.3 65+ - 20.3 - 20.1
All St Lucia 100.0 100.0 100.0 100.0
TABLE 12: DISTRIBUTION OF PERSONS ATTENDING SCHOOL BY SEX AND QUINTILES (CONT’D)
Attending School
Yes No Not Stated
Groups - II
%
All St Lucia
10-14 - - - - 15-19 - - - - 20-24 - 2.1 - 2.0 25-29 100.0 6.4 - 6.9 30-34 - 8.5 - 8.5 35-39 - 11.9 - 11.8 40-44 - 13.0 - 12.9 45-49 - 12.6 - 12.5 50-54 - 7.5 - 7.4 55-59 - 9.5 - 9.5 60-64 - 7.5 - 7.5 65+ - 21.1 - 21.0
All St Lucia 100.0 100.0 - 100.0
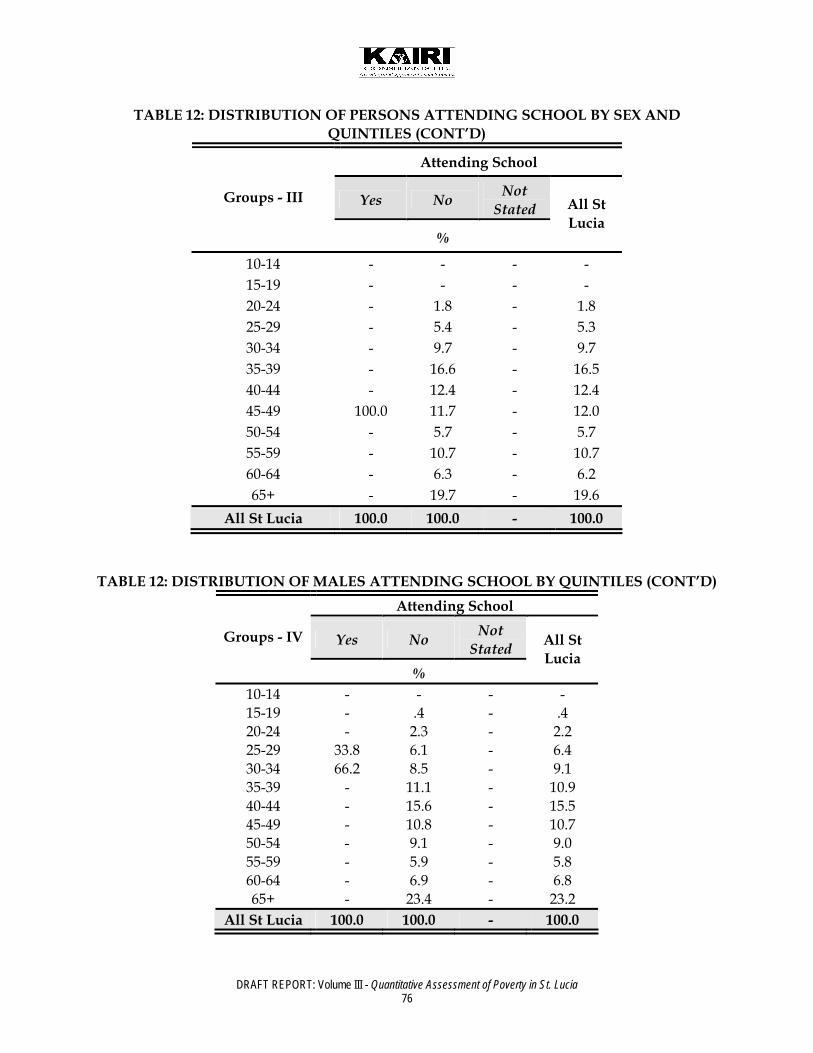
DRAFT REPORT: Volume III - Quantitative Assessment of Poverty in St. Lucia 76
TABLE 12: DISTRIBUTION OF PERSONS ATTENDING SCHOOL BY SEX AND QUINTILES (CONT’D)
Attending School
Yes No Not Stated
Groups - III
%
All St Lucia
10-14 - - - - 15-19 - - - - 20-24 - 1.8 - 1.8 25-29 - 5.4 - 5.3 30-34 - 9.7 - 9.7 35-39 - 16.6 - 16.5 40-44 - 12.4 - 12.4 45-49 100.0 11.7 - 12.0 50-54 - 5.7 - 5.7 55-59 - 10.7 - 10.7 60-64 - 6.3 - 6.2 65+ - 19.7 - 19.6
All St Lucia 100.0 100.0 - 100.0
TABLE 12: DISTRIBUTION OF MALES ATTENDING SCHOOL BY QUINTILES (CONT’D)
Attending School
Yes No Not Stated
Groups - IV
%
All St Lucia
10-14 - - - - 15-19 - .4 - .4 20-24 - 2.3 - 2.2 25-29 33.8 6.1 - 6.4 30-34 66.2 8.5 - 9.1 35-39 - 11.1 - 10.9 40-44 - 15.6 - 15.5 45-49 - 10.8 - 10.7 50-54 - 9.1 - 9.0 55-59 - 5.9 - 5.8 60-64 - 6.9 - 6.8 65+ - 23.4 - 23.2
All St Lucia 100.0 100.0 - 100.0

DRAFT REPORT: Volume III - Quantitative Assessment of Poverty in St. Lucia 77
TABLE 12: DISTRIBUTION OF FEMALES ATTENDING SCHOOL BY QUINTILES (CONT’D)
Attending School
Yes No Not Stated
Groups - Richest
%
All St Lucia
10-14 - 1.2 - 1.2 15-19 - .6 - .6 20-24 - 1.8 - 1.8 25-29 - 3.6 - 3.5 30-34 27.9 5.7 - 6.4 35-39 27.3 9.0 - 9.5 40-44 8.8 10.9 - 10.9 45-49 36.0 11.0 - 11.8 50-54 - 8.7 - 8.4 55-59 - 9.3 - 9.0 60-64 - 6.6 - 6.4 65+ - 31.6 - 30.6
All St Lucia 100.0 100.0 - 100.0
TABLE 12: DISTRIBUTION OF BOTH SEXES ATTENDING SCHOOL BY QUINTILES (CONT’D)
Attending School
Yes No Not Stated
Groups
%
All St Lucia
10-14 5.9 .4 100.0 .6 15-19 - .4 - .4 20-24 - 2.1 - 2.1 25-29 11.9 5.3 - 5.4 30-34 29.6 7.2 - 7.5 35-39 17.7 12.0 - 12.1 40-44 5.7 13.7 - 13.5 45-49 29.2 11.3 - 11.5 50-54 - 8.1 - 7.9 55-59 - 8.4 - 8.3 60-64 - 6.9 - 6.8 65+ - 24.2 - 23.8
All St Lucia 100.0 100.0 100.0 100.0
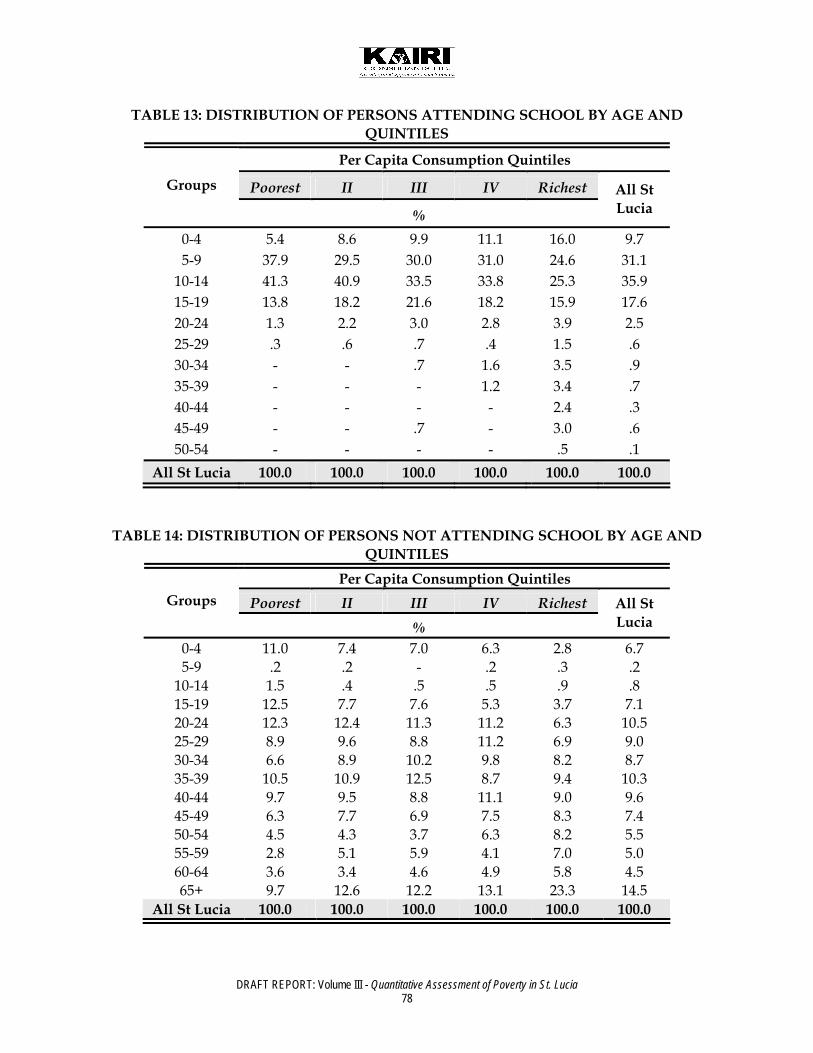
DRAFT REPORT: Volume III - Quantitative Assessment of Poverty in St. Lucia 78
TABLE 13: DISTRIBUTION OF PERSONS ATTENDING SCHOOL BY AGE AND QUINTILES
Per Capita Consumption Quintiles
Poorest II III IV Richest Groups
%
All St Lucia
0-4 5.4 8.6 9.9 11.1 16.0 9.7 5-9 37.9 29.5 30.0 31.0 24.6 31.1
10-14 41.3 40.9 33.5 33.8 25.3 35.9 15-19 13.8 18.2 21.6 18.2 15.9 17.6 20-24 1.3 2.2 3.0 2.8 3.9 2.5 25-29 .3 .6 .7 .4 1.5 .6 30-34 - - .7 1.6 3.5 .9 35-39 - - - 1.2 3.4 .7 40-44 - - - - 2.4 .3 45-49 - - .7 - 3.0 .6 50-54 - - - - .5 .1
All St Lucia 100.0 100.0 100.0 100.0 100.0 100.0
TABLE 14: DISTRIBUTION OF PERSONS NOT ATTENDING SCHOOL BY AGE AND QUINTILES
Per Capita Consumption Quintiles Poorest II III IV Richest Groups
% All St Lucia
0-4 11.0 7.4 7.0 6.3 2.8 6.7 5-9 .2 .2 - .2 .3 .2
10-14 1.5 .4 .5 .5 .9 .8 15-19 12.5 7.7 7.6 5.3 3.7 7.1 20-24 12.3 12.4 11.3 11.2 6.3 10.5 25-29 8.9 9.6 8.8 11.2 6.9 9.0 30-34 6.6 8.9 10.2 9.8 8.2 8.7 35-39 10.5 10.9 12.5 8.7 9.4 10.3 40-44 9.7 9.5 8.8 11.1 9.0 9.6 45-49 6.3 7.7 6.9 7.5 8.3 7.4 50-54 4.5 4.3 3.7 6.3 8.2 5.5 55-59 2.8 5.1 5.9 4.1 7.0 5.0 60-64 3.6 3.4 4.6 4.9 5.8 4.5 65+ 9.7 12.6 12.2 13.1 23.3 14.5
All St Lucia 100.0 100.0 100.0 100.0 100.0 100.0
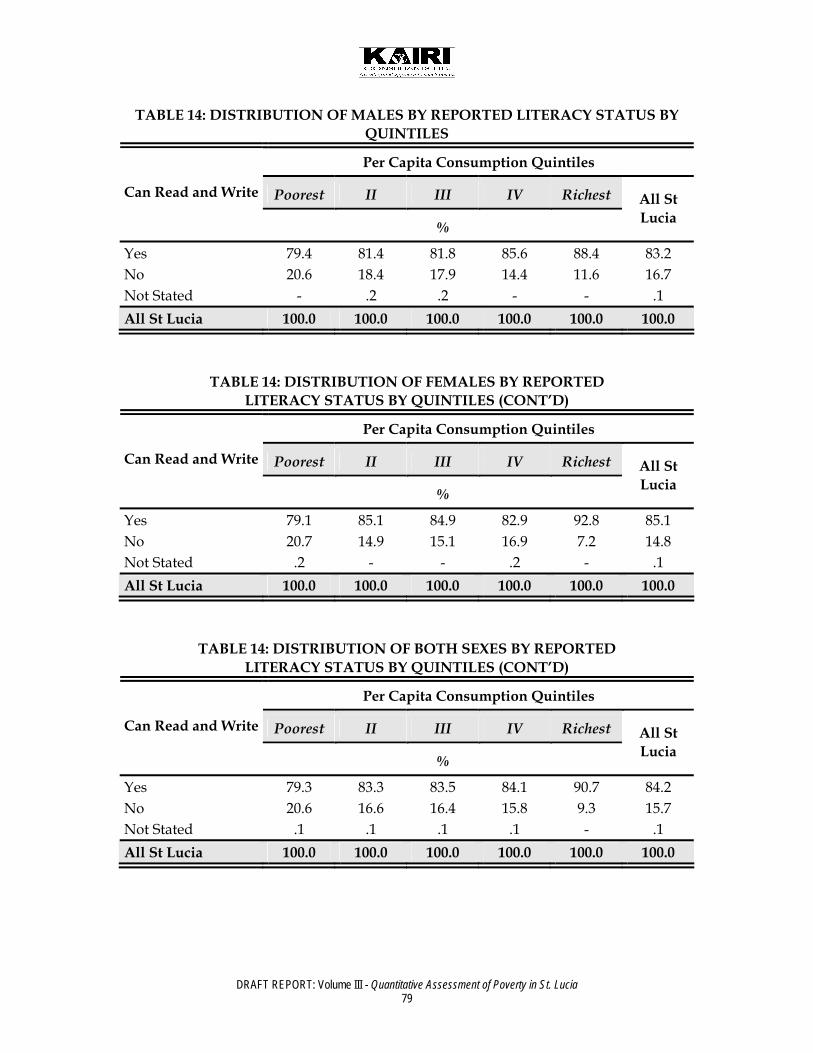
DRAFT REPORT: Volume III - Quantitative Assessment of Poverty in St. Lucia 79
TABLE 14: DISTRIBUTION OF MALES BY REPORTED LITERACY STATUS BY QUINTILES
Per Capita Consumption Quintiles
Poorest II III IV Richest Can Read and Write
%
All St Lucia
Yes 79.4 81.4 81.8 85.6 88.4 83.2 No 20.6 18.4 17.9 14.4 11.6 16.7 Not Stated - .2 .2 - - .1 All St Lucia 100.0 100.0 100.0 100.0 100.0 100.0
TABLE 14: DISTRIBUTION OF FEMALES BY REPORTED LITERACY STATUS BY QUINTILES (CONT’D)
Per Capita Consumption Quintiles
Poorest II III IV Richest Can Read and Write
%
All St Lucia
Yes 79.1 85.1 84.9 82.9 92.8 85.1 No 20.7 14.9 15.1 16.9 7.2 14.8 Not Stated .2 - - .2 - .1 All St Lucia 100.0 100.0 100.0 100.0 100.0 100.0
TABLE 14: DISTRIBUTION OF BOTH SEXES BY REPORTED LITERACY STATUS BY QUINTILES (CONT’D)
Per Capita Consumption Quintiles
Poorest II III IV Richest Can Read and Write
%
All St Lucia
Yes 79.3 83.3 83.5 84.1 90.7 84.2 No 20.6 16.6 16.4 15.8 9.3 15.7 Not Stated .1 .1 .1 .1 - .1 All St Lucia 100.0 100.0 100.0 100.0 100.0 100.0

DRAFT REPORT: Volume III - Quantitative Assessment of Poverty in St. Lucia 80
TABLE 15: NUMBER OF DAYS MALES ATTENDING SCHOOL WEEKLY BY QUINTILES
Per Capita Consumption Quintiles
Poorest II III IV Richest Days Actually Went To School/Classes
%
All St Lucia
One .5 1.4 - - - .4 Two 2.1 1.4 - - 1.2 1.0 Three 4.9 1.4 .7 1.7 - 2.1 Four 5.4 2.0 2.9 4.3 1.1 3.4 Five 83.3 87.2 90.8 85.5 85.1 86.3 Not Stated 3.8 6.7 5.5 8.5 12.6 6.8 All St Lucia 100.0 100.0 100.0 100.0 100.0 100.0
TABLE 15: NUMBER OF DAYS FEMALES ATTENDING SCHOOL WEEKLY BY QUINTILES (CONT’D)
Per Capita Consumption Quintiles
Poorest II III IV Richest Days Actually Went To School/Classes
%
All St Lucia
One 1.4 .5 .6 .7 .9 .8 Two 2.0 .5 - .7 .9 .8 Three - 1.1 3.1 5.0 .9 2.0 Four .7 5.4 3.1 4.5 5.2 3.8 Five 91.9 84.9 83.1 76.8 65.3 81.3 Not Stated 4.0 7.5 10.1 12.3 26.8 11.2 All St Lucia 100.0 100.0 100.0 100.0 100.0 100.0

DRAFT REPORT: Volume III - Quantitative Assessment of Poverty in St. Lucia 81
TABLE 15: NUMBER OF DAYS BOTH SEXES ATTENDING SCHOOL WEEKLY BY QUINTILES (CONT’D)
Per Capita Consumption Quintiles
Poorest II III IV Richest Days Actually Went To School/Classes
%
All St Lucia
One .9 .9 .3 .4 .5 .6 Two 2.1 .9 - .4 1.0 .9 Three 2.7 1.2 2.0 3.5 .5 2.0 Four 3.3 3.9 3.0 4.4 3.4 3.6 Five 87.1 85.9 86.8 80.7 73.9 83.7 Not Stated 3.9 7.2 7.9 10.6 20.7 9.1 All St Lucia 100.0 100.0 100.0 100.0 100.0 100.0
TABLE 16: HIGHEST LEVEL OF EDUCATION ATTAINED BY MALE HEADS OF HOUSEHOLDS BY QUINTILES
Per Capita Consumption Quintiles
Poorest II III IV Richest Highest Examination Passed
%
All St Lucia
None 76.7 71.6 53.5 56.4 34.8 54.9 School Leaving 12.8 15.1 20.5 20.0 19.8 18.1 CXC Basic - 1.8 1.8 2.1 2.4 1.8 CXC 1-4 Passes .9 1.8 9.0 6.4 4.4 4.6 CXC 5 and More Passes 1.9 3.5 5.4 5.7 9.5 5.9 A Level - - .9 .8 1.9 .9 Diploma .9 2.7 5.4 4.4 7.1 4.6 Associate Degree - - - .7 .5 .3 Undergraduate Degree - - - - 1.9 .6 Post Graduate Degree - .9 - - 7.2 2.4 Professional Qualification - 1.8 1.7 .7 6.7 2.8 Other 1.9 - .9 2.1 1.4 1.3 Not Stated 5.0 .9 1.0 .8 2.4 2.0 All St Lucia 100.0 100.0 100.0 100.0 100.0 100.0

DRAFT REPORT: Volume III - Quantitative Assessment of Poverty in St. Lucia 82
TABLE16: HIGHEST LEVEL OF EDUCATION ATTAINED BY FEMALE HEADS OF HOUSEHOLDS BY QUINTILES (CONT’D)
Per Capita Consumption Quintiles
Poorest II III IV Richest Highest Examination Passed
% All St Lucia
None 70.7 63.5 57.1 51.4 36.8 53.9 School Leaving 14.6 18.3 19.5 24.8 22.9 20.7 CXC Basic - 4.5 4.4 1.7 .8 2.3 CXC 1-4 Passes 2.6 3.5 8.9 5.7 3.1 4.9 CXC 5 and More Passes 4.0 3.4 .9 7.4 7.8 5.0 A Level - - - - .8 .2 Diploma - 2.2 4.6 1.6 7.1 3.5 Associate Degree - - .9 1.7 3.9 1.5 Undergraduate Degree - - - - 4.0 1.0 Post Graduate Degree - - - - 2.4 .6 Professional Qualification - - - 3.3 8.0 2.7 Other 3.9 3.3 .9 1.6 1.6 2.1 Not Stated 4.2 1.1 2.7 .9 .8 1.8 All St Lucia 100.0 100.0 100.0 100.0 100.0 100.0
TABLE 16: HIGHEST LEVEL OF EDUCATION ATTAINED BY MALE AND FEMALE HEADS OF HOUSEHOLDS BY QUINTILES (CONT’D)
Per Capita Consumption Quintiles
Poorest II III IV Richest Highest Examination Passed
% All St Lucia
None 74.1 68.1 55.3 54.1 35.6 54.4 School Leaving 13.6 16.5 20.0 22.2 21.0 19.2 CXC Basic - 3.0 3.1 1.9 1.8 2.0 CXC 1-4 Passes 1.6 2.5 9.0 6.0 3.9 4.7 CXC 5 and More Passes 2.8 3.5 3.2 6.5 8.9 5.5 A Level - - .5 .4 1.5 .6 Diploma .5 2.5 5.0 3.1 7.1 4.1 Associate Degree - - .4 1.2 1.8 .8 Undergraduate Degree - - - - 2.7 .7 Post Graduate Degree - .5 - - 5.4 1.6 Professional Qualification - 1.0 .9 1.9 7.2 2.7 Other 2.7 1.4 .9 1.9 1.5 1.6 Not Stated 4.6 1.0 1.8 .8 1.8 1.9 All St Lucia 100.0 100.0 100.0 100.0 100.0 100.0

DRAFT REPORT: Volume III - Quantitative Assessment of Poverty in St. Lucia 83
TABLE 17: HIGHEST LEVEL OF EDUCATION ATTAINED BY MALES COMPLETING SCHOOL BY QUINTILES
Per Capita Consumption Quintiles
Poorest II III IV Richest Highest Examination Passed
%
All St Lucia
None 71.6 57.6 58.0 48.7 33.3 53.1 School Leaving 13.6 18.3 15.7 15.9 16.9 16.1 CXC Basic .4 1.8 2.4 4.3 2.5 2.3 CXC 1-4 Passes 6.1 10.3 8.5 8.6 5.7 7.8 CXC 5 and More Passes 2.8 5.1 7.3 10.2 12.5 7.8 A Level - .3 .8 1.8 2.2 1.1 Diploma .3 1.8 3.1 5.5 7.4 3.8 Associate Degree - 1.1 .4 .4 1.0 .6 Undergraduate Degree - - - .3 2.8 .7 Post Graduate Degree - .4 - .4 5.3 1.3 Professional Qualification - .7 1.1 1.0 7.2 2.2 Other 1.5 1.1 1.6 1.4 .9 1.3 Not Stated 3.7 1.5 1.2 1.4 2.2 2.0 All St Lucia 100.0 100.0 100.0 100.0 100.0 100.0
TABLE 17: HIGHEST LEVEL OF EDUCATION ATTAINED BY FEMALES COMPLETING SCHOOL BY QUINTILES (CONT’D)
Per Capita Consumption Quintiles
Poorest II III IV Richest Highest Examination Passed
%
All St Lucia
None 66.4 53.9 52.8 47.6 33.1 49.7 School Leaving 12.9 20.9 15.4 18.3 21.8 18.0 CXC Basic .8 3.8 4.2 2.7 .9 2.4 CXC 1-4 Passes 7.3 7.8 11.1 7.2 6.9 8.0 CXC 5 and More Passes 4.6 7.6 6.9 9.6 9.6 7.8 A Level .8 - - 1.8 2.0 1.0 Diploma 1.2 1.9 2.7 4.9 7.3 3.8 Associate Degree - 1.1 1.3 3.0 4.1 2.1 Undergraduate Degree - - - .6 4.1 1.1 Post Graduate Degree - - - - 2.9 .7 Professional Qualification - - .3 2.4 5.0 1.7 Other 2.2 1.9 2.0 .6 1.1 1.5 Not Stated 3.8 1.1 3.3 1.6 1.2 2.1 All St Lucia 100.0% 100.0 100.0 100.0 100.0 100.0

DRAFT REPORT: Volume III - Quantitative Assessment of Poverty in St. Lucia 84
TABLE 17: HIGHEST LEVEL OF EDUCATION ATTAINED BY BOTH SEXES COMPLETING SCHOOL BY QUINTILES (CONT’D)
Per Capita Consumption Quintiles
Poorest II III IV Richest Highest Examination Passed
%
All St Lucia
None 69.0 55.8 55.1 48.1 33.2 51.4 School Leaving 13.3 19.6 15.5 17.2 19.5 17.1 CXC Basic .6 2.8 3.4 3.4 1.7 2.3 CXC 1-4 Passes 6.7 9.1 9.9 7.8 6.3 7.9 CXC 5 and More Passes 3.7 6.3 7.1 9.9 11.0 7.8 A Level .4 .2 .4 1.8 2.1 1.0 Diploma .7 1.9 2.9 5.1 7.4 3.8 Associate Degree - 1.1 .9 1.8 2.6 1.3 Undergraduate Degree - - - .5 3.5 .9 Post Graduate Degree - .2 - .2 4.0 1.0 Professional Qualification - .4 .7 1.8 6.0 2.0 Other 1.8 1.5 1.8 1.0 1.0 1.4 Not Stated 3.8 1.3 2.3 1.5 1.7 2.1 All St Lucia 100.0 100.0 100.0 100.0 100.0 100.0
TABLE 18: DISTRIBUTION OF MALES WITH TECHNICAL OR VOCATIONAL TRAINING BY QUINTILES
Per Capita Consumption Quintiles
Poorest II III IV Richest Technical or Vocation Training
%
All St Lucia
Vocational 1.7 4.6 3.5 4.9 8.0 4.7 Technical 12.8 18.0 20.3 26.2 28.3 21.3 Both 2.2 7.4 4.3 7.5 10.6 6.6 None 82.3 69.2 71.2 60.0 52.8 66.6 Not Stated 1.1 .7 .8 1.4 .3 .9 All St Lucia 100.0 100.0 100.0 100.0 100.0 100.0

DRAFT REPORT: Volume III - Quantitative Assessment of Poverty in St. Lucia 85
TABLE 18: DISTRIBUTION OF FEMALES WITH TECHNICAL OR VOCATIONAL TRAINING BY QUINTILES (CONT’D)
Per Capita Consumption Quintiles
Poorest II III IV Richest
Technical or Vocation Training
%
All St Lucia
Vocational 4.9 8.7 9.0 14.2 15.3 10.8 Technical 2.7 4.6 6.6 8.1 14.5 7.7 Both .7 3.8 5.5 4.5 7.3 4.6 None 90.2 82.2 77.2 72.3 62.0 75.8 Not Stated 1.5 .8 1.6 .9 .9 1.1 All St Lucia 100.0 100.0 100.0 100.0 100.0 100.0
TABLE 18: DISTRIBUTION OF BOTH SEXES WITH TECHNICAL OR VOCATIONAL TRAINING BY QUINTILES (CONT’D)
Per Capita Consumption Quintiles
Poorest II III IV Richest Technical or Vocation Training
%
All St Lucia
Vocational 3.3 6.6 6.5 10.0 11.8 7.9 Technical 7.8 11.5 12.9 16.3 21.1 14.3 Both 1.5 5.7 5.0 5.9 8.9 5.5 None 86.1 75.5 74.4 66.7 57.6 71.3 Not Stated 1.3 .7 1.2 1.1 .6 1.0 All St Lucia 100.0 100.0 100.0 100.0 100.0 100.0
TABLE 19: DISTRIBUTION OF MALE YOUTHS WITH TECHNICAL OR VOCATIONAL TRAINING BY QUINTILES
Per Capita Consumption Quintiles
Poorest II III IV Richest Technical or Vocation Training
%
All St Lucia
Vocational 3.0 2.0 - 10.8 2.5 Technical 18.6 23.7 26.4 45.0 30.4 27.1 Both 6.2 13.0 2.0 12.6 8.0 8.2 None 75.2 60.4 67.8 42.5 50.8 61.8 Not Stated - - 1.9 - - .4 All St Lucia 100.0 100.0 100.0 100.0 100.0 100.0

DRAFT REPORT: Volume III - Quantitative Assessment of Poverty in St. Lucia 86
TABLE 19: DISTRIBUTION OF FEMALE YOUTHS WITH
TECHNICAL OR VOCATIONAL TRAINING BY QUINTILES (CONT’D)
Per Capita Consumption Quintiles
Poorest II III IV Richest Technical or Vocation Training
%
All St Lucia
Vocational 7.5 6.8 5.5 17.0 6.7 9.0 Technical 7.8 11.0 3.8 15.1 18.0 10.4 Both 1.8 4.4 11.1 5.6 10.3 6.4 None 81.1 77.8 79.6 60.5 61.6 72.9 Not Stated 1.8 - - 1.9 3.3 1.3 All St Lucia 100.0 100.0 100.0 100.0 100.0 100.0
TABLE 19: DISTRIBUTION OF BOTH SEXES OF YOUTHS WITH TECHNICAL OR VOCATIONAL TRAINING BY QUINTILES (CONT’D)
Per Capita Consumption Quintiles
Poorest II III IV Richest Technical or Vocation Training
%
All St Lucia
Vocational 2.9 4.6 3.8 9.0 9.0 5.4 Technical 14.3 18.5 15.1 29.1 24.9 19.6 Both 4.5 9.5 6.5 8.9 9.0 7.4 None 77.6 67.4 73.7 52.0 55.6 66.8 Not Stated .7 - .9 1.0 1.5 .8 All St Lucia 100.0 100.0 100.0 100.0 100.0 100.0
TABLE 20: DISTRIBUTION OF MALES RECEIVING FREE MEALS OR SNACKS FROM MEAL SERVICE BY QUINTILES
Per Capita Consumption Quintiles
Poorest II III IV Richest Receives Meal Or Snack From This Service
%
All St Lucia
Yes 88.5 89.1 82.7 87.7 83.4 86.5 No 11.5 10.9 17.3 12.3 16.6 13.5 All St Lucia 100.0 100.0 100.0 100.0 100.0 100.0

DRAFT REPORT: Volume III - Quantitative Assessment of Poverty in St. Lucia 87
TABLE 20: DISTRIBUTION OF FEMALES RECEIVING FREE MEALS OR SNACKS FROM MEAL SERVICE BY QUINTILES (CONT’D)
Per Capita Consumption Quintiles
Poorest II III IV Richest
Receives Meal Or Snack From This Service
%
All St Lucia
Yes 86.7 85.5 92.9 75.1 95.7 86.7 No 13.3 14.5 7.1 24.9 4.3 13.3 All St Lucia 100.0 100.0 100.0 100.0 100.0 100.0
TABLE 20: DISTRIBUTION OF BOTH SEXES RECEIVING FREE MEALS OR SNACKS FROM MEAL SERVICE BY QUINTILES (CONT’D)
Per Capita Consumption Quintiles
Poorest II III IV Richest Receives Meal Or Snack From This Service
%
All St Lucia
Yes 87.7 86.9 87.3 80.9 89.3 86.6 No 12.3 13.1 12.7 19.1 10.7 13.4 All St Lucia 100.0 100.0 100.0 100.0 100.0 100.0
TABLE 21: REPORTED OWNERSHIP OF SCHOOL BOOKS BY MALES BY QUINTILES
Per Capita Consumption Quintiles
Poorest II III IV Richest Has All Textbooks Required For School
%
All St Lucia
Yes, has books for exclusive use 41.2 58.0 62.4 68.0 56.4 55.8
Yes, but shares with other family members - .7 - - - .1
Has only some books 53.2 36.4 28.7 23.3 19.5 34.9 Has None 5.0 4.2 6.2 7.0 13.8 6.6 Not Stated .6 .7 2.8 1.7 10.3 2.5 All St Lucia 100.0 100.0 100.0 100.0 100.0 100.0

DRAFT REPORT: Volume III - Quantitative Assessment of Poverty in St. Lucia 88
TABLE 21: REPORTED OWNERSHIP OF SCHOOL BOOKS BY FEMALES BY QUINTILES (CONT’D)
Per Capita Consumption Quintiles
Poorest II III IV Richest Has All Textbooks Required For School
%
All St Lucia
Yes, has books for exclusive use 47.3 58.9 55.9 61.4 55.5 55.9 Yes, but shares with other family members .7 .6 .7 .9 .5
Has only some books 47.9 34.0 31.5 22.7 18.3 31.7 Has None 3.5 4.3 8.2 6.4 5.3 5.5 Not Stated .7 2.8 3.7 8.7 20.0 6.3 All St Lucia 100.0 100.0 100.0 100.0 100.0 100.0
TABLE 21: REPORTED OWNERSHIP OF SCHOOL BOOKS BY BOTH SEXES BY QUINTILES (CONT’D)
Per Capita Consumption Quintiles Poorest II III IV Richest
Has All Textbooks Required For School
% All St Lucia
Yes, has books for exclusive use 43.9 58.5 59.0 64.4 55.9 55.9 Yes, but shares with other family members .3 .3 .3 .4 .5 .3
Has only some books 50.8 35.1 30.2 23.0 18.9 33.2 Has None 4.3 4.3 7.3 6.7 9.0 6.0 Not Stated .6 1.8 3.3 5.5 15.8 4.5 All St Lucia 100.0 100.0 100.0 100.0 100.0 100.0
TABLE 22: REPORTED REASONS FOR NOT OWNING ALL TEXT BOOKS BY MALES BY
QUINTILES Per Capita Consumption Quintiles
Poorest II III IV Richest Reasons For Not Having Required Textbooks
% All St Lucia
Books not available 34.9 61.3 48.3 59.3 34.1 45.6 Could not afford 50.8 21.8 24.1 5.3 8.0 29.0 Books available in school library 1.9 1.7 2.6 1.4 To be purchased 3.9 3.2 3.8 5.3 3.4 Other 6.6 8.5 14.6 16.5 31.7 12.9 Not Stated 2.0 3.4 9.1 10.9 26.2 7.8 All St Lucia 100.0 100.0 100.0 100.0 100.0 100.0

DRAFT REPORT: Volume III - Quantitative Assessment of Poverty in St. Lucia 89
TABLE 22: REPORTED REASONS FOR NOT OWNING ALL TEXT BOOKS BY FEMALES BY QUINTILES (CONT’D)
Per Capita Consumption Quintiles
Poorest II III IV Richest Reasons For Not Having Required Textbooks
%
All St Lucia
Books not available 39.2 55.0 28.8 41.5 35.7 40.5 Could not afford 44.8 27.7 33.4 9.3 4.4 26.3 Books available in school library 1.4 1.4 1.5 1.0 To be purchased 4.0 10.2 9.3 4.6 Other 9.3 7.9 15.9 15.1 10.0 11.4 Not Stated 1.3 8.0 10.2 24.8 49.9 16.1 All St Lucia 100.0 100.0 100.0 100.0 100.0 100.0
TABLE 22: REPORTED REASONS FOR NOT OWNING ALL TEXT BOOKS BY BOTH SEXES BY QUINTILES (CONT’D)
Per Capita Consumption Quintiles
Poorest II III IV Richest Reasons For Not Having Required Textbooks
%
All St Lucia
Books not available 36.7 57.8 37.4 48.9 35.0 42.9 Could not afford 48.3 25.1 29.3 7.6 6.0 27.6 Books available in school library 1.7 1.5 .8 1.1 - 1.2 To be purchased 3.9 1.4 7.4 7.6 - 4.1 Other 7.7 8.2 15.4 15.7 19.4 12.1 Not Stated 1.7 6.0 9.7 19.1 39.6 12.1 All St Lucia 100.0 100.0 100.0 100.0 100.0 100.0
TABLE 23: DISTRIBUTION OF MALES ATTENDING SCHOOL USING BOOK LOAN FACILITY BY QUINTILES
Per Capita Consumption Quintiles
Poorest II III IV Richest Made Use Of Loan Book Facility
%
All St Lucia
Yes 5.3 .7 1.4 .9 1.2 2.2 No 94.1 97.3 94.4 96.6 86.3 94.3 Not Stated .6 2.0 4.2 2.6 12.5 3.5 All St Lucia 100.0 100.0 100.0 100.0 100.0 100.0

DRAFT REPORT: Volume III - Quantitative Assessment of Poverty in St. Lucia 90
TABLE 23: DISTRIBUTION OF FEMALES ATTENDING SCHOOL USING BOOK LOAN FACILITY BY QUINTILES (CONT’D)
Per Capita Consumption Quintiles
Poorest II III IV Richest Made Use Of Loan Book Facility
%
All St Lucia
Yes 1.3 3.2 3.7 .7 2.6 2.4 No 98.7 93.5 92.5 90.6 78.3 91.4 Not Stated - 3.3 3.7 8.7 19.1 6.2 All St Lucia 100.0 100.0 100.0 100.0 100.0 100.0
TABLE 23: DISTRIBUTION OF BOTH SEXES ATTENDING SCHOOL USING BOOK LOAN FACILITY BY QUINTILES (CONT’D)
Per Capita Consumption Quintiles
Poorest II III IV Richest Made Use Of Loan Book Facility
%
All St Lucia
Yes 3.5 2.1 2.6 .8 2.0 2.3 No 96.1 95.2 93.4 93.3 81.8 92.8 Not Stated .3 2.7 3.9 5.9 16.2 4.9 All St Lucia 100.0 100.0 100.0 100.0 100.0 100.0
TABLE 24: HIGHEST LEVEL OF EDUCATION OF MALES NOT ATTENDING SCHOOL BY QUINTILES
Per Capita Consumption Quintiles Poorest II III IV Richest Highest Level Education
% All St Lucia
None .4 1.3 .9 .4 .3 .6 Nursery - - .5 .4 - .2 Kindergarten - - - - Special Education - .4 - .7 - .2 Primary 66.6 55.0 48.2 46.8 45.9 52.1 Secondary 21.1 33.4 34.7 36.9 27.2 30.5 SALCC 1.3 4.5 4.1 5.9 9.0 5.2 Other Tech/Vocational 2.2 .9 3.1 2.0 2.3 2.1 University - .4 .9 1.6 11.6 3.3 Other Not Specified .9 1.7 .9 1.2 .7 1.0 Don't Know 7.6 2.5 6.8 4.3 2.0 4.4 Not Stated - - - - 1.0 .2 All St Lucia 100.0 100.0 100.0 100.0 100.0 100.0

DRAFT REPORT: Volume III - Quantitative Assessment of Poverty in St. Lucia 91
TABLE 24: HIGHEST LEVEL OF EDUCATION OF FEMALES NOT ATTENDING SCHOOL BY QUINTILES (CONT’D)
Per Capita Consumption Quintiles
Poorest II III IV Richest Highest Level Education
%
All St Lucia
None 1.9 .4 .4 - - .5 Nursery - - - .3 - .1 Kindergarten - - .4 - - .1 Special Education 1.0 - - .7 - .3 Primary 58.4 52.1 48.7 47.9 42.5 49.2 Secondary 28.7 35.9 39.1 34.1 29.8 33.5 SALCC 2.9 3.5 4.1 9.2 8.9 6.1 Other Tech/Vocational 1.9 1.3 2.6 2.0 2.5 2.1 University - .4 3.4 12.1 3.8 Other Not Specified - .8 .4 - 1.5 .6 Don't Know 5.2 5.6 4.0 2.0 2.7 3.7 Not Stated - .4 - .3 - .1 All St Lucia 100.0 100.0 100.0 100.0 100.0 100.0
TABLE 24: HIGHEST LEVEL OF EDUCATION OF BOTH SEXES NOT ATTENDING SCHOOL BY QUINTILES (CONT’D)
Per Capita Consumption Quintiles
Poorest II III IV Richest Highest Level Education
%
All St Lucia
None 1.1 .8 .6 .2 .2 .5 Nursery - - .2 .4 - .1 Kindergarten - - .2 - - .0 Special Education .4 .2 - .7 - .3 Primary 62.7 53.6 48.5 47.4 44.1 50.6 Secondary 24.7 34.6 37.1 35.4 28.5 32.1 SALCC 2.0 4.0 4.1 7.7 9.0 5.7 Other Tech/Vocational 2.1 1.1 2.8 2.0 2.4 2.1 University - .2 .6 2.5 11.8 3.6 Other Not Specified .4 1.3 .6 .5 1.1 .8 Don't Know 6.4 4.0 5.3 3.1 2.4 4.1 Not Stated - .2 - .2 .5 .2 All St Lucia 100.0 100.0 100.0 100.0 100.0 100.0

DRAFT REPORT: Volume III - Quantitative Assessment of Poverty in St. Lucia 92
TABLE 25: HIGHEST EXAMINATION PASSED BY MALES NOT ATTENDING SCHOOL BY QUINTILES
Per Capita Consumption Quintiles
Poorest II III IV Richest Highest Examination Passed
%
All St Lucia
None 71.6 57.6 58.0 48.7 33.3 53.1 School Leaving 13.6 18.3 15.7 15.9 16.9 16.1 CXC Basic .4 1.8 2.4 4.3 2.5 2.3 CXC 1-4 Passes 6.1 10.3 8.5 8.6 5.7 7.8 CXC 5 and More Passes 2.8 5.1 7.3 10.2 12.5 7.8 A Level - .3 .8 1.8 2.2 1.1 Diploma .3 1.8 3.1 5.5 7.4 3.8 Associate Degree - 1.1 .4 .4 1.0 .6 Undergraduate Degree - - - .3 2.8 .7 Post Graduate Degree - .4 - .4 5.3 1.3 Professional Qualification - .7 1.1 1.0 7.2 2.2
Other 1.5 1.1 1.6 1.4 .9 1.3 Not Stated 3.7 1.5 1.2 1.4 2.2 2.0 All St Lucia 100.0 100.0 100.0 100.0 100.0 100.0
TABLE 25: HIGHEST EXAMINATION PASSED BY FEMALES NOT ATTENDING SCHOOL BY QUINTILES (CONT’D)
Per Capita Consumption Quintiles Poorest II III IV Richest
Highest Examination Passed
% All St Lucia
None 66.4 53.9 52.8 47.6 33.1 49.7 School Leaving 12.9 20.9 15.4 18.3 21.8 18.0 CXC Basic .8 3.8 4.2 2.7 .9 2.4 CXC 1-4 Passes 7.3 7.8 11.1 7.2 6.9 8.0 CXC 5 and More Passes 4.6 7.6 6.9 9.6 9.6 7.8 A Level .8 - - 1.8 2.0 1.0 Diploma 1.2 1.9 2.7 4.9 7.3 3.8 Associate Degree - 1.1 1.3 3.0 4.1 2.1 Undergraduate Degree - - - .6 4.1 1.1 Post Graduate Degree - - - - 2.9 .7 Professional Qualification - - .3 2.4 5.0 1.7 Other 2.2 1.9 2.0 .6 1.1 1.5 Not Stated 3.8 1.1 3.3 1.6 1.2 2.1 All St Lucia 100.0 100.0 100.0 100.0 100.0 100.0

DRAFT REPORT: Volume III - Quantitative Assessment of Poverty in St. Lucia 93
TABLE 25: HIGHEST EXAMINATION PASSED BY BOTH SEXES NOT ATTENDING SCHOOL BY QUINTILES (CONT’D)
Per Capita Consumption Quintiles
Poorest II III IV Richest Highest Examination Passed
%
All St Lucia
None 69.0 55.8 55.1 48.1 33.2 51.4 School Leaving 13.3 19.6 15.5 17.2 19.5 17.1 CXC Basic .6 2.8 3.4 3.4 1.7 2.3 CXC 1-4 Passes 6.7 9.1 9.9 7.8 6.3 7.9 CXC 5 and More Passes 3.7 6.3 7.1 9.9 11.0 7.8 A Level .4 .2 .4 1.8 2.1 1.0 Diploma .7 1.9 2.9 5.1 7.4 3.8 Associate Degree - 1.1 .9 1.8 2.6 1.3 Undergraduate Degree - - - .5 3.5 .9 Post Graduate Degree - .2 - .2 4.0 1.0 Professional Qualification - .4 .7 1.8 6.0 2.0 Other 1.8 1.5 1.8 1.0 1.0 1.4 Not Stated 3.8 1.3 2.3 1.5 1.7 2.1 All St Lucia 100.0 100.0 100.0 100.0 100.0 100.0

DRAFT REPORT: Volume III - Quantitative Assessment of Poverty in St. Lucia 94
Health Tables

DRAFT REPORT: Volume III - Quantitative Assessment of Poverty in St. Lucia 95
TABLE 26: DISTRIBUTION OF MALES CONFINED TO BED BY QUINTILES
Per Capita Consumption Quintiles
Poorest II III IV Richest Confined to Bed Due To Accident
%
All St Lucia
Yes 2.4 2.8 3.5 3.5 6.1 3.6 No 97.6 96.9 96.3 96.5 93.9 96.3 Not Stated .2 .2 - - .1 All St Lucia 100.0 100.0 100.0 100.0 100.0 100.0
TABLE 26: DISTRIBUTION OF FEMALES CONFINED TO BED BY QUINTILES (CONT’D)
Per Capita Consumption Quintiles
Poorest II III IV Richest Confined to Bed Due To Accident
%
All St Lucia
Yes 2.0 3.3 5.6 5.3 5.3 4.4 No 97.8 96.7 94.4 94.3 94.7 95.5 Not Stated .2 - - .4 - .1 All St Lucia 100.0 100.0 100.0 100.0 100.0 100.0
TABLE 26: DISTRIBUTION OF BOTH SEXES CONFINED TO BED BY QUINTILES (CONT’D)
Per Capita Consumption Quintiles
Poorest II III IV Richest Confined to Bed Due To Accident
%
All St Lucia
Yes 2.2 3.1 4.6 4.5 5.7 4.0 No 97.7 96.8 95.2 95.3 94.3 95.9 Not Stated .1 .1 .1 .2 - .1 All St Lucia 100.0 100.0 100.0 100.0 100.0 100.0
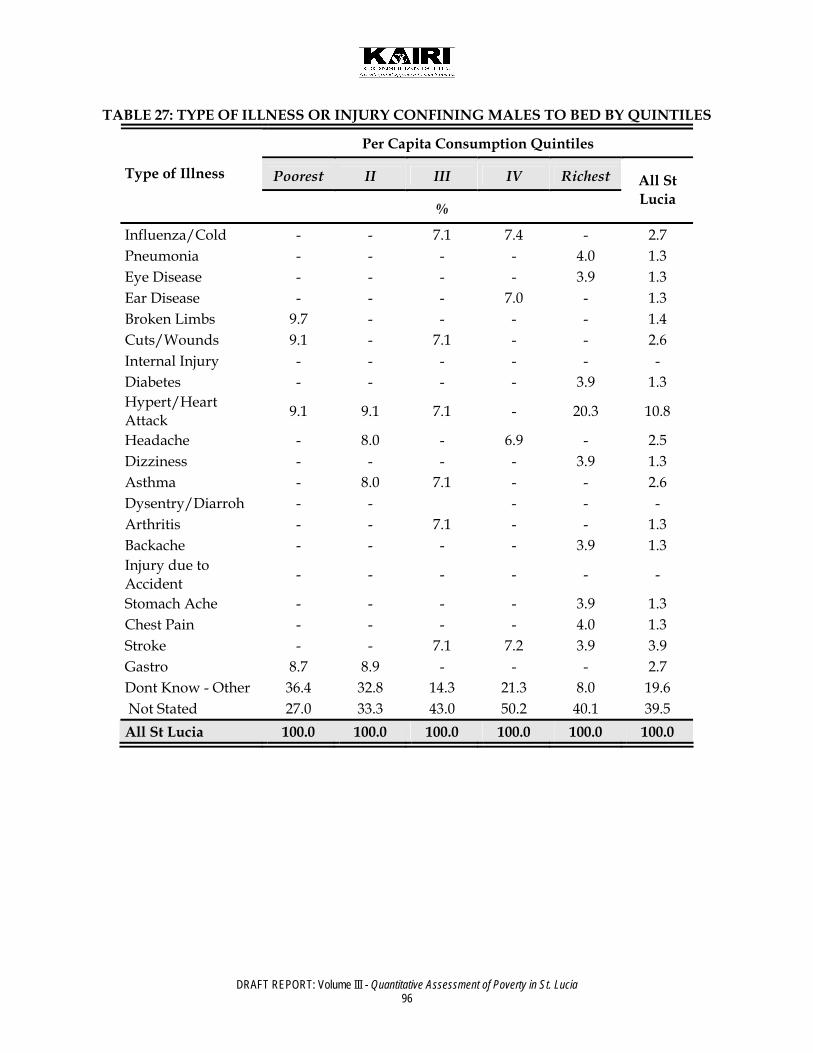
DRAFT REPORT: Volume III - Quantitative Assessment of Poverty in St. Lucia 96
TABLE 27: TYPE OF ILLNESS OR INJURY CONFINING MALES TO BED BY QUINTILES
Per Capita Consumption Quintiles
Poorest II III IV Richest Type of Illness
%
All St Lucia
Influenza/Cold - - 7.1 7.4 - 2.7 Pneumonia - - - - 4.0 1.3 Eye Disease - - - - 3.9 1.3 Ear Disease - - - 7.0 - 1.3 Broken Limbs 9.7 - - - - 1.4 Cuts/Wounds 9.1 - 7.1 - - 2.6 Internal Injury - - - - - - Diabetes - - - - 3.9 1.3 Hypert/Heart Attack 9.1 9.1 7.1 - 20.3 10.8
Headache - 8.0 - 6.9 - 2.5 Dizziness - - - - 3.9 1.3 Asthma - 8.0 7.1 - - 2.6 Dysentry/Diarroh - - - - - Arthritis - - 7.1 - - 1.3 Backache - - - - 3.9 1.3 Injury due to Accident - - - - - -
Stomach Ache - - - - 3.9 1.3 Chest Pain - - - - 4.0 1.3 Stroke - - 7.1 7.2 3.9 3.9 Gastro 8.7 8.9 - - - 2.7 Dont Know - Other 36.4 32.8 14.3 21.3 8.0 19.6 Not Stated 27.0 33.3 43.0 50.2 40.1 39.5 All St Lucia 100.0 100.0 100.0 100.0 100.0 100.0

DRAFT REPORT: Volume III - Quantitative Assessment of Poverty in St. Lucia 97
TABLE 27: TYPE OF ILLNESS OR INJURY CONFINING FEMALES TO BED BY QUINTILES (CONT’D)
Per Capita Consumption Quintiles
Poorest II III IV Richest Type of Illness
%
All St Lucia
Influenza/Cold 11.9 - 19.0 - 4.1 7.0 Pneumonia - - - - - - Eye Disease - - - 4.2 - 1.1 Ear Disease - - - - - - Broken Limbs - - - - - - Cuts/Wounds - - - - - - Internal Injury - - - 4.2 - 1.1 Diabetes - - - - 3.9 1.0 Hypert/Heart Attack - - - 4.2 12.4 4.1 Headache - - 7.6 - - 2.0 Dizziness - 6.5 7.6 3.8 - 4.0 Asthma - - 4.0 - - 1.1 Dysentry/Diarroh - - 3.8 - - 1.0 Arthritis - 6.8 - - 3.9 2.0 Backache - 6.4 3.8 - - 2.0 Injury due to Accident - - - 4.1 4.3 2.1 Stomach Ache - 6.4 3.8 - - 2.0 Chest Pain - - - - - - Stroke - - - 7.6 12.9 5.1 Gastro - - - - - - Don’t Know - Other 25.5 6.7 3.7 32.1 16.6 16.4 Not Stated 62.6 67.1 46.7 39.8 41.9 48.1 All St Lucia 100.0 100.0 100.0 100.0 100.0 100.0

DRAFT REPORT: Volume III - Quantitative Assessment of Poverty in St. Lucia 98
TABLE 27: TYPE OF ILLNESS OR INJURY CONFINING BOTH SEXES TO BED BY QUINTILES (CONT’D)
Per Capita Consumption Quintiles
Poorest II III IV Richest Type of Illness
%
All St Lucia
Influenza/Cold 5.1 - 14.9 2.6 2.0 5.1 Pneumonia - - - - 2.1 .6 Eye Disease - - - 2.7 2.0 1.2 Ear Disease - - - 2.5 - .6 Broken Limbs 5.5 - - - - .6 Cuts/Wounds 5.2 - 2.5 - - 1.1 Internal Injury - - - 2.7 - .6 Diabetes - - - - 3.9 1.1 Hypert/Heart Attack 5.2 4.0 2.5 2.7 16.4 7.0 Headache - 3.6 5.0 2.5 2.2 Dizziness - 3.6 5.0 2.5 2.0 2.8 Asthma - 3.6 5.1 - - 1.7 Dysentry/Diarroh - - 2.5 - - .6 Arthritis - 3.8 2.5 - 1.9 1.7 Backache - 3.6 2.5 - 2.0 1.7 Injury due to Accident - - - 2.6 2.1 1.2 Stomach Ache - 3.6 2.5 - 2.0 1.7 Chest Pain - - - - 2.1 .6 Stroke - - 2.5 7.5 8.4 4.6 Gastro 5.0 4.0 - - - 1.2 Dont Know - Other 31.8 18.3 7.4 28.3 12.2 17.8 Not Stated 42.2 52.0 45.4 43.5 40.9 44.4 All St Lucia 100.0 100.0 100.0 100.0 100.0 100.0

DRAFT REPORT: Volume III - Quantitative Assessment of Poverty in St. Lucia 99
TABLE 28: MALES REPORTING ILLNESS OR INJURY BY QUINTILES
Per Capita Consumption Quintiles
Poorest II III IV Richest Suffer Illness/Injury Due To Accident
%
All St Lucia
Yes 9.1 13.1 12.9 10.4 15.7 12.2 No 90.9 86.4 86.6 89.6 84.3 87.6 Not Stated - .5 .5 - - .2 All St Lucia 100.0 100.0 100.0 100.0 100.0 100.0
TABLE 28: FEMALES REPORTING ILLNESS OR INJURY BY QUINTILES (CONT’D)
Per Capita Consumption Quintiles
Poorest II III IV Richest Suffer Illness/Injury Due To Accident
%
All St Lucia
Yes 15.3 13.5 17.1 22.6 17.7 17.3 No 84.5 86.5 82.9 77.2 82.3 82.6 Not Stated .2 - - .2 - .1 All St Lucia 100.0 100.0 100.0 100.0 100.0 100.0
TABLE 28: BOTH SEXES REPORTING ILLNESS OR INJURY BY QUINTILES (CONT’D)
Per Capita Consumption Quintiles
Poorest II III IV Richest Suffer Illness/Injury Due To Accident
%
All St Lucia
Yes 12.0 13.3 15.2 17.1 16.8 14.9 No 87.8 86.5 84.6 82.8 83.2 85.0 Not Stated .1 .2 .2 .1 - .1 All St Lucia 100.0 100.0 100.0 100.0 100.0 100.0

DRAFT REPORT: Volume III - Quantitative Assessment of Poverty in St. Lucia 100
TABLE 29: TYPE OF ILLNESS OR INJURY CONFINING MALES TO BED BY QUINTILES
Per Capita Consumption Quintiles
Poorest II III IV Richest Type of Illness
%
All St Lucia
Influenza/Cold - - 7.1 7.4 - 2.7 Pneumonia - - - - 4.0 1.3 Eye Disease - - - - 3.9 1.3 Ear Disease - - - 7.0 - 1.3 Broken Limbs 9.7 - - - - 1.4 Cuts/Wounds 9.1 - 7.1 - - 2.6 Internal Injury - - - - - - Diabetes - - - - 3.9 1.3 Hypert/Heart Attack 9.1 9.1 7.1 - 20.3 10.8 Headache - 8.0 - 6.9 - 2.5 Dizziness - - - - 3.9 1.3 Asthma - 8.0 7.1 - - 2.6 Dysentry/Diarroh - - - - - - Arthritis - - 7.1 - - 1.3 Backache - - - - 3.9 1.3 Injury due to Accident - - - - - - Stomach Ache - - - - 3.9 1.3 Chest Pain - - - - 4.0 1.3 Stroke - - 7.1 7.2 3.9 3.9 Gastro 8.7 8.9 - - - 2.7 Dont Know - Other 36.4 32.8 14.3 21.3 8.0 19.6 Not Stated 27.0 33.3 43.0 50.2 40.1 39.5 All St Lucia 100.0 100.0 100.0 100.0 100.0 100.0

DRAFT REPORT: Volume III - Quantitative Assessment of Poverty in St. Lucia 101
TABLE 29: TYPE OF ILLNESS OR INJURY CONFINING FEMALES TO BED BY QUINTILES (CONT’D)
Per Capita Consumption Quintiles
Poorest II III IV Richest Type of Illness
%
All St Lucia
Influenza/Cold 11.9 - 19.0 - 4.1 7.0 Pneumonia - - - - - - Eye Disease - - - 4.2 - 1.1 Ear Disease - - - - - - Broken Limbs - - - - - - Cuts/Wounds - - - - - - Internal Injury - - - 4.2 - 1.1 Diabetes - - - - 3.9 1.0 Hypert/Heart Attack - - - 4.2 12.4 4.1 Headache - - 7.6 - - 2.0 Dizziness - 6.5 7.6 3.8 - 4.0 Asthma - - 4.0 - - 1.1 Dysentry/Diarroh - - 3.8 - - 1.0 Arthritis - 6.8 - - 3.9 2.0 Backache - 6.4 3.8 - 2.0 Injury due to Accident - - - 4.1 4.3 2.1 Stomach Ache - 6.4 3.8 - - 2.0 Chest Pain - - - - - - Stroke - - - 7.6 12.9 5.1 Gastro - - - - - - Dont Know - Other 25.5 6.7 3.7 32.1 16.6 16.4 Not Stated 62.6 67.1 46.7 39.8 41.9 48.1 All St Lucia 100.0 100.0 100.0 100.0 100.0 100.0

DRAFT REPORT: Volume III - Quantitative Assessment of Poverty in St. Lucia 102
TABLE 29: TYPE OF ILLNESS OR INJURY CONFINING BOTH SEXES TO BED BY QUINTILES (CONT’D)
Per Capita Consumption Quintiles
Poorest II III IV Richest Type of Illness
%
All St Lucia
Influenza/Cold 5.1 14.9 2.6 2.0 5.1 Pneumonia - - - - 2.1 .6 Eye Disease - - - 2.7 2.0 1.2 Ear Disease - - - 2.5 - .6 Broken Limbs 5.5 - - - - .6 Cuts/Wounds 5.2 - 2.5 - - 1.1 Internal Injury - - - 2.7 - .6 Diabetes - - - - 3.9 1.1 Hypert/Heart Attack 5.2 4.0 2.5 2.7 16.4 7.0 Headache - 3.6 5.0 2.5 - 2.2 Dizziness - 3.6 5.0 2.5 2.0 2.8 Asthma - 3.6 5.1 - - 1.7 Dysentry/Diarroh - - 2.5 - - .6 Arthritis - 3.8 2.5 - 1.9 1.7 Backache - 3.6 2.5 - 2.0 1.7 Injury due to Accident - - - 2.6 2.1 1.2 Stomach Ache - 3.6 2.5 - 2.0 1.7 Chest Pain - - - - 2.1 .6 Stroke - - 2.5 7.5 8.4 4.6 Gastro 5.0 4.0 - - - 1.2 Dont Know - Other 31.8 18.3 7.4 28.3 12.2 17.8 Not Stated 42.2 52.0 45.4 43.5 40.9 44.4 All St Lucia 100.0 100.0 100.0 100.0 100.0 100.0

DRAFT REPORT: Volume III - Quantitative Assessment of Poverty in St. Lucia 103
TABLE 30: DISTRIBUTION OF MALES SUFFERING FROM LIFESTYLE DISEASES BY QUINTILES
Per Capita Consumption Quintiles Poorest II III IV Richest Suffer From Disease
% Total
Diabetes 7.1 6.3 7.8 10.9 14.4 10.3 High Blood Pressure 27.9 21.3 10.6 17.2 21.2 19.2 Heart Condition 2.9 5.1 3.8 1.7 6.7 4.4 Cancer - - - - .5 .2 HIV/AIDS - - - - - - Other 5.8 8.7 3.8 2.6 3.9 4.5 Total 39.4 37.6 23.0 29.9 37.9 33.5
TABLE 30: DISTRIBUTION OF FEMALES SUFFERING FROM LIFESTYLE DISEASES BY QUINTILES (CONT’D)
Per Capita Consumption Quintiles Poorest II III IV Richest Suffer From Disease
% Total
Diabetes 21.6 24.0 28.7 24.3 23.0 24.3 High Blood Pressure 35.9 49.6 52.8 50.9 45.7 47.5 Heart Condition 4.3 6.4 4.9 9.0 10.0 7.6 Cancer 1.5 1.3 2.0 1.7 2.2 1.9 HIV/AIDS - - - - - - Other 7.2 5.1 8.7 5.1 6.7 6.6 Total 60.6 62.4 77.0 70.1 62.1 66.5
TABLE 30: DISTRIBUTION OF BOTH SEXES SUFFERING FROM LIFESTYLE DISEASES BY QUINTILES (CONT’D)
Per Capita Consumption Quintiles Poorest II III IV Richest Suffer From Disease
% Total
Diabetes 28.7 30.3 36.5 35.2 37.4 34.6 High Blood Pressure 63.7 70.9 63.4 68.1 67.0 66.7 Heart Condition 7.2 11.5 8.7 10.6 16.8 12.0 Cancer 1.5 1.3 2.0 1.7 2.8 2.0 HIV/AIDS - - - - - - Other 13.0 13.9 12.5 7.7 10.6 11.1 Total 100.0 100.0 100.0 100.0 100.0 100.0

DRAFT REPORT: Volume III - Quantitative Assessment of Poverty in St. Lucia 104
TABLE 31: TOTAL NUMBER OF MALES REPORTING INJURY OR ILLNESS BY QUINTILES
Per Capita Consumption Quintiles
Poorest II III IV Richest Illness
%
All St Lucia
Ill 14.2 17.4 17.9 19.3 28.3 19.3 Not ill 85.8 82.6 82.1 80.7 71.7 80.7 All St Lucia 100.0 100.0 100.0 100.0 100.0 100.0
TABLE 31: TOTAL NUMBER OF FEMALES REPORTING INJURY OR ILLNESS BY QUINTILES (CONT’D)
Per Capita Consumption Quintiles
Poorest II III IV Richest Illness
%
All St Lucia
Ill 24.5 23.2 28.1 36.3 36.6 29.9 Not ill 75.5 76.8 71.9 63.7 63.4 70.1 All St Lucia 100.0 100.0 100.0 100.0 100.0 100.0
TABLE 31: TOTAL NUMBER OF BOTH SEXES REPORTING INJURY OR ILLNESS BY QUINTILES (CONT’D)
Per Capita Consumption Quintiles
Poorest II III IV Richest Illness
%
All St Lucia
Ill 19.1 20.4 23.4 28.6 32.7 24.8 Not ill 80.9 79.6 76.6 71.4 67.3 75.2 All St Lucia 100.0 100.0 100.0 100.0 100.0 100.0

DRAFT REPORT: Volume III - Quantitative Assessment of Poverty in St. Lucia 105
TABLE 32: DISTRIBUTION OF MALES SEEKING MEDICAL ATTENTION BY QUINTILES
Per Capita Consumption Quintiles
Poorest II III IV Richest Visited Health Practitioner
%
All St Lucia
Yes 40.4 47.7 46.0 43.7 48.7 45.8 No 58.1 44.3 45.7 53.6 44.3 48.6 Not Stated 1.5 8.0 8.3 2.7 7.0 5.7 All St Lucia 100.0 100.0 100.0 100.0 100.0 100.0
TABLE 32: DISTRIBUTION OF FEMALES SEEKING MEDICAL ATTENTION BY QUINTILES (CONT’D)
Per Capita Consumption Quintiles
Poorest II III IV Richest Visited Health Practitioner
%
All St Lucia
Yes 43.2 45.8 46.9 46.5 55.6 48.3 No 52.9 44.6 49.2 50.6 42.6 47.8 Not Stated 3.9 9.6 3.9 2.9 1.7 4.0 All St Lucia 100.0 100.0 100.0 100.0 100.0 100.0
TABLE 32: DISTRIBUTION OF BOTH SEXES SEEKING MEDICAL ATTENTION BY QUINTILES (CONT’D)
Per Capita Consumption Quintiles
Poorest II III IV Richest Visited Health Practitioner
%
All St Lucia
Yes 42.1 46.6 46.6 45.7 52.8 47.3 No 54.9 44.5 48.0 51.5 43.3 48.1 Not Stated 3.0 9.0 5.4 2.8 3.9 4.6 All St Lucia 100.0 100.0 100.0 100.0 100.0 100.0

DRAFT REPORT: Volume III - Quantitative Assessment of Poverty in St. Lucia 106
TABLE 33: REASONS FOR MALES NOT SEEKING MEDICAL ATTENTION BY QUINTILES
Per Capita Consumption Quintiles Poorest II III IV Richest
Why Did Not Visit Health Practitioner
% All St Lucia
No Need 84.5 78.9 73.1 90.5 90.3 84.4 Too expensive 2.5 - 3.0 - - 1.0 Un treatable 5.2 6.3 3.0 2.4 - 3.1 Other 5.1 14.8 20.8 7.1 9.7 11.0 Not Stated 2.6 - - - - .5 All St Lucia 100.0 100.0 100.0 100.0 100.0 100.0
TABLE 33: REASONS FOR FEMALES NOT SEEKING MEDICAL ATTENTION BY SEX AND QUINTILES (CONT’D)
Per Capita Consumption Quintiles Poorest II III IV Richest
Why Did Not Visit Health Practitioner
% All St Lucia
No Need 83.1 89.1 90.6 88.5 87.2 87.8 Too expensive 3.9 2.2 - - 2.7 1.6 Un treatable 3.9 2.2 - 1.2 2.9 1.9 Other 9.2 6.6 9.4 7.9 7.2 8.1 Not Stated - - - 2.4 - .6 All St Lucia 100.0 100.0 100.0 100.0 100.0 100.0
TABLE 33: REASONS FOR BOTH SEXES NOT SEEKING MEDICAL ATTENTION BY QUINTILES (CONT’D)
Per Capita Consumption Quintiles Poorest II III IV Richest
Why Did Not Visit Health Practitioner
% All St Lucia
No Need 83.7 84.9 84.7 89.2 88.5 86.6 Too expensive 3.3 1.3 1.0 1.6 1.3 Un treatable 4.4 3.9 1.0 1.6 1.7 2.4 Other 7.5 9.9 13.3 7.6 8.2 9.1 Not Stated 1.1 - - 1.6 - .6 All St Lucia 100.0 100.0 100.0 100.0 100.0 100.0

DRAFT REPORT: Volume III - Quantitative Assessment of Poverty in St. Lucia 107
TABLE 34: MEAN DAYS MALES UNABLE TO WORK AND DAYS WITHOUT PAY BY QUINTILES
Per Capita Consumption Quintiles
Poorest II III IV Richest
Mean Total
Days Unable To Carry On Activities 12 12 12 10 10 11
Days Without Pay 4 20 4 11 8 12
TABLE 34: MEAN DAYS FEMALES UNABLE TO WORK AND DAYS WITHOUT PAY BY QUINTILES (CONT’D)
Per Capita Consumption Quintiles
Poorest II III IV Richest
Mean Total
Days Unable To Carry On Activities 10 8 12 12 10 11
Days Without Pay 12 . 15 12 9 11
TABLE 34: MEAN DAYS BOTH SEXES UNABLE TO WORK AND DAYS WITHOUT PAY BY QUINTILES (CONT’D)
Per Capita Consumption Quintiles
Poorest II III IV Richest
Mean Total
Days Unable To Carry On Activities 11 10 12 11 10 11
Days Without Pay 8 20 10 11 8 12

DRAFT REPORT: Volume III - Quantitative Assessment of Poverty in St. Lucia 108
TABLE 35: PLACE FIRST VISITED BY MALES FOR MEDICAL ATTENTION BY QUINTILES
Per Capita Consumption Quintiles
Poorest II III IV Richest Place First Visit Made
%
All St Lucia
Public Hospital 27.2 28.1 43.1 27.5 30.7 31.4 Private Hospital - - - 6.1 12.4 4.9 Community Health Clinic 41.9 34.3 23.7 26.8 7.0 23.8
Polyclinic - 5.8 - 6.1 1.8 2.8 Private Doctor/Dentist 15.3 26.1 30.3 24.1 46.3 31.1
Out of state hospital - - - 3.0 - .5 Pharmacy/Chemist 7.5 2.8 2.9 3.2 1.8 3.3 Other 4.0 2.8 - 3.2 - 1.7 Not Stated 4.1 - - - - .6 All St Lucia 100.0 100.0 100.0 100.0 100.0 100.0
TABLE 35: PLACE FIRST VISITED BY FEMALES FOR MEDICAL ATTENTION BY QUINTILES (CONT’D)
Per Capita Consumption Quintiles
Poorest II III IV Richest Place First Visit Made
%
All St Lucia
Public Hospital 37.6 25.9 30.1 30.0 20.8 27.8 Private Hospital 2.3 - - 7.6 9.8 5.0 Community Health Clinic 23.0 35.9 38.6 26.1 18.1 27.2
Polyclinic 4.6 4.3 - 1.3 3.2 2.5 Private Doctor/Dentist 30.0 33.9 29.6 29.9 41.6 33.8 Out of state hospital - - - 1.2 2.1 .9 Pharmacy/Chemist - - - 1.2 3.2 1.2 Other 2.4 - - 2.5 1.1 1.3 Not Stated - - 1.7 - - .3 All St Lucia 100.0 100.0 100.0 100.0 100.0 100.0

DRAFT REPORT: Volume III - Quantitative Assessment of Poverty in St. Lucia 109
TABLE 35: PLACE FIRST VISITED BY BOTH SEXES FOR MEDICAL ATTENTION BY QUINTILES (CONT’D)
Per Capita Consumption Quintiles
Poorest II III IV Richest Place First Visit Made
%
All St Lucia
Public Hospital 33.7 26.8 34.7 29.3 24.5 29.1 Private Hospital 1.5 - - 7.2 10.8 5.0 Community Health Clinic 30.1 35.2 33.3 26.4 13.9 25.9
Polyclinic 2.8 5.0 - 2.7 2.7 2.6 Private Doctor/Dentist 24.5 30.6 29.9 28.2 43.4 32.8 Out of state hospital - - - 1.8 1.3 .8 Pharmacy/Chemist 2.8 1.2 1.0 1.8 2.6 2.0 Other 3.0 1.2 - 2.7 .7 1.4 Not Stated 1.5 - 1.1 - - .4 All St Lucia 100.0 100.0 100.0 100.0 100.0 100.0
TABLE 36: PERSON PROVIDING MEDICAL ATTENTION TO MALES BY QUINTILES
Per Capita Consumption Quintiles
Poorest II III IV Richest Person Who Attended Individual At First Visit
%
All St Lucia
Nurse, health care worker 49.8 34.1 21.5 42.1 17.9 30.6
Pharmacist 7.5 2.8 2.9 3.2 1.8 3.3 Doctor 42.7 60.2 75.6 54.7 78.5 65.1 Other - 2.8 - - 1.8 1.1 Not Stated - - - - - - All St Lucia 100.0 100.0 100.0 100.0 100.0 100.0

DRAFT REPORT: Volume III - Quantitative Assessment of Poverty in St. Lucia 110
TABLE 36 (CONT’D): PERSON PROVIDING MEDICAL ATTENTION TO FEMALES BY QUINTILES
Per Capita Consumption Quintiles Poorest II III IV Richest
Person Who Attended Individual At First Visit
% All St Lucia
Nurse, health care worker 30.6 36.4 30.7 37.6 21.6 30.6
Pharmacist - - - 1.2 3.2 1.2 Doctor 62.4 63.6 69.3 61.2 75.2 67.3 Other 4.6 - - - - .6 Not Stated 2.4 - - - - .3 All St Lucia 100.0 100.0 100.0 100.0 100.0 100.0
TABLE 36 (CONT’D): PERSON PROVIDING MEDICAL ATTENTION TO BOTH SEXES BY
QUINTILES Per Capita Consumption Quintiles
Poorest II III IV Richest Person Who Attended Individual At First Visit %
All St Lucia
Nurse, health care worker 37.9 35.4 27.5 38.9 20.2 30.6
Pharmacist 2.8 1.2 1.0 1.8 2.6 2.0 Doctor 54.9 62.2 71.5 59.3 76.5 66.5 Other 2.9 1.2 - - .7 .8 Not Stated 1.5 - - - - .2 All St Lucia 100.0 100.0 100.0 100.0 100.0 100.0
TABLE 37: REPORTED LEVEL OF SATISFACTION OF MALES WITH MEDICAL SERVICE
BY QUINTILES Per Capita Consumption Quintiles
Poorest II III IV Richest Level of Satisfaction With Treatment
% All St Lucia
Very satisfied 41.9 37.0 48.2 48.9 51.6 46.3 Satisfied 43.1 49.2 48.8 29.9 39.9 41.9 Dissatisfied 11.0 11.1 - 18.0 6.9 9.0 Very dissatisfied 4.0 2.7 3.0 3.2 1.7 2.7 Not Stated - - - - - - All St Lucia 100.0 100.0 100.0 100.0 100.0 100.0
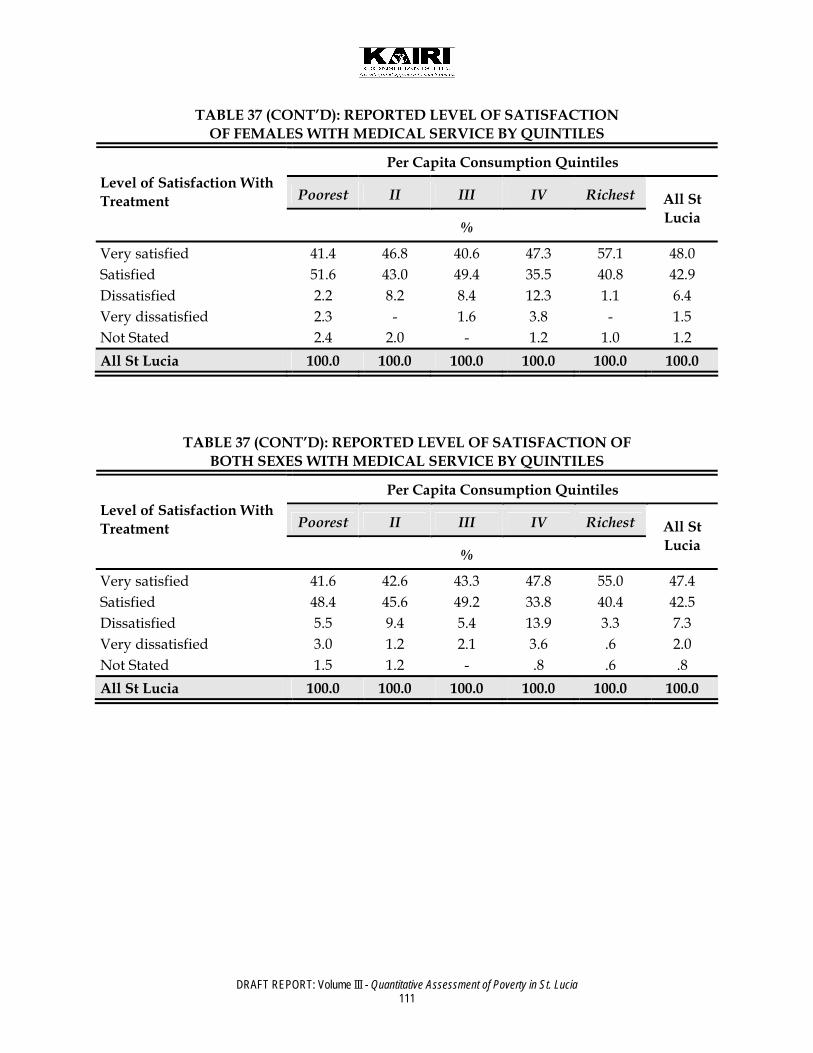
DRAFT REPORT: Volume III - Quantitative Assessment of Poverty in St. Lucia 111
TABLE 37 (CONT’D): REPORTED LEVEL OF SATISFACTION OF FEMALES WITH MEDICAL SERVICE BY QUINTILES
Per Capita Consumption Quintiles
Poorest II III IV Richest Level of Satisfaction With Treatment
%
All St Lucia
Very satisfied 41.4 46.8 40.6 47.3 57.1 48.0 Satisfied 51.6 43.0 49.4 35.5 40.8 42.9 Dissatisfied 2.2 8.2 8.4 12.3 1.1 6.4 Very dissatisfied 2.3 - 1.6 3.8 - 1.5 Not Stated 2.4 2.0 - 1.2 1.0 1.2 All St Lucia 100.0 100.0 100.0 100.0 100.0 100.0
TABLE 37 (CONT’D): REPORTED LEVEL OF SATISFACTION OF BOTH SEXES WITH MEDICAL SERVICE BY QUINTILES
Per Capita Consumption Quintiles
Poorest II III IV Richest Level of Satisfaction With Treatment
%
All St Lucia
Very satisfied 41.6 42.6 43.3 47.8 55.0 47.4 Satisfied 48.4 45.6 49.2 33.8 40.4 42.5 Dissatisfied 5.5 9.4 5.4 13.9 3.3 7.3 Very dissatisfied 3.0 1.2 2.1 3.6 .6 2.0 Not Stated 1.5 1.2 - .8 .6 .8 All St Lucia 100.0 100.0 100.0 100.0 100.0 100.0

DRAFT REPORT: Volume III - Quantitative Assessment of Poverty in St. Lucia 112
TABLE 38: REASONS FOR DISSATISFACTION OF MALES WITH REPORTED LEVEL OF SATISFACTION WITH MEDICAL SERVICE BY QUINTILES
Per Capita Consumption Quintiles
Poorest II III IV Richest Reason Not Satisfied with Treatment
%
All St Lucia
Drugs not available - - - - - - Drugs not affordable 25.1 - - - - 4.6 Attitude of Staff - - - 14.1 39.2 13.4 Long waiting time 50.4 79.4 100.0 43.7 20.5 50.3 Equipment not available or operational - - - - - -
No Doctor/Trained staff available - - - - 19.7 4.4
To many revisits 24.5 - - 13.8 20.5 13.6 Not Stated - 20.6 - 28.3 13.8
All St Lucia 100.0 100.0 100.0 100.0 100.0 100.0
TABLE 38 (CONT’D): REASONS FOR DISSATISFACTION OF FEMALES WITH REPORTED LEVEL OF SATISFACTION WITH MEDICAL SERVICE BY QUINTILES
Per Capita Consumption Quintiles
Poorest II III IV Richest Reason Not Satisfied with Treatment
%
All St Lucia
Drugs not available - 25.5 17.8 7.7 - 11.9 Drugs not affordable - - - 7.4 - 3.7 Attitude of Staff 51.6 - - 22.9 - 15.3 Long waiting time 48.4 24.5 50.8 46.8 - 42.6 Equipment not available or operational - 25.5 15.6 7.6 - 11.3
No Doctor/Trained staff available - - - - - -
To many revisits - - 15.9 - - 3.8 Not Stated - 24.5 - 7.6 100.0 11.4 All St Lucia 100.0 100.0 100.0 100.0 100.0 100.0

DRAFT REPORT: Volume III - Quantitative Assessment of Poverty in St. Lucia 113
TABLE 38 (CONT’D): REASONS FOR DISSATISFACTION OF BOTH SEXES WITH REPORTED LEVEL OF SATISFACTION WITH MEDICAL SERVICE BY SEX AND
QUINTILES
Per Capita Consumption Quintiles
Poorest II III IV Richest Reason Not Satisfied with Treatment
%
All St Lucia
Drugs not available - 11.4 15.3 5.0 - 6.5 Drugs not affordable 16.7 - - 4.8 - 4.1 Attitude of Staff 17.2 - - 19.8 32.4 14.4 Long waiting time 49.8 54.9 57.6 45.7 17.0 46.1 Equipment not available or operational - 11.4 13.4 4.9 - 6.1
No Doctor/Trained staff available - - - - 16.3 2.0
To many revisits 16.3 - 13.6 4.9 17.0 8.2 Not Stated - 22.3 - 14.9 17.4 12.5 All St Lucia 100.0 100.0 100.0 100.0 100.0 100.0
TABLE 39: MEAN TIME (MINS.) MALES SPENT WAITING FOR MEDICAL TREATMENT
BY QUINTILES
Per Capita Consumption Quintiles
Poorest II III IV Richest
Mean Total
Length of Wait Before Being Attended To 58 69 35 64 45 53
TABLE 39 (CONT’D): MEAN TIME (MINS.) FEMALES SPENT WAITING FOR MEDICAL TREATMENT BY SEX AND QUINTILES
Per Capita Consumption Quintiles
Poorest II III IV Richest
Mean Total
Length of Wait Before Being Attended To 61 60 42 51 45 50

DRAFT REPORT: Volume III - Quantitative Assessment of Poverty in St. Lucia 114
TABLE 39 (CONT’D): MEAN TIME (MINS.) BOTH SEXES SPENT WAITING FOR MEDICAL TREATMENT BY SEX AND QUINTILES
Per Capita Consumption Quintiles
Poorest II III IV Richest
Mean Total
Length of Wait Before Being Attended To 60 64 40 55 45 51
TABLE 40: MEAN TIME SPENT WAITING FOR TREATMENT BY PLACE VISITED FOR
MEDICAL CARE
Place First Visit Made Mean Length of Wait
Before Being Attended To
Public Hospital 78 Private Hospital 43 Community Health Clinic 49 Polyclinic 57 Private Doctor/Dentist 34 Out of state hospital 14 Pharmacy/Chemist 4 Other 56 Not Stated 33
Total 51
TABLE 41: DISTRIBUTION OF MALES COVERED BY MEDICAL INSURANCE BY QUINTILES
Per Capita Consumption Quintiles
Poorest II III IV Richest Covered By Health Insurance
%
All St Lucia
Yes 3.8 22.3 15.1 42.1 48.3 29.9 No 92.4 72.2 84.9 57.9 51.7 68.5 Not Stated 3.8 5.5 - - - 1.6 All St Lucia 100.0 100.0 100.0 100.0 100.0 100.0

DRAFT REPORT: Volume III - Quantitative Assessment of Poverty in St. Lucia 115
TABLE 41 (CONT’D): DISTRIBUTION OF FEMALES COVERED BY MEDICAL INSURANCE BY QUINTILES
Per Capita Consumption Quintiles
Poorest II III IV Richest Covered By Health Insurance
%
All St Lucia
Yes 6.9 21.3 16.6 27.2 36.4 24.3 No 93.1 78.7 83.4 71.6 61.4 74.8 Not Stated - - - 1.2 2.2 .9 All St Lucia 100.0 100.0 100.0 100.0 100.0 100.0
TABLE 41 (CONT’D): DISTRIBUTION OF BOTH SEXES COVERED BY MEDICAL INSURANCE BY QUINTILES
Per Capita Consumption Quintiles
Poorest II III IV Richest Covered By Health Insurance
%
All St Lucia
Yes 5.7 21.7 16.1 31.6 40.9 26.3 No 92.8 75.9 83.9 67.5 57.8 72.5 Not Stated 1.5 2.3 .9 1.4 1.2 All St Lucia 100.0 100.0 100.0 100.0 100.0 100.0

DRAFT REPORT: Volume III - Quantitative Assessment of Poverty in St. Lucia 116
Anthropometric Tables
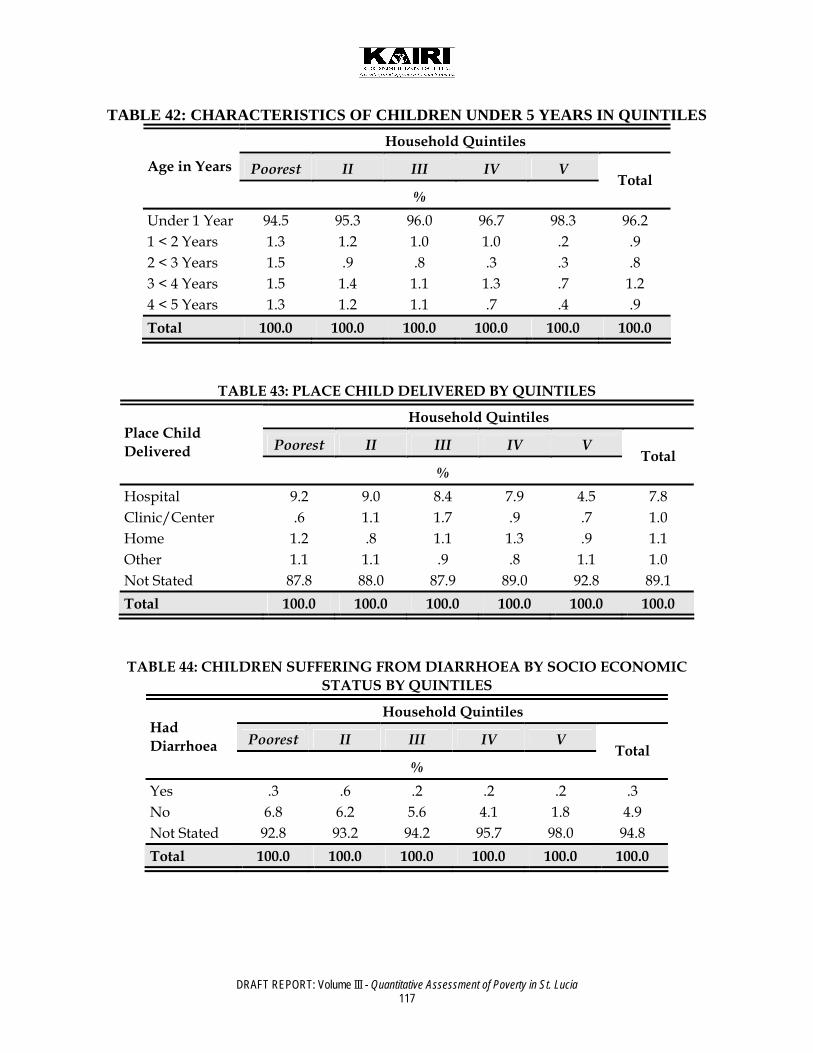
DRAFT REPORT: Volume III - Quantitative Assessment of Poverty in St. Lucia 117
TABLE 42: CHARACTERISTICS OF CHILDREN UNDER 5 YEARS IN QUINTILES Household Quintiles
Poorest II III IV V Age in Years
% Total
Under 1 Year 94.5 95.3 96.0 96.7 98.3 96.2 1 < 2 Years 1.3 1.2 1.0 1.0 .2 .9 2 < 3 Years 1.5 .9 .8 .3 .3 .8 3 < 4 Years 1.5 1.4 1.1 1.3 .7 1.2 4 < 5 Years 1.3 1.2 1.1 .7 .4 .9 Total 100.0 100.0 100.0 100.0 100.0 100.0
TABLE 43: PLACE CHILD DELIVERED BY QUINTILES
Household Quintiles
Poorest II III IV V Place Child Delivered
% Total
Hospital 9.2 9.0 8.4 7.9 4.5 7.8 Clinic/Center .6 1.1 1.7 .9 .7 1.0 Home 1.2 .8 1.1 1.3 .9 1.1 Other 1.1 1.1 .9 .8 1.1 1.0 Not Stated 87.8 88.0 87.9 89.0 92.8 89.1 Total 100.0 100.0 100.0 100.0 100.0 100.0
TABLE 44: CHILDREN SUFFERING FROM DIARRHOEA BY SOCIO ECONOMIC STATUS BY QUINTILES
Household Quintiles
Poorest II III IV V Had Diarrhoea
% Total
Yes .3 .6 .2 .2 .2 .3 No 6.8 6.2 5.6 4.1 1.8 4.9 Not Stated 92.8 93.2 94.2 95.7 98.0 94.8 Total 100.0 100.0 100.0 100.0 100.0 100.0

DRAFT REPORT: Volume III - Quantitative Assessment of Poverty in St. Lucia 118
TABLE 45:CHILDREN PREVIOUSLY BREAST FED BY SOCIO ECONOMIC STATUS
Household Quintiles
Poorest II III IV V Breast Fed
% Total
Yes 7.0 6.6 5.6 4.4 1.7 5.0 No .1 .1 .2 .1 .3 .1 Not Stated 92.9 93.4 94.1 95.5 98.1 94.8 Total 100.0 100.0 100.0 100.0 100.0 100.0
TABLE 46: CHILDREN PRESENTLY BREAST FED BY AGE AND SOCIO ECONOMIC STATUS
Household Quintiles
Poorest II III IV V Still Breast Fed
% Total
Yes 21.4 25.9 25.3 18.9 23.1 23.1 No 75.1 71.6 70.3 81.1 72.1 74.0 Not Stated 3.5 2.5 4.3 - 4.9 2.9 Total 100.0 100.0 100.0 100.0 100.0 100.0
TABLE 47: IMMUNIZATION RECEIVED BY CHILDREN UNDER 5 YEARS BY QUINTILES
Vaccination Received
Polio Diphtheria BCG HIB Measles Hepatitis B MMR1
Items Received Within 24 Hours
%
Vitamins and Supplements 53.8 55.0 53.1 55.1 58.6 56.6 54.8
Plain Water 92.8 94.9 92.9 93.6 93.1 91.6 94.7 Sweetened Water Juice Tea 82.3 85.1 82.2 85.1 84.3 81.9 84.6 ORS 5.4 5.8 5.4 7.3 7.3 6.9 3.7 Milk or Infant Formula 81.2 82.4 81.4 82.2 80.7 77.0 82.8 Solid or Semi Solid Food 78.7 81.1 78.2 81.6 80.1 77.0 81.2 Other 13.1 11.2 13.0 9.7 11.8 9.2 11.8 Only Breastmilk 4.9 4.0 4.9 2.5 3.8 .7 2.2 Don't Know 1.0 1.2 1.7 1.5 .9 - .5 Polio 100.0 99.6 96.3 98.5 99.5 99.3 99.5
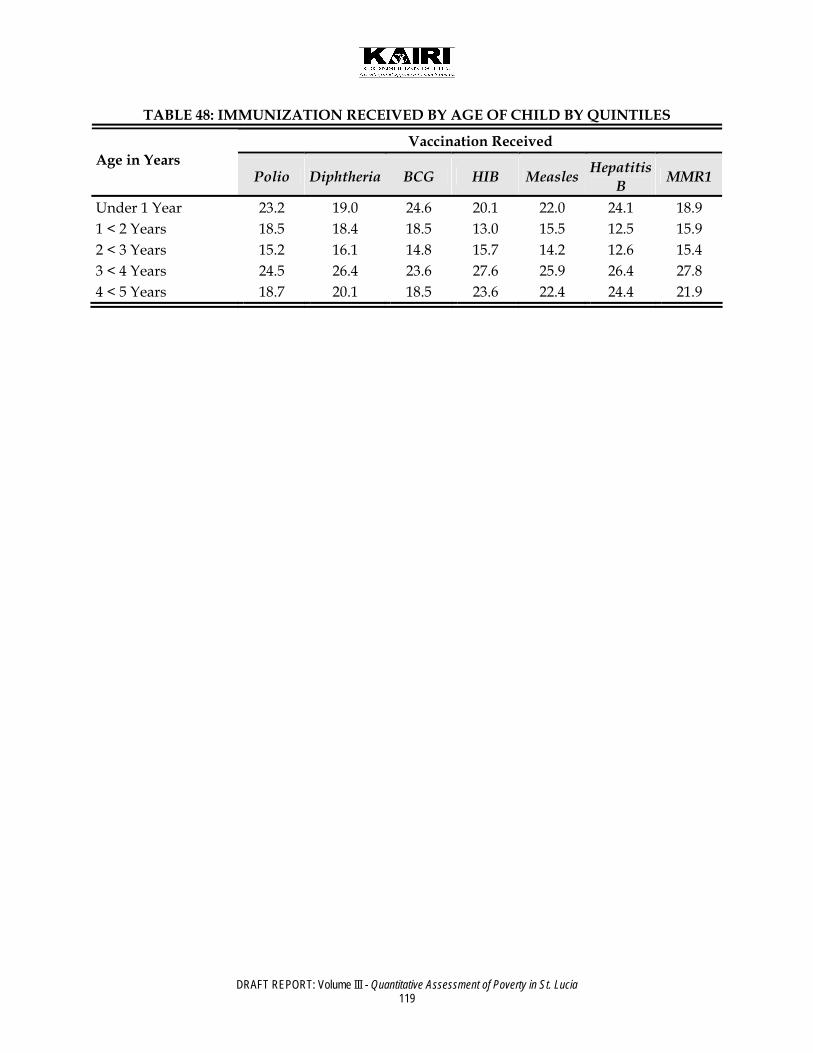
DRAFT REPORT: Volume III - Quantitative Assessment of Poverty in St. Lucia 119
TABLE 48: IMMUNIZATION RECEIVED BY AGE OF CHILD BY QUINTILES
Vaccination Received Age in Years
Polio Diphtheria BCG HIB Measles Hepatitis B MMR1
Under 1 Year 23.2 19.0 24.6 20.1 22.0 24.1 18.9 1 < 2 Years 18.5 18.4 18.5 13.0 15.5 12.5 15.9 2 < 3 Years 15.2 16.1 14.8 15.7 14.2 12.6 15.4 3 < 4 Years 24.5 26.4 23.6 27.6 25.9 26.4 27.8 4 < 5 Years 18.7 20.1 18.5 23.6 22.4 24.4 21.9
DRAFT REPORT: Volume III - Quantitative Assessment of Poverty in St. Lucia 120
Housing Tables

DRAFT REPORT: Volume III - Quantitative Assessment of Poverty in St. Lucia 121
TABLE 49: HOUSEHOLD CHARACTERISTICS: MAIN MATERIAL OF OUTER WALLS BY QUINTILES
Household Quintiles - AE Poorest II III IV V
Material of Outer Walls
% Total
Wood/Timber 32.0 23.7 19.1 16.1 10.1 20.2 Concrete/Concrete Blocks 20.9 30.6 41.6 55.3 68.5 43.4
Wood & Concrete 14.0 23.8 18.6 17.6 17.7 18.3 Stone - - - - .4 .1 Brick/Blocks 2.1 2.4 2.4 2.0 1.2 2.0 Plywood 30.7 19.1 17.9 8.5 1.6 15.5 Makeshift .4 .4 .4 - - .2 Other/Don't Know - - - .4 - .1 Not Stated - - - - .4 .1 Total 100.0 100.0 100.0 100.0 100.0 100.0
TABLE 50: HOUSEHOLD CHARACTERISTICS: TYPE OF DWELLING UNIT BY QUINTILES
Household Quintiles - AE Poorest II III IV V Type of Dwelling
% Total
Undivided Private House 90.2 89.8 83.7 81.8 80.7 85.2 Part of a Private House 7.0 6.2 9.0 11.3 9.6 8.6 Flat, Apartment, Condominium 2.4 2.8 6.1 5.7 7.2 4.8
Double House/Duplex - - - .4 .4 .2 Combined Business & Dwelling .4 .8 .8 .4 2.1 .9
Barracks - .4 - - - .1 Other - - .4 .4 - .2 Total 100.0 100.0 100.0 100.0 100.0 100.0

DRAFT REPORT: Volume III - Quantitative Assessment of Poverty in St. Lucia 122
TABLE 51: HOUSEHOLD CHARACTERISTICS: TYPE OF DWELLING UNIT BY DISTRICT
District
Cast
ries
Ci
ty
Cast
ries
Su
b-U
rban
A
nse-
La-
Ray
e
Souf
rier
e
Choi
seul
Labo
rie
Vieu
x-Fo
rt
Mic
oud
Den
nery
Gro
s-Is
let
Type of Dwelling
%
Total
Undivided Private House 69.4 81.8 85.7 78.8 91.7 94.2 93.9 99.1 99.0 80.3 85.2
Part of a Private House 15.7 12.0 6.3 19.2 6.3 3.8 3.1 1.0 8.7 8.6
Flat, Apartment, Condominium 14.9 4.7 7.9 1.9 - - - .9 - 8.2 4.8
Double House/Duplex - .5 - - - - - - - - .2
Combined Business & Dwelling
- .8 - - 2.1 1.9 3.1 - - 1.6 .9
Barracks - - - - - - - - .5 .1 Other - .3 - - - - - - - .5 .2 Total 100.0 100.0 100.0 100.0 100.0 100.0 100.0 100.0 100.0 100.0 100.0
TABLE 52: HOUSEHOLD CHARACTERISTICS: MAIN ROOFING MATERIAL BY QUINTILES
Household Quintiles - AE Poorest II III IV V Roof Material
% Total
Sheet Metal (galvanize) 98.4 98.3 97.5 96.7 90.3 96.2
Shingle Asphalt .4 .4 .8 2.5 4.9 1.8 Shingle Wood - - - - .8 .2 Shingle Other - - - - 1.2 .2 Tile - - - - 1.2 .2 Concrete - 1.2 .8 - .8 .6 Makeshift/Thatched - - .4 - - .1 Other .4 - .4 .8 .8 .5 Don't Know .8 - - - - .2 Total 100.0 100.0 100.0 100.0 100.0 100.0
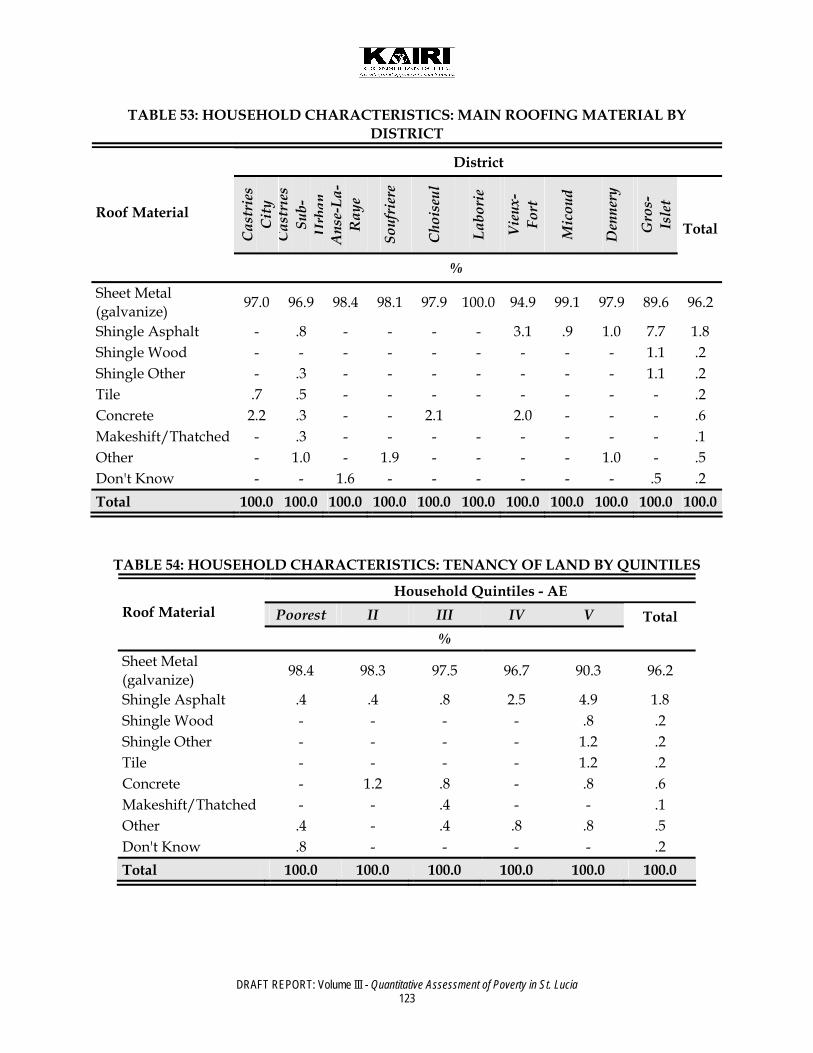
DRAFT REPORT: Volume III - Quantitative Assessment of Poverty in St. Lucia 123
TABLE 53: HOUSEHOLD CHARACTERISTICS: MAIN ROOFING MATERIAL BY DISTRICT
District
Cast
ries
Ci
ty
Cast
ries
Su
b-U
rban
A
nse-
La-
Ray
e
Souf
rier
e
Choi
seul
Labo
rie
Vieu
x-Fo
rt
Mic
oud
Den
nery
Gro
s-Is
let
Roof Material
%
Total
Sheet Metal (galvanize) 97.0 96.9 98.4 98.1 97.9 100.0 94.9 99.1 97.9 89.6 96.2
Shingle Asphalt - .8 - - - - 3.1 .9 1.0 7.7 1.8 Shingle Wood - - - - - - - - - 1.1 .2 Shingle Other - .3 - - - - - - - 1.1 .2 Tile .7 .5 - - - - - - - - .2 Concrete 2.2 .3 - - 2.1 2.0 - - - .6 Makeshift/Thatched - .3 - - - - - - - - .1 Other - 1.0 - 1.9 - - - - 1.0 - .5 Don't Know - - 1.6 - - - - - - .5 .2 Total 100.0 100.0 100.0 100.0 100.0 100.0 100.0 100.0 100.0 100.0 100.0
TABLE 54: HOUSEHOLD CHARACTERISTICS: TENANCY OF LAND BY QUINTILES
Household Quintiles - AE Poorest II III IV V Roof Material
% Total
Sheet Metal (galvanize) 98.4 98.3 97.5 96.7 90.3 96.2
Shingle Asphalt .4 .4 .8 2.5 4.9 1.8 Shingle Wood - - - - .8 .2 Shingle Other - - - - 1.2 .2 Tile - - - - 1.2 .2 Concrete - 1.2 .8 - .8 .6 Makeshift/Thatched - - .4 - - .1 Other .4 - .4 .8 .8 .5 Don't Know .8 - - - - .2 Total 100.0 100.0 100.0 100.0 100.0 100.0
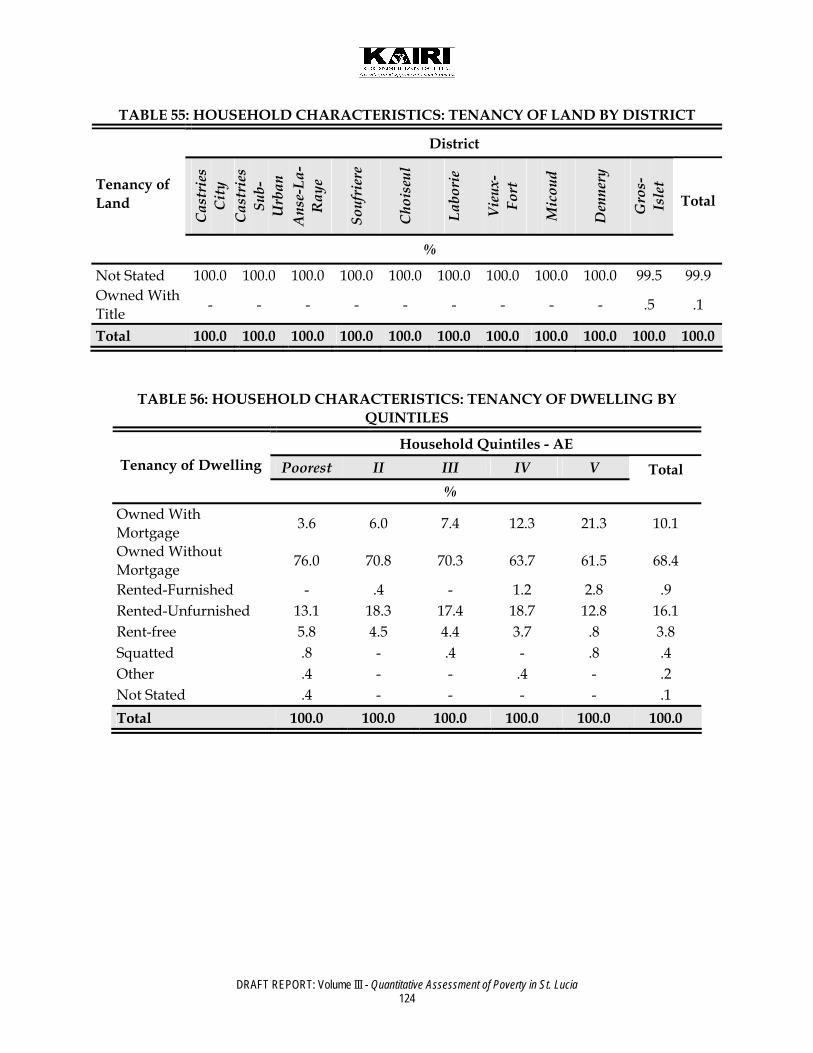
DRAFT REPORT: Volume III - Quantitative Assessment of Poverty in St. Lucia 124
TABLE 55: HOUSEHOLD CHARACTERISTICS: TENANCY OF LAND BY DISTRICT
District
Cast
ries
Ci
ty
Cast
ries
Su
b-U
rban
A
nse-
La-
Ray
e
Souf
rier
e
Choi
seul
Labo
rie
Vieu
x-Fo
rt
Mic
oud
Den
nery
Gro
s-Is
let Tenancy of
Land
%
Total
Not Stated 100.0 100.0 100.0 100.0 100.0 100.0 100.0 100.0 100.0 99.5 99.9 Owned With Title - - - - - - - - - .5 .1
Total 100.0 100.0 100.0 100.0 100.0 100.0 100.0 100.0 100.0 100.0 100.0
TABLE 56: HOUSEHOLD CHARACTERISTICS: TENANCY OF DWELLING BY QUINTILES
Household Quintiles - AE Poorest II III IV V Tenancy of Dwelling
% Total
Owned With Mortgage 3.6 6.0 7.4 12.3 21.3 10.1
Owned Without Mortgage 76.0 70.8 70.3 63.7 61.5 68.4
Rented-Furnished - .4 - 1.2 2.8 .9 Rented-Unfurnished 13.1 18.3 17.4 18.7 12.8 16.1 Rent-free 5.8 4.5 4.4 3.7 .8 3.8 Squatted .8 - .4 - .8 .4 Other .4 - - .4 - .2 Not Stated .4 - - - - .1 Total 100.0 100.0 100.0 100.0 100.0 100.0
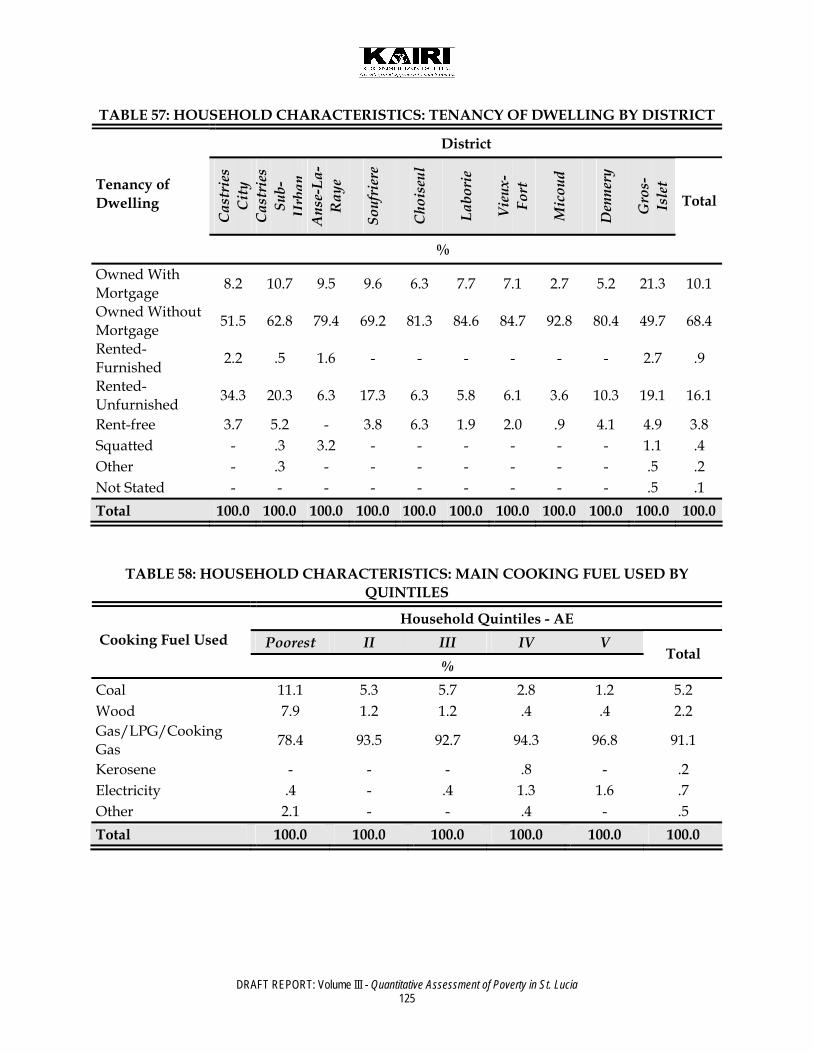
DRAFT REPORT: Volume III - Quantitative Assessment of Poverty in St. Lucia 125
TABLE 57: HOUSEHOLD CHARACTERISTICS: TENANCY OF DWELLING BY DISTRICT
District
Cast
ries
Ci
ty
Cast
ries
Su
b-U
rban
A
nse-
La-
Ray
e
Souf
rier
e
Choi
seul
Labo
rie
Vieu
x-Fo
rt
Mic
oud
Den
nery
Gro
s-Is
let Tenancy of
Dwelling
%
Total
Owned With Mortgage 8.2 10.7 9.5 9.6 6.3 7.7 7.1 2.7 5.2 21.3 10.1
Owned Without Mortgage 51.5 62.8 79.4 69.2 81.3 84.6 84.7 92.8 80.4 49.7 68.4
Rented-Furnished 2.2 .5 1.6 - - - - - - 2.7 .9
Rented-Unfurnished 34.3 20.3 6.3 17.3 6.3 5.8 6.1 3.6 10.3 19.1 16.1
Rent-free 3.7 5.2 - 3.8 6.3 1.9 2.0 .9 4.1 4.9 3.8 Squatted - .3 3.2 - - - - - - 1.1 .4 Other - .3 - - - - - - - .5 .2 Not Stated - - - - - - - - - .5 .1 Total 100.0 100.0 100.0 100.0 100.0 100.0 100.0 100.0 100.0 100.0 100.0
TABLE 58: HOUSEHOLD CHARACTERISTICS: MAIN COOKING FUEL USED BY QUINTILES
Household Quintiles - AE Poorest II III IV V Cooking Fuel Used
% Total
Coal 11.1 5.3 5.7 2.8 1.2 5.2 Wood 7.9 1.2 1.2 .4 .4 2.2 Gas/LPG/Cooking Gas 78.4 93.5 92.7 94.3 96.8 91.1
Kerosene - - - .8 - .2 Electricity .4 - .4 1.3 1.6 .7 Other 2.1 - - .4 - .5 Total 100.0 100.0 100.0 100.0 100.0 100.0
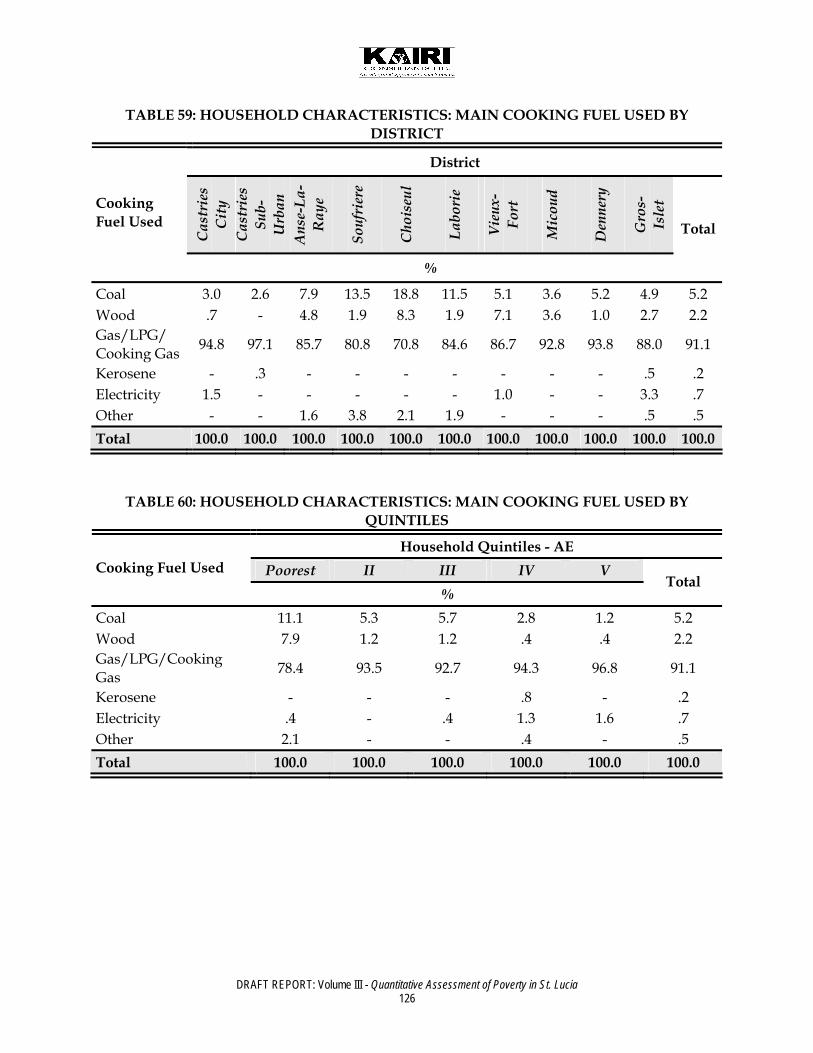
DRAFT REPORT: Volume III - Quantitative Assessment of Poverty in St. Lucia 126
TABLE 59: HOUSEHOLD CHARACTERISTICS: MAIN COOKING FUEL USED BY DISTRICT
District
Cast
ries
Ci
ty
Cast
ries
Su
b-U
rban
A
nse-
La-
Ray
e
Souf
rier
e
Choi
seul
Labo
rie
Vieu
x-Fo
rt
Mic
oud
Den
nery
Gro
s-Is
let Cooking
Fuel Used
%
Total
Coal 3.0 2.6 7.9 13.5 18.8 11.5 5.1 3.6 5.2 4.9 5.2 Wood .7 - 4.8 1.9 8.3 1.9 7.1 3.6 1.0 2.7 2.2 Gas/LPG/ Cooking Gas 94.8 97.1 85.7 80.8 70.8 84.6 86.7 92.8 93.8 88.0 91.1
Kerosene - .3 - - - - - - - .5 .2 Electricity 1.5 - - - - - 1.0 - - 3.3 .7 Other - - 1.6 3.8 2.1 1.9 - - - .5 .5 Total 100.0 100.0 100.0 100.0 100.0 100.0 100.0 100.0 100.0 100.0 100.0
TABLE 60: HOUSEHOLD CHARACTERISTICS: MAIN COOKING FUEL USED BY QUINTILES
Household Quintiles - AE Poorest II III IV V Cooking Fuel Used
% Total
Coal 11.1 5.3 5.7 2.8 1.2 5.2 Wood 7.9 1.2 1.2 .4 .4 2.2 Gas/LPG/Cooking Gas 78.4 93.5 92.7 94.3 96.8 91.1
Kerosene - - - .8 - .2 Electricity .4 - .4 1.3 1.6 .7 Other 2.1 - - .4 - .5 Total 100.0 100.0 100.0 100.0 100.0 100.0
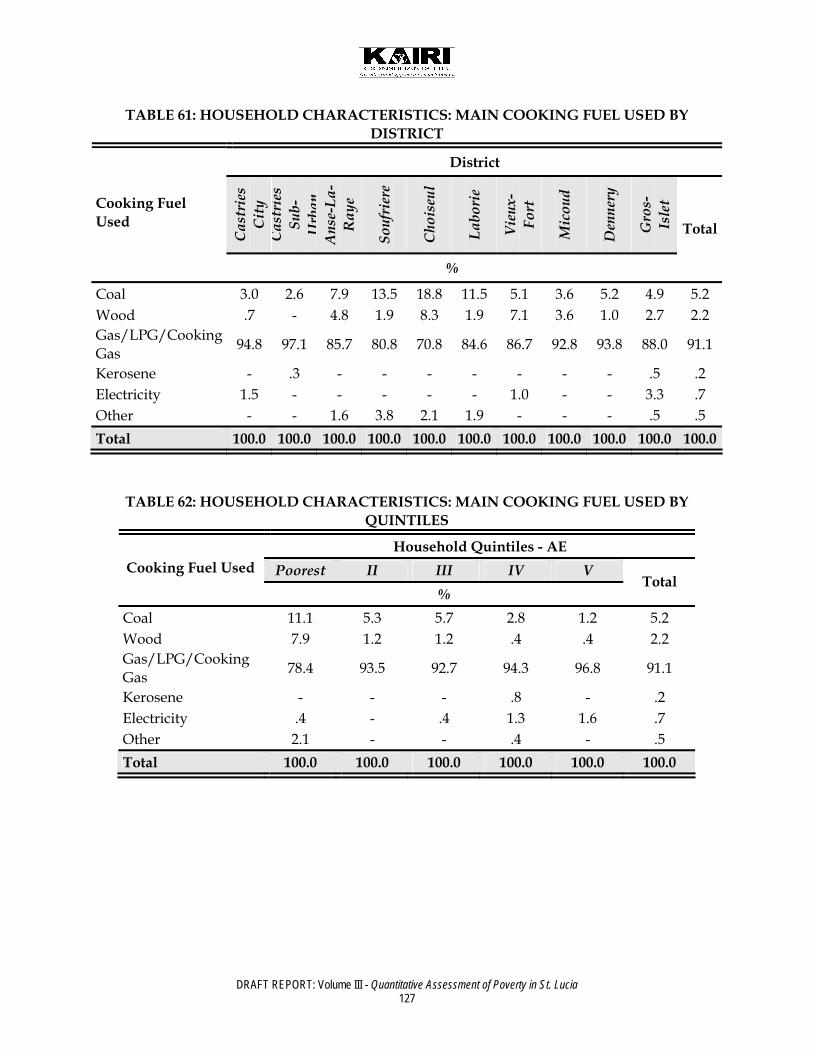
DRAFT REPORT: Volume III - Quantitative Assessment of Poverty in St. Lucia 127
TABLE 61: HOUSEHOLD CHARACTERISTICS: MAIN COOKING FUEL USED BY DISTRICT
District
Cast
ries
Ci
ty
Cast
ries
Su
b-U
rban
A
nse-
La-
Ray
e
Souf
rier
e
Choi
seul
Labo
rie
Vieu
x-Fo
rt
Mic
oud
Den
nery
Gro
s-Is
let Cooking Fuel
Used
%
Total
Coal 3.0 2.6 7.9 13.5 18.8 11.5 5.1 3.6 5.2 4.9 5.2 Wood .7 - 4.8 1.9 8.3 1.9 7.1 3.6 1.0 2.7 2.2 Gas/LPG/Cooking Gas 94.8 97.1 85.7 80.8 70.8 84.6 86.7 92.8 93.8 88.0 91.1
Kerosene - .3 - - - - - - - .5 .2 Electricity 1.5 - - - - - 1.0 - - 3.3 .7 Other - - 1.6 3.8 2.1 1.9 - - - .5 .5 Total 100.0 100.0 100.0 100.0 100.0 100.0 100.0 100.0 100.0 100.0 100.0
TABLE 62: HOUSEHOLD CHARACTERISTICS: MAIN COOKING FUEL USED BY QUINTILES
Household Quintiles - AE Poorest II III IV V Cooking Fuel Used
% Total
Coal 11.1 5.3 5.7 2.8 1.2 5.2 Wood 7.9 1.2 1.2 .4 .4 2.2 Gas/LPG/Cooking Gas 78.4 93.5 92.7 94.3 96.8 91.1
Kerosene - - - .8 - .2 Electricity .4 - .4 1.3 1.6 .7 Other 2.1 - - .4 - .5 Total 100.0 100.0 100.0 100.0 100.0 100.0

DRAFT REPORT: Volume III - Quantitative Assessment of Poverty in St. Lucia 128
TABLE 63: HOUSEHOLD CHARACTERISTICS: MAIN COOKING FUEL USED BY DISTRICT
District
Cast
ries
Ci
ty
Cast
ries
Su
b-U
rban
A
nse-
La-
Ray
e
Souf
rier
e
Choi
seul
Labo
rie
Vieu
x-Fo
rt
Mic
oud
Den
nery
Gro
s-Is
let Cooking Fuel
Used
%
Total
Coal 3.0 2.6 7.9 13.5 18.8 11.5 5.1 3.6 5.2 4.9 5.2 Wood .7 - 4.8 1.9 8.3 1.9 7.1 3.6 1.0 2.7 2.2 Gas/LPG/Cooking Gas 94.8 97.1 85.7 80.8 70.8 84.6 86.7 92.8 93.8 88.0 91.1
Kerosene - .3 - - - - - - - .5 .2 Electricity 1.5 - - - - - 1.0 - - 3.3 .7 Other - 1.6 3.8 2.1 1.9 - - - .5 .5 Total 100.0 100.0 100.0 100.0 100.0 100.0 100.0 100.0 100.0 100.0 100.0
TABLE 64: HOUSEHOLD CHARACTERISTICS: TOILET FACILITY USED BY QUINTILES
Household Quintiles - AE
Poorest II III IV V Toilet Facilities
% Total
W.C. Linked to sewer 2.8 4.4 3.6 4.1 14.6 5.9 W.C. Linked to Septic tank/Soak-away 28.2 54.1 66.2 76.5 78.4 60.7
Pit-latrine 57.8 36.7 25.7 16.5 6.9 28.7 Ventilated Pit-latrine .4 .4 .8 - - .3 Other 3.2 3.2 2.0 .8 - 1.8 None 7.5 .8 1.7 2.1 - 2.4 Not Stated - .4 - - - .1
Total 100.0 100.0 100.0 100.0 100.0 100.0

DRAFT REPORT: Volume III - Quantitative Assessment of Poverty in St. Lucia 129
TABLE 65: HOUSEHOLD CHARACTERISTICS: TOILET FACILITIES USED BY DISTRICT
District
Cast
ries
Ci
ty
Cast
ries
Su
b-U
rban
A
nse-
La-
Ray
e
Souf
rier
e
Choi
seul
Labo
rie
Vieu
x-Fo
rt
Mic
oud
Den
nery
Gro
s-Is
let
Toilet Facilities
%
Total
W.C. Linked to sewer 11.2 6.8 - - - - 4.1 - - 15.3 5.9
W.C. Linked to Septic tank/Soak-away
67.9 71.9 34.9 57.7 62.5 65.4 54.1 49.5 32.0 65.6 60.7
Pit-latrine 20.1 18.8 39.7 23.1 33.3 28.8 38.8 50.5 62.9 15.3 28.7 Ventilated Pit-latrine - 1.0 - - - - - - - - .3
Other .7 .8 19.0 1.9 4.2 - - - - 2.2 1.8 None - .8 6.3 17.3 - 5.8 3.1 - 5.2 1.1 2.4 Not Stated - - - - - - - - - .5 .1 Total 100.0 100.0 100.0 100.0 100.0 100.0 100.0 100.0 100.0 100.0 100.0
TABLE 66: HOUSEHOLD CHARACTERISTICS: FACILITIES SHARED BY QUINTILES
Household Quintiles - AE
Poorest II III IV V Toilet Facilities
% Total
W.C. Linked to sewer 2.8 4.4 3.6 4.1 14.6 5.9 W.C. Linked to Septic tank/Soak-away 28.2 54.1 66.2 76.5 78.4 60.7
Pit-latrine 57.8 36.7 25.7 16.5 6.9 28.7 Ventilated Pit-latrine .4 .4 .8 - - .3 Other 3.2 3.2 2.0 .8 - 1.8 None 7.5 .8 1.7 2.1 - 2.4 Not Stated - .4 - - - .1
Total 100.0 100.0 100.0 100.0 100.0 100.0

DRAFT REPORT: Volume III - Quantitative Assessment of Poverty in St. Lucia 130
TABLE 67: HOUSEHOLD CHARACTERISTICS: MAIN SOURCE OF WATER BY QUINTILES
Household Quintiles - AE Poorest II III IV V Main Source of Water
% Total
Public, piped into dwelling 40.5 59.8 70.6 82.1 90.1 68.6
Public, piped into yard 34.4 26.0 21.7 10.8 7.0 19.9 Public standpipe 13.5 6.5 3.7 2.9 - 5.3 Public well/tank or truck .4 - - - - .1 Private, piped into dwelling .4 2.4 1.2 1.2 1.2 1.3
Private catchment not piped .4 1.6 .4 - .4 .6
Private catchment piped .8 - - - .4 .3 Other 9.5 3.3 2.5 3.0 .8 3.8 Not Stated - .4 - - - .1 Total 100.0 100.0 100.0 100.0 100.0 100.0
TABLE 68: HOUSEHOLD CHARACTERISTICS: MAIN SOURCE OF WATER BY DISTRICT
District Main Source of Water % Total Public, piped into dwelling 88.1 78.4 58.7 51.9 50.0 71.2 53.1 53.2 38.1 81.4 68.6
Public, piped into yard 9.0 14.6 6.3 23.1 37.5 15.4 33.7 37.8 45.4 7.1 19.9
Public standpipe - 3.6 14.3 13.5 2.1 9.6 3.1 1.8 11.3 7.1 5.3 Public well/tank or truck
- - - - - - - - - .5 .1
Private, piped into dwelling 1.5 1.6 12.7 - - - - - - - 1.3
Private catchment not piped
.7 .3 - 1.9 2.1 1.9 - - - 1.1 .6
Private catchment piped - - - - - 1.9 - .9 .5 .3
Other .7 1.6 7.9 9.6 8.3 - 10.2 6.3 5.2 1.6 3.8 Not Stated - - - - - - - - - .5 .1 Total 100.0 100.0 100.0 100.0 100.0 100.0 100.0 100.0 100.0 100.0 100.0

DRAFT REPORT: Volume III - Quantitative Assessment of Poverty in St. Lucia 131
TABLE 69: HOUSEHOLD CHARACTERISTICS: MAIN FREQUENCY OF WATER SUPPLY BY QUINTILES
Household Quintiles - AE Poorest II III IV V
Days Have Water in Tap
% Total
Never 22.8 10.2 7.0 6.3 2.1 9.6 One 2.8 3.6 4.0 2.0 2.8 3.1 Two 6.7 4.1 4.4 3.7 3.6 4.5 Three 8.1 12.9 10.3 12.3 14.0 11.5 Four 6.1 5.0 4.9 6.2 11.1 6.7 Five 6.6 10.3 8.2 6.5 8.1 7.9 Six 5.0 7.6 7.4 3.2 7.2 6.1 Always 37.8 41.5 47.8 50.2 43.4 44.1 Don't Know 4.0 3.6 4.9 6.8 5.6 5.0 Not Stated 1.2 1.2 2.8 2.1 1.4 Total 100.0 100.0 100.0 100.0 100.0 100.0
TABLE 70: HOUSEHOLD CHARACTERISTICS: FREQUENCY OF WATER SUPPLY BY DISTRICT
District
Cast
ries
Ci
ty
Cast
ries
Su
b-U
rban
A
nse-
La-
Ray
e
Souf
rier
e
Choi
seul
Labo
rie
Vieu
x-Fo
rt
Mic
oud
Den
nery
Gro
s-Is
let Days Have
Water in Tap
%
Total
Never 1.5 6.3 20.6 23.1 12.5 11.5 11.2 9.9 13.4 10.4 9.6 One 3.0 2.9 3.2 - 4.2 1.9 - .9 10.3 3.8 3.1 Two 2.2 3.1 1.6 - 12.5 - - .9 24.7 4.9 4.5 Three 17.9 5.2 6.3 13.5 33.3 11.5 4.1 27.0 18.6 6.6 11.5 Four 7.5 7.6 1.6 19.2 - 1.9 3.1 9.0 7.2 5.5 6.7 Five 9.7 9.4 1.6 3.8 - 5.8 4.1 8.1 6.2 12.6 7.9 Six 4.5 7.6 - 3.8 2.1 3.8 14.3 5.4 3.1 6.0 6.1 Always 42.5 47.1 47.6 32.7 35.4 61.5 62.2 38.7 15.5 46.4 44.1 Don't Know 6.0 9.1 15.9 1.9 - 1.9 1.0 - 1.0 2.7 5.0 Not Stated 5.2 1.8 1.6 1.9 - - - - - 1.1 1.4 Total 100.0 100.0 100.0 100.0 100.0 100.0 100.0 100.0 100.0 100.0 100.0
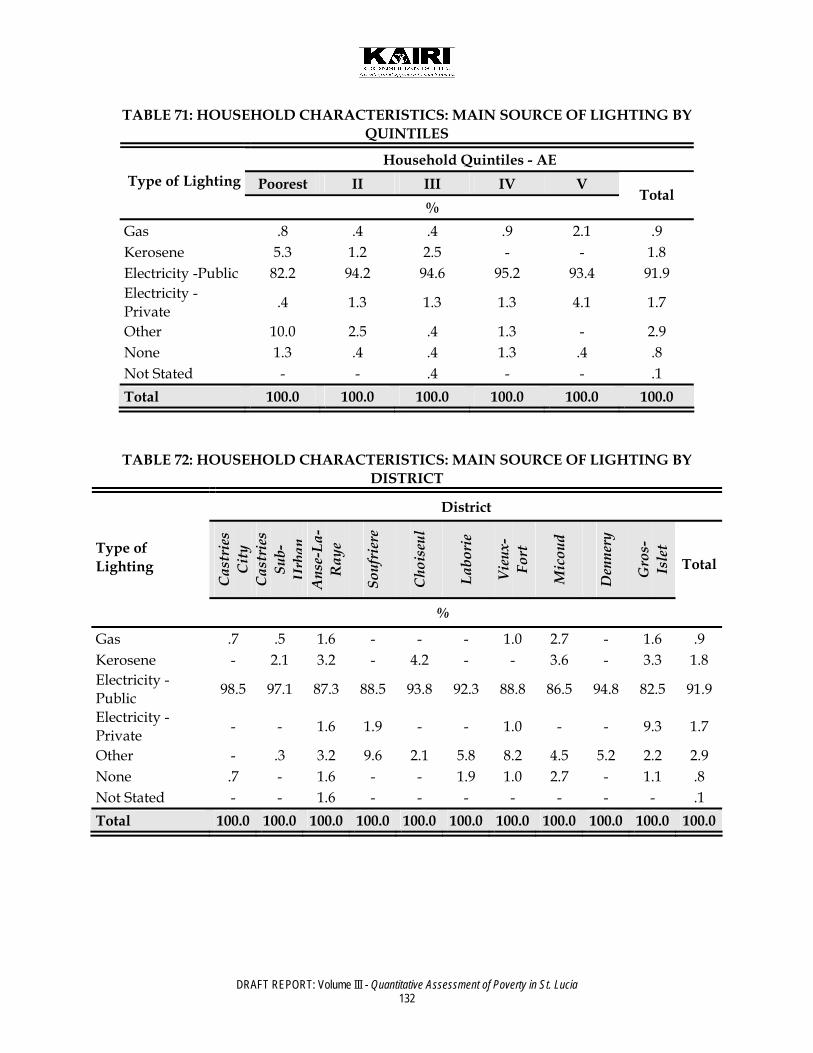
DRAFT REPORT: Volume III - Quantitative Assessment of Poverty in St. Lucia 132
TABLE 71: HOUSEHOLD CHARACTERISTICS: MAIN SOURCE OF LIGHTING BY QUINTILES
Household Quintiles - AE Poorest II III IV V Type of Lighting
% Total
Gas .8 .4 .4 .9 2.1 .9 Kerosene 5.3 1.2 2.5 - - 1.8 Electricity -Public 82.2 94.2 94.6 95.2 93.4 91.9 Electricity - Private .4 1.3 1.3 1.3 4.1 1.7
Other 10.0 2.5 .4 1.3 - 2.9 None 1.3 .4 .4 1.3 .4 .8 Not Stated - - .4 - - .1 Total 100.0 100.0 100.0 100.0 100.0 100.0
TABLE 72: HOUSEHOLD CHARACTERISTICS: MAIN SOURCE OF LIGHTING BY DISTRICT
District
Cast
ries
Ci
ty
Cast
ries
Su
b-U
rban
A
nse-
La-
Ray
e
Souf
rier
e
Choi
seul
Labo
rie
Vieu
x-Fo
rt
Mic
oud
Den
nery
Gro
s-Is
let Type of
Lighting
%
Total
Gas .7 .5 1.6 - - - 1.0 2.7 - 1.6 .9 Kerosene - 2.1 3.2 - 4.2 - - 3.6 - 3.3 1.8 Electricity -Public 98.5 97.1 87.3 88.5 93.8 92.3 88.8 86.5 94.8 82.5 91.9
Electricity - Private - - 1.6 1.9 - - 1.0 - - 9.3 1.7
Other - .3 3.2 9.6 2.1 5.8 8.2 4.5 5.2 2.2 2.9 None .7 - 1.6 - - 1.9 1.0 2.7 - 1.1 .8 Not Stated - - 1.6 - - - - - - - .1 Total 100.0 100.0 100.0 100.0 100.0 100.0 100.0 100.0 100.0 100.0 100.0

DRAFT REPORT: Volume III - Quantitative Assessment of Poverty in St. Lucia 133
TABLE 73: HOUSEHOLD CHARACTERISTICS: AGE OF DWELLING BY QUINTILES
Household Quintiles - AE Poorest II III IV V
Year Dwelling Built
% Total
Before 1970 8.7 7.3 11.5 14.0 10.5 10.4 1970 - 1979 11.6 7.8 7.4 9.3 17.8 10.8 1980 - 1989 16.0 20.5 13.2 19.0 21.2 18.0 1990 - 1995 14.8 12.0 17.3 13.6 15.2 14.6 1996 - 2000 10.6 11.0 12.0 11.1 11.1 11.2 2001 .8 1.3 1.6 2.5 2.0 1.6 2002 2.1 .9 2.0 .4 .4 1.1 2003 1.6 .8 1.6 .8 .4 1.0 2004 .4 2.2 .8 1.2 1.7 1.3 2005 .8 .4 1.2 .4 .6 Don't Know 32.1 34.7 31.6 25.7 19.3 28.6 Not Stated .4 1.7 .4 1.2 .7 Total 100.0 100.0 100.0 100.0 100.0 100.0
TABLE 74: HOUSEHOLD CHARACTERISTICS: AGE OF DWELLING BY DISTRICT
District
Cast
ries
Ci
ty
Cast
ries
Su
b-U
rban
A
nse-
La-R
aye
Souf
rier
e
Choi
seul
Labo
rie
Vieu
x-Fo
rt
Mic
oud
Den
nery
Gro
s-Is
let Year
Dwelling Built
%
Total
Before 1970 18.7 9.6 11.1 13.5 2.1 19.2 12.2 13.5 5.2 4.4 10.4 1970 - 1979 14.9 11.5 4.8 7.7 10.4 13.5 11.2 12.6 6.2 9.8 10.8 1980 - 1989 11.2 13.3 12.7 15.4 41.7 17.3 30.6 18.9 15.5 23.0 18.0 1990 - 1995 8.2 12.8 14.3 23.1 16.7 26.9 12.2 20.7 11.3 15.3 14.6 1996 - 2000 3.7 12.0 11.1 5.8 10.4 7.7 17.3 13.5 16.5 9.8 11.2 2001 .7 1.8 - 1.9 4.2 3.8 1.0 .9 1.0 2.2 1.6 2002 .7 .8 1.6 3.8 - - - .9 4.1 1.1 1.1 2003 .7 1.0 3.2 - - - 1.0 - 5.2 - 1.0 2004 .7 .5 - 1.9 - - 1.0 3.6 2.1 2.2 1.3 2005 .7 .8 - - - 1.9 2.0 - - - .6 Don't Know 39.6 35.7 38.1 26.9 14.6 9.6 11.2 13.5 33.0 30.1 28.6 Not Stated - .3 3.2 - - - - 1.8 - 2.2 .7 Total 100.0 100.0 100.0 100.0 100.0 100.0 100.0 100.0 100.0 100.0 100.0

DRAFT REPORT: Volume III - Quantitative Assessment of Poverty in St. Lucia 134
TABLE 75: SOCIO ECONOMIC RATING OF HOUSEHOLD BY QUINTILES
Household Quintiles - AE Poorest II III IV V
Socio-Economic Rating
% Total
Poor 31.7 14.6 14.6 15.0 2.8 15.7 II 35.5 42.4 34.1 30.3 21.8 32.8 III 27.4 38.0 42.6 48.9 65.9 44.6 IV 3.8 3.7 5.9 3.7 8.7 5.2 Rich - .4 .8 .4 .4 .4 Not Stated 1.6 .8 2.0 1.6 .4 1.3 Total 100.0 100.0 100.0 100.0 100.0 100.0
TABLE 76: SOCIO ECONOMIC RATING OF HOUSEHOLDS BY DISTRICT
District
Cast
ries
Ci
ty
Cast
ries
Su
b-U
rban
A
nse-
La-
Ray
e
Souf
rier
e
Choi
seul
Labo
rie
Vieu
x-Fo
rt
Mic
oud
Den
nery
Gro
s-Is
let Socio-Economic
Rating
%
Total
Poor 19.4 14.3 41.3 11.5 6.3 13.5 18.4 15.3 14.4 11.5 15.7 II 32.1 35.4 30.2 34.6 47.9 38.5 33.7 23.4 40.2 24.6 32.8 III 44.0 45.6 22.2 50.0 45.8 40.4 42.9 47.7 43.3 49.2 44.6 IV 3.0 2.9 1.6 3.8 - 7.7 4.1 10.8 1.0 12.6 5.2 Rich .7 .5 - - - - - .9 - .5 .4 Not Stated .7 1.3 4.8 - - - 1.0 1.8 1.0 1.6 1.3 Total 100.0 100.0 100.0 100.0 100.0 100.0 100.0 100.0 100.0 100.0 100.0

DRAFT REPORT: Volume III - Quantitative Assessment of Poverty in St. Lucia 135
TABLE 77: MEAN NUMBER OF ROOMS AND USE OF ROOMS BY QUINTILES
Household Quintiles - AE
Poorest II III IV V
Mean Total
Number of Rooms 3.21 4.06 3.88 4.23 4.32 3.94 Number of Bedrooms 2.08 2.48 2.74 2.52 2.74 2.51 Rooms Used For Business .02 .02 .03 .01 .07 .03 Rooms Rented .00 .00 .00 .02 .01 .01 Rooms Vacant .02 .05 .01 .03 .09 .04