Embed Size (px)
Citation preview

W O R K I N G PAPER
ASSESSMENT OF POTENTIAL SHIFTS IN EUROPE'S NATURAL VEGETATION DUE TO CLIMATIC CHANGE AND SOME IMPLICATIONS FOR NATURE CONSERVATION
Rudolf S. de Groot
November 1988 WP-88-105
I n t e r n a t i o n a l I n s t i t u t e for Applied Systems Analysis

ASSESSMENT OF POTENTIAL SHIFTS IN EUROPE'S NATURAL VEGETATION DUE TO CLIMATIC CHANGE AND SOME IMPLICATIONS FOR NATURE CONSERVATION
Rudolf S. de Groot
November 1988 WP-88-105
Nature Conservation Department, Agricultural University, Ritzema Bosweg 32a, 6703 AZ Wageningen, The Netherlands.
Working Papers are interim reports on work of the International Institute for Applied Systems Analysis and have received only limited review. Views or opinions expressed herein do not necessarily represent those of the Institute or of its National Member Organizations.
INTERNATIONAL INSTITUTE FOR APPLIED SYSTEMS ANALYSIS A-2361 Laxenburg, Austria

FOREWORD
One of the objectives of IIASA's Study The Future Environments for Europe: Some Impli- cations of Alternative Development Paths is to characterize the large-scale and long-term environmental transformations that could be associated with plausible scenarios of Europe's soci~economic development over the next century. An important environmen- tal transformation is the expected climatic change which will place additional stresses on the natural ecosystems in Europe. This Working Paper describes an assessment of the potential shifts in natural vegetation due to a change in climate and addresses some of the major implications for nature conservation.
The paper was prepared by the author during his participation in IIASA's Young Scientist's Summer Program of 1987.
B.R. Doos Leader Environment Program

TABLE OF CONTENTS
Page .
.............................................................................................. Introduction and summary 1
1 . Relation between climate and vegetation ..................................................................... 2
................................... 1.1 Some models for vegetation classification based on climate 3
1.2 Some important climatic factors that influence vegetation growth and ........................................................................................................... distribution 7
2 . A first attempt to produce a "bioclimatic vegetation map" for Europe ........................ 8
2.1 Existing vegetation maps for Europe in relation to climate .................................... 9
2.2 A potential "bioclimatic vegetation map" for Europe .......................................... 10
3 . Possible effects of climatic change on the natural vegetation in Europe .................... 12
.................................................................................. 3.1 Climatic change in Europe 12 3.2 Some general effects of climate change on natural ecosystems .............................. 14
........ 3.3 Potential shifts in Europe's natural vegetation zones due to climatic change 16
4 . Some implications of climatic change for nature conservation .................................... 17
....................................................................................................... 4.1 Introduction 17
4.2 Some general consequences of a climatic change for protected areas ..................... 18
4.3 Management and policy implications ................................................................... 22
................................................................................................................ 5 . Discussion 24
................................................................................................................ References 27
....................................................................................................... Further Reading 29

ASSESSMENT OF POTENTIAL SHIFTS IN EUROPE'S NATURAL VEGETATION
DUE TO CLIMATIC CHANGE AND SOME IMPLICATIONS FOR NATURE CONSERVATION
Rudolf S. de Groot
Introduction And Summary
The broad-scale distribution of terrestrial ecosystem complexes is determined in large part by climate and can be altered by climate change due to natural causes or due to human activities such as those leading to increasing atmospheric CO, concentrations (Emanuel et al., 1985). As a result of the increasing concentrations of C 0 2 and other secalled greenhouse gases, it is now believed that in the first half of the next-century a rise of g l e bal mean temperature could occur which is greater than any in man's history (see Chapter 3). If present trends continue, the combined concentrations of greenhouse gases would lead to an increase of the global mean equilibrium surface temperature of between 1.5 and 4.5' C (UNEP/WMO/ICSU, 1985) or up to 5.5OC according to Bolin, Jager and Doos (1986). At present it is still unclear what the possible effects of this global warming on the b i e sphere might be. International scientific organizations have sponsored numerous meetings on the carbon dioxide issue in recent years, with the aim of bringing the provision of scientific information in line with policy needs. Building upon the 1985 World Climate Programme Conference at Villach, specific recommendations have been developed regard- ing future policy-relevant research in the areas of climate scenario development, related to changes in agriculture, water resources, marine fisheries and forest and tropical biomes (Bolin et al., 1986). The major research activities on the effects of climatic change focussed primarily on the links between climatic variation and agriculture (see for exam- ple a recent study by Parry et al., 1988) and (production) forests. An assessment of the response of forests to climatic change is presented by Shugart et al. (1986). Further titles on this subject can be found in the references. Remarkably, thus far the effects of a climate change on natural ecosystems have largely been neglected in international research efforts. Yet, climate change will probably have significant consequences for the species composi- tion, structure and the distribution of natural vegetation zones and for the conservation of natural ecosystems in protected areas.
The original assignment for this study involved assessing the potential changes in Europe over the next 100 years that could occur on land currently reserved as national parks or other protected areas. Since vegetation is probably the single most important factor determining the structure, functioning and species composition of natural ecosystems, i t was decided to concentrate on an assessment of the effects of a climatic change on the na- tural vegetation in Europe.
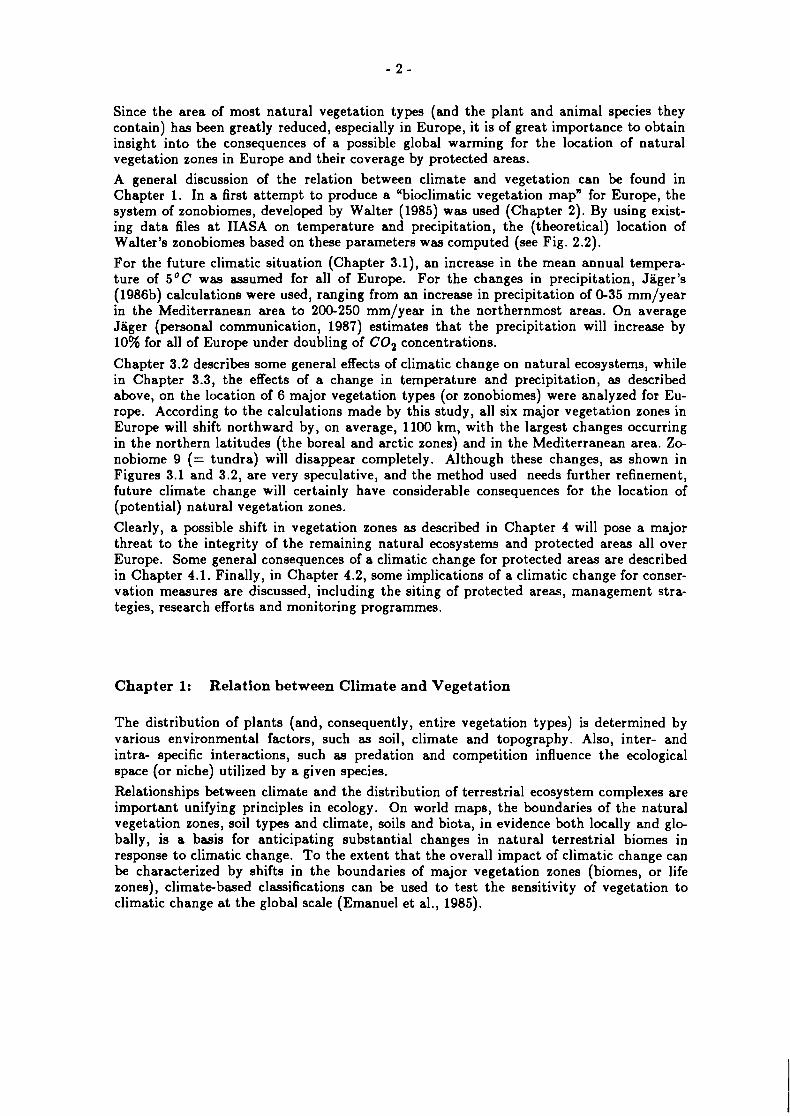
Since the area of most natural vegetation types (and the plant and animal species they contain) has been greatly reduced, especially in Europe, it is of great importance to obtain insight into the consequences of a possible global warming for the location of natural vegetation zones in Europe and their coverage by protected areas.
A general discussion of the relation between climate and vegetation can be found in Chapter 1. In a first attempt to produce a "bioclimatic vegetation map" for Europe, the system of zonobiomes, developed by Walter (1985) was used (Chapter 2). By using exist- ing data files a t IIASA on temperature and precipitation, the (theoretical) location of Walter's zonobiomes based on these parameters was computed (see Fig. 2.2).
For the future climatic situation (Chapter 3.1), an increase in the mean annual tempera- ture of 5OC was assumed for all of Europe. For the changes in precipitation, Jager's (1986b) calculations were used, ranging from an increase in precipitation of 0-35 mm/year in the Mediterranean area to 200-250 mm/year in the northernmost areas. On average Jager (personal communication, 1987) estimates that the precipitation will increase by 10% for all of Europe under doubling of C 0 2 concentrations.
Chapter 3.2 describes some general effects of climatic change on natural ecosystems, while in Chapter 3.3, the effects of a change in temperature and precipitation, as described above, on the location of 6 major vegetation types (or zonobiomes) were analyzed for Eu- rope. According to the calculations made by this study, all six major vegetation zones in Europe will shift northward by, on average, 1100 km, with the largest changes occurring in the northern latitudes (the boreal and arctic zones) and in the Mediterranean area. Zo- nobiome 9 (= tundra) will disappear completely. Although these changes, as shown in Figures 3.1 and 3.2, are very speculative, and the method used needs further refinement, future climate change will certainly have considerable consequences for the location of (potential) natural vegetation zones.
Clearly, a possible shift in vegetation zones as described in Chapter 4 will pose a major threat to the integrity of the remaining natural ecosystems and protected areas all over Europe. Some general consequences of a climatic change for protected areas are described in Chapter 4.1. Finally, in Chapter 4.2, some implications of a climatic change for conser- vation measures are discussed, including the siting of protected areas, management stra- tegies, research efforts and monitoring programmes.
Chapter 1: Relation between Climate and Vegetation
The distribution of plants (and, consequently, entire vegetation types) is determined by various environmental factors, such as soil, climate and topography. Also, inter- and intra- specific interactions, such as predation and competition influence the ecological space (or niche) utilized by a given species.
Relationships between climate and the distribution of terrestrial ecosystem complexes are important unifying principles in ecology. On world maps, the boundaries of the natural vegetation zones, soil types and climate, soils and biota, in evidence both locally and glo- bally, is a basis for anticipating substantial changes in natural terrestrial biomes in response to climatic change. To the extent that the overall impact of climatic change can be characterized by shifts in the boundaries of major vegetation zones (biomes, or life zones), climate-based classifications can be used to test the sensitivity of vegetation to climatic change at the global scale (Emanuel et al., 1985).

1.1 Some Models for Vegetation Classification Based on Climate Although climate is recognized as one of the most important environmental factors influencing vegetation growth (e.g. Odum, 1971), surprisingly few literature references are available on the relationship between climatic factors and specific vegetation types. Most literature on this subject that does exist is quite old (e.g. Holdridge in the 1940's and Walter in the 1960's) and deals with very broad vegetation zones only. Some of the most well-known models are briefly discussed below.
In general, the classification of climatic types based on temperature-moisture indices correlates well with general vegetation zones. However, the climatic types set up by climatologists are often too broad t o be useful t o the ecologist in local situations, so it is often necessary t o set up subdivisions based on the biotic community. Odum (1971), therefore designed -called climographs, or charts in which one major climatic factor is plotted against another (see Figure 1.1). Climographs represent a useful method of graphic representation of temperature and moisture in combination. In temperature rainfall charts mean monthly values are plotted with the temperature scale on the vertical axis and rainfall on the horizontal axis. Months are indicated by numbers, starting with January. The resulting 12-sided polygon gives a picture of the temperaturerainfall condi- tions and makes possible graphic comparison of one set of conditions with another. Cli- mographs can also be used t o compare one area with another and t o aid in testing the im- portance of temperaturemoisture combinations as limiting factors.
Figure 1.1: Temperature-rainfall climograph
A: Coastal Georgia (sea level) B: Northern Georgia (altitude 600 to 1800 m) In A, a pronounced wet and dry season is the
8 0 conspicuous seasonal variant as is characteristic I,, of subtropical climate, while in B the seasonal
70 differences in temperature are more pronounced 3 + than seasonal changes in rainfall. The 4 6 0 -
6 . 0
climatic climax vegetation in the coastal locality I is a broad-leaved evergreen forest, while in the
more northern area it is a temperate deciduous forest. Source: Odum, 1971.
4 0 -
2 3 4 5 6 7 8 RAINFALL I N INCHES
1.1.2 Whittaker'e Biome-Types in Relation to Climate
Based on temperature and precipitation, Whittaker (1975) designed a chart showing the pattern of world biome-types in relation to these two climatic factors (Figure 1.2).
Boundaries (ecotones) between types are, for a number of reasons, approximate. In eco- tones between forest and desert, and maritime versus continental climates, soil fire effects can shift the balance between woodland, shrubland, and grassland types. The dot-and- dash line encloses a wide range of environments in which either grassland, or one of the types dominated by woody plants, may form the prevailing vegetation in different areas (Whittaker, 1975.)

Figure 1.2: Relation between some major biome-types and climate Whittaker, 1975)
-15 1\ U
O -1- \\ Arc t i c -
(simplified after
Mear, Ar rua i P r e c i p i t a t i o r i r cm
1. Tropical rainforest
2. Tropical seasonal forest
3. Temperate rainforest
4. Temperate forest
5. Taiga (subarctic-subalpine needle-leaved forest)
6. Elfin woods, cool temperate bogs or alpine shrubland
7. Grassland, shrubland or woodland
8. Tundra and alpine grassland
9. Desert (subtropical desert-arc tic-alpine desert)
1.1.3 Holdridge Life-zone Classification System The Holdridge Life-zone Classification System (Holdridge, 1967) is a scheme for relating the character of natural vegetation associations to climatic indices. This classification system attempts to represent the broad distribution of terrestrial ecosystem complexes as a function of annual temperature and precipitation. A world Holdridge Life-Zone map was created by interpolating climatic data from approximately 9.000 meteorological sta- tions to a uniform grid of 0.5' latitude by 0.5" longitude on the Earth's landsurface (Emanuel et al., 1985). The features of the Holdridge Classification are summarized in Figure 1.3, in which life zones are depicted by a series of hexagons formed by intersecting intervals of climate variables on logarithmic axes in a triangular coordinate system. Two variables, average biotemperature and average annual precipitation, uniquely determine a classification. Average biotemperature is the average temperature over a year, with the unit temperature values (i.e. daily, weekly or monthly temperatures that are used in com- puting the average) set to 0" C if they are less than or equal to 0" C.

Figure 1.3: The Holdridge Life-Zone Classification System (Source: Emanuel et al., 1985)
In the Holdridge Diagram (Fig. 1.3), identical axes for average annual precipitation form two sides of an equilateral triangle. A logarithmic axis for the potential evapotranspira- tion ratio (effective humidity) forms the third side, and an axis for mean annual biotem- perature is oriented perpendicular to its base. By striking equal intervals on these loga- rithmic axis, hexagons are formed that designate the Holdridge Life Zones. Each Life Zone is named to indicate a vegetation association. The potential evapotranspiration ra- tio in the Holdridge Diagram is dependent on the two primary variables, annual precipita- tion and biotemperature. One additional division in the Holdridge System is based on the occurrence of killing frost. This division is along a critical temperature line that divides hexagons between 12 and 24 "C into Warm Temperate and Subtropical Zones. The com- plete Holdridge Classification at this level includes 37 Life Zones.
1.1.4 Walter's Zonobiomes Walter (1985) divides the biosphere into nine so-called zonobiomes largely based on cli- mate (see also Figure 1.4). Soil characteristics and vegetation associations typical of each zonobiome are summarized in Table 1.1. To characterize the climate of each zonobiome, Walter uses a standardized climate di- agram (Walter and Breckle, 1985), based on monthly average temperature and precipita- tion on coincident axes. The diagram provides an indication of the duration and intensity of relatively arid seasons, the duration and severity of a cold winter and the possibility of late or early frosts being also recorded. In Walter's system, zonobiomes are not specified by distinct intervals of climate variables as much as by a typical climate diagram (Figure 1.5).

Figure 1 . I : Vegetation zones (or zonobiomes) in Europe according to Walter (1985)
Zonobiomes/vegetation types I11 Subtropical (hot) desert vegetation IV Sclerophyllous woody plants (including semidesert or steppe) V (Warm) temperate evergreen forests VI Nemoral broadleaf forests V (Warm) temperate evergreen forests VII Steppe to cold inland desert VIII Boreal coniferous forests (taiga) oc = Climate with oceanic or maritime tendency co = Climate with continental tendency black = Mountains
1.1.5 Other Systems Other systems for classifying bioclimatic regions were developed by Koppen (1936) and Brazilivich et al. (1970). In addition, several investigators (e.g. Eyre, 1963; Schmithusen, 1976; Kiichler, 1976) have developed maps of natural or potential vegetation that incor- porate the influence not only of climate but of other factors as well. Of these, Kuchler's maps are perhaps the most widely applied. However, many of the criteria used in the nomenclatures that divide vegetation associations on these maps, such as the density of

Table 1.1: Relationship of climatically defined zonobiomes (ZB) to zonal soil types and zonal vegetation (Source: Walter and Breckle, 1985)
ZB Zonobiome; climate Zonal soil type Zonal vegetation
Equatorial; without major seaaonal variation (humid)
Equatorial brown clays, ferrallitic soih - latosoh
Evergreen tropical rain forest; almost no seasonal aspects
Tropical; with summer rains and cooler drought period (humid-arid)
Red clays or red earths - savannah soih
Tropical deciduous forest or savannah
Subtropical; arid desert climate, scanty rainfall
Sierosems or syr* sems (raw desert soih), also saline soih
Subtropical desert vegetation; landscape characterised by rock
Mediterranean; with winter rain, and summer drought (arid-humid)
Mediterranean brown earths; often fossil terra rwsa
Sclerophyllous woody plants; sensitive to prolonged frost
Red or yellow forest soils, slightly podeolic
Temperate evergreen forest; somewhat frost-sensitive
Warm temperate; with maximum rainfall in summer or mild maritime climate
Cool temperate with a short period of frost
Forest brown earths and grey forest soils, slightly podzolic
Nemoral broadleaf deciduous forests; bare in winter, frost- resistant
Continental; arid-tem- perate with a cold winter
Chernozem, Castan* zem, Burozem t o Sierozem
Steppe to desert with cold winters; frost-resistant
VIII Boreal; cold-temperate with short summer and long cold winters
Podzols (raw humus- bleached earths)
Boreal coniferous forests (taiga); very resistant t o frost
Polar; arctic and antarctic, with very short summers
Tundra humus soils with heavy solifluction
Treeless tundra vegetation, usually on permafrost soih
Zonoecotones The zonobiomes are not sharply defined but are linked by broad transitional zones known as zonoecotones. An ecotone is an area of ecological tension at the boundary between two types of vegetation (Walter, 1985). Zonoecotones are designated according to the zono- biomes they link.
trees in a forest category, cannot be realized in a climate based system (Emanuel et al., 1985).
Thus, an entirely satisfactory scheme for relating vegetation and climate is yet to be developed.
1.2 Some Important Climatic Factors that Influence Vegetation Growth and Distribution
In order to obtain an insight into the relation between climate and vegetation, the sensi- tivity of the most important ecological processes that influence vegetation growth should be determined for each climatic parameter, e.g., the influence of climate on energy flow, hydrological cycles, recycling of organic matter and nutrients, etc. In fact, since the vege- tation cover is part of a network of biotic and abiotic interactions that take place in an ecosystem, also plant-animal relations (e.g. food chains) should be taken into account. For example, a change in climatic factors may cause changes in species composition or po- pulation dynamics and thus influence plant-animal interactions such as pollination, forag-

Figure 1.5: Typical examples of climatic diagrams with explanations (Walter and Breck- le, 1985). Temperature in 'C; rainfall in mm.
DOUALA (13rn) Meteorolog~cal statlon Al t~ tude In metres above sea level Number of years of observa t~on where there a re two fly- ures, the flrst refers to temperature measurements the second to ralnfall Mean annual temperature M e a n annual ralnfall Mean doll) m ~ n ~ m u m durlng the coldest month Absolute mlnlmum (lowest recorded temperature) M e a n dally maxlmum d u n n g the warmest month Absolute maxlmum ( h ~ g h e s t recorded temperature) Mean dally temperature fluctuahon Curve of m e a n monthly temperature (1 unlt = 10°C) Curve of m e a n monthly ranfal l (1 unlt = 2 0 m m ) Relabvely a n d penod (dotted) = arouyht season Relat~vely h u m ~ d season (vertical bars) Mean monthly ramfall above lOOmm black a rea (scale reduced to Mo) (shown for Douala) C u n e for ralnfall on a smaller scale ( 1 unlt = 30mrn) above ~ t , horizontally stnated a rea l n d ~ c a t e s relabvely d q penod = dry season (shown for Odessa) Months w t h mean dally mlnlmum below OcC black below zero llne Months w t h absolute mlnlmum below O'C dlagonall\ strlaled below zero llne Average durabon of penod w ~ t h dad) mean temperature above 0°C number of days In standard type alternati\ e - ly, average duratlon of frost-free penod number of days In ltallc type (shown for Hohenhelm)
o ODESSA ( 7 0 m ) 9,g0 392
I I -4 -5
4 -25, 9
ing and parasitism.
Some of the most important climatic factors that influence the growth and distribution of major vegetation types are listed below (Table 1.2). Ideally, a matrix should be developed showing the minimum and maximum values for the most critical climatic fac- tors for each vegetation type (see Table 1.3).
Clearly, within the given time period for this study it was quite impossible to establish the relation between the vegetation types occurring in Europe and all the climatic factors mentioned in Table 1.2. For the assessment of the potential changes in the natural vege- tation in Europe, caused by possible climatic changes in the next 100 years, use was there- fore made of the system of zonobiomes developed by Walter (see 1.1.4)

- 9 -
Chapter 2:A First Attempt to Produce a YBioclimatic Vegetation Mapn for Europe
Table 1.2: Some climatic factors that are of importance to vegetation growth and distri- bution
Temperature - Mean annual temperature - Annual temperature range - Summer temperature - Winter temperature - Mean daily minimum temperature in coldest month - Absolute minimum temperature recorded - Mean daily maximum temperature during warmest month - Absolute maximum temperature recorded - Difference between normal winter and normal summer temperature - Temperature variability (seasonality) - Mean daily temperature variation - Frost-free days - Months with mean daily temperature below 0°C - Frequency of early- or late-season frost - Growing season degree daysleffective temperature sum
Precipitation - Mean annual precipitation - Summer precipitation - Winter precipitation - Monthly precipitation - Difference between summer and winter precipitation - Dry periodlwet period - Air-humidity
Evapotranspiration - Actual and potential evapotranspiration
Light - Number of daylight hours with bright sunshine - Sunshine duration
Windspeed - Mean speed - Frequency of gales
Sources: Hoekstra and Flather (1987), Parry and Carter (1983), Warrick et al. (1986), Odum (1971), Whittaker (1975), Walter (1985), Emanuel et al. (1985).
2.1 Existing Vegetation Maps for Europe in Relation to Climate There are three general categories of maps that display information about the relation- ships between natural vegetation and climate:
(1) maps of climatic zones named to indicate the general character of their vegetation;
(2) maps derived from classifications designed to predict natural vegetation insofar as it is determined by climate;
(3) maps that display natural or potential vegetation with both climatic and other influential factors taken into account (Emanuel et al., 1985).

- l o -
Table 1.3: Critical climatic factors linked to vegetation types.
In order to draw conclusions about the possible effects of a climatic change on natural vegetation, the third category would be preferable. As a basis for such a map, ideally, a matrix should be developed showing the relation between specific vegetation types and the most important climatic factors. For each climatic factor, maximum, minimum and optimal values should be given to show the tolerance of a specific vegetation type for this factor (e.g. temperature or precipitation). Preferably, the data should be based on the potential natural vegetation in a given area. Unfortunately, existing literature on the link between climate and specific vegetation types is very limited (see Chapter 1) and the few maps that exist are highly hypothetical. For example, the vegetation types that are dis- tinguished by Holdridge (life zones) and Walter (zonobiomes) are extrapolated from climatic data and it is unclear to what extent these vegetation types correspond with the actual natural vegetation. In addition, finding good vegetation maps for Europe proved to be very difficult. The only maps obtained (Clayton and Kormoss, 1971; Council of Eu- rope, 1979; Holdridge, 1967; Lieth, 1978; Odum, 1971; Walter, 1973, 1985; and Whittak- er, 1975) were maps of potential vegetation, and their use was also hampered by the fact that the maps use different classification systems, have different spatial scales and cover different parts of Europe. Thus, ideally a new map should be produced showing the actu- al potential natural vegetation for Europe, in relation to the climate.
CLIMATIC FACTORS
TEMPERATURE min. max.
PRECIPITATION min . rnax .
EVAPOTRANSPIRATION. min. max.
etc.
2.2 A Potent ia l "Bioclimatic Vegetation Map" for Europe
VEGETATION TYPE I I1 I11 IV V etc.
During the three months of this study it was quite impossible to produce an original po- tential natural vegetation map for Europe based on all (or even some) of the climatic parameters listed in Chapter 1.2. In order to illustrate a possible method for designing a "bioclimatic vegetation map" for Europe, Walter's system of zonobiomes (see Chapter 1.1.4) was selected to provide the basic information for studying the possible effects of a climatic change on the distribution of the natural vegetation in Europe. In order to establish the link between Walter's zonobiomes and climate, for each zono- biome four typical climate diagrams were selected. Climatic information about the mean annual temperature, mean annual precipitation, and the duration of the cold season and the growing season, was obtained from the climate diagrams in each zonobiome (see Table 2.1 and Figure 2.1). In addition, the location of Walter's zonobiomes (as shown in Figure 1.4) was superimposed on maps showing climatic data of approximately 300 stations in Europe based on Anon. (1983) and Miiller (1982). Using data from 85 weather stations, the ranges of temperature and precipitation for each of Walter's zonobiomes occurring in Europe (Table 2.1) were determined. As Table 2.1 and Figure 2.1 show, the climatic boundaries for the zonobiomes given by Walter (black bars) differ in some instances quite substantially from the data taken from the weather stations in Europe. This difference

can partly be explained by the fact that Walter's typical climate diagrams are based on data from all climatic regions in the world, also including tropical areas.
Table 2.1: Relation between Walter's zonobiomes and climate
Walter's Range of Range of Cold season Potential zonobiomes (a) mean annual mean annual (# months) (b) vegetation Q temp.(' C) (b) Precip.(rnrn) (b) Perm. Occ. period*
frost frost (# months)
IIIa: 15.3-24.4 15140 0 1.5 1 IIIb: >18.0 232-304 IVa: 14.3-17.3 49G627 0 1.3 6 IVb: 14.2-18.6 402-895 Va: 14.3-18.7 808-2510 0 3.3 9.5 Vb: 13.4-14.7 754-1198 VIa: 6.8-13.8 853-3018 2.3 5.5 5 VIb: 7.6-11.5 487-950 VIIa: 5.5-12.1 135-309 2.8 4.5 1 VIIb: 3.4-9.7 156-519 VIIIa: -7.0-5.9 272-569 5.7 3.0 4 VIIIb: 0.1-6.6 386-740 IXa: -11.1-5.4 64-763 8.3 3.3 1 IXb: -5.7-1.6 317-779
a Data taken from four typical climate diagrams for each zonobiome given in Walter (1973) and Walter and Breckle (1985).
b Data based on approximately 300 weather stations taken from Anon (1983) and Miiller (1982).
Q I11 = hot desert: IX = Tundra; for explanation of the other zonobiomes, see the legend to Figure 2.2.
* The potential vegetation period is deduced from rainfall data, taking account of dry periods (see Fig. 2.1) in combination with temperature, i.e. including only months with mean monthly temperature above 10'C.
For the calculations in this chapter and in chapter 4.1, the climatic boundaries based on the weather stations in Europe were used, i.e. the "b-zonobiomes" in Table 2.1. By mak- ing use of annual climatic data on temperature and precipitation that was available a t IIASA, the location of Walter's zonobiomes based on these parameters was computed (see Figure 2.2).
A problem with respect to the preparation of vegetation maps that are based only on climatic data is related to the fact that several vegetation types have overlapping climatic requirements, thus leading to transition zones that are not included in the figures shown here. Transition zones were also omitted for practical reasons such as the small scale of the map and the limited shading possibilities. To avoid the "overlapproblem", the effects of a climatic change on the vegetation in Europe were analyzed by using separate maps for each vegetation type (see Chapter 3).
In addition, one should consider that the distribution of vegetation types is determined not only by temperature and precipitation, but also by other climatic factors (e.g. evapo- transpiration) and other environmental factors such as groundwater table, topography

Figure t . 1 : Relation between Walter's zonobiomes and climate
black bar = Data taken from Walter (1973) and Walter and Breckle (1985), i.e. the "a-zonobiomes" in Table 2.1.
marked bar = Data taken from Anon (1983) and Miiller (1982), i.e. the "bzonobiomes" in Table 2.1.
and soil conditions. These shortcomings, together with the differences in climatic data used by Walter and this study t o characterize the zonobiomes (see Figure 2.1) explain the differences between Walter's map (Figure 1.4) and the map produced by this study (Fig- ure 2.2) Thus, much more research is required t o produce reliable maps linking vegetation t o the most important environmental factors. The maps shown here must therefore be seen as a first attempt t o produce such maps.
Chapter 3: Possible Effects of Climatic Change on the Natural Vegetation in Europe
3.1 Climatic Change in Europe The C02-level in the atmosphere has increased from 280 ppm in the preindustrial era via 300 ppm a t the beginning of this century towards 345 ppm today (Rosenzweig and Dic- kinson, 1986). Predictions point t o a doubling of the preindustrial concentration of at- mospheric COz well before the end of the 21st century (Bolin et al., 1986). In addition t o carbon dioxide, various other trace gases in the troposphere are increasing, notably ni- trous oxide (NzO), methane (CH4), ozone (03) and chlorofluorocarbons (CFC's). All of these gases are essentially transparent to incoming short-wave radiation but they absorb and emit long-wave radiation and are thus able to influence the earth's climate. From various sources it has been estimated that a doubling of C 0 2 will lead t o a global increase of the average yearly temperature of between 1.5"C and 5.5"C (Bolin, Jager and Diiiis, 1986), which is larger than any temperature change in the past 200,000 years (Warrick et al., 1986). However, there exists a large variety of climate models, ranging from simple equations t o three-dimensional general circulation models (GCM's). Evaluation of the

Figure 2.2: Potential "bioclimatic" vegetation map for Europe based on Walter's zono- biomes in relation to temperature and precipitation. (Temperature and pre- cipitation ranges for each vegetation type are given in Table 2.1.)
Sea, mountainous areas or transition zones
Sclerophyllous woody plants (zonobiome IV) . . . . . . . .
Temperate evergreen forests (V)
Nemoral broadleaf-deciduous forests (VI)
Steppe to (cold) desert (VII)
Boreal coniferous forests (taiga) (VIII)
Tundra (IX)
large number of results confirms that these global models show different patterns of the climatic effects, in particular because of the lack of information on the feedback influence of clouds, ice albedo (reflection) and other possible factors, such as ocean heat storage (Jager, 1986a). Based on the GISS-GCM model of Bach (1986), Hansen (1987) produced maps showing a shift in isotherms in Europe of 500 km northward on average. Jager (1986b) calculated the change in precipitation under a doubling of atmospheric C02 concentration. Accord- ing to Jager (personal communication, 1987) the average increase in annual total precipi- tation in Europe will be approximately 10%. Although there is a consensus that there will be a global surface warming over the next several decades as a result of the increases of greenhouse gases, this does not mean that there will be a uniform warming of the climate in Europe. There are hypotheses based on oceanographic considerations that suggest that the global warming could even be accom- panied by a cooling in Europe (Broecker, 1987). Indeed, several of the data-based histori-

cal analogues show that the warmest winters in the Arctic latitudes in the present century were accompanied by cooling in the Mediterranean area or Central Europe. Therefore, it will be necessary to look at both warming and cooling scenarios for Europe (Jager, 1986b).
3.2 Some General Effects of Climatic Change on N a t u r a l Ecoeyetema
When studying the possible impact of climatic changes on vegetation, it can be very use- ful to analyse the response of the vegetation (or entire ecosystems) to climatic changes in the past. If, indeed, the changes in climate that may result from increasing concentra- tions of greenhouse gases fall in the middle range of estimates provided by climate models (1.5 to 5.5"C for a C02 doubling, as discussed in chapter 3.1), we will experience a global climate that is probably at least as warm, or warmer, than at any time within the last 200,000 years. During that time, there were a number of fluctuations of climate, each of which was associated with geographical patterns of terrestrial ecosystems that were markedly, in some cases dramatically, different from those evident today (Warrick et al., 1986).
Data are available on both relatively recent climatic changes and climatic changes that occurred in prehistoric times.
a) Pleistocene changes
During several Pleistocene interglacials (the last was approximately 120,000 - 80,000 years ago), the temperature in North America was apparently 2 - 3°C higher than now. Osage oranges and pawpaws grew near Toronto, several hundred kilometers north of their present range; manatees swam in New Jersey; tapis and pecaries foraged in Pennsylvania; and Cape Cod's forest was like that of present-day North Carolina (Peters and Darling, 1985). Broad expanses of deciduous forest extended north into areas now occupied only by non-deciduous species (Warrick et al., 1986). The lwt glacial period (70,000 - 10,000 years ago) was associated with tundra in Central Europe and with a drastic shrinkage of the tropical rainforest, which quickly expanded with post-glacial warming (Warrick et al., 1986).
b) The warm period of the early Holocene The warm period of the early Holocene (9,000 - 6,000 BP) witnessed extraordinarily wetter conditions in the vast subtropical dry zones extending from West Africa to the Indus Valley-Rajasthan area; thriving savannah grasslands existed in large areas that are now unproductive desert (Warrick et al., 1986). Other significant changes during this period include the expansion of prairie in the American Midwest (Peters and Darling, 1985).
c) The Medieval Warm Epoch
During the Medieval Warm Epoch (800 - 1200 AD) when average temperatures were perhaps 1'C warmer than present (at least around the region of the North Atlantic), Canadian boreal forests extended well north of the current timberline and cereal cul- tivation flourished in Iceland and Norway up to 65"N latitude (Warrick et al., 1986).
d) The "Little Ice Age"
The "Little Ice Age" lasted roughly between 1400 and 1800 AD, during which there were glacial advances in many rnid- and high-latitude regions, with recorded or reconstructed mean temperatures in Europe and North America of ca 1-2°C below present values. The "Little Ice Age" had substantial effects on forest growth and composition in many northerly areas. For example, in the prarie-forest border re- gion of Minnesota, an increase in precipitation relative to evaporation caused a

reduction in the frequency of fires; this, in turn, favored forest of latter big hard- woods than the oak forest which it replaced. This change took only about a century to accomplish (Warrick et al., 1986).
A very large amount of evidence shows that the world's forests have responded, often dramatically, to changes in climate on various time scales. Even such a small fluctuation as the high-latitude period of warm summers during the 19309, when mean annual temperatures were typically no more than 1°C above the average for previous and subsequent decades, caused a burst of regeneration in boreal forest trees near their polar and altitudinal limits, with measurable advances in the timber- line (Warrick et al., 1986). According to Erkamo (1952), the rather extreme rise in temperature in Finland over several decades (ca 1920 - 1940) had the following consequences for the forest and bog ecosystems:
a an extension of the growing season and acceleration of growth processes: foliation, blossoming and fruit formation; leaf fall was retarded;
a drying of swamp surfaces, resulting in increasingly rapid overgrowth of swamps, afforestation of bogs, a change from wet spruce hardwood peat moors into forest and the drying of wet pine moors into peat soils characterized by lichen;
a xerophilous species gained increasing foothold;
moss-free watery bogs very rapidly became moss-covered and ponds became over- grown with vegetation;
a in forests the spruce (Picea abies) gained ground and deciduous trees increased their stock (in: Van Huis and Ketner, 1987).
It is clear from the above that entire biomes have shifted in the past in response to tem- perature changes smaller than those that may occur over the next several decades. In general, during warming, shifts were poleward; species colonized new habitats toward the poles, often while their ranges contracted away from the equator as conditions there be- came unsuitable. Equatorial organisms thus expanded their ranges into areas previously tenanted by temperate ones, while temperate organisms did the same in some areas pre- viously the domain of boreal communities. Although Pleistocene and past Holocene warming periods were probably not due to elevated C 0 2 levels, researchers have predicted that, if the proposed C02-induced warming occurs, similar shifts would also occur, and vegetation belts would move hundreds of kilometers towards the poles (Peters and Dar- ling, 1985).
Based on evidence from climatic changes in the past, there is little doubt that a future change in climate will have profound consequences for the natural vegetation in Europe. In the areas that currently experience extreme climatic conditions, the climatic change will have a substantial effect on the natural ecosystems, i.e. the north European Arctic biome, the east European continental biome and the south European Mediterranean biome. The coastal areas (including deltas) and mountainous areas in all of Europe will also undergo far-reaching changes. In the central and western part of Europe, where cli- mate is less extreme, the effects of the climate change will be tempered by the combined, balanced increase in temperature and precipitation and the presence of rather stable ecosystems. The quality of these effects and its possible favorable or unfavorable influence on the natural ecosystem will also differ for the various biomes. In the tundra, the climate change could be considered as a climate amelioration for all types of land use (longer growing season), but in the boreal zone, the much warmer winters and consequent lack of continuous snow cover will place severe stress on the forests. In the coastal areas and in the summer-dry continental and mediterranean biomes, the climate impact will be very adverse (drought, sea level rise), restricting all possible types of land use and threatening the preservation of natural ecosystems (Van Huis and Ketner, 1987). Some aspects that need consideration when studying the effects of a climatic change on natural

ecosystems, include:
shifts in vegetation zones (including lag time effects); changes in plant productivity, morphology, regeneration, mortality, etc.; increased water use efficiency in plants; hydrological effects (flooding, runoff change, and, sea level change, etc.); geomorphological effects (sedimentation, erosion; etc.); and changes in biological diversity, migration, species interactions and composition, etc.
The next section will only discuss the first of all these possible effects of climate change.
3.3 Potential Shifte in Europe'e Natural Vegetation Zonee due to Climatic Change Based on data presented in Chapter 2.2 this subsection will present the results of comput- er simulations that have been made on potential shifts in six major vegetation types (or zonobiomes) occurring in Europe. In order to analyze possible shifts in the vegetation types (or zonobiomes) as presented in Figure 2.2, the climatic requirements for each zone biome as given in Table 2.1 were superimposed on maps that show the simulated future climatic situation for temperature and precipitation. For the temperature scenario, an average annual temperature increase of 5°C was assumed for all of Europe, for the precipi- tation scenario, an average increase of 10% was assumed for all of Europe (after Jager, 1986b and personal communication, 1987). Figure 3.1 shows the resulting map of the p e tential location of Walter's zonobiomes in Europe. To appreciate the shift in vegetation zones, Figure 3.1 should be compared with Figure 2.2 in Chapter 2. In order to avoid the "overlapproblem" mentioned in Chapter 2, separate programs were written for all 6 zone biomes occurring in Europe. Figures 3.2a-f show the present maximum distribution range (left figure) and the maximum future distribution range (right figure) for each zonobiome. Table 3.1 summarizes the results of the simulated climatic change on the distribution of the six zonobiomes in Europe. This table does not include the transistion zones of the ex- tention of zonebiomes. According to our calculations, the results will be quite drastic. All six major vegetation zones shift northward by, on average 1100 km, with the largest changes occurring in the northern latitudes (the boreal and arctic zones) and in the Mediterranean area. Zone biome 9 (tundra) will completely disappear in Europe. When interpreting Figures 3.2a-f and Table 3.1, it must be realized that the calculations are based on very crude extrapolations with respect to the vegetation zones used, the climatic requirements for each vegetation zone and the future climatic situation. Much more research is needed with respect to these three factors in order to make reliable as- sumptions concerning the impact of climatic changes on the natural vegetation in Europe. For example, more accurate maps than those provided by Walter would be needed. Also, the link between vegetation types and climate should be more detailed and other parame- ters should be included such as evapotranspiration and growing season. Finally, climatic scenarios will probably become more reliable.
In spite of the shortcomings mentioned above, the results of this study do indicate that climatic change will most likely have considerable consequences for the natural vegetation in Europe and more research into this problem, especially regarding conservation aspects seems warranted. Some general conclusions with respect to the conservation aspects of climatic change are discussed in Chapter 4.

Figure 3.1: Potential location of Walter's zonobiomes for Europe under changed climatic conditions*
Sea, mountainous areas or transition zones Sclerophyllous woody plants (zonobiome IV) Temperate evergreen forests (V) Nemoral broadleaf-deciduous forests (VI) Steppe t o (cold) desert (VII) Boreal coniferous forests (taiga) (VIII) Tundra (IX) (not present) * Simulated climatic situation: T = +5"C, P = +lo% (on average).
C h a p t e r 4: S o m e Impl ica t ions of Cl imat ic C h a n g e fo r N a t u r e Conserva t ion
4.1 I n t r o d u c t i o n As we have seen in Chapter 3, changes in atmospheric greenhouse gases will pose a major threat to natural ecosystems and the species they contain. Especially those species already threatened by habitat fragmentation, such as natural populations within reserves, will be affected. According t o Warrick et al. (1986), there are many natural parks and reserves that are re- fuges for rare and endangered plant and animal species. Often these parks occupy a rela- tively small area in a setting of non-park land. If an environmental change made such parks unsuitable as habitats for these species, i t is uncertain whether alternative refuges could be found or whether i t would even be possible t o transport species to new sites. The risk of widespread extinction of rare species (particularly those with local distributions) could be high as a result of climatic change.

Table 9.1: Effects of a climatic change* on the distribution of six major vegetation types (zonobiomes) in Europe (number of grids, with per cent coverage between brackets).
Zone Present clima- Future clima- Change # grids Shift biome tic situation tic situation in # remaining north-
# grids (%) # grids (%) grids unchanged ward(km)
IV 101 (4.9) 247 (11.9) +I46 0 lo00 V 27 (1.3) 147 (7.1) +I20 0 1260 VI 498 (24.0) 540 (26.0) +42 0 960 VII 157 (7.6) 1 (0) -156 0 720 VIII 844 (40.6) 130 (6.3) -714 100 1500 IX 263 (12.7) (I (O) -263 0 > 1260
Source: Figures 9a-f * Future climatic situation: T= + 5OC, P= + 10%
The rest of this chapter will summarize some important effects of climatic change on p r e tected areas and discuss some management measures that could be applied to anticipate these changes.
4.2 Some General Consequences of Climatic Change for Protected Areas Generally speaking, it can be stated that ecosystems and their life communities that are restricted to protected areas are more vulnerable to climatic changes than ecosystems that still occupy large, uninterrupted areas. The same is true for particular species. For example, a tree species whose entire range falls in an area due to undergo regional drying is more a t risk than one whose larger range includes areas outside the desication zone. A climatic change would often improve conditions for a particular species a t one margin of its range and worsen conditions at the opposite. Reserve populations located near a mar- gin where conditions are deteriorating would therefore be more threatened than ones a t the opposite end of the range (Figure 4.1).
Figure 4.1: How climatic warming may turn biological reserves into former reserves (Source: Peters and Darling, 1985)

Figure 3.h: Zonobiome 4: Sclerophyllous woody
Present s i tua t ion* I . . . . . . . . . . . . . . . ~ . . ~ . . . . ~ ' ~ ~ ' ~ ' ~ " " " " " " " ' " " " ' I
plants Future s i tua t ion*
P ~ ~ ~ ' ~ ~ ~ ' ~ ~ ~ ' ~ ~ " " " " " " ~ ~ ~ ~ ~ " ~ ~ ~ ~ ~ ~ ' ~ ~ ~ ~ ' ~ ~ ~ ~ ~ ' .
No. o f gr ids : 101 (= 4.9%) NO. of gr ids : 247 (= 11.9%)
Figure 3.lb: Zonobiome 5: Temperate evergreen forests
Present s i tua t ion* L " ' ~ " " T - ~ ' ~ ~ ~ ' ' ~ ~ ' ~ ' ' ~ " ~ ' ~ ' ' " ~ ~ ~ " ~ ~ ~ ' ~ r ' " ' l
f u t u r e situation*, . , , , , , , , , , , , , , , , , l ~ " " ' ' ' ' ~ ~ ~ ~ ' ~ ~ ' " ~ " ~ ~ ' ~ ~ ' ~ '
No- of gr ids : 27 (= 1.3%)
*For explanation, see t e x t No. of g r ids : 147 (= 7.1%)
0 IIFlSF
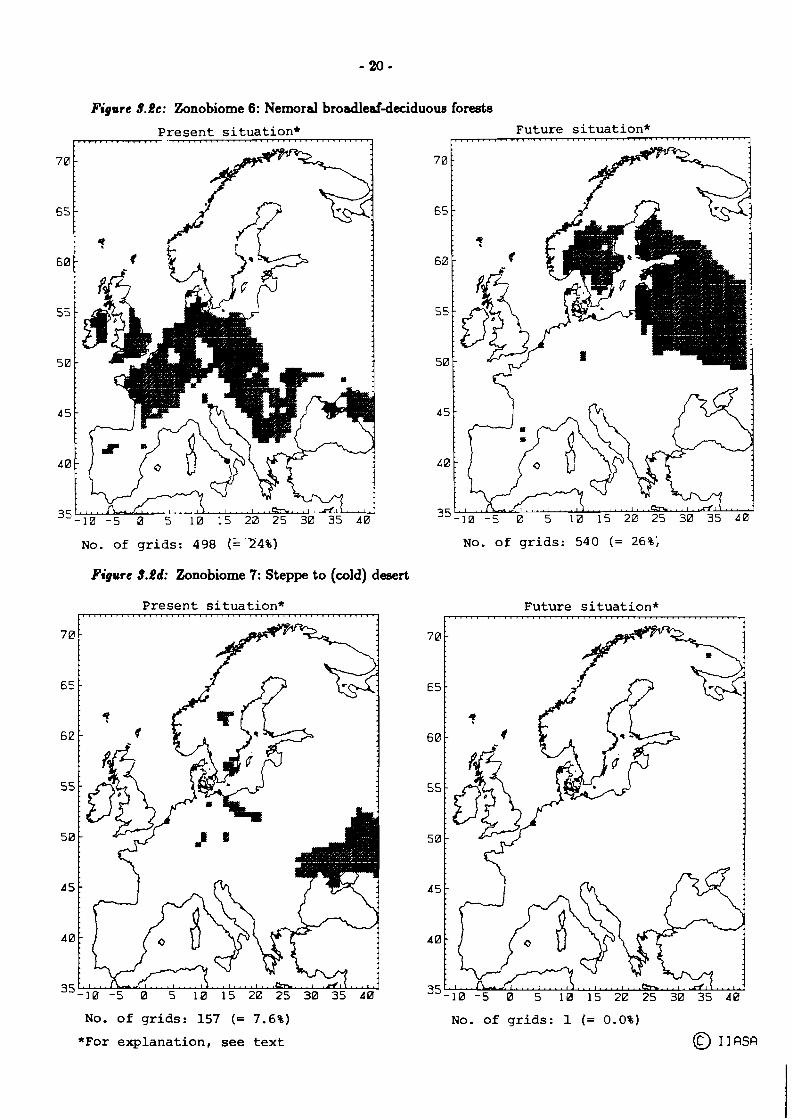
Figure 8.dc: Zonobiome 6: Nemoral broadleafdeciduoue forests
Present s i tua t ion* . . , . . . . . . . . . . . . . . . . . . . . . . . . . . . . . . . .
Future s i tua t ion* I
No. of gr ids : 498 (= 24%) No. of g r ids : 540 (= 26%;
Figure 8.dd: Zonobiome 7: Steppe to (cold) desert
Future s i tua t ion* l ' l " l T ' ~ T 1 ~ ' r ' " ' T ' l l l l ' ~ ~ ' ' l ~ . ' ~ ~ ~ ~ ~ ~ ~ ~ r ~ l 1 1 . . 7 . . . 7 . 1
No. of gr ids : 157 (= 7.6%)
*For explanation, see t e x t
No. of g r ids : 1 (= 0.0%)
0 IIFlSFl

Figure 9 . 2 ~ : Zonobiome 8: Boreal coniferous foreeta (taiga)
Future situation*
No. of grids: 844 (= 40.6%)
Figure 9.2j: Zonobiome 9: Tundra
Present situation*
No. of grids: 130 (=6.3%)
Future s i t u a t i o n * r - ' ~ ' . ' " " " " " " ' " " ' 1
No. of grids: 263 (= 12.7%)
*For explanation, see text
No. of grids: 0 (= 0%)
0 IIRSR

Hatching indicates: a) species distribution before human habitation (range limit indicates southern limit of species range), b) fragmented species distribu- tion after human habitation, c) species distribution after warming.
In addition, human modification of surrounding habitat will create barriers of agricultural or urban land that will be just as effective as mountains or oceans in preventing coloniza- tion of other suitable areas. Also, species respond individually to climatic change, forming stable but, by present-day standards, unusual assemblages of plants and animals. On the other hand, because species shift a t different rates in response to climate change, com- munities may disassociate into their component species. In many cases, interspecific in- teractions (predation, parasitism and competition) altered by climatic change will have a major role in determining new species distributions and, consequently, the susceptibility of species in reserves to extinction. Furthermore, species may not only be threatened by competitors naturally occurring within a reserve, but they may also feel pressure from in- vaders that find the new climatic regime to their liking (Peters and Darling, 1985).
Among the many reserve communities that would suffer from climate wariming, a few types would be particularly affected over the next 100 years (after Peters and Darling, 1985):
- peripheral populations,
- geographically localized species,
- genetically impoverished species,
- specialized species, - poor dispersers,
- annuals,
- montane and alpine communities, - arctic communities,
- coastal communities.
4.3 Management a n d Policy Implications
The consequences of climate warming for natural ecosystems will be such that conserva- tion strategies on the local scale will fail. Measures on the regional, national and interna- tional scale will be necessary to prevent ecological catastrophes (Van Huis and Ketner, 1987).
Basically, four types of policy actions can be distinguished: a) siting of protected areas, b) management strategies, c) research and d) monitoring programs.
1) Re-s i t ing of reserves
Considering the large shift in vegetation zones projected, conservation measures will have to aim to preserve a great diversity of biotopes, t o increase the possibility of these biotopes being conserved under changed climatic conditions. To the extent that we can still establish reserves, pertinent information about changing climate and subsequent eco- logical response should be used in deciding how to design and locate reserves to minimize the effects of changing temperature and moisture. In many areas of the Northern Hemi- sphere, for example, where northward shifts in climatic zones are likely, it makes sense to locate reserves as near the northern limit of a species range as possible, rather than farth- er south, where conditions are likely to become unsuitable. Locating reserves where topog- raphy and soil types are heterogeneous could increase the chance that a species' precise temperature and moisture requirements would be met. Altitudinal variability within a reserve would also increase the chance that vertical shifts could occur. Thus, maximizing

the size and number of reserves would enhance the long-term survival of species. In large reserves, species would have a greater chance of finding suitable microclimates or of shift- ing altitudinally or latitudinally. If we could increase the number of reserves so that each species and community type were represented in more than one reserve, we would increase the chance that if the climate in a reserve became unsuitable, the organisms within it might still survive elsewhere (Peters and Darling, 1985).
Also, protecting "alternative" biotopes, resembling the original, lost biotope could be con- sidered and preservation of "corridors" for plant and animal migration towards refuge areas should have high priority in large scale conservation strategies (Van Huis and Ketner, 1987).
Because of the slow response of forest ecosystems to climatic change, due t o slow regen- eration and migration rates, the conservation of forest ecosystems is especially important.
2 ) Adjustment of management strategies
Reserves that suffer from the stresses of altered climatic regimes will require carefully planned and increasingly intensive management t o minimize species loss. For example, depending on new moisture patterns, irrigation or drainage may be needed. Because of changes in interspecific interactions, competitors and predators may need t o be controlled and invading species weeded out. If such measures are unsuccessful, and old reserves do not retain necessary thermal or moisture characteristics, individuals of disappearing species may have t o be transferred t o new reserves. For example, warmth-adapted ecotypes or subspecies may have to be tran- splanted to reserves nearer the poles. Other species may have t o be reintroduced in reserves where they have become temporarily extinct. An unusually severe drought, for example, might cause local extinctions in areas where a species ordinarily could survive with minimal management. Such transplantations and reintroductions, particularly in- volving complexes of species, will often be difficult, but applicable technologies are being developed.
According t o Shugart et a1.(1986), it is possible to reduce large, migration-related lag effects by actively moving plant material (seeds and seedlings) t o appropriate locations. Suitable propagation techniques to accomplish such a task are better developed for com- mercially important tree species than for non-commercial species. Such a strategy prob- ably would be prohibitively expensive if pursued on a large scale for native forests. The actual movement of tree species to compensate for a change in climate could most likely be attempted for commercial tree crops only, in a forest management context.
3 ) Increase in research eforto
We must refine our ability to predict future conditions in reserves. We also need t o know more about how temperature, precipitation, C02 concentrations, and interspecific interac- tions determine range limits and, most important, how they can cause local extinctions. Adequate understanding of the influences of climate on population dynamics may require long-term studies of reserve populations (Petersand Darling, 1985). In particular, special studies will be required on the impact of climate warming on forest pest distributions.
A key research problem for forests (as for agriculture) is how changes in climatic variables and C02 concentrations will interact to affect the short-term responses of plant processes. Greater understanding will require many more experiments on tree species over one or more growing seasons (Shugart e t al., 1986).
Further empirical analysis and simulation modeling, including verification of models, are also essential. This is because models are required t o extrapolate from the effects of C02 and climate variables on short-term plant responses to determine their likely impacts on the longer term (Shugart et al., 1986).

4) Install monitoring programs
Finally, there is a need to develop monitoring networks to detect shifts in vegetation types and to provide basic data for understanding the processes of ecological change. Such monitoring could, among others, be based on the networks established in the higher latitudes to record fluctuations in timberlines (i.e. marked sutdy plots that are regularly surveyed) (Shugart et al., 1986). Large-scale monitoring to detect changes in regional vegetation patterns or productivity could be pursued with the aid of satellite imagery. For instance, the green leaf dynamics (measured as the photosynthetically active radiation intercepted by terrestrial vegetation) is recorded daily for the entire planet (Warrick et al., 1986). Some variables that need to be monitored include: forest type, tree density, basal area, size class distribution, percentage coniferous trees, percentage canopy cover, physiogra- phy, species occurrence and composition, species distribution and abundance, species vi- tality and changes in biomass (partly after Lieth, 1978; Hoekstra and Flather, 1987). "If we are concerned with setting up reserves and maintaining biological diversity - not just to eke out another 50 years or so of species survival but to preserve some remnants of the natural world for the year 2100 and beyond - we must begin now to incorporate infor- mation about global warming, as it becomes available, into the planning process" (Peters and Darling, 1985).
Chapter 5: Discussion
Some problems and shortcomings of present methods applied to assess the impact of fu- ture climatic changes on natural ecosystems will now be discussed, including some sugges- tions for further research.
1) One of the first problems one encounters when trying to assess the impact of climatic change on the natural vegetation in Europe is the fact that no comprehensive vege- tation map exists. The maps available all use different classification systems, have different scales and cover different parts of the European continent (see Chapter 1). There is a need to produce a new vegetation map for Europe, which should combine existing data into a classification system that includes all major vegetation types that occur in Europe, based on internationally accepted vegetation classifications.
Each type of vegetation has very specific climatic requirements. Unfortunately, ex- isting literature on the link between specific vegetation types and climate is very limited and the few models that exist are highly hypothetical (see appendices I1 and 111). This study therefore only used the average annual temperature and precipita- tion in order to assess the effects of a future climatic change on the natural vegeta- tion in Europe. To refine assessment methods, it would be necessary to specify these parameters in more detail, e.g. seasonal max/min values for temperature and precip itation, and to include more parameters such as periods of frost and drought and evapotranspiration.
3) Predictions about ecological responses to climate change are hampered by the rela- tively short period in which these climate changes will occur. The global climatic warming of approximately 5°C within one century is unprecedented and it is unlikely that there will be an opportunity for the normal process of natural selection and na- tural migration (Van Huis and Ketner, 1987). Since shifts of vegetation zones is an important possible response of the vegetation to climatic change, factors that affect the dispersal capacity of vegetation types should therefore also be included in the evaluation, such as soil conditions, physical barriers (mountains, open water, urban
and agricultural areas, etc.) and dispersal strategies and rates, and competition from resident plants and insect pests.
4) The different time scales a t which the various components of a vegetation type or ecosystem react to a change in environmental conditions makes it difficult to assess the response of entire vegetation types to climatic changes. There is a lack of knowledge concerning the interactive effects of C02 and climate variables on vegeta- tion and, in general, better information is required with respect to the sensitivity of specific vegetation types to climatic changes.
5 ) To be able to draw conclusions with respect to conservation aspects of climatic change in Europe, it will be necessary to obtain better insight into the current and future coverage of natural vegetation types by protected areas. In order to ensure the maintenance of biological diversity in the future European environment, it is essen- tial that representative samples of all major vegetation types (and associated life communities) are included in a system of protected areas, now and in the future. Thus, a project should be formulated aiming at: a) compiling a potential natural vegetation map for all of Europe (see point 1); b) assessing the coverage for each vegetation type by protected areas (at least 10% of each vegetation type should be covered), c) repeating this analysis for the future projection.
6 ) T o obtain better insight into the possible consequences of a climatic change for specific protected areas, i t would be necessary to conduct more regional and local case studies as have been executed by a Dutch pilot study (Van Huis and Ketner, 1987). One possibility to combine most of the points mentioned before (e.g. improve methods to link vegetation and climate, include dispersal barriers and draw conclu- sions with respect to conservation aspects) is to execute a case study on the Danube river catchment. This case study is attractive because it provides an opportunity to look into the problems of vegetation shifts and hydrological changes simultaneously in a geographically and ecologically defined area. Climatic data are available as well as possibilities to include conservation and land use aspects.
7) Although this study concentrates on the climatic factors that influence vegetation growth and distribution, it must be realized that the vegetation cover is but one as- pect of a complex ecosystem, consisting of a life community and its abiotic environ- ment. Climatic changes will most likely influence all ecological processes and com- ponents that make up an ecosystem, for example, energy flow, the hydrological cy- cle, recycling of organic matter and nutrients (decomposition), food chains, species composition and species diversity, etc. Thus, apart from influencing vegetation growth and distribution, climatic change will influence the structure and functioning of entire ecosystems.
8) T o make matters even more complicated, many environmental effects work simul- taneously on the vegetation, e.g. atmospheric pollution, soil conditions (structure, fertility and chemical quality), groundwater table and quality, topography, etc.
9) When assessing the impact of climate change on vegetation, account should be given to the response time of the various species that make up vegetation. For example, the tree canopy of a given vegetation type will have a much slower response time than the herbaceous undergrowth, thus leading to an unbalanced situation with unk- nown consequences.
10) Better information on the future climatic situation is necessary, especially a t the re- gional and local scale. Also, few data are available concerning the frequency and dis- tribution in time and space of climatic extremes. Extreme values have an extraordi- nary regulating influence on processes in natural ecosystems and they are thus more

far-reaching than mean values (Van Huis and Ketner, 1987).
11) Some limitations to the use of the Holdridge Life-zone maps for climate impact as- sessment, some of which also apply to the method used in this study, are discussed below (based on Emanuel et al., 1985).
a) Many features of global vegetation patterns resulting from elevation are not adequately captured by the climatic data used to derive the life-zone maps, and like other transition zones, regions of substantial elevation gradients are characterized by complex vegetation patterns.
b) Soils may substantially constrain the rearrangement of life zones due to climat- ic change. For example, the replacement of Boreal Forest by Cool Temperate forest may be slowed by the properties of podzols typical of the Boreal Zone. Over sufficiently long periods, soil characteristics will also change, but this transient may prove to be the longest in the response of the biosphere to climatic change, and in some instances parent material and geomorphology may limit changes in soil properties.
c) The actual contemporary land cover has been drastically modified by human activities. There are few remaining places where the natural vegetation associa- tions have not been modified. Clearly, the impacts of climatic change on re- gions composed of highly managed ecosystems will depend on societal response in terms of altered management practices.
d) Inconsistencies between the resolution of simulated climatic change and life- zone maps derived from meteorological data require refinements to climate models that may not be practical for some time. The applicability of simulation results from climate models to analysis of vegetation patterns associated with seasonality, topography and transition zones is also restricted by the coarse resolution of climate models. Simulations of climate at the continental or re- gional scale with greater spatial resolution are needed to study the sensitivity of these more complex vegetation patterns to climatic change. In addition, available methods for relating vegetation distribution and climate, such as the Holdridge Classification, also require refinement in this regard.

REFERENCES
Anon. 1983. Lander und Klima; Europa und USSR. Brockhaus, Wiesbaden. Bach, W., 1986. GCM-derived climatic scenario's of increased atmospheric C 0 2 as a basis
for impact studies. In: Parry, et al., 1988.
Bolin, B., B.R. Dijijs, J. Jager and R.A. Warrick (eds), 1986. The Greenhouse Effect. Cli- mate Change and Ecosystems. S C O P E 29, Wiley and Sons, Chichester.
Bolin, B., J. Jager and B.R. Doos, 1986. The Greenhouse Effect, Climatic Change and Ecosystems. In: Bolin e t al., 1986.
Brazilivich, N.L., L.E. Rodin and N.N. Rozov, 1970. Untersuchungen der Biologischen Produktivitat in Geographische Sicht. Ber.Tag. Geogr.Ges.U.S.S.R., Leningrad.
Broecker, W.S., 1987. Unpleasant surprises in the greenhouse? Nature 328:123-124. Clayton, K.M. and I.B.F. Kormoss (eds), 1971. Oxford Regional Economic Atlas:
Western Europe. Oxford University Press.
Council of Europe, 1979. Vegetation map of the Council of Europe member states, pro- duced by the European Committee for the Conservation of Nature and Natural Resources, Nature and Environment Series No. 16.
Emanuel, W.R., H.H. Shugart and M.P. Stevenson, 1985. Climatic change and the broad-scale distribution of terrestrial ecosystem complexes. In: Parry (ed), 1985.
Erkamo, V., 1952. On plant-biological phenomena accompanying the present climatic change. Fennia 75:25-97.
Eyre, S.R., 1963. Vegetation and Soils, Aldine Chicago. Hansen, J., 1987. Isopleth maps on mean monthly and annual data of the GISS-GCM pro-
gram. Working paper for the European Workshop on Interrelated Bioclimatic and Land-use Changes, 17-21 October, 1987, The Netherlands.
Hoekstra, T.W. and C.H. Flather, 1987. Theoretical Basis for Integrating Wildlife in Renewable Resource Inventories. Journal of Environmental Management 24:95-110.
Holdridge, L.R., 1967. Life Zone Ecology. Tropical Science Center, San Jose, Costa Rica.
Jager, J., 1986a. Climate change: floating new evidence in the C 0 2 -debate. Environ- ment , vol. 28(7): 6 9 and 38-41.
Jager, J., 1986b. Some notes on the Preparation of Climate Scenario's. Note for the IIASA case study on Future Environments for the European Continent.
Koppen, W., 1936. Das Geographische System der Klimate. In: Koppen and Geiger (eds), Handbuch der Klimatologie, vol. 1, part C, Borntrager, Berlin. Kuchler, A.W., 1978. Natural Vegetation. In: Espenshade, E.B.Jr. and J.L. Morrison (eds), 1978. Goode's World Atlas, 15th ed., Rand-McNally, Chicago.
Lieth, H., 1978. Vegetation and C 0 2 Changes. In: Williams,J.(ed). Carbon Diozide, Cli- mate and Society, IIASA Proceedings Series Environment.
Miiller, M.J., 1982. Selected climatic data for a global set of standard stations for vegeta- t ion science. Dr.W.Junk Publ., The Hague.
Odum, E.P., 1971. Fundamentals of Ecology (3d ed.). Saunders College Publ., Philadel- phia.
Parry, M.L. and T.R.Carter (eds), 1983. Assessing the impact of climatic change in cold regions; summary report. IIASA.
Parry, M.L., T.R.Carter and N.T.Konijn (eds.), 1988. The Impact of Climatic Variations on Agriculture. Vol.1. Assessments in Cool Temperate and Cold Regions. Reidel, Dordrecht.

Peters, R.L. and J.D.S.Darling, 1985. The Greenhouse Effect and Nature Reserves. BioS- cience Vol.85, No.l1:707-717.
Itosenzweig, C. and R. Dickinson (eds), 1986. Climate - Vegetation Interactions. NASA Conf.Publ., No. 2440, Greenbelt, Maryland.
Schrnithusen, J., 1976. Atlas zur Biogeograpie. Bibliographisches Institut, Mannheim, F.R.G.
Shugart, H.H., et al., 1986. C02, Climatic Change and Forest Ecosystems. In: Bolin et a1 (eds), 1986.
UNEP/WMO/ICSU, 1985. Report of the Lnternational Conference on the Assessment of the role of Carbon Dioxide and of other Greenhouse Gases in Climate Variations and Associated Impacts, 9-15 October, 1985, Villach, Austria.
Van Huis, J . and P. Ketner, 1987. Climate sensitivity of natural ecosystems in Europe. Discussion paper, prepared for the European Workshop on Interrelated Bioclimatic and Land Use Changes, 17-21 October 1987, The Netherlands.
Walter, H., 1973. Vegetationszonen und Klima (2nd ed.). Eugen Ulmer Verlag, Stuttgart, W .Germany.
Walter, H., 1985. Vegetation of the earth and ecological systems of the Geebiosphere (3d ed.). Springer Verlag, New York.
Walter, H. and S.W. Breckle, 1985. Ecological Systems of the Geobiosphere Vol.1. Springer Verlag, Berlin, Heidelberg, New York, Tokyo.
Warrick, R.A., et al., 1986. The Effects of Increased C02 and Climatic Change on Terres- trial Ecosystems. In: Bolin et al., (eds), 1986.
Whittaker, R.H., 1975. Communities and Ecosystems (2nd ed.). MacMillan Publ.Co.,Inc., New York.

FURTHER READING
Billings, W.D. et al., 1982. Arctic tundra: a source or a sink for atmospheric carbon diox- ide in a changing environment? Oecologia, 53:7-11.
Davis, M., 1986. Lags in the response of forest vegetation to climate change. In: C. Rosenzweig and R. Dickinson (eds), 1986.
Ingelo, T., 1987. Impact on nature conservation [of climatic changes). In: Koster and Lundberg (eds) , 1987.
Kauppi, P. and M. Posch, 1985. Sensitivity of boreal forest to possible climatic warming, Climate Change, vol. 7:45-54.
Klotzli, F., 1976. Grenzen von Laubwalder in Europa. Ber.dt.Bot.Ges. 89:371-390.
Koster, E.A. and H. Lundberg (eds), 1987. Impact analysis of climatic change in the fennwxandinavian part of the boreal and subarctic zone. Report prepared for the Eur* pean Workshop on Interrelated Bioclimatic and Land Use Changes, 17-21 October, 1987, The Netherlands.
Parry, M.L. (ed), 1985. The sensitivity of natural ecosystems and agriculture t o climatic change, RR-85-1. International Institute for Applied Systems Analysis, Laxenburg, Aus- tria.
Solomon, A.M., 1986. Transient response of forests to CO, -induced climate change: simulation modeling experiments in eastern North America. Oecologia, 68:567-579.