Embed Size (px)
Citation preview

International Journal of Research in Social Sciences Vol. 7 Issue 6, June 2017,
ISSN: 2249-2496 Impact Factor: 7.081
Journal Homepage: http://www.ijmra.us, Email: [email protected]
Double-Blind Peer Reviewed Refereed Open Access International Journal - Included in the International Serial
Directories Indexed & Listed at: Ulrich's Periodicals Directory ©, U.S.A., Open J-Gage as well as in Cabell’s
Directories of Publishing Opportunities, U.S.A
365 International Journal of Research in Social Sciences
http://www.ijmra.us, Email: [email protected]
ASSESSMENT OF PERFORMANCE RELATED PHYSICAL
FITNESS OF FOOTBALL PLAYERS BASED ON THEIR
PLAYING POSITION: IN
THE CASE OF SOUTH WESTERN ZONE OF ETHIOPIAN
NATIONAL LEAGUE FOOTBALL CLUBS
BIZUAYEHU DEMISSIE*
Dr.Sisay Mengistu**
ABSTRACT
The purpose of this investigation is to assess performance related physical fitness of
national league football players regarding to their playing position. National league
football clubs competition is one of the most widely organized popular football contests
across the country next to Ethiopian premier league match, which is governed by
Ethiopian football federation. 7(seven) national league club players and coaches from south
western regional division of the league was the population of the study. To conduct this
research 3(three) clubs was selected purposively from 7(seven) clubs based on their
date of establishment and previous achievement. Based on their playing position, 9
goal keepers, 24 defensives, 24 mid fielders and 18 forwards total of 75 players and
3(three) coaches was directly involved in the study.
The main instrument of data collection was 30 meter sprint test, vertical jump power
test, Illinois agility test and structured interview. Collected fitness test scores
through predetermined fitness tests and structured interview was analyzed using
descriptive statistics such as mean, median, standard deviation and analysis of variance was
* Mizan Tepi University, Ethiopia
** Hawassa University, Ethiopia

ISSN: 2249-2496 Impact Factor: 7.081
366 International Journal of Research in Social Sciences
http://www.ijmra.us, Email: [email protected]
carried out to identify the significance mean difference. The result of the study reviled
that, there was statistically significance mean difference between playing position in sprint
speed test, vertical jump test and Illinois agility test, p < 0.05.Goal keepers appeared low
scorer in speed and agility test.
Lack of motivation and absence of measuring instruments was the main problems that
hinder fitness assessment in national league football clubs. Coaches should consider
positional role of players and demands during training programs.
Key words: football, playing position, physical fitness, national league, performance
efficiency.
1 INTRODUCTION
1.1 BACKGROUND OF THE STUDY
Soccer is one of the most widely played and complex sports in the world, where players
need technical, tactical, and physical skills to succeed.Without good physical fitness, players
are rarely able to play the game with good technique, (Chapman.et al,2007). Soccer is
characterized by a continuous course of activities with intermittent intensity in the game
and a very low success ratio (the number of achieved goals) according to possession of the
ball. For achieving top results in this sport, it is necessary that players have an exceptionally
high level of technical and tactical skills as well as significant physical fitness, (Sevensson&
Drust, 2005).
Fitness in soccer specific context refers to a range of individual characteristics that
is a composite of many attributes and competences. Such competence by definition
includes, physical, physiological, and psychomotor factors, (Reilly & Williams, 2003).
Physically superior players fell less fatigued during the game played with the same
intensity and, therefore, those players experience less decrement in technical performance,
(Jukic, et al, 2011).
Players in competitive soccer require high levels of power, speed, and agility to
ISSN: 2249-2496 Impact Factor: 7.081
367 International Journal of Research in Social Sciences
http://www.ijmra.us, Email: [email protected]
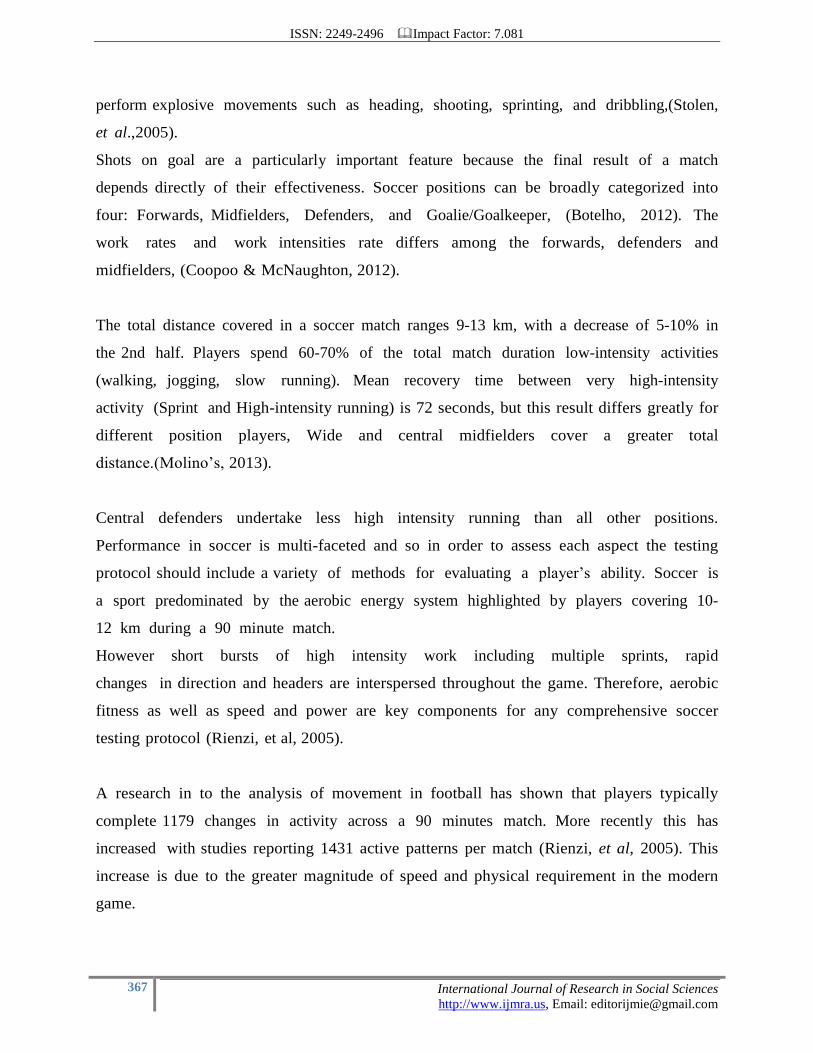
perform explosive movements such as heading, shooting, sprinting, and dribbling,(Stolen,
et al.,2005).
Shots on goal are a particularly important feature because the final result of a match
depends directly of their effectiveness. Soccer positions can be broadly categorized into
four: Forwards, Midfielders, Defenders, and Goalie/Goalkeeper, (Botelho, 2012). The
work rates and work intensities rate differs among the forwards, defenders and
midfielders, (Coopoo & McNaughton, 2012).
The total distance covered in a soccer match ranges 9-13 km, with a decrease of 5-10% in
the 2nd half. Players spend 60-70% of the total match duration low-intensity activities
(walking, jogging, slow running). Mean recovery time between very high-intensity
activity (Sprint and High-intensity running) is 72 seconds, but this result differs greatly for
different position players, Wide and central midfielders cover a greater total
distance.(Molino’s, 2013).
Central defenders undertake less high intensity running than all other positions.
Performance in soccer is multi-faceted and so in order to assess each aspect the testing
protocol should include a variety of methods for evaluating a player’s ability. Soccer is
a sport predominated by the aerobic energy system highlighted by players covering 10-
12 km during a 90 minute match.
However short bursts of high intensity work including multiple sprints, rapid
changes in direction and headers are interspersed throughout the game. Therefore, aerobic
fitness as well as speed and power are key components for any comprehensive soccer
testing protocol (Rienzi, et al, 2005).
A research in to the analysis of movement in football has shown that players typically
complete 1179 changes in activity across a 90 minutes match. More recently this has
increased with studies reporting 1431 active patterns per match (Rienzi, et al, 2005). This
increase is due to the greater magnitude of speed and physical requirement in the modern
game.

ISSN: 2249-2496 Impact Factor: 7.081
368 International Journal of Research in Social Sciences
http://www.ijmra.us, Email: [email protected]
The purpose of this study is to assess performance related fitness such as speed, power
and agility of south western zone (A) Ethiopian national league football players
through valid predetermined field testes.
1.2 Statement of the problem
The various codes of football played around the world have much in common in terms of
their physical demand and correspondingly the importance of fitness testing (Pyne.et
al, 2014).
Competition naturally provides the best test for an athlete, but it is difficult to isolate the
various components with the sport and get objective measure of performance (Di salvo, et
al, 2006). The path to any performance goal is never usually a straight line but a series of
peaks and troughs (Davies, 2005).
Testing the physical and physiological abilities of soccer players is important for a
variety of reasons including: identifying the strengths and limitations of players, monitoring
athletes during critical windows of development. Fitness testing is used as a way of
comparing an athlete’s results to previous performances or to normative standards
established in the sport. Fitness testing can thus be used to modify future training as
appropriate. (Jones. et al, 2008).
Ethiopia is one of the few nations in Africa to establish modern sport system. This was
known for the reputable achievement in Africa by its huge contribution for the
inception and development of continental sport organization particularly CAF founded in
1957 by collective effort of Ethiopia, Egypt and Sudan (Amdie, 2006). The performance
of east African football teams in the continental competition has been low in comparison
to other regions in Africa (Rintaugu, 2012). This statement includes our country
Ethiopia in critical background of our football player’s limited performance to compute
against other nations. But there is no clear evidence to what extent and a degree to which
the performance of players has been limited from certain standard. Various study has been
conducted on the assessment of physical performance of football players, but very few

ISSN: 2249-2496 Impact Factor: 7.081
369 International Journal of Research in Social Sciences
http://www.ijmra.us, Email: [email protected]
studies were conducted on the basis of playing position especially in Africa. As stated by
Clark, (2007), positional roles are less well distinguished on the basis of
physical fitness in Africa.
According to Korkusuz & Ergen, (2007), high level of soccer requires a great amount
of endurance speed, power and agility. To this end the researcher attempted fill the gap
shown on other study through administering objective measure of selected performance
related fitness such as speed, power and agility of national league players based on four
(4) basic playing position of football such as goal keeper, defensive, midfielder, and
striker or forwards through predetermined fitness tests.
Therefore this research intends to answer the following basic question in the course of the
study.
1. How national league football coaches assess their players’ actual performance?
2. Is their significance difference between players performance related fitness
according to their playing position?
3. Does performance related physical fitness of national league players go in line
with international test standards?
4. Which performance related fitness of players becomes common problematic area
for national league football clubs?
5. What are the possible solutions suggested to enhance players’ performance
related physical fitness?
2. Research design and method
2.1. Study Design
The researcher gathers data from different site and different point of view. Therefore cross-
sectional study design was be best closely related to the current study. The research method
which also best suited for the investigation was quantitative and qualitative research
methods.
2.2. Study Area and Period

ISSN: 2249-2496 Impact Factor: 7.081
370 International Journal of Research in Social Sciences
http://www.ijmra.us, Email: [email protected]
South western part of Ethiopia consists of different zones and localities such as: Jimma zone,
bench Maji zone, Sheka zone, Elu Abba Bora zone, Kaffa zone, and parts of Gambella
region.
From those zones and regions, national leagues clubs namely, Jimma Abba Buna, Mizan
Amman, Kaffa Coffee, Jimma City, Mettu city, Nekemt City, and Gambella City were
assigned in south western (A) division of the league..
2.3. Population of the Study
The study population of this particular research 7(seven)south western (A) division of
Ethiopian national league football clubs such as, Jimma Abba Buna, MizanAman, Kaffa
Coffee, Jimma City, Mettu City, Nekemt City, and Gambella City. Each club have an
average number of 25 players and one main plus one assistance coach. From those all 25
players from and coaches from those clubs totally 175 players and 14 coaches was the
population of the study.
2.4. Participants
Players those are currently involving in the main team of national league football clubs such
as, Jimma Abba Buna football club, Kaffa coffee football club, and Jimma city football club
and also the main coach of the clubs was the subjects of this study.
2.6. Sample Size
The selection of players was based on playing position and no assistance coaches was
included in the study, therefore all players from three selected national league football
clubs selected by considering their health condition and status of injury. To realize the
objective of the study, purposive sampling method was employed based on criteria such
as previous achievements of the clubs. Thus, from seven (7) clubs those participated in
2006EC competition season, these selected 3 clubs were completed the league respectively
from the list rank. Therefore from those three clubs total of 75 players was selected
according to their positional involvement to this end,
9, goal keepers, 24 defensives, 24 mid fielders, and 18 forwards were the sample group of

ISSN: 2249-2496 Impact Factor: 7.081
371 International Journal of Research in Social Sciences
http://www.ijmra.us, Email: [email protected]
the study including 3 main coaches from selected clubs were the sample of the study.
2.7. Instruments of data collection
The main instruments of data collection in due investigation of the study was valid
predetermined fitness tests and structured interview, the test score sheet was prepared to
record test score during administering the tests considering playing position. Demographic
data such as age, height and playing experience was recorded on single sheet prepared for
collect those data.
Additionally the researcher looked other published literatures as well as web sites in the area
of the investigation.
2.7.1. The valid predetermined fitness tests
2.7.1.1. 30-Meter sprint test
Speed test can be performed over varying distance, depending on the factor being tested and
the relevance to the sport. This test is used to measure acceleration and speed off the mark. A
longer distance isn’t relevant to soccer where players rarely run flat out for more than 20-
30meters/yards. The test, however, despite the definition of terms, is still valid and specific
to soccer (Turner ,2011)
2.7.1.2. Illinois Agility Test
This test measures your ability to change direction quickly. You will need 8 cones, a
stopwatch and a training partner to record the time. Rapid activity occurs in the crucial
seconds of the game and can make the difference between scoring and conceding a goal.
Thus, the ability to produce fast-paced variable actions can impact soccer performance,
and therefore, a soccer player’s agility must be assessed(Davies, 2005).
2.7.1.3. Vertical jump
This is a good test for soccer because it measures jumping power relevant for heading ability.
It’s also useful for goalkeepers
2.7.2. Interview

ISSN: 2249-2496 Impact Factor: 7.081
372 International Journal of Research in Social Sciences
http://www.ijmra.us, Email: [email protected]
Supplementary information from national league football club coaches was collected through
structured interview regarding to the presence of special fitness coaches and continuous
fitness testing throughout the season in the clubs.
2.8. Data Collection procedure
Data collection procedure was preceded through the following steps. After taking
ethical approval from Jimma University the researcher was progressed to the target area of
the study. So that here it also persuade stakeholders, coaches, and players of each clubs
through detail and brief description of the objective of the study. These made strong
agreement and to enhance their cooperativeness. Then after the researcher was directly
skipped to select sample participant considering injury and other health problem,
therefore, by selecting test groups, the test was administered in four (4) categories
regarding to playing position of the participant on similar field and similar measurement
of testes.
3. Results and major findings
3.1 Demographic characteristics of players
The data gathered from players for this investigation, in addition to testing the performance
of players through field tests demographic and anthropometric variables such as age, weight,
height and BMI was included and the result of each variable was analyzed.
Figure 1 Demographic and anthropometric Characteristics of players

ISSN: 2249-2496 Impact Factor: 7.081
373 International Journal of Research in Social Sciences
http://www.ijmra.us, Email: [email protected]
According to the above graph 1, goal keepers’ defensives and mid fielders were
appeared approximately under similar age group while forwards were older than other
position. Regarding to their height, goal keepers and defensives have similar mean height
and taller than other on the other hand mid fielders and forward players were similar in their
mean height value. Furthermore goal keepers were appeared heavier than the rest position
with mean weight (M= 71.2kg) and forwards were found to be comparatively lighter
than other positions with mean weight (M=69kg). So these indicates that there was
considerable difference between playing position.
Regarding to players anthropometric variable the minor mean variation was found
between playing position, in this regard goal keepers found to be fattest of the position with
(M = 23.5), while forwards appeared lower in their BMI having mean BMI (M =
22.2).. In order to determine the significance difference between the above mean
score, one way analysis of variance (ANOVA) was employed and the result had been
analyzed below.
Table 1comparison of players’ demographic and anthropometric characteristics
Playing position Demographic variables
N M SD F(3,71) Sig
Goal keepers 9 Age 24.0 2.6 3.7 NS
Height 1.75 .035 .64 NS
Weight 71.2 4.8 .52 NS
BMI 23.5 1.76 .64 NS
Defenders 24 Age 24.2 1.74 3.7 .032
Height 1.75 .08 .64 NS
Weight 68.4 5.9 .52 NS

ISSN: 2249-2496 Impact Factor: 7.081
374 International Journal of Research in Social Sciences
http://www.ijmra.us, Email: [email protected]
BMI 22.3 1.84 .64 NS
Mid fielders 24 Age 24.2 1.47 3.7 .032
Height 1.74 .06 .64 NS
Weight 68.7 4.1 .52 NS
BMI 22.4 1.32 .64 NS
Forwards18 Age 25.7 1.5 3.7 .016
Height 1.74 .07 .64 NS
Weight 69 5.8 .52 NS
BMI 22.2 2.2 .64 NS
The above table 1 illustrated the mean difference of players based on their playing
position regarding their demographic characteristics, therefore the researcher need to
ensure the above mean difference was significant or not, cause of this one way analysis of
variance (ANOVA) was used to identify significant mean difference of players
demographic and anthropometric variables based on their playing position. Therefore one
way analysis of variance (ANOVA) indicated that there was mean difference between
players age regarding to their playing position, thus forwards (M= 25.7,SD=1.5), mid
fielders (M= 24. 2, SD= 1.47), defences (M= 24.2, SD= 1.74), and goal keepers (M= 24.0,
SD= 2.6), F(3,71) = 3.7, P < .05.
The other section of analysis supported by ANOVA was anthropometric variables
(height, weight and BMI) variation of players based on their playing position. Thus, as
indicated on the

ISSN: 2249-2496 Impact Factor: 7.081
375 International Journal of Research in Social Sciences
http://www.ijmra.us, Email: [email protected]
table 2, there was a mean difference between players height according to their position
amongst, goal keepers (M = 1.75, SD = 0.035), defenders (M= 1.75, SD= 0.008), mid
fielders (M= 1.74, SD = 0.06) and forwards (M= 1.74, SD = 0.07), F(3,71)= 0.64, P > 0.05.
The last anthropometric variable which was included in this particular study was player’s
body mass index (BMI). BMI is a number calculated from player’s weight and height.
According the output taken from one way analysis of variance it had shown that, there
was mean difference between players regarding playing position, among goal keepers (M=
23.5, SD = 1.76), defences (M = 22.3, SD = 1.84), mid fielders (M = 22.4, SD = 1.32) and
forwards (M = 22.2, SD = 2.2). F (3,71) = 0.64, P > 0.05.
Generally as we have seen from the above analysis, only player’s age was found to be
significantly difference from the demographic characteristics of players regarding their
playing position, in contrast the other variables shown to be similar for all playing position.
This indicates excluding age, there was no significance difference between players regarding
to height, weight and BMI across playing position.
3.2. Comparison of fitness and playing position
The table 2 below illustrates the comparisons of mean differences in fitness variables
across playing position. One way analysis of variance (ANOVA) indicated that there
was a mean difference between playingin Illinois agility test score, to this Forwards
was found to be betterwith mean score (M = 16.8, SD=.18) than mid fielders score (M =
16.9, SD .38), as well as defence (M = 17.1, SD =0.5), than goal keepers (M = 17.7, SD =
.52), F (3,71),= 11.70, P < .05.

ISSN: 2249-2496 Impact Factor: 7.081
376 International Journal of Research in Social Sciences
http://www.ijmra.us, Email: [email protected]
Table 2 Comparisons of fitness variables across playing position
ANOVA
Sum of Df Mean F Sig.
Squares Square
power Between 19.652 3 6.551 2.981 .037
score of Groups
players Within 156.028 71 2.198
Groups
Total 175.680 74
agility Between 5.820 3 1.940 11.70 .000
score of Groups 6
players Within 11.767 71 .166
Groups
Total 17.587 74
speed Between .254 3 .085 4.154 .009
score of Groups
players Within 1.448 71 .020
Groups
Total 1.702 74

ISSN: 2249-2496 Impact Factor: 7.081
377 International Journal of Research in Social Sciences
http://www.ijmra.us, Email: [email protected]
*p <.05.
Regarding to vertical jump as it is indicated on table 2, power test one way analysis of
variance (ANOVA) showed that, there was mean difference between players of south
western zone, national league football clubs in vertical jump test score, so that forwards
mean score (M = 53.5 SD =1.24) than Goal keepers score (M = 53.0, SD 1.87), as well
as defence (M = 52.6, SD =1.63), than mid fielders (M = 52.2, SD =1.39), F(3,71 ),=
2.98,P < .05.
The third performance related physical fitness which was assessed by field test was speed;
the score obtained through 30m sprint test was based on playing position. Therefore
one way analysis of variance (ANOVA) indicated that there was mean difference
between playing position in 30m sprint test, in this regard forwards were better than
other position with mean score (M= 4.27, SD= 0.12), defensives were better than mid
fielders and goal keepers with mean score(M= 4.35, SD= O.18) and mid fielders have better
mean score (M= 4.38, SD = 0.38 )than goal keepers mean score(M= 4,46, SD= 0.10) F(
3,71 ), = 4.15 P > 0.05
Table 10comparison of players’ fitness mean score with international norms of each
test mean score..
Test variables Test norms
Super Excellent Good Average Fair Poor Very poor
1 Vertical jump 64.8- 61.0- 63.5 57.2 – 53.3- 48.5- 44.6– 39.4-44.5
leg power test 69.9 59.7 55.9 52.9 48.3
(cm)
2 Illinois agility 15.3 – 16.3–16.7 16.8- 17.5- 18.1- 18.7- 19.1 19.3-
test (second) 16.1 17.3 17.9 18.6
20.1
3 30meter sprint _ < 4.0 4.2- 4.0 4.5- 4.3 4.6- 4.4 > 4.6 _
test (second).

ISSN: 2249-2496 Impact Factor: 7.081
378 International Journal of Research in Social Sciences
http://www.ijmra.us, Email: [email protected]
Source: Davis B,et al(2000), Physical education senior syllabus,(2010)
The above table shown that, sport specific test standards are categorized by the international
norms which was used to compare an athlete’s performance based on those standard scores.
Therefore,the present study attempted to compare test score obtained from field test
assessment such as 30m sprint speed test, Illinois agility test and vertical jump leg power test
with the international test standards on the above table.
As we have seen on the above table the result of players fitness score obtained from 3
fitness tests based on their playing position was compared with international norms of each
test results.
Therefore the mean score obtained from30m sprint test of goal keepers was (M=4.46
sec), defenders (M= 4.35 sec), mid fielders (M=4.38 sec) and strikers (M= 4.27). Therefore
the current test score of players as compared with the above standardized score distribution
the score of goal keepers found to be below average, defenders and mid fielders appeared
under average score of the standards and only forward players was found to be above
average score of the standards.
This implies that players were not sufficiently trained to competereach their pick
performance in maximal speed.
The players Illinois agility test score is the second performance related fitness variable which
was compared with the test standard on the above table. In this regard Illinois agility test
mean score obtained from current assessment of players shown that, goal keepers (M= 17.7
sec), defenders (M= 17.1 sec). Mid fielders (M= 16.9 sec) and strikers (M=16.8 sec). as it
was clearly indicated that the mean score of players shown except goal keepers all position
appeared at good standard of the normative data, but goal keepers found on the average
standard of the test. From these one can understand that except goal keepers other positions
shown little improvement than 30m sprint speed test.

ISSN: 2249-2496 Impact Factor: 7.081
379 International Journal of Research in Social Sciences
http://www.ijmra.us, Email: [email protected]
The last performance related physical fitness compared with the international test standard
was vertical jump test. Similarly to the above test score, vertical jump test score was also
obtained from national league football players through field test. Therefore the obtained test
mean score from those individual performers shown that, goal keepers (M = 53.0 cm),
defender,(M= 52.6 cm), midfielders (M= 52.2 cm), forwards (M= 53.5 cm). As we have seen
from these mean distribution forwards and goal keepers were better in vertical jump test and
they fall in average distribution under the test standard, next to these mid fielders and
defensive fall under fair but not god or bad category. These implies, especially defensives
and mid fielders appears below average.
In addition to the above comparisons of test score of player with the standard, by considering
the mean score obtained from different tests, prevailing performance limitation of players
according to playing position was identified. In these regard, goal keepers mean score for
Illinois agility test was lowest score (M=17.7sec) and similarly the low scorerof 30m sprint
test was goal keepers with mean score (M=4.46 sec) to these end agility and speed to be
found prevailing limitation for goal keepers. This indicated that, goal keepers need extra
demand to improve both variables in training season.
3 Qualitative analysis of data
Determining actual players’ performance
When the coaches were asked to answer the interview question regarding to how they
determine the actual observable performance of player in the team, coaches who
participated in this study explained that, the main tool in which football coaches used to
determine the actual performance of players was, considering individual players
contribution during competition and pre training effectiveness.
Major factors inhibit fitness assessment
The participants offered the major challenges that inhibit them, not to administer
continuous assessment of fitness throughout the season with simple sport specific field test
were, listed as follow;

ISSN: 2249-2496 Impact Factor: 7.081
380 International Journal of Research in Social Sciences
http://www.ijmra.us, Email: [email protected]
Lack of coaches’ motivation
Low level of understanding about practical field test assessment
Absence of measuring instruments
Conclusion
The result of this study demonstrated that there is no sport specific field assessment trend
under south western division of Ethiopian national league football clubs. And also
there was no statistically significant difference between south western division of
national league players regarding to their height, weight and BMI. But, regarding to
age, there was statistically significance difference found between playing position.
Forward players were better than mid fielders in lower body power output. Compering to
international standard, Forward players were better than other position players in agility,
power and speed test. Goal keepers power and speed score found to be below the average
standard of the test, this indicates goal keepers’ speed and power performance was not in
line with the test standard. Agility and speed were prevailing performance limitations of
goal keepers.
REFERENCES
Ashok,C.( 2008). Test Your Physical Fitness. Kalpaz Publications C-30, Satyawati Nagar,
Delhi- l10052; ISBN: 81-7835-681-3; PP 30-32
Bjorntop, P. (2001). International Textbook of Obesity. Report in sahlgrenska
Hospital, Go’’teborg, sweeden.P528.
Bouchard C, Shephard R J.(1994). Physical activity, fitness and health: The model and
key concepts In: C Bouchard, RJ Shephard, T Stephens (Eds.): Physical Activity
Fitness and Health: International Proceedings and Consensus Statement, Human
Kinetics,Champaign
Can ,F. Yilmaz, I. Erden Z. (2004). Morphological Characteristics and Performance
Variables of Women Soccer Players. Journal of Strength Conditioning Research. 18(3):
480 – 485.
Cataldo C. (1999). Nutrition and Diet Therapy: Principles and Practice, St.Paul:
West Publishing Company, pp. 232-238.

ISSN: 2249-2496 Impact Factor: 7.081
381 International Journal of Research in Social Sciences
http://www.ijmra.us, Email: [email protected]
Choudhary, A. (1998). Physical Fitness of Female Students Studying in High
Schools in Rural and Urban Areas. M.Phil Thesis, Unpublished. Kurukshetra:
Kuruskhetra University.
Davies,J. R, Dennis R.(2000). Physical Education and the Study of Sport. 4th ed. Spain:
Harcourt; Davies, J.A., Brewer, J. and Atkin, D. (1992). Pre-Seasonal Physiological
Characteristics of English First and Second Division Soccer Players. Journal of Sports
Sciences 10, 541-547.
Fahey, T. D., Insel, P. M. & Roth, W. T. (2003). Fit and Well (5th ed.). New York:
Mc Graw-Hill Companies Inc.
Getchell, G. (1979). Physical Fitness A Way of Life. 2nd ed. New Jersey, John Wiley and
Sons.
Gil, S., Ruiz, F., Irazusta, A., Gil, J., and Irazusta, J. (2007). Selection of Young Soccer
Players in Terms of Anthropometric and Physiological Factors. Journal of Sports
Medicine Golding, Myers, Wayne.
(1986). The Y's Way to Physical Fitness. (3rd ed).P 96.
Hoeger, W. W. K. & Hoeger, S. A. (2002). Principles and Labs for Fitness and
Wellness (6th ed.). Belmont: Wadsworth Group.
Ichinohe M, Mita R, Saito., K. (2004). Physical activity, fitness and health: Obesity
and lifestyle in Jamaica. International Collaboration in Community Health, 1267: 39-50.
Juric, I., Sporis G., Mihacic, V. (2007). Analysis of Morphological Features and Played
Team Positions in Elite Female Soccer Players. Proceedings of the VIth
World Congress on
Science and Football. Antalya: Plenum press.
Keogh, J. (1999). The Use of Physical Fitness Scores and Anthropometric Data to Predict
Selection in an Elite
Under-18 Australian Rules Football Team. Journal of Science and Medicine in Sport,
Krustrup, P.,
Mohr M., Ellingsgaard H., Bangsbo J. (2005). Physical Demands During an Elite
Female Soccer
Game: Importance of Training Status. Medicine Science Sports Exercise.

ISSN: 2249-2496 Impact Factor: 7.081
382 International Journal of Research in Social Sciences
http://www.ijmra.us, Email: [email protected]
Kyle U G, Gremion G, Genton L, Slosman D O, Golay A, Pichard C.( 2001). Physical
activity and fat free and fat mass as measured by bioelectrical impedence in3853
adults. Med Sci Sports Exerc, 33: 576-584.
Malina, R. M., Eisenmann, J. C., Cumming, S. P., Ribeiro, B., & Aroso, J. (2004).
Maturity-associated variation in the growth and functional capacities of youth football
(soccer) players 13-15 years. European Journal of Applied Physiology,
Markovic G , Mikulic P .(2011). Discriminate ability of the Yo-Yo Intermittent Recovery
Test (level 1) in prospective young soccer players. Journal of Strength and Conditioning
Research, Mehdi-Ben B, Rym ,B, Amri, M.(2013). Anthropometric and Physical
Characteristics of Tunisians Young Soccer Players. Journal of Advances in Physical
Education, 3(3),
Ostojic, S.M. and Zivanic, S.(2001). Effects of Training on Anthropometric and Physiological
Characteristics of Elite Serbian Soccer Players. Acta Biologiae et Medicinae Experimentalis 2
Reilly, T. (1996). Fitness Assessment. In: Science and Soccer. Ed: Reilly, T. London: E & FN
Spon.
Reilly T., Secher N.(1990). Physiology of Sports: an Overview. London: E&FN Spon.
Rhodes, E.C., Mosher, R.E., McKenzie DC, Franks, I.M., Potts, J.E. and Wenger, H.A.
(1986). Physiological
Profiles of the Canadian Olympic Soccer Team. Canadian Journal of Applied Sport Sciences
11:31-36.
Sheppard, J. M., & Young, W. B. (2006). Agility literature review: Classifications,
training and testing.
Journal of Sports Science, 24, 919- 932. doi:10.1080/02640410500457109.
Silvestre, R., West, C., Maresh, C.M., and Kraemer, W.J. (2006). Body Composition and
Physical Performance in Mens` Soccer: A study of a National Collegiate Athletic
Association Division I team. Journal of Strength and Conditioning Research.20:177–183.
Sporis G, Canaki M, Barisic V. (2007). Morphological Differences of Elite Croatian
Female Soccer Players According to Team Position. Hrvatski sportskomedicinski vjesnik. 22:
91-96.
Thune I, Njolstad I, Lochen ML, Forde OH 1998. Physical activity improves the
metabolic risk profiles in men and women. Arch Intern Med, 158: 1633-1645.

ISSN: 2249-2496 Impact Factor: 7.081
383 International Journal of Research in Social Sciences
http://www.ijmra.us, Email: [email protected]
Vescovi J, D., Rupf, R. Brown, T. D,. Marques, M. C.(2010). Physical performance
characteristics of high-level female soccer. Scandinavian Journal of Medicine and
Science in Sports.
WHO. (2000).Obesity: Preventing and Managing the Global Epidemic. Report of a
WHO Consultation.
World Health Organ Tech Rep Ser, World Health Organization, Geneva.
WHO.(2000). Technical Report Series 894 Obesity: Preventing and Managing the
Global Epidemic.
World Health Organization: Geneva, Switzerland