Embed Size (px)
Citation preview
ASSESSMENT OF ASSESSMENT OF NUTRITIONAL STATUSNUTRITIONAL STATUS
Abdelaziz Elamin, MD, PhD, Abdelaziz Elamin, MD, PhD, FRCPCHFRCPCHCollege of MedicineCollege of MedicineSultan Qaboos University, OmanSultan Qaboos University, Oman
LEARNING OBJECTIVESLEARNING OBJECTIVES
By the end of this lecture the reader should be able to:To know the different methods for assessing the nutritional statusTo understand the basic anthropometric techniques, applications, & reference standards
INTRODUCTIONINTRODUCTION
The nutritional status of an individual is often the result of many inter-related factors.
It is influenced by food intake, quantity & quality, & physical health.
The spectrum of nutritional status spread from obesity to severe malnutrition
Nutritional Assessment Nutritional Assessment WhyWhy??
The purpose of nutritional assessment is The purpose of nutritional assessment is to:to:
Identify individuals or population groups at risk of becoming malnourished
Identify individuals or population groups who are malnourished
Nutritional Assessment Nutritional Assessment Why? 2Why? 2
To develop health care programs that meet the community needs which are defined by the assessment
To measure the effectiveness of the nutritional programs & intervention once initiated
Methods of Nutritional Assessment
Nutrition is assessed by two types of methods; direct and indirect.
The direct methods deal with the individual and measure objective criteria, while indirect methods use community health indices that reflects nutritional influences.
Direct Methods of Nutritional Assessment
These are summarized as These are summarized as ABCDABCD
Anthropometric methodsBiochemical, laboratory
methodsClinical methodsDietary evaluation methods
Indirect Methods of Nutritional Assessment
These include three categories:Ecological variables including crop productionEconomic factors e.g. per capita income, population density & social habitsVital health statistics particularly infant & under 5 mortality & fertility index
CLINICAL ASSESSMENT
It is an essential features of all nutritional surveysIt is the simplest & most practical method of ascertaining the nutritional status of a group of individualsIt utilizes a number of physical signs, (specific & non specific), that are known to be associated with malnutrition and deficiency of vitamins & micronutrients.
CLINICAL ASSESSMENT/2
Good nutritional history should be obtainedGeneral clinical examination, with special attention to organs like hair, angles of the mouth, gums, nails, skin, eyes, tongue, muscles, bones, & thyroid gland.Detection of relevant signs helps in establishing the nutritional diagnosis
CLINICAL ASSESSMENT/3
ADVANTAGESFast & Easy to performInexpensiveNon-invasive
LIMITATIONSDid not detect early cases
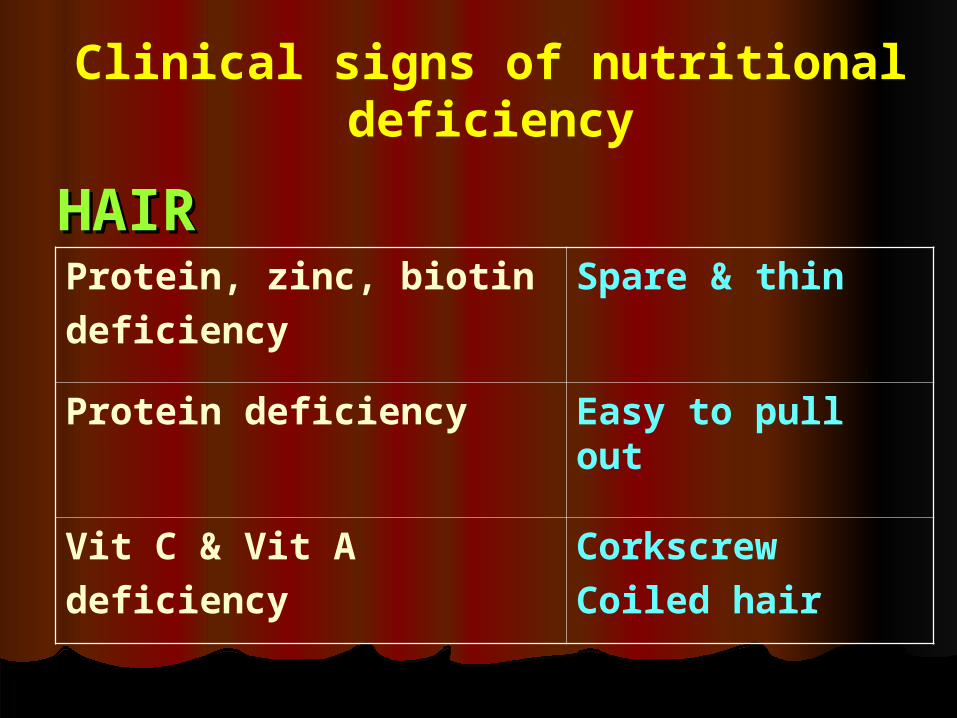
Clinical signs of nutritional deficiency
HAIRHAIRSpare & thinProtein, zinc, biotin
deficiency
Easy to pull outProtein deficiency
CorkscrewCoiled hair
Vit C & Vit Adeficiency
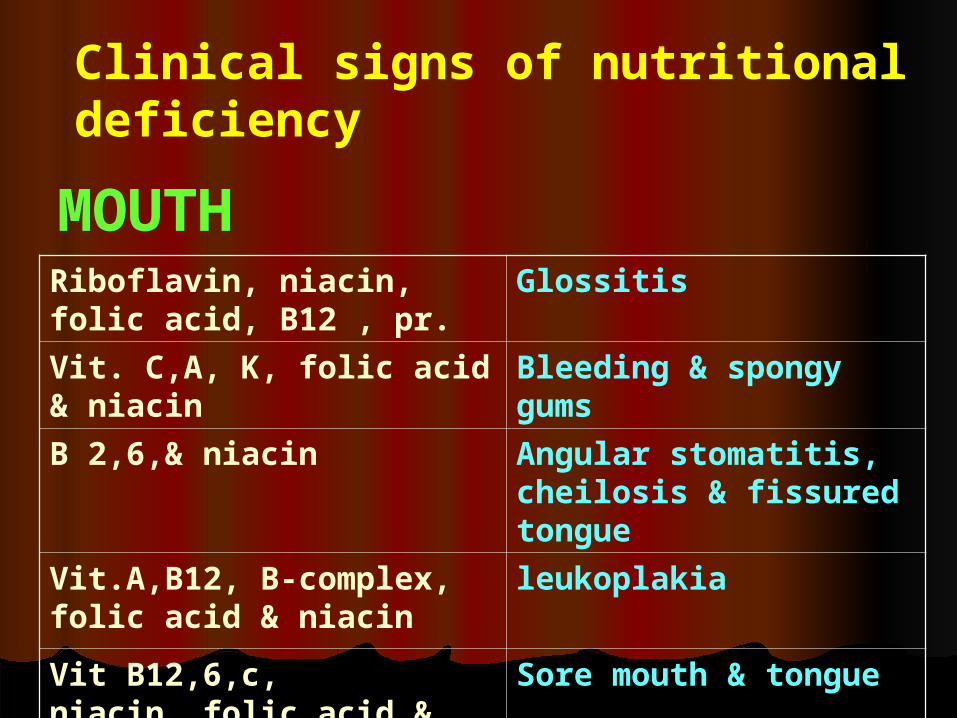
Clinical signs of nutritional deficiency
MOUTHGlossitisRiboflavin, niacin, folic acid,
B12 , pr.
Bleeding & spongy gumsVit. C,A, K, folic acid & niacin
Angular stomatitis, cheilosis & fissured tongue
B 2,6,& niacin
leukoplakiaVit.A,B12, B-complex, folic acid & niacin
Sore mouth & tongueVit B12,6,c, niacin ,folic acid & iron
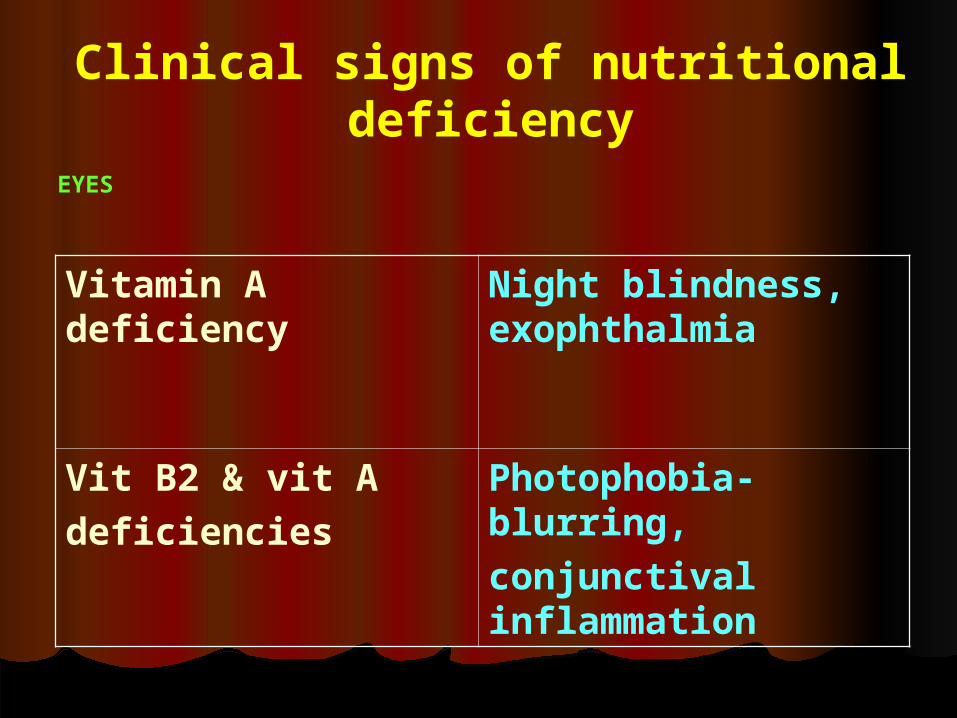
Clinical signs of nutritional deficiency
EYES
Night blindness, exophthalmia
Vitamin A deficiency
Photophobia-blurring, conjunctival inflammation
Vit B2 & vit Adeficiencies
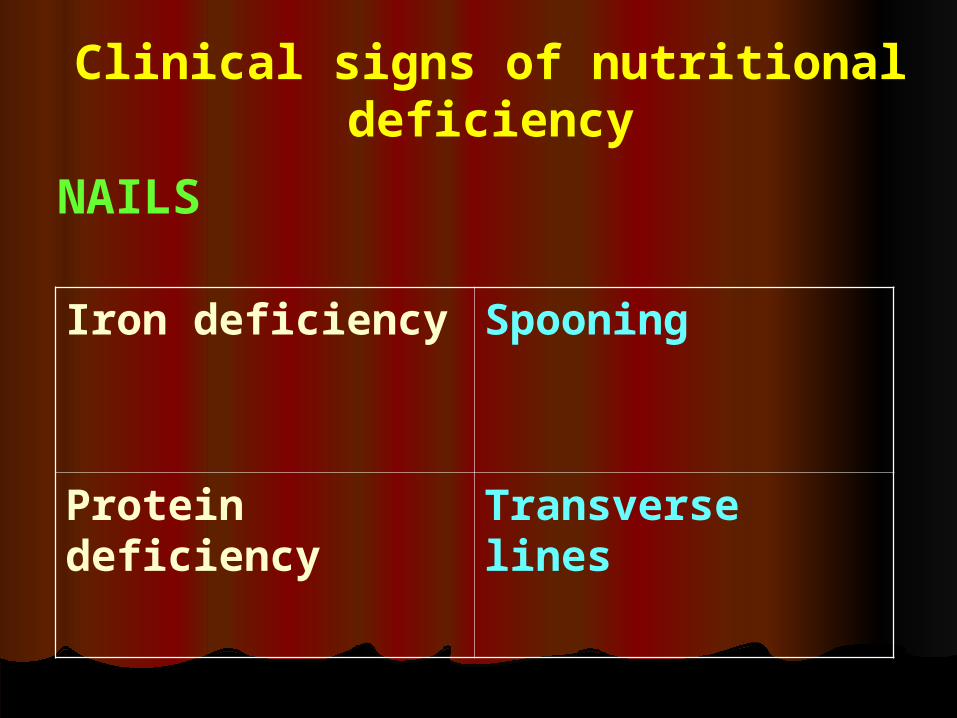
Clinical signs of nutritional deficiency
NAILS
SpooningIron deficiency
Transverse linesProtein deficiency
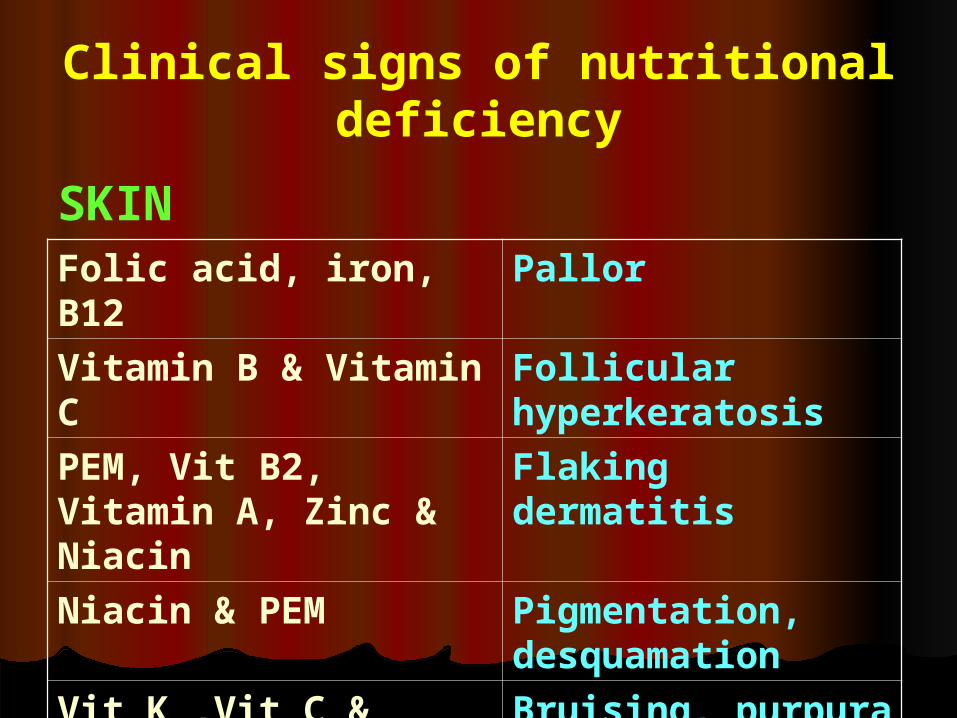
Clinical signs of nutritional deficiency
SKINPallorFolic acid, iron, B12
Follicular hyperkeratosis
Vitamin B & Vitamin C
Flaking dermatitis
PEM, Vit B2, Vitamin A, Zinc & Niacin
Pigmentation, desquamation
Niacin & PEM
Bruising, purpuraVit K ,Vit C & folic acid
Clinical signs of nutritional deficiency
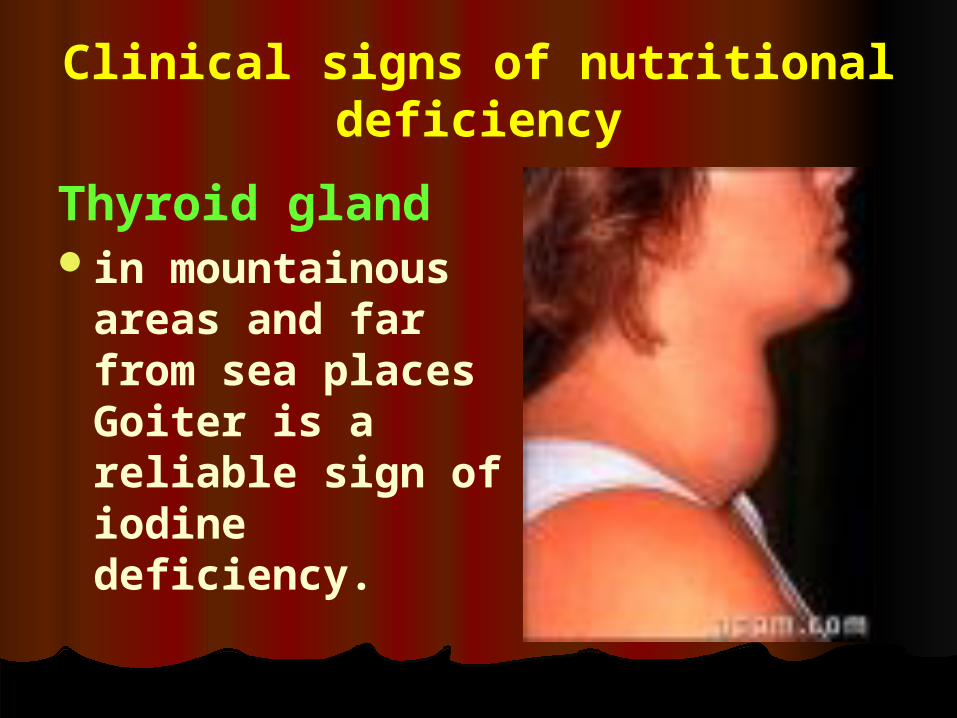
Thyroid glandin mountainous
areas and far from sea places Goiter is a reliable sign of iodine deficiency.
Clinical signs of nutritional deficiency
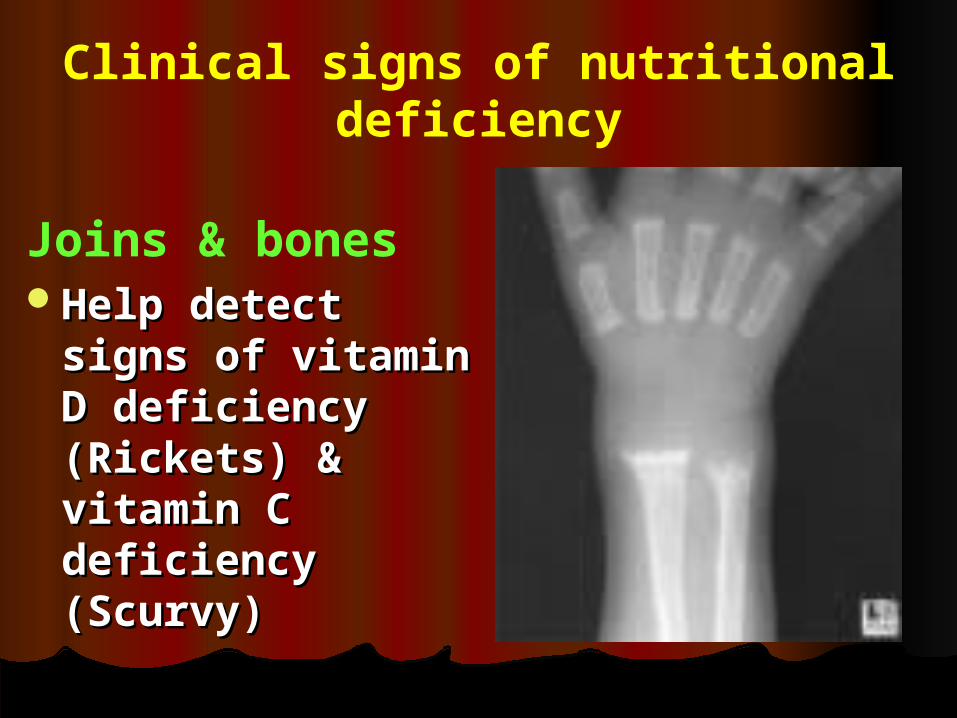
Joins & bonesHelp detect signs Help detect signs
of vitamin D of vitamin D deficiency deficiency (Rickets) & (Rickets) & vitamin C vitamin C deficiency deficiency (Scurvy)(Scurvy)
Anthropometric MethodsAnthropometry is the measurement of body height, weight & proportions.It is an essential component of clinical examination of infants, children & pregnant women.It is used to evaluate both under & over nutrition.The measured values reflects the current nutritional status & don’t differentiate between acute & chronic changes .
Other anthropometric Measurements
Mid-arm circumference
Skin fold thickness
Head circumference
Head/chest ratioHip/waist ratio
Anthropometry for children
Accurate measurement of height and weight is essential. The results can then be used to evaluate the physical growth of the child.
For growth monitoring the data are plotted on growth charts over a period of time that is enough to calculate growth velocity, which can then be compared to international standards
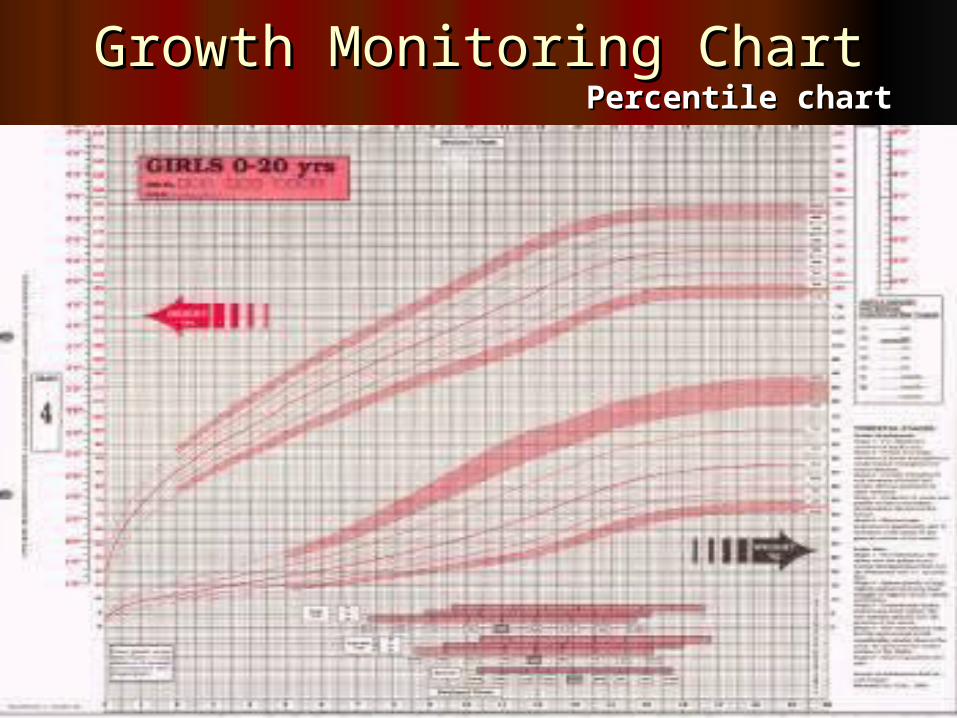
Growth Monitoring ChartGrowth Monitoring Chart Percentile chartPercentile chart

Measurements for adults
Height:Height:The subject stands erect & bare footed on a stadiometer with a movable head piece. The head piece is leveled with skull vault & height is recorded to the nearest 0.5 cm.
WEIGHT MEASUREMENT
Use a regularly calibrated electronic
or balanced-beam scale. Spring
scales are less reliable.
Weigh in light clothes, no shoes
Read to the nearest 100 gm (0.1kg)
Nutritional Indices in Adults The international standard for assessing body
size in adults is the body mass index (BMI).
BMI is computed using the following formula:
BMI = Weight (kg)/ Height (m²)
Evidence shows that high BMI (obesity level)
is associated with type 2 diabetes & high risk
of cardiovascular morbidity & mortality
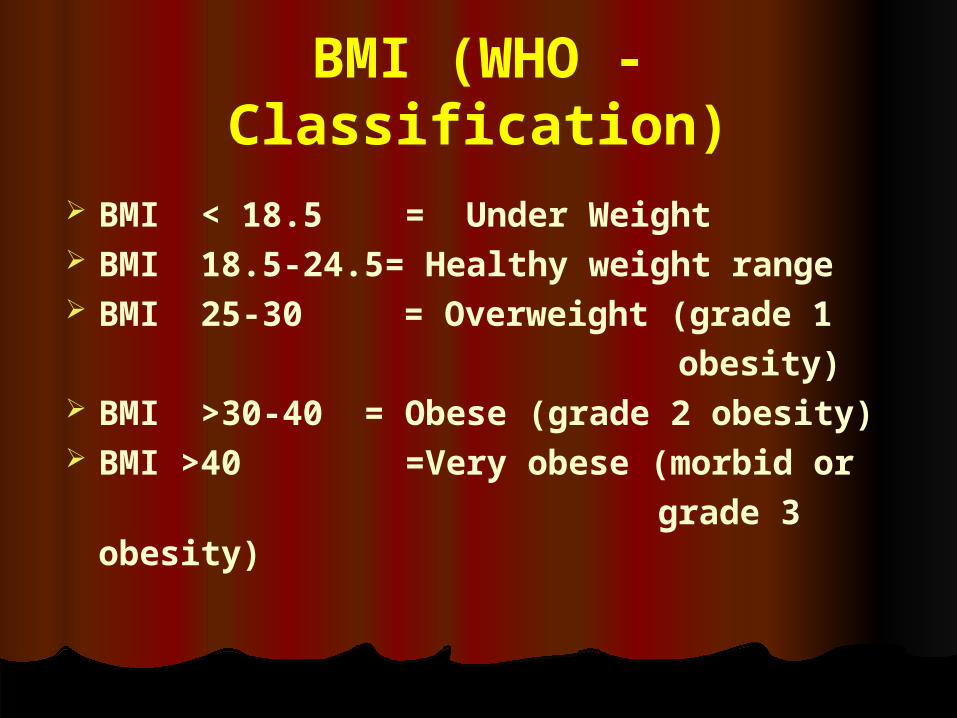
BMI (WHO - Classification)
BMI < 18.5 = Under Weight BMI 18.5-24.5= Healthy weight range BMI 25-30 = Overweight (grade 1 obesity) BMI >30-40 = Obese (grade 2
obesity) BMI >40 =Very obese (morbid or grade 3 obesity)
Waist/Hip Ratio
Waist circumference is measured at the level of the umbilicus to the nearest 0.5 cm.The subject stands erect with relaxed abdominal muscles, arms at the side, and feet together.The measurement should be taken at the end of a normal expiration.
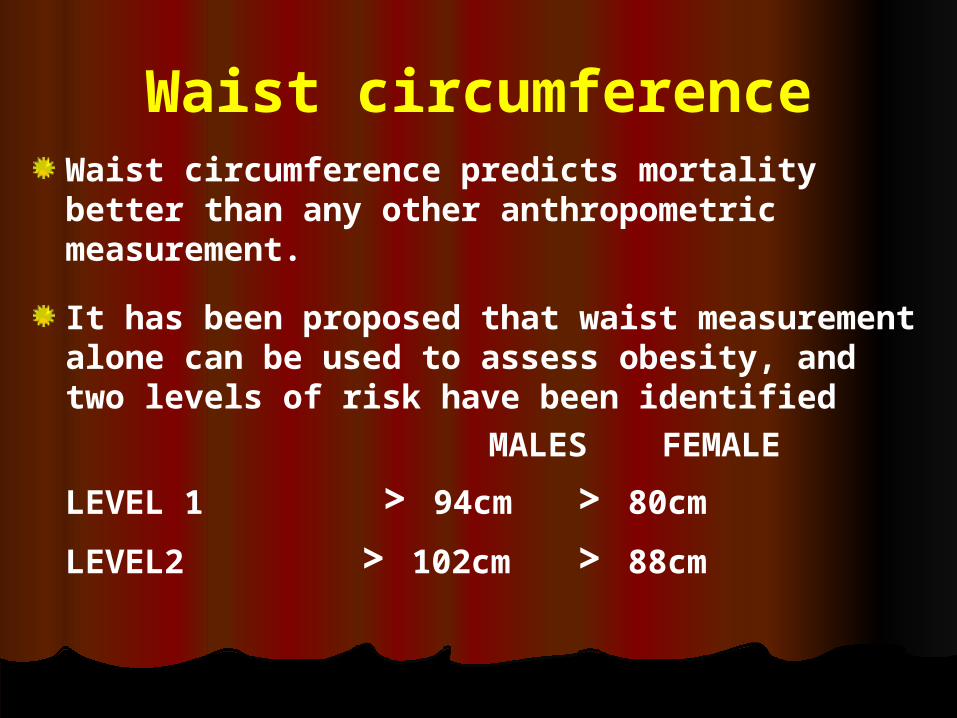
Waist circumferenceWaist circumference predicts mortality better than any other anthropometric measurement.
It has been proposed that waist measurement alone can be used to assess obesity, and two levels of risk have been identified
MALES FEMALE
LEVEL 1 > 94cm > 80cm
LEVEL2 > 102cm > 88cm
Waist circumference/2
Level 1 is the maximum acceptable waist circumference irrespective of the adult age and there should be no further weight gain.
Level 2 denotes obesity and requires weight management to reduce the risk of type 2 diabetes & CVS complications.
Hip Circumference
Is measured at the point of greatest
circumference around hips & buttocks to
the nearest 0.5 cm.
The subject should be standing and the
measurer should squat beside him.
Both measurement should taken with a flexible, non-stretchable tape in close contact with the skin, but without indenting the soft tissue.
Interpretation of WHR
High risk WHR= >0.80 for females & >0.95 for males i.e. waist measurement >80% of hip measurement for women and >95% for men indicates central (upper body) obesity and is considered high risk for diabetes & CVS disorders.A WHR below these cut-off levels is considered low risk.
ADVANTAGES OF ANTHROPOMETRY
Objective with high specificity & sensitivity
Measures many variables of nutritional significance (Ht, Wt, MAC, HC, skin fold thickness, waist & hip ratio & BMI).
Readings are numerical & gradable on standard growth charts
Readings are reproducible. Non-expensive & need minimal training
Limitations of Anthropometry
Inter-observers errors in measurement
Limited nutritional diagnosis
Problems with reference standards, i.e. local versus international standards.
Arbitrary statistical cut-off levels for what considered as abnormal values.
DIETARY ASSESSMENT
Nutritional intake of humans is assessed by five different methods. These are:
24 hours dietary recallFood frequency questionnaireDietary history since early lifeFood dairy techniqueObserved food consumption

24 Hours Dietary Recall
A trained interviewer asks the
subject to recall all food & drink
taken in the previous 24 hours.
It is quick, easy, & depends on
short-term memory, but may not
be truly representative of the
person’s usual intake
Food Frequency Questionnaire
In this method the subject is given a
list of around 100 food items to
indicate his or her intake (frequency
& quantity) per day, per week & per
month.
inexpensive, more representative &
easy to use.

Food Frequency Questionnaire/2
Limitations:
long Questionnaire
Errors with estimating serving size.
Needs updating with new
commercial food products to keep
pace with changing dietary habits.
DIETARY HISTORY
It is an accurate method for assessing the nutritional status.The information should be collected by a trained interviewer.Details about usual intake, types, amount, frequency & timing needs to be obtained.Cross-checking to verify data is important.
FOOD DAIRY
Food intake (types & amounts)
should be recorded by the subject
at the time of consumption.
The length of the collection period
range between 1-7 days.
Reliable but difficult to maintain.
Observed Food Consumption
The most unused method in clinical practice,
but it is recommended for research purposes.
The meal eaten by the individual is weighed
and contents are exactly calculated.
The method is characterized by having a high
degree of accuracy but expensive & needs
time & efforts.
Interpretation of Dietary Data
1. Qualitative Method using the food pyramid & the
basic food groups method. Different nutrients are classified
into 5 groups (fat & oils, bread & cereals, milk products, meat-fish-poultry, vegetables & fruits)
determine the number of serving from each group & compare it with minimum requirement.
Interpretation of Dietary Data/2
2. Quantitative Method The amount of energy & specific
nutrients in each food consumed can be
calculated using food composition
tables & then compare it with the
recommended daily intake.
Evaluation by this method is expensive
& time consuming, unless computing
facilities are available.
Initial Laboratory Assessment
Hemoglobin estimation is the most important test, & useful index of the overall state of nutrition. Beside anemia it also tells about protein & trace element nutrition. Stool examination for the presence of ova and/or intestinal parasites
Urine dipstick & microscopy for albumin, sugar and blood
Specific Lab Tests
Measurement of individual nutrient in body fluids (e.g. serum retinol, serum iron, urinary iodine, vitamin D) Detection of abnormal amount of metabolites in the urine (e.g. urinary creatinine/hydroxyproline ratio)Analysis of hair, nails & skin for micro-nutrients.
Advantages of Biochemical Method
It is useful in detecting early changes in body metabolism & nutrition before the appearance of overt clinical signs.
It is precise, accurate and
reproducible.
Useful to validate data obtained from
dietary methods e.g. comparing salt
intake with 24-hour urinary excretion.
Limitations of Biochemical Method
Time consuming
Expensive
They cannot be applied on large
scale
Needs trained personnel &
facilities


![[Abouzeid, Ola Abdelaziz.] a Comparative Study Bet(Bookfi.org)](https://img.pdfslide.us/doc/110x75/577c77b91a28abe0548d418e/abouzeid-ola-abdelaziz-a-comparative-study-betbookfiorg.jpg)