Embed Size (px)
Citation preview
Transportation Research Part D xxx (2015) xxx–xxx
Contents lists available at ScienceDirect
Transportation Research Part D
journal homepage: www.elsevier .com/ locate/ t rd
Assessment of motor vehicle use characteristics in three Indiancities
http://dx.doi.org/10.1016/j.trd.2015.05.0061361-9209/� 2015 Elsevier Ltd. All rights reserved.
⇑ Corresponding author at: MS-815, Main Building, Transportation Research and Injury Prevention Programme, IIT Delhi, Hauz Khas, New DelhIndia. Tel.: +91 11 2659 6361.
E-mail address: [email protected] (R. Goel).
Please cite this article in press as: Goel, R., et al. Assessment of motor vehicle use characteristics in three Indian cities. Transport. RD (2015), http://dx.doi.org/10.1016/j.trd.2015.05.006
Rahul Goel a,⇑, Dinesh Mohan a, Sarath K. Guttikunda b,c, Geetam Tiwari a
a Transportation Research and Injury Prevention Programme, Indian Institute of Technology, New Delhi, Indiab Division of Atmospheric Sciences, Desert Research Institute, Reno, NV 89512, USAc Interdisciplinary Program in Climate Studies, Indian Institute of Technology, Mumbai 400076, India
a r t i c l e i n f o
Article history:Received 21 October 2014Revised 24 April 2015Accepted 31 May 2015Available online xxxx
Keywords:IndiaCarsMotorised two-wheelersFuel efficiencyIn-use fleet sizeAnnual mileage
a b s t r a c t
Estimates of emissions and energy consumption by vehicular fleet in India are not backedby reliable values of parameters, leading to large uncertainties. We report new methods,including primary surveys and secondary data sources, to estimate in-use fleet size, annualmileage (kilometers per year), and fuel efficiency of cars and motorised two-wheelers(MTW) for Delhi, and except fleet size and annual mileage of cars, for Visakhapatnamand Rajkot. We estimated that the official number of registered cars and MTW in Indiancities is more than two times the actual number of in-use vehicles. The private vehicularfleet in India is the youngest, its fuel efficiency one of the highest, and annual kilometerstravelled is the lowest, compared to many high-income countries, such as the USA andthose in European Union. Along with high renewal rate of fleet, the data suggest that itis possible for India to have one of the most fuel-efficient vehicle fleets in the world inthe future, if fuel-efficiency standards and fiscal policies to contain growing dieselizationare implemented in the country at the earliest.
� 2015 Elsevier Ltd. All rights reserved.
Introduction
Of all the cars and motorised two-wheelers (MTW) registered in India since 1950, more than 85% were registered during1991 through 2011. The official registration numbers indicate that in 2012 there were more than five times as many MTW(115 million) as cars (22 million) (MoRTH, 2012). During the same year, India accounted for 4% of the new passenger carregistrations in the world, compared to China’s 19% and the USA’s 21% (ACEA, 2013), while their share in world’s populationwas 17%, 19% and 5%, respectively.
With the growth of vehicular fleet and its usage, owing to rapidly growing economy, fuel consumption by road transporthas also increased considerably. Over the two decades from 1991 to 2011, annual petrol as well as diesel consumption inIndia increased by more than four times (MoPNG, 2008, 2011). Among these fuels, almost all of petrol and 70% of dieselis consumed by road transport for the year 2012–13 (PPAC, 2013). For year 2007, road transport contributed an estimated6% of the total greenhouse gas (GHG) emissions in the country (GOI, 2011). Since up to 70% of the total oil consumed in Indiais imported (Lok Sabha, 2013), this leads to heavy economic burden and vulnerability to international economics.
i 110016,
es. Part
2 R. Goel et al. / Transportation Research Part D xxx (2015) xxx–xxx
In addition to direct economic implications, increase in fuel consumption also has climate change implications. In thiscontext, the issue of fuel efficiency standards of vehicular fleet has been gaining increased attention internationally. Manycountries (including the four largest automobile markets – the USA, European Union (EU), China and Japan) have adoptedmore stringent fuel efficiency standards to promote fuel-efficient vehicles (ICET, 2011), but India has only started the processrecently (PIB, 2009). The Government of India has notified fuel efficiency standards for passenger cars, vans and utilityvehicles to be implemented from 2016 (GFEI, 2014).
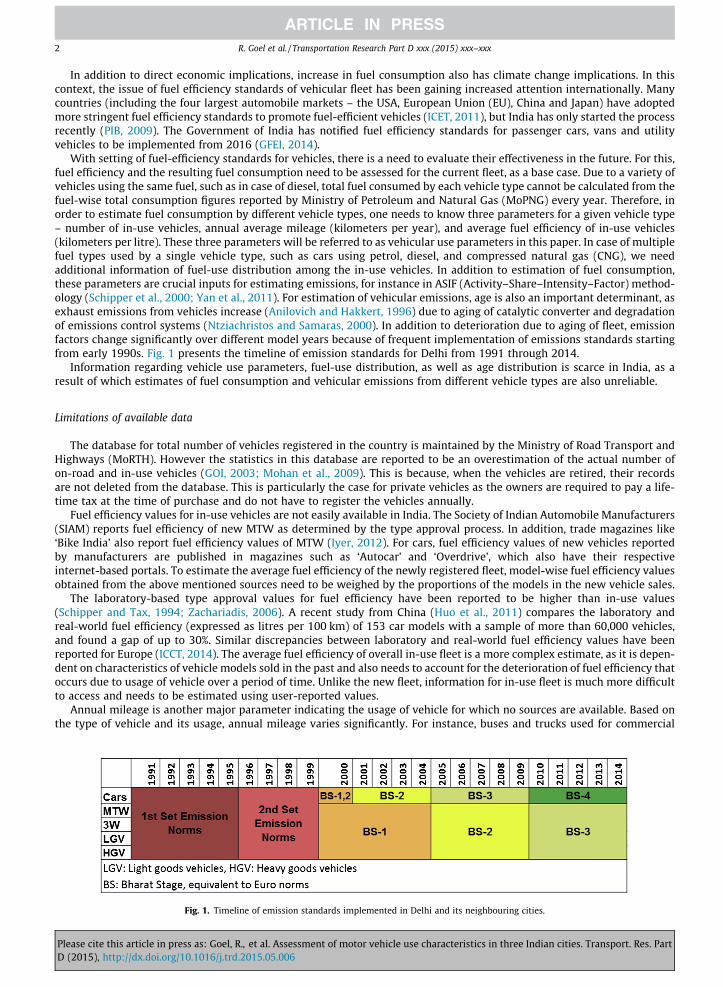
With setting of fuel-efficiency standards for vehicles, there is a need to evaluate their effectiveness in the future. For this,fuel efficiency and the resulting fuel consumption need to be assessed for the current fleet, as a base case. Due to a variety ofvehicles using the same fuel, such as in case of diesel, total fuel consumed by each vehicle type cannot be calculated from thefuel-wise total consumption figures reported by Ministry of Petroleum and Natural Gas (MoPNG) every year. Therefore, inorder to estimate fuel consumption by different vehicle types, one needs to know three parameters for a given vehicle type– number of in-use vehicles, annual average mileage (kilometers per year), and average fuel efficiency of in-use vehicles(kilometers per litre). These three parameters will be referred to as vehicular use parameters in this paper. In case of multiplefuel types used by a single vehicle type, such as cars using petrol, diesel, and compressed natural gas (CNG), we needadditional information of fuel-use distribution among the in-use vehicles. In addition to estimation of fuel consumption,these parameters are crucial inputs for estimating emissions, for instance in ASIF (Activity–Share–Intensity–Factor) method-ology (Schipper et al., 2000; Yan et al., 2011). For estimation of vehicular emissions, age is also an important determinant, asexhaust emissions from vehicles increase (Anilovich and Hakkert, 1996) due to aging of catalytic converter and degradationof emissions control systems (Ntziachristos and Samaras, 2000). In addition to deterioration due to aging of fleet, emissionfactors change significantly over different model years because of frequent implementation of emissions standards startingfrom early 1990s. Fig. 1 presents the timeline of emission standards for Delhi from 1991 through 2014.
Information regarding vehicle use parameters, fuel-use distribution, as well as age distribution is scarce in India, as aresult of which estimates of fuel consumption and vehicular emissions from different vehicle types are also unreliable.
Limitations of available data
The database for total number of vehicles registered in the country is maintained by the Ministry of Road Transport andHighways (MoRTH). However the statistics in this database are reported to be an overestimation of the actual number ofon-road and in-use vehicles (GOI, 2003; Mohan et al., 2009). This is because, when the vehicles are retired, their recordsare not deleted from the database. This is particularly the case for private vehicles as the owners are required to pay a life-time tax at the time of purchase and do not have to register the vehicles annually.
Fuel efficiency values for in-use vehicles are not easily available in India. The Society of Indian Automobile Manufacturers(SIAM) reports fuel efficiency of new MTW as determined by the type approval process. In addition, trade magazines like‘Bike India’ also report fuel efficiency values of MTW (Iyer, 2012). For cars, fuel efficiency values of new vehicles reportedby manufacturers are published in magazines such as ‘Autocar’ and ‘Overdrive’, which also have their respectiveinternet-based portals. To estimate the average fuel efficiency of the newly registered fleet, model-wise fuel efficiency valuesobtained from the above mentioned sources need to be weighed by the proportions of the models in the new vehicle sales.
The laboratory-based type approval values for fuel efficiency have been reported to be higher than in-use values(Schipper and Tax, 1994; Zachariadis, 2006). A recent study from China (Huo et al., 2011) compares the laboratory andreal-world fuel efficiency (expressed as litres per 100 km) of 153 car models with a sample of more than 60,000 vehicles,and found a gap of up to 30%. Similar discrepancies between laboratory and real-world fuel efficiency values have beenreported for Europe (ICCT, 2014). The average fuel efficiency of overall in-use fleet is a more complex estimate, as it is depen-dent on characteristics of vehicle models sold in the past and also needs to account for the deterioration of fuel efficiency thatoccurs due to usage of vehicle over a period of time. Unlike the new fleet, information for in-use fleet is much more difficultto access and needs to be estimated using user-reported values.
Annual mileage is another major parameter indicating the usage of vehicle for which no sources are available. Based onthe type of vehicle and its usage, annual mileage varies significantly. For instance, buses and trucks used for commercial
Fig. 1. Timeline of emission standards implemented in Delhi and its neighbouring cities.
Please cite this article in press as: Goel, R., et al. Assessment of motor vehicle use characteristics in three Indian cities. Transport. Res. PartD (2015), http://dx.doi.org/10.1016/j.trd.2015.05.006
R. Goel et al. / Transportation Research Part D xxx (2015) xxx–xxx 3
inter-city purpose have much higher mileage than private vehicles. In addition, unlike fuel efficiency, the annual mileagevalue will vary for different cities as a result of the size of the city and other factors affecting the usage of vehicles.
Methods for estimating vehicle use parameters
In India, there are no studies conducted by government agencies which investigate vehicular use parameters – size ofin-use fleet, fuel efficiency, and annual mileage – which are crucial inputs for estimates of energy consumption and vehicularemissions. In contrast, in high-income countries such as the USA, the UK, France, Australia, and Japan, national authoritiescarry out field surveys of drivers for estimating fuel efficiency and annual mileage (Schipper, 2008). In low andmiddle-income countries, there have been very few attempts to estimate vehicular characteristics (Barth et al., 2007; Huoet al., 2009). These studies reported counts of vehicle types on the road and parking lots, and used only visual inspection.Such studies, however, cannot estimate real-world fuel efficiency values, fuel used, and annual usage rates of vehicles.
There are few examples of online portals that provide estimates of on-road values of fuel efficiency. For Chinese vehicles,Huo et al. (2011) reported an online portal in which Chinese drivers voluntarily post fuel efficiency of their cars. In 2005, theUS Department of Energy and EPA’s fuel economy information website (http://www.fueleconomy.gov) began allowing usersto voluntarily share fuel economy estimates. The ‘‘spritmonitor’’ website (http://www.spritmonitor.de/en/) has a fuel con-sumption database of more than 250,000 vehicles and has been used for various research purposes (Huo et al., 2011).
Given the lack of sources for reliable estimates of parameters in India, we present methods to estimate the three vehicleuse parameters, fuel-use distribution and age distribution of vehicles for three cities of India – Delhi, Visakhapatnam andRajkot. The methods include a combination of data obtained from primary surveys in the three cities and from secondarysources.
Data and methods
The study was conducted in three cities– Delhi, Vishakhapatnam, and Rajkot with 2011 populations of 16.7 million, 1.7million, and 1.5 million, respectively (Census-India, 2012). Delhi is the capital of India and located in the north, Rajkot in themid-west, and Vishakhapatnam on the south-east coast of the country. The background statistics of the three cities areshown in Table 1. For the three settings, we collated information from primary surveys, secondary sources, and databasesavailable in the public domain from various ministerial and regulatory groups in the city. For Delhi, the data collectionwas conducted by TRIPP and for Visakhapatnam and Rajkot it was carried out by teams from iTrans Private Limited andCentre for Environmental Planning and Technology University, Ahmedabad (CEPT), respectively.
Fuel station surveys
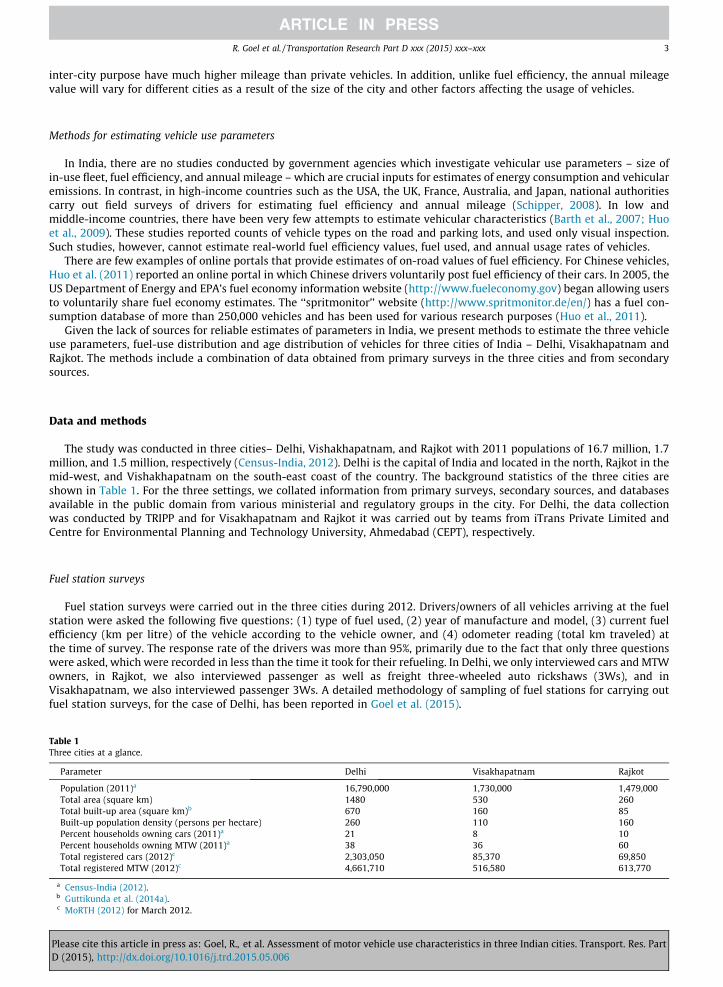
Fuel station surveys were carried out in the three cities during 2012. Drivers/owners of all vehicles arriving at the fuelstation were asked the following five questions: (1) type of fuel used, (2) year of manufacture and model, (3) current fuelefficiency (km per litre) of the vehicle according to the vehicle owner, and (4) odometer reading (total km traveled) atthe time of survey. The response rate of the drivers was more than 95%, primarily due to the fact that only three questionswere asked, which were recorded in less than the time it took for their refueling. In Delhi, we only interviewed cars and MTWowners, in Rajkot, we also interviewed passenger as well as freight three-wheeled auto rickshaws (3Ws), and inVisakhapatnam, we also interviewed passenger 3Ws. A detailed methodology of sampling of fuel stations for carrying outfuel station surveys, for the case of Delhi, has been reported in Goel et al. (2015).
Table 1Three cities at a glance.
Parameter Delhi Visakhapatnam Rajkot
Population (2011)a 16,790,000 1,730,000 1,479,000Total area (square km) 1480 530 260Total built-up area (square km)b 670 160 85Built-up population density (persons per hectare) 260 110 160Percent households owning cars (2011)a 21 8 10Percent households owning MTW (2011)a 38 36 60Total registered cars (2012)c 2,303,050 85,370 69,850Total registered MTW (2012)c 4,661,710 516,580 613,770
a Census-India (2012).b Guttikunda et al. (2014a).c MoRTH (2012) for March 2012.
Please cite this article in press as: Goel, R., et al. Assessment of motor vehicle use characteristics in three Indian cities. Transport. Res. PartD (2015), http://dx.doi.org/10.1016/j.trd.2015.05.006
4 R. Goel et al. / Transportation Research Part D xxx (2015) xxx–xxx
Secondary data sources
In the case of Delhi, we used two additional data sources, the details of which are given in Goel et al. (2015). A vehicledatabase is maintained in the city for vehicles undergoing the Pollution under Control (PUC) test (http://delhitransport-puc.in/). Under PUC program, vehicles more than one year old are required to undergo a pollution check every three months.Starting from 2013, cars and MTW, bought after April 2010, are required to undergo the test only once a year, while vehiclesbought before April 2010, once every three months. Using this database for more than 730,000 vehicles, for year 2010, weestimated age distribution of in-use fleet of cars, MTW, buses, 3Ws, and freight vehicles and proportion of fuel types (petrol,diesel and CNG) used by cars.
Secondly, we used online sales portal of used cars for odometer readings. Recently, a few websites have started offeringused cars exchange service. We used the information from http://www.carwale.com to extract the odometer readings andyear of manufacture for the vehicles registered for sale, in order to estimate the annual mileage of cars. While representativenature of these data cannot be verified, we used this information as a secondary database for further verification of annualmileage in the city. We used odometer readings of 2996 cars.
The two databases are available only for Delhi and not for other two settings as, except a few major metropolitan cities inIndia, most cities do not have similar computerized archival system of PUC database. Also, annual mileage of cars estimatedfrom sales portal of old cars is much lower than those estimated from the fuel station survey. This is possible because vehicleowners making less use of their cars may be more likely to sell them off. Therefore, we did not use similar car sales portal forthe other two cities.
Results
Age profile of vehicles
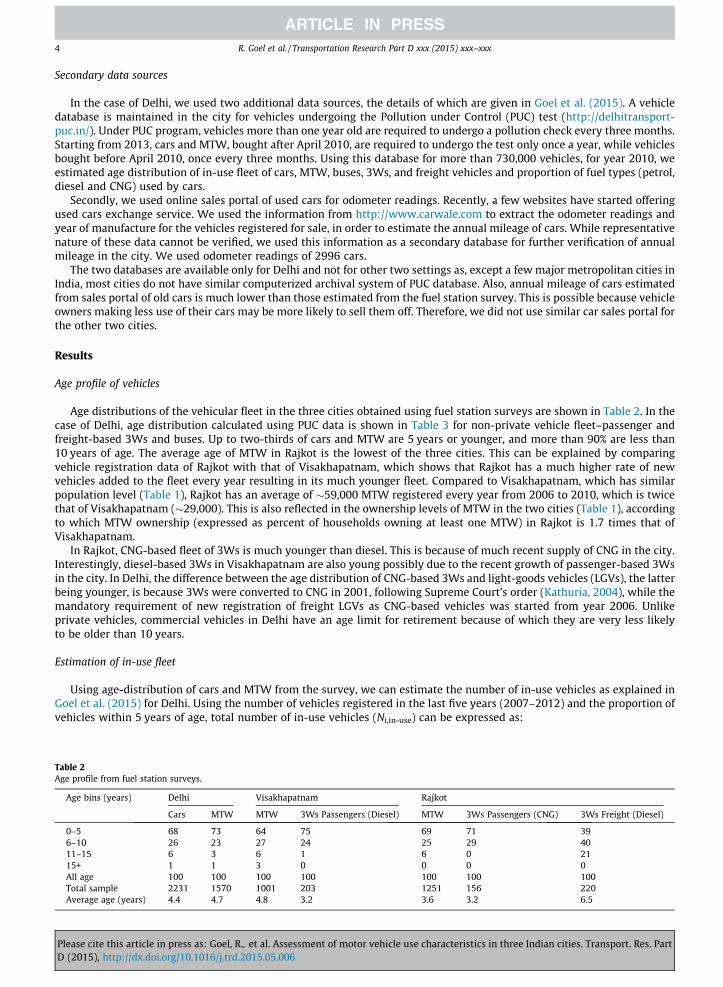
Age distributions of the vehicular fleet in the three cities obtained using fuel station surveys are shown in Table 2. In thecase of Delhi, age distribution calculated using PUC data is shown in Table 3 for non-private vehicle fleet–passenger andfreight-based 3Ws and buses. Up to two-thirds of cars and MTW are 5 years or younger, and more than 90% are less than10 years of age. The average age of MTW in Rajkot is the lowest of the three cities. This can be explained by comparingvehicle registration data of Rajkot with that of Visakhapatnam, which shows that Rajkot has a much higher rate of newvehicles added to the fleet every year resulting in its much younger fleet. Compared to Visakhapatnam, which has similarpopulation level (Table 1), Rajkot has an average of �59,000 MTW registered every year from 2006 to 2010, which is twicethat of Visakhapatnam (�29,000). This is also reflected in the ownership levels of MTW in the two cities (Table 1), accordingto which MTW ownership (expressed as percent of households owning at least one MTW) in Rajkot is 1.7 times that ofVisakhapatnam.
In Rajkot, CNG-based fleet of 3Ws is much younger than diesel. This is because of much recent supply of CNG in the city.Interestingly, diesel-based 3Ws in Visakhapatnam are also young possibly due to the recent growth of passenger-based 3Wsin the city. In Delhi, the difference between the age distribution of CNG-based 3Ws and light-goods vehicles (LGVs), the latterbeing younger, is because 3Ws were converted to CNG in 2001, following Supreme Court’s order (Kathuria, 2004), while themandatory requirement of new registration of freight LGVs as CNG-based vehicles was started from year 2006. Unlikeprivate vehicles, commercial vehicles in Delhi have an age limit for retirement because of which they are very less likelyto be older than 10 years.
Estimation of in-use fleet
Using age-distribution of cars and MTW from the survey, we can estimate the number of in-use vehicles as explained inGoel et al. (2015) for Delhi. Using the number of vehicles registered in the last five years (2007–2012) and the proportion ofvehicles within 5 years of age, total number of in-use vehicles (Ni,in-use) can be expressed as:
Table 2Age pro
Age
0–56–1011–115+All aTotaAver
PleaseD (201
file from fuel station surveys.
bins (years) Delhi Visakhapatnam Rajkot
Cars MTW MTW 3Ws Passengers (Diesel) MTW 3Ws Passengers (CNG) 3Ws Freight (Diesel)
68 73 64 75 69 71 3926 23 27 24 25 29 40
5 6 3 6 1 6 0 211 1 3 0 0 0 0
ge 100 100 100 100 100 100 100l sample 2231 1570 1001 203 1251 156 220age age (years) 4.4 4.7 4.8 3.2 3.6 3.2 6.5
cite this article in press as: Goel, R., et al. Assessment of motor vehicle use characteristics in three Indian cities. Transport. Res. Part5), http://dx.doi.org/10.1016/j.trd.2015.05.006
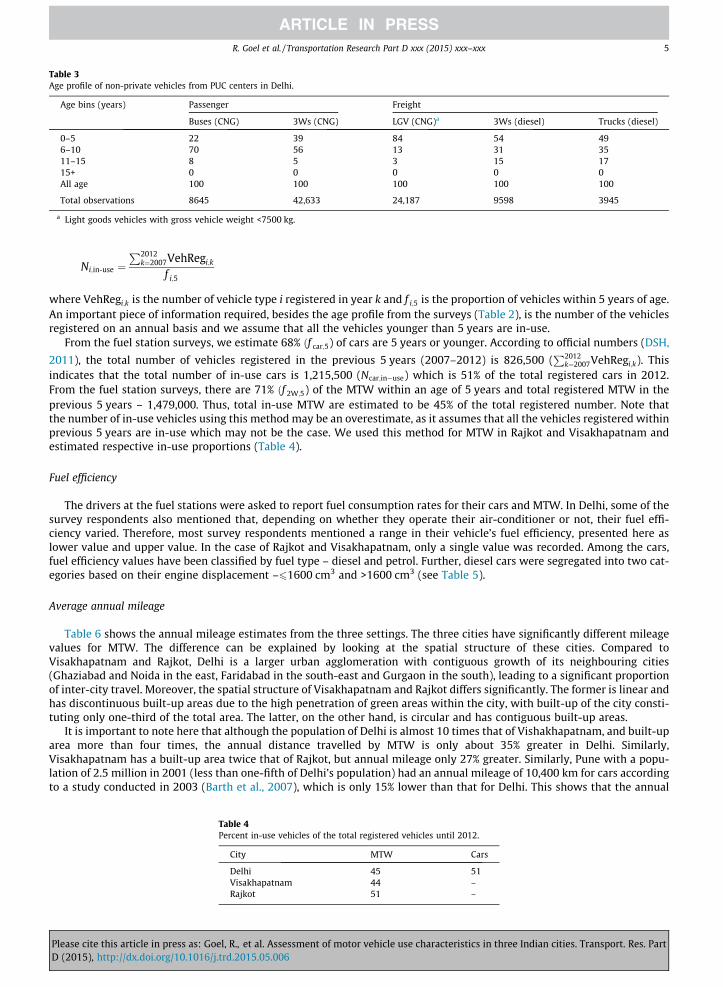
Table 3Age profile of non-private vehicles from PUC centers in Delhi.
Age bins (years) Passenger Freight
Buses (CNG) 3Ws (CNG) LGV (CNG)a 3Ws (diesel) Trucks (diesel)
0–5 22 39 84 54 496–10 70 56 13 31 3511–15 8 5 3 15 1715+ 0 0 0 0 0All age 100 100 100 100 100
Total observations 8645 42,633 24,187 9598 3945
a Light goods vehicles with gross vehicle weight <7500 kg.
R. Goel et al. / Transportation Research Part D xxx (2015) xxx–xxx 5
PleaseD (201
Ni;in-use ¼P2012
k¼2007VehRegi;k
f i;5
where VehRegi;k is the number of vehicle type i registered in year k and f i;5 is the proportion of vehicles within 5 years of age.An important piece of information required, besides the age profile from the surveys (Table 2), is the number of the vehiclesregistered on an annual basis and we assume that all the vehicles younger than 5 years are in-use.
From the fuel station surveys, we estimate 68% ðf car;5) of cars are 5 years or younger. According to official numbers (DSH,
2011), the total number of vehicles registered in the previous 5 years (2007–2012) is 826,500 (P2012
k¼2007VehRegi;k). Thisindicates that the total number of in-use cars is 1,215,500 (Ncar;in�use) which is 51% of the total registered cars in 2012.From the fuel station surveys, there are 71% ðf 2W;5) of the MTW within an age of 5 years and total registered MTW in theprevious 5 years – 1,479,000. Thus, total in-use MTW are estimated to be 45% of the total registered number. Note thatthe number of in-use vehicles using this method may be an overestimate, as it assumes that all the vehicles registered withinprevious 5 years are in-use which may not be the case. We used this method for MTW in Rajkot and Visakhapatnam andestimated respective in-use proportions (Table 4).
Fuel efficiency
The drivers at the fuel stations were asked to report fuel consumption rates for their cars and MTW. In Delhi, some of thesurvey respondents also mentioned that, depending on whether they operate their air-conditioner or not, their fuel effi-ciency varied. Therefore, most survey respondents mentioned a range in their vehicle’s fuel efficiency, presented here aslower value and upper value. In the case of Rajkot and Visakhapatnam, only a single value was recorded. Among the cars,fuel efficiency values have been classified by fuel type – diesel and petrol. Further, diesel cars were segregated into two cat-egories based on their engine displacement –61600 cm3 and >1600 cm3 (see Table 5).
Average annual mileage
Table 6 shows the annual mileage estimates from the three settings. The three cities have significantly different mileagevalues for MTW. The difference can be explained by looking at the spatial structure of these cities. Compared toVisakhapatnam and Rajkot, Delhi is a larger urban agglomeration with contiguous growth of its neighbouring cities(Ghaziabad and Noida in the east, Faridabad in the south-east and Gurgaon in the south), leading to a significant proportionof inter-city travel. Moreover, the spatial structure of Visakhapatnam and Rajkot differs significantly. The former is linear andhas discontinuous built-up areas due to the high penetration of green areas within the city, with built-up of the city consti-tuting only one-third of the total area. The latter, on the other hand, is circular and has contiguous built-up areas.
It is important to note here that although the population of Delhi is almost 10 times that of Vishakhapatnam, and built-uparea more than four times, the annual distance travelled by MTW is only about 35% greater in Delhi. Similarly,Visakhapatnam has a built-up area twice that of Rajkot, but annual mileage only 27% greater. Similarly, Pune with a popu-lation of 2.5 million in 2001 (less than one-fifth of Delhi’s population) had an annual mileage of 10,400 km for cars accordingto a study conducted in 2003 (Barth et al., 2007), which is only 15% lower than that for Delhi. This shows that the annual
Table 4Percent in-use vehicles of the total registered vehicles until 2012.
City MTW Cars
Delhi 45 51Visakhapatnam 44 –Rajkot 51 –
cite this article in press as: Goel, R., et al. Assessment of motor vehicle use characteristics in three Indian cities. Transport. Res. Part5), http://dx.doi.org/10.1016/j.trd.2015.05.006
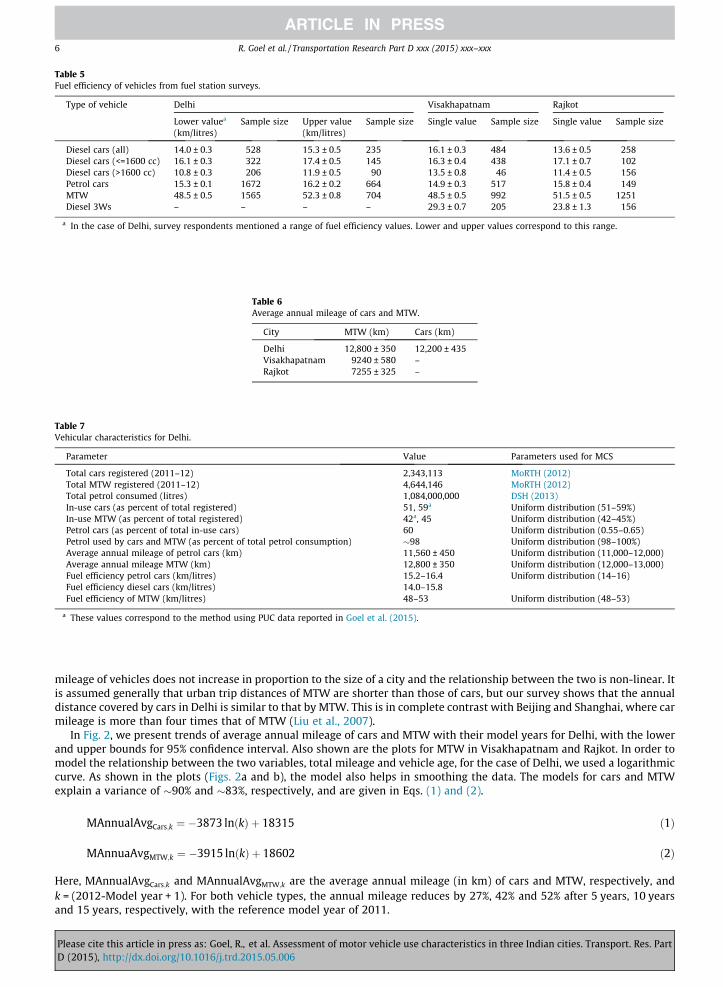
Table 5Fuel efficiency of vehicles from fuel station surveys.
Type of vehicle Delhi Visakhapatnam Rajkot
Lower valuea
(km/litres)Sample size Upper value
(km/litres)Sample size Single value Sample size Single value Sample size
Diesel cars (all) 14.0 ± 0.3 528 15.3 ± 0.5 235 16.1 ± 0.3 484 13.6 ± 0.5 258Diesel cars (<=1600 cc) 16.1 ± 0.3 322 17.4 ± 0.5 145 16.3 ± 0.4 438 17.1 ± 0.7 102Diesel cars (>1600 cc) 10.8 ± 0.3 206 11.9 ± 0.5 90 13.5 ± 0.8 46 11.4 ± 0.5 156Petrol cars 15.3 ± 0.1 1672 16.2 ± 0.2 664 14.9 ± 0.3 517 15.8 ± 0.4 149MTW 48.5 ± 0.5 1565 52.3 ± 0.8 704 48.5 ± 0.5 992 51.5 ± 0.5 1251Diesel 3Ws – – – – 29.3 ± 0.7 205 23.8 ± 1.3 156
a In the case of Delhi, survey respondents mentioned a range of fuel efficiency values. Lower and upper values correspond to this range.
Table 6Average annual mileage of cars and MTW.
City MTW (km) Cars (km)
Delhi 12,800 ± 350 12,200 ± 435Visakhapatnam 9240 ± 580 –Rajkot 7255 ± 325 –
Table 7Vehicular characteristics for Delhi.
Parameter Value Parameters used for MCS
Total cars registered (2011–12) 2,343,113 MoRTH (2012)Total MTW registered (2011–12) 4,644,146 MoRTH (2012)Total petrol consumed (litres) 1,084,000,000 DSH (2013)In-use cars (as percent of total registered) 51, 59a Uniform distribution (51–59%)In-use MTW (as percent of total registered) 42a, 45 Uniform distribution (42–45%)Petrol cars (as percent of total in-use cars) 60 Uniform distribution (0.55–0.65)Petrol used by cars and MTW (as percent of total petrol consumption) �98 Uniform distribution (98–100%)Average annual mileage of petrol cars (km) 11,560 ± 450 Uniform distribution (11,000–12,000)Average annual mileage MTW (km) 12,800 ± 350 Uniform distribution (12,000–13,000)Fuel efficiency petrol cars (km/litres) 15.2–16.4 Uniform distribution (14–16)Fuel efficiency diesel cars (km/litres) 14.0–15.8Fuel efficiency of MTW (km/litres) 48–53 Uniform distribution (48–53)
a These values correspond to the method using PUC data reported in Goel et al. (2015).
6 R. Goel et al. / Transportation Research Part D xxx (2015) xxx–xxx
mileage of vehicles does not increase in proportion to the size of a city and the relationship between the two is non-linear. Itis assumed generally that urban trip distances of MTW are shorter than those of cars, but our survey shows that the annualdistance covered by cars in Delhi is similar to that by MTW. This is in complete contrast with Beijing and Shanghai, where carmileage is more than four times that of MTW (Liu et al., 2007).
In Fig. 2, we present trends of average annual mileage of cars and MTW with their model years for Delhi, with the lowerand upper bounds for 95% confidence interval. Also shown are the plots for MTW in Visakhapatnam and Rajkot. In order tomodel the relationship between the two variables, total mileage and vehicle age, for the case of Delhi, we used a logarithmiccurve. As shown in the plots (Figs. 2a and b), the model also helps in smoothing the data. The models for cars and MTWexplain a variance of �90% and �83%, respectively, and are given in Eqs. (1) and (2).
PleaseD (201
MAnnualAvgCars;k ¼ �3873 lnðkÞ þ 18315 ð1Þ
MAnnuaAvgMTW;k ¼ �3915 lnðkÞ þ 18602 ð2Þ
Here, MAnnualAvgCars;k and MAnnualAvgMTW;k are the average annual mileage (in km) of cars and MTW, respectively, andk = (2012-Model year + 1). For both vehicle types, the annual mileage reduces by 27%, 42% and 52% after 5 years, 10 yearsand 15 years, respectively, with the reference model year of 2011.
cite this article in press as: Goel, R., et al. Assessment of motor vehicle use characteristics in three Indian cities. Transport. Res. Part5), http://dx.doi.org/10.1016/j.trd.2015.05.006
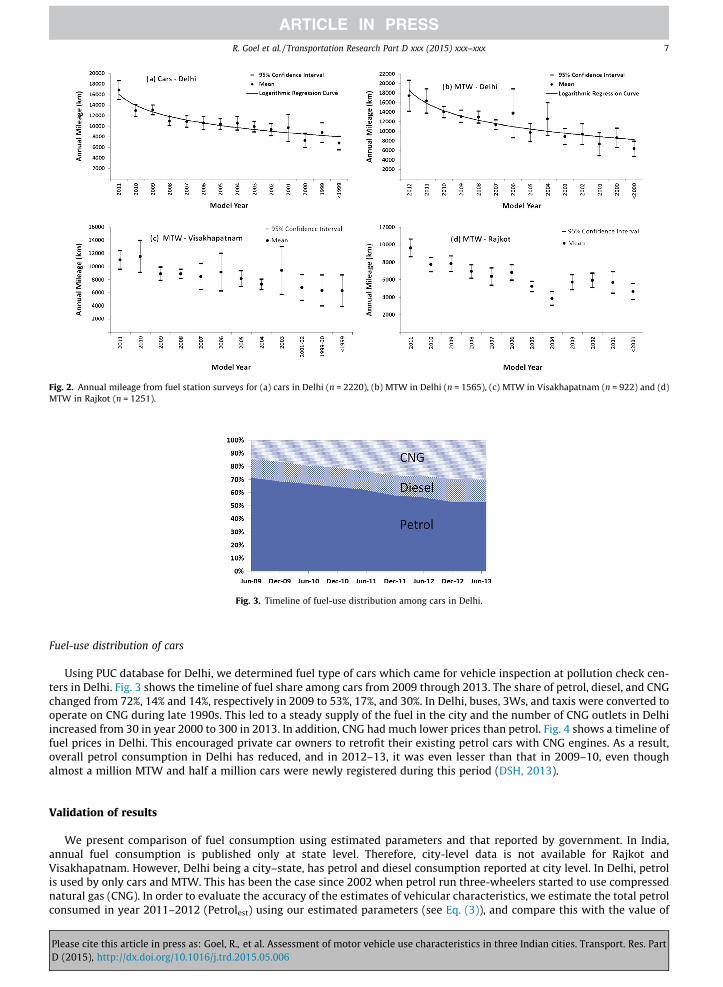
Fig. 2. Annual mileage from fuel station surveys for (a) cars in Delhi (n = 2220), (b) MTW in Delhi (n = 1565), (c) MTW in Visakhapatnam (n = 922) and (d)MTW in Rajkot (n = 1251).
Fig. 3. Timeline of fuel-use distribution among cars in Delhi.
R. Goel et al. / Transportation Research Part D xxx (2015) xxx–xxx 7
Fuel-use distribution of cars
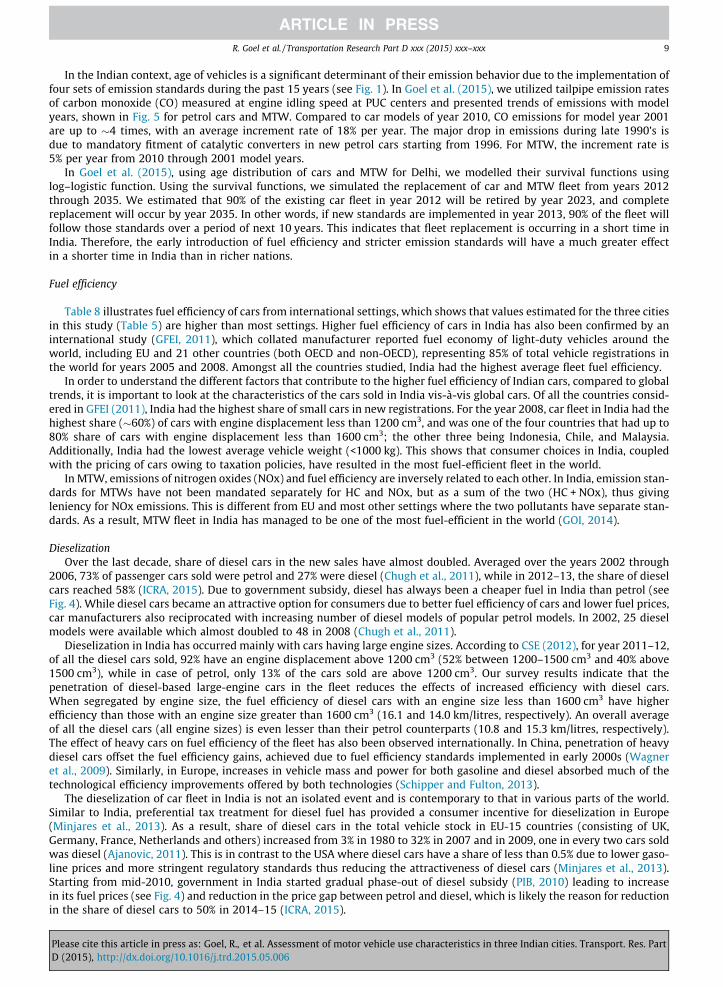
Using PUC database for Delhi, we determined fuel type of cars which came for vehicle inspection at pollution check cen-ters in Delhi. Fig. 3 shows the timeline of fuel share among cars from 2009 through 2013. The share of petrol, diesel, and CNGchanged from 72%, 14% and 14%, respectively in 2009 to 53%, 17%, and 30%. In Delhi, buses, 3Ws, and taxis were converted tooperate on CNG during late 1990s. This led to a steady supply of the fuel in the city and the number of CNG outlets in Delhiincreased from 30 in year 2000 to 300 in 2013. In addition, CNG had much lower prices than petrol. Fig. 4 shows a timeline offuel prices in Delhi. This encouraged private car owners to retrofit their existing petrol cars with CNG engines. As a result,overall petrol consumption in Delhi has reduced, and in 2012–13, it was even lesser than that in 2009–10, even thoughalmost a million MTW and half a million cars were newly registered during this period (DSH, 2013).
Validation of results
We present comparison of fuel consumption using estimated parameters and that reported by government. In India,annual fuel consumption is published only at state level. Therefore, city-level data is not available for Rajkot andVisakhapatnam. However, Delhi being a city–state, has petrol and diesel consumption reported at city level. In Delhi, petrolis used by only cars and MTW. This has been the case since 2002 when petrol run three-wheelers started to use compressednatural gas (CNG). In order to evaluate the accuracy of the estimates of vehicular characteristics, we estimate the total petrolconsumed in year 2011–2012 (Petrolest) using our estimated parameters (see Eq. (3)), and compare this with the value of
Please cite this article in press as: Goel, R., et al. Assessment of motor vehicle use characteristics in three Indian cities. Transport. Res. PartD (2015), http://dx.doi.org/10.1016/j.trd.2015.05.006
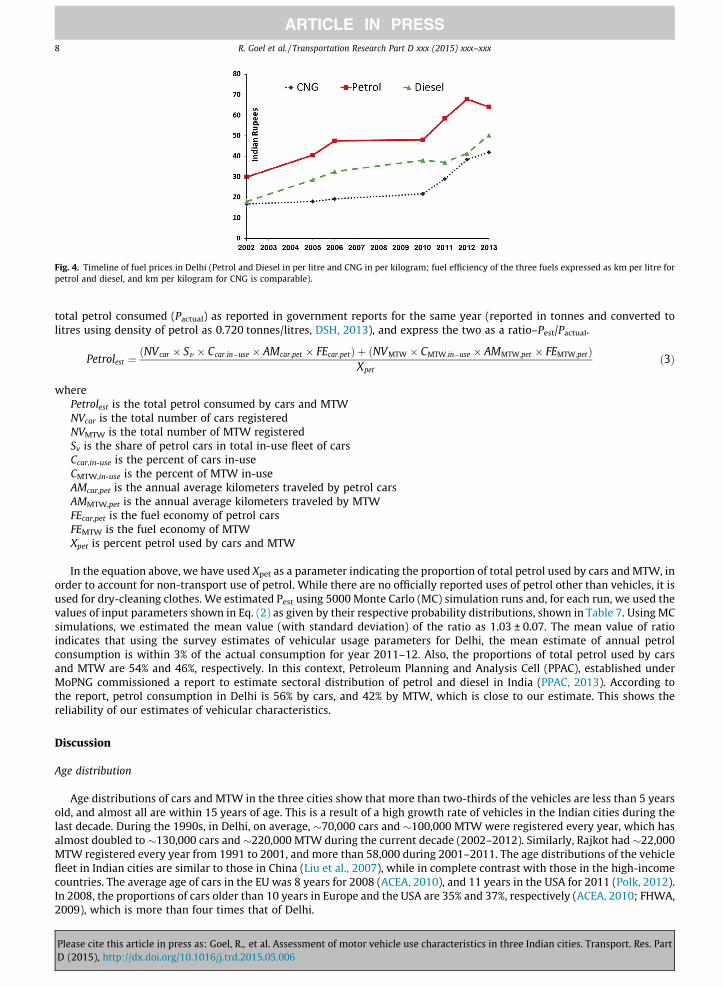
Fig. 4. Timeline of fuel prices in Delhi (Petrol and Diesel in per litre and CNG in per kilogram; fuel efficiency of the three fuels expressed as km per litre forpetrol and diesel, and km per kilogram for CNG is comparable).
8 R. Goel et al. / Transportation Research Part D xxx (2015) xxx–xxx
total petrol consumed (Pactual) as reported in government reports for the same year (reported in tonnes and converted tolitres using density of petrol as 0.720 tonnes/litres, DSH, 2013), and express the two as a ratio–Pest/Pactual.
PleaseD (201
Petrolest ¼ðNVcar � Sv � Ccar;in�use � AMcar;pet � FEcar;petÞ þ ðNVMTW � CMTW;in�use � AMMTW;pet � FEMTW;petÞ
Xpetð3Þ
wherePetrolest is the total petrol consumed by cars and MTWNVcar is the total number of cars registeredNVMTW is the total number of MTW registeredSv is the share of petrol cars in total in-use fleet of carsCcar,in-use is the percent of cars in-useCMTW,in-use is the percent of MTW in-useAMcar,pet is the annual average kilometers traveled by petrol carsAMMTW,pet is the annual average kilometers traveled by MTWFEcar,pet is the fuel economy of petrol carsFEMTW is the fuel economy of MTWXpet is percent petrol used by cars and MTW
In the equation above, we have used Xpet as a parameter indicating the proportion of total petrol used by cars and MTW, inorder to account for non-transport use of petrol. While there are no officially reported uses of petrol other than vehicles, it isused for dry-cleaning clothes. We estimated Pest using 5000 Monte Carlo (MC) simulation runs and, for each run, we used thevalues of input parameters shown in Eq. (2) as given by their respective probability distributions, shown in Table 7. Using MCsimulations, we estimated the mean value (with standard deviation) of the ratio as 1.03 ± 0.07. The mean value of ratioindicates that using the survey estimates of vehicular usage parameters for Delhi, the mean estimate of annual petrolconsumption is within 3% of the actual consumption for year 2011–12. Also, the proportions of total petrol used by carsand MTW are 54% and 46%, respectively. In this context, Petroleum Planning and Analysis Cell (PPAC), established underMoPNG commissioned a report to estimate sectoral distribution of petrol and diesel in India (PPAC, 2013). According tothe report, petrol consumption in Delhi is 56% by cars, and 42% by MTW, which is close to our estimate. This shows thereliability of our estimates of vehicular characteristics.
Discussion
Age distribution
Age distributions of cars and MTW in the three cities show that more than two-thirds of the vehicles are less than 5 yearsold, and almost all are within 15 years of age. This is a result of a high growth rate of vehicles in the Indian cities during thelast decade. During the 1990s, in Delhi, on average, �70,000 cars and �100,000 MTW were registered every year, which hasalmost doubled to �130,000 cars and �220,000 MTW during the current decade (2002–2012). Similarly, Rajkot had �22,000MTW registered every year from 1991 to 2001, and more than 58,000 during 2001–2011. The age distributions of the vehiclefleet in Indian cities are similar to those in China (Liu et al., 2007), while in complete contrast with those in the high-incomecountries. The average age of cars in the EU was 8 years for 2008 (ACEA, 2010), and 11 years in the USA for 2011 (Polk, 2012).In 2008, the proportions of cars older than 10 years in Europe and the USA are 35% and 37%, respectively (ACEA, 2010; FHWA,2009), which is more than four times that of Delhi.
cite this article in press as: Goel, R., et al. Assessment of motor vehicle use characteristics in three Indian cities. Transport. Res. Part5), http://dx.doi.org/10.1016/j.trd.2015.05.006
R. Goel et al. / Transportation Research Part D xxx (2015) xxx–xxx 9
In the Indian context, age of vehicles is a significant determinant of their emission behavior due to the implementation offour sets of emission standards during the past 15 years (see Fig. 1). In Goel et al. (2015), we utilized tailpipe emission ratesof carbon monoxide (CO) measured at engine idling speed at PUC centers and presented trends of emissions with modelyears, shown in Fig. 5 for petrol cars and MTW. Compared to car models of year 2010, CO emissions for model year 2001are up to �4 times, with an average increment rate of 18% per year. The major drop in emissions during late 1990’s isdue to mandatory fitment of catalytic converters in new petrol cars starting from 1996. For MTW, the increment rate is5% per year from 2010 through 2001 model years.
In Goel et al. (2015), using age distribution of cars and MTW for Delhi, we modelled their survival functions usinglog–logistic function. Using the survival functions, we simulated the replacement of car and MTW fleet from years 2012through 2035. We estimated that 90% of the existing car fleet in year 2012 will be retired by year 2023, and completereplacement will occur by year 2035. In other words, if new standards are implemented in year 2013, 90% of the fleet willfollow those standards over a period of next 10 years. This indicates that fleet replacement is occurring in a short time inIndia. Therefore, the early introduction of fuel efficiency and stricter emission standards will have a much greater effectin a shorter time in India than in richer nations.
Fuel efficiency
Table 8 illustrates fuel efficiency of cars from international settings, which shows that values estimated for the three citiesin this study (Table 5) are higher than most settings. Higher fuel efficiency of cars in India has also been confirmed by aninternational study (GFEI, 2011), which collated manufacturer reported fuel economy of light-duty vehicles around theworld, including EU and 21 other countries (both OECD and non-OECD), representing 85% of total vehicle registrations inthe world for years 2005 and 2008. Amongst all the countries studied, India had the highest average fleet fuel efficiency.
In order to understand the different factors that contribute to the higher fuel efficiency of Indian cars, compared to globaltrends, it is important to look at the characteristics of the cars sold in India vis-à-vis global cars. Of all the countries consid-ered in GFEI (2011), India had the highest share of small cars in new registrations. For the year 2008, car fleet in India had thehighest share (�60%) of cars with engine displacement less than 1200 cm3, and was one of the four countries that had up to80% share of cars with engine displacement less than 1600 cm3; the other three being Indonesia, Chile, and Malaysia.Additionally, India had the lowest average vehicle weight (<1000 kg). This shows that consumer choices in India, coupledwith the pricing of cars owing to taxation policies, have resulted in the most fuel-efficient fleet in the world.
In MTW, emissions of nitrogen oxides (NOx) and fuel efficiency are inversely related to each other. In India, emission stan-dards for MTWs have not been mandated separately for HC and NOx, but as a sum of the two (HC + NOx), thus givingleniency for NOx emissions. This is different from EU and most other settings where the two pollutants have separate stan-dards. As a result, MTW fleet in India has managed to be one of the most fuel-efficient in the world (GOI, 2014).
DieselizationOver the last decade, share of diesel cars in the new sales have almost doubled. Averaged over the years 2002 through
2006, 73% of passenger cars sold were petrol and 27% were diesel (Chugh et al., 2011), while in 2012–13, the share of dieselcars reached 58% (ICRA, 2015). Due to government subsidy, diesel has always been a cheaper fuel in India than petrol (seeFig. 4). While diesel cars became an attractive option for consumers due to better fuel efficiency of cars and lower fuel prices,car manufacturers also reciprocated with increasing number of diesel models of popular petrol models. In 2002, 25 dieselmodels were available which almost doubled to 48 in 2008 (Chugh et al., 2011).
Dieselization in India has occurred mainly with cars having large engine sizes. According to CSE (2012), for year 2011–12,of all the diesel cars sold, 92% have an engine displacement above 1200 cm3 (52% between 1200–1500 cm3 and 40% above1500 cm3), while in case of petrol, only 13% of the cars sold are above 1200 cm3. Our survey results indicate that thepenetration of diesel-based large-engine cars in the fleet reduces the effects of increased efficiency with diesel cars.When segregated by engine size, the fuel efficiency of diesel cars with an engine size less than 1600 cm3 have higherefficiency than those with an engine size greater than 1600 cm3 (16.1 and 14.0 km/litres, respectively). An overall averageof all the diesel cars (all engine sizes) is even lesser than their petrol counterparts (10.8 and 15.3 km/litres, respectively).The effect of heavy cars on fuel efficiency of the fleet has also been observed internationally. In China, penetration of heavydiesel cars offset the fuel efficiency gains, achieved due to fuel efficiency standards implemented in early 2000s (Wagneret al., 2009). Similarly, in Europe, increases in vehicle mass and power for both gasoline and diesel absorbed much of thetechnological efficiency improvements offered by both technologies (Schipper and Fulton, 2013).
The dieselization of car fleet in India is not an isolated event and is contemporary to that in various parts of the world.Similar to India, preferential tax treatment for diesel fuel has provided a consumer incentive for dieselization in Europe(Minjares et al., 2013). As a result, share of diesel cars in the total vehicle stock in EU-15 countries (consisting of UK,Germany, France, Netherlands and others) increased from 3% in 1980 to 32% in 2007 and in 2009, one in every two cars soldwas diesel (Ajanovic, 2011). This is in contrast to the USA where diesel cars have a share of less than 0.5% due to lower gaso-line prices and more stringent regulatory standards thus reducing the attractiveness of diesel cars (Minjares et al., 2013).Starting from mid-2010, government in India started gradual phase-out of diesel subsidy (PIB, 2010) leading to increasein its fuel prices (see Fig. 4) and reduction in the price gap between petrol and diesel, which is likely the reason for reductionin the share of diesel cars to 50% in 2014–15 (ICRA, 2015).
Please cite this article in press as: Goel, R., et al. Assessment of motor vehicle use characteristics in three Indian cities. Transport. Res. PartD (2015), http://dx.doi.org/10.1016/j.trd.2015.05.006
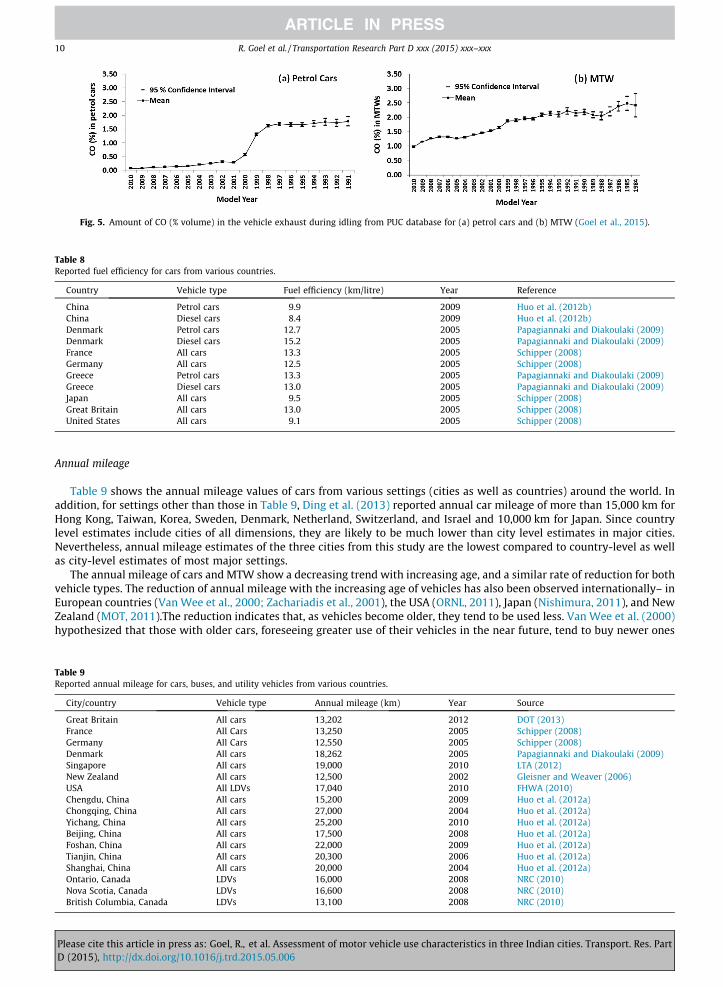
Fig. 5. Amount of CO (% volume) in the vehicle exhaust during idling from PUC database for (a) petrol cars and (b) MTW (Goel et al., 2015).
Table 8Reported fuel efficiency for cars from various countries.
Country Vehicle type Fuel efficiency (km/litre) Year Reference
China Petrol cars 9.9 2009 Huo et al. (2012b)China Diesel cars 8.4 2009 Huo et al. (2012b)Denmark Petrol cars 12.7 2005 Papagiannaki and Diakoulaki (2009)Denmark Diesel cars 15.2 2005 Papagiannaki and Diakoulaki (2009)France All cars 13.3 2005 Schipper (2008)Germany All cars 12.5 2005 Schipper (2008)Greece Petrol cars 13.3 2005 Papagiannaki and Diakoulaki (2009)Greece Diesel cars 13.0 2005 Papagiannaki and Diakoulaki (2009)Japan All cars 9.5 2005 Schipper (2008)Great Britain All cars 13.0 2005 Schipper (2008)United States All cars 9.1 2005 Schipper (2008)
10 R. Goel et al. / Transportation Research Part D xxx (2015) xxx–xxx
Annual mileage
Table 9 shows the annual mileage values of cars from various settings (cities as well as countries) around the world. Inaddition, for settings other than those in Table 9, Ding et al. (2013) reported annual car mileage of more than 15,000 km forHong Kong, Taiwan, Korea, Sweden, Denmark, Netherland, Switzerland, and Israel and 10,000 km for Japan. Since countrylevel estimates include cities of all dimensions, they are likely to be much lower than city level estimates in major cities.Nevertheless, annual mileage estimates of the three cities from this study are the lowest compared to country-level as wellas city-level estimates of most major settings.
The annual mileage of cars and MTW show a decreasing trend with increasing age, and a similar rate of reduction for bothvehicle types. The reduction of annual mileage with the increasing age of vehicles has also been observed internationally– inEuropean countries (Van Wee et al., 2000; Zachariadis et al., 2001), the USA (ORNL, 2011), Japan (Nishimura, 2011), and NewZealand (MOT, 2011).The reduction indicates that, as vehicles become older, they tend to be used less. Van Wee et al. (2000)hypothesized that those with older cars, foreseeing greater use of their vehicles in the near future, tend to buy newer ones
Table 9Reported annual mileage for cars, buses, and utility vehicles from various countries.
City/country Vehicle type Annual mileage (km) Year Source
Great Britain All cars 13,202 2012 DOT (2013)France All Cars 13,250 2005 Schipper (2008)Germany All Cars 12,550 2005 Schipper (2008)Denmark All cars 18,262 2005 Papagiannaki and Diakoulaki (2009)Singapore All cars 19,000 2010 LTA (2012)New Zealand All cars 12,500 2002 Gleisner and Weaver (2006)USA All LDVs 17,040 2010 FHWA (2010)Chengdu, China All cars 15,200 2009 Huo et al. (2012a)Chongqing, China All cars 27,000 2004 Huo et al. (2012a)Yichang, China All cars 25,200 2010 Huo et al. (2012a)Beijing, China All cars 17,500 2008 Huo et al. (2012a)Foshan, China All cars 22,000 2009 Huo et al. (2012a)Tianjin, China All cars 20,300 2006 Huo et al. (2012a)Shanghai, China All cars 20,000 2004 Huo et al. (2012a)Ontario, Canada LDVs 16,000 2008 NRC (2010)Nova Scotia, Canada LDVs 16,600 2008 NRC (2010)British Columbia, Canada LDVs 13,100 2008 NRC (2010)
Please cite this article in press as: Goel, R., et al. Assessment of motor vehicle use characteristics in three Indian cities. Transport. Res. PartD (2015), http://dx.doi.org/10.1016/j.trd.2015.05.006
R. Goel et al. / Transportation Research Part D xxx (2015) xxx–xxx 11
that are more comfortable as well as energy-efficient. In addition, being more fuel-efficient and less costly per kilometer dri-ven, newer cars tend to be driven even more.
Conclusions
In this study, we report three vehicular use parameters– in-use fleet size, annual mileage (vehicle kilometers per year),and fuel efficiency of cars and MTW for Delhi, and except fleet size and annual mileage of cars, for Visakhapatnam as well asRajkot. According to our estimates, cumulative number of registered cars and MTW in Indian cities, reported by officialsources, overestimates the actual number of in-use vehicles by up to 120%. Even though the cities differ from each otherin terms of population size as well as vehicle ownership (see Table 1), we found consistencies in the results such as agedistribution, fuel efficiency values as well as in-use proportion. Therefore, it is likely that the results from this study aregeneralizable for various other cities.
The fuel efficiency of cars in India is one of the highest compared to countries like China, Japan, Germany, and the USA.Annual mileage of cars and MTW in Indian cities is much lower than those reported from most countries in Europe, NorthAmerica as well as Asia, and have a non-linear relationship with the size of the city. While Delhi is more than 4 times largerin built-up than Visakhapatnam and 10 times larger in population size, the annual mileage per year was only 35% time larger.The average age of cars and MTW in the three cities indicate that the vehicle fleet in Indian cities is similar to that in Chinaand is much younger than in high-income countries of the EU and in the USA, where the average age of cars is 8 years and11 years, respectively. According to the survival functions for cars and MTW, 90% of the fleet will be replaced over a period ofnext 10 years. These data suggest that it is possible for India to have one of the most fuel-efficient vehicle fleets in the worldin the future if fuel-efficiency standards are implemented and fiscal policies introduced to contain the growing dieselizationof car fleet.
The parameters estimated in this study are crucial inputs for bottom-up emission inventory estimates of vehicular fleet.We used these parameters for emission estimates in Goel and Guttikunda (2015) for Delhi and Guttikunda et al. (2014b) forVisakhapatnam. The three cities in this study belonged to the 53 cities in India with a population of more than a million inyear 2011, with Delhi being a megacity (Census-India, 2012). If similar studies are conducted for smaller settings, a range ofvehicular use parameters can be estimated for cities with varying population sizes. Such a database can be used to estimatenational level consumption of fuels as well as emissions from road transport sector.
Acknowledgements
The research for this paper was supported from UNEP project ‘‘Promoting Low Carbon Transport in India’’ which wasfunded by the German government (BMU) under the International Climate Initiative. Rahul Goel and Sarath Guttikunda werepartially funded by PURGE project funded by the European Commission by its 7th Framework Programme under the GrantAgreement No. 265325. We would also like to acknowledge the support from Mr. Mahesh Rajput, Mr. Vijay Prajapati,Mr. Digvijay Singh, Mr. Dheeraj Swaroop, Mr. Karan Vir, and Mr. Mahesh Gaur (Indian Institute of Technology Delhi),Mr. Ravi Gadepalli (iTrans Private Limited, Delhi), Ms. Kalgi Shah and Dr. Talat Munshi (Centre for EnvironmentalPlanning and Technology University, Ahmedabad).
References
ACEA, 2010. The Automobile Industry Pocket Guide 2010. European Automobile Manufacturers’ Association, Brussels.ACEA, 2013. The Automobile Industry Pocket Guide 2013. European Automobile Manufacturers’ Association, Brussels.Ajanovic, A., 2011. The Effects of Dieselization of the European Passenger Car Fleet on Energy Consumption and CO2 Emissions. Energy Economics Group,
Vienna University of Technology, Gusshaustr.Anilovich, I., Hakkert, A.S., 1996. Survey of vehicle emissions in Israel related to vehicle age and periodic inspection. Sci. Total Environ. 189, 197–203.Barth, M., Davis, N., Lents, J., Nikkila, N., 2007. Vehicle activity patterns and emissions in Pune, India. Transp. Res. Rec.: J. Transp. Res. Board 2038, 156–166.Census-India, 2012. Census of India 2011. The Government of India, New Delhi, India.Chugh, R., Cropper, M., Narain, U., 2011. The cost of fuel economy in the Indian passenger vehicle market. Energy Policy 39 (11), 7174–7183.CSE, 2012. Parking Policy: Getting the Principles Right, Policy Brief, Center for Science and Environment, New Delhi, India.Ding, Y., Shen, W., Yang, S., Han, W., Chai, Q., 2013. Car dieselization: a solution to China’s energy security? Energy Policy 62, 540–549.DOT, 2013. National Travel Survey: 2012. Statistical Release. Department of Transport, Government of UK. Accessed online from <https://www.gov.
uk/government/uploads/system/uploads/attachment_data/file/243957/nts2012-01.pdf>.DSH, 2011. Delhi Statistical Handbook 2011. Directorate of Economics and Statistics, the Government of National Capital Territory of Delhi, New Delhi,
India.DSH, 2013. Delhi Statistical Handbook 2013. Directorate of Economics and Statistics, the Government of National Capital Territory of Delhi, New Delhi,
India.FHWA, 2010. Annual Vehicle Distance Traveled in Miles and Related Data 2010. US Department of Transportation, Federal Highway Administration,
Washington, DC. Accessed online from <http://www.fhwa.dot.gov/policyinformation/statistics/2010/pdf/vm1.pdf>.GFEI, 2011. International comparison of light-duty vehicle fuel economy and related characteristics, Working Paper 5/10. Global Fuel Economy Initiative,
International Energy Agency, Paris, France.GFEI, 2014. Fuel economy state of the world 2014. Global Fuel Economy Initiative, UK.Gleisner, B., Weaver, S., 2006. Cars, carbon, and Kyoto: evaluating an emission charge and other policy instruments as incentives for a transition to hybrid
cars in New Zealand. Kotuitui. New Zealand J. Soc. Sci. Online 1, 81–89.Goel, R., Guttikunda, S.K., 2015. Evolution of on-road vehicle exhaust emissions in Delhi. Atmospheric Environ., 105, 78–90.Goel, R., Guttikunda, S.K., Mohan, D., Tiwari, G., 2015. Benchmarking vehicle and passenger travel characteristics in Delhi for on-road emissions analysis.
Travel Behav. Soc. 2 (2), 88–101.
Please cite this article in press as: Goel, R., et al. Assessment of motor vehicle use characteristics in three Indian cities. Transport. Res. PartD (2015), http://dx.doi.org/10.1016/j.trd.2015.05.006
12 R. Goel et al. / Transportation Research Part D xxx (2015) xxx–xxx
Government of India (GOI), 2003. Auto fuel policy, Ministry of Petroleum and Natural Gas, Government of India, New Delhi.Government of India (GOI), 2011. Expert Group on Low Carbon Strategies for Inclusive Growth - An Interim Report, Planning Commission, New Delhi.Government of India (GOI), 2014. Auto fuel vision and policy 2025, Report of the expert committee, Accessed online from <petroleum.nic.in/docs/autopol.
pdf>.Guttikunda, S.K., Goel, R., Pant, P., 2014a. Nature of air pollution, emission sources, and management in the Indian Cities. Atmospheric Environ. 95, 501–510.Guttikunda, S.K., Goel, R., Mohan, D., Tiwari, G., Gadepalli, R., 2014b. Particulate and gaseous emissions in two coastal cities—Chennai and Vishakhapatnam,
India. Air Qual., Atmos. Health, 1–14.Huo, H., Zhang, Q., He, K., Wang, Q., Yao, Z., Streets, D.G., 2009. High-resolution vehicular emission inventory using a link-based method: a case study of
light-duty vehicles in Beijing. Environ. Sci. Technol. 43 (7), 2394–2399.Huo, H., Yao, Z., He, K., Yu, X., 2011. Fuel consumption rates of passenger cars in China: labels versus real-world. Energy Policy 39 (11), 7130–7135.Huo, H., He, K., Wang, M., Yao, Z., 2012a. Vehicle technologies, fuel-economy policies, and fuel-consumption rates of Chinese vehicles. Energy Policy 43, 30–
36.Huo, H., Zhang, Q., He, K., Yao, Z., Wang, M., 2012b. Vehicle-use intensity in China: current status and future trend. Energy Policy 43, 6–16.ICCT, 2014. A 2014 update of official and ‘‘real-world’’ fuel consumption and CO2 values for passenger cars in Europe, White Paper, International Council on
Clean Transportation Europe, Berlin.ICET, 2011. Global overview on fuel efficiency and motor vehicle emission standards: policy options and perspectives for international cooperation, The
Innovations Center for Energy and Transportation, United Nations Background Paper 3.ICRA, 2015. Indian automobile industry-passenger vehicle and commercial vehicle volume trends & outlook – in view of reduction in fuel prices & changes
in excise duty, ICRA Research Services, ICRA Limited.Iyer, N., 2012. A Technical Assessment of Emissions and Fuel Consumption Reduction Potential from Two and Three Wheelers in India. The International
Council on Clean Transportation, San Francisco, USA.Kathuria, V., 2004. Impact of CNG on vehicular pollution in Delhi: a note. Transp. Res. Part D: Transport Environ. 9 (5), 409–417.Liu, H., He, K., Wang, Q., Huo, H., Lents, J., Davis, N., He, C., 2007. Comparison of vehicle activity and emission inventory between Beijing and Shanghai. J. Air
Waste Manage. Assoc. 57 (10), 1172–1177.Lok Sabha, 2013. Petroleum Prices, Parliament library and reference, research, documentation and information service, Reference Note, No.7/RN/Ref./2013,
Lok Sabha Secretariat, New Delhi.LTA, 2012. Singapore Land Transport Statistics in Brief 2012. Land Transport Authority, Singapore. Accessed online from <http://www.lta.gov.
sg/content/dam/ltaweb/corp/PublicationsResearch/files/FactsandFigures/Stats_in_Brief_2012.pdf>.Minjares, R., Blumberg, K., Posada Sanchez, F., 2013. Alignment of policies to maximize the climate benefits of diesel vehicles through control of particulate
matter and black carbon emissions. Energy Policy 54, 54–61.Mohan, D., Tsimhoni, O., Sivak, M., Flannagan, M.J., 2009. Road Safety in India: Challenges and Opportunities. Transportation Research Institute, The
University of Michigan, Ann Arbor, USA.MoPNG, 2008. Section 3: Petroleum Products in India, Energy Statistics 2007, Ministry of Statistics and Programme Implementation, New Delhi, Accessed
online from <http://mospi.nic.in/Mospi_New/site/inner.aspx?status=3&menu_id=118>.MoPNG, 2011. Indian Petroleum and Natural Gas Statistics (2010–11). Economic Division, Ministry of Petroleum and Natural Gas, Government of India, New
Delhi.MoRTH, 2012. Road Transport Year Book 2011–12. Transport Research Wing, Ministry of Road Transport & Highways, Government of India, New Delhi.MOT, 2011. Aging of the Light Vehicle Fleet, Ministry of Transport, New Zealand, New Zealand.Nishimura, E., 2011. Assessing the Fuel Use and Greenhouse Gas Emissions of Future Light-Duty Vehicles in Japan. Master of Science in Technology and
Policy Engineering System Division, Massachusetts Institute of Technology.NRC, 2010. 2008 Canadian Vehicle Survey. Accessed online from <http://oee.nrcan.gc.ca/publications/statistics/cvs08/pdf/cvs08.pdf> Office of Energy
Efficiency, Natural Resources Canada, Ottawa, Canada.Ntziachristos, L., Samaras, Z., 2000. Speed-dependent representative emission factors for catalyst passenger cars and influencing parameters. Atmos.
Environ. 34 (27), 4611–4619.ORNL, 2011. Developing a best estimate of annual vehicle mileage for 2009 NHTS vehicles, Federal Highway Administration, National Household Travel
Survey.Papagiannaki, K., Diakoulaki, D., 2009. Decomposition analysis of CO2 emissions from passenger cars: the cases of Greece and Denmark. Energy Policy 37,
3259–3267.PIB, 2009. Mandatory fuel efficiency standard to be implemented in two years, Press Information Bureau, Government of India, Release ID: 52216, Accessed
online from <http://pib.nic.in/newsite/erelease.aspx?relid=52216>.PIB, 2010. Petrol prices deregulated, marginal increase in HSD, PDS kerosene and domestic LPG prices, Press Information Bureau, Government of India,
Release ID: 52216, Accessed online from <http://www.pib.nic.in/newsite/erelease.aspx?relid=62834>.Polk, 2012. Average age of vehicles reaches record high, according to Polk. Accessed online from <https://www.polk.com/company/news/average_age_of_
vehicles_reaches_record_high_according_to_polk>, Polk, Southfield, Michigan, US.PPAC, 2013. All India study on sectoral demand of diesel and petrol, petroleum planning and analysis cell, Ministry of Petroleum and Natural Gas,
Government of India, New Delhi.Schipper, L., 2008. Automobile Fuel Economy and CO2 Emissions in Industrialized Countries: Troubling Trends Through 2005/6. University of California,
Transportation Center.Schipper, L., Fulton, L., 2013. Dazzled by diesel? The impact on carbon dioxide emissions of the shift to diesels in Europe through 2009. Energy Policy 54, 3–
10.Schipper, L., Tax, W., 1994. New car test and actual fuel economy: yet another gap? Transport Policy 1, 257–265.Schipper, L., Marie-Lilliu, C., Gorham, R., 2000. Flexing the Link between Transport and Greenhouse Gas Emissions-A Path for the World Bank.Van Wee, B., Moll, H.C., Dirks, J., 2000. Environmental impact of scrapping old cars. Transp. Res. Part D: Transport Environ. 5 (2), 137–143.Wagner, D.V., An, F., Wang, C., 2009. Structure and impacts of fuel economy standards for passenger cars in China. Energy Policy 37 (10), 3803–3811.Yan, F., Winijkul, E., Jung, S., Bond, T.C., Streets, D.G., 2011. Global emission projections of particulate matter (PM): I. Exhaust emissions from on-road
vehicles. Atmos. Environ. 45, 4830–4844.Zachariadis, T., 2006. On the baseline evolution of automobile fuel economy in Europe. Energy Policy 34, 1773–1785.Zachariadis, T., Ntziachristos, L., Samaras, Z., 2001. The effect of age and technological change on motor vehicle emissions. Transp. Res. Part D: Transport
Environ. 6 (3), 221–227.
Please cite this article in press as: Goel, R., et al. Assessment of motor vehicle use characteristics in three Indian cities. Transport. Res. PartD (2015), http://dx.doi.org/10.1016/j.trd.2015.05.006