Embed Size (px)
Citation preview
Assessment of Mercury Contamination in Surficial Sediments of Newark Bay
by Alexander F. Gregory
Advisor: Professor Nickolas J. Themelis
Submitted in partial fulfIllment of the requirements for the degree of Master of Science in Earth Resources Engineering
Department of Earth and Environmental Engineering (Henry Krumb School of Mines)
Fu Foundation School of Engineering and Applied Science Columbia University
November 2001
EARTH ENGINEERING! Center
.. . I Columbia University I
Assessment of Mercury Contamination in Surficial Sediments of Newark Bay
by Alexander F. Gregory
Advisor: Nickolas J. Themelis
Department of Earth and Environmental Engineering (Henry Krumb School of Mines)
Fu Foundation School of Engineering and Applied Science Columbia University
EXECUTIVE SUMMARY
This study of mercury contamination in Newark Bay sediments was initiated from a broader study of mercury sources and material balance in the New York-New Jersey Harbor, conducted for the New York Academy of Sciences' Harbor Consortium by Themelis and Gregory (2001). The author of this report concluded that a more in-depth study should be conducted on a smaller area within the Harbor where mercury contamination has been historically significant. This conclusion was also based on results from a recent study by Gregory and Gorokovich (200 I), where geographic information systems (GIS) technology was used to visualize the high Hg concentrations in Newark Bay surficial sediments from 1988 to 2000. As a result, it was determined that this study should include a discussion of a) health risks associated with mercury exposure originating in aquatic environments, b) sediment and water quality characteristics that influence mercury methylation, c) source of Hg contamination to Newark Bay, and d) assessment of mercury contamination of Newark Bay sediments.
Newark Bay was chosen as the study area because it has historically contained some of the most anthropogenically enriched Hg sediments compared to the rest of the NYINJ Harbor. Furthermore, most Hg-related industries in the Hudson-Raritan (HRB) were historically concentrated within the Newark Bay vicinity. Municipal wastewater treatment plants (WWTP) were the next largest point source contributors of mercury to Newark Bay. Tributary flow from the Hackensack and Passaic Rivers and tidal flow from the Arthur Kill and Kill Van Kull transported these plant effluent discharges into Newark Bay. However, NJ DEP reported significant reductions in WWTP emissions between 1987 and 1998. These reductions are most likely attributed to the phasing out of mercury in industrial applications, and possibly improved Hg recovery techniques by enzymatic
reduction of soluble divalent mercury (Hg2) to insoluble elemental mercury (Hgo) by
mercury resistant bacteria. The sediment analysis using geographic information systems (GIS) demonstrated
that Newark Bay surficial sediments had high mercury concentrations relative to the rest of the Harbor over a twelve-year period (1988-2000). This method of analysis was useful in identifying sites of potentially high methyl Hg production based on the presentation of Hg and total organic carbon data in Newark Bay. However, it was not capable of modeling Hg methylation given the data deficiencies and technical limitations. Surficial
sediments were chosen as the medium of analysis because the most intense biogeochemical activity occurs at the surface layer where deposited metals participate in a variety of processes including sulfate reduction, which is the principal means of mercury methylation in estuarine sediments.
In summary, the state of mercury contamination within the Newark Bay sediments is not clearly understood. Based on the findings from this investigation, it is recommended that future studies of mercury contamination in surficial sediments in Newark Bay fill in existing data gaps by means of additional sampling. Future studies should also sample and analyze for the sulfate and sulfide content, which are necessary for estimating the mercury methylation and sulfate reducing rates. It is recommended that sampling be conducted on a long-term periodic basis taking into account both vertical (sediment cores) and horizontal sediment distributions. Establishing better trends is essential for determining whether remediation is necessary and also the form of remediation (natural, dredging, or chemicallbiological).
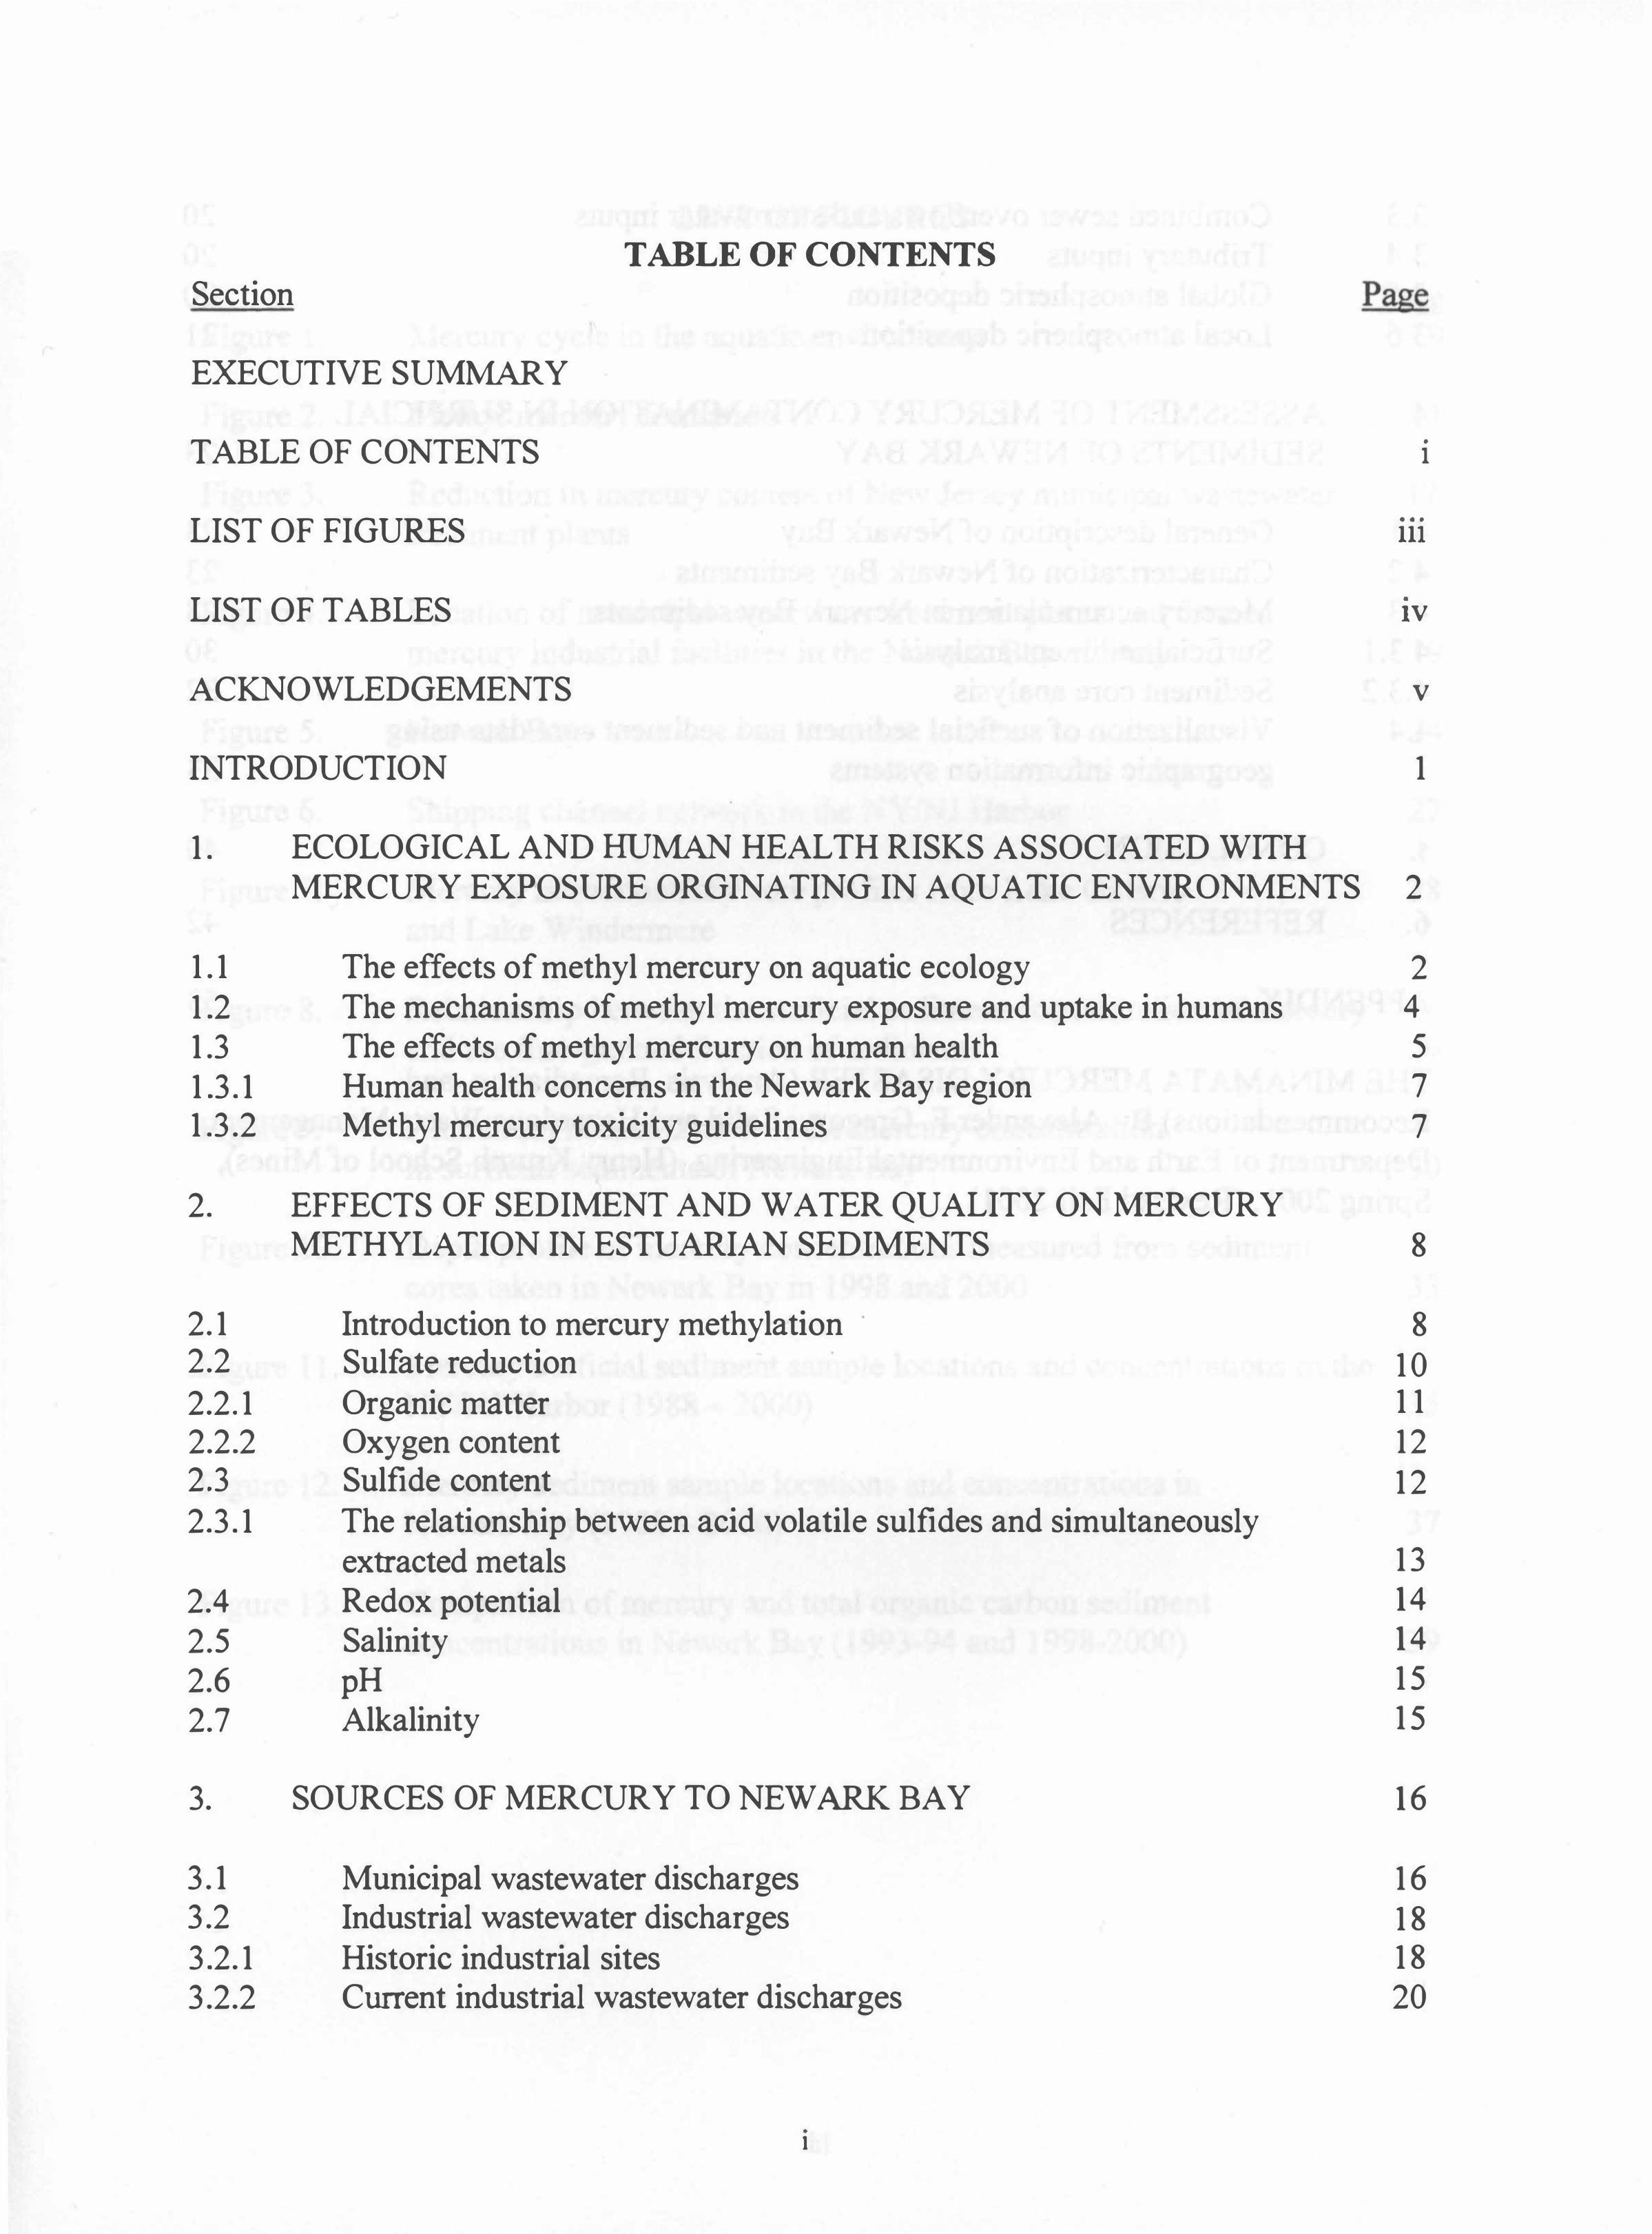
TABLE OF CONTENTS Section Page
EXECUTIVE SUMMARY
TABLE OF CONTENTS •
I
LIST OF FIGURES • • •
111
LIST OF TABLES • IV
ACKNOWLEDGEMENTS V
INTRODUCTION 1
1. ECOLOGICAL AND HUMAN HEALTH RISKS ASSOCIATED WITH MERCURY EXPOSURE ORGINATING IN AQUATIC ENVIRONMENTS 2
1.1 The effects of methyl mercury on aquatic ecology 2 1.2 The mechanisms of methyl mercury exposure and uptake in humans 4 1.3 The effects of methyl mercury on human health 5 1.3.1 Human health concerns in the Newark Bay region 7 1.3.2 Methyl mercury toxicity guidelines 7
2. EFFECTS OF SEDIMENT AND WATER QUALITY ON MERCURY METHYLATION IN ESTUARIAN SEDIMENTS 8
2.1 Introduction to mercury methylation . 8 2.2 Sulfate reduction 10 2.2.1 Organic matter 11 2.2.2 Oxygen content 12 2.3 Sulfide content 12 2.3.1 The relationship between acid volatile sulfides and simultaneously
extracted metals 13 2.4 Redox potential 14
2.5 Salinity 14
2.6 pH 15 2.7 Alkalinity 15
3. SOURCES OF MERCURY TO NEWARK BAY 16
3.1 Municipal wastewater discharges 16 3.2 Industrial wastewater discharges 18 3.2.1 Historic industrial sites 18 3.2.2 Current industrial wastewater discharges 20
• I
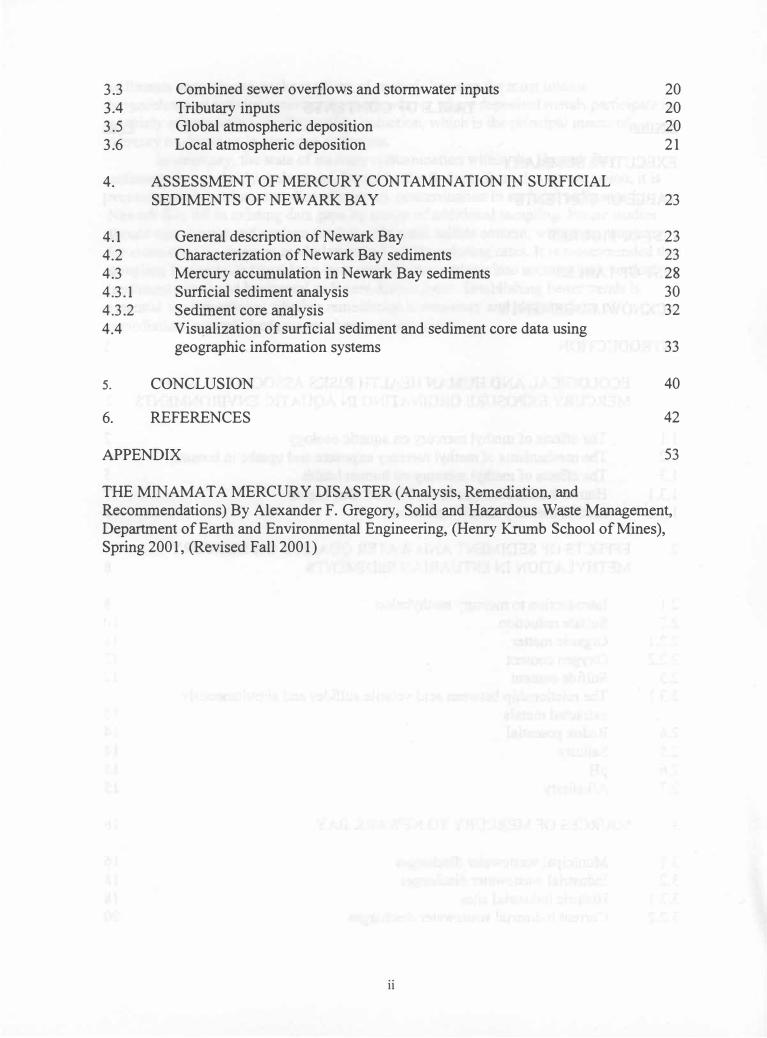
3.3 Combined sewer overflows and stormwater inputs 20 3.4 Tributary inputs 20 3.5 Global atmospheric deposition 20 3.6 Local atmospheric deposition 21
4. ASSESSMENT OF MERCURY CONT AMINA TION IN SURFICIAL SEDIMENTS OF NEWARK BAY 23
4.1 General description of Newark Bay 23 4.2 Characterization of Newark Bay sediments 23 4.3 Mercury accumulation in Newark Bay sediments 28 4.3.1 Surficial sediment analysis 30 4.3.2 Sediment core analysis 32
4.4 Visualization of surficial sediment and sediment core data using geographic information systems 33
5. CONCLUSION 40
6. REFERENCES 42
APPENDIX 53
THE MINAMATA MERCURY DISASTER (Analysis, Remediation, and Recommendations) By Alexander F. Gregory, Solid and Hazardous Waste Management, Department of Earth and Environmental Engineering, (Henry Krumb School of Mines), Spring 2001, (Revised Fall 2001)
ii
LIST OF FIGURES
Page Figure l. Mercury cycle in the aquatic environment 9
Figure 2. Methyl mercury formation 11
Figure 3. Reduction in mercury content of New Jersey municipal wastewater 17 treatment plants
Figure 4. Location of municipal wastewater treatment plants and former mercury industrial facilities in the Newark Bay vicinity 19
Figure 5. Newark Bay 24
Figure 6. Shipping channel network in the NY INJ Harbor 27
Figure 7. Mercury in sedimentary core profiles from Lake Ontario 28 and Lake Windermere
Figure 8. Relationship between the surficial sediment concentration of mercury and the fine-grained fraction of sediments 29
Figure 9. Aluminum normalization of the mercury concentration in surficial sediments of Newark Bay 30
Figure 10. Depth profile of mercury concentrations measured from sediment cores taken in Newark Bay in 1998 and 2000 33
Figure II. Mercury surficial sediment sample locations and concentrations in the NY INJ Harbor (1988 - 2000) 35
Figure 12. Mercury sediment sample locations and concentrations in Newark Bay (1988 - 2000) 37
Figure 13. Comparison of mercury and total organic carbon sediment concentrations in Newark Bay (1993-94 and 1998-2000) 39
1I1
List of Tables
Page
Table 1. Biological magnification of methyl mercury in the food chain 3
Table 2. Toxicological characteristics of methyl mercury 6
Table 3. Stability of methyl mercury and its complexes 8
Table 4. Sediment and water column characteristics 10
Table 5. Sources of mercury to Newark Bay 16
Table 6. Measured rates of mercury wet depositional fluxes 2 1
Table 7. Summary of mercury emissions from combustion sources in New York and New Jersey for 1999-2000 22
Table 8. Standard classification of sediment size distribution 25
Table 9. Range of the annual increase in sediment depth for various aquatic locations 25
Table 10. Authorized dredging projects in Newark Bay for 1999 26
Table 11. Mercury concentration statistics for the NYINJ Harbor data set 36
Table 12. Mercury concentration statistics for the Newark Bay data set 38
iv
ACKNOWLEDGEMENTS
The author gratefully acknowledges the support of Professor Nickolas J. Themelis of the Earth Engineering Center, the Department of Earth and Environmental Engineering (Henry Krumb School of Mines), the Dibner Fund, and the New York Academy of Sciences. The author also thanks Professor Yuri Gorokovich, Professor Amvrossios C. Bagtzoglou, the Center for International Earth Science Infonnation Network (CIESIN), and the Clean Ocean and Shore Trust (COAST) for their support.
Alexander F. Gregory November, 2001
v
INTRODUCTION
The objective of this study was to assess the state of mercury contamination in surficial sediment of Newark Bay. Mercury is a concern because of its toxicity to humans and aquatic life in the methyl form (i.e CH3Hg l. The surface sediments are a concern because most biogeochemical activity, which is responsible for Hg methylation occurs at the sediment-water interface.
This work was initiated from a broader study of mercury sources and material balance in the New York-New Jersey Harbor, which was conducted for the New York Academy of Sciences' Harbor Consortium by Themelis and Gregory (2001). The NY AS report mainly focused on past and present Hg air emissions, and mercury flows into the NYINJ Harbor. From this NYAS report, it was determined that future study areas in the Harbor should be focus to smaller sections of the Harbor to where exceptionally high Hg levels prevail. Furthermore, it was concluded that this current study should focus on the surface sediments where Hg methylation is most prevalent.
This report is divided into five sections. Section 1 examines the ecological and human health risks due to methylmercury formation in the aquatic environment. Section 2 discusses the effects of sediment and water quality on the formation of MeHg. Section 3 describes the sources of mercury to Newark Bay. In Section 4, a quantitative assessment of mercury in surficial sediments and sediment core data of Newark Bay was conducted using geographic information systems as a means of data presentation. The data used in this analysis came from a variety of sources including NYC DEP (1991a and 1993), Long et al. (1995), EPA (1998), and NYS DEC (2001). Conclusions and recommendations are summarized in Section 5. In the Appendix, a case study of mercury contamination in Minamata Bay, Japan is presented. The objective is to show alternative ways in which sediment mercury contamination has been assessed and to introduce remediation techniques: a) natural remediation, b) dredging, and c) chemical and microbial treatment.
1. ECOLOGICAL AND HUMAN HEALTH RISKS ASSOCIATED WITH MERCURY EXPOSURE AQUATIC ENVIRONMENTS
The mercury compound of principal concern is methyl mercury (Chemical formula: CH3Hg+, also referred to as MeHg). This form of mercury can bioconcentrate from the environmental matrix to biota tissue and it can biomagnify between successive trophic levels, resulting in neurologically adverse effects in humans mainly from the consumption of MeHg-contaminated fish. Within the last 50 years two major MeHg epidemics were recorded in Iraq and Japan resulting from the consumption of foodstocks with very high concentrations of MeHg, with death tolls recorded in the hundreds for each. However, in North American the scenario is much different with the population being much more susceptible to chronic low dose MeHg exposure. Bearing this in mind, EPA has developed a Reference Dose (RID) of O.I-J.1g/kg/d for MeHg (EPA, 1 997a), which is as an estimate of daily exposure to the human population that is likely to be without an appreciable risk of deleterious effects during a lifetime.
This section addresses the a) the effects of methyl mercury on aquatic ecology, b) the mechanisms of methyl mercury exposure and uptake in humans, and c) The effects of methyl mercury on human health, including a discussion on human health concerns in the Newark Bay region and methyl mercury toxicity guidelines. Stern (et al. 1 996) estimated that 2 1 % of women of childbearing age in New Jersey are at risk to adverse affected associated with fish consumption. However, it is still unclear how many fish bioconcentrate MeHg in Newark Bay and how many of these that may be consumed by the public. Therefore, it is recommended that future studies identify the commercial species offish prevalent in Newark Bay, quantify the number of commercial fish exposed to MeHg, and quantify the number of MeHg-contaminated commercial fish from the Newark Bay region that are likely to be consumed.
1.1 The effects of methyl mercury on aquatic ecology
Methyl mercury compounds have no known normal metabolic function. Their presence in living organisms, including man, is considered to be contamination from environmental sources. However, the biosynthesis of MeHg and MeHg diffusion into cells is still possible under the right conditions in the environment. Biosynthesis is determined by the type of microbial community in addition to the available concentrations of soluble mercuric ion species and methyl-B12 compounds (Wood et al. 1 968). Bioaccumulation into tissues of higher organisms is most likely controlled by diffusion (NRC, 1 978).
Low-level exposure of methyl mercury, under certain circumstances, is associated with reduced growth and photosynthesis in phytoplankton and deformities in plants and animals. In most aquatic systems, organisms are constantly exposed to very low levels of MeHg. This still can be a major concern since MeHg can be absorbed and magnified at each trophic level of the food chain, which ultimately threatens human health. Hamilton ( 1 971) concluded that predators had an average MeHg concentration that was almost 1 5 times greater than algae eaters (Table 1) . Furthermore, studies have shown that only MeHg biomagnifies through successive trophic levels, with virtually all
2
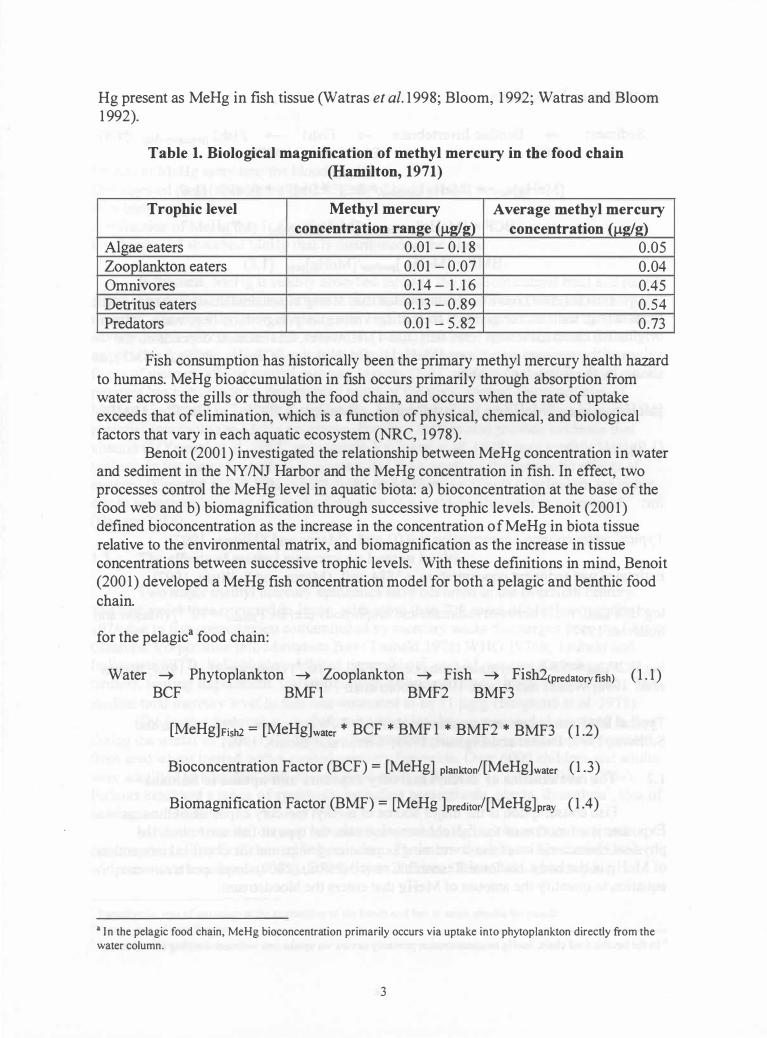
Hg present as MeHg in fish tissue (Watras et al. 1 998; Bloom, 1 992; Watras and Bloom 1 992).
Table 1. Biological magnification of methyl mercury in the food chain (Hamilton, 1971)
Trophic level Methyl mercury Average methyl mercury concentration range (J.1g1g) concentration (J.1g1g)
Algae eaters 0.01 - 0. 1 8 0.05 Zooplankton eaters 0.01- 0.07 0.04 Omnivores 0. 1 4 - 1 . 1 6 0.45 Detritus eaters 0. 1 3 - 0.89 0.54 Predators 0.0 1 - 5.82 0.73
Fish consumption has historically been the primary methyl mercury health hazard to humans. MeHg bioaccumulation in fish occurs primarily through absorption from water across the gills or through the food chain, and occurs when the rate of uptake exceeds that of elimination, which is a function of physical, chemical, and biological factors that vary in each aquatic ecosystem (NRC, 1 978).
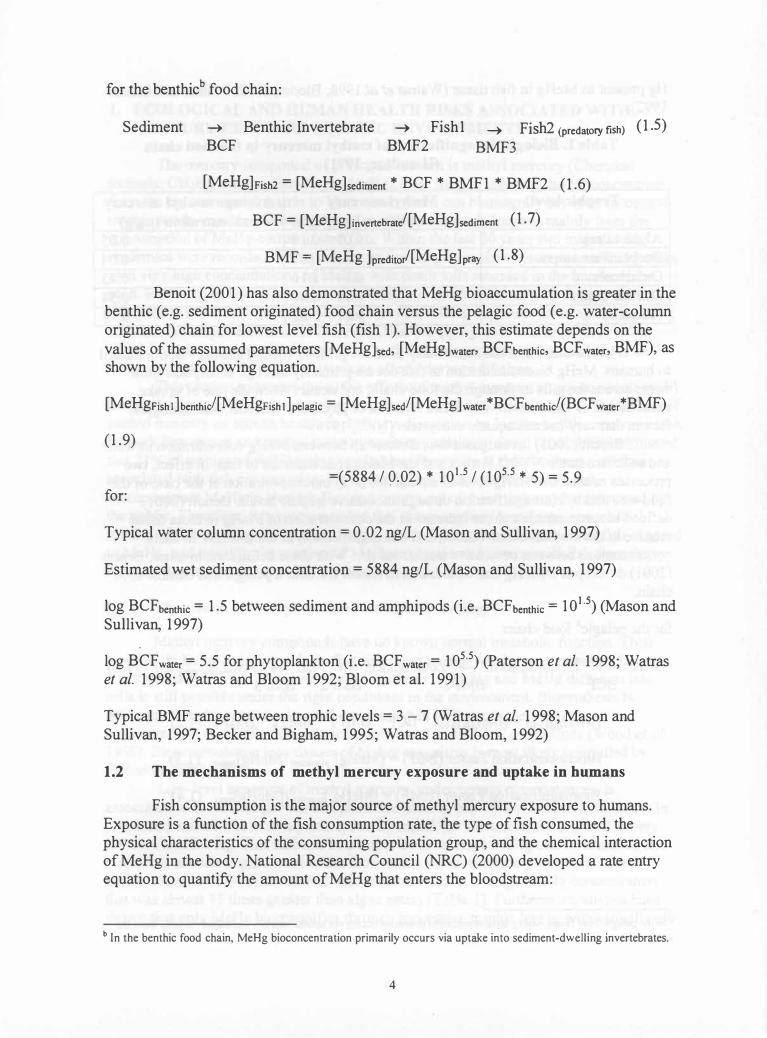
Benoit (2001 ) investigated the relationship between MeHg concentration in water and sediment in the NYINJ Harbor and the MeHg concentration in fish. In effect, two processes control the MeHg level in aquatic biota: a) bioconcentration at the base of the food web and b) biomagnification through successive trophic levels. Benoit (200 1) defined bioconcentration as the increase in the concentration of MeHg in biota tissue relative to the environmental matrix, and biomagnification as the increase in tissue concentrations between successive trophic levels. With these definitions in mind, Benoit (200 1) developed a MeHg fish concentration model for both a pelagic and benthic food chain.
for the pelagica food chain:
Water � Phytoplankton � Zooplankton � Fish � Fish2(predatoryfish) ( 1 . 1 ) BCF BMFI BMF2 BMF3
[MeHg]Fish2 = [MeHg]water * BCF * BMFI * BMF2 * BMF3 ( 1 .2)
Bioconcentration Factor (BCF) = [MeHg] plankton/[MeHg]water ( 1 .3)
Biomagnification Factor (BMF) = [MeHg ]preditor![MeHg]pray ( 1 .4)
a In the pelagic food chain, MeHg bioconcentration primarily occurs via uptake into phytoplankton directly from the water column.
3
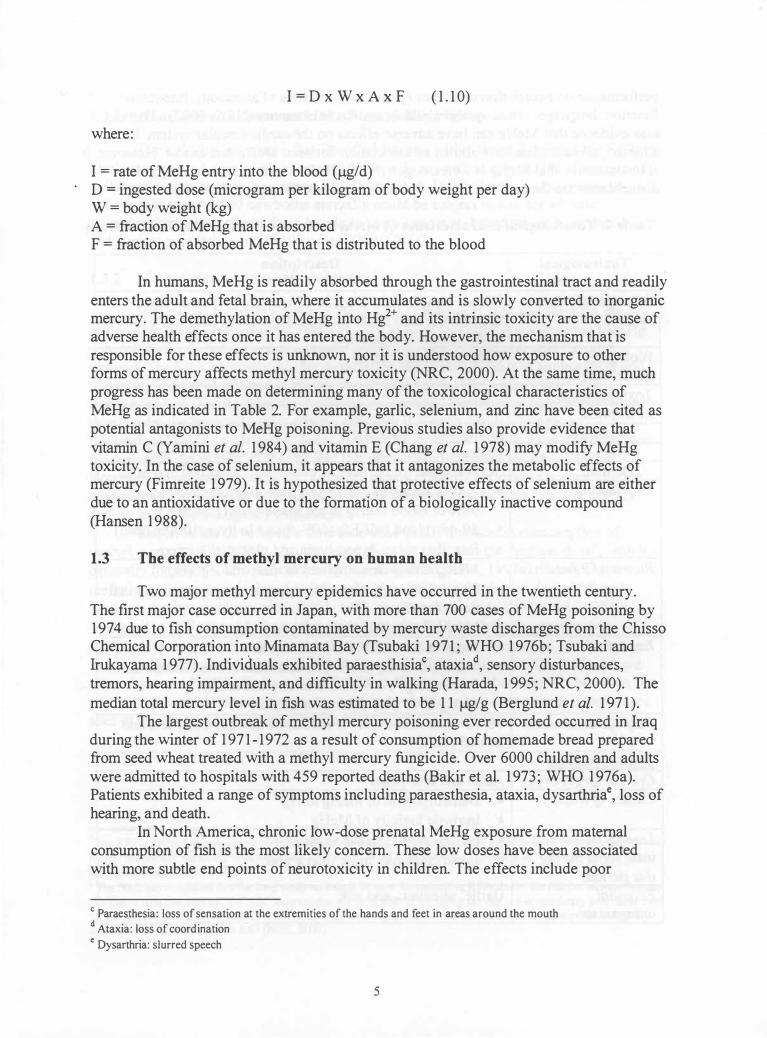
for the benthicb food chain:
Sediment � Benthic Invertebrate BCF
� Fish1 BMF2
� Fish2(predatoryfish) (1.5) BMF3
[MeHg]Fish2 = [MeHg]sediment * BCF * BMF1 * BMF2 (1.6)
BCF = [MeHg] invertebratel'[MeHg]sediment (1.7)
BMF = [MeHg ]preditor![MeHg]pray (1.8)
Benoit (2001) has also demonstrated that MeHg bioaccumulation is greater in the benthic (e.g. sediment originated) food chain versus the pelagic food (e.g. water-column originated) chain for lowest level fish (fish 1). However, this estimate depends on the values of the assumed parameters [MeHg]sed, [MeHg]water, BCFbenthic, BCFwater, BMF), as shown by the following equation.
[MeHgFishl]benthiJ[MeHgFish 1 ]pelagic = [MeHg]sed/[MeHg] water *BCF benthicl(BCFwater *BMF)
(1.9)
=(5884/0.02) * 101.5 / (105.5 * 5) = 5.9 for:
Typical water column concentration = 0.02 ngIL (Mason and Sullivan, 1997)
Estimated wet sediment concentration = 5884 ngiL (Mason and Sullivan, 1997)
log BCFbenthic = 1.5 between sediment and amphipods (i.e. BCFbenthic = 101.5) (Mason and Sullivan, 1997)
log BCFwater = 5.5 for phytoplankton (i.e. BCFwater= 105.5) (Paterson et al. 1998; Watras et al. 1998; Watras and Bloom 1992; Bloom et al. 1991)
Typical BMF range between trophic levels = 3 - 7 (Watras et al. 1998; Mason and Sullivan, 1997; Becker and Bigham, 1995; Watras and Bloom, 1992)
1.2 The mechanisms of methyl mercury exposure and uptake in humans
Fish consumption is the major source of methyl mercury exposure to humans. Exposure is a function of the fish consumption rate, the type of fish consumed, the physical characteristics of the consuming population group, and the chemical interaction of MeHg in the body. National Research Council (NRC) (2000) developed a rate entry equation to quantify the amount of MeHg that enters the bloodstream:
b In the benthic food chain, MeHg bioconcentration primarily occurs via uptake into sediment-dwelling invertebrates.
4
I= D x W x A x F ( 1 . 1 0)
where:
I = rate of MeHg entry into the blood (J.lg/d) D = ingested dose (microgram per kilogram of body weight per day) W = body weight (kg) A = fraction of MeHg that is absorbed F = fraction of absorbed MeHg that is distributed to the blood
In humans, MeHg is readily absorbed through the gastrointestinal tract and readily enters the adult and fetal brain, where it accumulates and is slowly converted to inorganic mercury. The demethylation of MeHg into Hg2+ and its intrinsic toxicity are the cause of adverse health effects once it has entered the body. However, the mechanism that is responsible for these effects is unknown, nor it is understood how exposure to other forms of mercury affects methyl mercury toxicity (NRC, 2000). At the same time, much progress has been made on determining many of the toxicological characteristics of MeHg as indicated in Table 2. For example, garlic, selenium, and zinc have been cited as potential antagonists to MeHg poisoning. Previous studies also provide evidence that vitamin C (Yamini et al. 1 984) and vitamin E (Chang et al. 1 978) may modify MeHg toxicity. In the case of selenium, it appears that it antagonizes the metabolic effects of mercury (Fimreite 1 979). It is hypothesized that protective effects of selenium are either due to an antioxidative or due to the formation of a biologically inactive compound (Hansen 1 988).
1.3 The effects of methyl mercury on human health
Two major methyl mercury epidemics have occurred in the twentieth century. The first major case occurred in Japan, with more than 700 cases of MeHg poisoning by 1 974 due to fish consumption contaminated by mercury waste discharges from the Chisso Chemical Corporation into Minamata Bay (Tsubaki 1 971 ; WHO 1 976b; Tsubaki and lrukayama 1 977). Individuals exhibited paraesthisiac, ataxiad, sensory disturbances, tremors, hearing impairment, and difficulty in walking (Harada, 1 995; NRC, 2000). The median total mercury level in fish was estimated to be 1 1 J.lg/ g (Berglund et aZ. 1 97 1 ).
The largest outbreak of methyl mercury poisoning ever recorded occurred in Iraq during the winter of 1 97 1 - 1972 as a result of consumption of homemade bread prepared from seed wheat treated with a methyl mercury fungicide. Over 6000 children and adults were admitted to hospitals with 459 reported deaths (Bakir et al. 1 973 ; WHO 1 976a). Patients exhibited a range of symptoms including paraesthesia, ataxia, dysarthriae, loss of hearing, and death.
In North America, chronic low-dose prenatal MeHg exposure from maternal consumption of fish is the most likely concern. These low doses have been associated with more subtle end points of neurotoxicity in children. The effects include poor
C Paraesthesia: loss of sensation at the extremities of the hands and feet in areas around the mouth
d Ataxia: loss of coordination
e Dysarthria: slurred speech
5
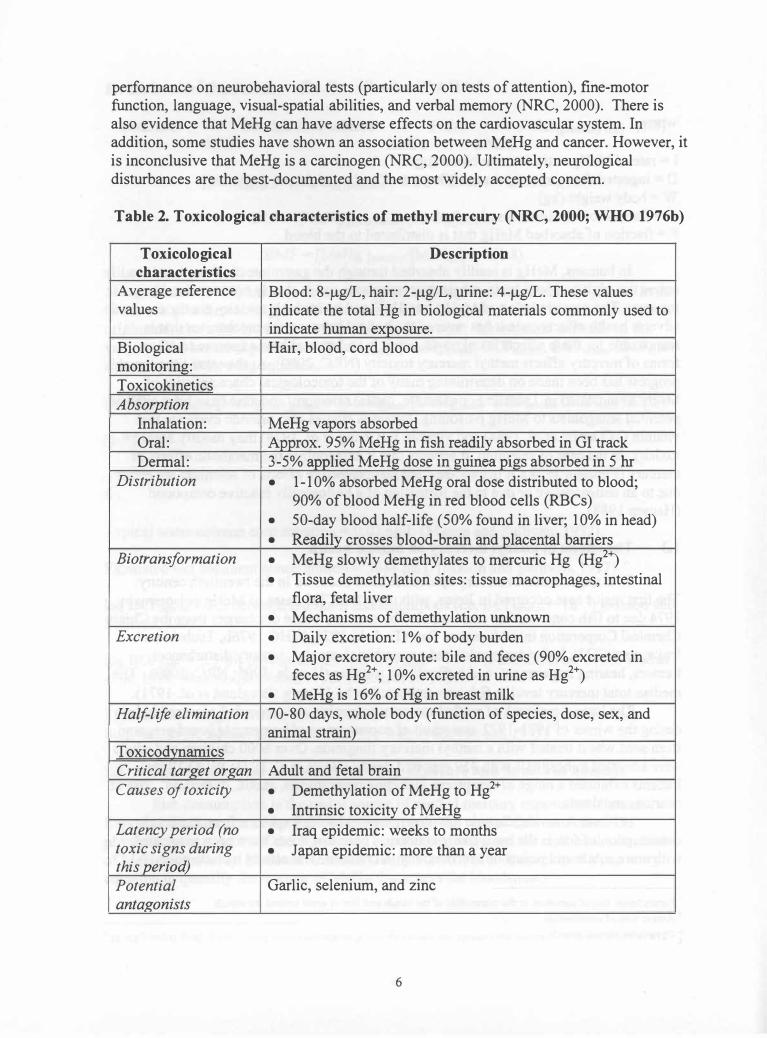
perfonnance on neurobehavioral tests (particularly on tests of attention), fme-motor function, language, visual-spatial abilities, and verbal memory (NRC, 2000). There is also evidence that MeHg can have adverse effects on the cardiovascular system. In addition, some studies have shown an association between MeHg and cancer. However, it is inconclusive that MeHg is a carcinogen (NRC, 2000). Ultimately, neurological disturbances are the best-documented and the most widely accepted concern.
Table 2. Toxicological characteristics of methyl mercury (NRC, 2000; WHO 1976b)
Toxicological Description characteristics
Average reference Blood: 8-J..lglL, hair: 2-J..lglL, urine: 4-J..lglL. These values values indicate the total Hg in biological materials commonly used to
indicate human exposure. Biological Hair, blood, cord blood monitoring: T oxicokinetics Absorption
Inhalation: MeHg vapors absorbed Oral: Approx. 95% MeHg in fish readily absorbed in GI track Dennal: 3-5% applied MeHg dose in guinea pigs absorbed in 5 hr
Distribution • 1-10% absorbed MeHg oral dose distributed to blood; 90% of blood MeHg in red blood cells (RBCs)
• 50-day blood half-life (50% found in liver; 10% in head) • Readily crosses blood-brain and placental barriers
Biotransformation • MeHg slowly demethylates to mercuric Hg (Hg2+) • Tissue demethylation sites: tissue macrophages, intestinal
flora, fetal liver • Mechanisms of demethylation unknown
Excretion • Daily excretion: 1 % of body burden • Major excretory route: bile and feces (90% excreted in
feces as Hg2+; 10% excreted in urine as Hg2+) • MeHg is 16% of Hg in breast milk
Half-life elimination 70-80 days, whole body (function of species, dose, sex, and animal strain)
Toxicodvnamics Critical tar�et or�an Adult and fetal brain Causes of toxicity • Demethylation of MeHg to Hg2+
• Intrinsic toxicity of MeHg Latency period (no • Iraq epidemic: weeks to months toxic signs during • Japan epidemic: more than a year this period) Potential Garlic, selenium, and zinc antagonists
6
1.3.1 Human health concerns in the Newark Bay region
The EPA has estimated that 7% of all women within the u.s. exceed the RID. Furthennore, food consumption surveys in New Jersey estimate that 21 % of women of childbearing age exceed the current RID (Stem et al. 1996). There is also reason to believe that over 60,000 newborns annually could be subject to risk for adverse neurodevelopmental effects from MeHg in utero exposure, based on consumption data and current population and fertility rates (NRC 2000).
1.3.2 Methyl mercury toxicity guidelines
In the U.S., both the Food and Drug Administration (FDA) and the EPA are responsible for the regulation of mercury. The FDA is responsible for ensuring that Hg concentrations do not exceed agency-defined levels in commercially sold fish and seafood. The EPA is responsible for monitoring Hg concentrations in environment and regulating industrial releases to the air and surface water. The Agency for Toxic Substances and Disease Registry evaluates the potential human exposure to MeHg and investigates the reported health effects, although it is not a regulatory agency. International bodies such as the World Health Organization (WHO) have also evaluated the exposure and effects of MeHg, and recommended fish consumption guidelines. However, these agencies each use different means to assess toxicant exposure. Unique agency guidelines are due to different risk-assessment methods, data sets, uncertainty factors, and different agency mandates.
The EPA has developed a reference dose (RID/ for human consumption of methyl mercury. The RID is also based on data that indicates the "critical dose", which is generally the most subtle indicator of an adverse effect (EPA, 1997a). The RID for methyl mercury was calculated as 0.1 /lg/kg-day (with uncertainty factor of 10) and based on the data analysis of the 1971-1972 Iraq incident (EPA, 1997a; NRC, 2000). Comparison to 7 other MeHg intake guidelines, the RID is relatively conservative compared to the FDA's recommendation of 0.5 /lg/kg-day (Friberg et al. 1971), but not as low as Washington States' tolerable daily intake (TDI) range ofO.035-0.08/lglkg/d (Grandjean et aI1997). However, the RIDg has been criticized because it is based on the Iraqi data where MeHg exposures were not comparable to low-level, chronic exposures seen in the North American population (NRC, 2000).
f The RID is defined as an estimate (with uncertainty spanning perhaps an order of magnitude) of daily exposure to the human population (including sensitive subgroups) that is likely to be without an appreciable risk of deleterious effects
during a lifetime (EPA, 1 997). g The NRC has concluded that the Iraqi study no longer be used for estimating RIDs due to the number of uncertainties
associated with this data set, the NRC believes that the EPA RID of 0.1 J,lglkg per day is a scientifically justifiable level for the protection of public health. Furthermore, the Faroe Island study is believed to be more appropriate of future determination of an acceptable RID (NRC, 2000).
7
2. EFFECTS OF SEDIMENT AND WATER QUALITY ON MERCURY METHYLATION IN ESTUARINE SEDIMENTS
2.1 Introduction to mercury methylation
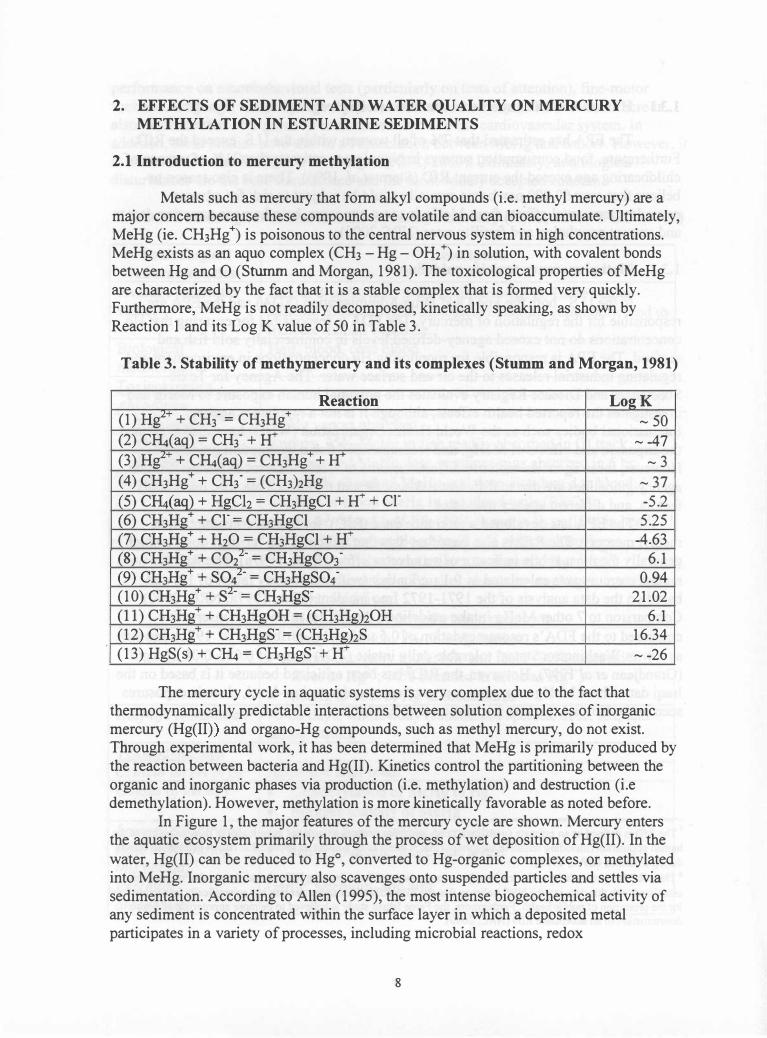
Metals such as mercury that form alkyl compounds (i.e. methyl mercury) are a major concern because these compounds are volatile and can bioaccumulate. Ultimately, MeHg (ie. CH3Hg +) is poisonous to the central nervous system in high concentrations. MeHg exists as an aquo complex (CH3 - Hg - OH2 +) in solution, with covalent bonds between Hg and 0 (Stumm and Morgan, 1981). The toxicological properties of MeHg are characterized by the fact that it is a stable complex that is formed very quickly. Furthermore, MeHg is not readily decomposed, kinetically speaking, as shown by Reaction 1 and its Log K value of 50 in Table 3.
Table 3. Stability of me thy mercury and its complexes (Stumm and Morgan, 1981)
Reaction Lo�K (1) HgL+ + CH3- = CH3Hg+ -50 (2) C�(aq) = CH3- + W --47 (3) HgL+ + C�(aq) = CH3Hg+ + H+ -3 (4) CH3Hg+ + CH3- = (CH3)2Hg -37 (5) C�(aq) + HgCh = CH3HgCI + W + cr -5.2 (6) CH3Hg + + cr = CH3HgCI 5.25 (7) CH3Hg + + H20 = CH3HgCI + W -4.63 (8) CH3Hg + + C02 L- = CH3HgC03- 6.1 (9) CH3Hg+ + S042- = CH3HgS04- 0.94 (10) CH3Hg + + S2- = CH3HgS- 21.02 (11) CH3Hg+ + CH3HgOH = (CH3Hg)20H 6.1 (12) CH3Hg+ + CH3HgS- = (CH3Hg)2S 16.34 (13) HgS(s) + C� = CH3HgS- + W --26
The mercury cycle in aquatic systems is very complex due to the fact that thermodynamically predictable interactions between solution complexes of inorganic mercury (Hg(II» and organo-Hg compounds, such as methyl mercury, do not exist. Through experimental work, it has been determined that MeHg is primarily produced by the reaction between bacteria and Hg(II). Kinetics control the partitioning between the organic and inorganic phases via production (i.e. methylation) and destruction (i.e demethylation). However, methylation is more kinetically favorable as noted before.
In Figure 1, the major features of the mercury cycle are shown. Mercury enters the aquatic ecosystem primarily through the process of wet deposition of Hg(II). In the water, Hg(II) can be reduced to HgO, converted to Hg-organic complexes, or methylated into MeHg. Inorganic mercury also scavenges onto suspended particles and settles via sedimentation. According to Allen (1995), the most intense biogeochemical activity of any sediment is concentrated within the surface layer in which a deposited metal participates in a variety of processes, including microbial reactions, redox
8
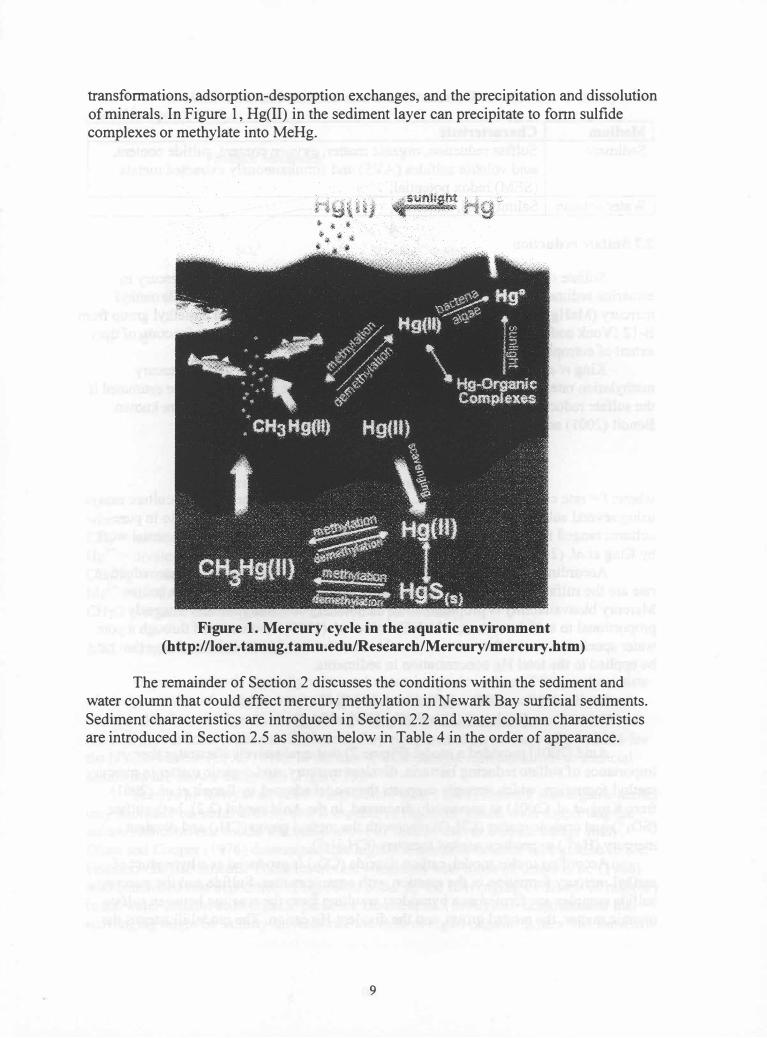
transfonnations, adsorption-desporption exchanges, and the precipitation and dissolution of minerals. In Figure 1, Hg(II) in the sediment layer can precipitate to fonn sulfide complexes or methylate into MeHg.
Figure 1 . Mercury cycle in the aquatic environment (http://loer.tamug.tamu.edulResearchlMercury/mercury.htm)
The remainder of Section 2 discusses the conditions within the sediment and water column that could effect mercury methylation in Newark Bay surficial sediments. Sediment characteristics are introduced in Section 2.2 and water column characteristics are introduced in Section 2.5 as shown below in Table 4 in the order of appearance.
9
Table 4. Sediment and water column characteristics
Medium Characteristic Sediment Sulfate reduction, organic matter, oxygen content, sulfide content,
acid volatile sulfides (A VS) and simultaneously extracted metals (SEM) redox potential,
Water column Salinity, pH, alkalinity
2.2 SuHate reduction
Sulfate reducing bacteria (SRB) are the principal methylators of mercury in estuarine sediments (Compeau and Bartha, 1985; Gilmour et al. 1984). SRB methyl mercury (MeHg) production occurs via enzyme-mediated transfer of a methyl group from B-12 (Vonk and Sijpesteinjn, 1973), where microbial populations are a function of the extent of eutrophication (DeSimone et al. 1973).
King et al. (2001) recently developed a qualitative model for the mercury methylation rate (MMR), suggesting that MMR in aquatic sediments can be estimated if the sulfate reduction rate (SSR) and the concentration of bioavailable Hg are known. Benoit (2001) adapted this model from King et al. (2001) as shown below.
MMR = f x SRR X [Hg]bioavailable (2.1)
where: f= rate constant = MMRlSSR, was empirically determined in pure-culture assays using several sulfate-reducer strains (King et al. 2001). The MMRlSSR ratio in pure cultures ranged from 0.28-26*10-6 with an average of 7.2*10-6 from experimental work by King et al. (2001).
According to Benoit (2001), the main variables controlling the sulfate reduction rate are the sulfate concentration, temperature, and organic matter as shown below. Mercury bioavailability is proportional to the total Hg concentration and inversely proportional to sulfide content, which Benoit et al. (1999) demonstrated through a pore water speciation model that made it possible to estimate a bioavailability factor that can be applied to the total Hg concentration in sediments.
SRR = F([Sulfate], [OM], T) [Hg]Bioavailable = F([HgT], 1/[ sulfide])
(2.2) (2.3)
Anid (2001) provided a model (Figure 2) that qualitatively illustrates the importance of sulfate reducing bacteria, divalent mercury, and organic matter in mercury methyl formation, which strongly supports the model adapted by Benoit et al. (2001) from King et al. (2001) as previously discussed. In the Anid model (2.2), both sulfate (SOl-) and organic matter (CH20) react with the methyl group (CH3) and divalent mercury (Hg2+) to produce methyl mercury (CH3Hg +).
According to this model, carbon dioxide (C02) is produced as a byproduct of methyl mercury formation in the reaction with organic matter. Sulfide and the mercury sulfide complex are formed as a byproduct resulting from the reaction between sulfate, organic matter, the methyl group, and the divalent Hg cation. The model illustrates the
1 0
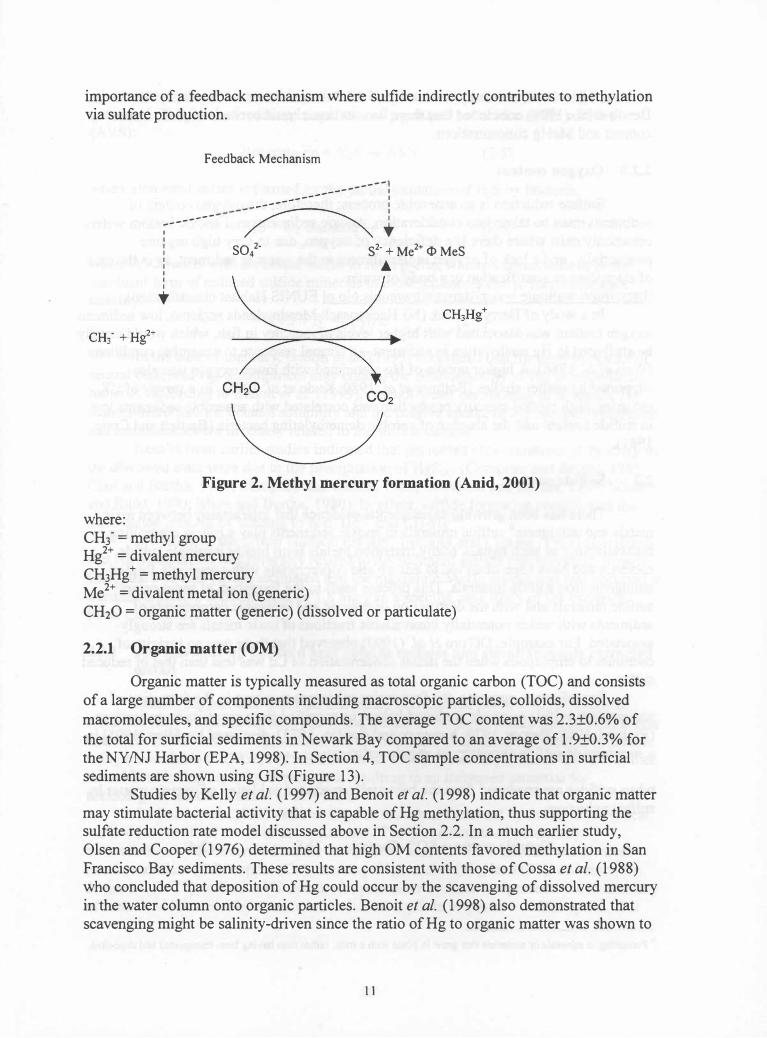
importance of a feedback mechanism where sulfide indirectly contributes to methylation via sulfate production.
where:
Feedback Mechanism
------1 _-------- I
-------
� :
;------- / '" . I
: S042. S2. + Me2+ <I> MeS : £ I I I
•
Figure 2. Methyl mercury formation (Anid, 2001)
CH3' = methyl group Hg2+ = divalent mercury CH3Hg + = methyl mercury Me2+ = divalent metal ion (generic) CH20 = organic matter (generic) (dissolved or particulate)
2.2.1 Organic matter (OM)
Organic matter is typically measured as total organic carbon (TOC) and consists of a large number of components including macroscopic particles, colloids, dissolved macromolecules, and specific compounds. The average TOC content was 2.3±O.6% of the total for surficial sediments in Newark Bay compared to an average of 1.9±O.3% for the NY INJ Harbor (EPA, 1998). In Section 4, TOC sample concentrations in surficial sediments are shown using GIS (Figure 13).
Studies by Kelly et al. (1997) and Benoit et al. (1998) indicate that organic matter may stimulate bacterial activity that is capable of Hg methylation, thus supporting the sulfate reduction rate model discussed above in Section 2.2. In a much earlier study, Olsen and Cooper (1976) determined that high OM contents favored methylation in San Francisco Bay sediments. These results are consistent with those of Cossa et al. (1988) who concluded that deposition of Hg could occur by the scavenging of dissolved mercury in the water column onto organic particles. Benoit et al. (1998) also demonstrated that scavenging might be salinity-driven since the ratio of Hg to organic matter was shown to
II
be inversely related to salinity, in a study of the Patuxent River estuary study. However, Benoit et al. (1998) concluded that there was no linear trend between organic matter content and MeHg concentrations.
2.2.2 Oxygen content
Sulfate reduction is an anaerobic process; therefore, the oxygen content of sediments must be taken into consideration. Anoxic sediments and anoxic bottom waters commonly exist where there is a deficiency of oxygen, due to very high organic productivity, and a lack of oxygen replenishment to the water or sediment, as in the case of stagnation or stratification in a body of water (http://mrw.wallonie.be/cgi/dgrne/sibw/eunis.gJo.pJ EUNIS Habitat classification).
In a study of Berry's Creek (NJ Hackensack Meadowlands regions), low sediment oxygen content was associated with higher levels of mercury in fish, which would usually be attributed to Hg methylation in sediment - a normal response to anaerobic conditions (Weis et al. 1986). A higher uptake of Hg associated with lower oxygen was also supported by earlier studies (Bothner et al. 1980; Kudo et al. 1975). In a survey of UK estuaries, high methyl mercury production was correlated with anaerobic sediments low in sulfide content and the absence of aerobic demethylating bacteria (Bartlett and Craig, 1981).
2.3 Sulfide content
There has been growing experimental evidence that interactions between toxic metals and authigenich sulfide minerals in anoxic sediments play a role in controlling bioavailability of such metals. Many transition metals form highly insoluble sulfide minerals and have been observed to adsorb and coprecipitate with commonly formed authigenic iron sulfide minerals. This process leads to the formation of sedimentary sulfide minerals and with the destruction of organic and inorganic components of sediments with which potentially bioavailable fractions of toxic metals are strongly associated. For example, DiToro et al. (1990) observed that there was no toxicity of cadmium to amphipods when the molar concentration of Cd was less than that of reduced sulfur.
For reference purposes, the four major processes resulting in the formation of sedimentary sulfide minerals are listed below, as specified from previous investigations (Rickard, 1969; Berner, 1970; Sweeney and Kaplan, 1973), discussed by Allen (1995) in a summary of sulfide chemistry in anoxic sediments:
when sulfides are produced from the bacterially-mediated oxidation of organic matter by sulfate reduction:
Organic matter + S02-4 Bacteria � H2S (2.4)
h Pertaining to minerals or materials that grow in place with a rock, rather than having been transported and deposited.
1 2
where upon hydrochloric leaching of sediment dissolves iron minerals and H2S is generated. This kind of reaction is operationally grouped as "acid volatile sulfides" (AVS):
Reactive-Fe + H2S � AVS (2.5)
where elemental sulfur is formed by the partial oxidation of H2S by bacteria:
(2.6)
where A VS reacts with elemental sulfur to form pyrite, which is considered to be the dominant form of reduced sulfide minerals in most sediments due to thermodynamic stability:
AVS + SO � pyrite (2.7)
In the case of mercury, Benoit et al. (1999) concluded that the passive uptake of neutral dissolved Hg-S complexes may control the bioavailability of Hg to methylating bacteria. According to Benoit et al. (1999), octanol-water partitioning of inorganic Hg demonstrated that the octanol solubility and the passive uptake of Hg across hydrophobic cell membranes were inversely related to the sulfide content.
Results from earlier studies indicated that decreased concentrations of mercury in the dissolved state were due to the precipitation of HgS(s). (Compeau and Bartha, 1985; Choi and Bartha, 1994; Compeau and Bartha, 1983; Compeau and Bartha, 1987; Winfrey and Rudd, 1990; Blum and Bartha, 1980). In effect, sulfide formation complicates the methylation process by binding to both Hg2+ and CH3Hg2+.
In a study of the Lower Hudson Estuary, Gilmour and Capone (1987) concluded that Hg methylation was inversely related to the sediment sulfide concentration. Finally, Craig and Moreton (1983) estimated that the maximum MeHg production rate occurred at a sediment sulfide concentration of 1.8 mg/g in a specific case study of the estuarine River Carron, UK.
2.3.1 The relationship between acid volatile sulfides and simultaneously extracted metals
Studies suggest that when the difference between the molar concentrations of simultaneously extracted metals (SEM) and metals in the acid volatile form (A VS) is less than 0 (ie. (SEM - AVS < 0), sulfides should be bound to all metals in theory, with none being bioavailable (NOAA, 1995 Hansen et al. 1996). However, if SEM - A VS > 0, then the sulfide binding capacity is exceeded, resulting in an increased potential for toxicological effects (Hansen et al. 1996).
Di Toro et al. (1992) defined SEM as the metal extracted by the AVS analytical method (not the total metal in the sediments). The best estimate of potentially bioavailable metal concentrations for comparison to A VS. SEM includes the divalent metals cadmium (Cd), copper (Cu), mercury (Hg), nickel (Ni), lead (Pb), and zinc (Zn). Jorgensen (1977) defined AVS as a useful parameter because it represents the availability of metals, which varies by season and sediment depth in response to sulfur cycles, that
1 3
are related to temperature and productivity (Di Toro et al. 1990; Di Toro et al. 1992; EPA, 1998).
The EPA (1998) used the SEM-A VS technique in a Harbor-wide study of surficial sediments sampled during the summer of 1993 and 1994. The difference between SEM and A VS was greater than zero (i.e. SEM - A VS > 0) for 36% of all the samples, with 54% of the Lower Harbor samples having a difference greater than zero. This contrasts with data from Newark Bay, where only 12% of all samples were greater than zero; this would suggest that the bioavailability of divalent metals is small relative to the rest of the Harbor, based on the previous discussion from Di Toro et al. (1992). Furthermore, Hg was not present in any of the simultaneous extractions. In the 20 SEM samples within Newark Bay, zinc exhibited the highest SEM, with lead being the second highest for 60% of the samples and copper the third highest for the remaining 40%.
2.4 Redox potential
Redox (oxidation - reduction) reactions play a major role in many of the reactions occurring in natural waters. The behavior of compounds containing carbon, nitrogen, sulfur, iron, and manganese in natural waters are largely influenced by redox reactions. The redox reaction consists of two parts (or half-reactions), that is the oxidation reaction (i.e. substance loses electrons) and the reduction reaction (i.e. substance gains electrons. Redox reactions must include both parts since free electrons cannot exist in solution and must also be conserved (Snoeyink V.L. and Jenkins, D., 1980).
Bartlett and Craig (1981) surveyed sediments of the Mersey and Clyde Estuaries, UK, for correlations between total mercury (HgT), MeHg, organic carbon, particle size, and sulfide. They concluded that MeHg is only present in these estuarine sediments with negative redox potentials. The maximum MeHg production was predicted at a redox potential of -100 to 0 mY. In intertidal New Jersey mudflats, Compeau and Bartha (1984) determined that the highest methylation rate and the equilibrium MeHg concentration occurred at a low redox potential of -220 mY, which also corresponded to a low salinity of 0.4%; however, this affect may be due to low sulfide content as opposed to salinity.
2.5 Salinity
Salinity is a measure of the total quantity of dissolved solids in water, in parts per thousand (ppt), when all organic matter has been completely oxidized, all carbonates have been converted to oxides, and bromide and iodide to chloride. (http://mrw.wallonie.be/cgi/dgme/sibw/eunis.glo.pl EUNIS Habitat classification).
In estuaries, salinity increases in the seaward direction. In a biological and hydrographical characterization of Newark Bay (http://www.sh.nmfs.goy/NEWRKbay.htm). the average salinity ranged from 15 to 25 parts per thousand from May 1993 to April 1994, with deviations as low as 5 parts per thousand during the late spring and summer months.
According to measurements by Gilmour and Capone (1987), Hg methylation in the Lower Hudson Estuary was inversely related to salinity, with the highest methylation rates occurring in nearly freshwater sediments at salinity concentrations in the range of one part per thousand. Additional studies by Blum and Bartha (1980) and Bartlett and
14
Craig ( 1 98 1) also support this inverse relationship between MeHg methylation and the salinity gradient.
2.6 pH
The pH is defined as the negative logarithm of the hydrogen ion concentration in a water body. Pure water has a pH of 7 (PH < 7 indicates an acidic solution and pH > 7 indicates a basic solution) The measure of pH is important not only because of the dissolved ion concentration, but also because the toxicity of many pollutants increases with changes in pH. Dissolution of metal ions can occur in acidic waters. Negative effects usually occur in combination with temperature, dissolved oxygen, prior acclimatization of organisms, and the ion content in the surface water. Acidic precipitation may have toxic effects on aquatic biota. Low pHs have been known to favor the mobilization and the release of many metals from sediments (MacFarlane and Livingston, 1 983; Gilmour and Henry, E.A., 1 99 1 ; Whinfrey and Rudd, 1 990). In fresh waters, acid deposition may influence microbiological and biogeochemical changes that could lead to increased levels of methyl mercury (Gilmour and Henry, 1 99 1). The New Jersey surface water quality criterion is: pH > 6.5 and < 8.5 (NJWSA, 2001). Average pH in Newark Bay was 7.32±0. 1 3 (EPA, 1 998).
2.7 Alkalinity
Alkalinity is not a specific polluting substance, but is a good measure of the capacity of water to neutralize hydrogen ions. It is expressed in terms of the equivalent amount of calcium carbonate (Ciemniecki, 2001) . Municipal and industrial wastewater loadings typically increase the natural levels of alkalinity. Decreased levels of alkalinity can increase the toxicity of metals (NJSWSA, 2001) . Also, it has been proposed that low alkalinity is correlated with methyl mercury accumulation (Wiener, J.G. and P.M. Stokes, 1 990)
1 5
3. SOURCES OF MERCURY TO NEWARK BAY
The metropolitan region surrounding Newark Bay has been one of the largest manufacturing and industrial centers in the eastern United States since the early 1 800s (Mytelka et al. 1 973 ; Whipple et al. 1 976; Wilber and Hunter, 1 979; Rod et al. 1 989). These activities have resulted in pollution from municipal and industrial wastewater, stormwater runoff, accidental spills, direct dumping of wastes, and atmospheric deposition (Olsen et al. 1 984; HydroQual, 1 991) . Furthermore, some of the world's largest mercury industries have operated in the Newark Bay vicinity for nearly a century (Ayres and Ayres, 1 999), contributing to the anthropogenic levels of Hg in Newark Bay sediment as reported by Suszkowski (1 978), Meyerson ( 1 98 1 ), NYC DEP ( 1991 and 1 993), Long et al. ( 1 995), and EPA (1998).
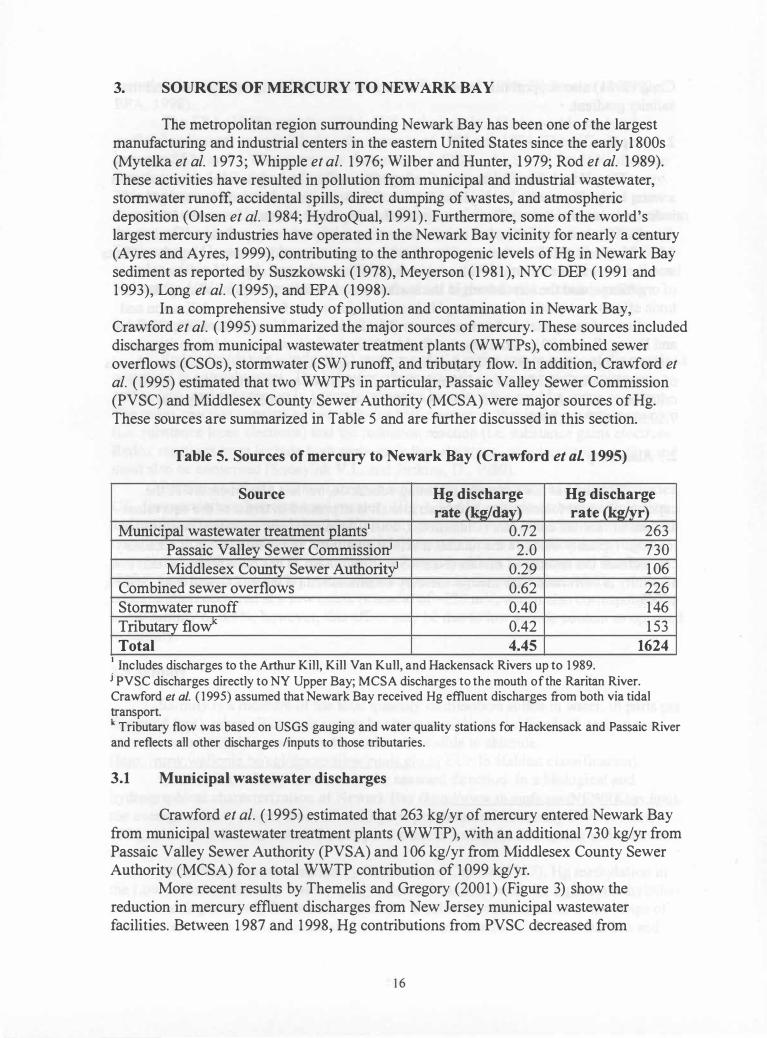
In a comprehensive study of pollution and contamination in Newark Bay, Crawford et al. ( 1 995) summarized the major sources of mercury. These sources included discharges from municipal wastewater treatment plants (WWTPs), combined sewer overflows (CSOs), stormwater (SW) runoff, and tributary flow. In addition, Crawford et al. ( 1 995) estimated that two WWTPs in particular, Passaic Valley Sewer Commission (PVSC) and Middlesex County Sewer Authority (MCSA) were major sources of Hg. These sources are summarized in Table 5 and are further discussed in this section.
Table 5. Sources of mercury to Newark Bay (Crawford et aL 1995)
Source Hg discharge Hg discharge rate (kg/day) rate (kgIyr)
Municipal wastewater treatment plants) 0.72 263 Passaic Valley Sewer Commissiorr 2.0 730 Middlesex County Sewer Authority 0.29 1 06
Combined sewer overflows 0.62 226 Stormwater runoff 0.40 146 Tributan' flow"_ 0.42 1 53 Total 4.45 1624
) Includes discharges to the Arthur Kill, Kill Van Kull, and Hackensack Rivers up to 1 989.
j PVSC discharges directly to NY Upper Bay; MCSA discharges to the mouth of the Raritan River. Crawford et a/. ( 1 995) assumed that Newark Bay received Hg effluent discharges from both via tidal transport. k Tributary flow was based on USGS gauging and water quality stations for Hackensack and Passaic River and reflects all other discharges linputs to those tributaries.
3.1 Municipal wastewater discharges
Crawford et al. ( 1 995) estimated that 263 kg/yr of mercury entered Newark Bay from municipal wastewater treatment plants (WWTP), with an additional 730 kg/yr from Passaic Valley Sewer Authority (PVSA) and 1 06 kg/yr from Middlesex County Sewer Authority (MCSA) for a total WWTP contribution of 1 099 kg/yr.
More recent results by Themelis and Gregory (2001 ) (Figure 3) show the reduction in mercury effluent discharges from New Jersey municipal wastewater facilities. Between 1 987 and 1 998, Hg contributions from PVSC decreased from
1 6
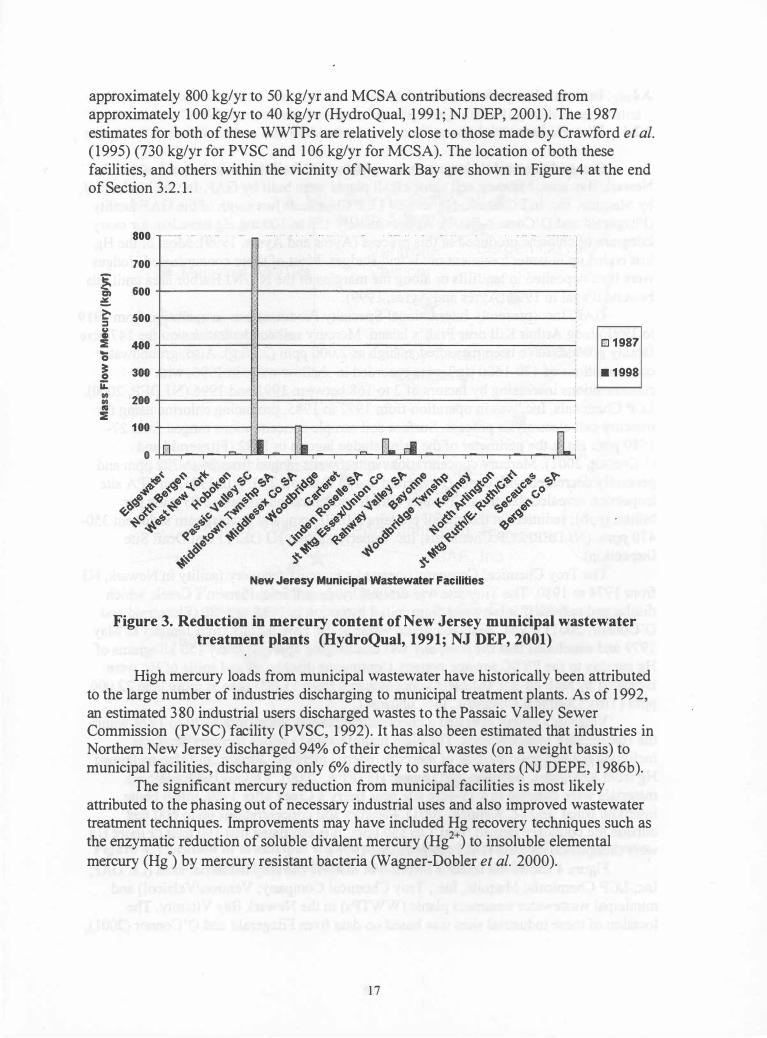
approximately 800 kglyr to 50 kglyr and MCSA contributions decreased from approximately 1 00 kglyr to 40 kglyr (Hydro Qual, 1 99 1 ; NJ DEP, 2001 ). The 1 987 estimates for both of these WWTPs are relatively close to those made by Crawford et al. ( 1995) (730 kglyr for PVSC and 1 06 kglyr for MCSA). The location of both these facilities, and others within the vicinity of Newark Bay are shown in Figure 4 at the end of Section 3.2. 1 .
800 ......... --...... .... -............... -........... -....................................... . ............ --...... --.... -................................... -.. -........ ---......... --.... -.............. -............. .......... .
700 +-------1 t----------------------" � 600 +-------1 1------------------. :!. � 500 +-------1 1---------------------' � � � �o +-----� �----------------� � � 300 +-------1 1-----�-----------� ii: = 200 +--------� �---------------------� IG � 100 +-------1 1--�r_---------------�
o n = ,. I ·� rL LI rL
0 1 987
. 1 998
Figure 3. Reduction in mercury content of New Jersey municipal wastewater treatment plants (HydroQual, 1991; NJ DEP, 2001)
High mercury loads from municipal wastewater have historically been attributed to the large number of industries discharging to municipal treatment plants. As of 1 992, an estimated 380 industrial users discharged wastes to the Passaic Valley Sewer Commission (PVSC) facility (PVSC, 1 992). It has also been estimated that industries in Northern New Jersey discharged 94% of their chemical wastes (on a weight basis) to municipal facilities, discharging only 6% directly to surface waters (NJ DEPE, 1 986b).
The significant mercury reduction from municipal facilities is most likely attributed to the phasing out of necessary industrial uses and also improved wastewater treatment techniques. Improvements may have included Hg recovery techniques such as the enzymatic reduction of soluble divalent mercury (Hg2+) to insoluble elemental mercury (Hgo) by mercury resistant bacteria (Wagner-Dobler et al. 2000).
1 7
3.2 Industrial wastewater discharges
3.2.1 Historic industrial sites
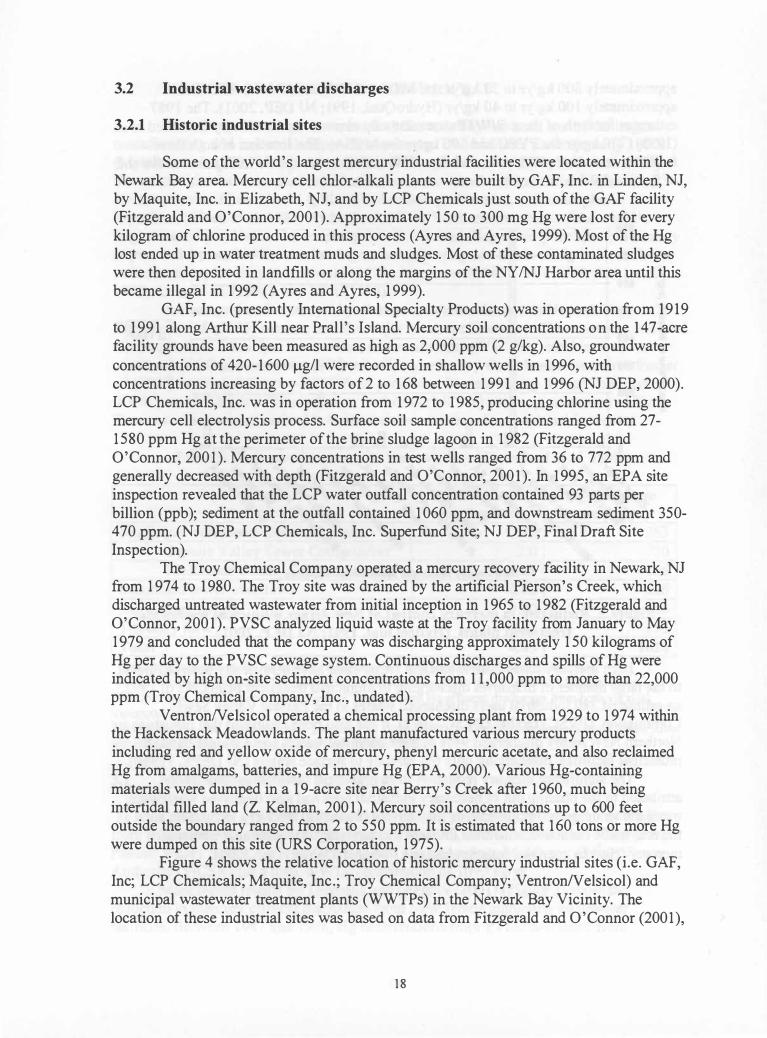
Some of the world's largest mercury industrial facilities were located within the Newark Bay area. Mercury cell chlor-alkali plants were built by GAF, Inc. in Linden, NJ, by Maquite, Inc. in Elizabeth, NJ, and by LCP Chemicals just south of the GAF facility (Fitzgerald and O'Connor, 200 1 ). Approximately 1 50 to 300 mg Hg were lost for every kilogram of chlorine produced in this process (Ayres and Ayres, 1999). Most of the Hg lost ended up in water treatment muds and sludges. Most of these contaminated sludges were then deposited in landfills or along the margins of the NYINJ Harbor area until this became illegal in 1 992 (Ayres and Ayres, 1 999).
GAF, Inc. (presently International Specialty Products) was in operation from 1919 to 1 99 1 along Arthur Kill near Prall's Island. Mercury soil concentrations on the 147 -acre facility grounds have been measured as high as 2;000 ppm (2 g/kg). Also, groundwater concentrations of 4 20- 1 600 �g/l were recorded in shallow wells in 1 996, with concentrations increasing by factors of2 to 1 68 between 1 99 1 and 1 996 (NJ DEP, 2000). LCP Chemicals, Inc. was in operation from 1 972 to 1 985, producing chlorine using the mercury cell electrolysis process. Surface soil sample concentrations ranged from 27-1 580 ppm Hg at the perimeter of the brine sludge lagoon in 1 982 (Fitzgerald and O'Connor, 200 1 ). Mercury concentrations in test wells ranged from 36 to 772 ppm and generally decreased with depth (Fitzgerald and O'Connor, 200 1 ). In 1 995, an EPA site inspection revealed that the LCP water outfall concentration contained 93 parts per billion (Ppb); sediment at the outfall contained 1 060 ppm, and downstream sediment 350-470 ppm. (NJ DEP, LCP Chemicals, Inc. Superfund Site; NJ DEP, Final Draft Site Inspection).
The Troy Chemical Company operated a mercury recovery facility in Newark, NJ from 1 974 to 1 980. The Troy site was drained by the artificial Pierson's Creek, which discharged untreated wastewater from initial inception in 1 965 to 1 982 (Fitzgerald and O'Connor, 200 1 ). PVSC analyzed liquid waste at the Troy facility from January to May 1 979 and concluded that the company was discharging approximately 1 50 kilograms of Hg per day to the PVSC sewage system. Continuous discharges and spills of Hg were indicated by high on-site sediment concentrations from 1 1 ,000 ppm to more than 22,000 ppm (Troy Chemical Company, Inc., undated).
VentronIV elsicol operated a chemical processing plant from 1 929 to 1 974 within the Hackensack Meadowlands. The plant manufactured various mercury products including red and yellow oxide of mercury, phenyl mercuric acetate, and also reclaimed Hg from amalgams, batteries, and impure Hg (EPA, 2000). Various Hg-containing materials were dumped in a 1 9-acre site near Berry's Creek after 1 960, much being intertidal filled land (Z. Kelman, 200 1 ). Mercury soil concentrations up to 600 feet outside the boundary ranged from 2 to 550 ppm. It is estimated that 1 60 tons or more Hg were dumped on this site (URS Corporation, 1 975).
Figure 4 shows the relative location of historic mercury industrial sites (i.e. GAF, Inc; LCP Chemicals; Maquite, Inc.; Troy Chemical Company; VentronIV elsicol) and municipal wastewater treatment plants (WWTPs) in the Newark Bay Vicinity. The location of these industrial sites was based on data from Fitzgerald and O'Connor (2001 ),
1 8
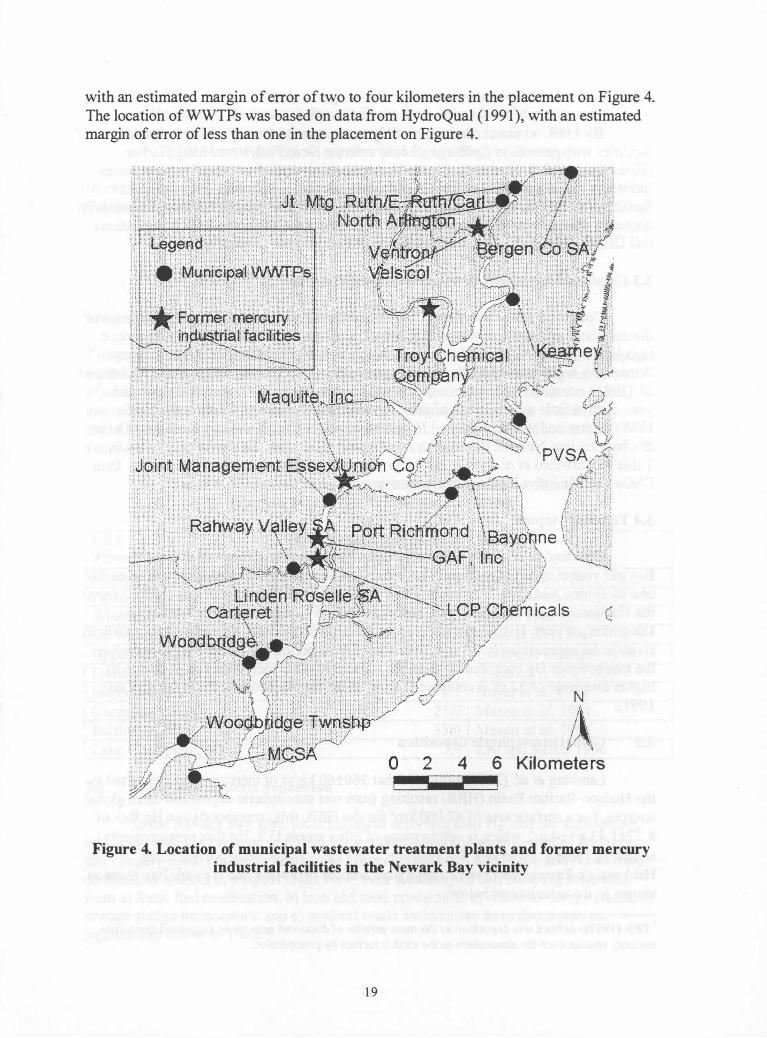
with an estimated margin of error of two to four kilometers in the placement on Figure 4. The location of WWTPs was based on data from HydroQual ( 199 1 ), with an estimated margin of error of less than one in the placement on Figure 4.
o 2 4
N l, i'
i/ \ f' '\
c
6 Kilomete rs
Figure 4. Location of municipal wastewater treatment plants and former mercury industrial facilities in the Newark Bay vicinity
1 9
3.2.2 Current industrial wastewater discharges
By 1 989, no direct discharges of Hg were reported for any of 400 industrial facilities with permits to discharge directly into the New YorklNew Jersey Harbor (HydroQual, 199 1 ). However, it is worth emphasizing again that Northern New Jersey industries discharged 94% of their chemical wastes (i.e. weight basis) to municipal facilities (NJ DEPE, 1 986b) because it considered then than mixing hazardous waste with domestic sewage was more cost-effective since it was not subject to RCRA regulations (NJ DEPE, 1986a).
3.3 Combined sewer overflows and stormwater inputs
Combined sewer overflow (CSO) events result from heavy rainfall and consist of discharges of raw sewage, stormwater runoff, and industrial effluents that may contain high levels of suspended solids, bacteria, heavy metals, floatables, nutrients, oxygendemanding organic compounds, oil and grease, etc. (CMC, 1 992; EPA, 1 992). Mytelka et al. ( 1 98 1 ) estimated that precipitation is sufficient to cause CSO events 56 days each year, with as little as 0. 1 inches of rain. The Interstate Sanitation Commission (lSC, 1 988) determined that there were 1 76 combined sewer overflow outfalls estimated to be discharging into Newark Bay and its surrounding tributaries. As shown previously in Table 4 (Crawford et al. 1 995), 226 kg/yr Hg were estimated to enter Newark Bay from CSOs and 146 kg/yr Hg from stormwater inputs.
3.4 Tributary inputs
Crawford et al. (1 995) estimated that 1 53 kilograms of mercury entered Newark Bay per year from tributary flow. This estimate was reasonably consistent with an earlier one by HydroQual ( 199 1 ), estimating that 4 kg/yr Hg and 142 kg/yr Hg discharged from the Hackensack and Passaic Rivers, respectively into Newark Bay for a total of 146 kilograms per year. HydroQual ( 199 1 ) also determined the total Hg concentration in both rivers to be approximately 0.1 Ilgl1 over a three-year period (i.e. 1 986- 1 989). Therefore, the much higher Hg contribution from the Passaic River is most likely attributed to its higher discharge of 32 m3 Is compared to 3 m3 Is for the Hackensack River (Hydro Qual, 1 99 1 ).
3.5 Global atmospheric deposition
Lamborg et al. (2000) estimated that 360±60 kg/yr of mercury were deposited to the Hudson-Raritan Basin (HRB) resulting from wet atmospheric depositionl from global sources. For a surface area of 42,000 km2 for the HRB, this corresponds to a Hg flux of 8 .57± 1 .43 g/yr_km2, which is within range of other recent U.S. Hg flux measurements shown in Table 6. From this flux estimate, 25±4 kg/yr would be deposited in the Hackensack-Passaic Basin with a negligible amount deposited into Newark Bay alone as shown in the calculations below:
I EPA (1 997a) defined wet deposition as the mass transfer of dissolved gaseous or suspended particulate mercury species from the atmosphere to the earth's surface by precipitation.
20
Hg input to Hackensack-Passaic Basin from atmospheric deposition =
(291 0 km2)x(8.57±1 .43 glyr-km2)x(1 kg / 1 000 g) = 25±4 kg/yr
where: Surface area of the Hackensack-Passaic Basin = 291 0 km2 (Simpson et al. 1975; Suszkowski, 1 978) and
Hg input to Newark Bay from atmospheric deposition =
( 1 7. 1 5 km2)x(8.57±1 .43 glyr-km2)x(1 kg / 1 000 g) = 0 . 1 5±0.02 kglyr == 0 kglyr
where: Surface area of Newark Bay = 1 7. 1 5 km2
Compared to the Hg input of 1624 kglyr estimated by Crawford et al. ( 1 995), Hg inputs resulting from wet atmospheric deposition are negligible. Furthermore, Hg that is deposited into watershed basins will eventually be accounted for in tributaries as it is transported there via surface runoff due to meteorological events. This would likely explain why Crawford et al. ( 1995) did not include atmospheric deposition in his summary of Hg sources and mass loadings to Newark Bay.
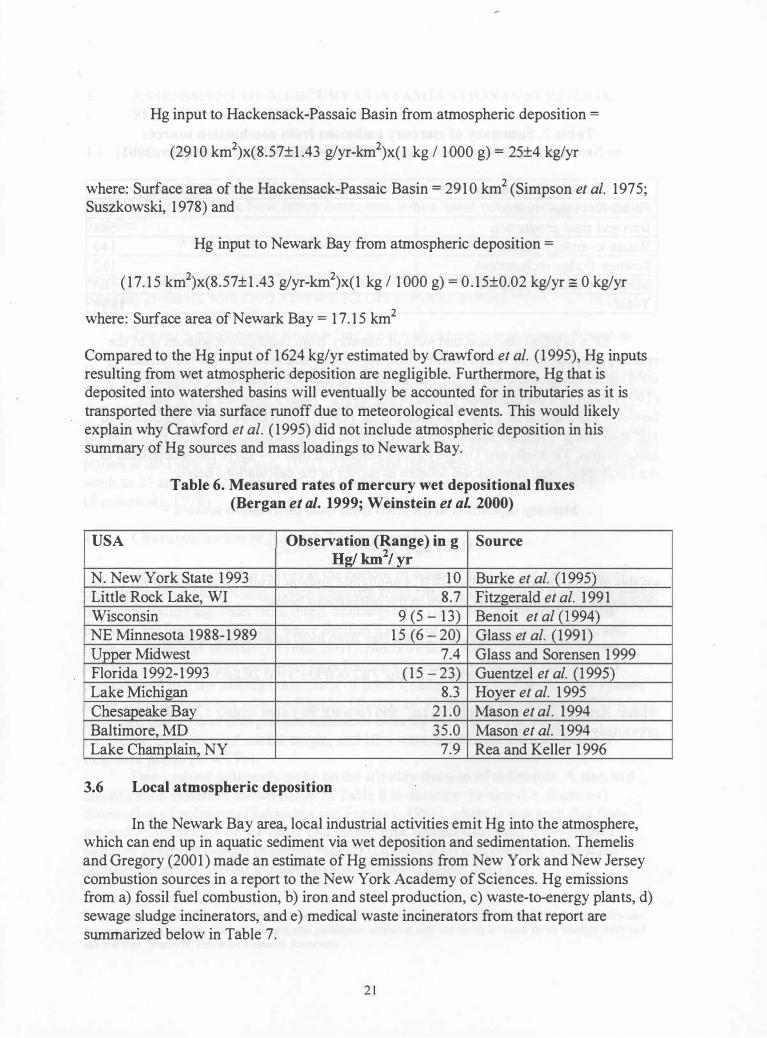
Table 6. Measured rates of mercury wet depositional fluxes (Bergan et al. 1999; Weinstein et aL 2000)
USA Observation (Range) in g
N. New York State · 1 993 Little Rock Lake, WI Wisconsin NE Minnesota 1988- 1 989 Upper Midwest Florida 1992-1 993 Lake Michigan Chesapeake Bay Baltimore, MD Lake Champlain, NY
3.6 Local atmospheric deposition
Hgl km2/yr 1 0
8.7 9 (5 - 1 3)
1 5 (6 - 20) 7.4
( 1 5 - 23) 8.3
2 1 .0 35.0
7.9
Source
Burke et al. ( 1 995) Fitzgerald et al. 199 1 Benoit et al (1994) Glass et al. ( 1991) Glass and Sorensen 1 999 Guentzel et al. (1 995) Hoyer et al. 1 995 Mason et al. 1994 Mason et al. 1 994 Rea and Keller 1 996
In the Newark Bay area, local industrial activities emit Hg into the atmosphere, which can end up in aquatic sediment via wet deposition and sedimentation. Themelis and Gregory (2001 ) made an estimate of Hg emissions from New York and New Jersey combustion sources in a report to the New York Academy of Sciences. Hg emissions from a) fossil fuel combustion, b) iron and steel production, c) waste-to-energy plants, d) sewage sludge incinerators, and e) medical waste incinerators from that report are summarized below in Table 7.
2 1
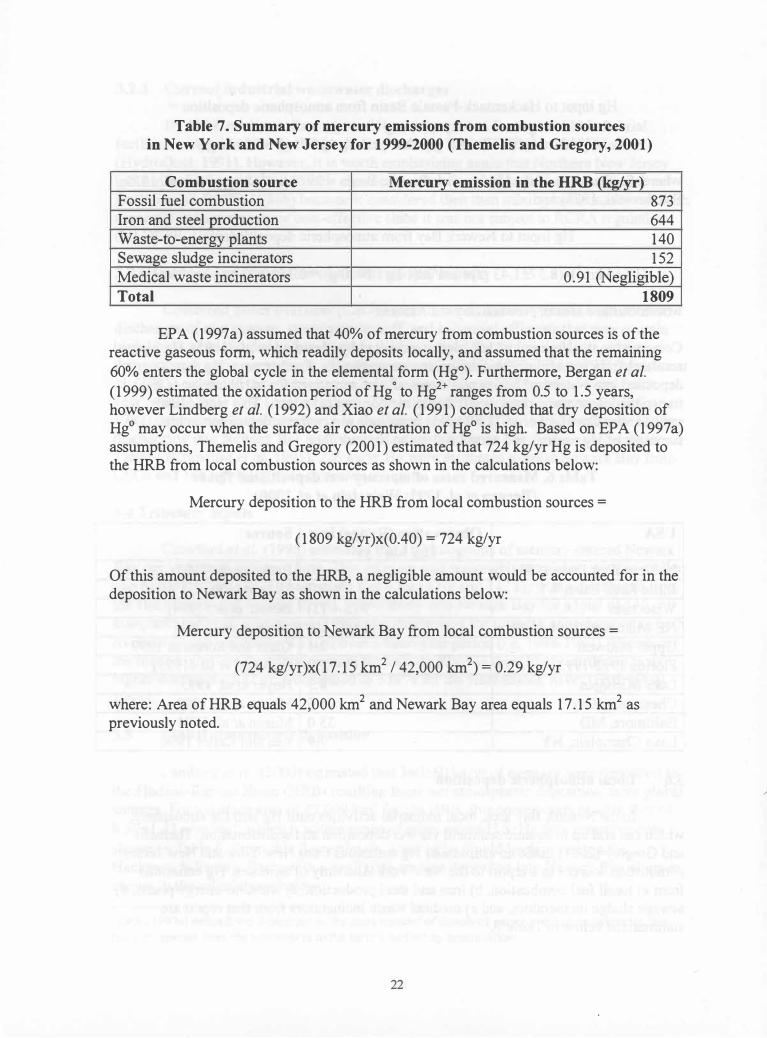
Table 7. Summary of mercury emissions from combustion sources in New York and New Jersey for 1999-2000 (Themelis and Gregory, 2001)
Combustion source Mercury emission in the HRB (kg/yr) Fossil fuel combustion 873 Iron and steel production 644 Waste-to-energy plants 140 Sewage sludge incinerators 1 52 Medical waste incinerators 0.91 (Negligible) Total 1809
EPA (1997a) assumed that 40% of mercury from combustion sources is of the reactive gaseous form, which readily deposits locally, and assumed that the remaining 60% enters the global cycle in the elemental form (HgO). Furthermore, Bergan et al. (1 999) estimated the oxidation period of Hg 0 to Hg2+ ranges from 0.5 to 1 .5 years, however Lindberg et al. ( 1 992) and Xiao et al. ( 1991 ) concluded that dry deposition of Hgo may occur when the surface air concentration of Ht is high. Based on EPA ( 1 997 a) assumptions, Themelis and Gregory (200 1 ) estimated that 724 kglyr Hg is deposited to the HRB from local combustion sources as shown in the calculations below:
Mercury deposition to the HRB from local combustion sources =
( 1 809 kg/yr)x(OAO) = 724 kg/yr
Of this amount deposited to the HRB, a negligible amount would be accounted for in the deposition to Newark Bay as shown in the calculations below:
Mercury deposition to Newark Bay from local combustion sources =
(724 kglyr)x(1 7. 1 5 km2 / 42,000 km2) = 0.29 kglyr
where: Area of HRB equals 42,000 km2 and Newark Bay area equals 1 7. 1 5 km2 as previously noted.
22
/
4. ASSESSMENT OF MERCURY CONTAMINATION IN SURFICIAL SEDIMENTS OF NEWARK BAY
4.1 General description of Newark Bay
Newark Bay is an enclosed estuarinem body of water located in the heavily industrialized New York-New Jersey metro area with a water volume of approximately 0. 1 1 km3:
Water volume = (surface water area) x (average depth) (4. 1 )
where: Surface water area = 1 7. 1 5 km2, determined by area approximation of a Newark Bay map projected with ESRI ArcView 3 .2 GIS software; average depth = 6.7 m (EPA, 1 998)
The main tributaries to Newark Bay are the Hackensack and Passaic Rivers as shown in Figure 5 . HydroQual ( 1 99 1 ) measured the average discharge for the Hackensack River (3 m3/s) and the Passaic River (32 m3/s). Olsen et al. ( 1 984) estimated the drainage basin for each river to be 525 km2 and 2,400 km2, respectively. The net flow through Newark Bay is southward toward the Arthur Kill and Kill Van Kull. However, there are significant diurnal tidal fluxes into Newark Bay and its tributaries that have the potential to transport contaminants from other places within the NY INJ Harbor to the Bay (Olsen et al. 1 984; HydroQual, 1 99 1 ). These tidal influences have been measured as far north as 35 and 27 kilometers up the Hackensack and Passaic Rivers, respectively (Suszkowski, 1 978).
. . .
4.2 Characterization of Newark Bay sediments
Sediment formation occurs at the bottom of water bodies by the deposition of particles in the water column, which originate from either soil and other suspended matter carried by inflowing water from direct discharges (DiToro, 200 1 ). Otherwise, these particles are formed within the water itself as a result of the growth, metabolism, and death of plants and anim�ls (DiToro, 200 1 ). Suszkowski ( 1 978) determined that the majority of Newark Bay sediments have historically been composed of fine-grained particles and that the leading contributor of these smaller sized particles was the Passaic River. This is consistent with findings by Olsen et al. ( 1 984) and Meyerson ( 1 988) whom estimated that 70% of fine-grained sediments entering the NYINJ Harbor were riverbome, 20% were of marine origin, and 1 0% were discharged from wastewater treatment plants (WWTPs).
Fine-grained sediments make up the silt-clay fraction of sediments. A standard classification system is shown below in Table 8 to describe the size (i.e. diameter) distribution of sediments (Salomons and Forstner, 1 984), where it was seen that finegrained sediments are on the order of a factor three smaller than sand. Fine-grained particles generally deposit in deeper regions (DiToro, 2001 ). In contrast, sand-sized particles generally deposit in more shallow regions (DiToro, 200 1 ).
m An estuary is a partially enclosed body of water defined by an area where freshwater flows intennix with saltwater. Estuaries act as cleansers, filtering out upstream pollutants, nutrients, and sediments as water flows through fresh and salt marshes. (National Estuarine Research Reserves).
23
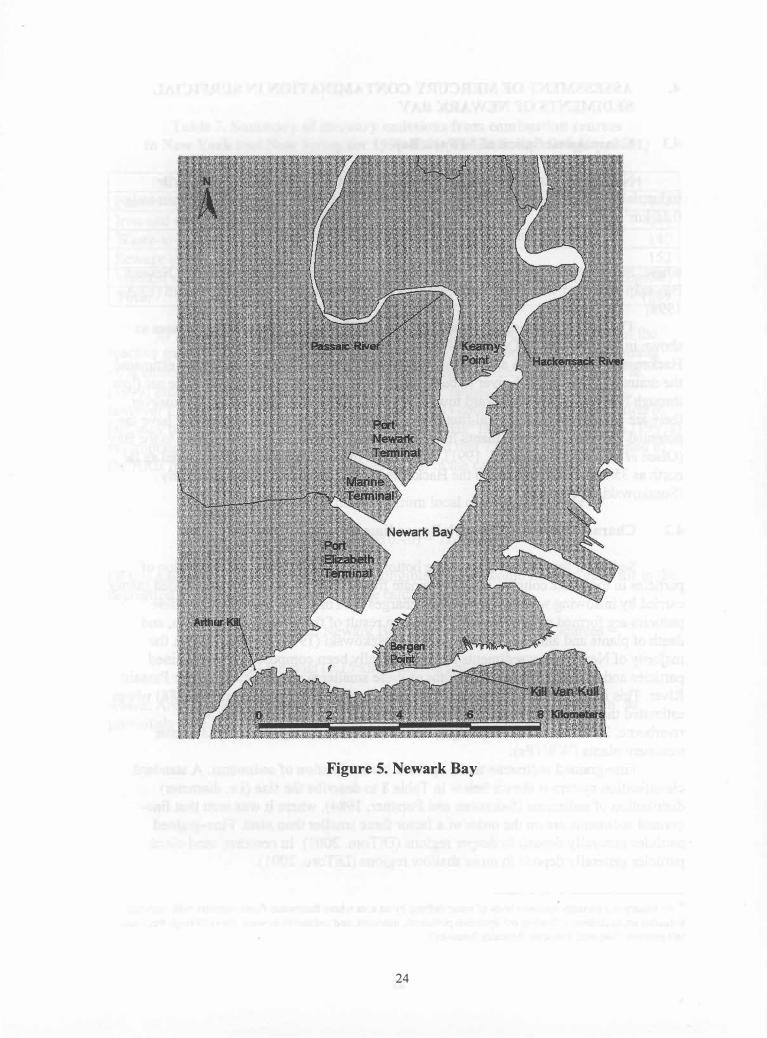
Figure 5. Newark Bay
24
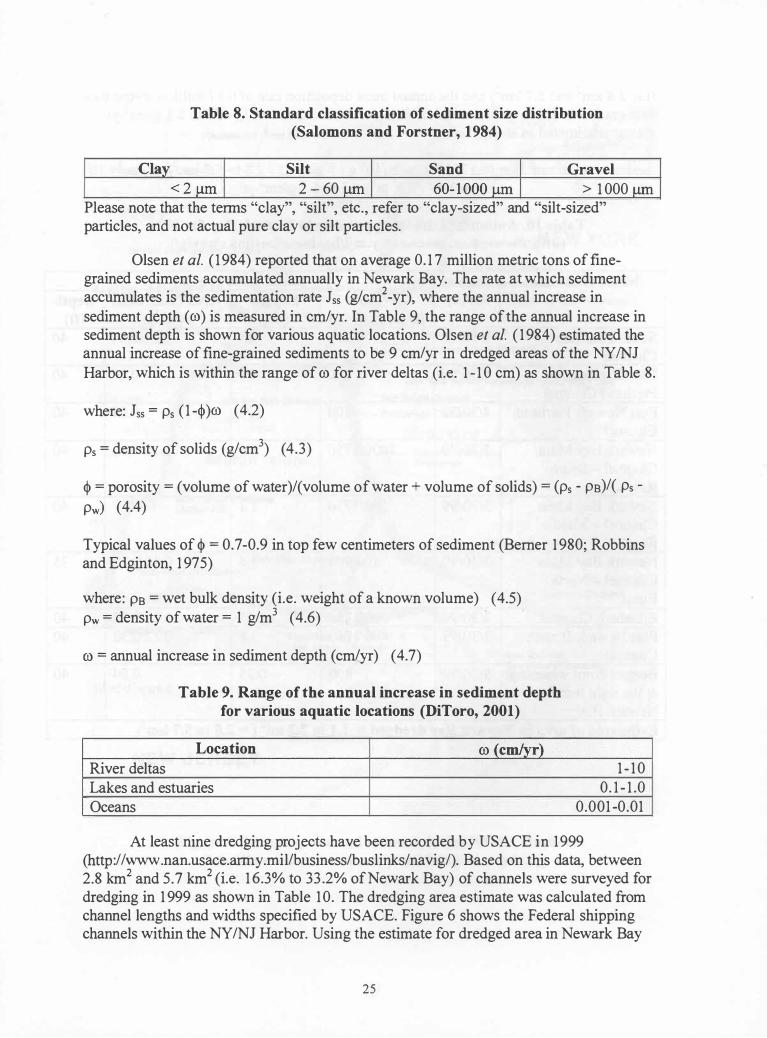
Clay
Table 8. Standard classification of sediment size distribution (Salomons and Forstner, 1984)
Silt Sand Gravel < 2 /lm 2 - 60 /lm 60- 1 000 /lm > 1 000 /lm
Please note that the tenns "clay", "SIlt", etc., refer to "clay-sized" and "silt-sized" particles, and not actual pure clay or silt particles.
Olsen et al. ( 1 984) reported that on average 0. 1 7 million metric tons of finegrained sediments accumulated annually in Newark Bay. The rate at which sediment accumulates is the sedimentation rate Jss (glcm2-yr), where the annual increase in sediment depth (00) is measured in cmlyr. In Table 9, the range of the annual increase in sediment depth is shown for various aquatic locations. Olsen et al. ( 1 984) estimated the annual increase of fine-grained sediments to be 9 cmlyr in dredged areas of the NY INJ Harbor, which is within the range of 00 for river deltas (i.e. 1 - 1 0 cm) as shown in Table 8.
where: Jss = Ps ( 1 -�)00 (4.2)
Ps = density of solids (glcm3) (4.3)
� = porosity = (volume of water)/(volume of water + volume of solids) = (Ps - ps)/( Ps Pw) (4.4)
Typical values of � = 0.7-0.9 in top few centimeters of sediment (Berner 1 980; Robbins and Edginton, 1 975)
where: ps = wet bulk density (i.e. weight of a known volume) (4.5) pw = density of water = 1 g/m3 (4.6)
00 = annual increase in sediment depth (cmlyr) (4.7)
Table 9. Range of the annual increase in sediment depth for various aquatic locations (DiToro, 2001)
Location 00 (cmlyr) River deltas Lakes and estuaries Oceans
1 - 1 0 0. 1 - 1 .0
0.001 -0.01
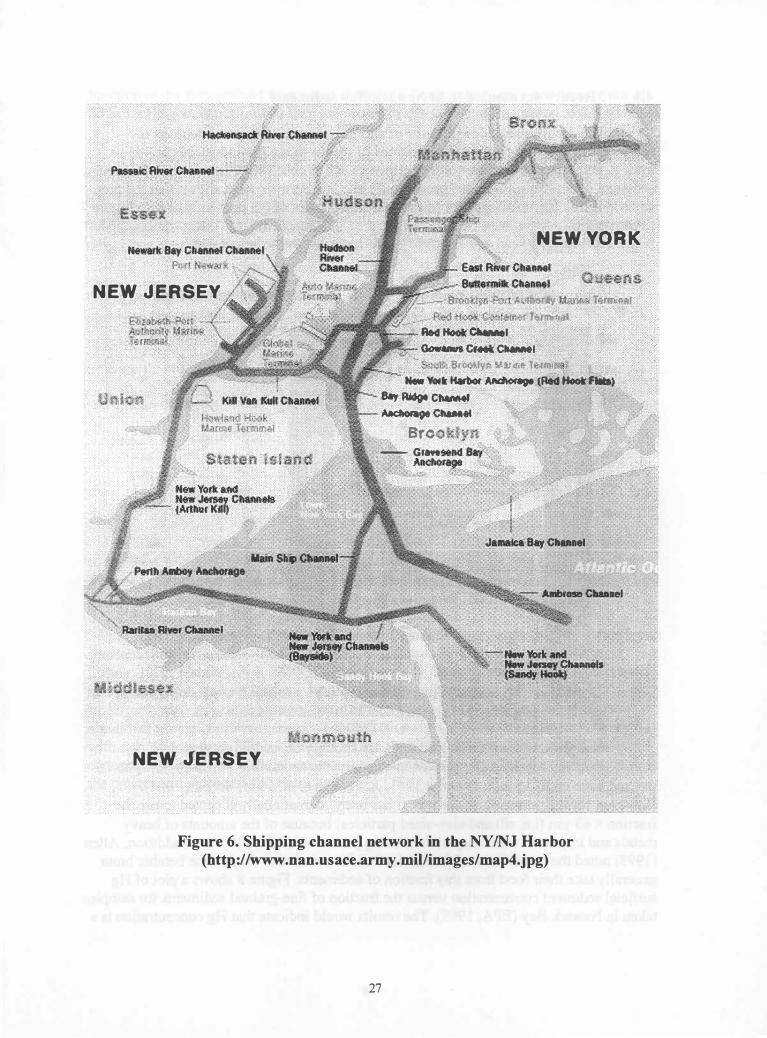
At least nine dredging projects have been recorded by USACE in 1999 (http://www.nan.usace.army.millbusinesslbuslinks/navig/). Based on this data, between 2.8 km2 and 5.7 km2 (i.e. 1 6.3% to 33 .2% of Newark Bay) of channels were surveyed for dredging in 1 999 as shown in Table 1 0. The dredging area estimate was calculated from channel lengths and widths specified by USACE. Figure 6 shows the Federal shipping channels within the NYINJ Harbor. Using the estimate for dredged area in Newark Bay
25
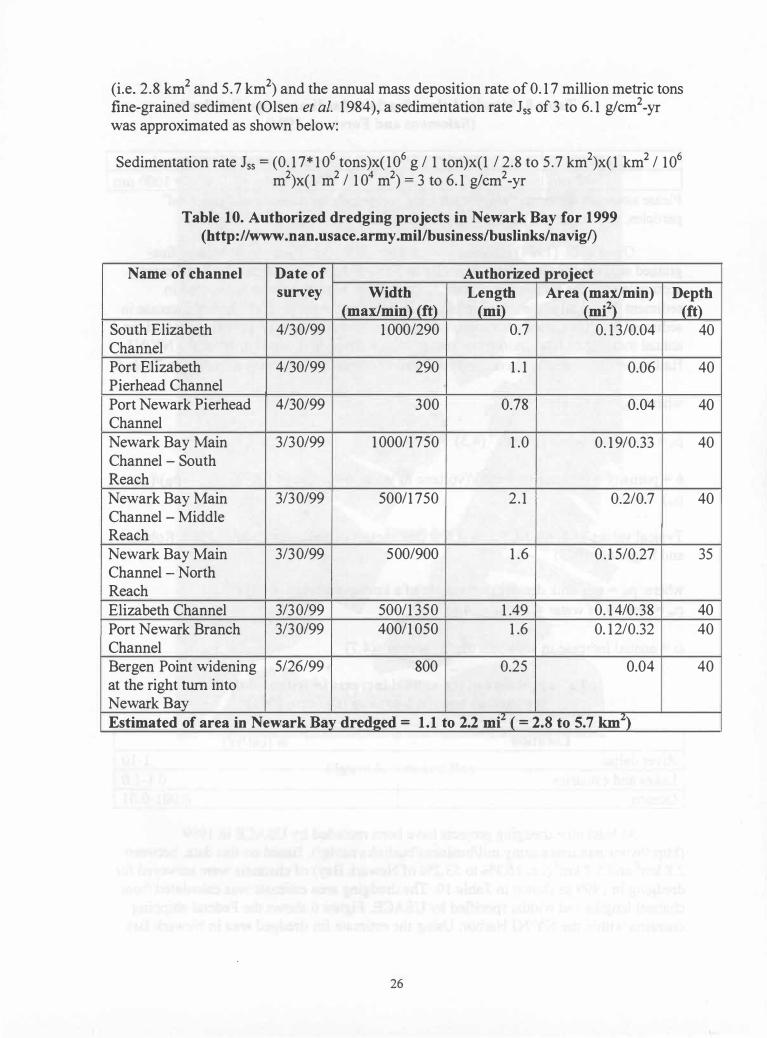
(i.e. 2.8 km2 and 5.7 km2) and the annual mass deposition rate of 0. 1 7 million metric tons fine-grained sediment (Olsen et a1. 1 984), a sedimentation rate Jss of 3 to 6. 1 g!cm2_yr was approximated as shown below:
Sedimentation rate Jss = (0. 1 7* 1 06 tons)x( 106 g / 1 ton)x(1 / 2.8 to 5 .7 km2)x(1 km2 / 106 m2)x(1 m2 / 1 04 m2) = 3 to 6. 1 g!cm2-yr
Table 10. Authorized dredging projects in Newark Bay for 1999 (http://www.nan.usace.army.millbusiness!buslinks/navigl)
Name of channel Date of Authorized project survey Width Length Area (maximin)
(mi2) Depth
(maximin) (ft) (mi) (ft) South Elizabeth 4/30/99 1 000/290 0.7 0. 1 3/0.04 40 Channel Port Elizabeth 4/30/99 290 1 . 1 0.06 40 Pierhead Channel Port Newark Pierhead 4/30/99 300 0.78 0.04 40 Channel Newark Bay Main 3/30/99 1 00011 750 1 .0 0. 1 9/0.33 40 Channel - South Reach Newark Bay Main 3/30/99 50011 750 2 . 1 0.2/0.7 40 Channel - Middle Reach Newark Bay Main 3/30/99 500/900 1 .6 0 . 1 5/0.27 35 Channel - North Reach Elizabeth Channel 3/30/99 500/1 350 1 .49 0. 14/0.38 40 Port Newark Branch 3/30/99 400/1 050 1 .6 0. 12/0.32 40 Channel Bergen Point widening 5/26/99 800 0.25 0.04 40 at the right turn into Newark Bay Estimated of area in Newark Bay dredged = 1.1 to 2.2 me ( = 2.8 to 5.7 kmz)
26
N EW J E-R S EY
NEW J'ER S EY
N EW YOR K
� ��)rt AlJRlon'l,( };(arir:� ieUii<!lil! J �(Ht���U\i�r illl'�11l11
.. AM HooI:'�1 .
�"' .... ::",.- GowMut. CMek CItMMI , ... ¢\# �(<<.)�IS� M.l.I\Jifr t f*"1 �
.... Y<Nt tfaIbot A� (Red Koot'fIIIa) 'Say Ndgt- CtIMMI � CbaI" ""
arc k*ylt �
- Gr ... � � ;'" , Altdlor. �'� " .. � � �.1!:�;.b �;! , ." _,,._.� ... ,A
Figure 6. Shipping channel network in the NY INJ Harbor (http://www.nan.usace.army.millimages/map4.j pg)
27
4.3 Mercury accumulation in Newark Bay sediments
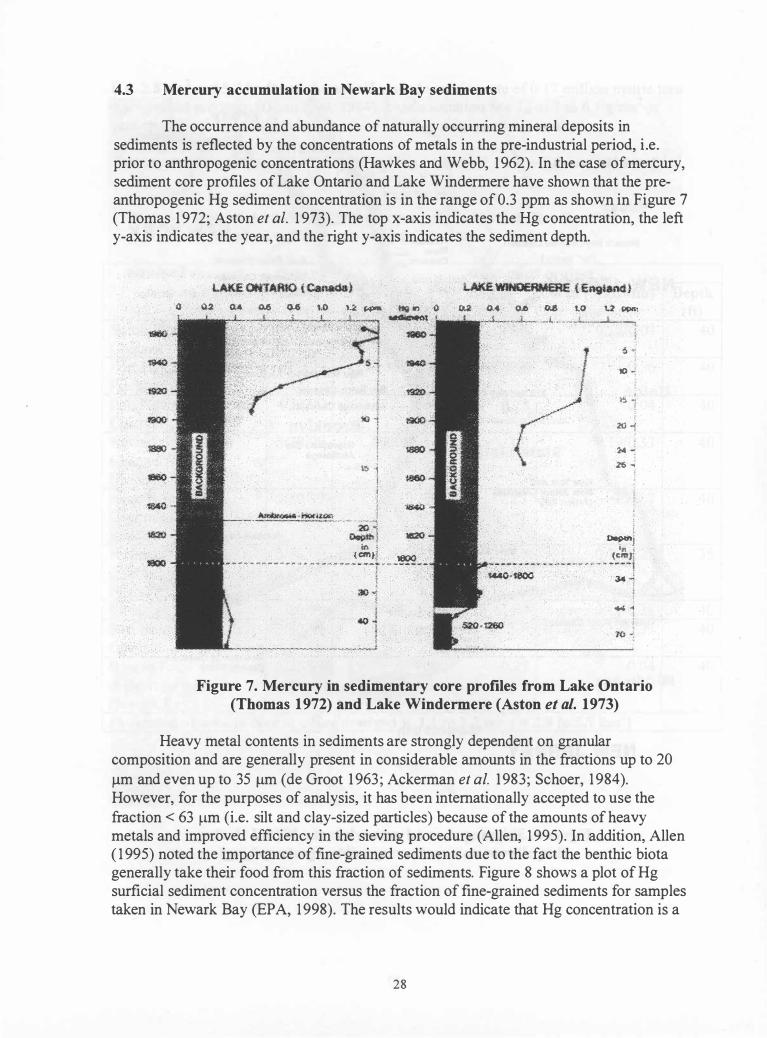
The occurrence and abundance of naturally occurring mineral deposits in sediments is reflected by the concentrations of metals in the pre-industrial period, i .e. prior to anthropogenic concentrations (Hawkes and Webb, 1962). In the case of mercury, sediment core profiles of Lake Ontario and Lake Windermere have shown that the preanthropogenic Hg sediment concentration is in the range of 0.3 ppm as shown in Figure 7 (Thomas 1 972; Aston et al. 1 973). The top x-axis indicates the Hg concentration, the left y-axis indicates the year, and the right y-axis indicates the sediment depth.
4 .\U 1M � 0.6 U) U JoPII' tfIi In i) (U 1M o.e o.a '"0 t.2 ppa, ,....,s._J.....----'---.,l.... • ......,l--"""' .. �t ._L.. • . • _L. __ � 1!1ilO 1880 f
...0
1920
*10
1880
� j 'teeO
i 1CHO -,--�==:..:.:::;=�.�-.. . ... .., 20 '" o.¢hj "CIO ;" , ( CIn J f tI:lOO - - - --- -- - · · · -- - -- --- - --r - - - ---- -31)
I (
� � 10 ";
is "I i :2!l 1
14 � 25 "'
, i 1);;pcft'
i .. 1 (eml' : ·�- ----·-- · · - · -·--I 'I44O.t8OQ . � ..: I ! , "" .; I ,
Figure 7. Mercury in sedimentary core profiles from Lake Ontario (Thomas 1972) and Lake Windermere (Aston et al. 1973)
Heavy metal contents in sediments are strongly dependent on granular composition and are generally present in considerable amounts in the fractions up to 20 Ilm and even up to 35 Ilm (de Groot 1 963 ; Ackerman et al. 1983; Schoer, 1 984), However, for the purposes of analysis, it has been internationally accepted to use the fraction < 63 Ilm (i.e. silt and clay-sized particles) because of the amounts of heavy metals and improved efficiency in the sieving procedure (Allen, 1 995). In addition, Allen ( 1 995) noted the importance of fine-grained sediments due to the fact the benthic biota generally take their food from this fraction of sediments. Figure 8 shows a plot ofHg surficial sediment concentration versus the fraction of fine-grained sediments for samples taken in Newark Bay (EPA, 1 998). The results would indicate that Hg concentration is a
28
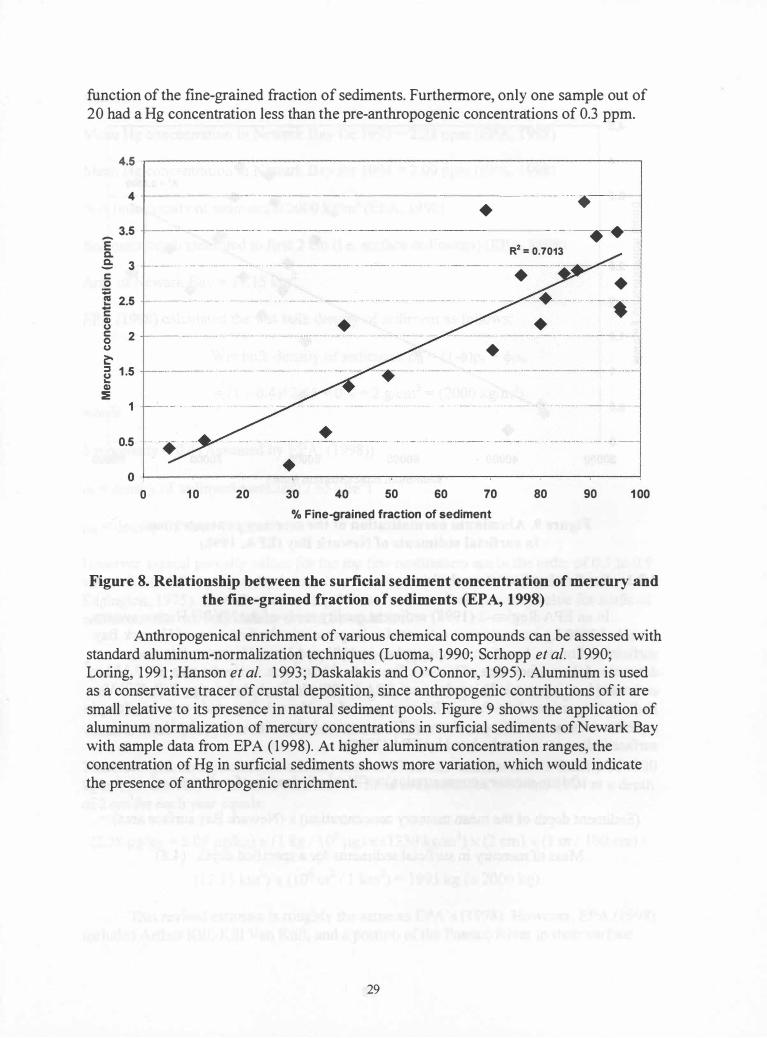
function of the fine-grained fraction of sediments. Furthermore, only one sample out of 20 had a Hg concentration less than the pre-anthropogenic concentrations of 0.3 ppm.
4.5 .-------------------------------------------------------�
4 -j------------- ------------- ----- - - -- -.• 3.5
e-o. S 3 c o � 2.5 c CI) u 5 2 u � � 1 .5 .. CI) � 1
0.5
-- ---.-. R2 = 0.7013
• • ---------- --- -- - --- ---- - - ------- - --- - --------- -----, ----- --- -- - ---- -- -- ---+----- - -- - -.
• • --- -----------------------------�--- ---- -----------•
o L-______________ �----------�----�----�----------�--� o 10 20 30 40 50 60 70 80 90 1 00
% Fine-grained fraction of sediment
Figure 8. Relationship between the surficial sediment concentration of mercury and the fine-grained fraction of sediments (EPA, 1998)
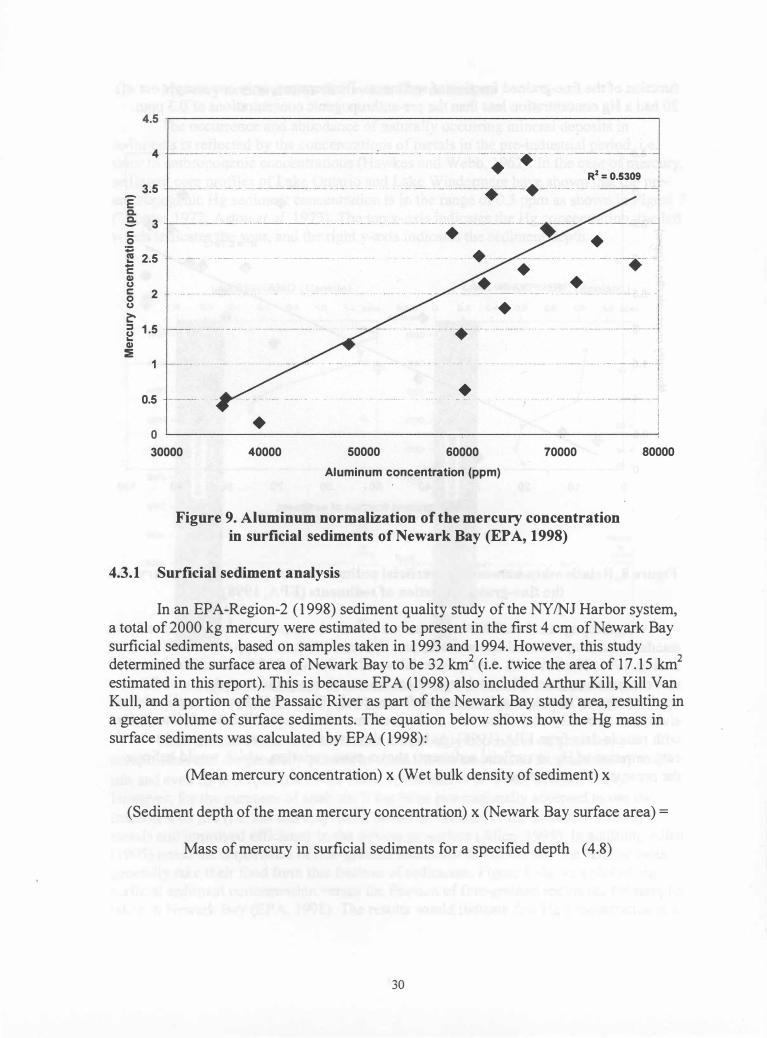
Anthropogenical enrichment of various chemical compounds can be assessed with standard aluminum-normalization techniques (Luoma, 1 990; Scrhopp et al. 1 990; Loring, 199 1 ; Hanson et al. 1 993 ; Daskalakis and O'Connor, 1 995). Aluminum is used as a conservative tracer of crustal deposition, since anthropogenic contributions of it are small relative to its presence in natural sediment pools. Figure 9 shows the application of aluminum normalization of mercury concentrations in surficial sediments of Newark Bay with sample data from EPA ( 1 998). At higher aluminum concentration ranges, the concentration of Hg in surficial sediments shows more variation, which would indicate the presence of anthropogenic enrichment.
29
4.5 r------------------------------,
4
3.5 E Q. .e 3 c o � 2.5 c Q) u a 2 u � � 1 .5 ... Q) � 1
0.5
._ -'._- -- _ .- _.- _ . _ ._ ._ .. _ .. _. __ . . __ ._--.- - -- ---- -
_ _ _ . __ __ .. _ ___ _ _ : _+ _ __ _ ___ �.� = O.5309 � i
--_._ ._. __ . ... _-------_._.- .. _. .. - .... - ...... ... _ ... . _-- --_._---- --- - _ . .... --- ------� + ,.. + I .. _.- .-- -. .. . .. - .------- -. --. - . . - .+. -. -- ----.-. - . .. _- - - .
.. - -.-.. --'1 + ,
•
• • I - - --.. -- --- - - . - - - .-. . . - -. - .. I • I -. . - .- - --------- -1 I . . -- - ---- _ . _._ . __ .. _._-_ .. _ ... j I +
. - -_ ._ - _._._- -... --� i o �-----------------------------�------�
30000 40000 50000 60000 70000 Aluminum concentration (ppm)
Figure 9. Aluminum normalization of the mercury concentration in surficial sediments of Newark Bay (EPA, 1998)
4.3.1 Surficial sediment analysis
80000
In an EPA-Region-2 ( 1 998) sediment quality study of the NYINJ Harbor system, a total of 2000 kg mercury were estimated to be present in the first 4 cm of Newark Bay surficial sediments, based on samples taken in 1 993 and 1 994. However, this study determined the surface area of Newark Bay to be 32 km2 (i.e. twice the area of 1 7. 1 5 km2
estimated in this report). This is because EPA ( 1 998) also included Arthur Kill, Kill Van Kull, and a portion of the Passaic River as part of the Newark Bay study area, resulting in a greater volume of surface sediments. The equation below shows how the Hg mass in surface sediments was calculated by EPA ( 1998) :
(Mean mercury concentration) x (Wet bulk density of sediment) x
(Sediment depth of the mean mercury concentration) x (Newark Bay surface area) =
Mass of mercury in surficial sediments for a specified depth (4.8)
30
where:
Mean Hg concentration in Newark Bay for 1 993 = 2.28 ppm (EPA, 1 998)
Mean Hg concentration in Newark Bay for 1 994 = 2.09 ppm (EPA, 1 998)
Wet bulk density of sediment == 2000 kg/m3 (EPA, 1998)
Sediment depth measured to first 2 cm (i.e. surface sediments ) (EPA, 1 998)
Area of Newark Bay = 1 7. 1 5 km2
EPA (1998) calculated the wet bulk density of sediment as follows:
Wet bulk density of sediment: Ps = ( l -cp )Ps + CPPw
= (1 - 0.4)*2.65 + 0.4 = 2 g/cm3 = (2000 kg/m3) where:
cP = porosity = 0.4 (Assumed by EPA, (1 998))
Ps = density of sediment particles (2.65 g/m3)
pw = density of water (1 g/cm3)
However, typical porosity values for the top few centimeters are in the order of 0.7 to 0.9 versus 0.4 to 0.7 at greater depths as already indicated (Berner, 1 980; Robbins and Edgington, 1 975). Therefore, assuming 0.8 as a more realistic porosity value for surficial sediments, the wet bulk density would be equal to:
Ps = ( l -cp)ps + CPPw
= (1 - 0.8)x(2.65 g/cm3) + (0.8)x( 1 g/cm3) = 1 .33 g/cm3 = ( 1 330 kg/m3)
which is more appropriate for sediments that are primarily composed of water.
Therefore with an adjusted Newark Bay area of 1 7. l 5 km2 and a wet bulk density of 1 330 kg/m3, the mercury mass in Newark Bay surficial sediments for 1 993 and 1 994 at a depth of 2 cm for each year equals:
(2.28 Ilg/kg + 2.09 Ilg/kg) x (1 kg 1 1 06 Ilg) x ( 1330 kg/m3) x (2 cm) x (1 m I 1 00 cm) x
( 17. 1 5 km2) x ( 106 m2 1 1 km2) = 1 993 kg (== 2000 kg).
This revised estimate is roughly the same as EPA's ( 1998). However, EPA ( 1998) included Arthur Kill, Kill Van Kull, and a portion of the Passaic River in their surface
3 1
area estimate of Newark Bay. Secondly, EPA (1998) also made a very conservative assumption of the surficial sediment porosity (i.e. � = 0.4) resulting in a wet bulk density that may have been uncharacteristically high (i.e. 2000 kglm3 vs. 1 330 kglm3). Furthermore, EPA (1 998) estimated the mass of Hg in surficial sediment using the average Hg concentration for the entire Harbor sample popUlation (i.e. 0.79 ppm Hg for 1 993 and 0.70 ppm Hg for 1 994) versus the average Hg concentration for Newark Bay (i.e. 2.28 ppm Hg for 1 993 and 2.09 ppm Hg for 1 994) as was done in this report.
4.3.2 Sediment core analyis
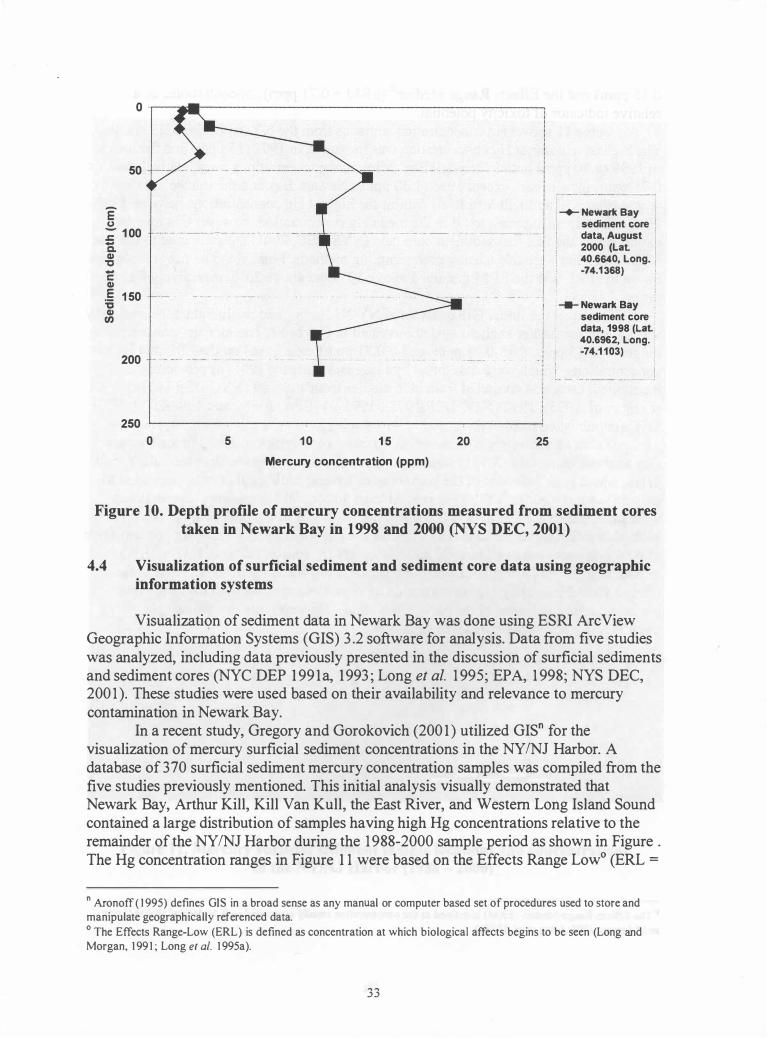
In 1 998 and 2000, the New York State Department of Environmental Conservation (NYS DEC, 200 1 ) took sediment cores from Newark Bay and measured the mercury concentrations. The 1 998 core was take at a location 2.5 km south of Kearny Point along the eastern shore of Newark Bay. The 2000 core was taken approximately 1 km south of the 1998 core, also along the eastern shore. The interpretations of these results are shown in Figures 10 . NYS DEC (2001 ) estimated the average Hg concentration of the sediment cores at specified depth intervals. In Figure 10, the average Hg concentrations are plotted versus the average depth determined from the specified core depth intervals.
For the 1 998 sediment core data shown in Figure 1 0, the mercury concentration increased from 2.7 ppm to 1 3 .8 ppm in the first 50 cm. The Hg concentration then decreased to 1 0.9 ppm a depth of approximately 75 cm, with a peak Hg concentration of 19.5 ppm at a depth of approximately 1 50 cm (Figure 1 0). For the 2000 sediment core data shown in Figure 1 0, the Hg concentration was considerably less compared to 1 998 core data with respect to depth, suggesting that the sediment conditions in Newark Bay are subject to very localized influences.
32
O .-��r---------------------------------------�
I �� �-----50
E u � 100 -c. Q) " -c Q) E 1 50 is Q) en
200
I I � Newark Bay sediment core - - . -.. -.-
--.-
--. . -.
. - --.- . .. -. .. - - --- - ----- -.- - .. _.
-.
-- -.----.---
-. - data, August ! 2000 (Lal
I 40.6640, Long_ I
1.,1 -14-1368)
,
___ Newark Bay sediment core ,!i data, 1998 (Lal i 40.6962, Long.
I '
-:74.,:') .
�
250 �------------------------------------�------� o 5 10 1 5 20 25
Mercury concentration (ppm)
Figure 10. Depth profile of mercury concentrations measured from sediment cores taken in Newark Bay in 1998 and 2000 (NYS DEC, 2001)
4.4 Visualization of surficial sediment and sediment core data using geographic information systems
Visualization of sediment data in Newark Bay was done using ESRI ArcView Geographic Information Systems (GIS) 3 .2 software for analysis. Data from five studies was analyzed, including data previously presented in the discussion of surficial sediments and sediment cores (NYC DEP 1 991a, 1993 ; Long et al. 1 995; EPA, 1 998; NYS DEC, 200 1 ). These studies were used based on their availability and relevance to mercury contamination in Newark Bay.
In a recent study, Gregory and Gorokovich (200 1 ) utilized GISn for the visualization of mercury surficial sediment concentrations in the NYINJ Harbor. A database of 370 surficial sediment mercury concentration samples was compiled from the five studies previously mentioned. This initial analysis visually demonstrated that Newark Bay, Arthur Kill, Kill Van Kull, the East River, and Western Long Island Sound contained a large distribution of samples having high Hg concentrations relative to the remainder of the NYINJ Harbor during the 1 988-2000 sample period as shown in Figure . The Hg concentration ranges in Figure 1 1 were based on the Effects Range Lowo (ERL =
n Aronoff (1 995) defines GIS in a broad sense as any manual or computer based set of procedures used to store and manipulate geographically referenced data.
o The Effects Range-Low (ERL) is defined as concentration at which biological affects begins to be seen (Long and Morgan, 1 991 ; Long et al. 1 995a).
33
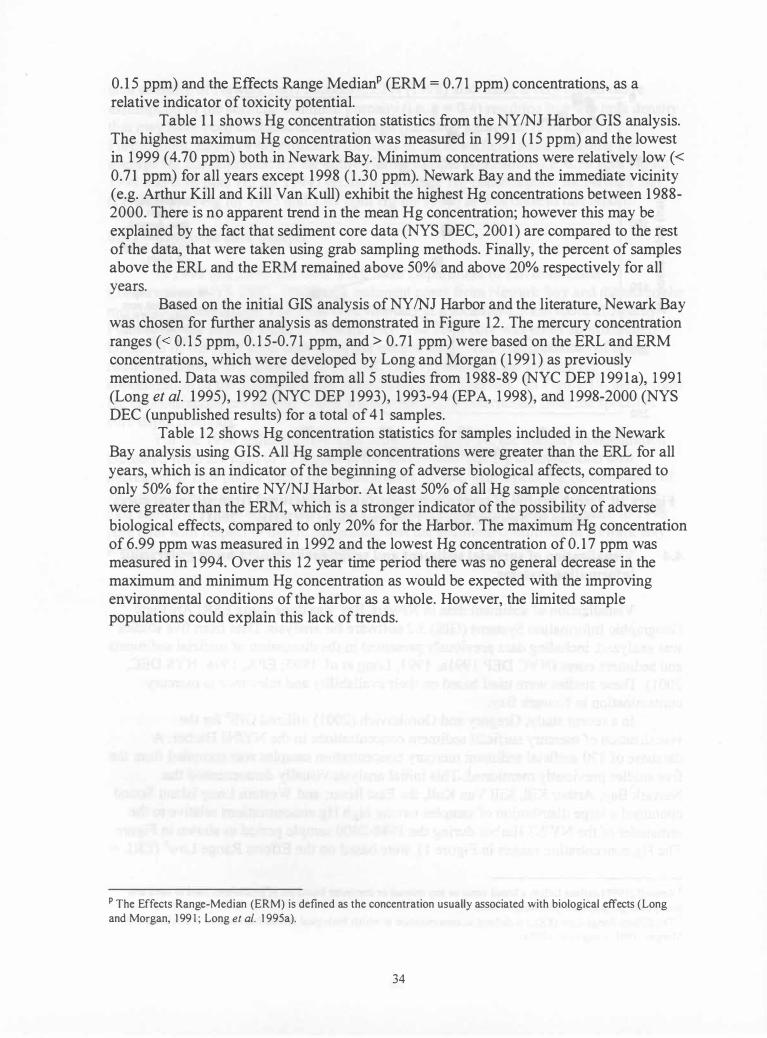
0. 1 5 ppm) and the Effects Range MedianP (ERM = 0.7 1 ppm) concentrations, as a relative indicator of toxicity potential.
Table 1 1 shows Hg concentration statistics from the NY INJ Harbor GIS analysis. The highest maximum Hg concentration was measured in 1 99 1 ( 1 5 ppm) and the lowest in 1 999 (4.70 ppm) both in Newark Bay. Minimum concentrations were relatively low « 0.7 1 ppm) for all years except 1 998 ( 1 .30 ppm). Newark Bay and the immediate vicinity (e.g. Arthur Kill and Kill Van Kull) exhibit the highest Hg concentrations between 1 988-2000. There is no apparent trend in the mean Hg concentration; however this may be explained by the fact that sediment core data (NYS DEC, 200 1 ) are compared to the rest of the data, that were taken using grab sampling methods. Finally, the percent of samples above the ERL and the ERM remained above 50% and above 20% respectively for all years.
Based on the initial GIS analysis ofNYINJ Harbor and the literature, Newark Bay was chosen for further analysis as demonstrated in Figure 1 2. The mercury concentration ranges « 0. 1 5 ppm, 0. 1 5-0.7 1 ppm, and > 0.71 ppm) were based on the ERL and ERM concentrations, which were developed by Long and Morgan ( 1 99 1 ) as previously mentioned. Data was compiled from all 5 studies from 1 988-89 (NYC DEP 1 99 1 a), 1 99 1 (Long et al. 1 995), 1 992 (NYC DEP 1 993), 1 993-94 (EPA, 1 998), and 1 998-2000 (NYS DEC (unpublished results) for a total of 4 1 samples.
Table 1 2 shows Hg concentration statistics for samples included in the Newark Bay analysis using GIS. All Hg sample concentrations were greater than the ERL for all years, which is an indicator of the beginning of adverse biological affects, compared to only 50% for the entire NY INJ Harbor. At least 50% of all Hg sample concentrations were greater than the ERM, which is a stronger indicator of the possibility of adverse biological effects, compared to only 20% for the Harbor. The maximum Hg concentration of 6.99 ppm was measured in 1 992 and the lowest Hg concentration of 0. 1 7 ppm was measured in 1 994. Over this 1 2 year time period there was no general decrease in the maximum and minimum Hg concentration as would be expected with the improving environmental conditions of the harbor as a whole. However, the limited sample populations could explain this lack of trends.
P The Effects Range-Median (ERM) is defined as the concentration usually associated with biological effects (Long and Morgan, 1 99 1 ; Long et al. 1 995a).
34
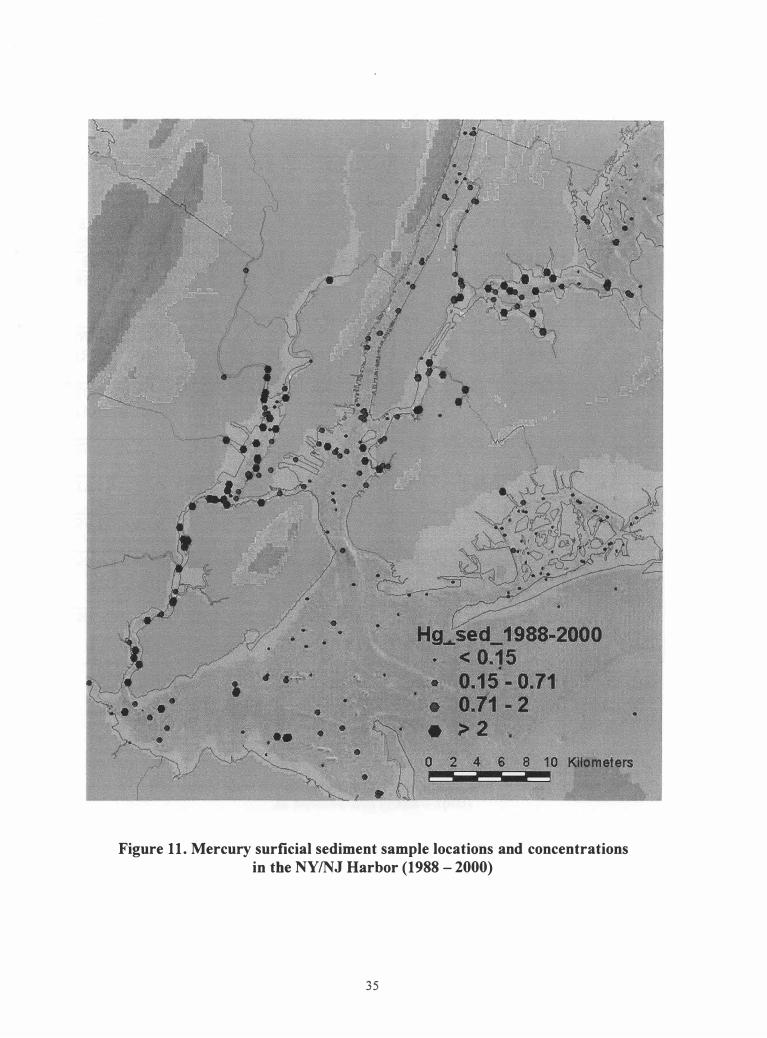
8 1 0 - -
- - -
Figure 11 . Mercury surficial sediment sample locations and concentrations in the NY INJ Harbor (1988 - 2000)
35
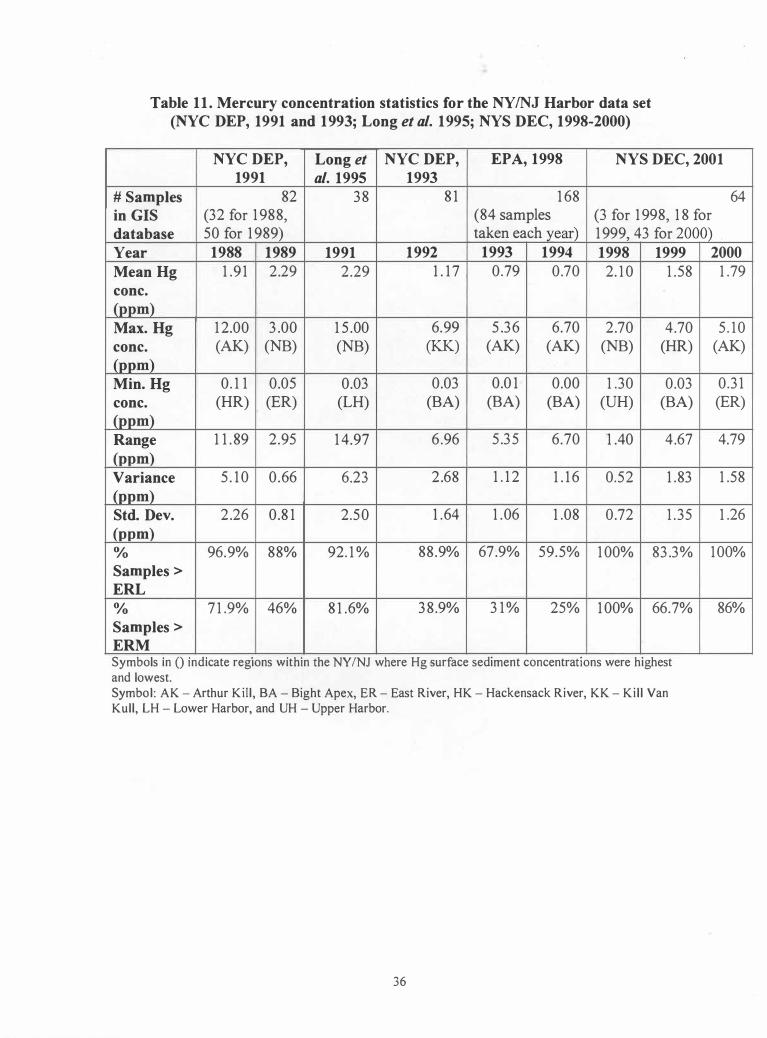
Table 1 1 . Mercury concentration statistics for the NY INJ Harbor data set (NYC DEP, 1991 and 1993; Long et al. 1995; NYS DEC, 1998-2000)
NYC DEP, Long et NYC DEP, EPA, 1998 NYS DEC, 2001 1991 al. 1995 1993
# Samples 82 38 81 1 68 64 in GIS (32 for 1988, (84 samples (3 for 1998, 18 for database 50 for 1989) taken each year) 1999, 43 for 2000) . Year 1988 1989 1991 1992 1993 1994 1998 1999 Mean Hg 1 .9 1 2.29 2.29 1 . 1 7 0.79 0.70 2. 10 1 .58 conc. (ppm) Max. Hg 1 2.00 3.00 1 5.00 6.99 5.36 6.70 2.70 4.70 conc. (AK) (NB) (NB) (KK) (AK) (AK) (NB) (HR)
(ppm) Min. Hg 0. 1 1 0.05 0.03 0.03 0.0 1 0.00 1 .30 0.03 conc. (HR) (ER) (LH) (BA) (BA) (BA) (UH) (BA) (ppm) Range 1 1 .89 2.95 1 4.97 6 .96 5.35 6.70 1 .40 4.67 (ppm) Variance 5. 10 0.66 6.23 2.68 1 . 1 2 1 . 1 6 0.52 1 .83 (ppm) Std. Dev. 2.26 0.8 1 2.50 1 .64 1 .06 1 .08 0.72 1 .35 (ppm) % 96.9% 88% 92. 1 % 88.9% 67.9% 59.5% 100% 83.3% Samples > ERL 0/0 71 .9% 46% 81 .6% 38.9% 3 1% 25% 100% 66.7% Samples > ERM
. .
Symbols In () indIcate regIOns wIthin the NYINJ where Hg surface sedIment concentratIOns were hIghest and lowest. Symbol : AK - Arthur Kill, BA - Bight Apex, ER - East River, HK - Hackensack River, KK - Kill Van Kull, LH - Lower Harbor, and UH - Upper Harbor.
36
2000 1 .79
5. 10 (AK)
0.31 (ER)
4.79
1 .58
1 .26
100%
86%
Figure 12. Mercury sediment sample locations and concentrations in Newark Bay (1988 - 2000)
37
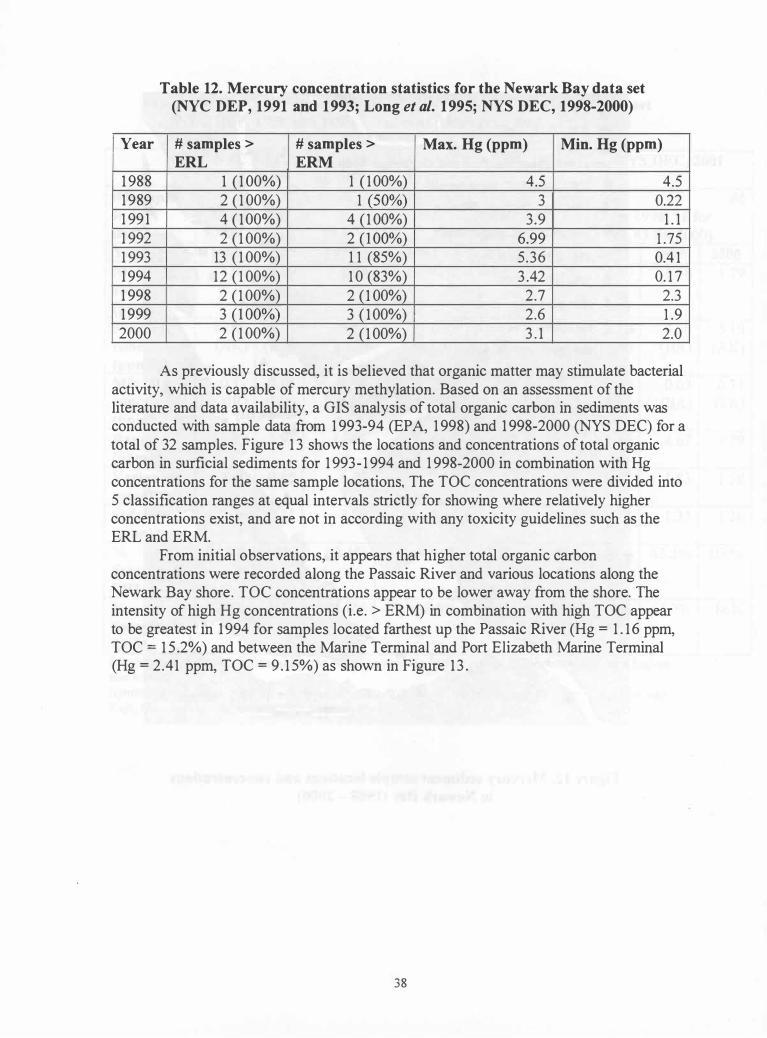
Year
1 988 1 989 1 991 1 992 1 993 1 994 1 998 1 999 2000
Table 12. Mercury concentration statistics for the Newark Bay data set (NYC DEP, 1991 and 1993; Long et al. 1995; NYS DEC, 1998-2000)
# samples > # samples > Max. Hg (ppm) Min. Hg (ppm) ERL ERM
1 ( 1 00%) 1 ( 1 00%) 4.5 4.5 2 ( 1 00%) 1 (50%) 3 0.22 4 ( 1 00%) 4 ( 1 00%) 3.9 1 . 1 2 ( 1 00%) 2 (1 00%) 6.99 1 .75
13 ( 1 00%) 1 1 (85%) 5.36 0.4 1 12 ( 1 00%) 1 0 (83%) 3 .42 0. 1 7 2 ( 1 00%) 2 ( 1 00%) 2.7 2.3 3 (1 00%) 3 ( 1 00%) 2.6 1 .9 2 ( 1 00%) 2 ( 1 00%) 3 . 1 2.0
As previously discussed, it is believed that organic matter may stimulate bacterial activity, which is capable of mercury methylation. Based on an assessment of the literature and data availability, a GIS analysis of total organic carbon in sediments was conducted with sample data from 1 993-94 (EPA, 1 998) and 1 998-2000 (NYS DEC) for a total of 32 samples. Figure 1 3 shows the locations and concentrations of total organic carbon in surficial sediments for 1 993- 1 994 and 1 998-2000 in combination with Hg concentrations for the same sample locations. The TOC concentrations were divided into 5 classification ranges at equal intervals strictly for showing where relatively higher concentrations exist, and are not in according with any toxicity guidelines such as the ERL and ERM.
From initial observations, it appears that higher total organic carbon concentrations were recorded along the Passaic River and various locations along the Newark Bay shore. TOe concentrations appear to be lower away from the shore. The intensity of high Hg concentrations (i.e. > ERM) in combination with high TOC appear to be greatest in 1 994 for samples located farthest up the Passaic River (Hg = 1 . 1 6 ppm, TOC = 1 5 .2%) and between the Marine Terminal and Port Elizabeth Marine Terminal (Hg = 2.41 ppm, TOC = 9 . 1 5%) as shown in Figure 1 3 .
38
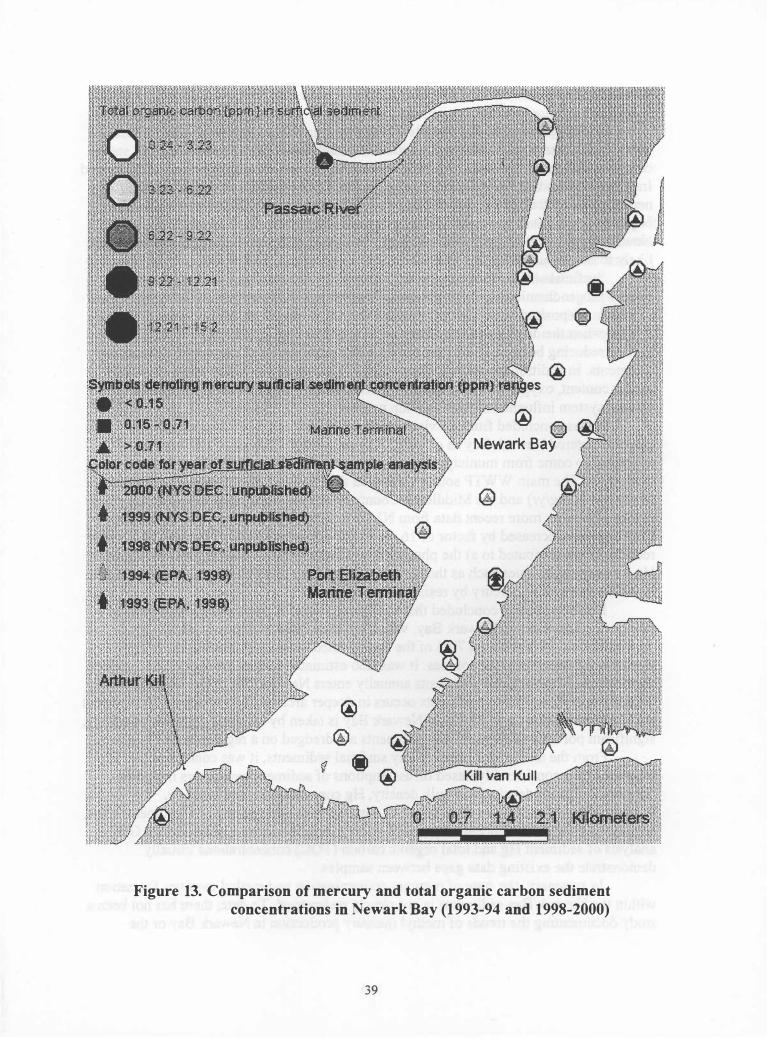
@ @ Newark Bay
Figure 13. Comparison of mercury and total organic carbon sediment concentrations in Newark Bay (1993-94 and 1998-2000)
39
5. CONCLUSION
Mercury in the methyl form is a major health concern because it can bioaccumulate in aquatic life and in humans through the consumption of MeHgcontaminated fish. Past cases of MeHg contamination in human populations of Japan and Iraq have shown that MeHg in high concentrations can result in serious adverse neurological effects. It is recommended that future studies a) update Newark Bay fish population estimates, b) measure MeHg exposure and uptake to commercial fish in Newark Bay, and c) estimate Newark Bay MeHg-contaminated fish populations that are likely to be consumed by the pUblic.
Surficial sediments were chosen as the medium of analysis because the most intense biogeochemical activity of any sediment is concentrated within the surface layer in which a deposited metal participates in a variety of processes. Methyl mercury is formed when the divalent mercury ion reacts with a methyl group via sulfate reduction. Sulfate reducing bacteria (SRB) are the principal methylators of mercury in estuarine sediments. In addition to sulfate reduction, the bulk mercury concentration, organic matter content, oxygen content, sulfide content, salinity, pH, and alkalinity within the aquatic system influence the methylation process.
It was concluded from previous studies that as much as 1 600 kilograms of mercury entered Newark Bay as of 1 99 1 . Approximately 1 1 00 kg of this total was estimated to come from municipal wastewater treatment plant (WWTP) effluent discharges. The main WWTP sources included the Passaic Valley Sewer Commission (PVSC) (730 kg/yr) and the Middlesex County Sewer Authority (MCSA) ( 1 06 kg/yr) plants. However, more recent data from NJ DEP (200 1 ) indicates that the Hg effluent discharge has decreased by factor of 1 6 for PVSC and a factor of 2.5 for MSCA. Drastic reductions are attributed to a) the phasing out of commercially used Hg and b) improved Hg recovery techniques such as the enzymatic reduction of soluble divalent mercury into insoluble elemental mercury by resistant bacteria.
Previous studies concluded that the Passaic River is the leading contributor of fine-grained particles to Newark Bay, which are associated with heavy metal contamination. An estimated 70% of the fine-grained sediments entering the NYINJ Harbor are from riverbome sources. It was also estimated that an average of 0. 1 7 million metric tons of fine-grained sediments annually enters Newark Bay. More importantly, deposition of fine-grained sediments occurs in deeper areas such as channels. The present study estimated that up to 33 .2% of Newark Bay is taken by shipping channels; therefore, significant portions of Newark Bay sediments are dredged on a regular basis.
From the analysis of Newark Bay surficial sediments, it was concluded that Hg estimates vary considerably based on assumptions of sediment parameters including porosity, sediment density, wet bulk density, Hg concentration, and location. Furthermore, sediment core data, based on samples take approximately 1 kilometer apart, suggest that sediment concentrations vary widely from location to location. The GIS analysis of sediment Hg and total organic carbon (TOC) concentrations visually demonstrate the existing data gaps between samples.
In summary, the state of mercury contamination and methyl mercury formation within the Newark Bay sediments is not clearly understood. To date, there has not been a study documenting the trends of methyl mercury production in Newark Bay or the
40
NYINJ Harbor as a whole. The reason for this is two-fold: a) Sampling has been random and isolated to single-year events; b) Sampling parameters have not included the sulfate and sulfide concentrations, which are important in determining the methylation and sulfate reduction rates. Therefore, it is recommended that longer observation periods be implemented, taking into account the vertical (sediment cores) and horizontal sediment distributions. It is also recommended that sediment core sampling be conducted on a periodic basis to determine the trends of Hg contamination in Newark Bay sediments. Establishing better trends is essential to determining whether remediation is necessary. It is recommended that future studies of mercury contamination in Newark Bay sediments be modeled after past studies conducted in Minamata Bay, incorporating sulfate and sulfide sampling, long observation periods, and horizontal and vertical sediment distributions. In the Appendix of this study, this issue is further discussed in a report on mercury contamination in Minamata Bay, conducted for the Department of Earth and Environmental Engineering, Solid and Hazardous Waste Management course, April 200 1 .
4 1
6. References
Ackennann, F., Bergmann, N., and Schleichert, U. ( 1 983). Monitoring of heavy metals in coastal and estuarine sediments - a question of grain-size: < 20 versus < 60 J.!m, Environ. Techno!. Lett. 4: 3 1 7-328.
AI-Hussaini, M.M. 1 977. "Contribution to the engineering soil classifications of cohessionless soils". Final report, Miscellaneous paper S-77-21 , U.S. Anny Engineer Waterways Experiment Station, Vicksburg, Mississippi, 6 1 pp.
Allen, H.E. ( 1 995). Metal in Contaminated Aquatic Sediments. Ann Arbor Press, Inc. Chelsea, Michigan.
Andren, A.W. and Harriss, RC. ( 1 975) . Observations on association between mercury and organic matter dissolved in natural waters. Geochemica et Cosmochimica Acta 39: 1 253- 1 257.
Anid (200 1 ) Methyl Mercury Formation by sulfate reducing bacteria (SRBs) diagram. Personal communication.
API (Center for Analysis of Public Issues). ( 1 972). Pollution Control on the Passaic River. American Petroleum Institute. Princeton, NJ.
Aronoff, S. ( 1 989) Geographic Information Systems: A Management Perspective. ASTM ( 1 992). Standard guide for conducting 1 0-day static sediment toxicity tests with
marine and estuarine amphipods, E 1 367-92. American Society of Testing Materials, Philadelphia, P A.
ASTM ( 1 99 1 ). Standard guide for conducting 1 0-day static sediment toxicity tests with marine and estuarine amphipods, E 1367�9 1 . American Society of Testing Materials, Philadelphia, P A.
Aston, S.R, Bruty, D., Chester, R, and Padgham, R. ( 1 973). Mercury in Lake Sediments. A possible indicator of technological growth. Nature (London) 24: 450-45 1 .
Bakir, F., S .F. Damluji, L . Amin-Zaki, M. Murtadha, A. Khalidi, N.Y. Al-Rawi, S.T. Kriti, H.I. Dhahir, T.W. Clarkson, J.C. Smith, and RA. Doherty ( 1 973). "Methylmercury poisoning in Iraq." Science 1 8 1 : 230-241 .
Bartlett, P.D. and Craig, PJ. ( 198 1 ). Total mercury and methyl mercury levels in British estuarine sediments-II. Wat. Res. 15, 37 -47.
Becker, D.S. and G.N. Bigham. 1 995. Distribution of mercury in the aquatic food web of Onondaga Lake, New York. Water Air Soil Pollut. 80:563-57 1 .
Belton, TJ., Hazen, R , Ruppel, B.E., Lockwood, K.R, Mueller, J.A., Stevenson, E., and Post, JJ. ( 1 985). A Study of Dioxin (2,3, 7, 8-Tetrachlorodibenzo-p-dioxin) Contamination in Select Fin-fish, Crustaceans, and Sediments of New Jersey Waterways. New Jersey Department of Environmental Protection. Office of Science and Research. Trenton, NJ.
Benoit, J.M. (200 1 ). Methylmercury cycling in NYINJ Harbor: Implications for mitigating high mercury levels in harbor fish (DRAFT). Department of Geosciences, Princeton University, Princeton, NJ 08554. Prepared for the "Industrial Ecology, Pollution Prevention and the NYINJ Harbor Project of the New York Academy of Sciences.
Benoit, J.M., Gilmour, C.C., Mason, R.P., and Heyes, A. ( 1 999). Sulfide controls on mercury speciation and bioavailability to methylating bacteria in sediment pore waters.
42
Benoit, J.M., Fitzgerald, W.F. Damman, A.W., ( 1 994). Historical atmospheric mercury deposition in the mid-continental u.s. as recorded in a ombotrophic peat bog. In: Watras, C., Huckabee, 1. (Eds.), Mercury Pollution: Integration and Synthesis, Ch. H2. Lewis Publishers, Boca Raton, Florida.
Bergan, T. Gallardo, L., and Rodhe, H. ( 1 999). Mercury in the global troposphere: a three-dimensional model study. Atmospheric Environment 33 1 575- 1 585.
Berglund, F., M. Berlin, G. Birke, R. Cedarlof, U. von Euler, L. Friberg, B. Holmstedt, E. Jonsson, K.G. Tejning, ( 1 97 1 ). "Methylmercury in fish, A Toxicological Epidemiologic Evaluation of Risks." Report from an Expert Group. Nordisk Hygienisk Tidskrift (Supplementum 4)
Berner, R.A. ( 1 980) Early diagenesis - A theoretical approach. Princeton University Press, Princeton, N J.
Bloom, N.S., C.J. Watras and J.P. Hurley. 1 99 1 . Impact of acidification on the methylmercury cycle of remote seepage lakes. Water Air Soil Pollut. 56:477-49 1 .
Blum, J.E. and Bartha, R. ( 1 980). Effects of salinity on methylation of mercury. Bull. Environ. Contam. Toxico!. 25: 404-408.
Bopp, R.F., Gross, M.L., Tong, H., Simpson, H.J., Monson, S.J., Deck, B.L., and Moser, F.C. ( 1 99 1 ). A major incident of dioxin contamination: Sediment of New Jersey estuaries. Environ. Sci. Technol. 25 (5), 95 1 -956.
Bopp, R.F. and Simpson, H.J. ( 1 99 1 ). Sediment Sampling and Radionuclide and Chlorinated Hydrocarbon Analysis in Newark Bay and the Hackensack and Passaic Rivers. Final Report. Contract No. P24096. Submitted to the New Jersey Department of Environmental Protection, Division of Science and Research, Trenton, NJ.
Bopp, R.F. and Simpson, H.J. ( 1 985). Contamination o/the Hudson River: The Sediment Record. Lamont-Doherty Geological Observatory, Columbia University. New York.
Bothner, M. Jahnke, R. A., Peterson, M., and Carpenter, R. ( 1 980). Rate of mercury loss from contaminated estuarine sediments. Geochim. Cosmochim. Acta. 44, 273-285.
Burke, J., Hoyer, M., Keeler, G., Scherbatskoy, T., ( 1 995). Wet deposition of mercury and ambient mercury concentrations at a site in the Lake Champlain basin. Water, Air and Soil Pollution 80, 353-362.
Chang, L.W., M. Gilbert, and J. Sprecher ( 1 978). "Modification of methylmercury neurtoxicity by vitamin E." Environ. Res. 1 7:356-366.
Choi, S-c. and Bartha, R. ( 1 994) Environmental factors affecting mercury methylation in estuarine sediments. Bull. Environ. Contam. Tox. 53 : 805-8 12 .
Choi, S-C. and Bartha, R. ( 1 983). Effects of sea-salt anions on the fonnation and stability of methylmercury. Bull. Environ. Contam. Toxicol. 31 : 486-493 .
Ciemniecki, Dennis. (200 1 ). Elizabethtown Water Company. Bridgewater, NJ. E-mail Communication, January 4, 200 1 .
CMC (Center for Marine Conservation) ( 1 992). Sewage Treatment: America 's Pipe Dream - A Report on Combined Sewage Overflows. Washington, DC.
Cochran, W.G. ( 1 977). Sampling Techniques. John Wiley and Sons, New York, NY Compeau, G. and Bartha, R. ( 1 985). Sulfate-reducing bacteria: principle methylators of
mercury in anoxic estuarine sediment. Appl. Environ. Microbiol. 50: 498-502.
43
Compeau, G. and Bartha, R. ( 1 984). Methylation and demethylation of mercury under controlled redox, pH, and salinity conditions. Appl. Environ. Microbiol. 48: 1 203-1 207.
Cossa, D., Gobeil, C. and Courau, P. ( 1 988). Dissolved mercury behavior in the St. Lawrence estuary. Estuarine Coastal Shelf Sci. 26: 227-230.
Craig, P.J. Moreton, P.A. ( 1 983). Total mercury, methylmercury and sulphide in River Carron sediments. Mar. Poll. Bull. 14: 408-4 1 1 .
Crawford, D.W., Bonnevie, N.L., and Wenning, R.J. ( 1 995). Sources of pollution and sediment contamination in Newark Bay, New Jersey. Ecotox. and Env. Safety 30, 85-1 00.
Daskalakis, K.D. and O'Connor, T.P. ( 1 995). Normalization and elemental sediment contamination in the coastal United States. Environ. Sci. Technol. 29: 470-477.
de Groot, A.J. ( 1 963). Manganese status of Dutch and German holocene sediments. Versl. Landbkd. Onderz. 69.7:37-4 1 .
DiToro, D.M. (200 1 ). Sediment Flux Modeling. John Wiley & Sons, Inc., Publication. New York, NY.
DiToro, D.M., Zarba, C.S., Hansen, D.J., Scott, K.J., Carlson, A.R., and Ankley, G.T. ( 1 992). Acid volatile sulfide predicts the acute toxicity of Cd and Ni in sediments. Environ. Sci & Technol. 26: 96- 1 0 1 .
DiToro, D.M., Zarba, C.S., Hansen, D.J., Scott, K.J., Hicks, M.B., Mayr, S.M., and Redmond, M.S. ( 1 990). Toxicity of cadmium in sediments: the role of acid volatile sulfide. Environ. Toxicol. Chem. 9: 1 487- 1 502.
Efron, B. and Gong, G. ( 1 983). A leisurely look at the bootstrap, the jackknife and crossvalidation. Am. Sta. 37: 36-48.
EPA. Office of Water. National Estuary Program. Program Profiles: New Yor - New Jersey Harbor (Harbor Estuary Program). http://www.epa.gov/owow/estuaries/sheds/hep.gif
EPA. http://www.epa.gov/safewater/mcl.html#inorganic EPA. (2000). Office of Research and Development. Environmental Planning for
Communities - A Guide to the Environmental Visioning Process Utilizing a Geographical Information System (GIS). EPA/6251R-98/003 .
EPA. ( 1 998) Adams, D.A., J.S. O'Connor, and S.B. Weisberg. "Sediment Quality of the NY INJ Harbor System - An Investigation under the Regional Environmental Monitoring and Assessment Program (R-EMAP)", EPA/902-R-98-00 1 .
EPA ( 1 997a). Office of Air Quality Planning and Standards and Office of Research and Development. Mercury Study Report to Congress - Volume 1: Executive Summary. EPA-4521R-97-003. December 1 997.
EPA. ( 1 997b). Mercury Study Report to Congress, Volume II. Inventory of Anthropogenic Emissions in the EPA-4521R-97-004. December 1 997.
EPA ( 1 995). Office of Compliance Sector Notebook Project. Profile of the Iron and Steel Industry. EPA/3 1 0-R-95-005. September 1 995 .
EPA ( 1 994b-f). Technical Support Branch (TSB) Standard Operating Procedures (SOPs) C-48, C-5, C-8, C-72, C-74 (revised Feb. 1 994). USEPA-Region 2 Technical Support Branch, Edison, NJ.
44
EPA ( 1 992). Evaluation o/ Wet Weather Design Standards/or Controlling Pollution from Combined Sewer Overflows, Final Report. Water Quality Branch, Office of Policy, Planning, and Evaluation. Washington, DC.
EPA ( 1 983). Methods/or chemical analysis o/water and wastes, EPA-600/4-79-020. U.S. Environmental Protection Agency, Environmental Monitoring and Support Laboratory, Cincinnati, Ohio.
EPA ( 1 982b). 4', 4DDT, 4,4'-DDE, 4,4'DDD in Arthur Kill. Region II, New York. EPA Region 2 (2000). Site Inspection Report. VentronIV elsicol Site. EPA ID #
NJD980529879. EUNIS Habitat classification http://mrw.wallonie.be/cgi/dgrne/sibw/eunis. glo.pl EWG (Environmental Working Group). (200 1 ). "Analysis of mercury pollution from
coal-burning plants", www.ewg.org, Natural Resources Defense Council, Washington, DC
Fimreite, N., E. Brun, A. Froslie, P. Fredericksen, and N. Gundersen ( 1 974). "Mercury in eggs of Norwegian seabirds." Astarte 1 :7 1 -75.
Fitzgerald, W.F. and O'Connor, J.S. (200 1 ). Mercury cycling in the Hudson/Raritan Draft. Prepared for the "Industrial Ecology, Pollution Prevention and the NYINJ Harbor" Project of the New York Academy of Sciences.
Fitzgerald, W.F., Vandal, G.M., Rolfhus, K.R, Lamborg, C.H., Langer, e.S. (2000). Mercury emissions and cycling in the coastal zone. J Environ. Sci. 12: 92- 1 0 1 .
Fitzgerald, W.F. (2000). Unpublished results. Fitzgerald, W.F., Mason, RP ., Vandal, G .M., ( 1 99 1 ). Atmospheric cycling and air water
exchange of mercury over mid continental lacustrine regions. Water, Air and Soil Pollution 56, 745-767.
Friberg, L., Piscator, M. & Nordberg, G. ( 1 97 1 ) Cadmium in the environment, The Chemical Rubber Co, Press, Cleveland, Ohio
Gagnon, C., Pelletier, E., Mucci, A. and Fitzgerald, W.F. ( 1 996). Diagenetic behavior of methylmercury in organic-rich coastal sediments. Limnol. Oceanogr. 41 : 428-434.
Gillis, C.A., Bonnevie, N.L., and Wenning, RJ. ( 1993). Mercury contamination in the Newark Bay estuary. Ecotoxicol. Environ. Sa! 25, 2 1 4-226.
Gilmour, C.C. Riedel, G.S., Ederington, M.C., Bell, J.T., Benoit, J.M., Gill, G.A., and Stordal, M.e. ( 1 998) Biogeochemistry 80: 327.
Gilmour, C.C. and Henry, E.A. ( 1 99 1 ) . Mercury methylation in aquatic systems affected by acid deposition. Environ. Pollution 71 : 1 3 1 - 1 69.
Gilmour, C.C. and Capone D.G. ( 1 987) Relationship between Hg methylation and the sulfur cycle in estuarine sediments. EOS, Trans Amer. Geo. Union. 68: 1 7 1 8.
Gilmour, C.C., Means, J.C., and Tuttle, J.H. ( 1 984). Evidence for anaerobic methylation of inorganic tin. Abstr. Annu. Meet. Am. Soc. Microbiol. , St. Louis, Mo. March 4-9.
Glass, G.E., Sorensen, J.A., Schmidt, K.W., Rapp, G.R. Yap, D., Fraser, D., ( 1 99 1 ). Mercury deposition and sources for upper Great Lakes region. Water, Air, and Soil Pollution 56, 235-250.
Gobeil C. and Cossa, D. ( 1 994). Mercury sediments and sediment porewater in the Laurentian Trough. Can. J Fish. A quat. Sci. 50: 1 794- 1 800.
Grainier, L., Chevreuil, M., Carru, A.M., and Letolle, R. ( 1 990). Urban runoff pollution by organochlorines (polychlorinated biphenyls and lindane) and heavy metals (lead, zinc, and chromium). Chemosphere 21 (9) 1 1 0 1 - 1 1 07
45
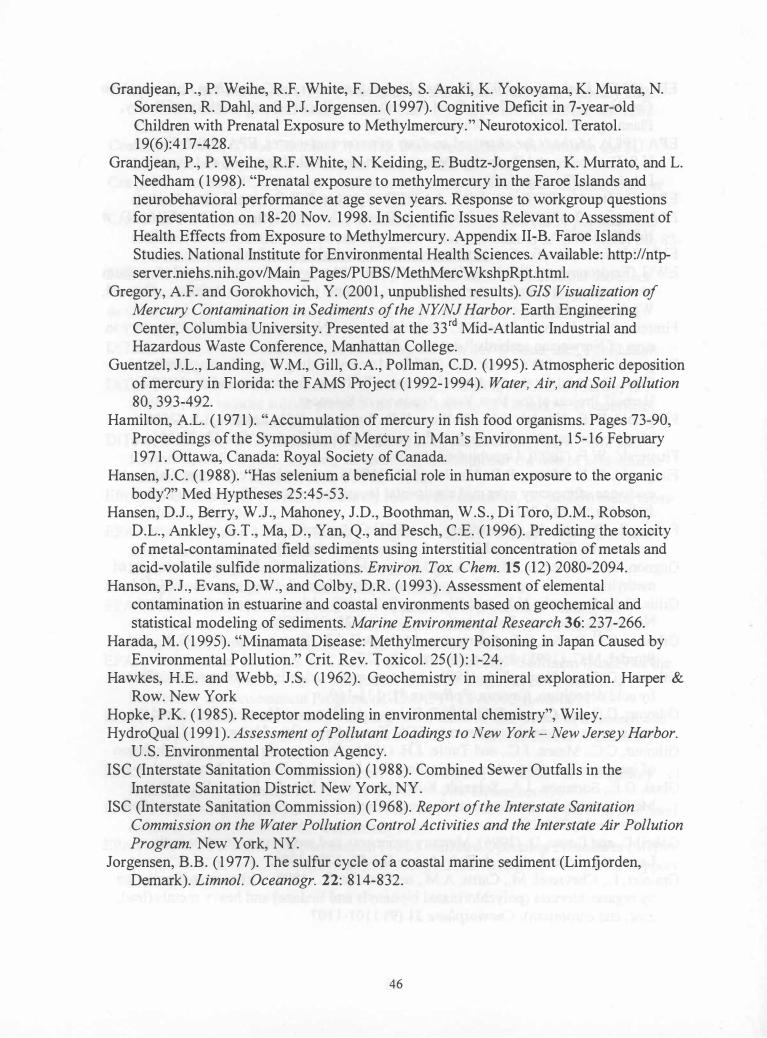
Grandjean, P., P. Weihe, R.F. White, F. Debes, S. Araki, K. Yokoyama, K. Murata, N. Sorensen, R. Dahl, and PJ. Jorgensen. ( 1 997). Cognitive Deficit in 7-year-old Children with Prenatal Exposure to Methylmercury." Neurotoxicol. Teratol. 1 9(6):4 1 7-428.
Grandjean, P., P. Weihe, R.F. White, N. Keiding, E. Budtz-Jorgensen, K. Murrato, and L. Needham ( 1 998). "Prenatal exposure to methylmercury in the Faroe Islands and neurobehavioral performance at age seven years. Response to workgroup questions for presentation on 1 8-20 Nov. 1 998. In Scientific Issues Relevant to Assessment of Health Effects from Exposure to Methylmercury. Appendix II-B. Faroe Islands Studies. National Institute for Environmental Health Sciences. Available: http://ntpserver.niehs.nih.gov/Main_Pages/PUBS/MethMercWkshpRpt.htm1.
Gregory, A.F. and Gorokhovich, Y. (200 1 , unpublished results). GIS Visualization of Mercury Contamination in Sediments of the NYINJ Harbor. Earth Engineering Center, Columbia University. Presented at the 33rd Mid-Atlantic Industrial and Hazardous Waste Conference, Manhattan College.
Guentzel, J.L., Landing, W.M., Gill, G.A., Pollman, C.D. ( 1 995). Atmospheric deposition of mercury in Florida: the FAMS Project ( 1 992- 1 994). Water, Air, and Soil Pollution 80, 393-492.
Hamilton, A.L. ( 1 97 1 ). "Accumulation of mercury in fish food organisms. Pages 73-90, Proceedings of the Symposium of Mercury in Man's Environment, 1 5- 1 6 February 1 97 1 . Ottawa, Canada: Royal Society of Canada.
Hansen, J.C. ( 1 988). "Has selenium a beneficial role in human exposure to the organic body?" Med Hyptheses 25 :45-53.
Hansen, D.J., Berry, W.J., Mahoney, J.D., Boothman, W.S., Di Toro, D.M., Robson, D.L., Ankley, G.T., Ma, D., Yan, Q., and Pesch, C.E. ( 1 996). Predicting the toxicity of metal-contaminated field sediments using interstitial concentration of metals and acid-volatile sulfide normalizations. Environ. Tox. Chem. 15 ( 12) 2080-2094.
Hanson, P.J., Evans, D.W., and Colby, D.R. ( 1 993). Assessment of elemental contamination in estuarine and coastal environments based on geochemical and statistical modeling of sediments. Marine Environmental Research 36: 237-266.
Harada, M. ( 1 995). "Minamata Disease: Methylmercury Poisoning in Japan Caused by Environmental Pollution." Crit. Rev. Toxicol. 25( 1 ) : 1 -24.
Hawkes, H.E. and Webb, J.S. ( 1 962). Geochemistry in mineral exploration. Harper & Row. New York
Hopke, P.K. ( 1 985). Receptor modeling in environmental chemistry", Wiley. HydroQual ( 1 99 1 ). Assessment of Pollutant Loadings to New York - New Jersey Harbor.
U.S. Environmental Protection Agency. ISC (Interstate Sanitation Commission) ( 1 988). Combined Sewer Outfalls in the
Interstate Sanitation District. New York, NY. ISC (Interstate Sanitation Commission) ( 1 968). Report of the Interstate Sanitation
Commission on the Water Pollution Control Activities and the Interstate Air Pollution Program. New York, NY.
Jorgensen, B.B. ( 1 977). The sulfur cycle of a coastal marine sediment (Limfjorden, Demark). Limnol. Oceanogr. 22: 8 1 4-832.
46
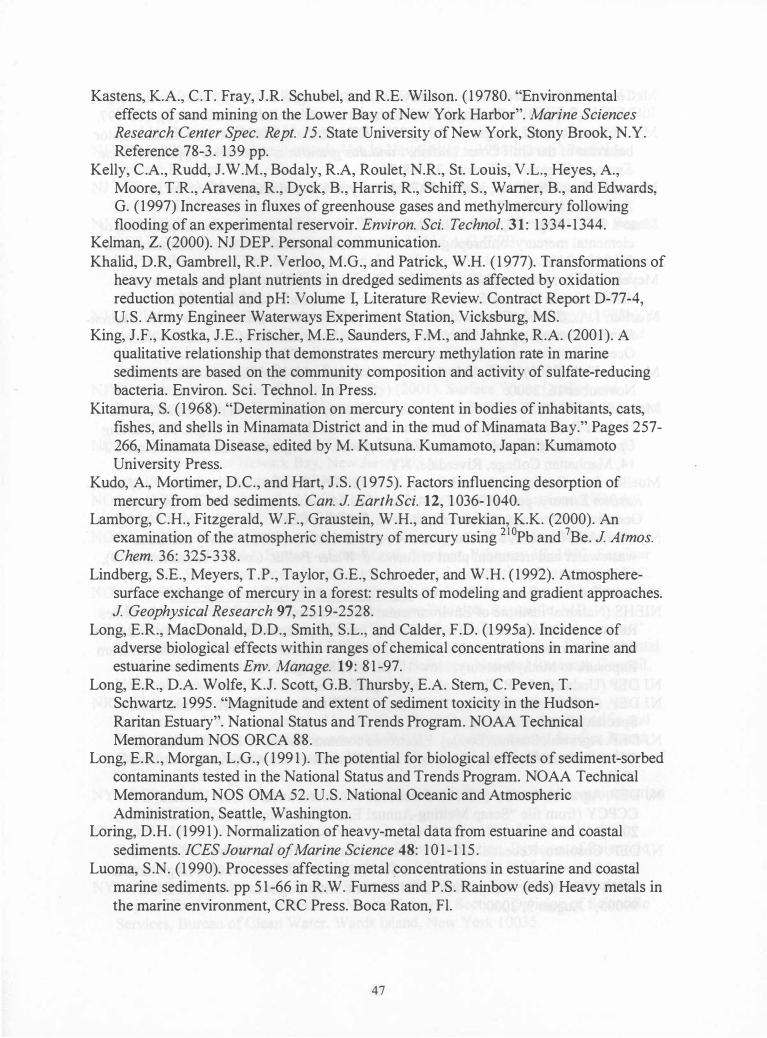
Kastens, KA., C.T. Fray, J.R. Schubel, and R.E. Wilson. ( 1 9780. "Environmental effects of sand mining on the Lower Bay of New York Harbor". Marine Sciences Research Center Spec. Rept. 15. State University of New York, Stony Brook, N.Y. Reference 78-3 . 1 39 pp.
Kelly, C.A., Rudd, J.W.M., Bodaly, R.A, Roulet, N.R., S1. Louis, V.L., Heyes, A., Moore, T.R., Aravena, R., Dyck, B., Harris, R., Schiff, S., Warner, B., and Edwards, G. ( 1 997) Increases in fluxes of greenhouse gases and methylmercury following flooding of an experimental reservoir. Environ. Sci. Technol. 31 : 1 334-1 344.
Kelman, Z. (2000). NJ DEP. Personal communication. Khalid, D.R, Gambrell, R.P. Vedoo, M.G., and Patrick, W.H. ( 1 977). Transformations of
heavy metals and plant nutrients in dredged sediments as affected by oxidation reduction potential and pH: Volume I, Literature Review. Contract Report D-77-4, U.S. Army Engineer Waterways Experiment Station, Vicksburg, MS.
King, J.F., Kostka, J.E., Frischer, M.E., Saunders, F.M., and Jahnke, R.A. (2001 ). A qualitative relationship that demonstrates mercury methylation rate in marine sediments are based on the community composition and activity of sulfate-reducing bacteria. Environ. Sci. Technol. In Press.
Kitamura, S. ( 1 968). "Determination on mercury content in bodies of inhabitants, cats, fishes, and shells in Minamata District and in the mud of Minamata Bay." Pages 257-266, Minamata Disease, edited by M. Kutsuna. Kumamoto, Japan: Kumamoto University Press.
Kudo, A., Mortimer, D.C., and Hart, J .S. ( 1 975). Factors influencing desorption of mercury from bed sediments. Can. J Earth Sci. 12, 1 036- 1 040.
Lamborg, C.H., Fitzgerald, W.F., Graustein, W.H., and Turekian, KK (2000). An examination of the atmospheric chemistry of mercury using 2 1 0Pb and 7Be. J Atmos. Chern. 36: 325-338.
Lindberg, S.E., Meyers, T.P., Taylor, G.E., Schroeder, and W.H. ( 1 992). Atmospheresurface exchange of mercury in a forest: results of modeling and gradient approaches. J Geophysical Research 97, 25 1 9-2528.
Long, E.R., MacDonald, D.D., Smith, S.L., and Calder, F.D. ( 1 995a). Incidence of adverse biological effects within ranges of chemical concentrations in marine and estuarine sediments Env. Manage. 19: 8 1 -97.
Long, E.R., D.A. Wolfe, K.J. Scott, G.B. Thursby, E.A. Stem, C. Peven, T. Schwartz. 1 995 . "Magnitude and extent of sediment toxicity in the HudsonRaritan Estuary". National Status and Trends Program. NOAA Technical Memorandum NOS ORCA 88.
Long, E.R., Morgan, L.G., ( 1 99 1 ). The potential for biological effects of sediment-sorbed contaminants tested in the National Status and Trends Program. NOAA Technical Memorandum, NOS OMA 52. U.S. National Oceanic and Atmospheric Administration, Seattle, Washington.
Loring, D.H. ( 1 99 1 ). Normalization of heavy-metal data from estuarine and coastal sediments. ICES Journal o/Marine Science 48: 1 0 1 - 1 1 5 .
Luoma, S .N. ( 1 990). Processes affecting metal �oncentrations in estuarine and coastal marine sediments. pp 5 1 -66 in R.W. Furness and P.S. Rainbow (eds) Heavy metals in the marine environment, CRC Press. Boca Raton, Fl.
47
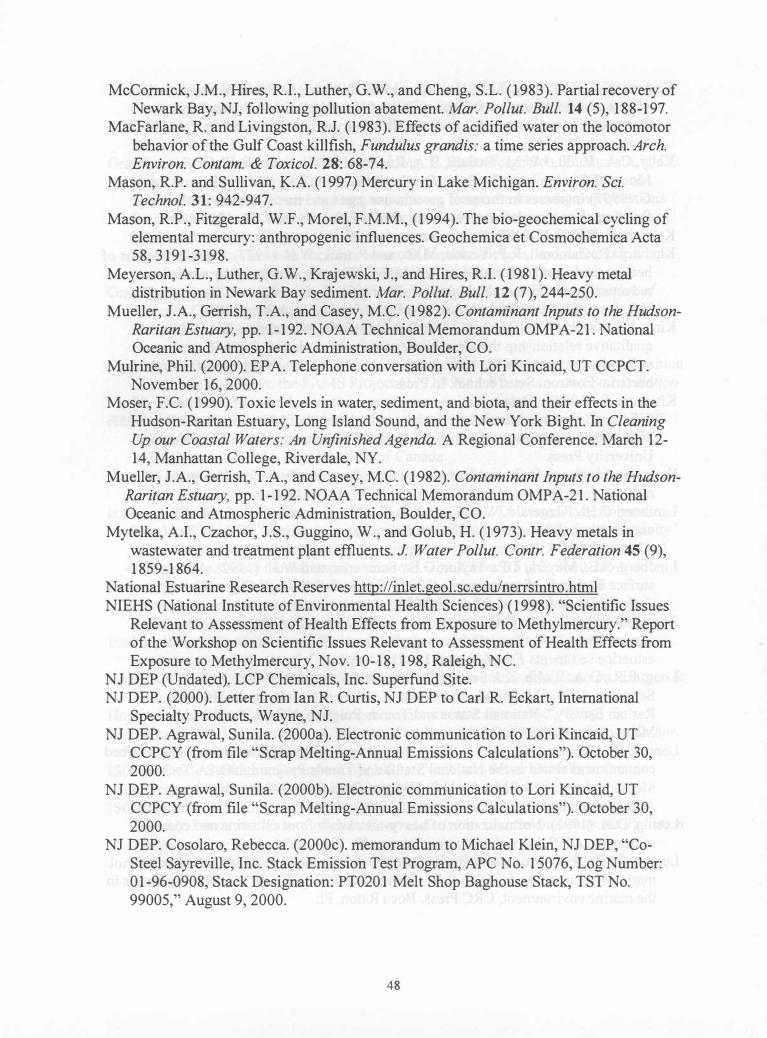
McConnick, J.M., Hires, RI., Luther, G.W., and Cheng, S.L. ( 1 983). Partial recovery of Newark Bay, NJ, following pollution abatement. Mar. Pollut. Bull. 14 (5), 1 88-1 97.
MacFarlane, R. and Livingston, RJ. ( 1 983). Effects of acidified water on the locomotor behavior of the Gulf Coast killfish, Fundulus grandis: a time series approach. Arch. Environ. Contam. & Toxico!. 28: 68-74.
Mason, RP. and Sullivan, K.A. ( 1 997) Mercury in Lake Michigan. Environ. Sci. Technol. 31 : 942-947.
Mason, RP., Fitzgerald, W.F., Morel, F.M.M., ( 1 994). The bio-geochemical cycling of elemental mercury: anthropogenic influences. Geochemica et Cosmochemica Acta 58, 3 1 9 1 -3 1 98.
Meyerson, A.L., Luther, G.W., Krajewski, J., and Hires, R.I. ( 1 98 1 ). Heavy metal distribution in Newark Bay sediment. Mar. Pollut. Bull. 12 (7), 244-250.
Mueller, J.A., Gerrish, T.A., and Casey, M.C. ( 1 982). Contaminant Inputs to the HudsonRaritan Estuary, pp. 1 - 1 92. NOAA Technical Memorandum OMPA-21 . National Oceanic and Atmospheric Administration, Boulder, CO.
Mulrine, Phil. (2000). EPA. Telephone conversation with Lori Kincaid, UT CCPCT. November 1 6, 2000.
Moser, F.C. ( 1 990). Toxic levels in water, sediment, and biota, and their effects in the Hudson-Raritan Estuary, Long Island Sound, and the New York Bight. In Cleaning Up our Coastal Waters: An Unfinished Agenda. A Regional Conference. March 12-14, Manhattan College, Riverdale, NY.
Mueller, J.A., Gerrish, T.A., and Casey, M.e. ( 1 982). Contaminant Inputs to the HudsonRaritan Estuary, pp. 1 - 1 92. NOAA Technical Memorandum OMPA-2 1 . National Oceanic and Atmospheric Administration, Boulder, CO.
Mytelka, A.I., Czachor, J.S. , Guggino, W., and Golub, H. ( 1 973). Heavy metals in wastewater and treatment plant effluents. J Water Pollut. Contr. Federation 45 (9), 1 859-1 864.
National Estuarine Research Reserves http://inlet.geol.sc.edu/nerrsintro.html NIEHS (National Institute of Environmental Health Sciences) ( 1 998). "Scientific Issues
Relevant to Assessment of Health Effects from Exposure to Methylmercury." Report of the Workshop on Scientific Issues Relevant to Assessment of Health Effects from Exposure to Methylmercury, Nov. 1 0- 1 8, 1 98, Raleigh, NC.
NJ DEP (Undated). LCP Chemicals, Inc. Superfund Site. NJ DEP. (2000). Letter from Ian R Curtis, NJ DEP to Carl R Eckart, International
Specialty Products, Wayne, NJ. NJ DEP. Agrawal, Sunila. (2000a). Electronic communication to Lori Kincaid, UT
CCPCY (from file "Scrap Melting-Annual Emissions Calculations"). October 30, 2000.
NJ DEP. Agrawal, Sunila. (2000b). Electronic communication to Lori Kincaid, UT CCPCY (from file "Scrap Melting-Annual Emissions Calculations"). October 30, 2000.
NJ DEP. Cosolaro, Rebecca. (2000c). memorandum to Michael Klein, NJ DEP, "CoSteel Sayreville, Inc. Stack Emission Test Program, APC No. 1 5076, Log Number: 0 1 -96-0908, Stack Designation: PT020 1 Melt Shop Baghouse Stack, TST No. 99005," August 9, 2000.
48
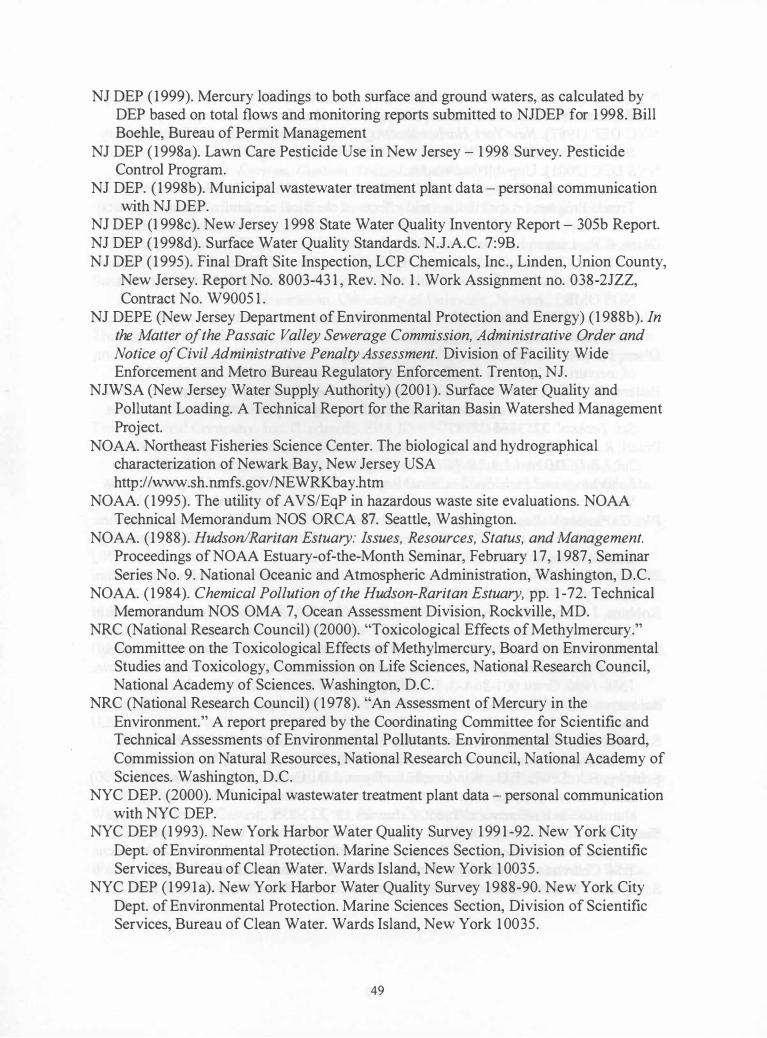
NJ DEP ( 1 999). Mercury loadings to both surface and ground waters, as calculated by DEP based on total flows and monitoring reports submitted to NJDEP for 1 998. Bill Boehle, Bureau of Permit Management
NJ DEP ( 1 998a). Lawn Care Pesticide Use in New Jersey - 1 998 Survey. Pesticide Control Program.
NJ DEP. ( 1 998b). Municipal wastewater treatment plant data - personal communication with NJ DEP.
NJ DEP (I 998c). New Jersey 1 998 State Water Quality Inventory Report - 30Sb Report. NJ DEP (l 998d). Surface Water Quality Standards. N.J.A.C. 7:9B. NJ DEP ( 1 99S). Final Draft Site Inspection, LCP Chemicals, Inc., Linden, Union County,
New Jersey. Report No. 8003-43 1 , Rev. No. 1 . Work Assignment no. 038-2JZZ, Contract No. W900S 1 .
NJ DEPE (New Jersey Department of Environmental Protection and Energy) ( I 988b). In the Matter o/the Passaic Valley Sewerage Commission, Administrative Order and Notice o/Civil Administrative Penalty Assessment. Division of Facility Wide Enforcement and Metro Bureau Regulatory Enforcement. Trentop, NJ.
NJWSA (New Jersey Water Supply Authority) (200 1 ). Surface Water Quality and Pollutant Loading. A Technical Report for the Raritan Basin Watershed Management Project.
NOAA. Northeast Fisheries Science Center. The biological and hydrographical characterization of Newark Bay, New Jersey USA http://www.sh.nmfs.govINEWRKbay.htm
NOAA. ( 1 99S). The utility of A VSlEqP in hazardous waste site evaluations. NOAA Technical Memorandum NOS ORCA 87. Seattle, Washington.
NOAA. ( 1 988). Hudson/Raritan Estuary: Issues, Resources, Status, and Management. Proceedings of NOAA Estuary-of-the-Month Seminar, February 1 7, 1 987, Seminar Series No. 9. National Oceanic and Atmospheric Administration, Washington, D.C.
NOAA. ( 1 984). Chemical Pollution o/the Hudson-Raritan Estuary, pp. 1 -72. Technical Memorandum NOS OMA 7, Ocean Assessment Division, Rockville, MD.
NRC (National Research Council) (2000). "Toxicological Effects of Methylmercury." Committee on the Toxicological Effects of Methylmercury, Board on Environmental Studies and Toxicology, Commission on Life Sciences, National Research Council, National Academy of Sciences. Washington, D.C.
NRC (National Research Council) ( 1 978). "An Assessment of Mercury in the Environment." A report prepared by the Coordinating Committee for Scientific and Technical Assessments of Environmental Pollutants. Environmental Studies Board, Commission on Natural Resources, National Research Council, National Academy of Sciences. Washington, D.C.
NYC DEP. (2000). Municipal wastewater treatment plant data - personal communication with NYC DEP.
NYC DEP (1 993). New York Harbor Water Quality Survey 1 99 1 -92. New York City Dept. of Environmental Protection. Marine Sciences Section, Division of Scientific Services, Bureau of Clean Water. Wards Island, New York 1 003S .
NYC DEP ( 1 99 1 a). New York Harbor Water Quality Survey 1 988-90. New York City Dept. of Environmental Protection. Marine Sciences Section, Division of Scientific Services, Bureau of Clean Water. Wards Island, New York 1 003S.
49
NYC DEP ( 1 99 1 b). Port Richmond Sewage Treatment Plant Operations. Monthly Reports. New York, NY. February, July, and October.
NYC DEP ( 1 987). New York Harbor Water Quality Service Data, p. 1 9. Water Quality Section, Wards Island, NY.
NYS DEC (200 1) . Unpublished results. O'Connor, T.P. and Ehler, C.N. ( 1 99 1 ). Results from the NOAA National Status and
Trends Program on distribution and effects of chemical contamination in the coastal and estuarine United States. Environmental Monitoring and Assessment 17: 33-49.
Olsen, C.R., Larsen, l.L., Brewster, R.L., Cutshall, N.H., Bopp, R.F., and Simpson, H. ( 1 984). A Geochemical Assessment o/Sedimentation and Contaminant Distributions in the Hudson-River Estuary. National Oceanic and Atmospheric Adiminstration. NOS OMS
Olsen, C.R. ( 1 979). Radionuc1ides, sedimentation and the accumulation of pollutants in the Hudson estuary. Ph.D. thesis, Columbia University, New York, NY, 343 pp.
Olsen, B.H. and Cooper, R.C. ( 1 976). Comparison of aerobic and anaerobic methylation of mercuric chloride by San Francisco Bay sediments. Wat. Res. 10 b l 13- 1 16 .
Pattern, M.J., Rudd, J.W.M., St. Louis, V. ( 1 998). Increases in the total and methylmercury in zooplankton following flooding of a peatland reservoir. Environ. Sci. Technol. 32 : 3868-3874.
Pruell, R.J., Rubinstein, N.l., Taplin, B.K., LiVolsi, J.A., and Norwood, C.B. ( 1 990). 2,3, 7, 8-TCDD and 2,3, 7, 8-TCDF and PCBs in Marine Sediments and Biota: Laboratory and Field Studies. Final Report to U.S. Army Corps of Engineers, New York.
PVSC (Passaic Valley Sewerage Commissioners) ( 1 974). Annual Report/or Operations During the Year 1974. Chief Engineer S.A. Lubetkin to the Passaic Valley Sewerage Commissioners, Newark, NJ.
PVSC (Passaic Valley Sewerage Commissioners) ( 1 992). Pretreatment Program Annual Report/or 1992.Newark, NJ.
Robbins, J.A. and Edington, D.N. ( 1 975). Determination of recent sedimentation rates in Lake Michigan using Pb-2 1 0 and Cs- 1 37. Geochim. Cosmoschim. Acta, 39: 285-304.
Rod, S.R., Ayers, R.U., �d Small, M. ( 1 989). Reconstruction 0/ Historical Loadings 0/ Heavy Metals andChlorinated Hydrocarbon Pesticides in the Hudson-Raritan Basin, 1880-1980. Grant 001 -86A-3 . Final Report to the Hudson River Foundation.
Salomons, W. and Forstner, U. ( 1 984). Metals in the hydrocyc1e. Springer-Verlag, New York.
Schoer, J.H. ( 1 984). Eisen-oxo-hydroxide und iher bedeutung fur die schwermetallverteilung in Astuarien, insbesondere der Elbe. Thesis, pp. 240-244. Heidelberg.
Schropp, S.J., Lewis, F.G., Windom, H.L., Ryan, J.D., Calder, F.D., Burney, L.C. ( 1 990). Interpretation of metal concentrations in estuarine sediments of Florida using aluminum as a reference element. Estuaries 13: 227-235.
Simpson, H.J., D.E. Hammond, B.L. Deck, and S.c. Williams. ( 1 975). Nutrient budgets in the Hudson River Estuary. Marine Chemistry in the Coastal Environment. T.M. Church (ed.), American Chemical Society, Washington D.C., 6 1 8-635
Snoeyink V.L. and Jenkins, D. ( 1 980). Water Chemistry. John Wiley & Sons, Inc.
50
Squibb, K.S., O'Connor, J.M., and Kneip, T.J. ( 1 99 1 ). New York/New Jersey Harbor Estuary Program Module 3. 1 : Toxics Characterization. Institute of Environmental Medicine. New York University Medical Center.
Stainken, D.J. and Rollwagen, J. ( 1 979). PCB residues in bivalves and sediments of Raritan Bay. Bull. Environ. Contam. Toxicol. 23, 690-697.
Stern, A.H., L.R. Korn, and B.E. Ruppel. ( 1 996). Estimation of Fish Consumption and Methylmercury Intake in the New Jersey Population." J. Expo. Anal. Environ. Epidemiol. 6(4):503-525.
Stumm and Morgan ( 1 98 1 ). Aquatic Chemistry An Introduction Emphasizing Chemical Equilibria in Natural Waters. John Wiley & Sons. New York.
Suszkowski, D.J. ( 1 978). Sedimentology of Newark Bay, New Jersey: An Urban Estuarine Bay. Ph.D. dissertation. University of Delaware, Newark, DE.
Themelis, N.J. (200 1 ) Personal communication. Themelis, N.J. and Gregory, A.F. (Draft - 200 1 ). Mercury sources and sinks in the New
York-New Jersey Harbor. Earth Engineering Center, Columbia University. Report to the New York Academy of Sciences Harbor Consortium.
Thomas, R.L. ( 1 972). The distribution of mercury in the sediment of Lake Ontario. Can. J. Earth Sci. 9: 636-65 1 .
Troy Chemical Company, Inc. (Undated). EPA ID # NJD002 1 445 1 7. Tsubaki, T. ( 1 97 1 ). "Clinical and epidemiological aspects of organic mercury
intoxication." Page 1 3 1 - 1 36, Proceedings of the Symposium on Mercury in Man's Environment, 1 5- 1 6 February 1 97 1 . Ottawa, Canada: The Royal Society of Canada.
Tsubaki, T. and K. Irukayama, eds. ( 1 977). "Minamata Disease (Methylmercury poisoning in Minamata and Niigata, Japan). New York: Elsevier Scientific Publishing Company, Kodansha, Ltd.
URS Corporation. ( 1 975). Materials Balance and Technology Assessment of Mercury and its Compounds in National and Regional Bases. EPA 560/3-75-007. Washington, DC.
U.S. Army Corps of Engineers. Port of New York and New Jersey. http://www.nan.usace.army.mil/harbor/
U.S. Army Corps of Engineers ( 1 999). Report of channel conditions 1 00 to 400 feet wide (ER 1 1 30-2-3 1 65) U.S. Army Corps of Engineers. 26 Federal Plaza, ATTN: CENAN-OP-ST. New York, NY 1 0278-0090. http://www.nan.usace.army.mil/business/buslinks/navig/cntldpthl9907nwkbayto4.pdf
U.S. Army Corps of Engineers ( 1 999). Report of channel conditions 400 feet wide or greater (ER 1 1 3 0-2-306) U.S. Army Corps of Engineers. 26 Federal Plaza, ATTN: CENAN-OP-ST. New York, NY 1 0278-0090. http://www.nan.usace.army.mil/business/buslinks/navigl cntldpthl9907nwkbay4plus. p df.
Wagner-Dobler, I., Caste in, H.V., Li, Y., Timmis, K.N., Deckwer, W-D. (2000). Removal of mercury from chemical wastewater by microorganisms in technical scale. Environ. Sci. Technol. 34 (2 1 ), 4628-4634.
Watras, C.J., R.C. Back, S. Halvorsen, R.J.M. Hudson, K.A. Morrison and S.P. Wente. ( 1 998). Bioaccumulation of mercury in pelagic freshwater food webs. Sci. Total Environ. 219: 1 83-208.
5 1
Watras, C.J. and N.S. Bloom. ( 1 992). Mercury and MeHg in individual zooplankton: implications for bioaccumulation. Limnol. Oceanogr. 37: 1 3 1 3 .
Weinstein, M.P. Kosko, K.E., Young, L.S., and Belton, TJ., Editors; Brownawell, B.J., Nagourney, S.J., Roundtable Facilitators. (2000) "Proceedings - The Significance of Atmospheric Pollutant Loading to the New York - New Jersey Harbor Estuary and Watershed. (April 1 3, 2000).
Weis, P., Weis, J .S. , and Bogden, J. ( 1 986). Effects of environmental factors on release of mercury from Berry's Creek (New Jersey) sediments and its uptake by Killfish Fundulsus heteroclitus. Environ. Pollution (Series A) 40 303-3 1 5 .
Wenning, R.J., Bonnevie, N.L. Huntley, S.l., and Tull, J.D. ( 1 992). Spatial extent and sources of toxics in sediments from Newark Bay. Abstract 589. Presented at 1 3th
Annual Meeting of the Society of Environmental Toxicology and Chemistry, Cincinnati, OH.
Wiener, J.G. and Stokes, P.M. ( 1 990). Enhanced bioaccumulation of mercury, cadmium, and lead in low-alkalinity waters: an emerging regional environmental problem. Environ. Toxico!. Chem. 9: 82 1 -823.
Winfrey, M.R. and Rudd, J.W.M. ( 1 990). Environmental factors affecting the formation of methylmercury in low pH lakes: A review. Environ. Tox. Chem. 9: 853-869.
Whipple, W., Hunter, J.V., and Yu, S.L. ( 1 976). Characterization of Urban Runoff- New Jersey. Water Resources Institute, Rutgers University.
Wiener, J.G. and Stokes, P.M. ( 1 990). Enhanced bioaccumulation of mercury, cadmium, and lead in low-alkalinity waters: an emerging regional environmental problem. Environ. Toxico!. Chem. 9 : 82 1 -823 .
Wilber, W.G., and Hunter, J.V. ( 1 979). Distribution of metals in street sweepings, stormwater solid, and urban aquatic sediments. J Water Poilu!. Contr. Federation 51 ( 1 2), 28 1 1 -2822.
Wood, J.M., Kennedy, F.S., Rosen, C.G. ( 1 968). Synthesis of methyl-mercury compounds by extracts of a methanogenic bacterium. Nature 220: 1 73- 1 74.
World Health Organization ( l 976a). Conference on Intoxication due to Alkylmercurytreated Seed. Baghdad, Iraq, 9- 1 3 September 1 974. Supplement to Volume 53. Geneva: Wodd Health Organization.
World Health Organization ( 1 976b). "Environmental Health Criteria 1 , Mercury." Report from a meeting held 4- 1 0 February 1 975. Geneva: World Health Organization.
Xiao, Z., Munthe, J., Schroeder, E.W., Lindqvist, O. ( 1 99 1 ). Vertical fluxes of volatile mercury over forests, soil and lake surfaces in Sweden. Tellus 43B, 267-279.
Yamini, B., and S.D. Sleight ( 1 984). "Effects of ascorbic acid deficiency on methylmercury dicyandiamide toxicosis in guinea pigs." J. Environ. Pathol . Toxicol. Oncol. 5, 1 39- 1 50.
52
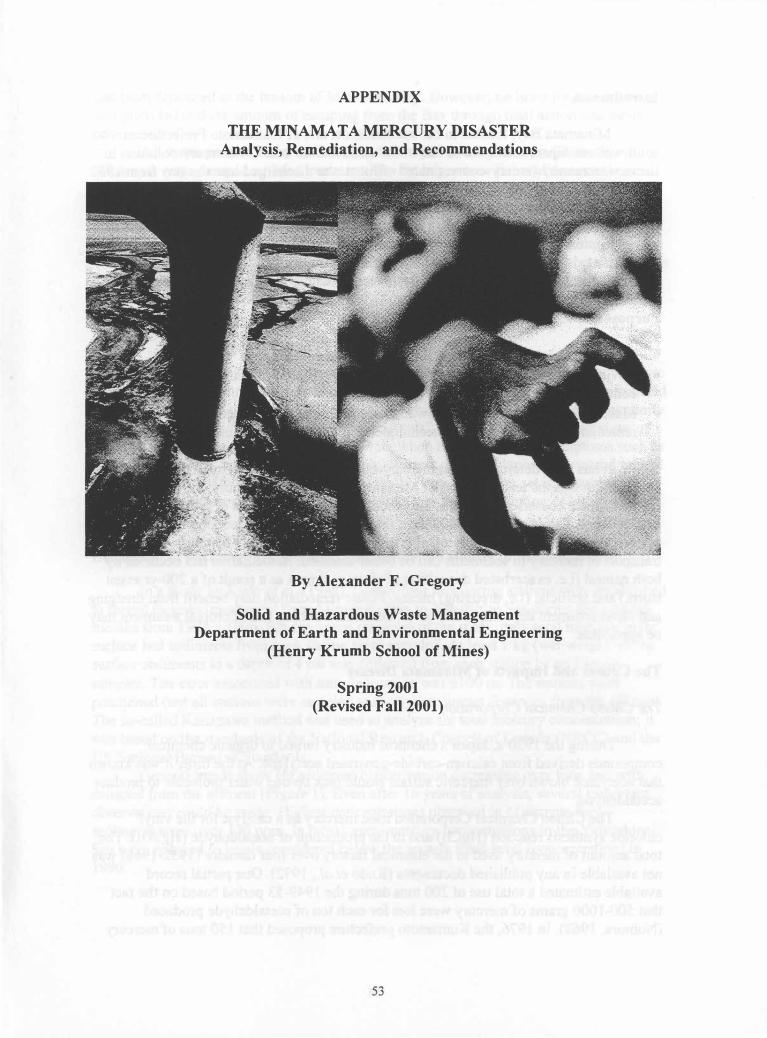
APPENDIX
THE MINAMATA MERCURY DISASTER Analysis, Remediation, and Recommendations
By Alexander F. Gregory
Solid and Hazardous Waste Management Department of Earth and Environmental Engineering
(Henry Krumb School of Mines)
Spring 2001 (Revised Fall 2001)
53
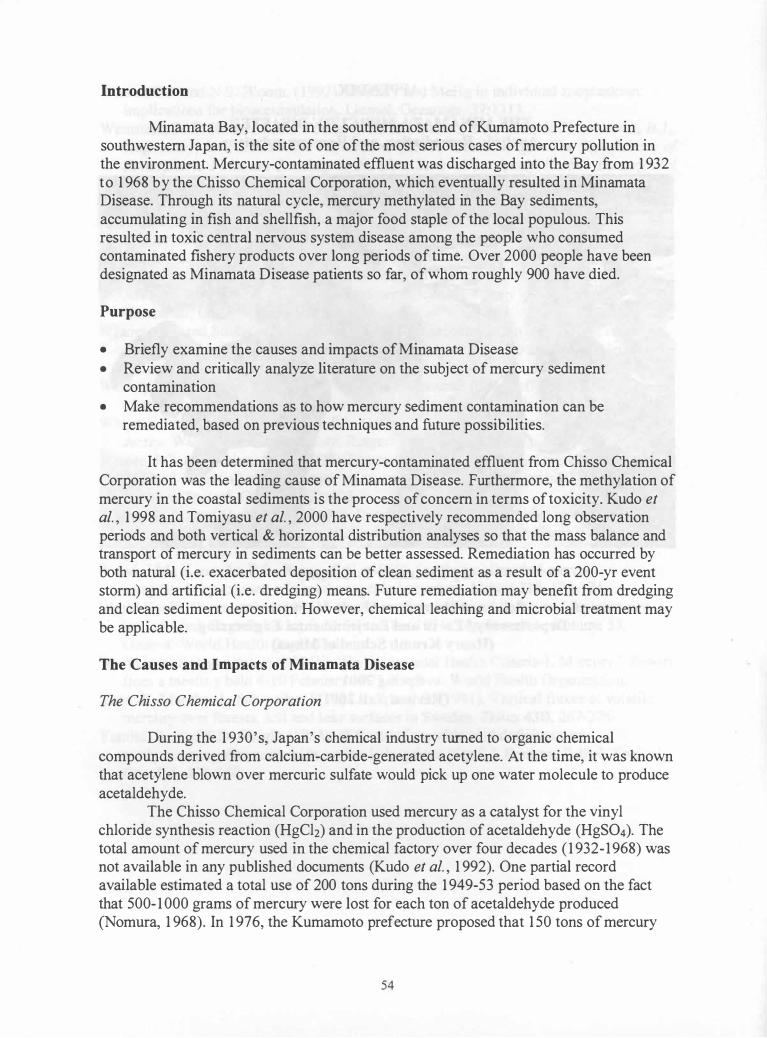
Introduction
Minamata Bay, located in the southernmost end of Kumamoto Prefecture in southwestern Japan, is the site of one of the most serious cases of mercury pollution in the environment. Mercury-contaminated effluent was discharged into the Bay from 1 932 to 1 968 by the Chisso Chemical Corporation, which eventually resulted in Minamata Disease. Through its natural cycle, mercury methylated in the Bay sediments, accumulating in fish and shellfish, a major food staple of the local populous. This resulted in toxic central nervous system disease among the people who consumed contaminated fishery products over long periods of time. Over 2000 people have been designated as Minamata Disease patients so far, of whom roughly 900 have died.
Purpose
• Briefly examine the causes and impacts of Minamata Disease • Review and critically analyze literature on the subject of mercury sediment
contamination • Make recommendations as to how mercury sediment contamination can be
remediated, based on previous techniques and future possibilities.
It has been determined that mercury-contaminated effluent from Chisso Chemical Corporation was the leading cause of Minamata Disease. Furthermore, the methylation of mercury in the coastal sediments is the process of concern in terms of toxicity. Kudo et aI. , 1 998 and Tomiyasu et aI. , 2000 have respectively recommended long observation periods and both vertical & horizontal distribution analyses so that the mass balance and transport of mercury in sediments can be better assessed. Remediation has occurred by both natural (i.e. exacerbated deposition of clean sediment as a result of a 200-yr event storm) and artificial (i.e. dredging) means. Future remediation may benefit from dredging and clean sediment deposition. However, chemical leaching and microbial treatment may be applicable.
The Causes and Impacts of Minamata Disease
The Chisso Chemical Corporation
During the 1 930's, Japan's chemical industry turned to organic chemical compounds derived from calcium-carbide-generated acetylene. At the time, it was known that acetylene blown over mercuric sulfate would pick up one water molecule to produce acetaldehyde.
The Chisso Chemical Corporation used mercury as a catalyst for the vinyl chloride synthesis reaction (HgCh) and in the production of acetaldehyde (HgS04). The total amount of mercury used in the chemical factory over four decades ( 1 932- 1 968) was not available in any published documents (Kudo et aI. , 1 992). One partial record available estimated a total use of 200 tons during the 1 949-53 period based on the fact that 500- 1 000 grams of mercury were lost for each ton of acetaldehyde produced (Nomura, 1 968). In 1 976, the Kumamoto prefecture proposed that 1 50 tons of mercury
54
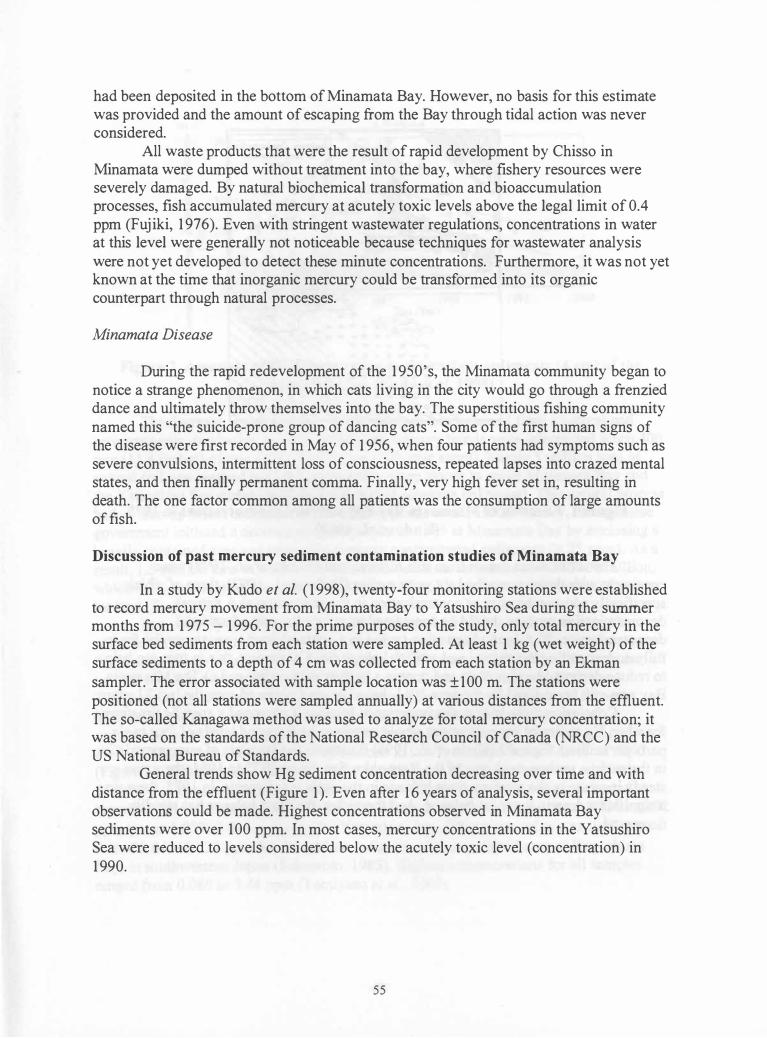
had been deposited in the bottom of Minamata Bay. However, no basis for this estimate was provided and the amount of escaping from the Bay through tidal action was never considered.
All waste products that were the result of rapid development by Chisso in Minamata were dumped without treatment into the bay, where fishery resources were severely damaged. By natural biochemical transformation and bioaccumulation processes, fish accumulated mercury at acutely toxic levels above the legal limit of 0.4 ppm (Fuj iki, 1 976). Even with stringent wastewater regulations, concentrations in water at this level were generally not noticeable because techniques for wastewater analysis were not yet developed to detect these minute concentrations. Furthermore, it was not yet known at the time that inorganic mercury could be transformed into its organic counterpart through natural processes.
Minamata Disease
During the rapid redevelopment of the 1 950's, the Minamata community began to notice a strange phenomenon, in which cats living in the city would go through a frenzied dance and ultimately throw themselves into the bay. The superstitious fishing community named this "the suicide-prone group of dancing cats". Some of the first human signs of the disease were first recorded in May of 1 956, when four patients had symptoms such as severe convulsions, intermittent loss of consciousness, repeated lapses into crazed mental states, and then finally permanent comma. Finally, very high fever set in, resulting in death. The one factor common among all patients was the consumption of large amounts of fish.
Discussion of past mercury sediment contamination studies of Minamata Bay
In a study by Kudo et al. ( 1 998), twenty-four monitoring stations were established to record mercury movement from Minamata Bay to Yatsushiro Sea during the summer months from 1 975 - 1 996. For the prime purposes of the study, only total mercury in the surface bed sediments from each station were sampled. At least 1 kg (wet weight) of the surface sediments to a depth of 4 cm was collected from each station by an Ekman sampler. The error associated with sample location was ±100 m. The stations were positioned (not all stations were sampled annually) at various distances from the effluent. The so-called Kanagawa method was used to analyze for total mercury concentration; it was based on the standards of the National Research Council of Canada (NRCC) and the US National Bureau of Standards.
General trends show Hg sediment concentration decreasing over time and with distance from the effluent (Figure 1 ). Even after 1 6 years of analysis, several important observations could be made. Highest concentrations observed in Minamata Bay sediments were over 1 00 ppm. In most cases, mercury concentrations in the Yatsushiro Sea were reduced to levels considered below the acutely toxic level (concentration) in 1 990.
55
, ... > 1 00 �1 • 50 - 1 00 o.:..n! ., 1� _ 50 i · 1 0 - 25
I '--=�-,--,.-"""""'.J
.. ;. . .
Figure 1 . Location of Minamata Bay and mercury concentrations in 1975 (Kudo et aL, 1980)
The conclusions drawn from this historic study (Kudo et al. , 1 998) were consistent with the ones reached six years earlier (Kudo et al. , 1 992), three of which specifically address the state of contamination in the sediments: a) A natural decontamination process should be considered to reduce the cost of artificial decontamination, b) A long observation period in a contaminated area is essential for to fully understanding the natural and artificial phenomena occurring, this in tum can help to reduce decontamination costs and restore a healthy ecosystem, and c) The Minamata Bay area will be restored by the year 201 1 , based on data obtained over the last 22 years.
Conclusion three is of major importance because it proposed a specific timeframe for when Hg sediment concentrations would recede to background levels of four to six parts per million. Figure 2 (Kudo et al. , 1 998) illustrates the amounts of mercury existing in the surface sediments (4 cm) of the Yatsushiro Sea. From 1 975 to 1 984, there was a steady increase in the mercury mass balance in the surface sediments. In 1 985, there was a significant drop in the mass balance. And thereafter, the mass balance has steadily decreased.
56
Figure 2. Amounts of mercury existing in the surface sediments (4 cm) of the Yatsushiro Sea (Kudo et aL 1998)
The decrease in mercury to the sediment can be explained from a natural and anthropogenic standpoint. In 1 982, increasing mercury trends were interrupted when 400 mm ( 1 1 .4 inches) of rain fell in three hours (200-year event). Nearly 1 million tons of natural soil was washed from the surrounding steep slopes to cover Minamata Bay and the Yatsushiro Sea surface sediments (extent of coverage unknown). This natural process had a clean-up effect estimated at $96 million (Kudo et al. , 1 992). Finally, the Japanese government initiated a decontamination project in 1 985 at Minamata Bay by enclosing a heavily contained area and removing mercury contaminated sediments (> 25 ppm). As a result, 1 .5 million tons of sediments were removed at an estimated cost of $500 million, which included creating a modern harbor and 0.53 million m2 (over 1 00 acres) of vacant lot land (Kudo et al. , 1 998).
In a study by Tomiyasu et at. (2000), the spatial variations of mercury in the sediment of the Yatsushiro Sea were assessed. The most significant difference between the historic (Kudo et al. ) and spatial variation (Tomiyasu et al. , 2000) studies was the vertical and horizontal distribution analysis conducted in the latter. Although the Tomiyasu study was not conducted with a long observation period, the vertical and horizontal analysis provided additional insight into characterizing the extent of contamination in Minamata Bay and the Yatsushiro Sea.
Sediments were sampled at 62 stations in the Yatsushiro Sea in March of 1 996 (Figure 3). In the vertical distribution, the total amount of mercury was at a relatively uniform low concentration in the sediment cores. These low values were interpreted to represent pre-anthropogenic background concentrations, which ranged from 0.036 to 0.92 ppm (mean 0.059±0.01 3 ppm) for the Yatsushiro Sea. This mean value was similar to that of 0.043±0.027 ppm for the surface sediment of an unpolluted area of Kagoshima Bay, in southwestern Japan (Sakamoto, 1 985). Highest concentrations for all samples ranged from 0.086 to 3 .46 ppm (Tomiyasu et aI. , 2000).
57
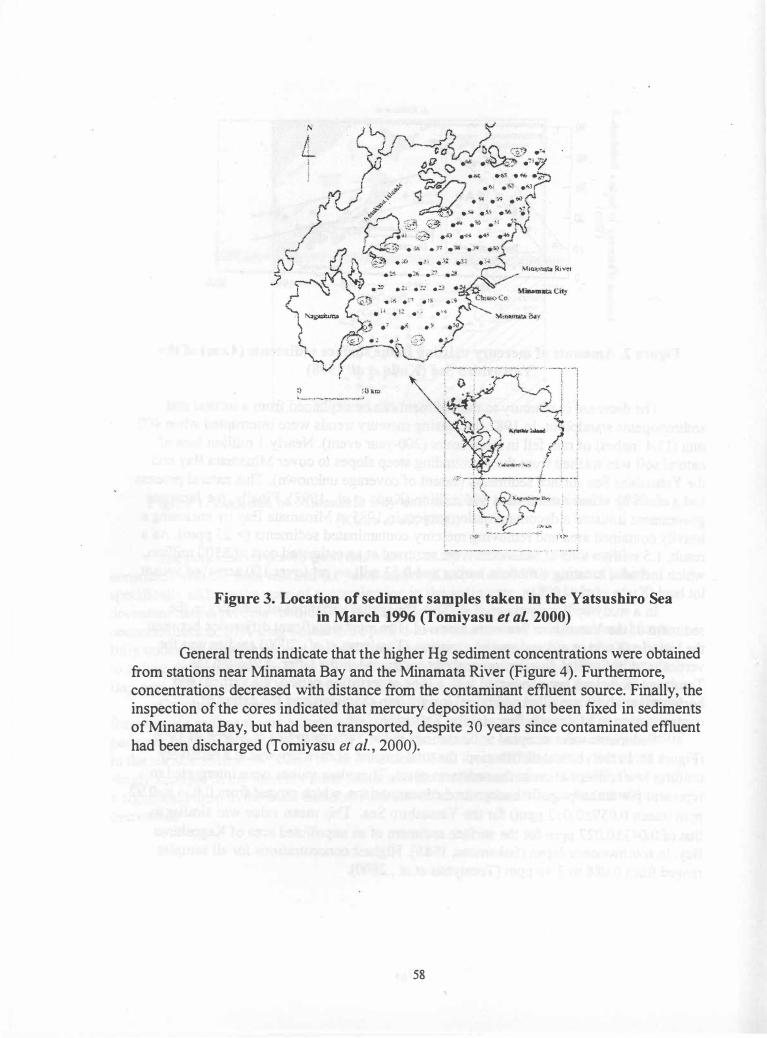
Figure 3. Location of sediment samples taken in the Yatsushiro Sea in March 1996 (Tomiyasu et aL 2000)
General trends indicate that the higher Hg sediment concentrations were obtained from stations near Minamata Bay and the Minamata River (Figure 4). Furthermore, concentrations decreased with distance from the contaminant effluent source. Finally, the inspection of the cores indicated that mercury deposition had not been fixed in sediments of Minamata Bay, but had been transported, despite 30 years since contaminated effluent had been discharged (Tomiyasu et aI. , 2000).
58
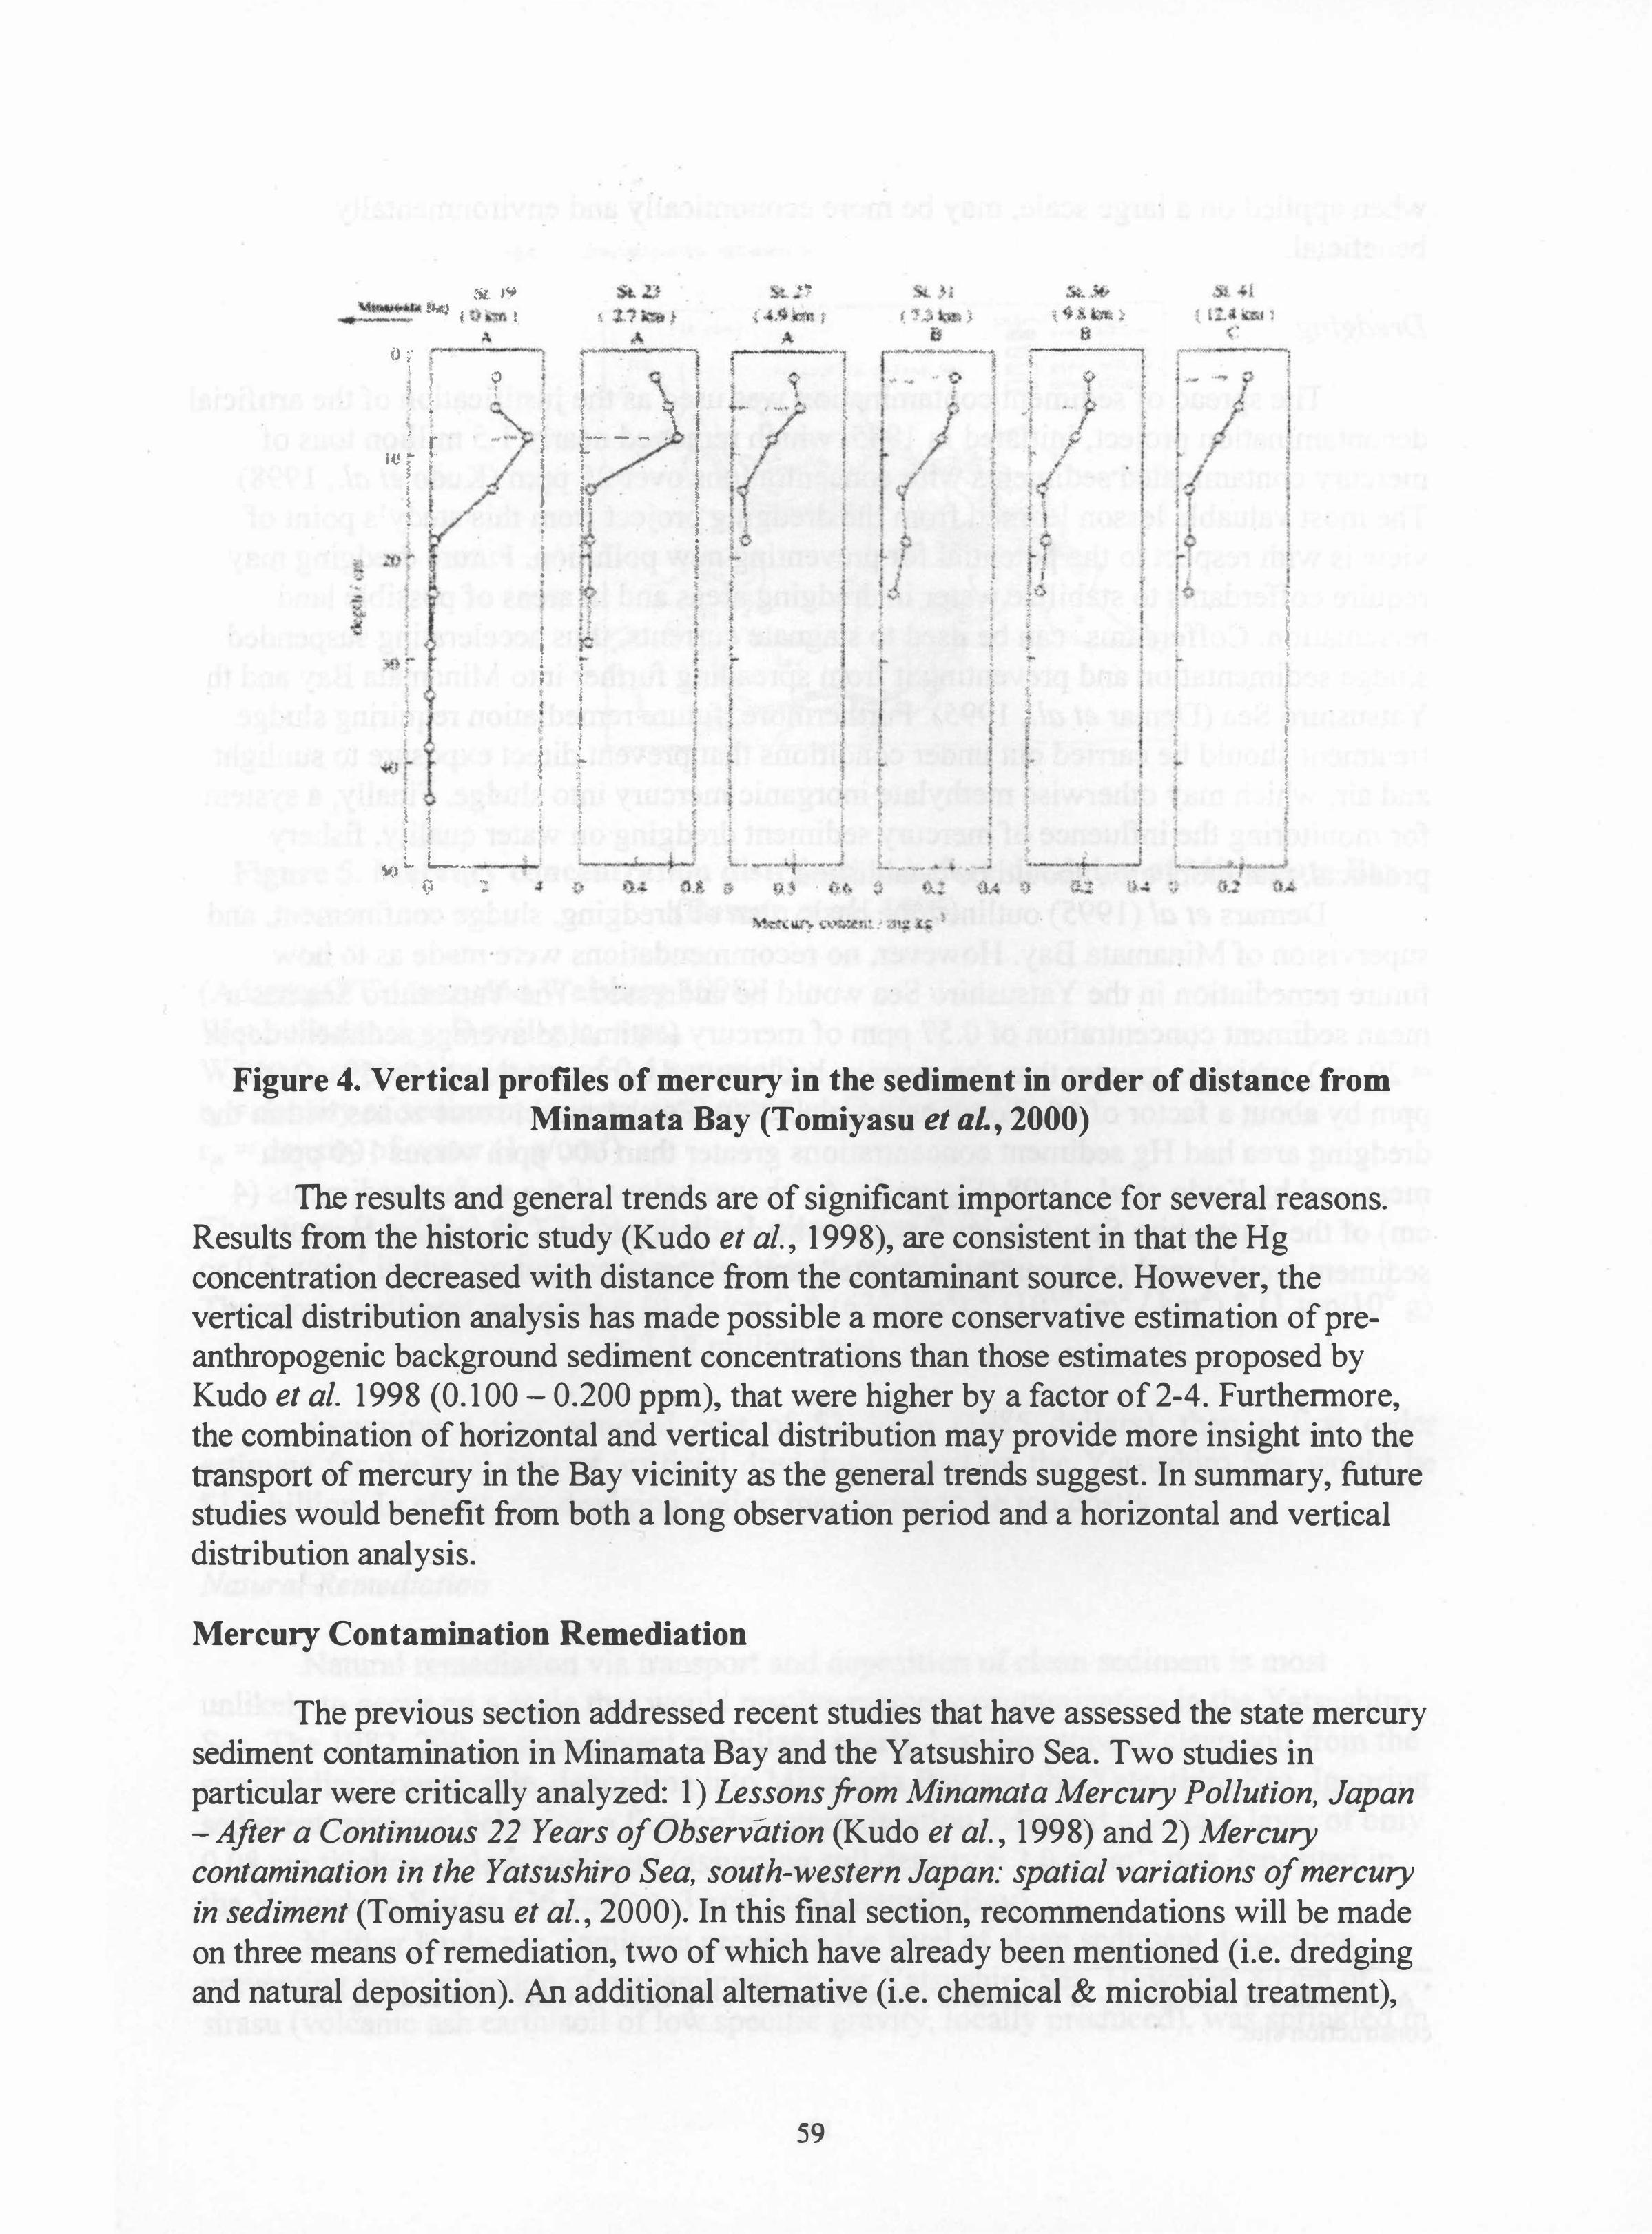
,
& ,,,, 'i�'h .... "'-1 ! • . " I .. ' , , ... � .'IT'i
.\ o �· f"' : 1 1 .
.. , .• \ ,
IC : t 1 f ! I · , • t
\ , .. . i • •
I
j \ , , , ! ! • • • •
Xl :" L .. , {) ::
" • ,
j f"''1' ��"" � J I \. I ! , , I I, t- - _ ·, { , , ! i ! ,l i !
I ! ! j 1 ! , .
i . •
i l? � i t f tA J �� ·
' f !
I j , .
I f � � · s • •
I t • , •
• •• I
",'. ,," """ . t
j •
! , •
I ,
I
I • I ! \
Figure 4. Vertical profiles of mercury in the sediment in order of distance from Minamata Bay (Tomiyasu et aL , 2000)
The results and general trends are of significant importance for several reasons. Results from the historic study (Kudo et al. , 1998), are consistent in that the Hg concentration decreased with distance from the contaminant source. However, the vertical distribution analysis has made possible a more conservative estimation of preanthropogenic background sediment concentrations than those estimates proposed by Kudo et al. 1998 (0.100 - 0.200 ppm), that were higher by a factor of 2-4. FurtheImore, the combination of horizontal and vertical distribution may provide more insight into the transport of mercury in the Bay vicinity as the general trends suggest. In summary, future studies would benefit from both a long observation period and a horizontal and vertical distribution analysis.
Mercury Contamination Remediation
The previous section addressed recent studies that have assessed the state mercury sediment contamination in Minamata Bay and the Yatsushiro Sea. Two studies in particular were critically analyzed: 1) Lessons from Minamata Mercury Pollution, Japan - After a Continuous 22 Years of Observation (Kudo et al. , 1998) and 2) Mercury contamination in the Yatsushiro Sea, south-western Japan: spatial variations of mercury in sediment (Tomiyasu et al. , 2000). In this final section, recommendations will be made on three means of remediation, two of which have already been mentioned (i.e. dredging and natural deposition). An additional alternative (i.e. chemical & microbial treatment),
59
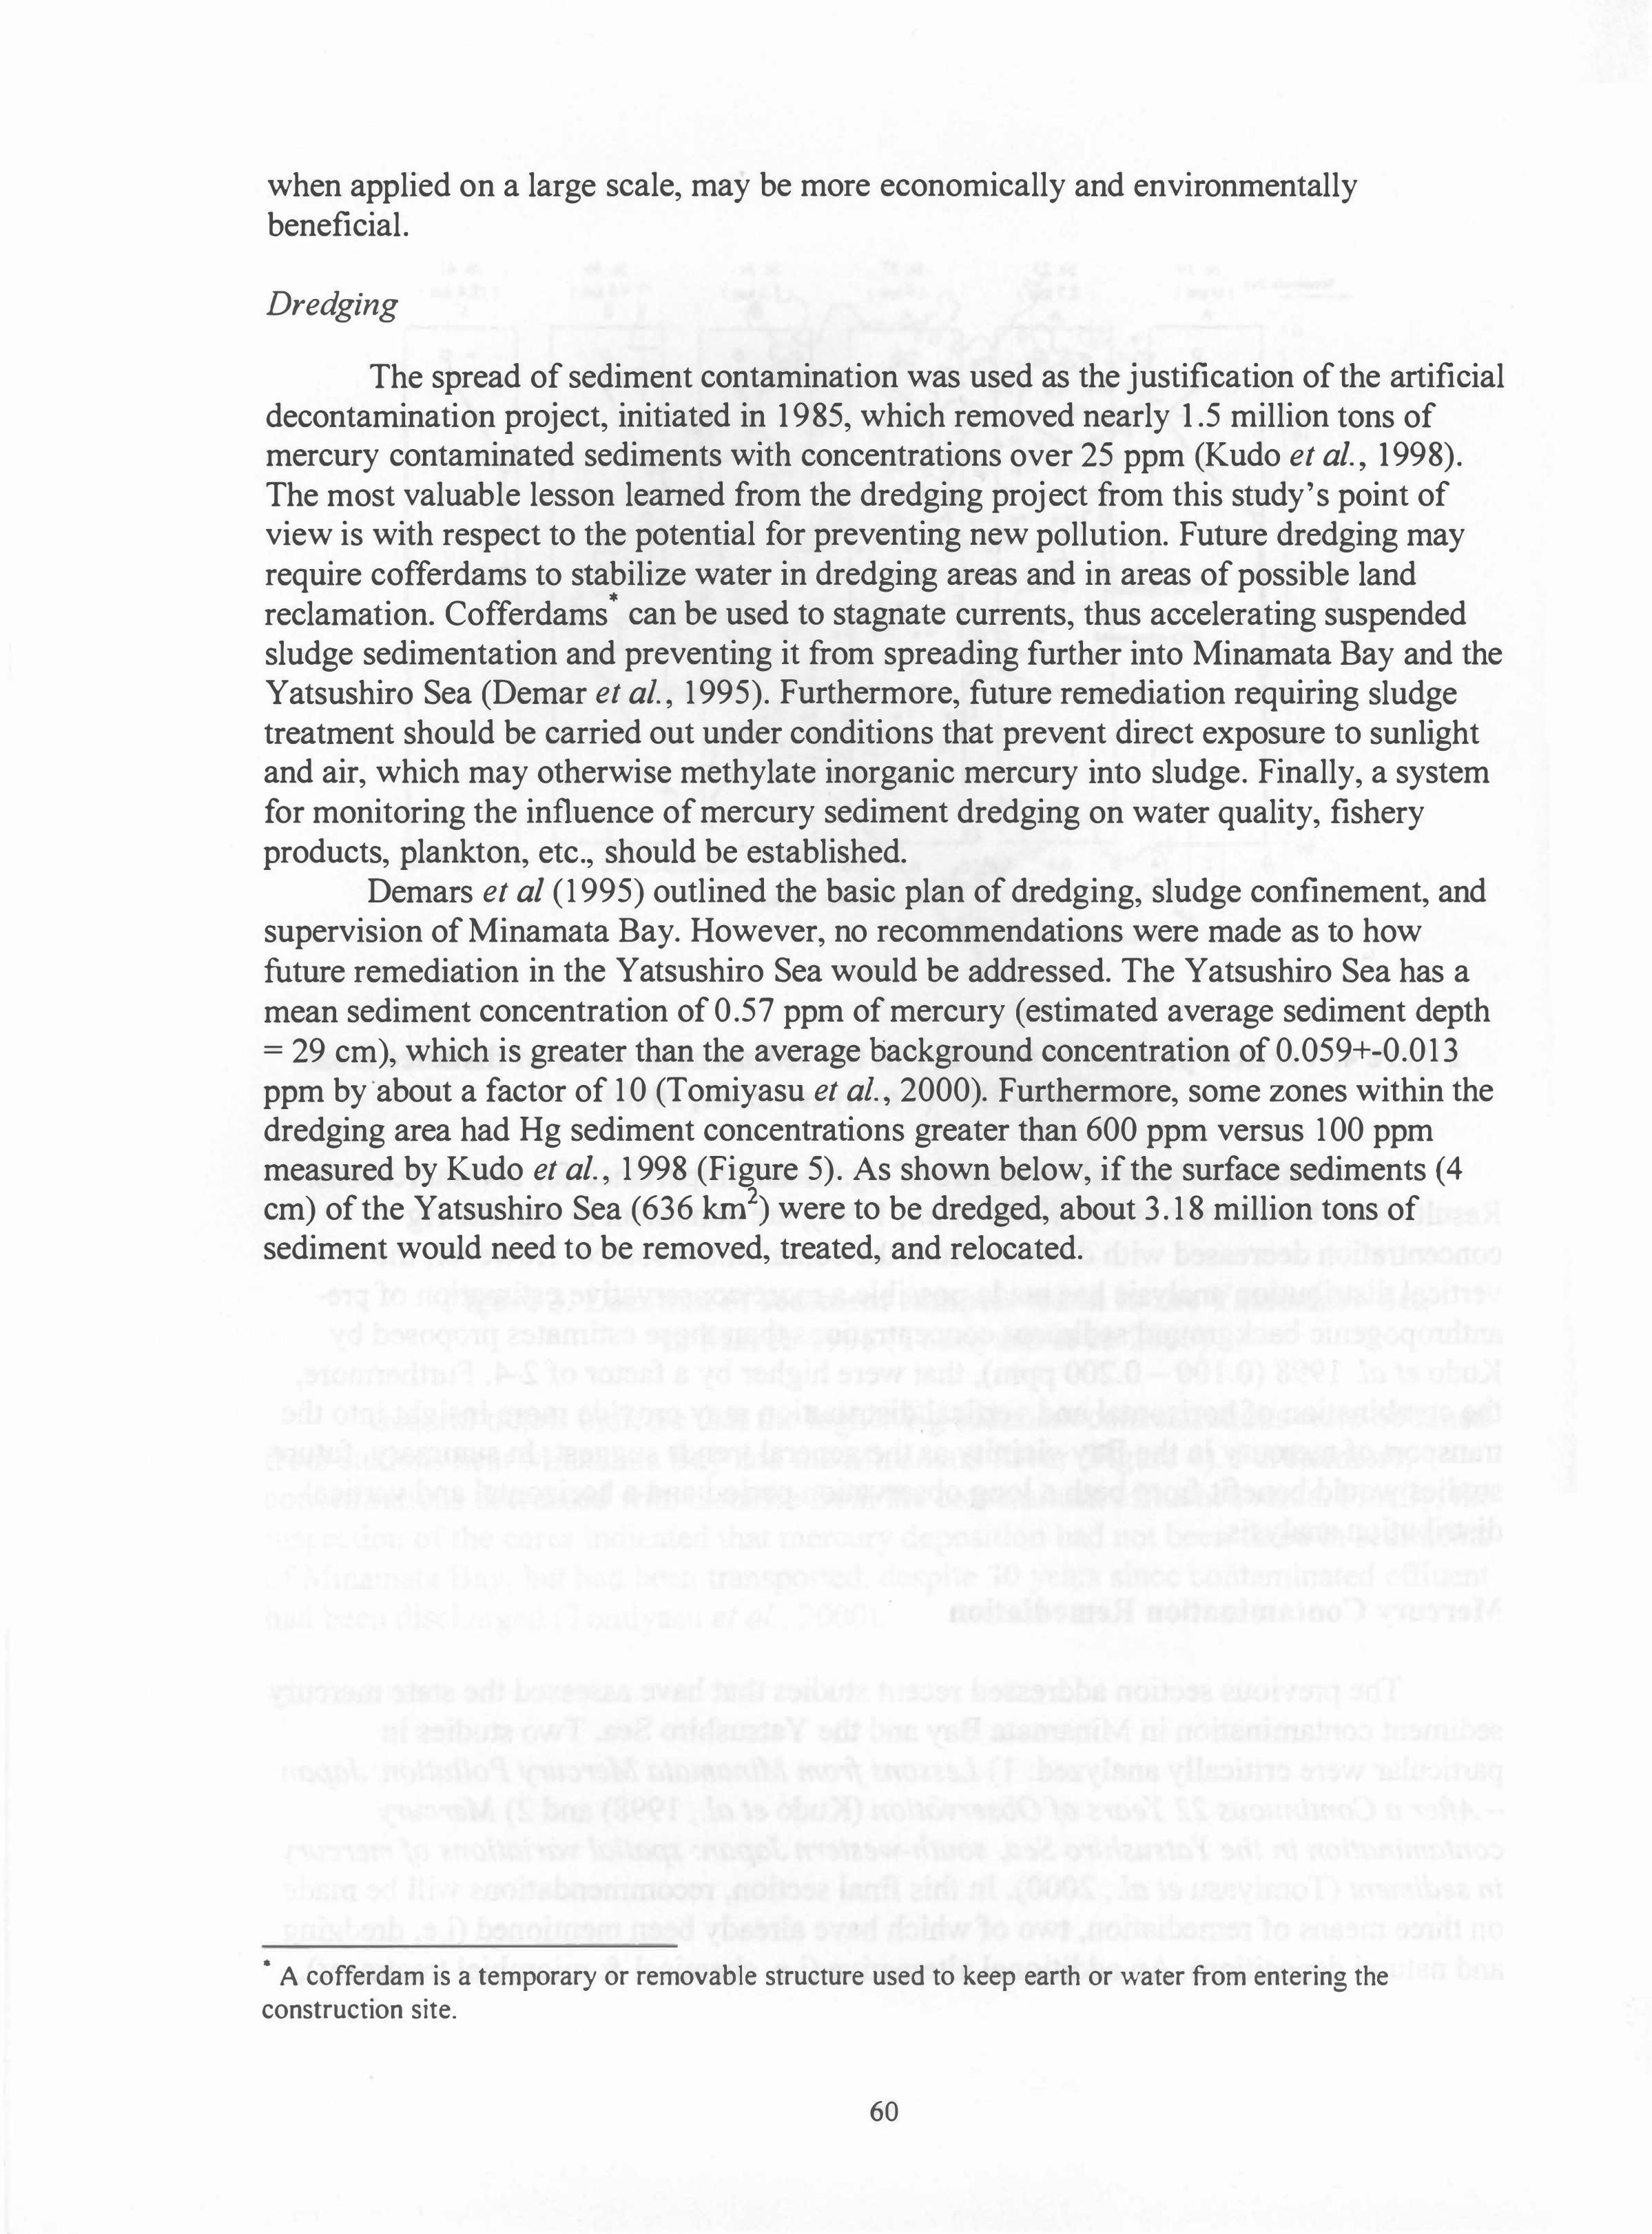
when applied on a large scale, may be more economically and environmentally beneficial.
Dredging
The spread of sediment contamination was used as the justification of the artificial decontamination project, initiated in 1985, which removed nearly 1.5 million tons of mercury contaminated sediments with concentrations over 25 ppm (Kudo et al. , 1998). The most valuable lesson learned from the dredging project from this study's point of view is with respect to the potential for preventing new pollution. Future dredging may require cofferdams to stabilize water in dredging areas and in areas of possible land reclamation. Cofferdams
· can be used to stagnate currents, thus accelerating suspended
sludge sedimentation and preventing it from spreading further into Minamata Bay and the Yatsushiro Sea (Demar et at. , 1 995). Furthermore, future remediation requiring sludge treatment should be carried out under conditions that prevent direct exposure to sunlight and air, which may otherwise methylate inorganic mercury into sludge. Finally, a system for monitoring the influence of mercury sediment dredging on water quality, fishery products, plankton, etc., should be established.
Demars et al ( 1 995) outlined the basic plan of dredging, sludge confinement, and supervision of Minamata Bay. However, no recommendations were made as to how future remediation in the Yatsushiro Sea would be addressed. The Yatsushiro Sea has a mean sediment concentration of 0.57 ppm of mercury (estimated average sediment depth = 29 cm), which is greater than the average background concentration of 0.059+-0.013 ppm by about a factor of 1 0 (Tomiyasu et at. , 2000). Furthermore, some zones within the dredging area had Hg sediment concentrations greater than 600 ppm versus 100 ppm measured by Kudo et al. , 1 998 (Figure 5). As shown below, if the surface sediments (4 cm) of the Yatsushiro Sea (636 km2) were to be dredged, about 3. 18 million tons of sediment would need to be removed, treated, and relocated .
• A cofferdam is a temporary or removable structure used to keep earth or water from entering the construction site.
60
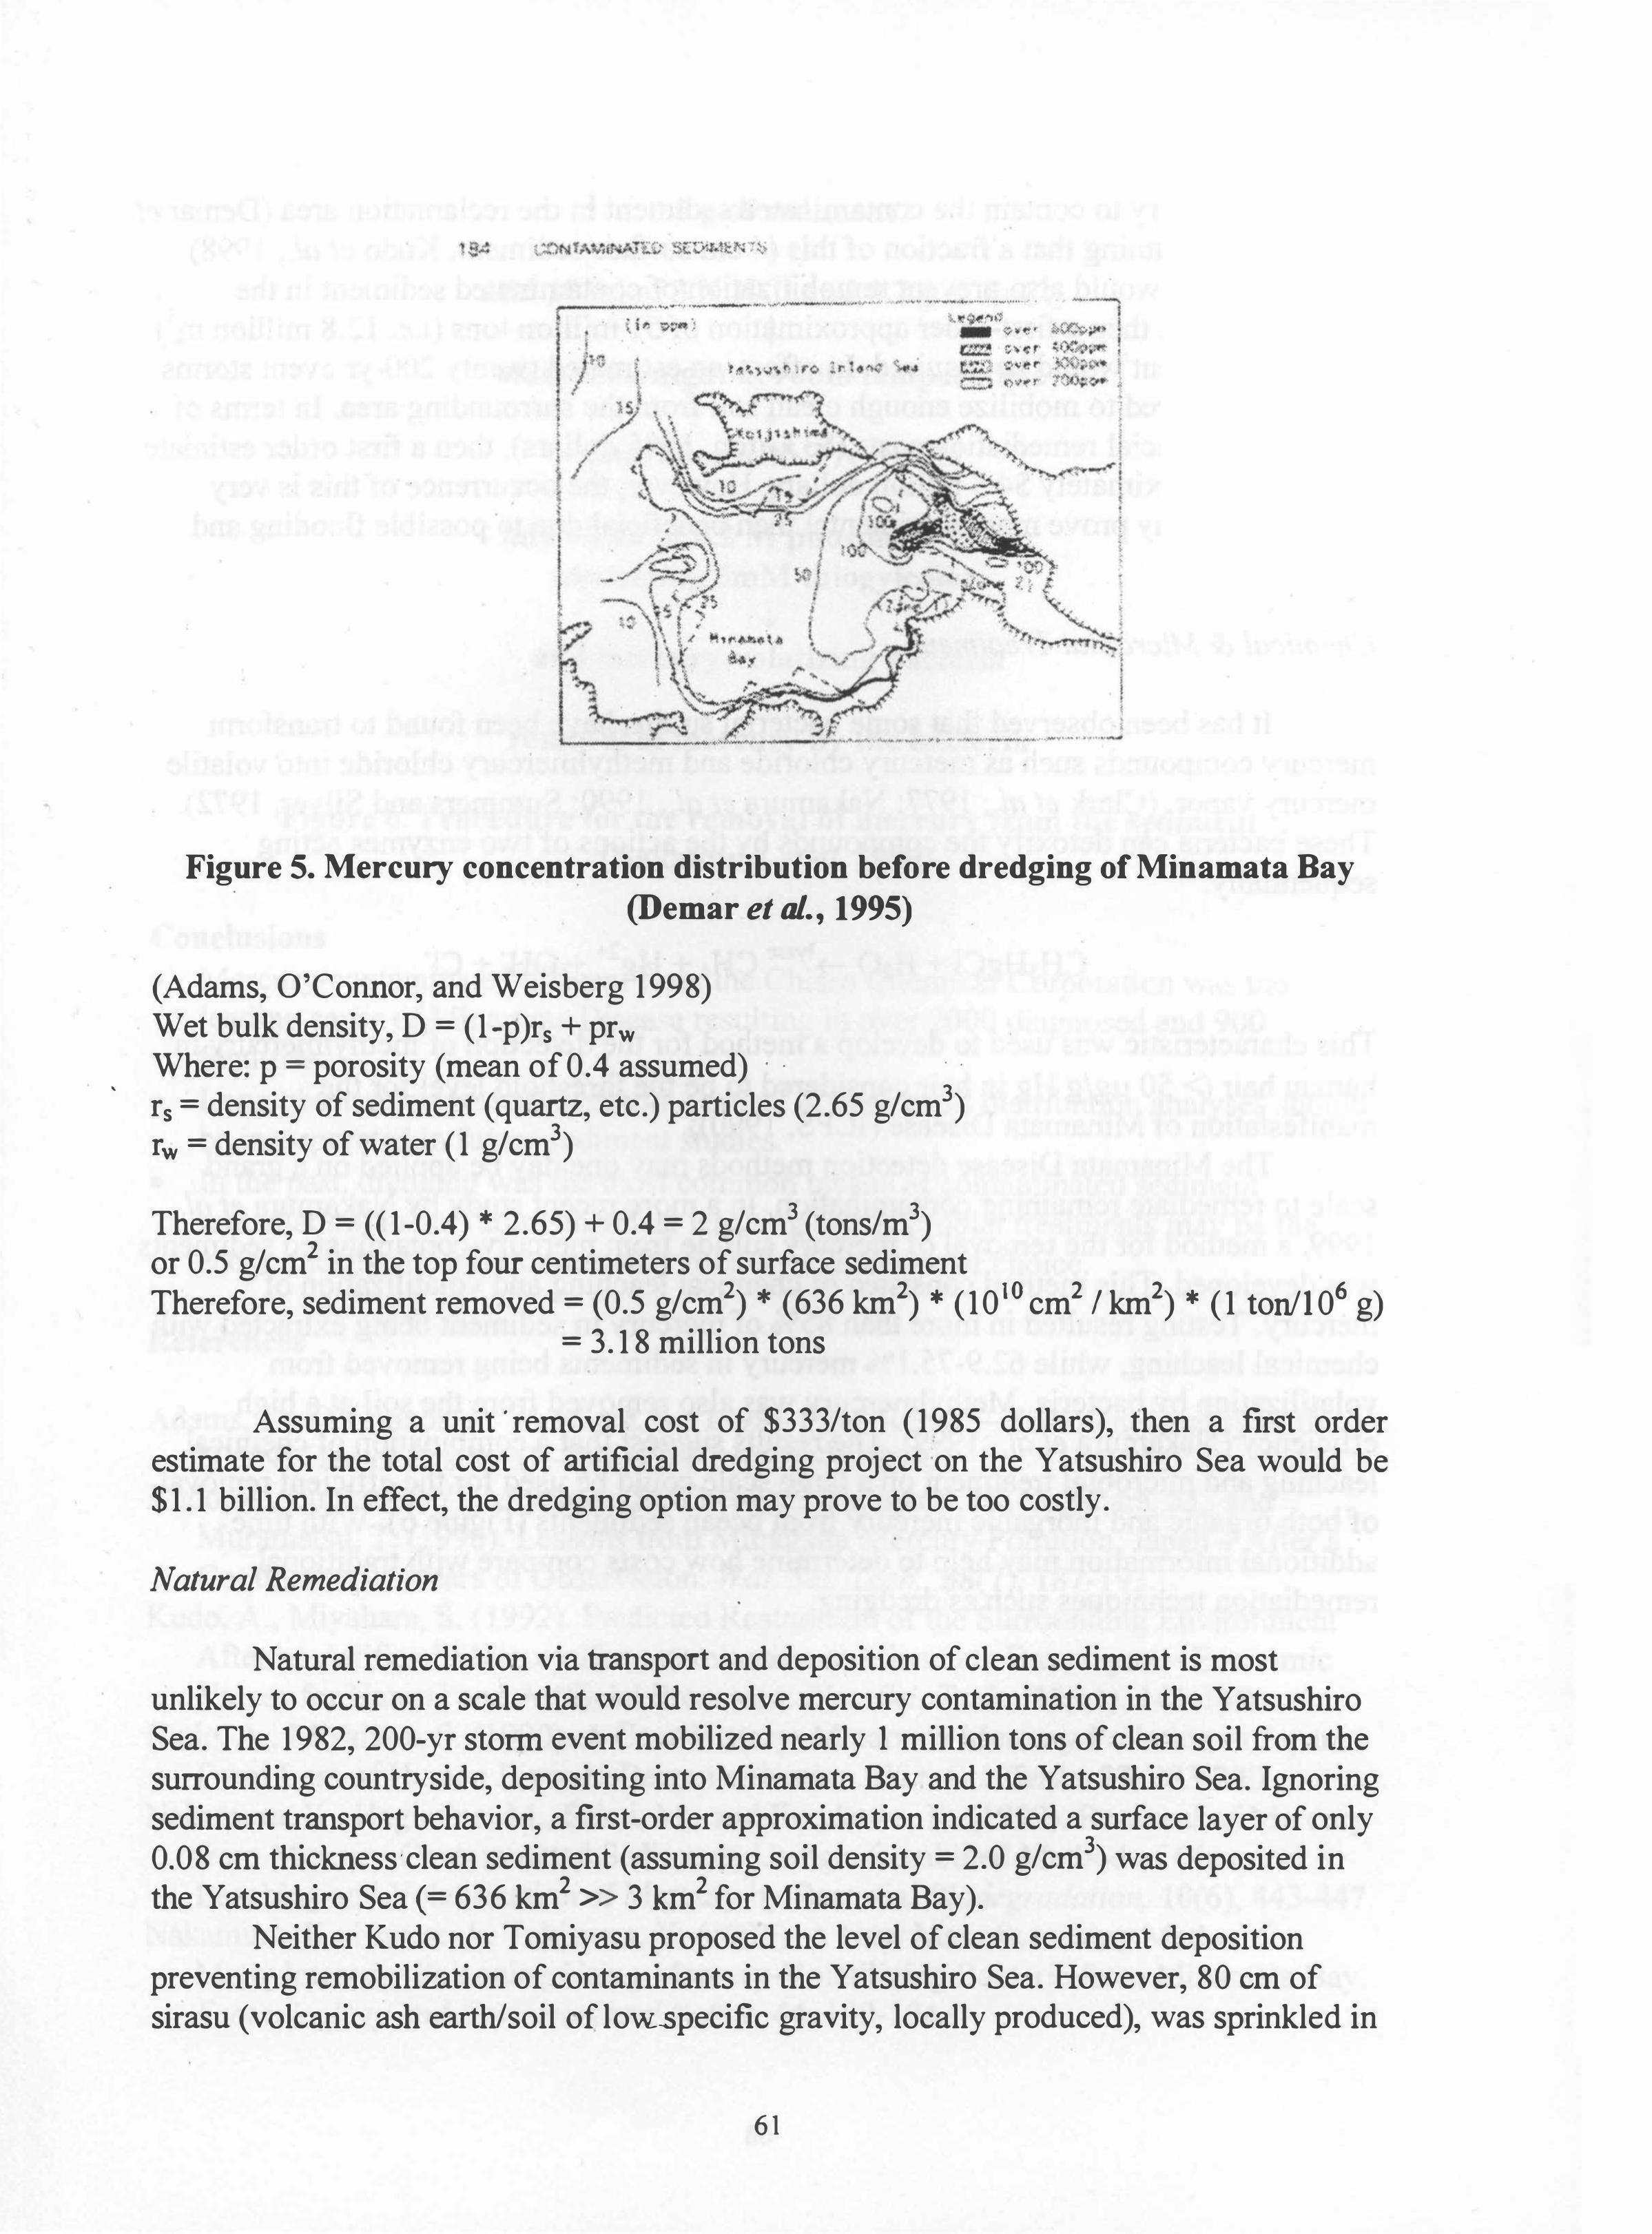
•
•
•
•
Figure 5. Mercury concentration distribution before dredging of Minamata Bay . (Demar et al., 1995)
(Adams, O'Connor, and Weisberg 1998) Wet bulk density, D = (l -p)rs + prw Where; p = porosity (mean of 0.4 assumed) . . . .
, rs = density of sediment (quartz, etc.) particles (2.65 glcm3) rw = density of water (l glcm3)
Therefore, D = ((1-0.4) * 2.65) + 0.4 = 2 glcm3 (tons/m3) or 0.5 glcm2 in the top four centimeters of surface sediment Therefore, sediment removed = (0.5 glcm2) * (636 km2) * (1010 cm2 1 km2) * (1 toni 1 06 g)
= 3.18 million tons
Assuming a unit ' removal cost of $333/ton (1985 dollars), then a first order estimate for the total cost of artificial dredging project on the Yatsushiro Sea would be $1.1 billion. In effect, the dredging option may prove to be too costly.
Natural Remediation •
Natural remediation via transport and deposition of clean sediment is most unlikely to occur on a scale that would resolve mercury contamination in the Yatsushiro Sea. The 1982, 200-yr stonn event mobilized nearly I million tons of clean soil from the surrounding countryside, depositing into Minamata Bay and the Yatsushiro Sea. Ignoring sediment transport behavior, a first-order approximation indicated a surface layer of only 0.08 cm thickness ' clean sediment (assuming soil density = 2.0 g/cm3) was deposited in the Yatsushiro Sea (= 636 km2 » 3 km2 for Minamata Bay).
Neither Kudo nor Tomiyasu proposed the level of clean sediment deposition preventing remobilization of contaminants in the Yatsushiro Sea. However, 80 cm of sirasu (volcanic ash earth/soil of low..specific gravity, locally produced), was sprinkled in
6 1
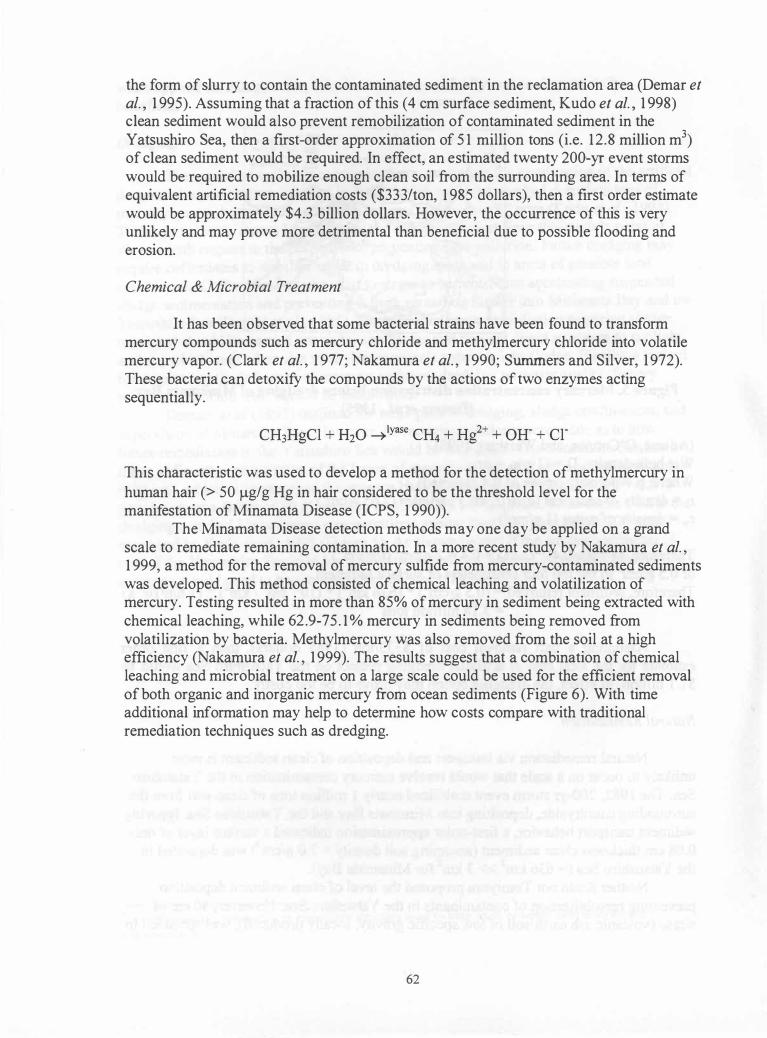
the form of slurry to contain the contaminated sediment in the reclamation area (Demar et al. , 1 995). Assuming that a fraction of this (4 cm surface sediment, Kudo et aI. , 1 998) clean sediment would also prevent remobilization of contaminated sediment in the Yatsushiro Sea, then a first-order approximation of 5 1 million tons (i.e. 1 2.8 million m3) of clean sediment would be required. In effect, an estimated twenty 200-yr event storms would be required to mobilize enough clean soil from the surrounding area. In terms of equivalent artificial remediation costs ($333/ton, 1 985 dollars), then a first order estimate would be approximately $4.3 billion dollars. However, the occurrence of this is very unlikely and may prove more detrimental than beneficial due to possible flooding and erosion.
Chemical & Microbial Treatment
It has been observed that some bacterial strains have been found to transform mercury compounds such as mercury chloride and methylmercury chloride into volatile mercury vapor. (Clark et aI. , 1 977; Nakamura et al. , 1 990; Summers and Silver, 1 972). These bacteria can detoxify the compounds by the actions of two enzymes acting sequentially.
This characteristic was used to develop a method for the detection of methylmercury in human hair (> 50 Ilg/g Hg in hair considered to be the threshold level for the manifestation of Minamata Disease (ICPS, 1 990)).
The Minamata Disease detection methods may one day be applied on a grand scale to remediate remaining contamination. In a more recent study by Nakamura et aI. , 1 999, a method for the removal of mercury sulfide from mercury-contaminated sediments was developed. This method consisted of chemical leaching and volatilization of mercury. Testing resulted in more than 85% of mercury in sediment being extracted with chemical leaching, while 62.9-75 . 1 % mercury in sediments being removed from volatilization by bacteria. Methylmercury was also removed from the soil at a high efficiency (Nakamura et aI. , 1 999). The results suggest that a combination of chemical leaching and microbial treatment on a large scale could be used for the efficient removal of both organic and inorganic mercury from ocean sediments (Figure 6). With time additional information may help to determine how costs compare with traditional remediation techniques such as dredging.
62
0.5 g of sediment
-1-add 10 ml of 3 N Hel and 0.2 g of FeCi)
-1-stand overnight at room temperature
-1-neutralize with 3 N NaOH
-1-add 40 ml of 0.2 M phosphate buffer
containing SmM thiogylcolate
-1-add mercury-volatizing bacteria
-1-removal of mercury by the bacteria
Figure 6. Procedure for the removal of mercury from the sediment (Nakamura et aL 1999)
Conclusions • Mercury-contaminated effluent from the Chisso Chemical Corporation was the
leading cause of Minamata Disease resulting in over 2000 diagnosed and 900 fatalities.
• Long observation periods and both vertical & horizontal distribution analyses should be incorporated in future sediment studies.
• In the past, dredging was the most common means of contaminated sediment remediation; in the future chemical leaching and microbial treatments may be the economically and environmentally friendly alternative of choice.
References
Adams, D., O'Connor, J., Weisberg, S . (1998). Final Report - Sediment Quality of the NYINJ Harbor System (R-EMAP). EPA/902-R-98-00 1 .
Kudo, A., Fujikawa, Y., Miyahara, S., Zheng, J. , Takigami, H., Sugahara, M., and Muramatsu, T. ( 1 998). Lessons from Minamata Mercury Pollution, Japan - After a Continuous 22 Years of Observation. Wat. Sci. Tech. , 38(7), 1 87-193.
Kudo, A., Miyahara, S . (1992). Predicted Restoration of the Surrounding Environment After an Artificial Mercury Decontamination at Minamata Bay, Japan - Economic Values for Natural and Artificial Processes. Wat. Sci. Tech. , 25( 1 1 ), 1 4 1 -148 .
Kudo, A., Miyahara, S. (1990). A Case History; Minamata Mercury Pollution in Japan From Loss of Human Lives to Decontamination. Wat. Sci. Tech. , 23, 283-290.
Nakamura, K., Hagimine, M., Sakai, M., and Furukawa, K. (1999). Removal of Mercury from Mercury-Contaminated Sediments Using a Combined Method of Chemical Leaching and Volatilization of Mercury by Bacteria. Biodegradation, 10(6), 443-447.
Nakamura, K., Naruse, I., Takizawa, Y. ( 1 999). A New Mass Screening Method for Methylmercury Poisoning Using Mercury-Volatilizing Bacteria from Minamata Bay. Ecotoxicology and Environmental Safety, 44, 100- 104.
63
Miyahara, S. , Schintu, M., Kauri, T., Kudo, A. ( 1 988). Twelve Years of Observations of Mercury Concentrations in Yatsushiro Sea (Japan). Wat. Sci. Tech. , 20(617), 1 93- 1 97.
Nakumura, K., Naruse, I., and Takizawa, Y. (1 999). A new mass screening method for methylmercury poisoning using mercury - volatilizing bacteria from Minamata Bay. Ecotoxicology and Environmental Safety, 44(1 ), 1 00-1 04.
Sakamoto, H. The Distribution of Mercury, Arsenic and Antimony in Sediments of Kagoshima Bay. Bull. Chem. Soc. Jpn. , 58, 580-587.
Tomiyasu, T., Nagano, A., Yonehara, N.; Sakamoto, H., Rifardi, Oki, K., and Akagi, H. (2000). Mercury Contamination in the Yatsushiro Sea, south-western Japan: Spatial Variations of Mercury in Sediment. Sci. Tot. Env. , 257, 1 2 1 - 1 32.
Yoshinaga, K., Mercury-Contaminated Sludge Treatment by Dredging in Minamata bay, Dredging, Remediation, and Containment of Contaminated Sediments, ASTM STP 1293, K. R. Demars, G. N. Richardson, R. N. Young, and R. C. Chaney, Eds., American Society for Testing and Materials, Philadelphia, 1 995, pp. 1 82- 1 9 1 .
64