Embed Size (px)
Citation preview
Malaysian Journal of Analytical Sciences, Vol 19 No 6 (2015): 1335 - 1347
1335
MALAYSIAN JOURNAL OF ANALYTICAL SCIENCES
Published by The Malaysian Analytical Sciences Society
ASSESSMENT OF LAND USE CHANGE AND SEDIMENTATION
MODELLING ON ENVIRONMENTAL HEALTH
IN TROPICAL RIVER
(Penilaian Perubahan Guna Tanah dan Permodelan Sedimentasi ke atas
Kesihatan Persekitaran di Sungai Bertropika)
Mohd Ekhwan Toriman1,2
, Mohd Khairul Amri Kamarudin1,3
*, Thudchai Sansena4, Kampand Bhaktikuld
5,
Roslan Umar1, Asyaari Muhamad
1, Nor Azlina Abd Aziz
1, Nur Hishaam Sulaiman
1
1East Coast Environmental Research Institute (ESERI),
Universiti Sultan Zainal Abidin, 21300 Kuala Terengganu, Terengganu. Malaysia 2School of Social, Development and Environmental Studies, Faculty of Social Sciences and Humanities,
Universiti Kebangsaan Malaysia, 43600 UKM Bangi, Selangor, Malaysia 3Faculty of Design Arts and Engineering Technology,
Universiti Sultan Zainal Abidin, Gong Badak Campus, 21300 Kuala Terengganu Terengganu. Malaysia 4Informatics and Space Technology Department Agency, 10150 Bangkok, Thailand.
5Faculty of Environment and Resource Studies,
Mahidol University, Phutthamonthon 73170, Nakhon Pathom, Thailand
*Corresponding author: [email protected]
Received: 14 April 2015; Accepted: 9 July 2015
Abstract
Sediments are defined as the organic and inorganic materials or solid fragments derived from the weathering processes of sand,
pebbles, silt, mud and loess. The objective of this research is to forecast sediment volume in the Lam Phra Phloeng reservoir by
using the Neuro-genetic Optimizer model to calculate the sediment volume from runoff, rainfall, and sediment volume data. The
results from satellite imagery interpretation elucidated that from 2002 to 2005, forest area decreased approximately 50,220 km2
or 36 %, and was converted to agricultural land. By applying the USLE equation, the soil erosion area was found to increase
approximately 185,341 tons/year between 2002 and 2005. This result illustrated that the impact of land use change greatly
increased sedimentation volume. In applying the Neuro-genetic Optimizer model, the learning rate and momentum of this model
was 0.9 and 0.1, respectively, and the initial weight value was +/-3. The model forecasted the annual sediment volume in the
Lam Phra Phloeng reservoir in 2005 to be 49,855 tons with R2 equals to 0.9994. The regression model, on the other hand,
forecasted the sediment volume using the equation Y=198. 48x 1.1783 with R2 equals to 0.9974, and the annual sediment
volume was estimated to be 45,346 tons. The actual sediment volume in the reservoir in 2005 was obtained from The Royal
Irrigation Department, which was found to be 48,697 tons.
Keywords: sedimentation, land use change, Tropical River; USLE; neuro-genetic optimizer
Abstrak
Sedimen boleh ditakrifkan sebagai bahan organik dan bukan organik atau serpihan pepejal yang diperolehi daripada proses
luluhawa pasir, batu kecil, kelodak, lumpur dan loess. Objektif kajian ini adalah untuk meramal jumlah sedimen dalam takungan
Sungai Lam Phra Phloeng dengan menggunakan model Neuro-genetik Optimizer untuk mengira jumlah sedimen daripada data
larian air, hujan, dan jumlah sedimen. Hasil daripada tafsiran imej satelit pada tahun 2002-2005, kawasan hutan merosot kira-
kira 50.220 km2 atau 36%, dan telah ditukar kepada tanah pertanian. Dengan menggunakan persamaan USLE, kawasan hakisan
tanah didapati telah meningkatkan kira-kira 185.341 tan / tahun antara tahun 2002 dan 2005. Hasil kajian menunjukkan kesan
ISSN
1394 - 2506

Mohd Ekhwan et al: ASSESSMENT OF LAND USE CHANGE AND SEDIMENTATION MODELLING ON
ENVIRONMENTAL HEALTH IN TROPICAL RIVER
1336
perubahan guna tanah dan sedimentasi adalah meningkat. Berdasarkan model Neuro-genetik Optimizer, kadar pembelajaran dan
momentum model ini adalah 0.9 dan 0.1, dan nilai berat badan awal adalah +/- 3. Model ini meramalkan jumlah sedimen tahunan
dalam takungan Lam Phra Phloeng pada 2005 meningkat kepada 49.855 ton yang bersamaan dengan R2 0.9994. Model regresi,
di bahagian lain pula, diramalkan dengan menggunakan persamaan Y = 198. 48 x 1.1783 dengan bersamaan dengan R2 0.9974.
Jumlah sedimen tahunan pula dianggarkan sebanyak 45346 tan. Jumlah sedimen sebenar dalam takungan pada tahun 2005 telah
diperolehi daripada Jabatan Pengairan Diraja, iaitu sebanyak 48.697 tan.
Kata kunci: sedimentasi, perubahan guna tanah; Sungai Tropika; USLE; neuro-genetik optimizer
Introduction
Apparently, numerous important basins in Thailand are risking deterioration due to rapid population expansion,
economic growth and inappropriate use of natural resources, particularly soil, water, and forest [1]. These activities
affected the existence of basins directly and indirectly, especially the increase of soil erosion in upper catchment
which poses a deleterious threat to water sources [2]. Inappropriate land use based on watershed characteristics and
its potential led to soil erosions that caused the streams and reservoirs to become shallow. Shallow streams and
reservoirs consequently decrease the ability of the water reservation and may potentially inflict floods in the rainy
season and drought in the summer season. In addition, certain groups of the local community have not realized the
essential role of water and the importance of conserving water in terms of quality and quantity. These factors
contribute to the complexity of the water sources crisis.
Predominantly, most of previous researches concerning sediment in the watershed area employed linear model to
find an association between land use changes in the area and sediment volume. However, the watershed does not
follow a linear model, but is dynamic in characteristics with rapid changes that occur constantly. Thus, linear model
may not be effectively appropriate for the prediction of the sedimentation [3]. Additionally, it requires large
amounts of data that increase the complexity of the data process.
Therefore, the forecasting of sediment in the subsequent research should be carried out with non-linear model.
Currently, the Neuro-genetic Optimizer model, which is a black-box model, and also a hybrid model of Neural
Network with Genetic Algorithm, is one of the effective forecasting tools. It has recently been used in hydrology,
because Artificial Neural Network (ANNs) could recognize patterns and find associations among various affecting
factors and use them in forecasting [4]. Therefore, this study aimed to use Neuro-genetic Optimizer to forecast
dynamic changes that occurred in Lam Phra Phloeng watershed in order to predict and create a guideline for further
watershed management.
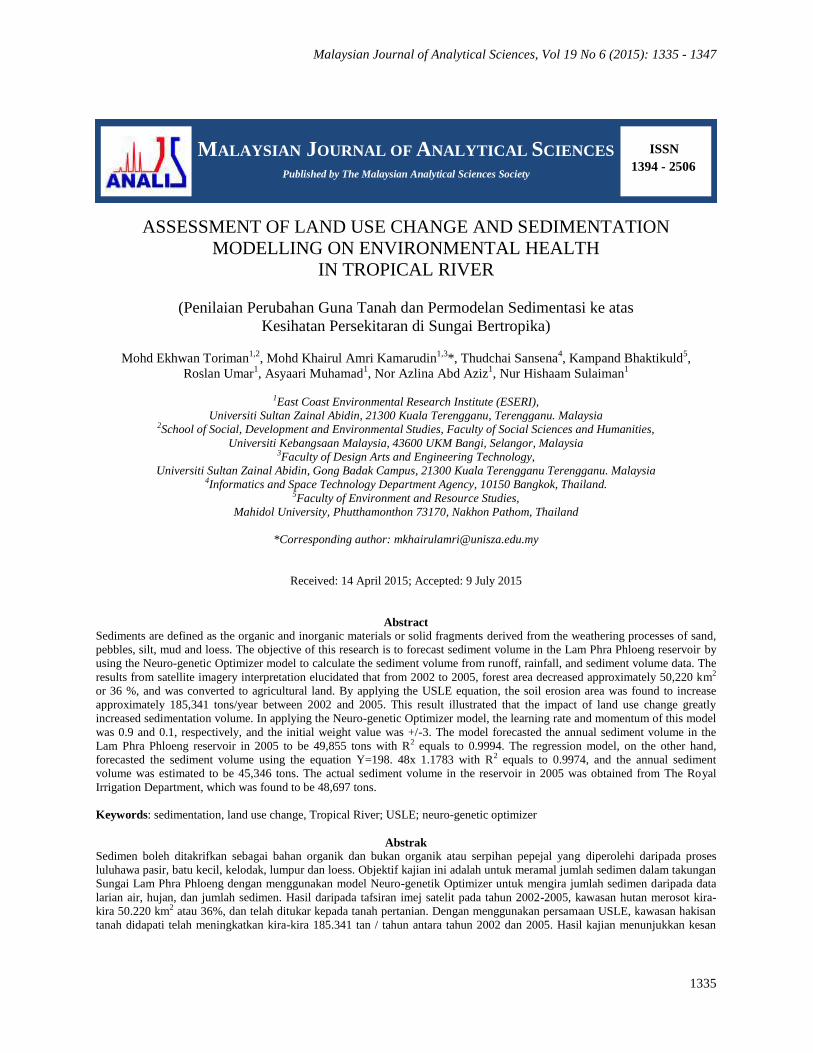
Neuro-genetic Algorithm: NGA is a hybrid model of Artificial Neural Network and Genetic Algorithm that could be
used with complicated matters as the tools for decision-making when there are diversified variables. It is done by
selecting data for testing and training as well as selecting the type of Network and designing the structure of Neuro-
genetic Algorithm through the application of Genetic Algorithm (GA) in the structural improvement of network and
selecting key variables as one way to solve problem that could be applied with solving existing problems. The
structure of Neuro-genetic Optimizer is shown in Figure 1.
Malaysian Journal of Analytical Sciences, Vol 19 No 6 (2015): 1335 - 1347
1337
Figure 1. Neuro-genetic Optimizer of Structure
Materials and Methods
The data were collected from relevant governmental agencies and authorities, which involving the data on land use,
rainfall and runoff volume in the study area and the surrounding. The data were then inserted into the models for
analysis. The rainfall data were obtained from the Thai Meteorological Department by which the data of monthly
rainfall volume measured from the year of 1993 until 2005 were accumulated from ten monitoring stations
surrounding the Lam Phra Phloeng Reservoir. The runoff data were acquired from the Royal Irrigation Department,
and calculated to be monthly runoff data, which can then be compared to the rainfall data to find the association
with land use change. The data were recorded for the year of 1993 to 2005. Validated method for reliability of
rainfall and runoff data utilizes the double mass curve method. In order to find the variable that affects the sediment
volume, the correlation coefficient can be obtained from the equation 1 below [5]. In general, the R value of
Hydrology study should exceed 0.60 in order to accept the association.
R =
In determining the land use change, satellite images from LANDSAT-5 that recorded the pictures of Lam Phra
Phloeng river basin in 2002 and 2005 from Geo-Informatics and Space Technology Development Agency
(GISTDA) were studied. Interpretation of satellite images was carried out with the Program ERDAS IMAGINE 8.6
through supervised classification. Land use was classified into 7 types, which are dry evergreen forest, dry
dipterocarp forest, water bodies, mixed upland crop, sugar cane, orchard and open land.
Conjointly, land use between 2002 and 2005 was compared in order to make the map showing land use changes in
each year alongside with creating the database for GIS through overlay analysis and matrix. In the analysis of soil
loss based on USLE [6-10], equation of land loss was attained through the adapted program to find the situation in
))()()(( 2222
yyNxxN
yxxyN (1)

Mohd Ekhwan et al: ASSESSMENT OF LAND USE CHANGE AND SEDIMENTATION MODELLING ON
ENVIRONMENTAL HEALTH IN TROPICAL RIVER
1338
each area or soil loss level as the data in decision-making for the land use as well as setting up proper measures for
soil and water conservation. Soil loss inputs were derived from data analysis of Rainfall Erosivity Index, Topology,
Soil Erodibility, Crop and Land use and Conservation Practice. Apropos of GIS application and finding value of
land loss, they were done utilizing the USLE equation as portrayed in Figure 2.
Figure 2. Schematic of Soil Erosion Hazard Model in Lam Phra Phloeng River Basin
These five data had been applied to spatial data analysis through overlay and non-spatial data in the calculation for
soil loss (A), ton/hectare/year before dividing by 6.25 to yield a unit as ton/km2/year. The result of the study
suggested that the area exhibiting soil loss class in the area above Lam Phra Phloeng Reservoir. These data were
classified into 5 intensity classes [11,12].
The following steps for developing a model in sediment estimation in Lam Phra Phloeng River Basin with the
application of Neuro-genetic Optimizer may be concluded as follows:
I. Identifying data by dividing into the following 2 sets:
a) Input Layer comprising the following data:
- Rainfall,
- Runoff,
- Runoff lagged time 1 month
- Sediment lagged time 3 months
b) Output Layer consisting of the following data:
- Sediment data
II. Specifying Neuron in the structure of ANNs which contain 3 levels [13,14] as follows:
- Input Layer has 4 Neurons,
- Hidden Layer used GAs to specify Neurons
- Output Layer has 1 Neuron

Malaysian Journal of Analytical Sciences, Vol 19 No 6 (2015): 1335 - 1347
1339
There are 10 steps of Neuro-genetic Optimizer, which are depicted in Figure 3. Step 1 is Initial Population. The
sample population consists of 4 input layers, which are rainfall data, runoff data, runoff data lagged 1 month, and
sediment data lagged 3 months.
Figure 3. Flowchart of Neuro-genetic Optimizer [15]
The first step is started from building new population comprising chromosomes with double base derived from
random sampling with equal size of specified chromosomes by having total chromosomes as population size. The
initial weight was in the span of +/-3. Step 2 is Decode which involves the decoding heredity from chromosomes
derived from the population in the 1st step by transforming double base into ten bases for the hidden neuron in the
hidden layer of ANNs. Step 3 is Trained Back-propagation Neural Network. In this step, network for learning would
be derived from the past data by assigning numbers of hidden neuron as equal as the value from decoding. Before
the data could be applied in learning, those data must be constructed into normal design. Subsequently, they must be
divided into 2 sets, with one set in train (19 set), and the other in testing (19 set).
The learning process is the Back-propagation (BP), which use data pass with the total of 50 times. The structure of
neural training mode was the optimizing form. Sigmoid function was employed as a transfer function with a scaling

Mohd Ekhwan et al: ASSESSMENT OF LAND USE CHANGE AND SEDIMENTATION MODELLING ON
ENVIRONMENTAL HEALTH IN TROPICAL RIVER
1340
function converting input in the span of 0-1 as well as reversing data. The learning process is utilizing variance that
could be reversed back to adjust the weight so that the variance may be reduced. As for numbers of Epoch, one may
notice the stability of the error or reduction in smaller proportion. Learning rate and momentum are 0-1. Step 4 is
Fitness Evaluation. In this step, the calculation was done to find variations of the network, which considering proper
fitness value of heredity by using RMSE. Step 5 is Stop Criteria. This is the step to check when the design stops
working by setting up conditions for numbers of result compilation. If the answers in each round are still stable, it
should stop working. If the stop conditions are real, the operation may cease at step 10. On the contrary, for unreal
stop conditions, the step should be proceeded further with step 6.
Step 6 is Selection. In this step, two chromosomes with the minimum fitness values were selected from the
population to be the breeders. This method encompassing the identifying selection value with the application of
Percent 0.5 will select data with GAs and search structure to the best fitness. Step 7 is Crossover. This is the step for
crossing species by exchanging genes among selected breeders in Step 6 for the offspring. Specifying mating by
applying GAs through tail swap and thereafter GAs would be used in cut point and end parent. Step 8 is Mutation.
After deriving the offspring with 2 chromosomes after crossover, mutation would be done by arbitrarily selected
position of the gene with the possibility of mutation. Thenceforward, after randomly selected position, value of the
gene would have opposite value. In identifying mutation, random exchange rates 0.25 and section reversal rates
0.25.
Step 9 is Replacement. The offspring with a fitness value would take place on the optimum chromosome in order to
derive new group of population before going back to 2nd step. The structure of this method would give better value
of fitness than finding the average of refill through cloning. Step 10 is Stop. After the stop conditions had been
verified, the operation of model would stop with only the best network design had been collected to be utilized for
measuring effectiveness of the network.
Results and Discussion
Based on this study, hydrological data analysis requires extended rainfall data duration [16,17]. Recurrently, the
measurement and collection process may be inconsistent. The common data validation method to validate rainfall
and runoff data is the double mass curve. This method compares the cumulative annual rainfall volume and runoff
volume at the monitoring stations of interest with average cumulative data from nearby stations. In order to validate
the data, the present study adopted annual cumulative rainfall data from 4 monitoring stations, belonging to the
Royal Irrigation Department: Station M.33, Station M.145, Station M.146, and Station M.147. The double mass
curves are displayed in Figure 4.
By using satellite images from LANDSAT-5 TM between 2002 and 2005 for interpretation in order to classify and
create map showing land use in Lam Phra Phloeng river basin, the results connoted that the land use can be
classified into 7 types: mixed upland crop, orchard, sugarcane, dry evergreen forest, dry dipterocarp forest, open
land and water bodies.
As for the land use changes, the results are concluded as follows: Agricultural areas. The agricultural areas were
used to cultivate mixed upland crops, sugar cane and orchard. Agricultural areas were reduced from 244,662 km2 in
2002 to 215,902 km2 in 2005 or 5.69 % of the total changed area since the satellite image interpretation during that
time was done with the open land that had been planned for the next cultivation plots. Forest Areas. The
predominant forest areas are dry evergreen forest and dry dipterocarp forest.
The study discovered that the forest areas were reduced from 256,145 km2 in 2002 to 205,996 km
2 in 2002 or 9.93
% of the total changed area. The decline is associated with deforestation activities as well as clearing land for other
use such as agricultural, resort or orchard. Miscellaneous Areas. areas that do not fall into agriculture or forest area
are classified as open land. It had increased from 1,842 km2 in 2002 to 80,669 km
2 in 2005 or 15.59 % of the total
changed area, and water bodies increased from 3,060 km2 in 2002 to 3,212 km
2 in 2002, constituting 0.03 % of total
changed area.

Malaysian Journal of Analytical Sciences, Vol 19 No 6 (2015): 1335 - 1347
1341
Double mass curve
0
2,000
4,000
6,000
8,000
10,000
12,000
14,000
16,000
18,000
0 2,000 4,000 6,000 8,000 10,000 12,000 14,000 16,000 18,000
Average Accumulative Rainfall 4 Station (mm)
Ac
cu
mu
lati
ve
Ra
infa
ll M
.33
(m
m)
20052004
2003
20001999
1997
19951994
19921993
1996
1998
2001
Double Mass Curve
0
2,000
4,000
6,000
8,000
10,000
12,000
14,000
16,000
18,000
0 2,000 4,000 6,000 8,000 10,000 12,000 14,000 16,000 18,000
Average Accumulative Rainfall 4 Station (mm)
Ac
cu
mu
lati
ve
Ra
infa
ll M
.14
5 (
mm
)
20052004
2003
20001999
1997
19951994
19921993
1996
1998
2001
Double Mass Curve
0
2,000
4,000
6,000
8,000
10,000
12,000
14,000
16,000
18,000
0 2,000 4,000 6,000 8,000 10,000 12,000 14,000 16,000 18,000
Average Accumulative Rainfall 4 Station (mm)
Ac
cu
mu
lati
ve
Ra
infa
ll M
.14
6 (
mm
)
20052004
2003
20001999
1997
19951994
19921993
1996
1998
2001
Double Mass Curve
0
2,000
4,000
6,000
8,000
10,000
12,000
14,000
16,000
18,000
0 2,000 4,000 6,000 8,000 10,000 12,000 14,000 16,000 18,000
Average Accumulative Rainfall 4 Station (mm)
Ac
cu
mu
lati
ve
Ra
infa
ll M
.14
7 (
mm
)
20052004
2003
20001999
1997
19951994
19921993
1996
1998
2001
Figure 4. Double Mass Curve Analysis of Rainfall and Runoff Data
The present study revealed the land use changes in Lam Phra Phloeng river basin during 2002 until 2005. The data
provide beneficial information to trail future land use changes in this watershed and since the GIS database has been
developed for Lam Phra Phloeng reservoir, this study is also crucial for further application in land evaluation. This
can be done through the construction of spatial modelling, which would aim at planning the land use in the upper
Lam Phra Phloeng reservoir area to correspond with the land ecological approach and sustainable use in order to
benefit the populace in the watershed area. Furthermore, comparing land use changes of area above Lam Phra
Phloeng Reservoir in 2002 to 2005 indicated the following results, as depicted in Figure 5 and Table 1.
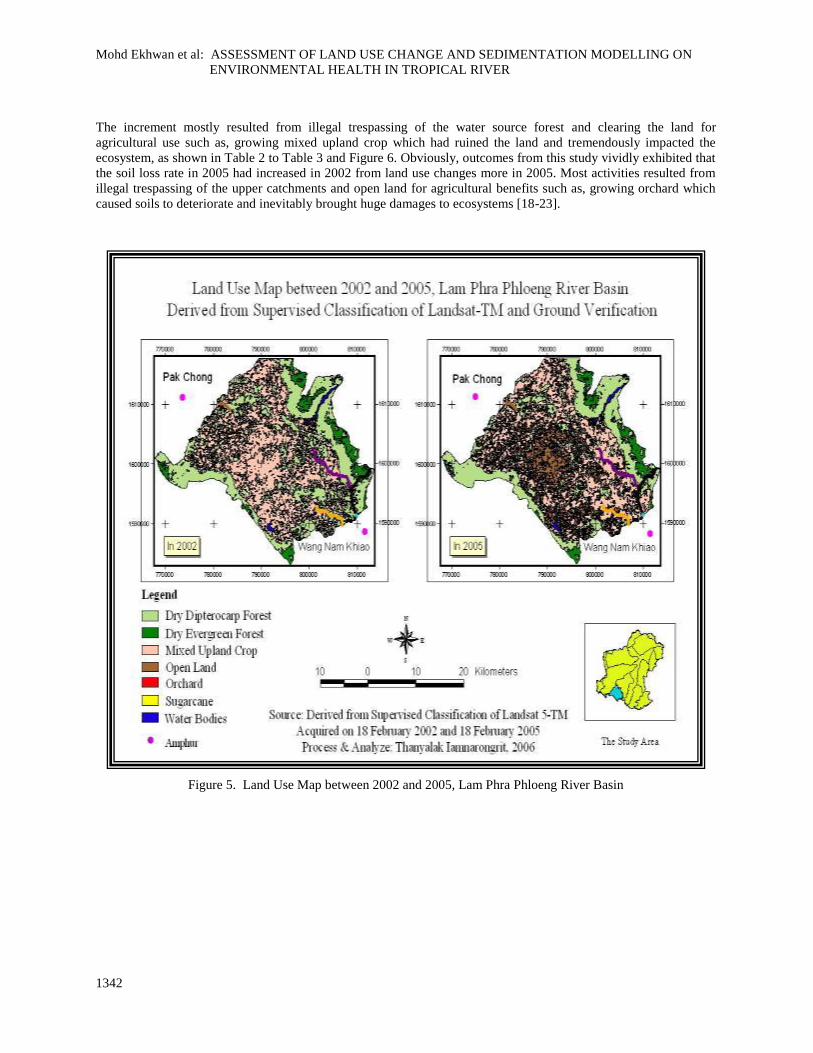
From developing map for soil loss based on specified intensity and area calculation of each intensity level in the
year 2002 and 2005, findings implied that rate of soil loss had been increased. Moreover, findings also suggested
that the volume of sediment from soil erosion as the average in the area above the Lam Phra Phloeng reservoir had
escalated from 2002 with estimated of 196,771 tons/km2/year to estimate of 382,112 tons/ km
2/year in 2005.
Mohd Ekhwan et al: ASSESSMENT OF LAND USE CHANGE AND SEDIMENTATION MODELLING ON
ENVIRONMENTAL HEALTH IN TROPICAL RIVER
1342
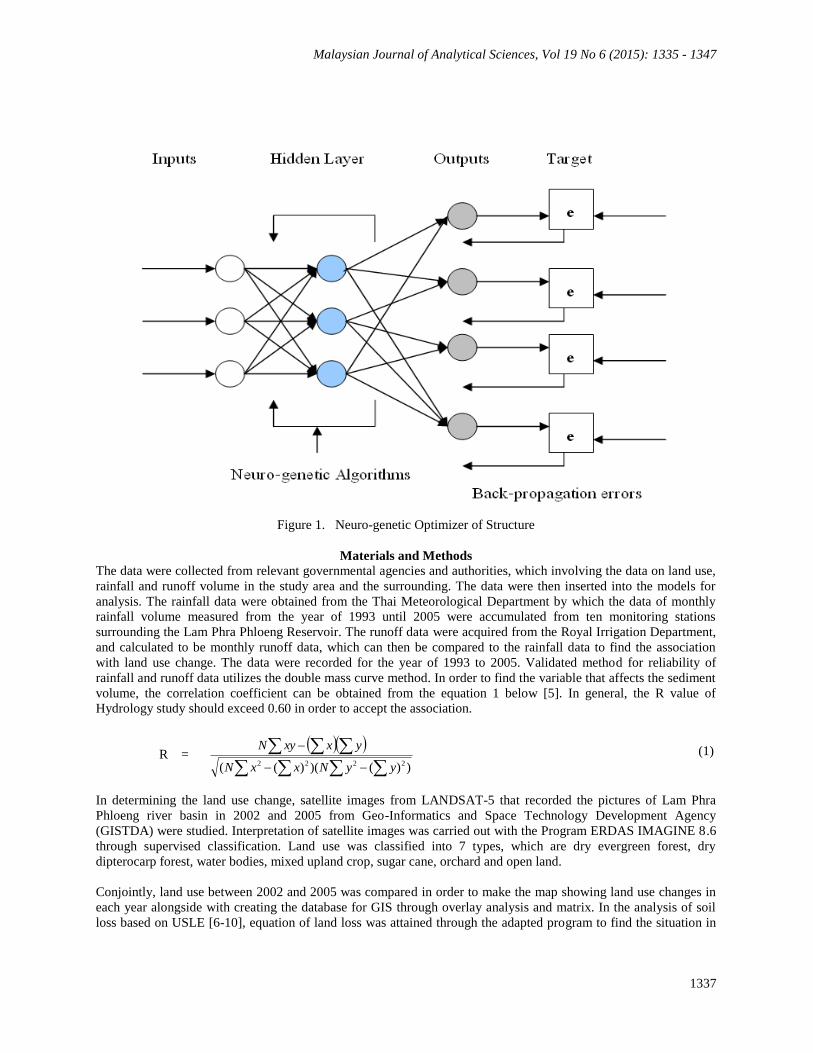
The increment mostly resulted from illegal trespassing of the water source forest and clearing the land for
agricultural use such as, growing mixed upland crop which had ruined the land and tremendously impacted the
ecosystem, as shown in Table 2 to Table 3 and Figure 6. Obviously, outcomes from this study vividly exhibited that
the soil loss rate in 2005 had increased in 2002 from land use changes more in 2005. Most activities resulted from
illegal trespassing of the upper catchments and open land for agricultural benefits such as, growing orchard which
caused soils to deteriorate and inevitably brought huge damages to ecosystems [18-23].
Figure 5. Land Use Map between 2002 and 2005, Lam Phra Phloeng River Basin

Malaysian Journal of Analytical Sciences, Vol 19 No 6 (2015): 1335 - 1347
1343
Table 1. The Change of Land Use in Lam Phra Phloeng Reservoir between 2002 and 2005
Land Use Type Area (km2) 2002 Area (km
2)
2005
Changing
(km2)
Changing
Percentage
1. Agricultural Area 244,661 215,902 -28,759 5.69
- Mixed upland crop
Crops
239,773 209,872 -29,901 5.91
- Sugarcane 2,837 3,646 809 0.16
Orchard 2,051 2,384 333 0.07
2. Forest Area 256,146 205,926 -50,220 9.93
- Dry Evergreen Forest 30,374 25,195 -5,179 1.02
- Dry Dipterocarp Forest 225,772 180,731 -45,041 8.91
3. Miscellaneous Area 1,842 80,669 78,827 15.59
- Open Land 1,842 80,669 78,827 15.59
4. Water Area 3,060 3,212 152 0.03
- Water Bodies 3,060 3,212 152 0.03
Total 505,709 505,709 0.00 0.00
Remark: + =Increasing area, - = Decreasing area
Table 2. Soil Erosion Classes above Upper Lam Phra Phloeng Reservoir in 2002
Soil loss Rating
(ton/km2/year)
Soil loss
Volume
(ton/km2/year)
Areas Total Sediment from
Soil Erosion
(tons/year) km
2 Percentage of Area
Very Slight (< 2) 0.74 313,226 60.95 23,227
Slight (2-5) 3.19 39,665 7.51 12,328
Moderate(5-20) 5.14 154,187 30.0 79,252
Severe (20-100) 52.22 4,093 0.80 21,371
Very Severe (> 100) 158.77 3,817 0.74 60,594
Total 514,988 100.00 196,771
Table 3. Soil Erosion Classes above Upper Lam Phra Phloeng Reservoir in 2005
Soil loss Rating
(ton/km2/year)
Soil loss Volume
(ton/km2/year)
Land Total Sediment from
Soil Erosion
(tons/year) km
2 Percentage of
Area
Very Slight (< 2) 0.98 282,605 55.15 27,777
Slight (2-5) 8.20 86,361 16.85 70,803
Moderate(5-20) 13.12 134,736 26.29 176,783
Severe (20-100) 75.67 4,516 0.88 34,174
Very Severe (> 100) 172.04 4,219 0.82 72,576
Total 512,437 100.00 382,112
Mohd Ekhwan et al: ASSESSMENT OF LAND USE CHANGE AND SEDIMENTATION MODELLING ON
ENVIRONMENTAL HEALTH IN TROPICAL RIVER
1344
Figure 6. Actual Soil Loss between 2002 and 2005 in Lam Phra Phloeng River Basin
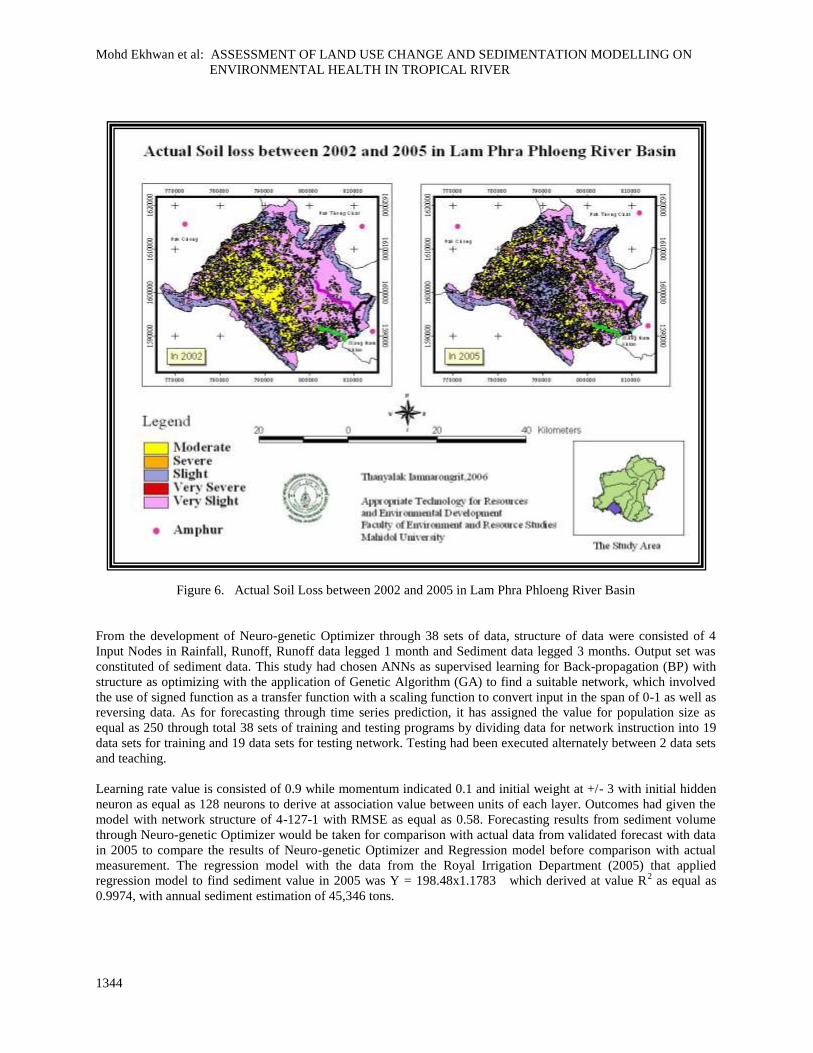
From the development of Neuro-genetic Optimizer through 38 sets of data, structure of data were consisted of 4
Input Nodes in Rainfall, Runoff, Runoff data legged 1 month and Sediment data legged 3 months. Output set was
constituted of sediment data. This study had chosen ANNs as supervised learning for Back-propagation (BP) with
structure as optimizing with the application of Genetic Algorithm (GA) to find a suitable network, which involved
the use of signed function as a transfer function with a scaling function to convert input in the span of 0-1 as well as
reversing data. As for forecasting through time series prediction, it has assigned the value for population size as
equal as 250 through total 38 sets of training and testing programs by dividing data for network instruction into 19
data sets for training and 19 data sets for testing network. Testing had been executed alternately between 2 data sets
and teaching.
Learning rate value is consisted of 0.9 while momentum indicated 0.1 and initial weight at +/- 3 with initial hidden
neuron as equal as 128 neurons to derive at association value between units of each layer. Outcomes had given the
model with network structure of 4-127-1 with RMSE as equal as 0.58. Forecasting results from sediment volume
through Neuro-genetic Optimizer would be taken for comparison with actual data from validated forecast with data
in 2005 to compare the results of Neuro-genetic Optimizer and Regression model before comparison with actual
measurement. The regression model with the data from the Royal Irrigation Department (2005) that applied
regression model to find sediment value in 2005 was Y = 198.48x1.1783 which derived at value R2 as equal as
0.9974, with annual sediment estimation of 45,346 tons.
Malaysian Journal of Analytical Sciences, Vol 19 No 6 (2015): 1335 - 1347
1345
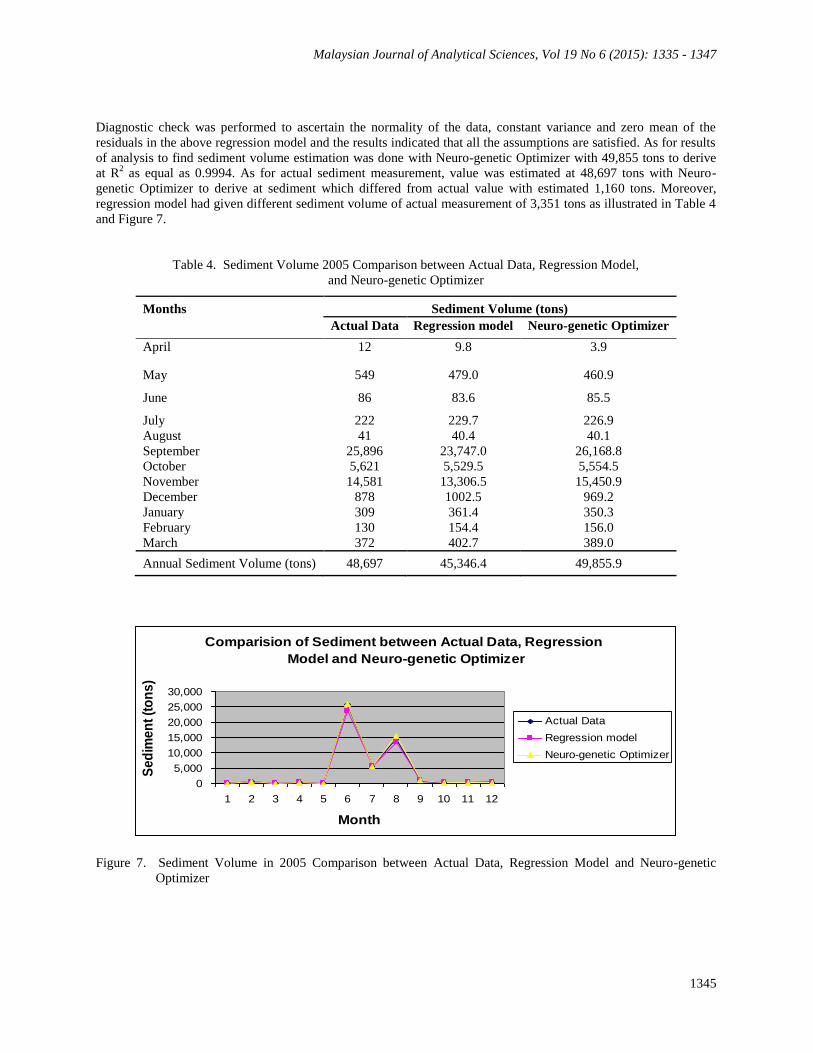
Diagnostic check was performed to ascertain the normality of the data, constant variance and zero mean of the
residuals in the above regression model and the results indicated that all the assumptions are satisfied. As for results
of analysis to find sediment volume estimation was done with Neuro-genetic Optimizer with 49,855 tons to derive
at R2 as equal as 0.9994. As for actual sediment measurement, value was estimated at 48,697 tons with Neuro-
genetic Optimizer to derive at sediment which differed from actual value with estimated 1,160 tons. Moreover,
regression model had given different sediment volume of actual measurement of 3,351 tons as illustrated in Table 4
and Figure 7.
Table 4. Sediment Volume 2005 Comparison between Actual Data, Regression Model,
and Neuro-genetic Optimizer
Months Sediment Volume (tons)
Actual Data Regression model Neuro-genetic Optimizer
April 12 9.8 3.9
May 549 479.0 460.9
June 86 83.6 85.5
July 222 229.7 226.9
August 41 40.4 40.1
September 25,896 23,747.0 26,168.8
October 5,621 5,529.5 5,554.5
November 14,581 13,306.5 15,450.9
December 878 1002.5 969.2
January 309 361.4 350.3
February 130 154.4 156.0
March 372 402.7 389.0
Annual Sediment Volume (tons) 48,697 45,346.4 49,855.9
Figure 7. Sediment Volume in 2005 Comparison between Actual Data, Regression Model and Neuro-genetic
Optimizer
Comparision of Sediment between Actual Data, Regression
Model and Neuro-genetic Optimizer
0
5,000
10,000
15,000
20,000
25,000
30,000
1 2 3 4 5 6 7 8 9 10 11 12
Month
Se
dim
en
t (t
on
s)
Actual Data
Regression model
Neuro-genetic Optimizer

Mohd Ekhwan et al: ASSESSMENT OF LAND USE CHANGE AND SEDIMENTATION MODELLING ON
ENVIRONMENTAL HEALTH IN TROPICAL RIVER
1346
Conclusion
Hydrologically, the occurrence of rainfall may influence the capacity of runoff and thus, the investigation of any
particular trend and seasonal pattern of runoff over the year is beneficial. Hence, the statistical temporal model
which incorporates time and potential predictors is essential to achieve the above objective. In particular, time series
model for runoff incorporated with potential influenced parameter such as rainfall could be appropriate. However,
in most of time series data, the occurrence of correlation is typically noticed. On that account, the determination of
the correlation structure of the residuals using the autocorrelation and partial autocorrelation functions may provide
a plausible description of the error structure of the model for runoff.
The results from satellite image interpretation showed that from 2002 to 2005, forest areas decreased approximately
36 %, which were converted to agricultural area. This land use change affects the sediment volume due to soil loss.
Neuro-genetic Optimizer model which was being employed predicted sediment volume off by approximately 1,160
tons.
Therefore, this study revealed that the Neuro-genetic Optimizer model provided forecast results for the Lam Phra
Phloeng reservoir closer to the actual sediment volume than the regression model. The index of efficiency for
Neuro-genetic Optimizer model was approximately 99 %, and the forecast did not require much data, which saved
time and expenses involved in the data collection process. It is concluded that the Neuro-genetic Optimizer model is
appropriate to be applied and facilitates the decision making process and further planning of reservoir management
in the dynamic ecosystem and land use change.
Acknowledgement
Special thanks are also directed to East Coast Environmental Research Institute (ESERI), Universiti Sultan Zainal
Abidin, Terengganu, Malaysia. Faculty of Environment and Resource Studies, Mahidol University. Nakhonpathom
73170, Thailand and Informatics and Space Technology Department Agency, Bangkok. Thailand in their
contributions.
References
1. Biswas, A. K., (1999). Management of international water: Opportunities and constraints. Journal of Water Res
ource Development. 15(4): 429-441.
2. Kamarudin, M. K. A., Toriman, M. E., Rosli, M. H., Juahir, H., Azid, A., Mohamed Zainuddin, S. F., Abdul A
ziz, N. A. and Sulaiman, W. N. A., (2014). Analysis of meander evolution studies on effect from land use and c
limate change at upstream reach of Pahang River, Malaysia. Mitigation and Adaptation Strategies for Global C
hange : 1- 10
3. Toriman, M. E., Gasim, M.B., Yusop, Z., Shahid, I., Mastura, S.A.S., Abdullah, P., Jaafar, M., Aziz, N.A.A., K
amarudin, M. K. A., Jaafar, O., Karim, O., Juahir, H. and Jami, N.R., (2012). Use of 137Cs
activity to investigat
e sediment movement and transport modeling in river coastal environment. American Journal of Environmental
Science 8: 417-423.
4. Jaafar. O., Toriman, M.E., Idris, M., Sharifah Mastura, S.A., Juahir, H., Abdul Aziz, N.A., Kamarudin, M.K.A.
and Jamil, N.R., (2010). Study of water level-discharge relationship using artificial neural network (ANN) in S
ungai Gumum, Tasik Chini, Pahang, Malaysia. Research Journal of Applied Sciences. 5(1): 20-26.
5. Jaafar, O., Toriman, M. E., Sharifah Mastura, S. A., Gazim, M. B., Lan, P. I., Abdullah, P., Kamarudin, M. K.
A. and Abdul Aziz, N.A., (2010). Modeling the impacts of ringlet reservoir on downstream hydraulic capacity
of Bertam River using XPSWMM in Cameron Highlands, Malaysia. Research Journal of Applied Sciences 5(2)
: 47-53.
6. Wischmeier, and Smith, D.D., (1978). Predicting Rainfall Erosion Losses; A Guide to conservation planning. A
griculture. Handbook No.537, USDA, Washington, DC, pp. 57.
7. Hickin, E.J., (1983). River Channel Changes: Retrospect and Prospect. In: River Channel Changes. Modern an
d Ancient. Fluvial System, Collinson, J.D. and J. Lewin (Eds.), Blackwell Scientific. London. pp: 61-83.
8. Parveen, R. and Kumar, U., (2012). Integrated approach of Universal Soil Loss Equation (USLE) and Geograph
ical Information System (GIS) for soil loss risk assessment in Upper South Koel Basin, Jharkhand. Journal of
Geographic Information System. 4: 588-596.
Malaysian Journal of Analytical Sciences, Vol 19 No 6 (2015): 1335 - 1347
1347
9. Ghosh, S. and Guchhait, S.K. (2012). Soil loss estimation through USLE and MMF methods in the lateritic ttra
cts of Eastern Plateau Fringe of Rajmahal Traps, India. Ethiopian Journal of Environmental Studies and Manag
ement. 5(4): 529 – 541.
10. Li H., Chen X., Kyoung J. L., Cai X. and Myung S. (2010). Assessment of soil erosion and sediment yield in Li
ao Watershed, Jiangxi Province, China, using USLE, GIS, and RS. Journal of Earth Science. 21(6): 941–953.
11. Zhang Q., Yuan L. and Andreas M. (2008). GIS-based approach for change and prediction of soil erosion. The
International Archives of the Photogrammetry, Remote Sensing and Spatial Information Science 36: 859 – 864.
12. Kim K.T., Kim, J.H., Park, J.S., Choi, Y.S., (2005). Analysis of soil erosion hazard zone in Farmland. proceedi
ngs.esri.com,http://proceedings.esri.com/library/userconf/proc05/papers/pap1834.pdf
13. Mutalib, S. N. Rahim, S. A., Juahir, H., Azid, A., Sharif, S.M., Latif, M.T., Aris, A.Z., Zain, S.M., and Domin
ick, D. (2013). Spatial and temporal air quality pattern recognition using environmetric techniques: A case stud
y in Malaysia. Environmental Science: Processes Impacts. 15: 1717-1728.
14. Azid, A., Juahir, H., Latif, M.T., Zain, S. M. and Osman, M. R. (2013). Feed-forward artificial neural network
model for air pollutant index prediction in the Southern Region of Peninsular Malaysia. Journal of Environmen
tal Protection 4(12A): 1-10.
15. Shukla, K. K., (2000). Neuro-genetic prediction of software development effort. Information and Software Tech
nology 42 (10): 701–713.
16. Toriman, M.E., Ata, F. M., Kamarudin M. K. A. and Idris, M. (2013). Bed-load sediment profile and effect of ri
ver bank erosion on river cross-section. American Journal Environmental Sciences 6: 292-300.
17. Lun P. I., Gasim, M. B., Toriman, M.E., Rahim, S. A., Kamarudin, M. K. A., (2011). Hydrological pattern of P
ahang river basin and their relation to flood historical event. e-BANGI. 4(1): 29-37.
18. Toriman, M. E., Lee Q. Y., Kamarudin, M. K. A., Aziz, N. A. A., Mokhtar, M., Elfithri, R. and Bhaktiku, K. (2
014). Applying Seasonal Climate Trends To Agricultural Production In Tanjung Karang, Malaysia. American J
ournal Agriculture Biological Sciences 9 (1): 119-126.
19. Kamarudin, M. K. A., Idris, M. and Toriman, M. E. (2013). Analysis of Leptobarbus hoevenii in control enviro
nment at natural lakes. American Journal Agriculture Biological Sciences 8: 142-148.
20. Gasim, M.B., Ismail, B.S., Sajaul Islam-Mir, Rahim, S.A. and Toriman, M.E., (2011). The physico-physical pr
operties of four soil series in Tasik Chini, Pahang Malaysia. Asean Journal of Earth Sciences. 1-10.
21. Kamarudin, M. K. A., Toriman, M. E., Sharifah Mastura, S. A., Idris, M., Jamil, N. R. and Gasim, M.B., (2009)
. Temporal variability on lowland river sediment properties and yield. American Journal of Environmental Scie
nces 5(5): 657-663.
22. Juahir, H., Sharifuddin, M. Z., Mazlin, M., Toriman, M. E., Jalaludin, Z. and Jan, I.K.M., (2008). The use of ch
emometrics analysis as a cost-effective tool in sustainable utilisation of water resources in the Langat River catc
hment, Malaysia. American-Eurasian Journal of Agriculture and Environmental Science 4(2): 258-265.
23. Gasim, M. B., Toriman, M. E., Rahim, S. A., Mir Sujaul Islam, Chek, T. C. and Juahir, H., (2006). Hydrology a
nd water quality assessment of Tasik Chini’s feeder rivers, Pahang Malaysia. Geografia 3 (3): 1-16.