Embed Size (px)
Citation preview

ASSESSMENT OF JUSTICE SECTOR INTEGRITY AND
CAPACITY IN TWO INDONESIAN PROVINCES
Technical assessment report
United Nations Vienna – Jakarta
March 2006
i

AKNOWLEDGEMENT
The following staff of UNODC and Moores Rowland Indonesia contributed to the preparation of this report. For UNODC Mr. Stuart Gilman Mr. Oliver Stolpe Mr. Fabrizio Sarrica Ms. Jouhaida Hanano For Moores Rowland Indonesia Mr. Rully Aprianto Mr. Ario Putro Ms. Fifi Satrif Sabang Ms. Niken Ariati Ms. Aida Ratna Zulaiha Ms. Nilay Sari
This publication has not been formally edited. The designations employed and the presentation of the material in this publication do not imply the expression of any opinion whatsoever on the part of the Secretariat of the United Nations concerning the legal status of any country, territory, city or area or of its authorities, or concerning the delimitation of its frontiers or boundaries. This publication has been made possible thanks to a contribution by the Government of Germany.
ii

TABLE OF CONTENT
FOREWORD BY THE CHIEF JUSTICE OF INDONESIA ....................................... 1 I. EXECUTIVE SUMMARY.................................................................................. 2 II. INTRODUCTION................................................................................................ 3 A. BACKGROUND/COUNTRY PROFILE............................................................ 3
1. South Sumatera ........................................................................................... 4 2. South East Sulawesi .................................................................................... 5
B. OBJECTIVES AND METHODOLOGY OF THE ASSESSMENT ................... 5 1. Objectives.................................................................................................... 5 2. Methodology ............................................................................................... 6
III. DATA DESCRIPTION........................................................................................ 8 A. ACCESS TO JUSTICE........................................................................................ 8
1. Access to Service ........................................................................................ 8 2. Access to Information ............................................................................... 11 3. Physical Access to the Courts ................................................................... 12 4. Affordability.............................................................................................. 13
B. TIMELINESS OF JUSTICE DELIVERY......................................................... 15 C. QUALITY OF JUSTICE DELIVERY .............................................................. 21
1. Alternative Dispute Resolution (ADR) ..................................................... 21 2. Competence and Predictability of the Justice System............................... 21 3. Quality of Services .................................................................................... 22 4. Record Management and Computerization............................................... 24 5. Performance Monitoring and Evaluation .................................................. 26
D. CORRUPTION IN THE JUSTICE SYSTEM................................................... 27 1. Perceptions of Corruption in the Justice System....................................... 27 2. Frequency and Nature of Corruption in the Justice System...................... 28 3. Frequency and Nature of Corruption among Judges................................. 30 4. Frequency and Nature of Corruption among Prosecutors......................... 31 5. Frequency and Nature of Corruption among Police.................................. 32 6. Frequency and Nature of Corruption among Court Staff.......................... 347. Amounts Paid for Bribery ......................................................................... 35 8. Code of Judicial Conduct .......................................................................... 36
E. PUBLIC TRUST IN THE JUSTICE SYSTEM................................................. 37 F. INDEPENDENCE, FAIRNESS AND IMPARTIALITY OF THE JUDICIARY40 G. RESPONDENTS’ PROFILE ............................................................................. 43
1. General Profile of the Respondents........................................................... 43 2. Legal Expertise of Court Practitioners ...................................................... 47 3. Working Hours of Court Practitioners ...................................................... 49 4. Charges against Prisoners Awaiting Trial................................................. 50
IV. BASELINE......................................................................................................... 51 V. DATA ANALYSIS ............................................................................................ 54 A. ACCESS TO JUSTICE...................................................................................... 54 B. TIMELINESS OF JUSTICE DELIVERY......................................................... 56 C. QUALITY OF JUSTICE DELIVERY .............................................................. 57 D. PUBLIC TRUST IN THE JUSTICE SYSTEM................................................. 58
iii

FOREWORD BY THE CHIEF JUSTICE OF INDONESIA
With great pleasure, I note the completion of this important study of the justice system in South Sumatera and South East Sulawesi, which was conducted by the United Nations Office on Drugs and Crime (UNODC) and Moores Rowland Indonesia. While in some respect, it draws a somewhat sobering picture of our courts – in particular as far as the extent and nature of corruption is concerned -, it provides us for the first time ever with a comprehensive assessment of the status quo of those institutions mandated under our constitution to uphold the rule of law. At the same time, there is reason for optimism, as our citizens and our business community mostly agreed, that the performance of our courts has improved over the last two years. This should encourage us in the judiciary together with our colleagues in the Attorney General’s Office, the Police, and the Department for Law and Human Rights, to use the assessment as the basis for further developing measures to strengthen the professionalism, effectiveness, integrity, accountability and transparency of our courts. As such the assessment provides an important tool for us to improve the services we deliver to our citizens and those who come to our country to invest and participate in our economy, to punish effectively those who violate our laws, and to protect the poor and weak. I look forward to further strive with you, my fellow judges, towards these goals. Chief Justice of The Supreme Court of The Republic of Indonesia (Ketua Mahkamah Agung Republik Indonesia)
Prof. Dr. Bagir Manan, S.H.,M.C.L.
1

I. EXECUTIVE SUMMARY This assessment was carried out within the overall framework of a joint project of the Government of Indonesia and the United Nation Office for Drugs and Crime (UNODC), and which aims at improving the integrity and capacity of the justice system, in particular of the judiciary. Within this context, the primary objective of the technical assessment was to arrive at a broad understanding of the state of integrity and capacity within the justice sector in the two pilot provinces South Sumatera and South East Sulawesi. For that purpose, the study explored the current levels of access to justice, the timeliness and quality of justice delivery, the independence and impartiality of the judiciary, as well as corruption and public trust in justice sector institutions in the two concerned provinces. The report presents statistics and data drawn from live interviews held with specific groups within the justice system, including judges, lawyers, court users, court staff and prisoners awaiting trial. A total of 2,485 respondents were asked a set of questions designed to ascertain their experiences and perceptions either as operators within the justice system or as the users of the courts. Drawing on and analysing the data, and paying particular attention to the reinforcing interdependencies of the various problems, the report presents key findings and identifies their root causes. Based on the key findings, detailed recommendations for judicial reform measures are presented in terms of increasing accessibility to the courts, making justice delivery more efficient, enhancing the public’s trust in the justice system, increasing the independence, fairness and impartiality of the judiciary and curbing corruption within the justice sector.
2

II. INTRODUCTION
A. BACKGROUND/COUNTRY PROFILE In 2005, the Indonesian population stood at 241,973,8791, with a growth rate of 1.51% during 2002 – 2003. The vast majority of the population remains concentrated on the island of Java, which with only 7% of Indonesia’s total land area is home to 59.2% of the population. The continued growth in population in Java has seen the population density rise from 843 inhabitants / km2 in 1990 to 997 / km2 in 2003. Based on key economic indicators from the International Monetary Fund (IMF)2, the macro-economic development in Indonesia has shown a significant increase. Gross Domestic Product (GDP) growth (based on the annual change in percentage) rose from 3.7% in 2002 to 4.1% in 2003, and is forecasted by the IMF to rise to 5%, due to an increase in domestic consumption. Despite the economic growth, foreign investment is lacking. According to the Asian Development Bank3 in 2003 foreign direct investment (FDI) in Indonesia was the worst in Asia. In 2003, the net FDI continued to slide by US $ 2.1 billion after falling by US $ 7.1 billion in 2002. Clearly the investment climate in Indonesia continues to be not conducive. In a recent study, the World Bank4 has highlighted the main factors that are responsible for the low interest of investors to develop business in Indonesia. These include the following:
Chart 2-1 Deciding factor for the low interest in business in Indonesia
48.2
18.922.3
2324.7
29.541.5
Productivity
I
Law EnforceTax L
C
aw/Regulation The uncertainty of L
orruption
evelment
Financial
nfrastructure
and Skill of Employees
%
0 5 10 15 20 25 30 35 40 45 50
In view of the highly negative impact of corruption on economic growth, President Susilo Bambang Yudhoyono launched a variety of programs and measures to combat corruption, which are to be implemented within the first 100 days of his Government in office. These include:
1 Estimated Population at July 2005, CIA “The World Fact book”. 2 Hwww.imf.org/external/2004H3 Asian Development Outlook 2004 4 World Bank Survey of 713 Business people in Indonesia, 2004
3

a. The Attorney General will re-open corruption cases that have been previously closed. b. A Presidential Instruction to Governors was issued to provide examples of officers who
are clean and free from corruption, collusion and nepotism. Officers involved in corruption collusion and nepotism (KKN) must be punished.
c. The Justice and Human Rights Minister will relocate those convicted of corruption to the Batu Prison on the geographically isolated island of Nusa Kambangan, Central Java.
d. The Attorney General will establish ad hoc anti-corruption courts. e. A supervisory commission for prosecutors will be created. f. A National Action Plan for the eradication of corruption will be developed under the
coordination of the Minister of Foreign Affairs. Within this context, the President authorized investigations against 12 Heads of Municipalities, 7 Members of the House of Representatives, 3 Governors, and 3 Mayors.
1. South Sumatera With a total area of 97,159.32 km2, the province of South Sumatera is situated in the central-western part of the country.
The administrative region of South Sumatera encompasses 7 districts (Ogan Komering Ulu, Ogan Komering Ilir, Muara Enim, Lahat, Musi Rawas, Musi Banyuasih and Banyuasih) and 4 cities (Palembang, Prabumulih, Pagaralam and Lubuk Linggau). The National Socio-Economic Survey (SUSENAS) of 2003 recorded a total population of 7.1 million inhabitants. In the same year, the percentage of poor people in South Sumatera was 21.5%, and the unemployment level doubled from 4.45% in 2002 to 8.97%. The economy of the province is dominated by the contributions of four sectors: mining and quarrying (mainly oil activities) 32.68%; industrial sector 18.80%; agricultural sector 15.84%, and the trade sector 15.29%.
4

2. South East Sulawesi With a total area of some 110,000 km2, the province of South East Sulawesi is situated in the centre of the country.
Only 38,140 km2 of the province are covered by land. The province’s area consists of many islands separated by the ocean. Administratively, the province of South East Sulawesi consists of 2 municipalities (City of Kendari and City of Bau Bau) and 7 districts: Konawe, Kolaka, North Kolaka, Konawe, South Konawe, Bombana, Wakatobi, Buto and Muna. In 2003 the total population had increased from 1.82 million to 1.92 million with 29.3% living under the poverty rate, and 10.17%, being unemployed. The economic development of the province is still largely dependent on the agricultural sector (47.71% of the GDP in 2000), followed by the service sector which accounts for 15.92% of the economy, and the construction sector and trade sector which account for 12.86% and 10.91% respectively. B. OBJECTIVES AND METHODOLOGY OF THE ASSESSMENT A few empirical studies have been carried out on the justice system in general and about its integrity and capacity in particular. Generally there is insufficient concrete data on the specific nature, extent and locations of corruption as well as on other weaknesses of the courts that would guide meaningful policy formulation and implementation. One of the main objectives of the Judicial Integrity and Capacity Project therefore was to bridge this gap by conducting an assessment to determine the current status of integrity and capacity if the justice system in two provinces of Indonesia.
1. Objectives The main thrust and objectives of this assessment were to gain full understanding of the levels of integrity and capacity of the various justice sector institutions in the two Indonesian provinces of South Sumatera and South East Sulawesi.
5

More specifically, the study assessed: • Access to justice • Timeliness of justice delivery • Quality of justice delivery • Independence, impartiality and fairness of the judiciary • Public’s trust in the judiciary • Corruption within the justice sector.
2. Methodology The research activities conducted in order to assess the capacity and integrity of the justice sector in two Indonesian provinces included a desk research and field surveys. The desk research was carried out to provide background information regarding the socio-economic conditions of the country and in the two provinces, as well as available information on the functioning of the national and local justice sector. The information has been collected from different open sources, and through interviews with experts on the Indonesian judicial system. Field surveys were conducted in the two provinces of South Sumatera and South East Sulawesi during the month of August 2004. The field surveys were conducted with the help of questionnaires for judges, prosecutors, court staff, lawyers, businesses and court users. The questionnaires used both multiple-choice and open-ended questions. The samples were selected using a combination of simple random sampling and stratified random sampling. Based on the random sampling method, the total sample of 2,485 persons was selected among the various categories of the justice sector stakeholders:
Table 2-1 Type and number of respondents
Location Types of Respondents Amount (pax) 1. Judges 60 2. Prosecutors 60 3. Lawyers 136 4. Court Staff 218 5. Court Users 307 6. Business people 328
South Sumatera
7. Prisoners Awaiting Trial 358 Total Respondents 1467
1. Judges 39 2. Prosecutors 38 3. Lawyers 61 4. Court Staff 137 5. Court Users 211 6. Business people 249
South-East Sulawesi
7. Prisoners Awaiting Trial 283 Total Respondents 1018
6
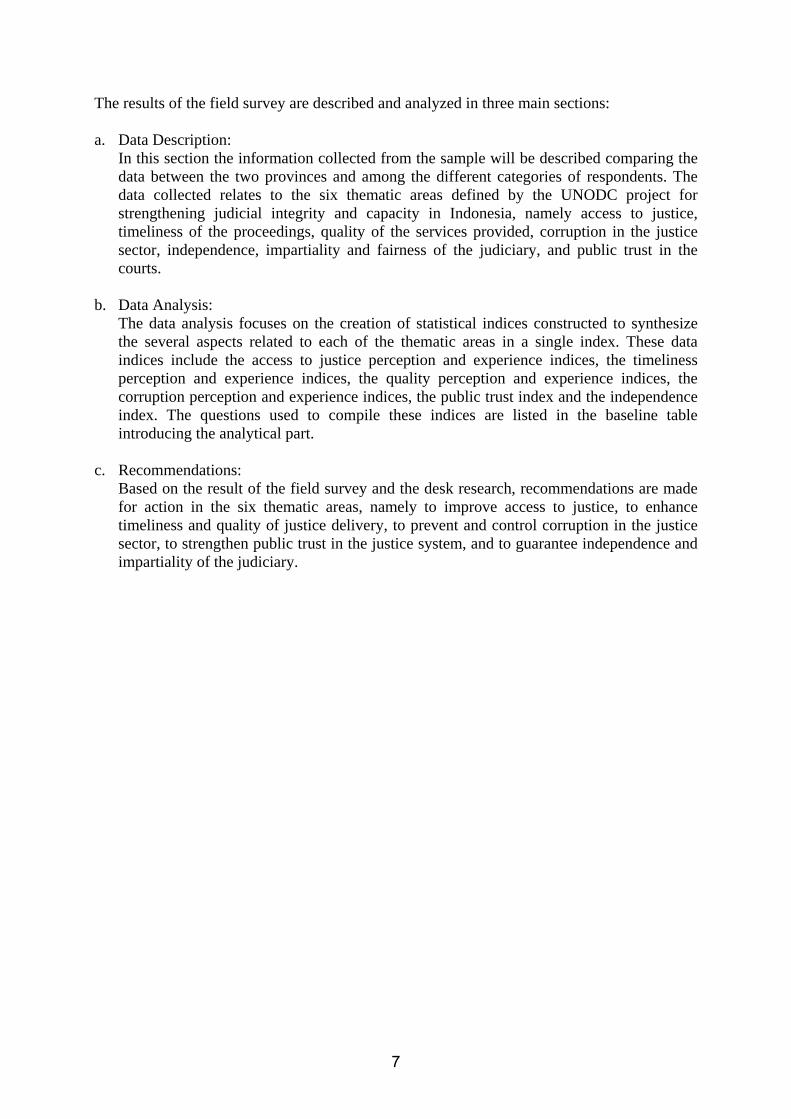
The results of the field survey are described and analyzed in three main sections: a. Data Description:
In this section the information collected from the sample will be described comparing the data between the two provinces and among the different categories of respondents. The data collected relates to the six thematic areas defined by the UNODC project for strengthening judicial integrity and capacity in Indonesia, namely access to justice, timeliness of the proceedings, quality of the services provided, corruption in the justice sector, independence, impartiality and fairness of the judiciary, and public trust in the courts.
b. Data Analysis: The data analysis focuses on the creation of statistical indices constructed to synthesize the several aspects related to each of the thematic areas in a single index. These data indices include the access to justice perception and experience indices, the timeliness perception and experience indices, the quality perception and experience indices, the corruption perception and experience indices, the public trust index and the independence index. The questions used to compile these indices are listed in the baseline table introducing the analytical part.
c. Recommendations: Based on the result of the field survey and the desk research, recommendations are made for action in the six thematic areas, namely to improve access to justice, to enhance timeliness and quality of justice delivery, to prevent and control corruption in the justice sector, to strengthen public trust in the justice system, and to guarantee independence and impartiality of the judiciary.
7

III. DATA DESCRIPTION
A. ACCESS TO JUSTICE Access to justice describes the ease with which the courts are used by the public for their institutional purposes. More specifically, it encompasses aspects, such as access to information, physical accessibility of the premises and the affordability of the courts to the average citizen.
1. Access to Service Under access to service, two aspects were examined: the difficulties encountered by citizens when reporting a crime to the police and the accessibility of lawyers for prisoners awaiting trial. Both results differ according to the level of education and income of the respondents.
In South Sumatera, 50% of the court users sustained that it had been “easy” or “very easy” to report a case to the police, whereas 29% had faced difficulties. In South East Sulawesi, less than 40% found it easy or very easy to report a crime, while almost 15% evaluated the reporting process as “very difficult”.
On average on a scale 1 to 5, it appears that the reporting of crimes is significantly more difficult in South East Sulawesi than it is in South Sumatera.
Chart 3-1
If you had experience with the police, how difficult was it to report your case to the police? (Average on 1-5 scale, by gender, Cu 13)
Very Easy 1 2 3 4 5
South EastSulawesi
South Sumatera
Female
Very Difficult
South SumateraSouth East Sulawesi
3,32,5Male
3,2,72
Every suspect has a right to the services of a lawyer. Nevertheless in both pilot provinces, less than 30% of the prisoners used the services of a lawyer (26% in South Sumatera, 22% in South East Sulawesi). The reason for this is a general lack of information and knowledge about the free services of lawyers which are provided by the government to suspects who cannot afford to pay lawyers’ fees.
8
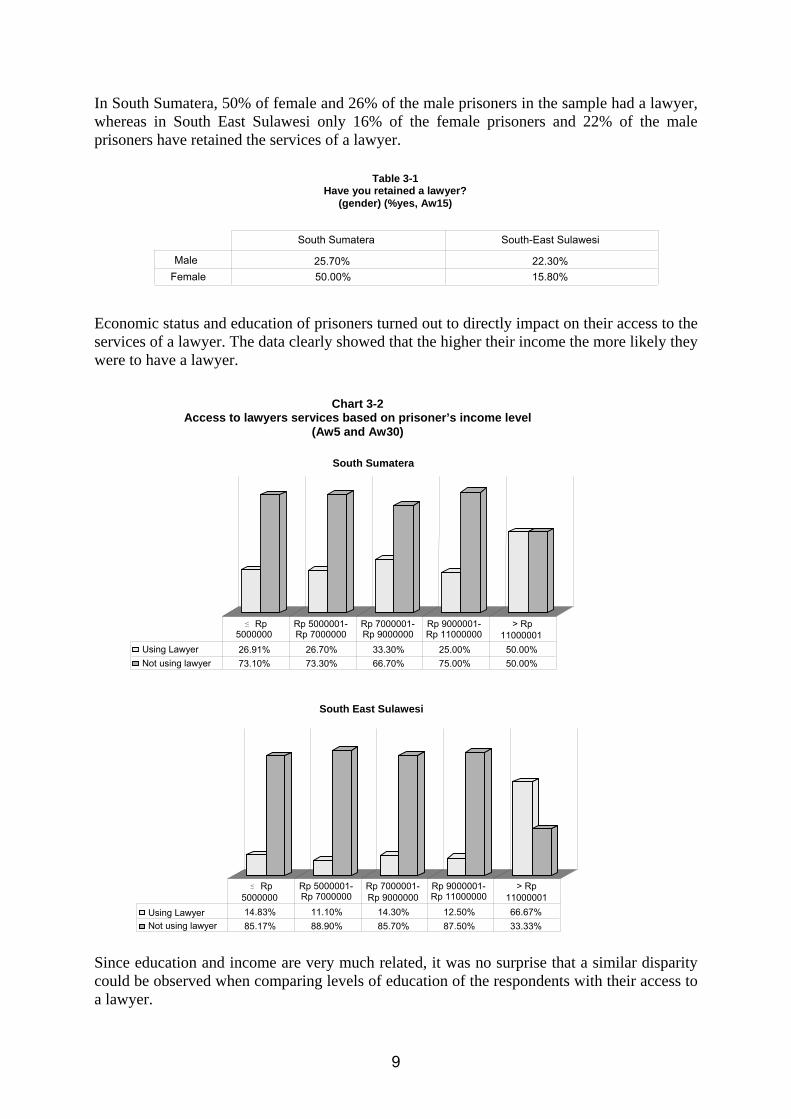
In South Sumatera, 50% of female and 26% of the male prisoners in the sample had a lawyer, whereas in South East Sulawesi only 16% of the female prisoners and 22% of the male prisoners have retained the services of a lawyer. Table 3-1
Have you retained a lawyer? (gender) (%yes, Aw15)
Female 50.00% 15.80% Male 25.70% 22.30%
South Sumatera ulawesiSouth-East S Economic status and education of prisoners turned out to directly impact on their access to the services of a lawyer. The data clearly showed that the higher their income the more likely they were to have a lawyer.
Chart 3-2 Access to lawyers services based on prisoner’s income level
(Aw5 and Aw30) South Sumatera
Using Lawyer 26.91% 26.70% 33.30% 25.00% 50.00%Not using lawyer 73.10% 73.30% 66.70% 75.00% 50.00%
≤ Rp p
wyeNot using la r 85.17% 88.90% 85.70% 87.50% 33.33%
South East Sulawesi
≤ Rp 000001-00
000001-0
000001-00
p> R11000001
Rp 910000Rp 1
Rp 7900000Rp
Rp 570000Rp 5000000
Using Lawyer 6.67%612.50%14.30%11.10%14.83%
> R11000001
Rp 9000001-Rp 11000000
Rp 7000001-Rp 9000000
Rp 5000001-Rp 70000005000000
Since education and income are very much related, it was no surprise that a similar disparity could be observed when comparing levels of education of the respondents with their access to a lawyer.
9

Chart 3-3 Access to lawyer’s services based on the prisoner’s education level
(Aw5 and Aw28)
Not using lawyer 86.70% 9 70%0. 82.80% 30.30%
South East Sulawesi
Illiterate Elementary chool
wyeNot using la r 67.70% 75.30% 73.10% 36.40%
S1/S2Elementary chool
umateraSouth S
High SSchool
Illiterate
63.64%26.90%24.70%32.30%wyerUsing La
S1/S2High SSchool
72.90%17.20%9.30%13.30%Using Lawyer
For prisoners who did use a lawyer’s services, the respective fees were normally paid by family or friends. Other sources for paying the lawyer included the prisoners themselves, the government/public service, the social or religious community, or the lawyer offered his or her services pro bono. The latter is rather frequent in South Sumatera, where almost a third of the prisoners receive pro bono services by lawyers, while in South East Sulawesi this practice is less common. Chart 3-4
Who pays your lawyer's fees? (Aw6)
Prisoners themselves 11.80% 29.00%Friend/family 47.40% 48.40%Government/Public service 10.50% 12.90%Free (Volunteer service of lawyer) 28.90% 9.70%
company)
umatera ulawesiSouth East SSouth S
0.00%1.30%Others (
10

2. Access to Information Another essential component of access to justice includes whether prisoners are aware of and have been given the possibility to apply for bail. When asked about their knowledge about the bail system, it turned out that only 37.1% of the prisoners awaiting trial in South Sumatera and 29.3% of those in South East Sulawesi were aware of the possibility to apply for bail, and only 27.2% and 24% respectively knew about the general conditions under which bail could be granted. Chart 3-5
Information about bail: 1. Are you aware of the possibility of applying for bail? (Aw7)
2. Are you aware of general conditions under which bail might be granted? (Aw8)
27.20% 72.80%
Know Don’t Know Know Don’t Know General conditions under which
bail might be granted
37.10% South Sumatera 62.90%
76%24%70.70%29.30% South-East Sulawesi
Possibility of applying for bail
When prisoners had knowledge about the possibility to apply for bail, they normally had received such information from their lawyer, family or friends, the prison staff, or they had been aware of it before their arrest. In South Sumatera, most of the prisoners knew already about the bail prior to their arrest, while in South East Sulawesi, they mostly had learned about it from their family, friends or lawyer.
Moreover, it appears that South East Sulawesi prosecutors play an important role as a source of information, while in South Sumatera many prisoners had learned about bail from prison staff.
Chart 3-6From whom did you receive information on bail? (Aw9)
34.80% 17.90%
Court Staff 4.30% 4.50%Prison Staff 19.60% 9.00%Family/friend 19.60% 25.40%Judge 4.30% 1.50%Prosecutor 2.20% 10.40%Police 6.50% 4.50%Lawyer 8.70% 26.90%
South Sumatera ulawesi
hemselvesPrisoner t
South East S
When comparing the answers of the respondents in the two provinces, it is worthwhile noticing that between the two provinces, court users in South Sumatera seem to have easier access to general information concerning their cases.
11

Chart 3-7
How difficult it was to have information regarding your current case? (Average on 1-5 scale, Cu12)
3,18
2,49
Court Users in Southula esi
outhSumatera
Court Users in S
East S w
Very Difficult1 2 Very Easy 3 4 5 In comparison for lawyers and prosecutors it appears to be slightly easier to obtain information in the courts in South East Sulawesi.
Chart 3-8Normally, how difficult is it to obtain information on the status of the case from
the court? (Average on 1-5 scale, Pr18 and Lw18)
2,88
3,26
2,98
2,87
1 2 3 4 5
Lawyers
Prosecutors South SumateraSouth East Sulawesi Very Easy Very Difficult
3. Physical Access to the Courts The physical accessibility of the courts is an important factor for court users when deciding whether to use the formal justice system. When asked how long it took them the reach the court, most respondents indicated that it had taken them less than three hours, since most regencies in the provinces have their own court. Still 5% of the lawyers reported that their clients would travel for more than twelve hours to reach the court.
12

Chart 3-9
1. How long does it take for you to reach the court? (c9) 2. How long does it take for your clients, normally, to reach the court? (p6 & j6)
South Sumatera
Prosecutors
> 12 hours6 hours-12 hours
3 hours-6 hours < 3 hours
Court Users 95.10% 4.60% 0.30%
Lawyer 63% 25.20% 6.70% 5.20%
2.10%2.10%31.90%63.80%
South-East Sulawesi
28.90%68.40% 2.60%Prosecutors
3 hours-6 hours
> 12 hours6 hours-12 hours
< 3 hours
Court Users 89.60% 3.30% 2.80% 4.30%
Lawyers 77% 4.90%3.30%14.80%
4. Affordability Costs incurred by the court users in relation to their case include transportation and court fees. Transportation costs are usually relatively small. In South Sumatera, 60% of the respondents paid between Rp 5,000 and Rp 20,000 for transportation, while in South East Sulawesi, 46% of the respondents spent even less than Rp. 5,000.
Chart 3-10 How much did you pay for each trip? (Cu7)
29.97% 30.94%
8.47%1.95% 0.30% 1.37%
27.00%
Rp 50,001 - Rp 65,000
Rp 20,001 - Rp 35,000
Rp 35,001 - Rp 50,000
Rp 65,001 - Rp 80,000
> Rp 80,000
No Answer
Sout terah Suma
≤ Rp 5,000
Rp 5,001 - Rp 20,000
13

South-East Sulawesi
46.44%
23.70%
2.84%1.42%
0.95%5.69%3.32%15.64%
Rp 5,001 - Rp 20,000
No Answer> Rp 80,000Rp 65,001 - Rp 80,000
Rp 50,001 - Rp 65,000Rp 35,001 - Rp 50,000
Rp 20,001 - Rp 35,000≤ Rp 5,000 Lawyers and prosecutors were asked about average court fees according to the type of proceeding. Lawyers in South Sumatera reported that court fees generally range from around Rp 100,000 to Rp 1,000,000 per case. In South East Sulawesi, average court fees appear to be higher, and range from Rp 100,000 to Rp 5,000,000, with criminal and property cases incurring the highest cost. As it turned out, for any type of proceeding the courts in South East Sulawesi are more expensive than those in South Sumatera.
How much do your clients, normally paycontract, tort, family cases, tenancy, l
South Sumatera Property Contra
< Rp 5000 0,00% 0,00Rp 5000- 100.000 0,00% 0,00Rp 100.001- 1.000.000 36,79% 30,88Rp 1.000.001-5.000.000 10,29% 13,97Rp5.000.001-10.000.000 4,41% 2,21>Rp 10.000.000 4,41% 2,94
South-East Sulawesi Property Contra
< Rp 5000 0,00% 0,0Rp 5000- 100.000 1,64% 0,0Rp 100.001- 1.000.000 20,01% 18,0Rp 1.000.001-5.000.000 40,26% 42,6Rp 5.000.001-10.000.000 12,10% 14,7>Rp 10.000.000 6,36% 4,9 Thus, it does not come as a surprise tperceive the justice system as less afford
Table 3-2 as court fees for criminal case, land/property case, abour cases? (Pr8,Pr9, Pr10,Pr11,Pr12,Pr13,Pr14)
ct Tort Family Cases Tenancy Labour Cases
% 0,00% 0,73% 0,00% 0,74%% 0,00% 0,00% 0,00% 0,00%% 30,81% 25,72% 28,68% 23,52%% 15,44% 8,10% 11,03% 9,56%% 2,94% 2,21% 2,94% 0,74%% 2,21% 0,74% 1,47% 0,74%
ct Tort Family Cases Tenancy Labour Cases
0% 0,00% 0,00% 0,00% 0,00%0% 6,56% 6,56% 4,92% 0,00%3% 18,03% 31,19% 27,87% 8,20%2% 32,79% 27,87% 29,50% 29,50%5% 14,72% 3,28% 4,91% 3,28%0% 3,30% 0,00% 0,00% 4,92%
hat respondents in South East Sulawesi in general able than their counterparts in South Sumatera.
14

Chart 3-11Do you believe your country’s justice system to be affordable? Today and 2 years ago (Cu10, Cu11,
South S
The opinions on the affordability did not vary much when comparing the current situation with the one of 2 years before.
B. TIMELINESS OF JUSTICE DELIVERY Timeliness is defined as the average length required by courts to carry out the proceedings and to dispose of cases. Perceptions as to whether delays occur or not in the court process differ across various types of respondents. The following diagram shows that court users and lawyers have different perceptions compared to prosecutors and judges. All respondents agreed that conditions today are slightly better than they were 2 years ago.
Always
Always Never
u atera
sers
eople
m
Business P
2 years ago Today
1 2 3 4 5
Court U
South-East Sulawesi
1 Never
Business People
2 years ago Today
Court Users
2 3 4 5
15

Chart 3-12
According to your experience, do you consider the courts quick? today and 2 years ago (Average on 1-5 scale, Jd27,Jd28,Pr33,Pr34,Lw33,Lw34,Cu18,Cu19)
South Sumatera
Always
2,582,73
22,16
,14
33,31
,33
3,843,98
1 2 3 4Two Years Ago TodayNever
ulawesiSouth-East S
5
Judges
Prosecutors
Lawyers
Court Users
3,623,47
2,952,84
2,852,72
2,592,57
Judges Prosecutors Lawyers Court Users 1 2 3 4
TodayTwo Years Ago5
Always Never
However, the average time it takes to resolve a case is relatively swift, in particular compared to other countries.
Table 3-3According to your experience, how long on average criminal, commercial, labour, family and other civil
cases take? (Average, Jd17,Jd19,Jd21,Jd23,Jd25, Pr23,Pr25,Pr27,Pr29,Pr31, Lw23,Lw25,Lw27,Lw29,Lw31)
South Sumatera
Case Time
Resolving
Criminal < 6 months
Commerce 6 - 12 mo
Labour 6 - 12 mo
Family < 6 mo
Other Civil 6 - 12 mo
South East Sulawesi
Case Time
Resolving
Criminal < 6 mo
Commerce < 6 mo
Labour < 6 mo
Family < 6 mo
Other Civil 6 - 12 mo Nevertheless, most of the respondents had experienced delays at some point of the procedure.
16

Chart 3-13
Have you ever experienced undue delay at any of the stages of the court proceedings? (Jd13, Pr19, Lw19)
Yes
South Sumatera
9
Lawye
9.3 93.2 55.8
r Judge Prosecutor
Sou esith East Sulaw
Yes 78.7 61.5 50.0
Lawyer
% (percent)
percent)% (
ProsecutorJudge
In order to tackle the problem of delays, it is necessary to identify at which stage delays most often occur. To obtain more complete information, respondents were therefore asked at which stage of the court proceedings they had experienced delays.
17

Chart 3-14.1 If delays were experienced, at which stage of the court proceedings?
(% of respondents)(Jd14,Pr20,Lw20)
7.3
41.8
9.1 9.1 7.3
Service of summons on witnessInstitution of proceedingsTrial proceedingsIssue of summons on defendantTransmission of court record to appeal court
South Sumatera: Judges
32.7
23.618.2
5.5 5.5
Service of summons on witnessObtaining copy of judgmentTrial proceedingsDiscovery of documentsIssue of summons on witness
rosecutors
South Sumatera: Lawyers
5.7 4.16.5
13.8
22.8
South Sumatera: P
Trial proceedingsExecution of judgmentObtaining certified copy of proceedingsTransmission of court record to appeal courtInstitution of proceedings
In South Sumatera and South East Sulawesi, lawyers, judges and prosecutors experienced delays mainly with regard to the servicing of summons on witnesses followed by undue delays in obtaining a copy of the judgment and during the trial proceeding5.
5 This question was proposed to the respondents as open ended, as a consequence some stages of the proceedings were indicated less frequently. For judges: Services of summons on defendants, interrogatories, issue of summons on witnesses, commencement of trial, delivery of judgement, obtaining certified copies of proceedings, execution of judgement, discovery of documents, implementation of bail and obtaining certified copies of judgement. For prosecutors: Services of summons on defendant, interrogatories, commencement of the trial, delivery of the judgement, obtaining certified copies of judgement, execution of the judgement, issue of summons on defendant, implementation of bail order and transmission of court records. For lawyers: Services of summons, interrogatories, issue of summons on witnesses, delivery of the judgement, issue of summons on
18
Chart 3-14.2 If delays were experienced, at which stage of the court proceedings? (% of respondents) (Jd14,Pr20,Lw20)
South East Sulawesi: Judges 29.2 16.7
8.3 8.3 8.3
Trial proceedings
Service of summons on witnessInstitution of proceedings
Issue of summons on defendantService of summons on defendant
South East Sulawesi: Prosecutors
29.7
21.6 18.9
8.1 5.4
Obtaining copy of judgmentService of summons on witnessTrial proceedingsIssue of summons on witnessDiscovery of documents
6.78.3 8.3
18.3
30
awyersSouth East Sulawesi: L
Execution of judgmentDelivery of judgmentTrial proceedingsObtaining copy of judgmentInterrogatories
When asked to identify the causes for such delays, most respondents indicated the cumbersome court process as the main contributing factor. Other shortcomings causing delays in South East Sulawesi included a lack of human resources, weak management and unmotivated staff. In South Sumatera respondents indicated unmotivated staff, lack of human resources and corruption as additional factors causing undue delays. defendants, discovery of documents, implementation of bail order, services of summons on witnesses, obtaining certified copies of the judgement.
19

Chart 3-15
If you have experienced delays to which of the following reasons would you attribute any such delay to? (Jd15, Pr21,Lw21)
South Sumatera
LawyerWeak management 11.5 4.6
Prosecutor15.0
Judge
Corruption 15.5 10.8 2.8Lack of Human Resources 11.0 7.7 29.9Cumbersome process 22.0 36.9 36.4Unmotivated staff 14.0 21.5 14.0
1.918.5All the above 26.0
All the above 15.9 3.6 0.0
South East Sulawesi
Weak management 20.5Lawyer
16.1Prosecutor
14.3Judge
Corruption 10.2 7.1 2.4Lack of Human Resources 15.9 23.2 35.7Cumbersome process 23.9 28.6 35.7Unmotivated staff 13.6 21.4 11.9
In addition, judges were asked about the factors that in their experience create work and require time. In South Sumatera judges indicated the overall complexity of the case as most relevant in this context, while their colleagues in South East Sulawesi felt that difficulties in the relations between parties and lawyers constituted the biggest obstacle to the swift disposition of cases. Chart 3-16
When you work on a case, what are the main issues that create work and require time? Please evaluate the seriousness of the potential obstacles listed below
(Average on 1-5 scale, Jd7, Jd8, Jd9, Jd10, Jd11, Jd12)
2.08
2.4
2.5
3.073
2.79
2 2.4
2.482.62
2.46
2.07
1.5
Lack of availabili criminal rty of
Inconsistency of l
ecords
aws
ase)
ase
ttorneys
Overall complexity of c
Difficulty of discovery (material to support c
Difficulty in relations between parties and/or a
Others
1 2 3 4 5
Very minor Very major Level of Obstacles
South Sumatera South East Sulawesi
20

C. QUALITY OF JUSTICE DELIVERY Quality of justice delivery is intended as the ability of the courts to carry out their institutional functions, including the ability to solve disputes, to uphold the rule of law and to support the economy.
1. Alternative Dispute Resolution (ADR) In both provinces ADR is used fairly frequently, in particular through mediation. In South Sumatera, 64% of the judges confirmed the use of ADR methods, restorative justice and other less formal mechanism of justice delivery. Among the judges who confirmed the use of ADR methods, 84% indicated mediation as the most frequently used methods. In South East Sulawesi 74% confirmed the use of ADR methods, of which 77% indicated mediation as the most frequently used method. This result was confirmed by lawyers and by prosecutors.
2. Competence and predictability of the Justice System In both provinces, judges and to a lesser degree prosecutors, strongly agree with the statement that the judiciary effectively and efficiently supports a modern economy and the private sector. Lawyers were less positive in their assessment, especially in the province of South Sumatera. Chart 3-17
The justice system effectively and efficiently supports a modern economy and the private sector (1-strongly disagree, 5-strongly agree, Jd35,Pr41,Lw41)
LawyersProsecutors
Scale
3.33
2.79
1 2
South Sumatera
ulawesiSouth East S
Judges
3.74
3.76
4.1
4.02
3 4 5 Moreover, business people were asked about their opinions concerning the competence of the justice system. In particular in South East Sulawesi, business people turned out to be rather negative in their assessment. Chart 3-18
Do you believe your country's justice system to be competent today and two years ago? (Average on 1-5 scale, bz34, bz35)
Never Always
2.85
22.38
.42
2.7
1 2 3 4 5
South EastSulawesi
Scale
South Sumatera
2 Years AgoToday
21

Consistency and predictability of the law and its application are of great importance for economic development. This assessment, therefore explored the business community’s views in this regard. The result suggests a disturbing lack of consistent application of law. Business people in both provinces agreed that laws and regulations as well as their interpretation by the courts were rather inconsistent. Chart 3-19
In general, laws, regulations, and their interpretation by courts, are: (% of respondents, bz60)
0.40 3.10 5.26 14.86
39.0135.22
29.9634.06
29.15
8.98
Very consistent
Very inconsistent 8.98 29.15 Somewhat inconsistent 34.06 29.96 Neither inconsistent nor consistent 39.01 35.22 Somewhat consistent 14.86 5.26
3.10 0.40
South Sumatera South East Sulawesi Moreover in South East Sulawesi, they found it very difficult to predict changes of laws and regulations that were likely to affect their businesses. Chart 3-20
Changes in laws and regulations affecting your business are: (% of respondents, bz61)
2.19 0.40
South East Sulawesi South Sumatera Completely unpredictable Fairly unpredictable 35.94 28.34Neither unpredictable nor predictable Fairly predictable Completely predictable
4.4513.1327.1332.81
15.94 39.68
3. Quality of Services The assessment further investigated the opinions of judges, prosecutors, lawyers, court users and business people on the quality of the services provided by justice sector professionals, including judges, prosecutors, police, court staff and enforcement officials. In both provinces, the judges, prosecutors and lawyers rate themselves as those providing the best services, followed by court staff and enforcement officials. However, court users and business people evidenced quite different views.
22
In South Sumatera, they considered court staff and enforcement officials as those who performed better services than other professional categories, while in South East Sulawesi, lawyers were deemed the best service-providers. In both provinces, police and prosecutors were pointed out as those providing the worst services. Business people essentially confirmed the views expressed by court users.
Chart 3-21 Please evaluate the quality of services provided by the following justice sector professionals
(1-very poor; 5-very good) Respondents: Court Users (cu32-cu37)
ast
Enforcement OfficialsCourt StaffPoliceLawyerProsecutorsJudges
South ESulawesi
SouthSumatera
33.38
.41
3.3.21
20
2.31
2.44
3.24
3.69
3.002.75
22.46
.54
1.00 2.00 3.00 4.00 5.00
Respondents: Business people (Bz48-Bz53)
Sulawesi
S ateraum2 1.82.8
22.2
.27
43.06
22.45
2.73.99
2.03
22.92
2.2.52
53
South
astSouth E
Enforcement OfficialsCourt StaffPoliceLawyerProsecutorsJudges
1.00 2.00 3.00 4.00 5.00 Moreover, court users were asked about their experiences concerning the reporting of crimes to the police, in particular about their level of satisfaction with the attention given by the police to the reported incident. It turned out that more than 45% of the court users in South Sumatera and almost 50% of the court users in South East Sulawesi were rather unsatisfied or very unsatisfied with the police. Chart 3-22
To what extent were you satisfied with the overall attention given to the matter by the police? (% of respondents, Cu29)
Very satisfied 1.35 4.55
South East Sulawesi South Sumatera
37.84 18.18 satisfied
Very unsatisfied 2.70 40.91 Somewhat unsatisfied 45.95 18.18 Neither unsatisfied nor satisfied 12.16 18.18
23

Court users were also asked to evaluate the protection they received by the police against further harassment by the offender. Here opinions differed significantly. In South Sumatera 46% evaluated the protection received as very good or somewhat good, while only 30% were not satisfied. In South East Sulawesi only 35% were content with the level of protection received, while more than 40% found the protection by the police somewhat or even very poor. Chart 3-23
How good or bad was the protection from further potential harassment by the offender? (% of respondents, Cu31)
Ver goy od 30.00 7.58
South Sumatera ulawesi South East S
16.00 27.27Somewhat good24.2424.00Neither poor nor good10.6129.00Somewhat poor
0.3031.00oorVery p
4. Record management and Computerization The assessment further explored the quality of record management and the level of computerization as objective indicators for the overall quality of the court administration. Judges in both provinces confirmed that their courts kept records for the last five years. However, while 74% of the judges in South Sumatera considered the retrieval of information from such records as very or somewhat easy, in South East Sulawesi only 40% shared that view, with 12.8% considering data retrieval as very difficult.
Chart 3-24 How difficult was it to obtain information from those records? (% of respondents, Jd53)
0
South-East Sulawesi South Sumatera
Somewhat easy 34.48 20.51 Very easy 39.66 20.51
Somewhat difficult 5.17 10.26
Neither difficult nor easy 20.69 35.90
12.82 Very difficult
20.51
39.66
20.51
34.48 35.90
20.69
10.265.17
12.82
In general, 80% of the judges in South Sumatera evaluated the existing record keeping system as effective, while in South East Sulawesi only 59% were of that opinion.
24

Chart 3-25 In general, how effective is record-keeping at your organization?
(% of respondents Jd54)
Very effective
South East Sulawesi South Sumatera
17.95 38.98
41.03 40.68Somewhat effective
20.51 10.17Neither ineffective nor effective
12.82 6.78Somewhat ineffective
7.69 3.39Very ineffective
The level of computerization of the judiciary in the two provinces appears to be fair, with 71% of the judges in South Sumatera and 62% of the judges in South East Sulawesi indicating that they have been provided with computers. Moreover, in both provinces around 80% of the interviewed judges confirmed that their courts have been equipped with computer-based case-management system. The absolute majority of judges in both provinces confirmed that this computer-based system had proven to be very or somewhat effective.
Chart 3-26How useful is the computer system in improving the management of cases?
(% of respondents Jd46)
South SumateraNot effective at all 5.1
South East Sulawesi
Not very effective Neither effective or ineffective 7.7
0
Somewhat effective 33.9
000
17.9 69.2 66.1Very effective
Judges were also asked whether there were guidelines, policy instructions or regulation on personnel and budget related matters, and whether they had been formalized in writing. With regard to both the majority of judges confirmed that such guidelines and instructions existed and were often or always published in writing. However, between 15-20% of the judges in South East Sulawesi claimed that such guidelines and instructions were never or seldom published in writing.
25

Chart 3-27 In your organization, to what extent are guidelines/policies/regulations on personnel and budget
management formalized in writing? (% of respondents Jd47 and Jd48) Personnel Management South Sumatera South-East Sulawesi Never 1.96 7.69
Seldom 7.84 10.26Half of the times 21.57 20.51
27.45 30.77Often
Always 41.18 30.77
Budget Management
5. Performance Monitoring Evaluation Another important measure to maintain and enhance the quality of service delivery is regular performance monitoring and evaluation. Judges were therefore asked if and how often their performance was evaluated in writing. It turned out that judges are evaluated usually on an annual basis. However, in some regency, in particular in South East Sulawesi, performance evaluation appears to be less regular. As a matter of fact, in South East Sulawesi 8% of the judges had never been evaluated.
Chart 3-28 Frequency of judges’ performance being formally evaluated?
(% of respondents Jd49)
More times per year 20.69 17.95
Never 3.45 7.69Less than once per 3 years 1.72Every 2 or 3 years 2.56Annually 74.14 71.79
South Sumatera ulawesiSouth-East S
00
Never 7.69South Sumatera ulawesiSouth-East S
Seldom 10.420
12.82Half of the times 20.83 23.08Often 27.08 15.38Always 00
26

D. CORRUPTION IN THE JUSTICE SYSTEM
1. Perceptions of Corruption in the Justice System The various categories of respondents were further asked a series of questions concerning their general perception of corruption in the judiciary. Chart 3-29.1
Do you believe your country’s justice system to be corrupt? (1-Never, 5-Always).
South Sumatera
2.49
3.75
3.61
3.533.49
3.59
3.77
2.51
Business people Court User Lawyers Prosecutors 1 2 3 4
Always 5
Never Perception Scale
2 Years AgoToday While in South Sumatera the lawyers had the worst opinion of the judicial system in Indonesia, in South East Sulawesi it was businesses and court users who evaluated the integrity of the judiciary most negatively. Chart 3-29.2
Do you believe your country’s justice system to be corrupt? (1-Never, 5-Always).
South East Sulawesi
3.723.74
3.763.72
3.563.54
2.742.82
Business people Court User Lawyers
Prosecutors
1
Never 2 3 4
Always 5
Perception Scale
2 Years AgoToday
27
2. Frequency and Nature of Corruption in the Justice System Corruption within the judiciary threatens its independence, impartiality and fairness and undermines the rule of law—a key prerequisite for economic growth and the eradication of poverty. Effective protection of human rights and human security require a well-functioning judiciary capable of enforcing the law and administering justice in an equitable, efficient and predictable manner. Within a corrupt judicial system none of these elements exist. The assessment therefore contained a number of questions exploring both the general perceptions of respondents as well as their concrete experiences with regard to the nature, extent, location, cause and consequences of corruption and the related practices in the justice sector. As it turned out, all justice sector professionals had been confronted with corruption in the courts. More specifically, when lawyers were asked whether in the last year they had received an indication to pay a bribe in order to expedite the court proceedings, 76.5% of the respondents in South Sumatera and 57% of those in South East Sulawesi confirmed they had experienced such incidences.
Chart 3-30.1
Have you ever been asked to pay a bribe during the last year in order to expedite the court proceeding? (% yes, Lw49)
76,50%
57,40%
Lawyers in South
Sumatera Lawyers in
South-East Sulawesi
70% 80% 90% 0% 10% 20% 40% 50% 60% According to the lawyers, bribery occurs during all phases of the court proceedings, hence there is no specific phase where bribery occurs the most. 15% of the lawyers in South East Sulawesi indicated the execution of judgment as the step of the proceeding where they had received a request for a bribe, while 13% has indicated the delivery of the judgment. In South Sumatera, obtaining a copy of the judgment, and the delivery of the judgment were indicated as the phases where requests for bribes were most common6.
6 In details for lawyers in South Sumatera the other phases of the proceedings includes namely: Institutions of proceedings, service of summons on defendants, interrogatories, issues of summons on witnesses, commencement of trial, issues of summons on defendants, discovery of documents, services of summons on witnesses, transmissions of court records to appeal courts. For lawyers in South East Sulawesi the other phases of the proceedings include namely: Institutions of proceedings, services of summons on defendants, issues of summons on witnesses, commencements of trial, obtaining certified copies of proceedings, issues of summons on defendant, discovery of documents, implementation of bail order and services of summons on witnesses.
28

Chart 3-30.2
If yes, at which stage of the court proceedings?
South East Sulawesi: Lawyers (%)(Lw50) South Sumatera: Lawyers (%)(Lw50)
15.611.59.4
13.511.511.5
9.58.511.5 12.110.16.8
Implementation of bail orderTrial proceedingsDelivery of judgmentObtaining copy of judgmentObtaining certified copy of proceedingsExecution of judgment
InterrogatoriesTrial proceedingsDelivery of judgmentObtaining copy of judgmentTransmission of court record to appeal courtExecution of judgment
Judges were also asked whether they were aware of bribes being paid to expedite the court process. In South Sumatera 22% and in South East Sulawesi 28% of the respondents confirmed the existence of such practices in their respective courts.
Chart 3-31.1
Up to your knowledge, are court users (or their lawyer) been asked in the last year to pay a bribe to expedite the court procedure? (% of yes, Jd57)
22%
28%
Judges in South Sumatera
Judges in South
East Sulawesi
30% 0% 5% 10% 15% 20% 25%
According to judges, bribery occurs at several stages of the court proceedings. However, most frequently in both provinces bribes were paid for obtaining a copy of the judgement. In addition, in South East Sulawesi also the execution of judgment is reported to be a stage where bribes are frequently requested. Chart 3-31.2
If yes, at which stage of the court proceedings?
33.3
7.411.1
7.411.1
Commencement of trialTrial proceedingDelivery of judgmentObtaining copy of judgmentObtaining certified copy of proceedingsExecution of judgment
jd58)South East Sulawesi: Judges (%) (South Sumatera: Judges (%)(jd58) 22.9
14.311.411.4
8.68.6
Commencement of trial
Trial proceedingDelivery of JudgmentObtaining copy of judgmentTransmission of court record to appeal courtExecution of judgment
29
3. Frequency and Nature of Corruption among Judges
The assessment furthermore explored the frequency and extent of bribery of judges. Even if with significant variations, all respondents, including the judges them selves, admitted to have direct knowledge of bribes being paid to judges. Chart 3-32.1
Do you know of any concrete case in which a court user paid a bribe to judges: (% of yes)(Jd59, Pr51, Lw51, Aw11, Cu53, Bz17)
61.5
South Sumatera
se
45.138.5
3.616.7
26.4
Judge Business eoplerCourt UPrisonersLawyersProsecutors
As it turned out in South Sumatera lawyers were most likely to know of concrete cases of bribery, followed by court users, prisoners and business people. However only 3.6% of the judges admitted any knowledge of incidences of bribery among their peers.
44.4
15.810.3
South East S
547.
ulawesi
seCourt UPrisoners
31.2
44.2 Judges Prosecutors Lawyers r Businesspeople
Results were similar in South East Sulawesi, even though direct knowledge of incidences of bribery appeared more consistent across lawyers, court users, business people and prisoners. Moreover, judges were more forthcoming in admitting their knowledge of corruption within their own profession. Respondents were also asked to indicate for what type of “service” bribes had been paid. In this context, it emerged clearly in both provinces that judges are bribed mainly to re-engineer or reduce the sentence7. Thus bribery of judges directly impacts on the very essence of the judicial function of delivering an independent, fair and impartial decision.
7 The Questions (Jd60, Aw12, Lw52, Pr52, Cu54) were open-ended. It could assumed that some of the categories given actually overlap, e.g. “Re-engineering the sentence” and “Reducing the sentence” probably indicate similar types of ‘services’.
30

Chart 3-32.2 If yes, for what services? (% of respondent, Cu54, Lw52, Pr52, Aw12, Jd60)
8.3 4.65.55.5
76.1 South Sumatera
To win the case Influence thejudgment
Others Re-engineer the the sentence
Reduce theSentence
12.6 5.3
South East Sulawesi
Reduce the
ngineer nce
heInfluence tjudgmententeThe ssentenc
Re-ee
6.312.6
63.2
Execute the Otherssentence
4. Frequency and Nature of Corruption among Prosecutors The assessment also investigated the extent and nature of bribery among prosecutors. As lawyers and prisoners awaiting trial are more likely to have been in contact with prosecutors, it does not come as a surprise that they are more likely to have experienced concrete incidences of bribery. In South Sumatera more than 60% of the lawyers and more than 50% of the prisoners awaiting trial had witnessed prosecutors being bribed; 10% of the interviewed prosecutors confirmed that they had knowledge of such cases. Chart 3-33.1
Do you know of any concrete case in which a court use paid a bribe to prosecutor? (% of yes, Jd61, Pr53, Lw53, Aw13, Cu55, Bz21)
Prisoners Court Users Businesspeople Prosecutors Lawyers Judges
11.5 11.4
51.3
63.7
10.0 4.0
South Sumatera
In South East Sulawesi 45% of the lawyers and 65% of the prisoners indicated that they had knowledge of concrete cases of bribery among prosecutors. Prosecutors themselves did not confirm this, however 13% of the judges did report their knowledge of concrete cases of bribery among prosecutors.
31

Businesspeople Lawyers Prisoners Court Users Prosecutors Judges
40.7 32.0
65.1
44.3
2.8 13.5
South East Sulawesi
Respondents were also asked for what type of “service” the prosecutor had been paid bribed most frequently. As it had been the case for the judges, also for prosecutors it emerged clearly that bribes were generally paid to prosecutors for two purposes: reducing and re-engineering the charges.
Chart 3-33.2 If yes, for what services?
(% of respondent, Cu56, Pr54, Lw54, Aw14, Jd62) South Sumatera
7.2
73.6
2.416.8
Reducing the charges
Increasing the charges
Delay indetention
Re-engineeringthe charges
South East Sulawesi
7.17.16.14.0
75.8
Reducing theitness
ngineerings
OthersRe-ehargethe c
Delay indetention
Investigationof wcharges
5. Frequency and Nature of Corruption among Police The assessment furthermore explored the extent and nature of corruption in the police force. Results differ significantly among respondents and across provinces. In South Sumatera only the lawyers, prosecutors and business people reported to have knowledge of concrete cases of corruption in the police. While judges, prosecutors and court users claimed to have little or no knowledge of concrete examples of bribery among the police.
32

Do you know of any concrete ca (% of yes)(Jd63,
Sou
69.0
4.2
Judges Prosecutors Lawyer
39.3
18.2
8.3
South E
Prosecutors Judges Lawyers
The main purposes8 for bribing the policreengineer the case report, and to tamper the C
If yes, for what services? So
20
9.8
19.6
To avoid or terminate detention
Detenpostpoent
Affect the outcome of Interrogation
South Eas
Affect to outcome of Interrogation
18.9
7.5
Adm
visiDetention postponement
8 In South Sumatera bribes were paid to the police alsthe evidences, to influence the investigation, to acceSouth East Sulawesi bribes were paid: To delete oterminate the investigation, to avoid or terminate deavoid abuses during the interrogation, to be protected
Chart 3-34.1se in which a court user paid a bribe to police? Pr55, Lw55, Aw15, Cu57, Bz23)
th Sumatera
29.7
7.218.5
Businesspeople Court UsersPrisonerss
40.7
ulawesi
sersPrisoners Court U
18.9
34.1
ast S
Businesspeople
e are to obtain postponement of detention, to outcome of the interrogation.
hart 3-34.2 (Cu58, Pr56, Lw56, Aw16, Jd64)
uth Sumatera
9.811.8
.6
Re-engineer the minutes of case report
tion nem
Accelerate the investigation
t Sulawesi
9.4 11.311.3
inistration ting fee
Re-engineer the minutes of the case report
To influence Investigation
o for the following finalities: To delete the case, to destroy ss bail, to avoid abuses during the interrogation. While in r close the case, to allow deliveries during detention, to tention, to access bail, to accelerate the investigation, to in detention.
33

6. Frequency and Nature of Corruption among Court Staff The court staff also interacts frequently with the public, opening a large range of opportunities to engage in corrupt practices. Mainly lawyers, court users, business people and prisoners indicated their concrete knowledge of instances of bribery involving court staff. Chart 3-35.1
Do you know of any concrete case in which a court user paid a bribe to court staff/court clerk/registrar: (% of yes)(Jd67, Pr59, Lw59, Aw19, Cu61, Bz15)
18.5 24.5
South Sumatera
7.4 3.3
67.2
44.1
Judges Prosecutors Businesspeople Lawyers Prisoners Court Users
29.6
13.4
3.8
28.6
20.0
10.3
South East Sulawesi Judges Prosecutors Lawyers Prisoners Businesspeople Court Users Court Staff was mainly bribed to facilitate the administration of the case. In South East Sulawesi they are also being paid to provide advisory and consulting services to court users. Chart 3-35.2
If yes, for what services? (Cu62, Pr60, Lw60, Aw20, Jd68)
South Sumatera
Case administration
Accelerate the court proceedings
6.39.5
67.4
4.2
Establishing a
link to judges / prosecutors
Obtain more information on the case
34

22.2
5.65.6
50.0 South East Sulawesi
Case administration
Accelerate the court proceedings
Establishing a link to judges / prosecutors
Consultation fee Only a small percentage of the interviewed court staff confirmed the existence of bribery within their profession, with less than 7% in both provinces admitting that they had ever been offered a bribe. Chart 3-36
Court staff: have you been offered bribe money?(% respondents, Cs6)
No 93.49 93.43
South East SulawesiSouth SumateraYes 6.51 6.57
7. Amounts Paid for Bribery Business people were asked about the amount of bribe money they had paid to various justice system operators in relation with their case. While the responses varied significantly, it became evident that, amounts paid in bribes are substantial, compared to the average annual income of business people (16.000.000 Rp. in South Sumatera, and 20.000.000 Rp. in South East Sulawesi). According to these figures, the amount paid in bribes to a judge for one case, is equal to more than one fifth of the judge’s yearly income. The proportion income-bribe is lower for prosecutors in South Sumatera and court staff in South Sumatera, whereas the average bribe size level in South East Sulawesi tends to be higher, especially when compared to the income level in this province9.
9 Judges sampled in this assessment report to earn yearly around 38,500,000 Rp. in South Sumatera and 32,500,000 in South East Sulawesi. The prosecutors’ reported income is around 22,500,000 Rp in South East Sulawesi and around 17,500,000 Rp. in South Sumatera. Court staff sampled in this survey reported to earn yearly 13,500,000 in South Sumatera, and 8,000,000 in South East Sulawesi, (see Respondent Profile under Data Description).
35

Table 3-4
Average amount of money paid by business people as bribe (Rp)
Institution South Sumatera South East Sulawesi Judge 7,590,909 7,041,667Prosecutor 3,100,000 4,818,182Bailiff 2,000,000 1,000,000Police 1,290,625 3,810,000Court Staff 943,750 1,678,571
8. Code of Judicial Conduct A code of judicial conduct is a crucial building block for maintaining judicial integrity and upholding the rule of law. Lawyers, judges and prosecutors, therefore were interviewed about their knowledge of the existence of such a code, whether they had been provided with a copy of it, and whether the content of the code was communicated to the public. In general judges lawyers and prosecutors were mostly aware of the code of judicial conduct, with the exception of lawyers in South Sumatera. Here only 78% of the lawyers had ever heard of the existence of such a code. Table 3-5
Are your aware of the existence of a code of judicial conduct? (% of yes, Jd32,Pr39,Lw39)
Prosecutors 82.98 91.89
South East Sulawesi South Sumatera
100.00100.00
Lawyers Judges
98.3678.03 Judges were also asked if copies of the code had been made available to them. While most of judges confirmed that they had received copies, roughly 10% of the judges in South East Sulawesi claimed that only some or none of them had received a copy of the code. Table 3-6
In the court where you mainly work, is the code of conduct made available to judges in your court (%) (Jd33)
South East Sulawesi South Sumatera
5.2614.04
All of the Judges 77.19 81.58Most of the Judges 8.77 7.89Half of the Judges 0 0
0Some of the Judges 5.26None of the Judges
Moreover, judges, lawyers and prosecutors were also asked whether court users could obtain a copy of the code of judicial conduct at the court. More than half of the judges in both provinces believed that this was not the case, while lawyers and prosecutors, in particular in South East Sulawesi, shared a more positive view concerning the availability of the code to the public.
36
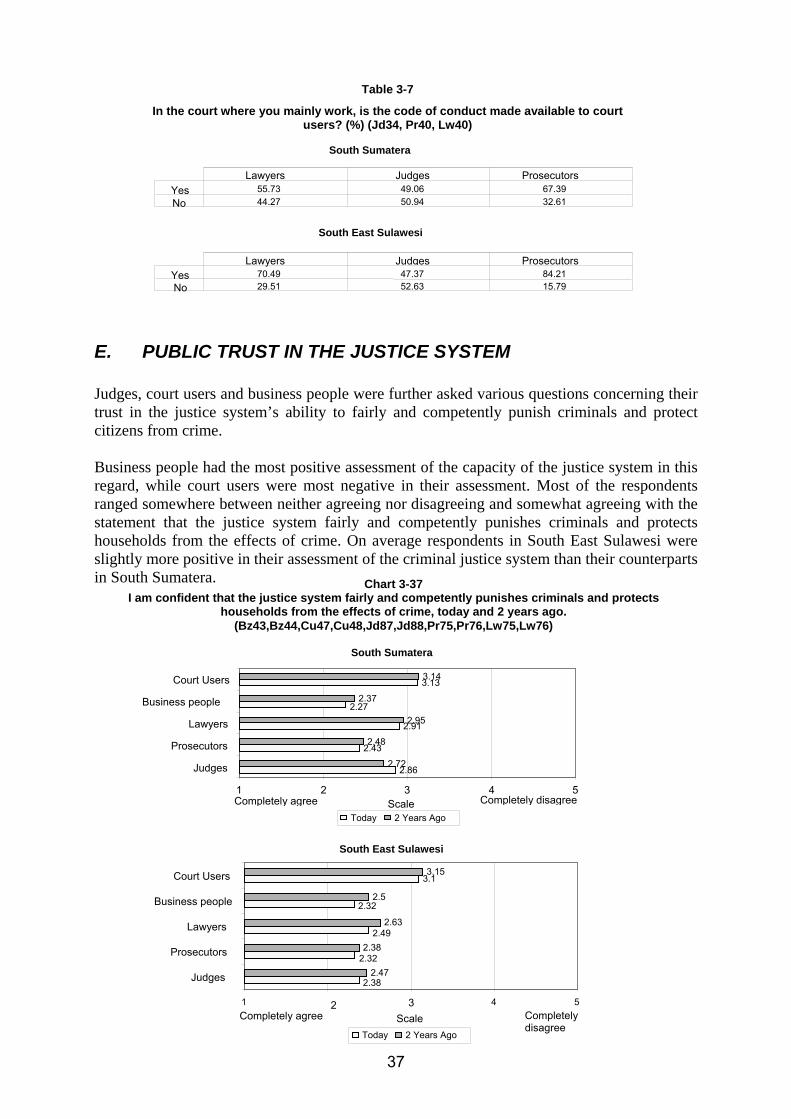
Table 3-7 In the court where you mainly work, is the code of conduct made available to court
users? (%) (Jd34, Pr40, Lw40) South Sumatera
ProsecutorsJudgesLawyers
32.6150.94Yes 55.73
44.27No49.06 67.39
South East Sulawesi
15.7952.6329.51YesNo
70.49Lawyers
47.37Judges
84.21Prosecutors
E. PUBLIC TRUST IN THE JUSTICE SYSTEM Judges, court users and business people were further asked various questions concerning their trust in the justice system’s ability to fairly and competently punish criminals and protect citizens from crime. Business people had the most positive assessment of the capacity of the justice system in this regard, while court users were most negative in their assessment. Most of the respondents ranged somewhere between neither agreeing nor disagreeing and somewhat agreeing with the statement that the justice system fairly and competently punishes criminals and protects households from the effects of crime. On average respondents in South East Sulawesi were slightly more positive in their assessment of the criminal justice system than their counterparts in South Sumatera. Chart 3-37 I am confident that the justice system fairly and competently punishes criminals and protects
households from the effects of crime, today and 2 years ago. (Bz43,Bz44,Cu47,Cu48,Jd87,Jd88,Pr75,Pr76,Lw75,Lw76)
South Sumatera
3.133.14
22.72
.86
2.432.48
2.912.952.27
2.37
1 2 3 4 5
Judges
Prosecutors
Lawyers
Business peo
Court U
ple
sers
Completely disagree Completely agree ScaleToday 2 Years Ago
South East Sulawesi
eople
sers
2.382.47
2 2.32.38
2.492.63
2.322.5
3.13.15Court U
Business p
Lawyers
Prosecutors
Judges
1 2 3Scale
Today 2 Years Ago
Completely agree 4 5
Completely disagree
37

Respondents were also asked to assess the capability of the justice system to protect their property and contract rights. Judges in both provinces showed great confidence in the civil justice system, while court users again held the most negative view. Chart 3-38
I am confident that the justice system upholds civil rights, including contract and property rights, today and 2 years ago. (Bz45,Bz46,Cu49,Cu50,Jd89,Jd90,Lw77,Lw78,Pr77,Pr78)
3.3.08
08
22.89
.95
2.252.08
1.481.57
South Sumatera
eople
sersCourt U
Business p 2.222.34
Lawyers
Prosecutors Judges
1 2Completely agree
Scale
3 4 5Completely disagree
2 Years AgoToday
South East Sulawesi
eople
sers
1.4
Court U
Business p
Judges
Prosecutors
Lawyers
2.933.04
2.252.41
2.282.41
2.622.81
61.59
1 2 3 4 5 Completely agree Completely disagree
Scale 2 Years AgoToday
Moreover, in South East Sulawesi all respondents agreed that, in comparison to two years before the survey, the civil justice system had become slightly more effective in upholding civil rights, while in South Sumatera opinions differed across various categories of respondents. As another indicator for people’s trust in the justice system, business people and court users were asked about occasions when they had chosen to rather not use the court system for solving disputes. It turned out that; in particular in South East Sulawesi, court users (50%) and even more frequently businesses (68%) had felt the need to access the court system, but decided not to do so.
Table 3-8 During the past two years, has your household ever felt the need to use the court system, but decided not
to? (% of respondents, Cu70, Bz64) South Sumatera South East Sulawesi Business people Court Users Business people Court Users
Yes 35.98% 57.67% 68.42% 49.28%
38
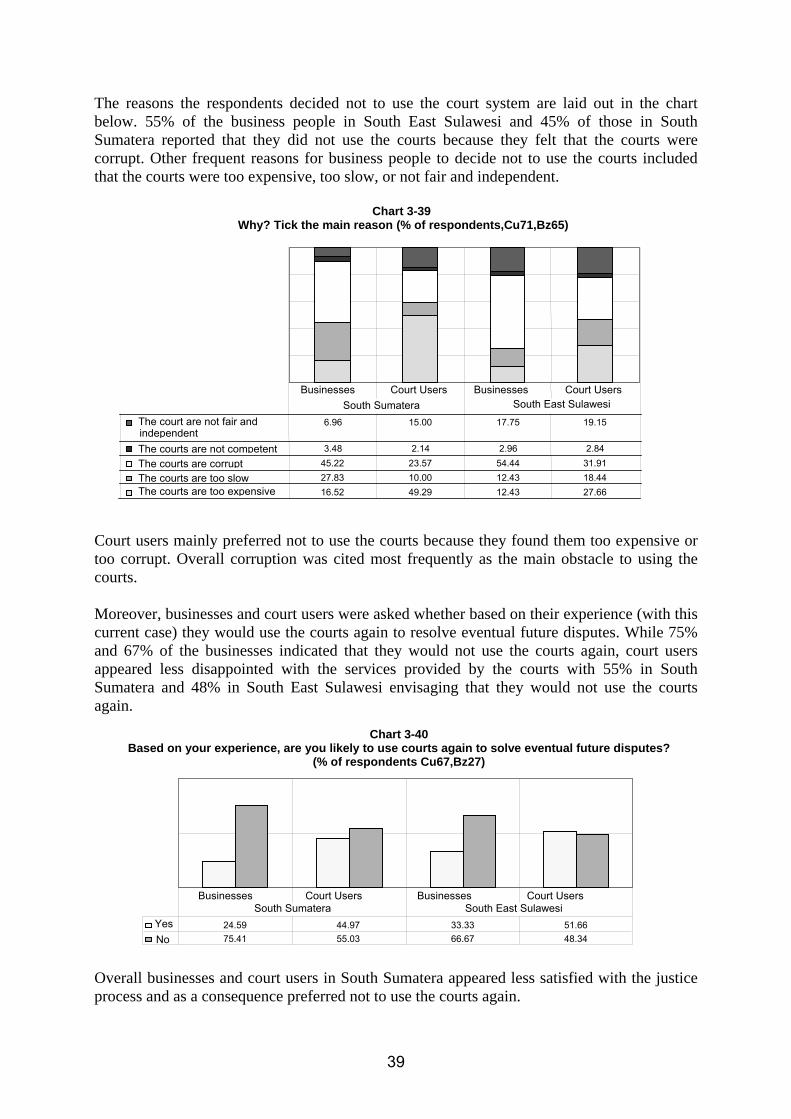
The reasons the respondents decided not to use the court system are laid out in the chart below. 55% of the business people in South East Sulawesi and 45% of those in South Sumatera reported that they did not use the courts because they felt that the courts were corrupt. Other frequent reasons for business people to decide not to use the courts included that the courts were too expensive, too slow, or not fair and independent. Chart 3-39
Why? Tick the main reason (% of respondents,Cu71,Bz65)
The court are not fair and independent
6.96 15.00 17.75 19.15
The courts are not competent 3.48 2.14 2.96 2.84
The courts are corrupt 45.22 23.57 54.44 31.91 The courts are too slow 27.83 10.00 12.43 18.44 The courts are too expensive 16.52 49.29 12.43 27.66
Businesses Court Users Businesses Court Users South Sumatera South East Sulawesi
Court users mainly preferred not to use the courts because they found them too expensive or too corrupt. Overall corruption was cited most frequently as the main obstacle to using the courts. Moreover, businesses and court users were asked whether based on their experience (with this current case) they would use the courts again to resolve eventual future disputes. While 75% and 67% of the businesses indicated that they would not use the courts again, court users appeared less disappointed with the services provided by the courts with 55% in South Sumatera and 48% in South East Sulawesi envisaging that they would not use the courts again.
Chart 3-40 Based on your experience, are you likely to use courts again to solve eventual future disputes?
(% of respondents Cu67,Bz27)
Yes 24.59 44.97 33.33 51.66
Businesses Court Users Businesses Court Users South East Sulawesi South Sumatera
48.34 66.6755.0375.41 No
Overall businesses and court users in South Sumatera appeared less satisfied with the justice process and as a consequence preferred not to use the courts again.
39

F. INDEPENDENCE, FAIRNESS AND IMPARTIALITY OF THE JUDICIARY In order to assess the independence fairness, and impartiality of the judiciary, respondents were asked to what extent they agreed with statements that were considered indicative in this context. More specifically, they were asked whether they believed that the justice system was only working for the rich and powerful, that the executive branch controlled the justice system, and that political pressures completely dominated the justice system.
Completely disagree
Chart 3-41.2 South Sumatera: The executive branch of the government
completely controls the justice system (Jd85,Pr73,Lw73,Bz41,Cu39)
4.34
3.67
2.75
3.3
2.71
1 2 3 4 5
Judge
Prosecutors
Lawyers
Business people
sersCourt U
Scale
Completely agree
Chart 3-41.3 South Sumatera: Political pressures completely dominates
the justice system (Jd86,Pr74,Lw74,Bz42,Cu40)
4.37
4.22
2.38
3.15
2.58
1 2 3 4 5
Judge
Pro ecutorss
Lawyers
Bus piness
Court U
eople
sers
Scale
Completely agree Completely disagree
Chart 3-41.1 South Sumatera: The justice system works only for the rich and powerful (Jd84,Lw72,Pr72,Bz40,Cu38)
4.39
4.16
2.33
3.11
2.63
1 2 3 4 5
Judge
Pro cutorsseLawyers
Bus piness Court U
eoplesers
ScaleCompletely agree Completely disagree
Judiciary system in Indonesia:
South Sumatera 3.10
2.97 2.97
the justice system works only for the rich and powerful
political pressures completely
dominates the justice system
The executive branch of the government
completely controls the justice system
In South Sumatera judges, followed by prosecutors, disagreed most strongly with the statements suggesting a lack of independence and fairness, while lawyers turned out to share the most negative assessment in this regard.
40

In South East Sulawesi, the results were similar, however, here on the average businesses people shared the most negative assessment of judicial independence and fairness.
Chart 3-42.3 South East Sulawesi: Political pressures completely
dominates the justice system (Jd86,Pr74,Lw74,Bz42,Cu40)
4.18
2.76
3.25
2.43
3.31
1 2 3 4 5
Judge
Pro ecutorss
Lawyers
BusCourt U
iness people
sers
Scale
Completely disagreeCompletely agree
Chart 3-42.2 South East Sulawesi: The executive branch of the
government completely controls the justice system (Jd85,Pr73,Lw73,Bz41,Cu39)
4.23
2.97
3.54
2.66
3.35
1 2 3 4 5
Judge
Pro cutorsse
Lawyers
BusineCourt U
ss people
sers
ScaleCompletely agree Completely disagree
Chart 3-42.1 South East Sulawesi: The justice system works only for the rich and powerful (Jd84,Pr72,Lw72,Bz40,Cu38)
4.23
3.29
3.13
2.31
3.39
1 2 3 4 5
Judge
Pro cutorsse
Lawyers
BusCourt U
iness people
sers
ScaleCompletely agree Completely disagree
Judiciary system in Indonesia: South East Sulawesi
3.12
2.96 2.96
the justice system works only for the rich and powerful
The executive branch of the government completely control the
justice system
Political pressures completely
dominates the justice system
When business people were asked whether they believed their country’s justice system to be fair and impartial, they stated that this was only sometimes or seldom the case.
41

Chart 3-43Do you believe your country's justice system to be fair and impartial
(today and two years ago)(Bz28,Bz29)
Never 1 2 3 4 5
South
Always Sometimes
Sumatera
South EastSulawesi
2 Years Ago 2.83South Sumatera ulawesiSouth East S
2.782.732.85Today
Moreover, respondents were asked whether they were aware of any judicial decision that had been influenced by factors, such as politics, gender, ethnicity, religion, family and social ties. Court users were asked more specifically whether they believed that in the concrete court case these factors had influenced the judicial decision. In both provinces politics and social and family ties turned out to be the two factors which most often were perceived to impact negatively on judicial neutrality. Even if to a far lesser degree, also ethnicity in some instances appeared to play a role.
Table 3-9.1
South Sumatera: Do you think that in your case the court decisions was influenced by (are you aware of any judicial decisions which were influenced by): Politics, Gender, Ethnicity, Religion, Family and Social
Ties (Cu41-Cu46, Lw67-Lw71, Pr67-Pr71,Jd72-Jd76)
Types of Respondents Factor Judges Prosecutors Lawyers Court Users %Yes %Yes %Yes %Yes
Political 64.3 63.2 85.8 55.9 Gender 7.8 17.0 10.9 5.9 Ethnicity 2.0 7.3 36.0 22.4 Religion 7.7 7.5 9.9 13.2 Family and Social 36.5 46.3 74.2 54.5
Table 3-9.2
South East Sulawesi: Do you think that in your case the court decisions was influenced by (are you aware of any judicial decisions which were influenced by): Politics, Gender, Ethnicity, Religion, Family and
Social Ties (Cu41-Cu46, Lw67-Lw71, Pr67-Pr71,Jd72-Jd76)
Types of Respondents Factor Judges Prosecutors Lawyers Court users
%Yes %Yes %Yes %Yes
Political 43.2 63.2 83.3 51.2 Gender 3.0 13.5 16.9 8.7 Ethnicity 0.0 29.7 25.4 9.2 Religion 0.0 18.9 11.9 4.3 Family and Social 15.2 45.9 65.0 45.2
42

G. RESPONDENTS’ PROFILE The survey has been carried out among different categories of respondents in order to capture all aspects of and perspectives on the courts and their functioning. The respondents include judges, lawyers, prosecutors, court staff, business people, court users and prisoners awaiting trial.
1. General Profile of the Respondents The survey results showed that lawyers are relatively young compared to other court practitioners (such as judges, prosecutors and court staff). The average age of the lawyers sampled in the two provinces is 33 years, while judges, prosecutors and court staff are between 39 and 48 years old. Table 3-10.1
Average age of respondents (Jd118, Pr103, L103, Cs9)
South East Sulawesi 43 39 34 38
44 48 33 40
Judge Prosecutor Lawyer Court Staff
ateraSouth Sum
The average age of prisoners awaiting trial in the sample was 22 years old (21 in South Sumatera and 23 in South East Sulawesi). Business people on average were 42 years old in South Sumatera and 39 years old in South East Sulawesi. The average age of court users sampled in this survey was 35 years in both provinces.
Table 3-10.2 Average age of respondents (Cu80, Aw26, Bz89)
Businesspeople
42
39
Prisoner A Tri
waitingal Court User
3521
3523SE Sulawesi
umatera South S
The majority of the judges, lawyers, prosecutors and court staff who were interviewed in the two provinces were men.
43
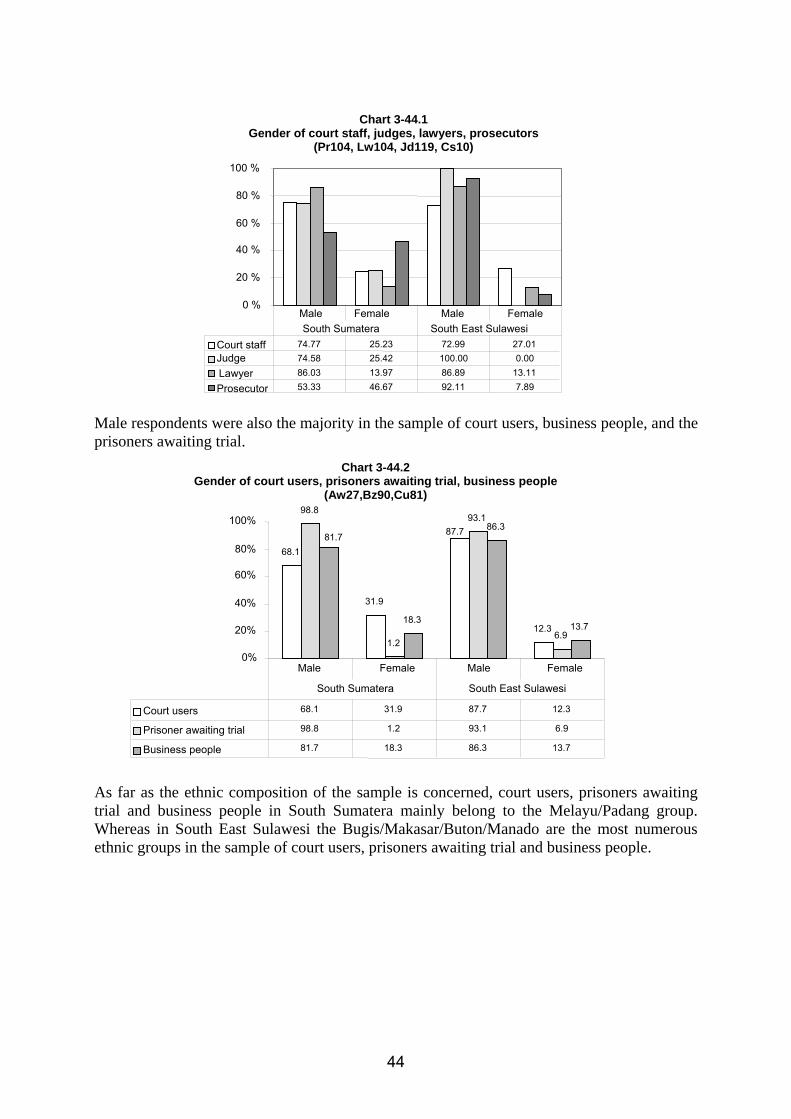
Chart 3-44.1
Gender of court staff, judges, lawyers, prosecutors (Pr104, Lw104, Jd119, Cs10)
0 %
Court staff 74.77 25.23 72.99 27.01Judge 74.58 25.42 100.00 0.00Lawyer 86.03 13.97 86.89 13.11
Prosecutor 53.33 46.67 92.11 7.89
Male Female Male FemaleSouth Sum era ula siweSouth East Sat
20 %
100 %
80 %
60 %
40 %
Male respondents were also the majority in the sample of court users, business people, and the prisoners awaiting trial.
Chart 3-44.2 Gender of court users, prisoners awaiting trial, business people
(Aw27,Bz90,Cu81)
68.1
31.9
87.7
12.3
98.8
1.2
93.1
6.9
81.7
18.3
86.3
13.7
0%
0%
00%
Court users 68.1 31.9 87.7 12.3
Prisoner awaiting trial 98.8 1.2 93.1 6.9
Business people
81.7 18.3 86.3 13.7
Male Female Male Female
South Sumat a ulaw si South East S eer
1
8
60%
40%
20%
As far as the ethnic composition of the sample is concerned, court users, prisoners awaiting trial and business people in South Sumatera mainly belong to the Melayu/Padang group. Whereas in South East Sulawesi the Bugis/Makasar/Buton/Manado are the most numerous ethnic groups in the sample of court users, prisoners awaiting trial and business people.
44

Chart 3-45.1 Ethnicity of the respondents (Aw29, Cu83, Bz92) 100
45
As far as the ethnic composition of the court staff, lawyers and prosecutors is concerned, in South Sumatera the Melayu/Padang was again the most frequent ethnic group. In South East Sulawesi, court staff and lawyers were mainly from Bugis/Makasar/Buton/Manado groups, while prosecutors belonged to Java/Sunda/Madura and Bugis/Makasar/Buton/Manado groups. Among judges in both provinces the Java/Sunda/Madura were the most numerous.
Judges, prosecutors and lawyers in the two provinces mostly graduated from Academy (D3) and University (Bachelor degree). In South East Sulawesi 25% of judges hold post-graduate degrees, compared to only 6% in South Sumatera. In South Sumatera, 57% of the court staff graduated from the academy/university, whereas only 36% of their counterparts did so in South East Sulawesi. Most of the court staff in South East Sulawesi held a High School Diploma.
Others 10,8 3,7 6,9 28 43,1 21,2
80
0
20
40
60
percentage)% (
Java/Sunda/Madura 13,5 16,1 23,4 4,7 6,9 4,5
Melayu/Padang 68,7 79 66,9 2,8 0,7 2
Batak/Tapanuli 2,7 0,6 2,8 0,9 0,4 5,7
Bugis/Makasar/Buton/Manado 4,4 0,6 0 63,5 48,9 66,5
Court Users Awaiting Trial sersBusinesspeople Court U Awaiting Trial BusinesspeopleSouth East Sulawesi South Sumatra
Chart 3-45.2Ethnicity of the respondents (Cs12, Jd121, Lw106, Pr106)
80
60
100
% (
40
20
0
percentage)
Java/Sunda/Madur a
15,2 43,1 11 19,3 6,6 56,8 11,5 39,5
Judges Lawyers ProsecutorsCourt Staff Judges Lawyers ProsecutorsSouth East Sulawesi South Sumatra
Court Staff
65,2 43,1 83,1 70,2 0 5,4 1,6 10,5Melayu/Padang6,7 10,3 4,4 3,5 0,7 10,8 3,3 7,9Batak/Tapanuli0,5 0 0,7 1,8 62 16,2 63,9 35,1Bugis/Makasar/Buton/Manado12,4 3,4 0,7 5,3 30,7 10,8 19,7 5,4Others

100
Post Graduate 0
Chart 3-46.1Level of education of respondents (Jd120, Pr105, Lw105, Cs11)
%
80
60
40
20
0
Primary 4Secondary 36 63College/University 94 95 95 57 75 95 100 36
6 5 5 3 25 5 1
Judge Prosecutor Lawyer CourtStaff
Judge Prosecutor Lawyer CourttaffSSouth Sumatera u wesiSouth East S la
0 0 0
0 0
0 0
0 0 0
0 0 0
The below chart reveals that the majority of prisoners awaiting trial in both provinces have had only an elementary school education. However, while in South East Sulawesi 14% held a University degree, only 3% did so on South Sumatera. At the same time an average of 10% of the prisoners awaiting trial in both provinces were illiterate.
Chart 3-46.2 Level of education of respondents (Aw28, Cu82, Bz91)
0
Illiterate 9 1 1 11 4Primary 60 23 19 39 40 5Secondary 28 49 56 36 45 39
College/University/Post Graduate
3 27 24 14 11 56
Prisoner Court User Business Prisoner Court User BusinessSouth Sumate ulaw sira South East S e
0
% 60
40
20
The average annual income of respondents varies. In general, judges earn more than prosecutors and lawyers10. On average court staff salaries amount to approximately 30% or less of what judges earn, however court staff salaries are significantly higher in South Sumatera than in South East Sulawesi.
10 The central values for the income of respondent is calculated trough the use of the median values.
46

Table 3-11.1 Annual average income of Judges, Lawyers, Prosecutors and Court Staff
(ML of Indonesian Rp, JD 122, Pr 107, Lw 107, Cs 13)
South Sumatera South East Sulawesi Judges 38.5 32.5
Lawyers 22.5 22.5 Prosecutors 17.5 22.5 Court Staff 13.5 8
The business people surveyed had an average annual income of 18,000,000 Indonesian Rupiahs, whereas the average court user had an income of around 13,000,000. Prisoners have an annual income of around 3,000,00011.
Table 3-11.2
Annual average income of Prisoners, Business People and Court Users (ML of Indonesian Rp, Aw 30, Cu 84, Bz 93)
South Sumatera South East Sulawesi
Prisoners 3 3 Business People 16 20
Court Users 13.5 12
2. Legal Expertise of Court Practitioners The survey indicates that most of the judges and lawyers handle both criminal and civil law cases. Table 3-12.1
Judges: Main practice in law (Jd3) (%Percentage of respondents)
SE Sulawesi 5.1 10.3 33.3 51.3
Mixture of all cases Criminal cases Family cases Other Civil
Cases
53.4 27.612.16.9 S. Sumatera
Table 3-12.2Lawyers: Main practice in law (Lw2) (% Percentage of respondents))
SE Sulawesi 1.6 3.3 9.8 9.8 75.4
atera
ses Lab es Fa s Criminal cases
2.9 2.9 6.6 9.6 77.9
Commercial ca our Cas mily case Other Civil
cases A mixture of all cases
0
0South Sum
With a few exceptions, prosecutors handle almost exclusively criminal cases: 74% in South Sumatera and 84.2% in South East Sulawesi. 11 The central values for the income of respondent is calculated through the use of the median values.
47

Table 3-12.3Prosecutors : Main practice in Law (Pr2)
A mixture of acases
ll asesCriminal c
74.120.4
S.E Sulawesi 5.3 5.3 5.3 84.2
atera
ivil asesFamily cOther CCases
1.93.7South Sum
Working experience varies across categories of respondents and across the two provinces. On the average, judges in South Sumatera were more experienced than their colleagues in South East Sulawesi. Chart 3-47.1
Judges: How many years have you been in legal practice? (Jd4)
>15 years
5-15 years
1-5 years
< 1 years % 10 20 30 40 50 60 0
>15 years 5-15 years 1-5 years < 1 years
S.E. Sulawesi 7.7 33.3 30.8 28.2 25.4 50.85.1 18.6S. Sumatera
Prosecutors in general tend to have less working experience than judges, and prosecutors in South East Sulawesi turned out to be less experienced than their colleagues in South Sumatera. Chart 3-47.2
Pr )osecutors: How many years have you been in legal practice? (Pr3
0
>15 years
5-15 years 1-5 years
< 1 years 10 20 30 40 50 60 >15 years 5-15 years1-5 years< 1 years
10 3551.73.3
SE Sulawesi South Sumatera
39.547.413.2 On average, lawyers in both provinces had been in practice between 5 and 15 years.
48

3. Working Hours of Court Practitioners The majority of judges in both provinces work on average between 35 and 45 hours per week, with judges in South East Sulawesi working slightly longer hours than their colleagues in South Sumatera. In South Sumatera, 20% of the prosecutors indicated that they worked more than 45 hours per week, and another 35% claimed to work between 40 and 45 hours. Meanwhile in South East Sulawesi the workload appears to be heavy with 47.4% of the respondents indicating that they work 40-45 hours and another 2.6% of the respondents maintained that they worked over 45 hours a week.
10 20 30 40 50
Chart 3-48.2 Pr )osecutors: Typically how many hours a week do you work? (Pr4
South Sumatera
0 10 20 30 40 50
< 25 hours
25-30 hours
30-35 hours
35-40 hours
40-45 hours
> 45 hours
SE. Sulawesi 15.8 7.9 26.3 47.4 2.6 5 3.3 18.3 18.3 35 20
Ju )
SE. Sulawesi 2.6 12.8 15.4 20.5 38.5 10.3South Sumatera
ours ours ours ours ours
0
> 45 h40-45 h35-40 h30-35 h25-30 hours< 25 h
3.435.645.810.25.1
< 25 hours
30-35 hours
25-30 hours
35-40 hours
40-45 hours
0
> 45 hours
Chart 3-48.1 dges: Typically how many hours a week do you work? (Jd5
> 45 hours 40-45 hours 35-40 hours30-35 hours25-30 hours< 25 hours 0
Lawyers, in particular in South East Sulawesi, have a slightly less heavy workload compared with prosecutors and judges, with more than half of the respondents working less than 35 hours a week.
49

Chart 3.48.3Typically how many hours a week do you work? (Lw4)
> 45 hours 40-45 hours
35-40 hours
30-35 hours 25-30 hours < 25 hours
0 5 10 15 20 25 30 35 > 45 hours 40-45 hours 35-40 hours30-35 hours25-30 hours< 25 hours
SE. Sulawesi 11.5 31.1 16.4 24.6 13.1 3.3 14.1 13.324.413.36.7 28.1South Sumatera
4. Charges against Prisoners Awaiting Trial The survey furthermore explored the crimes that prisoners awaiting trial were most commonly accused of. While many similarities exist, there are two significant differences between the two provinces. In South Sumatera theft accounts for 35.5% of all crimes allegedly committed by the respondents, while in South East Sulawesi only 18% were accused of theft. At the same time assault appears to be a much more common crime in South East Sulawesi, with 26.80% of the respondents being accused thereof, while in South Sumatera only 6.7% of the respondents had been accused of this crime. Chart 3-49
Prisoners: What offence are you accused of? (Aw1)
0%Other Assault Drug related
crime Embezzlement
Burglary Fraud Theft Robbery Rape No, Intentional Homicide
Intentional Homicide, Attempted
Intentional Homicide, Committed
19.80%26.80%3.20% 9.20%3.20%1.80%18%1.40%4.60%8.10%1.40%2.50%South-East Sulawesi16%6.67%10.10%2.80% 3.40% 3.40%35.50%8.70%5%5.60%1.10%1.40%South Sumatera
5%
10%
45%
40%
35%
30%
25%
20%% (percentage)
15%
50

IV. BASELINE An important element for any reform is to develop impact-oriented measures and to establish a baseline against which progress can be monitored. A baseline will increase the accountability of policy makers and provide an instrument for all stakeholders to evaluate the actual impact of reforms. Finally, an impact-oriented progress review enables reformers to assess the validity of their action, and to refine or readjust the identified plans. The Provincial Integrity Meetings for the judiciaries of South Sumatera (Palembang, 11-12 October, 2004) and South East Sulawesi (Kendari, 7-8 October, 2004) decided that reforms should focus on enhancing access to justice, raising public trust in the courts, increasing quality and timeliness of the court process, improving accountability, integrity and independence of the judiciary, and strengthening the coordination across the criminal justice system. For each of these objectives a set of indices have been identified in order to verify if and to which extent the reforms have achieved their purpose. The following table presents the questions that have been used to construct these indices. The indices are constructed using a scale from zero to ten, with zero indicating the most positive value regarding a specific matter, and ten the most negative value.
51

Index
(0 = Most Positive Result and 10 =Most Negative Result)
Baseline Index Questions for developing the Index
South Sumatera
South East Sulawesi
Accessibility Perception Index (covered by 4 questions)
“Do you believe your country’s justice system to be affordable?” (Business people, prosecutor, lawyer, court users).
4.95
5.13
“How difficult was it to obtain information regarding your current case?” (Court users, business people). “How much did you pay for each travel?” (Lawyer, court users). “How much did you pay in court fees?”(Lawyer, court users, business). “How much did you pay for you lawyers?”(Court users, prisoners). “How many times did you/your client come to the court in connection with this case?” (Court users, lawyers).
Accessibility Experience Index (Covered 13 by questions)
“How long does it take to reach the courts?” (Court users, lawyers)
4.79
5.14
“Delays in the delivery of the Judgement are a serious problem” (Judges, lawyers) “Delays in giving reasons for Judgement are a serious problem” (Judges, lawyers)
Timelines Perception Index (covered by 9 questions)
“Do you consider your country’s justice system to be quick?” (Prosecutors, lawyers, court users, business people and judges)
5.04
5.06
“How many months ago was the current case filed?” (Court users, business people) Timeliness Experience Index (covered by 5 questions)
“Have you ever experienced undue delay at any stages of court proceedings?” (Judges, prosecutors, lawyers)
4.75
5.32
“Do you consider the courts to be competent?” (Business people) Quality Perception Index (covered by 6 question)
“Please evaluate quality of services provided by judges, prosecutors, lawyers, police, court staff and enforcement officials related to the justice system?” (Court Users, business people, lawyers, prosecutors, judges)
4.78
5.11
“How long did it take for the decision of the court to be enforced?” (Court users, business people) “How frequently is your performance formally evaluated in writing?” (Judges) ”In general, laws, regulations, and their interpretation by courts are consistent” (Business people) “Is any kind of court-related alternative dispute resolution method used in the cases you are in charge of?” (Lawyers, judges, prosecutors) “Do you have an information management system?” (Judges)
Quality Experience Index (covered by 9 questions)
“Is anyone in your court/ have you been provided with a PC?” (Judges)
4.61
5.68
Corruption Perception Index (covered by 4 questions)
”Do you believe your country’s justice system to corrupted?” (Lawyers, prosecutors, business people, court users)
4.90
5.15
52

Index (0 = Most Positive Result and 10 =Most
Negative Result)
Baseline Index Questions for developing the Index
South Sumatera
South East Sulawesi
”Have you ever been asked to pay a bribe in order to expedite the court proceeding?” (Lawyers, judges, prosecutors) ”In relation to your current case have you/ your client (or you on their behalf) ever been asked to pay a bribe to a judge, prosecutor, police officer, other lawyer or court clerk?” (Lawyers, business people, prisoners, court users). ” Do you know of any concrete case in which a court user paid a bribe to a judge, prosecutor, police officer, other lawyer or court clerk?” (Judges, prosecutors). “If yes, how many times did it happen?” (Lawyers, judges, prosecutors, business people, prisoners and court users) “Have you at any time been offered unofficially any money in relation to a lawful act of court proceedings?” (Court staff)
Corruption Experience Index (covered by 4 questions)
“Are you aware of any instances when any persons offered unofficially any colleague of yours any money in relation to a lawful act of court proceedings?” (Court staff)
5.04
4.87
“The justice system effectively and efficiently supports a modern economy and the private sector?” (Lawyers, judges, prosecutors) “Do you believe your country justice system will defend you from crime?” (Business people, court users, lawyers, prosecutors, judges) “Do you believe your country justice system will uphold your civil rights?” (Business people, court users, lawyers, prosecutors, judges)
Public trust index (covered by 10 questions)
“Has your firm ever had a complaint against any government agency, including, for example, the tax office, the public health service or customs? If yes did you litigate against the government in the court?” (Court users, business people)
5.07
4.88
“Do you believe your country’s justice system of today to be fair and impartial?” (Business people) ”Does the justice system work only for the rich and powerful?’ (Lawyers, judges, prosecutors, court users and business people) “Does the executive branch of government completely control the justice system?” (Lawyers, judge, prosecutors, court users and business people) “Do political pressures completely dominate the justice system?” (Lawyers, judge, prosecutors, court users and business people) ”Are you aware of any judicial appointments / promotions within the past 5 years that have been, or were perceived to have been, politically inspired or influenced?” (Lawyers, judges, prosecutors)
Independence Index (Covered by 23 questions)
“Are you aware of any judicial decisions within the last 5 years that were influenced by politics, gender, ethnicity, religion, family and social ties”? (Lawyers, judges, prosecutors, court users)
4.96
5.25
53

V. DATA ANALYSIS The objective of this analysis is to identify policy options and facilitate decision making in determining priority measures for judicial reform. For this purpose, the findings outlined in the descriptive part were integrated into perception and experience indices for accessibility, judicial independence, timeliness and quality of justice delivery, as well as for corruption of and public trust in the justice system. The analysis revealed that perceptions and experiences were interrelated in most cases, indicating that opinions concerning the justice system are normally based on actual experiences or first hand knowledge of such experiences. It also became evident that socio-economic and demographic characteristics seem to influence the experiences and the perceptions of respondents. In particular, there were two groups who faired worse in terms of their experiences and perceptions in the justice system: the poor and some ethnic groups. More specifically, the poor encountered significant obstacles in accessing justice, in particular in the province of South East Sulawesi. Also, some ethnic minorities were more likely to experience delays in justice delivery. The socio-economic and demographic characteristics of the respondents did not affect their perceptions and experiences of the quality of the courts. However, it turned out that some ethnic groups seem more likely to be confronted with corruption in the courts. Gender and income on the other hand did not appear to be significantly related to the levels of experienced or perceived corruption. This might need to be explored more fully through additional research because the majority of the respondents to this survey were male
A. ACCESS TO JUSTICE The Accessibility Experience Index (AEI) was created by merging questions related to the experiences, in particular of court users and business people, when seeking access to justice. Such factors included ‘the number of times respondents had been asked to come to court before the case was concluded’ ‘how difficult it had been to obtain information on the court case they were involved in’, ‘the time needed for the respondent to reach the courts’, ‘how much they had to pay for each travel to reach the court’, as well as ‘how much they had to pay in court fees, and lawyer’s fees’. In addition, an Accessibility Perception Index (API) was developed since the decision to access the court system often will be determined by the perception of the accessibility rather than by prior experience. The Accessibility Perception Index was composed of questions relating to the perceptions of the affordability of the justice system.

The perceptions of affordability appeared to have different causes in the two provinces. Difficulties in affording the justice system, in South Sumatera were mainly caused by too high court fees12, whereas in South East Sulawesi lawyer fees and the number of times the respondents had to return to court seemed to influence the perception of affordability13.
FINDING 1 Access to justice could be significantly enhanced by reducing the number of adjournments and as well as time required to resolve the case in South East Sulawesi, while in South Sumatera the high court fees should be reviewed. The respondents who had experienced delays in the proceedings were more likely to perceive the courts as not accessible. In particular, those respondents who had experienced long proceedings in criminal or labour cases perceive the justice system as least accessible14.
FINDING 2 In particular in criminal and labour cases there is a need to reduce the time it takes to resolve such cases. Such action is likely to improve the overall perception concerning the accessibility of the courts.
bility)
Chart 5-1 Access to justice, measured on a scale
from 0 ( high accessibility) to 10 (low accessi
0South Sumatera ulawesiSouth East S
5,134,95API
5,144,79AEI
10
5
12 The Pearson coeff. between ‘Do you believe the criminal justice system being Affordable?’ and court fees in South Sumatera is 0.400 (Sig. 0.001). 13 The Pearson coeff. between ‘Do you believe the criminal justice system being Affordable?’ and lawyer fees and times in front of the courts in South East Sulawesi is 0.315 and 0.218 (Sig. 0.001). 14 The Pearson coeff. between API and Months in remands for criminal cases, and for labour cases are accordingly: - 0.236 and –0.253(Sig. 0.001).
55

B. TIMELINESS OF JUSTICE DELIVERY The Timeliness Experience Index (TEI) considers the ‘number of months ago the current case had been filed’, as well as ‘experiences of undue delay at any stage of the court proceedings’. The Timeliness Perception Index (TPI) reflects the opinions of court users, business people, judges, prosecutors and lawyers concerning ‘the country’s justice system being quick’. Further, the index includes the answers to the question whether ‘delays in the delivery of the judgement were a serious problem’, and whether ‘delays in the delivery of the reasons of judgement were a serious problem’ compared to other factors hampering justice delivery.
When reviewing perceptions and experiences of timeliness across the two provinces, it turns out that respondents in South Sumatera had experienced slightly faster courts compared to South East Sulawesi, while there were no differences in perceptions between the two provinces. Comparing the timeliness experiences among the different respondents, lawyers and business people report significantly worse experiences than prosecutors. Similarly, lawyers and business people15 have worse perceptions than prosecutors and judges. It appears that gender and income are not related to the timeliness of proceedings. At the same time some ethnic groups in both provinces tend to be more likely to experience delays16. Most significantly, perceptions of timeliness are influenced by difficulties experienced when accessing the justice sector. This is particularly true for those court users who had difficulties in obtaining information on their cases, and those who had to return several times to court for the same case17.
s)Chart 5-2
Timeliness of the courts, measured on a scale 0 (few delays) to 10 (frequent delay
0South Sumatera ulawesiSouth East S
5,045 5,06TPI
5,324,75TEI
10
5
15 On a scale from 0 (most positive result) to 10 (most negative result), lawyers scored TPI: 5.49 and business people scored TPI: 5.37. 16 One way ANOVAs TEI and Ethnic Groups is significant at 0.001 level for Court users and Awaiting Trials. Among Court users Batak/Tapanuli score TEI: 5.7. Among Awaiting Trial, ‘Others’ ethnic groups, which consist of different groups infrequently reported scores TEI: 6.5. 17 The Pearson coeff. between the ‘Do you believe the criminal justice system being quick?’ and ‘How many times in front of the courts’ is 0.250 in South Sumatera (Sig. 0.001). Whereas The Pearson coeff. between the ‘Do you believe the criminal justice system being quick?’ and ‘Difficulties in finding information on you current case’ is 0.310 (Sig.0.001).
56

FINDING 3
Overall perceptions of the timeliness of the courts could be significantly improved by improving the access to information for court users, and by reducing the number of adjournments.
C. QUALITY OF JUSTICE DELIVERY The Quality Experience Index includes indicators relating to the capacity of the justice system to carry out its institutional functions. For this purpose it comprises questions relating to the reliable ‘enforcement of court decisions’, the ‘consistency of laws, regulations, and their interpretation by the courts’, as well as the ‘difficulties encountered when retrieving information from court records’, ‘the availability of a personal computer to the judges and the existence of a information management system’ and the frequency of performance evaluation of judicial officer. The variables considered for the Quality Perception Index (QPI) were the evaluation of ‘the services provided by the various actors within the justice system, including judges, prosecutors, public and private attorneys, court clerks, police, enforcement officers, and by the prison personnel, as well as the perceptions of the ‘competence of the courts’. Respondents in South Sumatera scored to experience better quality services than those in South East Sulawesi. However, as far as the perceptions of quality of services are concerned, the differences between the two provinces are less significant.
Chart 5-3Quality of the services provided by the courts,
measured on a scale from 0 (high quality) to 10 (low quality)
0
QEI 4,61 5,68
umatera ulawesiSouth East SSouth S
5,114,78QPI
10
5
57

When comparing the Quality Perception Index across the categories of respondents, as one would expect judges and prosecutors have the highest opinions of the services provided by the courts18.
When correlating the Quality indices with other indices, a relation could be established between the Quality Perception Index and the levels of corruption experienced in the courts19. In particular, court users who had more frequently paid bribes to court staff, judges and prosecutors, shared the most negative perceptions concerning the quality of the services provided by the courts20. Correlating the single components of the Quality Experiences Index with the experiences of corruption, a strong link was noted between the inconsistency and unpredictability of court decisions and corruption21.
FINDING 4 Measures that limit judicial discretion and enhance judicial accountability, such as sentencing guidelines, will not only enhance the predictability and reliability of the law and its interpretation, but also reduce the opportunities for corrupt practices.
D. PUBLIC TRUST IN THE JUSTICE SYSTEM The nature of the Public Trust Index did not allow for a distinction between experience and perception related data. The variables used for the index included the respondents’ perceptions concerning the ‘justice system’s ability to uphold civil rights’, ‘to protect its citizens from crime’ and ‘to support a modern economy’. As a sign of public trust the index also considered whether court users or business people ‘did litigate against government in the courts’. A cross-province analysis of the responses showed that the trust in the judiciary was at the same level in the two provinces.
18 On a scale from 0 (most positive result) to 10 (most negative result), judges scored QPI: 3.26 and prosecutors scored QPI: 3.44. 19 The Pearson coeff. between the QPI and CEI is 0.377 (Sig. 0.001), among court users is 0.492 (Sig.0.001). 20 One way ANOVA between QPI and ‘bribery to judges’ F: 78.7 for court users and F: 14.38 for business people (Sig. 0.001). One way ANOVA between QPI and ‘bribery to court staff’ F: 158.7 for court users (Sig. 0.001). One way ANOVA between QPI and ‘bribery to prosecutors’ F: 20.117 for court users, F: 10.88 for business people (Sig. 0.001). 21 One way ANOVA between ‘consistency of court decisions’ and ‘bribery to judges’ F: 21.7 and ‘ bribery to prosecutors’ F: 22.38 (Sig. 0.001).
58

Among the different categories of respondents, court users expressed the lowest level of trust in the judiciary, whereas judges showed the highest level of confidence22. When exploring the links with the other indices, the experiences of timeliness and of corruption were most strongly correlated with public trust23. More specifically, in South Sumatera, the opinion of a criminal justice systems ability to protect the public from crime and to defend the public’s civil rights is affected by lengthy proceedings24. In both provinces, those respondents who had experienced corruption in the courts, in particular among judges, evidenced significantly lower trust level25. Moreover, the affordability of the justice seemed to play an important role for the public trust in the courts26.
FINDING 5 Public Trust in the justice system is highly dependent on the ability of the courts to deliver justice in a reliable, predictable, timely and affordable fashion, as well as on the absence of corrupt practices in the courts.
Chart 5-4
Public trust in judiciary, measured in a scale 0 (high trust) to10 (low trust)
10
5
0
dex umatera ulawesiSouth S South East S
4,885,07Trust In
22 On a scale from 0 (most positive result) to 10 (most negative result), court users scored Trust Index: 5.9 and judges scored Trust Index: 3.52. 23 Pearson coeff. between ‘Trust Index’ and ‘Corruption Experience Index’ is 0.243, in South Sumatera is 0.344 (Sig. 0.01); Pearson coeff. between ‘Trust Index’ and ‘Timeliness Perception Index’ is 0.278, in South Sumatera is 0.365 (Sig. 0.01). 24 Pearson coeff. between ‘Months in remand for criminal cases’ and ‘The courts are able to defend me from crime’, ‘The courts will uphold my civil rights’ is, in South East Sulawesi 0.374 and 0.459 (Sig. 0.001). 25 One way ANOVA between ‘Bribery to judges’ and ‘The courts will uphold my civil rights’ F: 67.5 and ‘The courts are able to defend me from crime’ F; 42.27 (Sig. 0.001). 26 Pearson coeff. between ‘How much do you pay as court fees’ and ‘The courts are able to defend me from crime’, ‘The courts will uphold my civil rights’ is, in South east Sulawesi 0.354 and 0.4059 (Sig. 0.001).
59

E. INDEPENDENCE, FAIRNESS AND IMPARTIALITY OF THE JUDICIARY All factors relating to independence, fairness and impartiality of the courts were integrated into the Independence Index. It included questions relating to the ‘political pressure on the judiciary’, and the ‘control that the executive exercises over the courts’, as well as the perceived ‘fairness and impartiality of the courts’. Furthermore, the index included questions concerning the hiring and promotion of judges, in particular, whether the process was determined by merit or rather by personal or political connections or by social status.
Chart 5-5
Independence, Fairness and Impartiality of the Judiciary measured on a scale from 0 (high independence) to 10 (low independence)
0
ndex umatera ulawesiSouth East SSouth S
5,254,96Independence I
10
5 As far as independence, impartiality and fairness were concerned, judges and prosecutors appeared to share the best opinions when compared with other categories of respondents27. Further, the opinions of respondents were highly dependent on whether they experienced corruption in the courts28. A judicial system that is influenced by politics or by other factors is constantly undermined in its integrity and looses its ability to curb corruption, both within its own ranks, and in the public and private sector in general. 27 On a scale from 0 (most positive result) to 10 (most negative result), judges scored Independence Index: 3.53 and prosecutors scored Independence Index: 3.52. 28 One way ANOVA between ‘Do you perceive the Judiciary under political pressure?’ shows variance difference whether the respondent have paid bribe to court staff, lawyers, prosecutors, police, judges (Sig. 0.01). One way ANOVA between ‘The executive branch of the government completely controls the justice system?’ shows variance difference whether the respondent have paid bribe to court staff, lawyers, prosecutors, police, judges (Sig. 0.01). One way ANOVA between ‘The justice system works only for the rich and powerful’ shows variance difference whether the respondent have paid bribe to court staff, lawyers, prosecutors, police, judges (Sig. 0.01).
60

FINDING 6 A lack of judicial independence and corruption appear to be mutually reinforcing factors. Thus, measures are required that strengthen judicial independence as well as accountability.
F. CORRUPTION IN THE JUSTICE SYSTEM The Corruption Experience Index (CEI) was composed of indicators relating to the experiences of the various categories of ‘unofficial payments to judges, prosecutors, police officers, lawyers and court clerks’, ‘the frequency of such payments’ as well as experiences relating to bribes paid to ‘expedite the proceedings’. The Corruption Perception Index (CPI) included responses of the various stakeholders on how they perceived the level of corruption in the courts.
Chart 5-6
Corruption in the courts, measured in a scale from 0 (low corruption) to 10 (high corruption)
0South Sumatera ulawesiSouth East S
5,043 4,87CEP
5,154,9CPI
10
5
When comparing the two indices, it turned out that high levels of perceived corruption correspond to frequent experiences with corrupt practices. Moreover, perceptions appeared to be mostly influenced by actual experience of corruption involving judges and court staff29. From a cross-province comparison of the Corruption Perception and the Corruption Experience Index it emerged clearly that corruption within the justice system was considered a problem in both provinces. A thorough analysis of both the Corruption Experience Index and the Corruption Perception Index revealed that lawyers and 29 One way ANOVA between ‘Do you perceive your criminal justice system corrupt?’ and ‘Bribery to Court Staff’ are for court users F: 75.6 (Sig.000) and for lawyers F: 34.32 (Sig: 000). The same variable with ‘Bribery to judges” are for court users F: 41.78 (Sig.000), for lawyers (Sig.000) and for business people F 8.61 (Sig.000). The same variable with prosecutors Corruption are for court users F: 21.073 (Sig.000) and for lawyers F: 25.85 (Sig.000). The same variable with Police Corruption are for court users F: 14.9 (Sig.000) and for lawyers F: 24.85 (Sig.000).
61

prisoners awaiting trial are most likely to experience corruption (See the Data Description Part). Moreover, it appears that some ethnic groups are more likely to experience corruption than others30. The Corruption Experience Index was also closely linked to the Timeliness Experience Index31. Delays are a compelling incentive for the court users to accelerate the procedure by paying bribes32. Often delays are used as an implicit request for a bribe in exchange for an unanticipated ‘service’. The finding suggests that the likelihood of incidents of corruption directly depends on the overall duration of the case. A person’s encounters with corruption also related to experiences of accessibility of the courts. Respondents, who had experienced more difficulties in receiving information on the status of the case, were more likely to experience bribery33. Moreover, there is a relation between the perceptions of affordability of the courts and corruption, suggesting that bribery raises the costs of justice so much as to undermine the access to justice34. Furthermore, there is a relation between experiences of corruption and the number of times court users are called in front of the court35. It seemed therefore safe to assume that any measure speeding up the trial in general, and reducing the number of adjournments in particular will not only assist in increasing the timeliness of justice delivery, but also reduce the opportunities for corrupt practices in the courts and enhance access to justice.
FINDING 7 There is a strong linkage between corruption on one hand and delays, access to justice or the lack thereof on the other, which suggests that enhancing accountability and integrity of the courts will assist in: - Increasing the timeliness of justice delivery, - Enhancing access to justice, - Increasing the public’s confidence in the judicial system.
To conclude, experiences of corruption in the courts tend to affect strongly the trust in the justice system, as already shown in the descriptive part36.
FINDING 8 The more corruption the less trust, the less trust the more people accept bribery as normal when dealing with justice sector institutions.
30 CEP for ethnic group Melayu/Padang in South Sumatera among business people is 4.5, and among court users is 4.1 (Sig.000). 31 Pearson coeff. between ‘CEI’ and ‘TEI’ among business people is 0.340 (Sig. 0.05). In South Sumatera is 0.422. (Sig. 0.01). 32 One way ANOVA between ‘Court Staff Corruption’ and ‘Months in remand’ (Sig. 0.05). 33 One way ANOVA between ‘Difficulties in having information on your case?’ and ‘bribery to lawyers’, ‘bribery to judges’ and ‘bribery to prosecutors’ are accordingly Sig 0.041, 0.018, 0.04. One way ANOVA between ‘Do you information on bail ’and ‘Bribery to lawyers’ (Sig 0.000). 34 One way ANOVA between ‘Do you perceive the court not affordable’ and ‘Judge’s Corruption’ in South Sumatera (Sig. 0.01). 35 Pearson coeff. between ‘Corruption Experience Index’ and ‘How many times in front of the Courts’ are accordingly 0.210 for Court users (Sig. 0.001). 36 Pearson coeff. between ‘Public Trust Experience Index’ and ‘CEI’ are accordingly 0.410 and 0.364 (Sig. 0.05).
62

VI. MAIN PROBLEMS ACCORDING TO JUSTICE PRACTITIONERS When asked what, in their view, were the most important obstacles to the well-functioning courts, judges, prosecutors and lawyers in both provinces stressed the disappearance of court records as a major problem. The disappearance of court records can delay the court process, affect service quality, and open the door to corrupt practices. Moreover, variations in sentencing, a high acquittal rate, apparent conflicts of interest and high rate of decisions in favour of the executive were identified as recurrent problems.
Chart 6-1How serious are these problems in the judicial system?
(h105-h117, j89-j102, p89-p102)
Sou2.80
3.12
193.
083.043.
3.00
th East Sulawesi
South Sumatera
33.40
.44
3.3.20
21
5 = Not serious at all
1= The Most Serious
32.95
.02
dgmentdges
dgmen
8. Del7. Pos nt placements for ju
ay in giving reasons for jut-retireme6. Delay in delivering the ju t
4. Appare nflict of innt co terest3. Hig
2. Variations in sh acquittal rate
entencingrds
xecutive
tationtigants
dge12. Immediate family members appearing in court before the ju
11. Prejudice for/against a party or a lawyer in proceedings 10.
9. Socializing by judges with litigants or potential li Prolonged service in a particular judicial s
5. High rate of decisions in favour of the e
1. Disappearance of court reco 2.46
2.7
802.7
72.7.772
2.72
368.77
3..633
.51
5 = Not serious at all
1= The Most Serious
323.4
3.39
9. Post-retirement placements for judges
dgmen7. Delay in giving reason for ju t
6. Delay in d the juelivering dgment
5. Variations in sentencing
teres3. Appare nflict of innt co t
2. High acquittal raterds
xecutive
tation
udge12. Imm mily members appearing in court before the jediate fa
10. Prolonged service in a particular judicial s
8. Prejudice for/against a party or a lawyer to proceedings
tigants11. Socializing by judges with litigants or potential li
4. High rate of decisions in favour of the e
1. Disappearance of court reco
63

VII. RECOMMENDATIONS Within the context of the UNODC project on strengthening judicial integrity and capacity in the provinces of South Sumatera and South East Sulawesi, a large series of recommendations for judicial reform measures were collected. These included:
a. The inputs from judges, prosecutors and lawyers interviewed as part of the assessment.
b. The findings resulting directly from the analysis of the data collected as part of this assessment.
A. RECOMMENDATIONS BY JUSTICE PRACTITIONERS When asked to rank the effectiveness of possible measures that could be implemented in order to improve court performance, judges, prosecutors and lawyers had different views. Judges in both provinces believed that the incentives of raising salaries and tying promotion to performance would be a very effective way to improve court performance. In addition, judges suggested that court performance would benefit from better case management, including an effective registry and file management system, from better-trained staff, as well as from better laws and regulations. As far as the ranking of possible improvements is concerned, there were no significant differences between the two provinces as shown in the following table.
Table 7-1.1 Judges’ recommendations on court performance
Recommended actions to improve Court Performance based on Judges’ Opinions in South Sumatera Effectiveness %
Respondent
Merit-based hiring, promotion, and compensation Very effective 94 Higher salaries Very effective 86 Better case management including effective registry and file managementsystem Very effective 85 Better trained staff Very effective 84 Better Laws and Regulations Very effective 84
Recommended actions to improve Court Performance based on
Judges’ Opinions in South East Sulawesi Effectiveness % Respondent Better trained staff Very effective 85 Higher salaries Very effective 80 Better case management including effective registry and file management system Very effective 77 Merit-based hiring, promotion, and compensation Very effective 77 Better Laws and Regulations Very effective 77
64

Prosecutors in South Sumatera believed that the incentive of raising salaries would be the most effective way for improving courts performance (84%). Other proposals included better laws and regulations, better trained staff, and a merit-based hiring and promotion system. Unlike prosecutors in South Sumatera, those in South East Sulawesi considered other incentives, such as the establishment of clearer performance standards, as well as improving the training of court staff as the most needed improvements. Prosecutors in South East Sulawesi also suggested to improve case management, provide for better laws and regulation, and easier access to existing laws and relevant jurisprudence.
Table 7-1.2 Prosecutors’ recommendations on court performance
Recommended actions to improve Court Performance based on Prosecutors’ Opinions in South Sumatera Effectiveness %
Respondents Higher salaries Very effective 84 Better Laws and Regulations Very effective 76 Better trained staff Very effective 74 Better case management including effective registry and file management system Very effective 62 Merit-based hiring, promotion, and compensation Very effective 62
Recommended actions to improve Court Performance based
on Prosecutors’ Opinions in South East Sulawesi Effectiveness % Respondents Establishment of clearer performance standards Very effective 78 Better trained staff Very effective 76 Better case management including effective registry and file management system Very effective 72 Better Laws and Regulations Very effective 56 Easier access to existing law, precedent, and other relevant jurisprudence Very effective 53
Lawyers in both provinces ranked improved capacity to curb corruption as the most effective recommendation. Moreover, lawyers in South Sumatera suggested improving the training of court staff, as well as strengthening judicial independence against political influence (65%). Lawyers in South Sumatera also frequently mentioned the establishment of clearer performance standards, and raising the salaries of judges. Lawyers in South East Sulawesi were convinced that better laws and regulations were needed to improve court performance (70%). Other possible improvements included higher salaries, better-trained court staff and more judges. Lawyers in South East Sulawesi also expressed their concern about variations in the interpretation of the law.
65

Table 7-1.3
Lawyers’ recommendations on court performance
Recommended actions to improve Court Performance based on Lawyers’ Opinions in South Sumatera Effectiveness %
Respondents Better capacity to detect and punish corruption Very effective 72 Better trained staff Very effective 65 Immunity from political influence Very effective 65 Establishment of clearer performance standards Very effective 61 Higher salaries Very effective 58
Recommended actions to improve Court Performance based on Lawyers’ Opinions in South East Sulawesi Effectiveness %
Respondents Better Laws and Regulations Very effective 70 Better capacity to detect and punish corruption Very effective 69 Higher salaries Very effective 62 Better trained staff Very effective 61 More judges Very effective 59
B. RECOMMENDATIONS BASED ON THE ASSESSMENT The following recommendations are derived from the statistical analysis as well as a careful review of the findings of the assessment by UNODC experts, drawing from experiences in other countries and the conclusions of the Provincial Integrity Meetings for the judiciaries of South Sumatera and South East Sulawesi.
1. Access to Justice
• All users of the courts, whether they were citizens, prisoners or lawyers complained about a lack of information. e.g. the vast majority of prisoners was unaware of the possibility and conditions of bail, and citizen and lawyers found it difficult to obtain information concerning their case. There is a need to provide easily accessible information concerning the basic rights of citizens when coming into contact with the justice system, including on issues relating to bail, justice-related constitutional rights, the code of conduct for judges, etc37.
• Lower-income classes were much less likely to have access to a lawyer. Therefore, there is a need to enhance the effectiveness and availability of legal aid and similar functions for the poorer segments of the population38.
• While in international comparison the average time of 6-12 months required to dispose of cases does not appear overly lengthy, most respondents had
37 Limited knowledge of the law means over 70% of prisoners are unaware about the opportunity of bail, and Cumbersome bureaucracies have made it difficult for lawyers and court users to access information on a case. 38 From the prisoner sample, only 30% are represented by a lawyer. Prisoners with higher education and income have greater access to being represented by a lawyer than those who have a low level of education and income.
66

experienced delays in the court process. The delays were viewed as a form of corruption in the courts, and therefore undermined the respondents confidence in the fairness of the judicial system. Thus, there is a need to reduce the number of adjournments and the total time required to resolve the case.
• In particular in South Sumatera court fees presented a significant obstacle for the poor to access the courts. Hence, consideration should be given to reducing court fees where appropriate.
2. Timeliness and Quality of Justice Delivery
• Delays were particularly frequent in the context of servicing summons on the defendant as well as on witnesses. The establishment and monitoring of servicing times should be considered.
• Respondents complained about the lack of reliability and predictability of the law and its interpretation. There is a need for continuous training of judges on the interpretation and application of the law. Moreover, the Supreme Court should consider the introduction of sentencing guidelines and/or establishing its case law as a nonofficial source of law.
• Roughly a third of the court users interviewed in both provinces found it either difficult or very difficult to report crimes to the police, mostly they were unsatisfied with the overall attention given to the matter, and, in particular in South East Sulawesi, they were highly critical about the protection given by the police against further harassment by the offender. Thus, there is an urgent need to improve the overall effectiveness and efficiency of the police, including instilling a client-oriented approach in its dealings with the public.39
3. Public Trust in the Justice System Public trust is depended on the courts’ ability to deliver justice, in a predictable, affordable and timely fashion. However, any improvements made with regard to this ability will remain in vain as long as citizens continue to encounter wide-spread corruption within the courts. Specific measures aiming at enhancing integrity, transparency and accountability must therefore be adopted as integral part of the overall efforts to strengthen the justice system.
4. Independence, Fairness and Impartiality of the Judiciary The analysis shows a strong relationship between the lack of independence and corruption. A judicial system, which is influenced by politics or by other factors40 is constantly undermined in its integrity and looses its ability to curb corruption. It is therefore crucial to ensure meritocracy within the judiciary with a view to reducing
39 40% of court users considered the police unable to protect them from security disturbances and reported that they were not satisfied with the police service during the process of case reporting. 40 In the last 5 years, more than 50% of respondents (judges, prosecutors, lawyers and court staff) consider that the political factor has been an influencing factor in resolving a case in court.
67
the importance of political influence and other non-merit based considerations in the appointment and career development of judges.
5. Corruption in the Justice System The assessment revealed a strong belief that there is wide-spread corruption in the justice system, which impacts negatively on all aspects of the justice system. The effective prevention and control of corruption within the courts is therefore a pre-condition for any sustainable improvement with regard to access to justice, timeliness and quality of justice delivery, public trust in the courts, and judicial independence, fairness and impartiality. Hence, there is a need to:
• Ensure the creation of the relevant and effective codes of conduct for all justice sector officials, and possibly even those using the courts, to instil the value of integrity in the justice sector. Part of this process should be regular training in professional ethics as enshrined in their respective codes of conduct.
• Increase accountability of judges through more effective and rigorous performance monitoring.
• Involve citizens in holding judges, prosecutors, police and court staff accountable through the establishment of an effective and credible complaints system.
• Limited access to information facilitates corruption. Therefore, citizens must be educated about the nature and conditions of services provide by the courts, their rights as recipients of these services, as well as the means available to voice their complaints.
68