Embed Size (px)
Citation preview
Edith Cowan University Edith Cowan University
Research Online Research Online
Theses: Doctorates and Masters Theses
2018
Assessment of joint kinetics in elite sprint cyclists Assessment of joint kinetics in elite sprint cyclists
Lynne Munro Edith Cowan University
Follow this and additional works at: https://ro.ecu.edu.au/theses
Part of the Sports Sciences Commons
Recommended Citation Recommended Citation Munro, L. (2018). Assessment of joint kinetics in elite sprint cyclists. https://ro.ecu.edu.au/theses/2128
This Thesis is posted at Research Online. https://ro.ecu.edu.au/theses/2128

Edith Cowan University
Copyright Warning
You may print or download ONE copy of this document for the purpose
of your own research or study.
The University does not authorize you to copy, communicate or
otherwise make available electronically to any other person any
copyright material contained on this site.
You are reminded of the following:
Copyright owners are entitled to take legal action against persons who infringe their copyright.
A reproduction of material that is protected by copyright may be a
copyright infringement. Where the reproduction of such material is
done without attribution of authorship, with false attribution of
authorship or the authorship is treated in a derogatory manner,
this may be a breach of the author’s moral rights contained in Part
IX of the Copyright Act 1968 (Cth).
Courts have the power to impose a wide range of civil and criminal
sanctions for infringement of copyright, infringement of moral
rights and other offences under the Copyright Act 1968 (Cth).
Higher penalties may apply, and higher damages may be awarded,
for offences and infringements involving the conversion of material
into digital or electronic form.
Assessment of Joint Kinetics in
Elite Sprint Cyclists
This thesis is presented for the degree of
Doctor of Philosophy
Lynne A. Munro
M.Sc., M.M., B.Eng (Hons), CSCS
Edith Cowan University
School of Medical & Health Sciences
2018

COPYRIGHT AND ACCESS STATEMENT
This copy is the property of Edith Cowan University. However the literary
rights of the author must also be respected. If any passage from this thesis is
quoted or closely paraphrased in a paper or written work prepared by the
user, the source of the passage must be acknowledged in the work. If the user
desires to publish a paper or written work containing passages copied or
closely paraphrased from this thesis, which passages would in total constitute
and infringing copy for the purpose of the Copyright Act, he or she must first
obtain the written permission of the author to do so.

DECLARATION
I certify that this thesis does not, to the best of my knowledge and belief:
i. incorporate without acknowledgement any material previously submitted for a degree
or diploma in any institution of higher education;
ii. contain any material previously published or written by another person except where
due reference is made in the text; or
iii. contain any defamatory material
I also grant permission for the Library at Edith Cowan University to make duplicate
copies of my thesis as required.
Signature:
Date: 19/9/18

In Loving Memory
Fuji Munro
2004-2018
“Blessed”

DEDICATION
To Kenneth George Sinclair Munro.
My dad. Your name on this thesis skips time for me.
In remembrance and gratitude for the life you gave me.
I am so much of you. I am who you made me, and proud that I am like you in so many ways.
I know you are never far and are standing with me through my life.
To Angus R. Adam.
I am your daughter also.
You gave me unconditional love, belief and guidance throughout so much of my life.
I know you are proud of me in this moment. This is what you helped me achieve.
To Laura Melville Munro Adam.
This is so much for you. The strongest, most loving mother I could wish for.
Word are not enough to describe what you continue to give to me every day.
And to my beautiful Fuji.
My little girl, always with me. You are the most special of souls.
This thesis is for these individuals. I am eternally grateful.


i
ACKNOWLEDGEMENTS
When the sun sets and we think about what tomorrow will bring, we understand that better is not we
what do. It is who we are.
In every PhD thesis there is a story. For every PhD scholar ultimately realises that the thesis and
academic body of work are the smallest, almost least significant part of the tale. We grow in these years
through the challenges of life. We are shaped everyday by the hurdles we face, the burdens we bear and
the crags of the cliffs we climb every single day til we reach, in this moment, the top of this particular
mountain. We glimpse the view briefly before continuing our journey with our deepest learning - that
we are resilient beyond all measure and know ourselves to depths greater than ever before. We chose
to face this challenge. And in doing so we said with a loud voice to the Universe “I am ready to grow”.
In facing ourselves and truly learning about who we are, our PhD years have taught us to be people that
can better serve this world.
In losing my dad in the final days of completing this body of work, I convey to you the reader, the
pinnacle of the personal challenges that have presented to me throughout the duration of this PhD.
Throughout the course of these studies I have suffered great loss, challenges and change on a scale that
has shaken my world. I have borne these burdens alone, being tested to my very core and having to find
inner strength to keeping getting back up from the ground time and again. Completing this thesis is,
therefore, a momentous moment in my life. Its meaning is far greater than a PhD. It has been the hardest
of trials, but through my beliefs I know it was meant for me, that I am a better person for it and that I
was guided through every moment. I am incredibly grateful for that unwavering presence and guidance.
This PhD has, literally, changed my life and my gratitude to those that have supported me through can
only partially be expressed by words. Our connection with those we meet on our path I believe is one
of life’s greatest gifts and I have been truly blessed by each one of these people.

ii
It is customary in starting acknowledgements to begin with those who have contributed most to the
thesis i.e. the mentors and supervisors that have shaped your work, growth and development during the
years of completion. However, I will break from tradition in this instance for a valid and important
reason. I lost my dad, Angus R Adam, during the final months of completing this work. I want,
therefore, to give him that privilege. He has been my literary advisor for four such substantial bodies of
work now. Alongside my mum, he has been my guide and supporter, my biggest ally and fan, since
coming into my life following the early demise of my biological father in my teens. For this I am
eternally grateful. I sat at his bedside in the hospice during his final days on this earth, continuing to
write this thesis, allowing him to take part in another of our shared academic journeys that he was
always proud to be part of. To be so close to conclusion of my academic advancement and for him not
to see the finale, is hard to bear. So Angus, I thank you and send love to you from the bottom of my
soul for everything you gave me. You are the most incredible human being and have been everything a
father could ever have been to me. It was my absolute and utmost privilege to be there with you holding
your hand at the end.
My academic panel have been exceptional. In Associate Professor Chris Abbiss I have been fortunate
enough to have a supervisor who is one of the most outstanding members of the academic staff and
most caring and considerate of people I could have ever have hoped for. Chris, you made sure every
step of the way that I had someone on my side who would step with me through this. Thank you for
everything you have done for me and this project. In you, more than anyone, I was always sure had
someone that was part of these studies with me. I always knew I could turn to you and have 100%
support. Without you this project could have foundered many times and your energy for helping me
find solutions never failed. And to Associate Professor Greg Haff, you gave me belief in what I was
capable of and in what I was doing throughout. You helped me find confidence in my abilities and I
always knew you would do everything in your power to help me. Our catch ups and moments of
chewing the fat over so many topics are a favourite part of my time at ECU and you always made me
feel like we were/are doing something really special. I am very grateful for having your support and
iii
passion on my side throughout and for having had this incredible opportunity to be under your tutelage.
I have been fortunate enough to also have the support and guidance of other academic staffs who have
contributed at key points in my project. Dr James Croft, thank you for your direction in learning various
biomechanics systems and software that were central to the project and for your advice in dealing with
the complexities of many aspects of the systems solution. The system design involved me getting up to
speed on so many pieces of software and required a lot of lateral thinking. I’m very grateful for your
input during these, most challenging stages of the project and for your thought provoking suggestions
and ideas. Thanks also to Associate Professor Sophia Nimphius for offering me your time and wisdom
even though I was not officially your student. It was seeing you at a conference in New Zealand that
inspired me to take this path. There are not many female role models in sports science and high
performance coaching and your talk that day gave me the impetus to follow what I felt was my calling.
You always showed such interest in me and my project and I always left our chats having a renewed
sense of purpose and passion for the project and biomechanics in general. Thank you for your inspiration
that has lead me to now be walking the dream I held. Finally thanks to Dr Jodie Cochrane Wilkie for
helping me getting up to speed with Vicon, Professor Anthony Blazevich for our many chats around
the physiology and training of sprint cyclists and Dr Paolo Menaspa for sharing the passion of cycling,
helping me out in Canberra testing and reaching out in friendship so often.
I have been so incredibly fortunate to have the support and backing of both the Australian Cycling Team
(ACT) and the Australian Institute of Sport (AIS) throughout this project. At the inception of the project
Dr Nick Brown saw the potential in both myself and the project while it was still in the formative stages.
Nick, thank you so much for your belief, support and guidance throughout. It gave me great pride to
have you come down into the biomechanics lab of the AIS while testing with the national squad and
have you see this whole thing come to fruition. I am very grateful for your work behind the scenes in
getting the project wider support. I hope you know how beneficial the system and results are continuing
to be for our national programme. Many staffs of the ACT have given support to the project but none
more so than Nick Flyger, Senior National Track Sprint Coach, who has given me mentorship that has
iv
gone above and beyond in so many ways. Nick, I truly cannot thank you enough for your support. From
putting your faith in me to deliver, believing in my potential on a wider level within the sport, to
continuing to make sure that completing this thesis was held as a priority when so many other important
events could have taken the lead. You have given so much to me, the project and this thesis and have
unquestionably been a cornerstone of my development the past couple of years. I thank you
wholeheartedly for everything you have done and, indeed, all the many roles you have played in this. It
is an absolute honour to work with you and the sprint squad.
A number of other staffs and students were critical to successful data collection and analysis. Scott
Baker, Strength and Power Coach for the ACT track sprint squad, gave his committed support to the
project throughout and was central to running the testing days. Thank you Scott, for all your help and
on-going engagement with the project, for showing such a passion for its results and having so much
interest in exploring its benefit to training processes. I have enjoyed the insightful conversations that
have emerged from our explorations around joint kinetics and lifting, talking with you around our data
always excites me about further potential. Adam Hunter, AIS Senior Biomechanist, was critical to the
primary testing week of the national athletes. I am incredibly grateful, Adam, for the expertise, advice
and support you gave. You worked alongside me through that phase and it was so incredibly important
to have someone of your expertise and skill involved. You added your wisdom in so many areas and
most of all made sure that I had all the tools to ensure the testing was executed to the highest of
standards. April Barratt, AIS Lab Manager, also ensured our time at the AIS was well prepared and that
I was provided everything needed to make the sure the testing was successful. It was an absolute
pleasure to work with you April. We all know my findings those weeks at the AIS ran to more than just
the athlete data, and I’m fairly confident me and my testing visits won’t be forgotten at the AIS for
some years to come!!! Thank you for helping manage things so effectively. A number of the AIS PhD
scholars gave their time to run the sessions and I am very thankful to have had so many willing hands.
I’d like to particularly thank Claire Keneally-Dabrowski who, having had previous experience in
running joint kinetic testing with the sprint cycling squad, was just invaluable to giving pointers for
v
smoother data collection and processing. Dr Wayne Spratford similarly provided guidance in that
regards. Wayne, I am also very appreciative of you taking time to spend with me answering wider
biomechanics questions and helping with the testing days. Finally, without my Undergraduate
Practicum student posse the long weeks of testing sessions at ECU could not have happened. In them I
had a team of research assistants covering the multiple roles needed to ensure each session ran
successfully. Special thanks to Marc, Bec, Chris, Lezaan, Michael and Ken, you guys were amazing.
We got the job done so efficiently, had great fun, much learning and awesome tunes keeping us pumped
throughout!
I was similarly fortunate to have the backing of the Western Australian Institute of Sport (WAIS) during
this PhD. I had in Clay Worthington, then WAIS Head Cycling Coach, a coaching ally who imparted
his trust in me to coach and work with his state sprint squad. I could not have hoped for a better
opportunity to grow as a coach, something that was initially a sideline to my sports science studies while
in WA, but yet became in central part of my development and ultimately led to me realising my
vocation. Clay, thank you for those opportunities, I am so appreciative of your trust and support in
making this project happen through WAIS and for bringing me into the fold as an assistant coach to the
programme. Thank you also for those moments and memories we shared along the way, the coaching
sessions, trips and tours, the discussions, jokes and mutual support through many times. It is my
privilege to have worked with you and to now be able to call you ‘friend’. You are an inspiration in
coaching. Thanks are also due to WAIS endurance coach Andrew Jackson for sharing the boards with
me and being a friend and ally throughout. Thanks must also go to Dr Martin Binnie and Dr Peter
Peeling for backing the project as part of the WAIS performance strategy.
The technical support required for this project was quite extensive. Throughout the project we were
devising novel strategies and equipment, overcoming hurdles and solving issues. There were some
incredibly special people who ensured that the brick walls I hit due to technical problems never stalled
me for too long. These people understood how I couldn’t take no for an answer and had to find solutions
vi
where sometimes they didn’t yet exist. Nadija Vrdoljak, ECU Sports Science Lab Manager, you are one
special person indeed. You have been there for me as a constant ally. When every sign said “this cannot
be done” you stood by me and helped me overcome. You helped give me complete confidence that a
solution was possible and, indeed, that I could achieve it. Without your help and willingness to make
sure I had every bit of support possible, I am quite certain I would still be trying to complete. Our chats
have kept me going at times when there was no one else who understood where I was at. We have
ridden the technical wave of this project together and have a lifetime of stories to tell about it! Thank
you for everything you’ve been for me. Helen Alexander, ECU Sports Science Lab Technician, you are
just the most wonderful of humans. You added the most incredibly valued friendship to all the hours of
assistance you gave me through your staff role. The hours in the lab were just the tip of the iceberg of
what you have given to me. You were and are a constant who is always there and always makes sure I
have unconditional care and support day and night. I cannot express how much that has meant and
continues to mean to me. Thanks also to Jude McInerney, ECU Sports Science Lab Technician. You
always welcomed me with a big smile and nothing was ever too much to ask. You made sure I knew I
had a team around me and that I was always welcome in your office. Every part of how you interacted
with me showed me that you would be there in any way you could. I am so incredibly grateful for those
warm welcomes which so frequently happened when I was facing the hardest technical challenges. To
Geoff Wanders, Regional Sales and Service Manager, Kistler Instruments Australia Pty Ltd, who helped
me solve so much of the hardware and system integration requirements. Geoff, you always made
yourself available at the end of the phone, always did everything you could to help solve, answer
questions and explore solutions. Your contribution was key to the system being successful and you
helped me design and construct something that others had previously failed to achieve. I am so thankful
for you having answered calls during many crisis situations! To Tom Kepple, Scott Selbie, and the
support team at C-Motion Inc. and Joan Charmant, Lead Designer at Kinovea. You provided the most
exceptional technical support, helping find unique solutions through your software. Thank you for
engaging and collaborating so readily in this process, your software and solutions were the final pieces
in the puzzle of putting together a working system.
vii
At various times during this project I had to reach out around the world to external advisors in order to
piece together solutions or extend my own knowledge in order to move things forward. I was lucky
enough to have that guidance and no mentor was more valuable than Dr Jim Martin. Jim, since I first
read your research in sprint cycling it has driven me towards this PhD. You taught me the fundamentals
of inverse dynamics at the outset of the project and I was so incredibly fortunate to have you as my
tutor in just the first year of committing to this goal. I am privileged to now have you as someone that
is a most trusted advisor and mentor and so grateful to you for our many chats and emails. Many times
you have created light bulb moments and you always show such willing and desire to help and guide
me. I am incredibly blessed to be able to reach out to you in this way and so very humbled to have been
taught by someone is a world leader in this field.
The people that walk through the world with you as friends and kindred spirits provide you with support
that starts at helping you just get through the day but extends so much deeper into being safety nets,
guru’s, counsellors, advisors as well as sources of trust, release, reflection and spirit-lifting in life. Bec
Wheadon, you have so often been front and centre in that role. We teach each other a great deal and
share an incredibly unique friendship and partnership in life and cycling. I also appreciate your honesty.
I’m sure you might say otherwise! You said to me early on that people arrive in your life at just the
right time. We certainly did and I am so grateful to you for being a constant presence in my day. Denise
Brown, we share a past full of cycling and friendship and it has meant the world to me throughout this
that you would fly round the world to see me and show me that friendship in person. You always did
so at times in this journey where I needed to know I had that importance. Thank you for being there for
me, and for always being available to offer such trusted advice when flying solo means I need to talk
things through with you. Dan Rafferty, my partner in crime for so much of this project. We were a great
team. You were more than an athlete, you are an amazing guy who showed me care and support week-
in week-out through so much of this time. You and Alicia were around often when no one else was.
Carol Knox, our Skype calls got me through the hard days many times. Your love and friendship are
always there and I’m so grateful for you. To Ronnie Newell and the Howards who treated me like family
viii
when I first arrived in Perth. Ronnie, you were all I had when I first stepped off the plane and you gave
me such care and support. I am so appreciative of all your help but also just loved spending time with
you, you really are the most beautiful of humans. Peter Ritchie, who reached out and looked on me as
a most special friend even though we had only just met. I am blessed to know you and so incredibly
thankful to have been given refuge and care by you and Yuki in those early days in Perth. To the Bonser
Clan. You guys have given me a family in Australia and I am so grateful to have that care and support
in my corner. You have always made sure I knew I could “just ask” and you’d be there – knowing I
have that love and support really is a true blessing to me. To Caroline and the Haines family, who have
taken care of me so many times, been there for me when I most needed it, given me genuine love and
friendship and made sure I knew I wasn’t alone. You are truly special and will always mean the world
to me. So many others in the WA track cycling family have given me such valued support and
friendships that I know will be long lasting. Those who I have trained and competed alongside during
these years – Chris, Sara, Fiona, Jarred, Darryl, Kerry, Lionel, Mike, all of you helped ensure I had my
own joy and fun in cycling and wasn’t just ‘the coach’. So many other families who have made sure I
was shown love at the track - The Matthews, Pizaz, Amodts, Richardson, Rowe and Hodges families,
especially you guys for always showing me such care and appreciation. Finally, Trina Reilly. I can’t
not acknowledge you here in this section. Quite simply I wouldn’t have made it through without you.
You held it all together for me and were my primary support system to make it to this point. And here
it is, I made it. Thank you for guiding me through this chapter of my life.
My PhD family needs a separate space. We have shared this walk together. We understand without
words. Tina, Alyce, Vanessa, Sam, Ang, Marcin, Ben, Shane, Alan, Harry, Karen, Jo, Jenny, James and
the 21.501 office, I may have been mostly in and out, heading off and about in my cycling endeavours,
but you guys were always there and your friendship, support and wisdom got me through many days.
Some of you deserve a special mention for taking the MVP to another level entirely. Shantha Karthigesu
- you are my most special friend. I could not have imagined this path without you in it. You and Arushan
have been my family each and every day. We share such a special love and you guys will always have
ix
that place in my heart. Andrew Walsh - what can I say, you have been like a brother to me and kept me
afloat with openness and a true willingness to share and care. You have looked out for me and reached
out to check on me knowing that just a check-in could mean I was able to get through the week. Sofyan
Sahrom – my VICON brother. Man did we get landed with this gig! Thank you for making it something
we both went through together and for being there throughout. Andy Govus – master statistician. Finally
the one guy who got what I needed to do to pull the thing together. Thank you for being the person who
understood that the search for answers needed to reach an end point!
Moving interstate while still finishing a PhD, taking on a split-role, full-time job, and trying to piece
together some kind of temporary home until I could fully move on from Perth, was just about the hardest
finish to a PhD I could have set myself. And as I transferred my life of cycling over to Adelaide I had
more incredible people go out of their way to be there for me. The wonderful Meriel Custance who
helped make sure I had care, friendship and a sense of family local to me once again. Meriel, you are
just the most wonderful human being. You and your family have just been amazing to me and I thank
you from the bottom of my heart for everything you have done to help ensure Adelaide felt like my new
home. To Simone Niejalke and Liz Buckley, my new training buddies, and Jon Buckley, jumping in to
help with stats advice. To my peers at South Australian Sports Institute (SASI) and ACT who I am
fortunate enough to call friends. Both teams are full of the most wonderful, passionate and caring people
and I am so fortunate to have the opportunity to be part of the best team of people I have ever had the
privilege to work with. Special mention to Sian, Jill, Alex, Sue and my LPU training buddies who have
given me laughter and kinship that brought me back to life in the final stages of completing this thesis.
And to my family. First and foremost, my most wonderful mum. You have shown me how to have the
strength and courage to keep stepping forward in life and in my career. You are my constant source of
love and belief. There is nothing that gives me more pride than to be your daughter. My ability to
progress forward in the world is so much because of your support. You listen and care like no other.
x
Your unconditional love is the centre point of my world and I can’t thank you enough. My sister and
nephews, who may be so far but are so much a part of me and never far from my thoughts. You guys
have a love and spirit that binds strong and though you’re not part of my every day, your presence in
my life means the world to me. The rest of the clan Munro and whanau Hogan. Always there and always
showing me what family means. I am blessed to be kin.
I have been lucky enough to travel the world in cycling and every coach, athlete, performance staff,
volunteer and supporter leaves their footprint on you. I have such immense gratitude for that life and
those people contributing to the joy and passion I find in this sport. Within that, and most of all, I leave
my final thanks to the people who provide me the inspiration to do what I do. To all the athletes I have
worked with during this PhD. Thank you to those of you who gave your all to help this PhD live and
breathe: Bec, Dan, TCWA athletes and the athletes of WAIS and ACT sprint squads for your belief and
committed support to this project. Without you the project wouldn’t have happened and this PhD and
its outcomes are so much, therefore, down to you. To my current squad and athletes, who are my own
sprint fam. You keep the inspiration alive every day. Caitlin Ward, you have done far more than just
read a chapter. You know this. You have showed me the absolute essence of what this vocation means
in my life. And I’m quite certain the spirit animal thing is true. This vocation is about having the
opportunity to help athletes find exceptional in themselves. In doing so the coach and athlete build a
relationship that goes deeper than just training, research and data. We impel each other every day to be
better and test ourselves on the world stage in doing so. That opportunity and that connection is my
driver. It is the passion that kept the PhD, and me, rolling. It’s why I did this. So thank you.
And finally. It has been a long journey to this point. The end of this PhD marks the end of one long
chapter and the dawning of another. As that transition draws nearer I have been thrown another great
challenge, having to cross the finish line as one of my beautiful little girls faces her final days. My
three fuzzy kids have been my guardian angels throughout. They have shared this path and lived my

xi
energies every day. So, to those little souls, I owe my greatest gratitude. Lily, Fuji and Diesel, you are
my constant source of love and I am truly blessed to be with you in this world. Fuji, this powerful
moment in time is ours alone to share. You have a bond with me that always showed I was just
irreplaceable in your world. You kept joy and love in my every day and I know you saw me through to
this point. My completion now lets me be with you wholly and in these final days we will walk this
transition together. You will go with so much love and I’ll cherish your life and our bond always.
And so, throughout all of this, there are individuals that I have lost from being part of my every day
along the way. These individuals have shaped me. They have guided me. They have stood with me in
so many forms and so many ways. My heart and soul has gone into this challenge and they contributed
to that heart and soul. They may be gone or less part of my life, but I am grateful for every part of what
they have given and left me with. It remains part of me every day. They say we are only given challenges
that are the measure of what we can handle. I am blessed in having made it through this mountain of a
trial. I am humbled to have been walked through it. And thankful to have peace and closure in its
completion.

xii
ABSTRACT
Sprint cycling requires the production of explosive muscle power outputs up to very high pedalling
rates. The ability to assess muscular function through the course of the sprint would aid training
practices for high-level performers. Inverse dynamics provides a non-invasive means of estimating the
net muscle actions acting across any joint contributing to movement. However, analysis of joint kinetics
requires motion-capture techniques that present some unique challenges for cycling. This thesis presents
three studies investigating the application of a custom-designed force pedal system to examine the joint
kinetics of elite trained track sprint cyclists. To provide the basis for selecting appropriate testing
procedures, study one evaluated differences between two- and three- dimensional techniques while
assessing joint kinetics of seated and standing sprint cycling at optimal cadence (the cadence where
peak power is delivered). Study two examined the impact of cadence and seating position on joint
kinetics, while determining testing reliability using the three-dimensional process. Coefficients of
variation were established for between- and within- days repetitions of sprint performance at optimal
cadence, and cadences 30% lower and 30% higher, in both seated and standing positions. Study three
compared joint kinetics of sprint cycling performance with commonly-applied resistance-training
exercises in an elite cycling cohort, in order to better understand training specificity. Joint-specific
torque-angular velocity relationships were established from seated and standing sprinting at three
cadences and the clean exercise at three loads, with other strength-based exercises examined at maximal
load only.
Study one determined that flattened projections of the 3D motion into 2D resulted in significant
differences in joint powers calculated in the sagittal-plane. When using 2D methods, knee joint power
was significantly lower and hip transfer power significantly greater, while hip range of motion was
lower and the angle where hip peak power occurred later in the crank cycle. These results indicate that
3D processes should be used where evaluation of absolute values are important, although 2D processes
xiii
may still be acceptable where relative differences are being assessed. It was observed in Study two that,
while crank and total muscle power upheld a quadratic power-cadence relationship, joint-specific
powers were uniquely related to cadence and riding position. Crank and joint-specific optimal cadences
for power production were distinctly different. The hip displayed a linear maximum power-cadence
relationship in seated but quadratic in standing position, with the reverse observed at the knee. Ankle
and hip transfer powers both linearly declined with cadence irrespective riding position. In such a case,
joint-specific power contribution, hence distribution of muscular effort, cannot be directly inferred from
power assessed at the crank. Reliability was highest for crank and total muscle power, particularly at
the riders’ optimal cadence. Reliability of joint powers were somewhat lower and uniquely dependent
on joint, joint action and trial condition. Results indicate that external power output at the crank is
relatively stable across sprints, despite variation in the underlying muscular contributions. Results of
study three showed equivalence in the torque-angular velocity relationships at the hip in sprint cycling
and different phases of the clean. No such relationship was evident at the knee or ankle. In contrast to
the negative linear relationships observed in all other conditions, ankle mechanics in sprinting showed
a positive linear relationship highlighting a distinct functional role of this joint. Highest maximal
torques at the hip and knee were observed during unilateral single rack pull and step-up exercises,
respectively, supporting their efficacy for improving the maximum strength characteristics at these
joints.
The results of this thesis indicate that joint kinetics are an effective means of assessing muscular
performance in highly-trained track sprint cyclists and provide information on the underlying strategies
that could not be assessed through conventional testing of power at the crank. The use of 3D processes
is recommended where accuracy of assessment and absolute values are important. Flexibility of 2D
processes may be advantageous in field-based settings and may be acceptable where only relative
change is of interest. High reliability of 3D testing supports its use in monitoring of athletes, with the
reliability data presented in this thesis providing an indication of the smallest meaningful changes in
various trial conditions. Low coefficients of variation observed in crank and muscle power terms,
xiv
despite greater variation in joint powers, suggest motor control strategies dynamically respond to task
conditions while maintaining a consistent external power. Resistance exercises are seen to display joint-
specific profiles that characterise relative hip- or knee- dominance. The comparison of these profiles
with those of sprint cycling can help inform exercise selection for strength development of elite riders.
The ability to monitor changes and target training intervention at joint level provides a unique approach
to athlete development. Outcomes of this thesis support the practical application of joint kinetic
assessment in aiding training practices to the highest levels of competition in track sprint cycling.
Indeed, the equipment, methods and knowledge obtained from this research is currently applied in the
preparation of Australia’s best sprint cyclists.

xv
Table of Contents
ACKNOWLEDGEMENTS ..................................................................................................................... i
ABSTRACT .......................................................................................................................................... xii
1 Introduction .......................................................................................................................................... 1
1.1 Overview ................................................................................................................................. 1
1.2 Background ............................................................................................................................. 1
1.3 Significance of the Research ................................................................................................... 7
1.4 Research Aims ........................................................................................................................ 8
1.4.1 Study One ........................................................................................................................ 8
1.4.2 Study Two ....................................................................................................................... 8
1.4.3 Study Three ..................................................................................................................... 8
1.5 Research Questions and Hypothesis ....................................................................................... 9
1.5.1 Study One ........................................................................................................................ 9
1.5.2 Study Two ....................................................................................................................... 9
1.5.3 Study Three ................................................................................................................... 10
1.6 Limitations ............................................................................................................................ 11
1.7 Delimitations ......................................................................................................................... 11
1.8 Definitions of Terms ............................................................................................................. 12
2 Literature Review .......................................................................................................................... 15
2.1 Introduction ........................................................................................................................... 15
2.2 Athletic Demands of Track Sprint Cycling ........................................................................... 17
2.2.1 Functional Assessment of Athletes ............................................................................... 21
xvi
2.3 Biomechanics of Cycling ...................................................................................................... 24
2.3.1 Bike Set-Up and Pedal Stroke ....................................................................................... 24
2.3.2 Coordination and Recruitment During Pedal Stroke..................................................... 26
2.3.3 Kinematics of the Pedal Stroke ..................................................................................... 30
2.3.4 Upper Body Contribution .............................................................................................. 31
2.3.5 Effects of Workload and Task Demands on the Biomechanics of Pedalling ................ 32
2.4 Measuring Cycling Kinetics and Kinematics ........................................................................ 34
2.4.1 Kinetics ......................................................................................................................... 35
2.4.2 Kinematics .................................................................................................................... 37
2.4.3 Inverse Dynamics Modelling ........................................................................................ 40
2.5 Joint Kinetics in Cycling ....................................................................................................... 44
2.5.1 Effects of Workload and Cadence................................................................................. 46
2.5.2 Effects of Riding Position and Bike Set-Up ................................................................. 53
2.5.3 Effects of Fatigue and Other Influencing Factors ......................................................... 55
2.6 Joint Kinetics in Weightlifting .............................................................................................. 57
2.6.1 Standard Lifts ................................................................................................................ 63
2.6.2 Ballistic and Explosive Lifts ......................................................................................... 67
2.7 Summary and Conclusions.................................................................................................... 69
3 Comparison of 2D and 3D Methodologies in the Assessment of Joint Kinetics in Highly-Trained
Sprint Cyclists ....................................................................................................................................... 71
3.1 Abstract ................................................................................................................................. 71
3.2 Introduction ........................................................................................................................... 72
3.3 Methodology ......................................................................................................................... 75
xvii
3.3.1 Experimental Approach to the Problem ........................................................................ 75
3.3.2 Participants .................................................................................................................... 75
3.3.3 Procedures ..................................................................................................................... 76
3.3.4 Instrumentation ............................................................................................................. 78
3.3.5 Data Analysis ................................................................................................................ 80
3.3.6 Statistical Analysis ........................................................................................................ 82
3.4 Results ................................................................................................................................... 83
3.5 Discussion ............................................................................................................................. 91
3.5.1 Conclusion .................................................................................................................... 99
4 The Effects of Cadence and Riding Position on Joint Kinetics and Testing Reliability of Highly-
Trained Sprint Cyclists ....................................................................................................................... 100
4.1 Abstract ............................................................................................................................... 100
4.2 Introduction ......................................................................................................................... 101
4.3 Methodology ....................................................................................................................... 103
4.3.1 Experimental Approach to the Problem ...................................................................... 103
4.3.2 Participants .................................................................................................................. 104
4.3.3 Procedures ................................................................................................................... 104
4.3.4 Instrumentation ........................................................................................................... 106
4.3.5 Data Analysis .............................................................................................................. 108
4.3.6 Statistical Analysis ...................................................................................................... 109
4.4 Results ................................................................................................................................. 110
4.5 Discussion ........................................................................................................................... 122
4.5.1 Conclusion .................................................................................................................. 128

xviii
5 Comparison of Joint Kinetics in Sprint and Resistance Exercise Performance of Elite Sprint
Cyclists ................................................................................................................................................ 130
5.1 Abstract ............................................................................................................................... 130
5.2 Introduction ......................................................................................................................... 131
5.3 Methodology ....................................................................................................................... 134
5.3.1 Experimental Approach to the Problem ...................................................................... 134
5.3.2 Participants .................................................................................................................. 135
5.3.3 Procedures ................................................................................................................... 135
5.3.4 Instrumentation ........................................................................................................... 138
5.3.5 Data Analysis .............................................................................................................. 140
5.3.6 Statistical Analysis ...................................................................................................... 141
5.4 Results ................................................................................................................................. 143
5.5 Discussion ........................................................................................................................... 156
5.5.1 Conclusion .................................................................................................................. 163
6 Summary, Conclusions and Recommendations .......................................................................... 164
6.1 Thesis Summary and Implications ...................................................................................... 164
6.2 Directions for Future Research ........................................................................................... 175
6.3 Conclusion .......................................................................................................................... 176
7 References ................................................................................................................................... 180
8 Appendices .................................................................................................................................. 214
Appendix A – Contribution of Work .............................................................................................. 214
xix
List of Tables
Table 3.1: Maximum Joint Powers Measured Using 2D and 3D Analysis during All-out Sprinting
both In (IN) and Out (OUT) the Seat .................................................................................................... 87
Table 3.2: Crank Angle at which Maximum Joint Power is Developed Measured Using 2D and 3D
Analysis during All-out Sprinting both In (IN) and Out (OUT) the Seat ............................................. 88
Table 3.3: Mean Joint Powers across the Full Revolution (REV), Extension Phase (EXT) and Flexion
Phase (FLEX) Measured Using 2D and 3D Analysis during All-out Sprinting both In (IN) and Out
(OUT) the Seat ...................................................................................................................................... 89
Table 3.4: Joint Range of Motion Measured Using 2D and 3D Analysis during All-out Sprinting both
In (IN) and Out (OUT) the Seat ............................................................................................................ 90
Table 4.1: Tests of Model Fixed Effects for Maximum Power Averaged Over 5 Full Crank Cycles 111
Table 4.2: Tests of Model Fixed Effects for Mean Power Averaged Over 5 Full Crank Cycles ....... 111
Table 4.3: Tests of Fixed Effects for Mean Power Averaged Over Extension and Flexion Phases of 5
Crank Cycles ....................................................................................................................................... 111
Table 4.4: Model Comparisons for Maximum Power in Seated (IN) and Standing (OUT) Averaged
Over 5 Full Crank Cycles ................................................................................................................... 115
Table 4.5: Model Comparisons for Mean Power in Seated (IN) and Standing (OUT) Averaged Over 5
Full Crank Cycles ............................................................................................................................... 115
Table 4.6: Model Comparisons for Mean Power in Seated (IN) and Standing (OUT) Averaged Over
Extension and Flexion Phases of 5 Crank Cycles ............................................................................... 115
Table 4.7: Coefficients of Variation with 95% Confidence Intervals for Crank, Total Muscle and Hip
Joint Maximum and Mean Power Averaged Over 5 Full Crank Cycles ............................................. 119
Table 4.8: Coefficients of Variation with 95% Confidence Intervals for Knee Joint, Ankle Joint and
Cross-hip Maximum and Mean Power Averaged Over 5 Full Crank Cycles ..................................... 120
Table 4.9: Coefficients of Variation with 95% Confidence Intervals for Hip, Knee and Ankle Joint
Mean Power Averaged Over Extension and Flexion Phases of 5 Crank Cycles ................................ 121

xx
Table 5.1: Tests of Fixed Effects ........................................................................................................ 143
Table 5.2: Parameter Estimates and Model Fit for Hip Maximum Torque ........................................ 145
Table 5.3: Pairwise Comparisons of Exercise Conditions for Hip Maximum Torque ....................... 145
Table 5.4: Parameter Estimates and Model Fit for Hip Mean Torque ................................................ 146
Table 5.5: Pairwise Comparisons of Exercise Conditions for Hip Mean Torque ............................... 146
Table 5.6: Parameter Estimates and Model Fit for Knee Maximum Torque ...................................... 149
Table 5.7: Pairwise Comparisons of Exercise Conditions for Knee Maximum Torque ..................... 149
Table 5.8: Parameter Estimates and Model Fit for Knee Mean Torque ............................................. 150
Table 5.9: Parameter Estimates and Model Fit for Ankle Maximum Torque ..................................... 153
Table 5.10: Pairwise Comparisons of Exercise Conditions for Ankle Maximum Torque.................. 153
Table 5.11: Parameter Estimates and Model Fit for Ankle Mean Torque .......................................... 154
Table 5.12: Pairwise Comparisons of Exercise Conditions for Ankle Mean Torque ......................... 154
xxi
List of Figures
Figure 2.1: Deconstruction of Pedal Power into Muscular and Non-Muscular Components .............. 26
Figure 2.2: Muscle Activity around the Crank Cycle ........................................................................... 27
Figure 3.1: Force Pedal with Markers Defining Pedal Spindle, Fore and Aft Positions ...................... 77
Figure 3.2: Force Pedal Calibration System ......................................................................................... 79
Figure 3.3: Joint Power Ensemble Averages in Each Condition .......................................................... 85
Figure 4.1: Force Pedal with Markers Defining Pedal Spindle, Fore and Aft Positions .................... 105
Figure 4.2: Force Pedal Calibration System ....................................................................................... 108
Figure 4.3: Joint Power Ensemble Averages in Each Condition ........................................................ 112
Figure 4.4: Group Means for Maximum Power Averaged Over 5 Full Crank Cycles ....................... 113
Figure 4.5: Group Means for Mean Power Averaged Over 5 Full Crank Cycles ............................... 113
Figure 4.6: Group Means for Mean Power Averaged Over Extension and Flexion Phases of 5 Crank
Cycles .................................................................................................................................................. 113
Figure 5.1: Force Pedal with Markers Defining Pedal Spindle, Fore and Aft Positions .................... 136
Figure 5.2: Force Pedal Calibration System ....................................................................................... 139
Figure 5.3: Hip Maximum Torque v Angular Velocity Constructed from 3 Cadence Conditions in
Seated and Standing Sprint Cycling and 3 Load Conditions in Cleans. Isolated points are included for
maximum load only in Deadlift, Single Leg Rack Pull, Step-Up, Romanian Deadlift and Hip Thrust
............................................................................................................................................................ 144
Figure 5.4: Hip Mean Torque v Angular Velocity Constructed from 3 Cadence Conditions in Seated
and Standing Sprint Cycling and 3 Load Conditions in Cleans. Isolated points are included for
maximum load only in Deadlift, Single Leg Rack Pull, Step-Up, Romanian Deadlift and Hip Thrust
............................................................................................................................................................ 144
Figure 5.5: Knee Maximum Torque v Angular Velocity Constructed from 3 Cadence Conditions in
Seated and Standing Sprint Cycling and 3 Load Conditions in Cleans. Isolated points are included for

xxii
maximum load only in Deadlift, Single Leg Rack Pull, Step-Up, Romanian Deadlift and Hip Thrust
............................................................................................................................................................ 148
Figure 5.6: Knee Mean Torque v Angular Velocity Constructed from 3 Cadence Conditions in Seated
and Standing Sprint Cycling and 3 Load Conditions in Cleans. Isolated points are included for
maximum load only in Deadlift, Single Leg Rack Pull, Step-Up, Romanian Deadlift and Hip Thrust
............................................................................................................................................................ 148
Figure 5.7: Ankle Maximum Torque v Angular Velocity Constructed from 3 Cadence Conditions in
Seated and Standing Sprint Cycling and 3 Load Conditions in Cleans. Isolated points are included for
maximum load only in Deadlift, Single Leg Rack Pull, Step-Up, Romanian Deadlift and Hip Thrust
............................................................................................................................................................ 152
Figure 5.8: Ankle Mean Torque v Angular Velocity Constructed from 3 Cadence Conditions in Seated
and Standing Sprint Cycling and 3 Load Conditions in Cleans. Isolated points are included for
maximum load only in Deadlift, Single Leg Rack Pull, Step-Up, Romanian Deadlift and Hip Thrust
............................................................................................................................................................ 152
1
1 Introduction
1.1 Overview
This doctoral thesis presents the results of three applied research studies examining joint kinetics in
highly-trained track sprint cyclists during cycling and resistance-training exercises. The overall aim of
the thesis is to investigate the application of a custom-designed force pedal system and dynamic
modelling process to improve understanding of the biomechanics of expert performers in track sprint
cycling, with the wider intention to inform elite training practices for the sport. Study one compared
sagittal-plane joint kinetics determined by simple two-dimensional (2D) techniques with those using a
three-dimensional (3D) system. Given that cycling movement is predominantly in the sagittal plane, the
goal of this study was to determine the extent to which tri-planar assessment processes impact results.
Study two examined the effects of cadence and riding position on joint kinetics, while determining the
reliability of the 3D testing process. This study aimed to quantify the effects of testing conditions on
intra-subject variability. Study three compared the joint kinetics of elite standard track sprint cyclists in
sprint testing and in performance of six resistance exercises commonly prescribed in training. The goals
of this, final, study was to determine which resistance exercises are most biomechanically comparable
to the sprint cycling movement in order to further aid training prescription. Data for the studies were
obtained from testing two squads of athletes over a single testing block in each case. Some common
methodologies are, therefore, shared between the studies. As an inherent part of this project, a novel
system facilitating 3D assessment of cycling biomechanics was engineered and constructed. The
constituent parts and use of the system are described within the methodologies as relevant to the
execution of the studies. However, full details of the electrical and mechanical componentry are out-
with the scope of this thesis and hence are not included.
1.2 Background
In elite sport, performance differences of the smallest margins can distinguish competitive outcomes
[2]. Since the magnitude of training adaptations diminish with advancing training status, the ability to
2
effect small but meaningful gains in performance characteristics is critical to success [3]. Expert
performance requires task specific application of muscular force in creating appropriate movement
patterns. Successful outcomes are dependent on the capacity of the physiological structures involved
and the adoption of effective motor control strategies [4]. Performance improvement, then, requires
prescription of appropriate training interventions to enhance these qualities. The principles of dynamic
correspondence establish criteria supporting the effective transfer of training activities to performance
in a given sport, aiding in the design of training programmes [5]. A well-defined understanding of the
biomechanics of the goal movement is central to this process. In the sport of cycling, performance is
largely delineated by the ability to deliver mechanical power to the crank [6]. In submaximal conditions,
the optimal motor control strategy is a function of reducing metabolic and neuromuscular demand and
maximising mechanical efficiency [7]. In contrast, the unique task demands of sprint cycling require
production of maximal muscle power output [8]. While a substantial body of literature has described
the biomechanics of steady-state cycling, there is currently a paucity of research identifying the unique
characteristics of all-out sprinting [9].
Locomotion in cycling is achieved through the application of pedal force to produce torque at the crank.
Three points of contact (feet, hands and pelvis) provide a loci of force transfer to the bike-rider system
but equally constrain movement within fixed parameters established by bike set-up and rider position
[10]. Bike geometry, rider kinematics, gear ratio and crank length will dictate performance along the
force-length-velocity relation of contributing muscles, while the cyclical pattern of activity further
limits the time available to develop force [11]. The interaction of pedalling rate, i.e. cadence, and crank
length determines linear velocity of the pedal, ultimately establishing shortening velocity of the uni-
articulate muscles contributing to pedal stroke [12]. Selection of gear ratio will affect the cadence range
over which the sprint will be conducted and identification of the impact of cadence on muscle
mechanical performance is, therefore, of substantial interest. Muscle power is the product of muscle
force and contraction velocity, and is governed by the intrinsic properties of the muscle. The
development of maximal external mechanical power, therefore, represents a compromise of muscle
3
function within the imposed limits of operation [13]. In this context, motor control strategy is critical.
Indeed, Wakeling et al. [14] have suggested that coordinative pattern, rather than capabilities of the
individual muscle, is the most important limiting factor to power production.
At any point in the crank cycle, only the proportion of pedal force perpendicular to the crank is effective
in producing crank torque [15]. Driss and Vandevalle [16] suggested, therefore, that muscles have two
distinct task demands in cycling, firstly to produce locomotive force, and secondly to maintain limb
position round the crank cycle. Pedal force effectiveness, the ratio of perpendicular force produced to
total resultant force delivered, is considered representative of the rider’s pedalling technique [17].
However, skilled improvements in pedal stroke apparently have limited influence on enhancing pedal
power [18]. An examination restricted to external force production is, consequently, inadequate for the
purposes of assessing neuromuscular function in highly-trained athletes [19]. In contrast, Hug et al. [20]
observed that, where inter-individual variance in pedal stroke is low in experienced riders, the activity
patterns of contributing muscles were far more divergent. Electromyographical (EMG) studies suggest
that there is, at least, a common sequencing of muscles around the crank cycle [21, 22]. Attempts have
been made to associate changes in the magnitude and timing of activity of contributing muscle groups,
with modifications in the environmental conditions such as workload [23, 24], cadence [25-28], fatigue
[29], bike-set up [30, 31] and riding position [32-34]. However, while there is a clear relationship
between muscle activity and power output, the relationship is not systematically perfect in maximal
conditions. Indeed, Dorel et al. [23], showed that only the triceps surae and quadriceps muscle groups
were activated maximally in sprinting trials. Given the influence of muscle redundancy, the central
nervous system (CNS) has the ability to vary the recruitment strategy in response to environmental
changes, and it is clear that sprinting requires a unique solution to motor control [16, 35].
Assessing the distribution of muscular effort at each joint offers a more intuitive means of assessing
sprint performance. The use of inverse dynamics processes provides a non-invasive means of predicting
4
forces and moments within a linked-segment system, allowing evaluation of the net muscle activity
affecting movement at each joint [36]. Kautz and Hull [37] further demonstrated that the process could
decompose the contribution of muscular and non-muscular (i.e. gravitational and inertial) contributions
to pedal force, benefiting a clear assessment of neuromuscular function in generating external power.
Hip, knee and ankle joints dominate power production at the crank but are augmented by power
generated by the upper body and transferred across the hip [38]. Extensor moments, from approximately
0 to 180° of the crank cycle, are the primary contributors to forward motion; while between roughly
180 and 360°, flexor moments dominate as the pedal returns to top dead centre and contralateral limb
extends [18]. Comparisons of submaximal and maximal pedalling conditions reveal that the task
demands of maximising power output affect an increased contribution of hip extension and knee
flexion, and decreased contribution of knee extension to total muscular power [39]. Martin and Brown
[40] further determined that muscle redundancy was certainly exploited in sprinting, helping prolong
the crank phase of joint extension. Despite the clear differences in sprint performance, only limited
research is available examining joint-specific power in maximal conditions. In the only research
presenting joint kinetic data using sprint-trained participants, results of a case study of a competitive
sprinter suggest that skilled sprinters may have unique functional strategies to aid maximal power
delivery [41]. Wheat and Barratt [42], additionally acknowledge that the morphologies of sprint-, as
compared to endurance- trained riders, would impact the inverse dynamics solutions.
The physical characteristics of sprint cyclists are uniquely specified by the demands of the sport. Sprint
cyclists are more commonly mesomorphic, being heavier, stronger and with larger segmental girths
than their endurance counterparts [43]. Newton’s first principle dictates that the riders must be able to
produce high levels of force in order to affect the explosive accelerations required to attain high end
velocities [44]. Both cross-sectional area of muscle and lower-leg lean volume are related to
performance [16], indicative of the strength capacities required by the athletes. Resistance training
occupies a substantial part of the sprint cyclists’ programme, not only to assist hypertrophic
development but also for the purposes of increasing maximal strength, the ability to exert absolute
5
maximal levels of force, as well as the overall functional capacities of the rider [45, 46]. A significant
body of research has also examined the development of muscle power using resistance training
techniques [47-49], and, indeed, strong relationships exist between measures of maximal power output
assessed in the gym and ballistic sports performance [50-53]. However, ‘strength’ represents the ability
of the athlete to apply force under specific movement conditions [5], and, in such a case, effective use
of resistance training techniques requires a clear understanding of how the movements utilised relate to
movement in the sport. Specificity of a prescribed resistance exercise involves ensuring the muscles are
stressed in similar functional conditions to those of the goal movement, such as the ranges of length and
velocity of operation. With triple extension of the lower-limb providing the primary locomotor force in
cycling, squat-based patterns and derivatives are commonly applied in resistance training [54]. Joint-
specific kinetics have been examined in a number of these exercises with results showing that the
biomechanical demands of the lift, including placement of the load with respect to centre of mass [55,
56], magnitude of the load itself [57, 58], stance width [59, 60], depth [61] and supporting leg position
in unilateral lifts [62], all affect the distribution of muscular effort. Given the number of confounding
factors, as well as the impact of skill level on performance [63], assessment of the lifts in the cyclists
themselves would provide the only accurate means of relating the exercise conditions to the sprint
action.
Joint-specific kinetics, therefore, provide a highly beneficial approach to improving biomechanical
understanding of track sprint cycling athletes. However, the use of inverse dynamics is not without
problem [64]. With movement kinematics, kinetics and rider anthropometry as model inputs, the
process applies Newton-Euler equations to solve for unknown moments and forces within each segment
of the linked system [4]. Segment inertial parameters, positional data tracking, positioning of markers
and/or sensors, location of joint centres, estimation of the centre of pressure location, soft-tissue artifacts
and errors in force plate measurements, all contribute sources of error [42, 65-69]. Testing methodology
is, therefore, critical in minimising inaccuracies. Commercially available 3D motion capture systems
have become the gold-standard for data acquisition and processing, providing high data resolution,

6
accuracy in position tracking and integrated modelling algorithms [70]. However, in these systems,
kinetic information is assumed to be associated with ground reaction forces and therefore kinetic model
inputs are synchronised directly with in-floor force platforms. Bespoke solutions are therefore required
for cycling assessment where forces are produced at the shoe-pedal interface. Given that the cycling
movement is predominantly in the sagittal-plane, 3D assessment of cycling biomechanics has been
assumed as unnecessary [71]. Yet comparison of 2D and 3D analysis methods in other sports has
suggested that the influence of biomechanical coupling, where one direction of movement influences
movement in another direction, can critically affect outcomes [72]. Although lower-limb movement is
predominantly sagittal plane in cycling, sprint cycling is known to have an increased contribution of
power transferred across the hip [73]. Hence the impact of coupling action at the lumbar-pelvic-hip
complex may be significant. Currently few studies exist utilising 3D processes in cycling, yet critical
discrepancies have been quantified in kinematic analysis of cycling between 2D and 3D systems [74].
Two-dimensional analysis imposes some additional errors including oversimplification of movement
patterns, particularly at the hip [75], camera parallax, which impacts segmental lengths during motion,
and the coordinate reference system not being coincident with the true axis of rotation of the joint [76].
These in-accuracies would, therefore, be compounded in the inverse dynamics analysis.
To date, no assessment has been made of the benefits of 3D systems in modelling cycling. The reliability
of data from these biomechanical processes has similarly not been established for cycling research.
Flexibility of the motor domain is critical in sporting action, with the CNS utilising available degrees
of freedom to ensure stability in performance outcomes [5]. Although Martin and Brown have
demonstrated changes in effort distribution with ensuing fatigue during all-out sprint [40], the
consistency of net joint moments in more stable performance conditions is yet to be established. Indeed,
no study has examined intra-individual variability of joint-specific power distribution in repeat
performances of a cycling test. Systematic testing must also be able to differentiate the contribution of
typical process error in order to determine meaningful change in the athletes’ performance [2].
Performance variability in average cycling power has been reported as being as low as 3% [77, 78],

7
leading to recommendations that testing be able to detect smallest worthwhile changes of 1.5% [79].
To be utilised as a regular component of an elite testing battery, results of joint kinetic analysis must,
therefore, be understood in the context of inherent system and athlete variability. In doing so the data
can then serve, not only to provide an understanding of performance and informing training prescription
but can further provide a means of evaluating changes following training intervention.
1.3 Significance of the Research
The system designed to facilitate this research provides a novel solution to 3D biomechanical
assessment of cyclists. This system solution may be used to examine biomechanics of performance on
any cycling ergometer and may be utilised for a wide range of testing and research purposes. Results of
the research presented in this thesis will further our understanding of the biomechanics of highly-trained
track sprint cyclists both on the bike and in performance of key resistance exercises commonly used in
training. This information will provide an assessment of the distinguishing biomechanical
characteristics of highly skilled sprint performance, thereby assisting determination of the training
needs of the athletes. Critically this will aid coaching and support staff to improve prescriptive practices
developing athletes to the highest levels of performance in the sport. Key aspects of the results will
inform the choice of testing practices used for biomechanical assessment. Specifically, athlete support
personnel will have a qualitative means of determining whether a simple 2D system or more
sophisticated 3D testing process is most appropriate for a specific analysis or purpose. Findings
additionally support the accurate interpretation of results from repeat testing of the population, allowing
evaluation of functional change consequent to the training interventions employed. In this context,
variability data will provide practitioners with the means of determining the significance of any
performance changes observed during testing. Hence, athlete progress can be more accurately
monitored, while the effectiveness of training methodologies can be assessed.
8
1.4 Research Aims
This thesis aimed to develop a custom calibrated system in order to investigate the joint kinetics of
sprint cycling performance in highly-trained track sprint cyclists. Key outcomes were, then, to
determine the impact of changing cadence and riding position on joint-power distribution. Further aims
were to determine the accuracy and reliability of the testing methods and outcomes and to assess the
compatibility of key resistance exercises for rider development through comparison of joint kinetics in
each mode of activity.
Specific aims for each study presented were:
1.4.1 Study One
Identify discrepancies between two- and three- dimensional methodologies for joint kinetic
assessment in order to provide recommendations for practical implementation of testing
practices.
1.4.2 Study Two
Assess the effects of changing cadence and riding position on joint-specific kinetics of sprint
cycling performance, while, additionally, determining the reliability of the three-dimensional
test process and evaluating intra-athlete variability in test performance.
1.4.3 Study Three
Assess joint-specific kinetics of key resistance exercises and determine their association to
those of sprint cycling in the same athlete population.
9
1.5 Research Questions and Hypothesis
Research questions (Q) and hypothesis (H) pertaining to each study are as itemised below:
1.5.1 Study One
Q1: Does utilisation of three-, as compared to two- dimensional processes, significantly impact
the assessment of sagittal-plane joint kinetics in high performance sprint cyclists?
H1: Significant differences will be observed between outcomes in each case, suggesting that
utilising a three-dimensional process will increase the accuracy of results.
Q2: Is the magnitude of any apparent difference in three-, as compared to two- dimensional
processes, equivalent at each contributing joint?
H2: The magnitude of difference between three- and two- dimensional analysis will be greatest
at the hip joint, and, to a lesser degree the knee joint, with ankle joint showing little apparent
difference.
1.5.2 Study Two
Q3: Is joint-specific power of the lower limbs during sprint cycling affected by cadence?
H3: Joint-powers will demonstrate a parabolic relationship with cadence, with the cadence at
which peak power is observed being joint-specific. Distribution of joint-power will vary with
cadence, with changes across each joint showing a clear trend with increasing or decreasing
cadence.
Q4: Is joint-specific power affected by changing riding position from seated to standing?
H4: The distinct performance conditions of seated and standing sprinting will affect joint-power
distribution, particularly observing an increased contribution of cross-hip power in the standing
position.
10
Q5: Does a three-dimensional joint kinetic assessment process provide a reliable means of
assessing highly-trained sprint cyclists?
H5: Evaluation of results from repeated testing will demonstrate coefficients of variation (CV)
within acceptable margins of reliability (i.e. CV <10%).
Q6: Are joint-specific powers of expert performers during sprint cycling consistent across
multiple repeats of the test?
H6: A small degree of intra-individual variability will be observed in joint-specific power
across test repetitions.
1.5.3 Study Three
Q7: Is there an association between the joint moment-angular velocity profiles of the hip, knee
and ankle obtained in executing the clean exercise at multiple loads with those of sprint cycling
performance over multiple cadences?
H7: The joint moment-angular velocity profiles of hip, knee and ankle in executing the clean
exercise will have only partial association with those of sprint cycling.
Q8: Does the kinematic profile of a resistance-training exercise impact the distribution of
muscular effort across the contributing joints?
H8: Resistance exercises will vary in the distribution of effort across contributing joints, with
deadlift, Romanian deadlift, hip thrust and single leg rack pull showing greater dominance of
hip joint torque and step up showing greater knee joint torque.
Q9: Does joint-specific torque in various resistance exercises correspond to that in sprint
cycling?
H9: Resistance exercises showing a hip-dominant effort distribution will have greater peak and
mean hip torque than observed in sprint cycling, while greater peak and mean knee torque will
be observed in knee-dominant exercises as compared to sprint cycling.
11
1.6 Limitations
The testing periods of this research were constrained by the training and competitive schedules of the
athletes. Given that athlete training is generally structured with different emphasis through the year, it
is possible that outcomes observed may change during different training phases. Due to the high level
of the athletes within this research, the ability to control individual training schedules of participants
was also limited during the trial periods. Differences in training load and, hence, physical condition
may be present. The necessity of having cabling attached to the pedals, and the requirement to be in a
clear motion-capture space, enforced the use of a stationary cycle ergometer for testing. This limits the
natural lateral sway of the bicycle that would be inherent in performance on the velodrome. However,
research intentions were to characterise the fundamental pedalling patterns of riders rather than
determine the extent to which movement varies in a dynamic environment. Ergometer training is a
component part of the athlete’s training week and athletes are, therefore, highly familiar with
performance on such equipment. The specific ergometer used for the test was as used by the elite squad
in regular testing and training practices. The resistance exercise component of the study was conducted
during a maximal strength training block for the athletes, with exercises representing the key lifts being
utilised in this phase. It is acknowledged that other exercises are commonly utilised in developing sprint
cyclists and would provide an opportunity for future research.
1.7 Delimitations
This research examined only performance in track sprint cyclists at state and national level. While
criteria for participant selection for these studies, therefore, limited the selection pool, the examination
was only intended to be descriptive of this distinct homogenous group. In requiring at least a 2-year
training history exclusively in sprint disciplines, results of the studies are unable to account for
performance of riders from other cycling disciplines or of a mixed training background. It is also likely
that outcomes would be different in athletes of lower performance levels. Sprint cycling performance
was examined under controlled conditions, where, in competitive situations, a number of environmental
12
factors will influence performance. In racing, athletes are also able to choose gear ratio’s to best suit
their physical characteristics. However, the range of test cadences was individualised, providing a
means of matching assessment to these characteristics. The impact of bike-setup would similarly allow
a means of altering an individual’s biomechanical profile. However, high level riders utilise expert bike
fitting services to optimise their bike-set up for competitive performance and the ergometer set up used
in the trials was matched to this data. Hence, in testing maximum performance, tests were completed as
close to their competitive position as possible.
1.8 Definitions of Terms
2D: Two-dimension(al)
3D: Three-dimension(al)
AIC: Akaike information criterion
AJC: Ankle joint centre
AJP: Ankle joint power
AJM: Ankle joint moment
ANOVA: Analysis of variance
ASIS: Anterior superior iliac spine
BIC: Baysian information criterion
BDC: Bottom dead centre (of crank cycle)
CI: Confidence intervals
CNS: Central nervous system
13
COP: Centre of pressure
CSA: Cross sectional area
CT: Computed tomography
CV: Coefficient of Variation
EMD: Electromechanical delay
EMG: Electromyography
F0: Peak isometric force
FV: Force-velocity (relationship)
FL: Force-length (relationship)
GT: Greater trochanter
ID: Inverse dynamics
ISLS: Integrated spatial linkage system
IK: Isokinetic
HJC: Hip joint centre
HJP: Hip joint power
HJM: Hip joint moment
KJC: Knee joint centre
KJP: Knee joint power
KJM: Knee joint moment
LMM: Linear mixed model
P: Power
Pmax
: Maximum power

14
PV: Power-velocity (relationship)
PO: Power output
PSIS: Posterior superior iliac spine
R: Correlation coefficient
R2
: Coefficient of determination
RDL: Romanian deadlift
RFD: Rate of force development
RM: Repetition maximum
RME: Relative muscular effort
RPM: Revolutions per minute
SD: Standard deviation
SRM: Schoberer Rad Meßtechnik (a portable power monitoring system for bicycles)
TPk
: Peak dynamic torque
T0: Peak isometric torque
TDC: Top dead centre (of crank cycle)
Vopt
: Optimal cadence (cadence at peak power)
V0: Maximum unloaded shortening velocity

15
2 Literature Review
2.1 Introduction
The performance capacity of highly-trained athletes has been refined over years of focused practice and
continued performance improvement requires a more advanced training prescription based upon key
principles of specificity [3, 44]. To this end, the principle of dynamic correspondence outlines specific
criteria guiding programming decisions including understanding the timing and direction of force
application, type of muscle contraction, movement strategies employed and direction and sequencing
of joint movements; thus underscoring the need for a thorough biomechanical analysis [5, 80]. While
the biomechanics of steady-state cycling have been frequently reported [10, 30, 81, 82], the unique
characteristics of sprint performance are less well defined [11]. Further, expert performers commonly
exhibit physical and technical proficiencies distinguishing their performance [83, 84], yet, of the
published studies in sprint cycling biomechanics, only a single case study has examined performance
in the track sprint population [41]. Evidence of some unique characteristics highlight that wider
assessment in an elite track sprint cycling population may be more revealing.
Mechanical power output is known to discriminate performance in cycling and the assessment of how
external power is produced and transferred to the bicycle crank is of substantial interest [6, 85].
However, specificity of task demands critically affect the optimal movement strategy. Where economy
and efficiency of movement are important to steady-state cycling [86], sprint cycling requires the athlete
to produce and sustain maximal muscle power [11]. Muscle redundancy allows the central nervous
system (CNS) to determine a recruitment and coordinative solution specific to performance conditions
[35], and, indeed, muscle activity patterns during maximal cycling are different to those observed in
submaximal conditions [16, 23]. At muscle level, the motor control strategy determines both the
magnitude and timing of forces, systemically affecting net force present at each joint as well as the
orientation of the external force delivered [87]. Effective pedal stroke requires orientating the greater
proportion of force perpendicular to the crank [31]. However, as a representative measure, changes in
16
so-called ‘pedal force effectiveness', are not consistently linked to pedal power production [17]. In
contrast, power output does appear to affect the distribution of muscular effort, i.e. how force production
is distributed across the contributing joints - even where pedal force effectiveness remains unaltered
[71]. Examination of joint kinetics, the moment and power produced at joint level, can, therefore, be
more informative. In fact, recent studies have shown some key changes in joint power distribution in
comparing maximal versus submaximal cycling performance [39].
As an explosive sport, sprint cycling demands rapid acceleration, hence the ability to exert high levels
of force production [88]. The use of weightlifting, therefore, features highly in the training week of
sprint cyclists as a means of improving the strength capacities of riders [45, 46]. The predominance of
squat-based patterns in exercise selection assumes an association with lower-limb triple-extension
observed during the primary power delivery phase of the crank cycle [54]. Since off-bike training is
intended to develop functional capacities, there are differences of opinion as to the degree of kinematic
specificity that needs to exist between weightlifting and the sport movement [89, 90]. However, it is
likely that the equivalence in the distribution of muscular effort is more relevant. Joint kinetics have
been described in a number of weightlifting exercises, with results showing some dependence on
aspects of technical application and execution [57, 61, 63, 91]. This emphasises the need for individual
joint kinetic assessment, particularly within populations with refined movement patterns, such as
athletes.
The tools and technologies available to the biomechanics practitioner are constantly evolving and
improved methodologies may provide opportunity to refine analysis through the quality of data
obtained. The seminal research in cycling biomechanics has utilised two-dimensional (2D) motion-
capture systems with a single camera manually synchronised to pedal force data [36, 92-94]. Cutting-
edge mechanical analysis practices now use three-dimensional (3D), multi-camera motion capture
systems, internally synchronised with high resolution force acquisition technologies and packaged with

17
integrated analysis and modelling solutions [70]. While weightlifting studies have made effective use
of this technology [95-97], their use has been of limited interest in cycling, in part due the movement
being predominantly in the sagittal-plane [71]. However, cycling presents unique challenges for
biomechanical evaluation, particularly that external force is applied to a moving pedal. Competitive
cyclists use a cleated pedal system to secure the foot to the pedal, meaning that the shoe-pedal interface
is not directly accessible for force measurement. Furthermore, commercially available motion-capture
systems directly link modelling inputs with ground reaction forces, assumed, therefore, to be derived
from in-floor force platforms [70]. Novel strategies are needed throughout the data acquisition process
to allow a full biomechanical assessment of cycling. To date there has been little research in this regard
and further research exploring innovative solutions is required.
Supporting examination of the sprint-specific disciplines of cycling, this review will focus on the
competitive discipline of track sprinting. The sport will, first, be introduced through presentation of its
athletic demands, focussing on the key factors influencing neuromuscular function. A brief review of
seminal findings in steady-state cycling biomechanics will be presented, providing a reference against
which to, thereafter, assess differences in sprint performance. A discussion of methodologies and issues
in analysing cycling biomechanics will be included with key review content then focussing on
examining the application of joint kinetic analysis in both cycling and weightlifting, with particular
relevance to the assessment of track sprint cyclists.
2.2 Athletic Demands of Track Sprint Cycling
World-standard track sprint cycling encompasses a number of events of different length and format.
Distinct from the track endurance events, sprint competition involves short, fixed-distance races where
riders accelerate to maximal velocity from standing, rolling or flying start. Sprinters compete in rides
against the clock, such as the flying 200m qualifier ride (elite times being <10s men, and <11s women)
and individual 500m (women, ~34s) or 1000m (men, ~60s) time trials, as well as tactical rides against
18
other opponents including the match sprint, where two riders challenge each other over three laps, and
kierin, where 6-8 riders are paced by motorbike up to the final three sprint laps [54]. In these tactical
contests the length and duration of the final sprint is dependent on tactical approach employed. Typical
competitions also require rapid recovery in order to sustain performance over multiple heats and rounds
within a single day. Finally, the team sprint event uniquely highlights the varied conditioning
requirements for sprint cycling. Held over two laps for women and three for men, the team members
ride in-line, each taking the front for a single lap before pulling off. The event therefore requires distinct
rider profiles, from the explosive, high force characteristics of a starter to the sustained speed-endurance
qualities of the finisher [98]. Given the unique demands of the various sprint disciplines, athletes may
compete as an all-rounder across the events or may become specialists in particular races. It is
noteworthy that the wind-up and tactical prelude laps of sprint events additionally infers a substantial
sub-maximal component to rider conditioning [99].
Performance in sprint cycling is ultimately determined by the balance of power supply and demand
[11]. Power supplied is determined by the contractile properties of the contributing muscles mediated
by fatigue, pedalling rate and riding position [8, 13]. The distribution of energy sources for muscle
contraction varies across the sprint events, with shorter distance events critically dependent on the both
the PCr and Glycolytic systems, while longer sprint distances involve a more substantial aerobic
contribution [98]. Power demand includes overcoming air, rolling and bearing/drive-train resistances
as well as accounting for changes in kinetic and potential energy related to mass, gravity, inertia and
velocity. The impact of aerodynamics on cycling is emphatic, with the air resistance term accounting
for a substantial 96% of available power when travelling at steady-state velocity on a flat surface [11].
At the outset of the sprint, where velocity is low, riders adopt a standing position which increases power
delivered to the bike, power surplus then affecting an increase in kinetic energy [73]. At maximal
velocity, where air resistance terms dominate, riders maintain a seated and aerodynamic position. The
tucked position, though compromising function of the musculature of the hip, reduces frontal area,
ultimately benefiting performance [100]. Critical trade-offs are, therefore, apparent in the ideal
19
functional and anthropometric characteristics of riders. The mesomorphic profile of sprint cyclists are
representative of their capacity for force production [43]. However, increased cross-sectional area
(CSA) may alternatively detrimental through increasing aerodynamic drag [101].
Sprint cycling requires the production of maximal forces to affect explosive accelerations [88].
However, riders must also be able to sustain the high velocities attained over extended distances. The
fixed gearing of track bikes provide a unique challenge in that the gear selection imposes a compromise
between the force required to overcome inertial load and accelerate from low or zero velocity, and the
leg speed required to maintain peak velocity later in the sprint. A small gear will facilitate fast start
times but establishes a higher, and potentially less effective, race cadence thereafter [101].
Notwithstanding a gear selection attuned to the athlete’s physical attributes, performance over the
course of a sprint demands function across a wide range of the power-force-velocity relationship. Elite
riders will generate peak crank torques of over 250Nm in initiating a maximal acceleration and peak
pedal rates of over 160rpm by the final stages of the sprint [98, 99, 102]. During acceleration, power
will initially rise to a peak (around 2000-2500W in elite males and 1400-1600 in elite females), before
declining towards maximum velocity and being sustained against ensuing fatigue during the velocity
maintenance phase [98]. Literature commonly ascribes optimal cadence, the pedal rate at which peak
power is developed, as being between 120 and 130rpm [11]. However, maximum external power output
represents a compromise in the summated power-velocity relationships of contributing muscles and is
therefore dependent on muscle contractile characteristics and coordination pattern [8]. Since it is
uniquely specified, identifying the riders’ optimal cadence provides valuable data to inform gear
selection and is a key metric that is responsive to training adaptation [101]. Given that higher cadences
are on the descending limb of the power-velocity curve, competition trends have supported shifts to
bigger gearing and lower race cadences [101]. The use of larger gears is additionally supported by
observations that fatigue may be influenced by the number of contractions required to complete the race
distance [103]. Although a higher gear allows the rider to travel further with each pedal stroke, the
increased force requirement further accentuates the demand for high strength capacity in the athlete.
20
In order to maximise the development of sprint cyclists’ strength, specific structural and neural
adaptations are necessary to improve contractile function. The importance of body composition has
already been highlighted and changes in CSA, muscle mass and muscle architecture are primary training
goals [45, 46]. The relationship of CSA to force production is well established, higher physiological
CSA representing greater number of muscle fibres in parallel [104]. Strong relationships have also been
observed between lower limb lean muscle volume and maximal cycling power [11]. However, a critical
trade-off must be assessed in avoiding excessive size which may be detrimental to aerodynamics.
Maximal strength training, seeking to improve the athlete’s ability to exert absolute maximal levels of
force, will emphasise neural adaptations such as increased motor unit activation, higher motor unit
discharge frequency, greater motor unit synchronisation and recruitment coordination [105]. Explosive
performance is also dependent on the ability to produce force during critical time periods [106]. This is
particularly important in cycling given the crank cycle limits time available to develop force. For
example, at 120rpm time available for contraction, i.e. half the cycle, would be 250ms, yet knee
extensors have been shown to take >300ms to reach peak force [107]. With increasing cadence, the
dynamics of force development and relaxation become critical limiting factors [16, 108]. Specific
strength training prescription can affect a number of adaptations known to benefit the rate of force
development (RFD) [109]. However, of particular relevance is the relationship of RFD to connective
tissue stiffness. Improvements in tissue stiffness are commonly observed following resistance training
and have been shown to positively impact RFD [110, 111]. In cycling, Watsford et al. [112] noted that
riders with higher musculoarticular stiffness have a superior ability to develop effective crank torque
during sprinting. Ditroilio et al. [113] also noted that stiffness characteristics impact that ability to
maintain sprint performance during fatigue.
Given the importance of rider strength characteristics, sprint cyclists dedicate a substantial amount of
the training week to resistance training sessions. Riders’ must have advanced movement competency
in a range of resistance exercises, particularly those that match the kinematics of the downward joint-
extension phase of the crank cycle [54]. Squat and deadlift variations, as well as seated leg-press, are
21
common for pure strength development, while jumps and weightlifting movements are incorporated to
aid development of muscular power. The exact content of the resistance training component, is,
however, highly dependent on coaching ethos. For example, the use of either unilateral or bilateral squat
patterns is hotly attested. Regardless, movement pattern specificity, maximum absolute exercise load
and ability to affect maximal recruitment are key considerations when constructing a resistance training
intervention for the sprint cyclist [114]. One area of consideration that is not clearly understood is
whether matching critical joint angles and movement velocities during resistance training aid the
transference of training effects to the sport [5]. Although some relationship of performance in
weightlifting exercises to sprint cycling performance have been reported in the scientific literature [88],
it is rather the overall functional capacity of the rider’s in key lifts that is important to supporting the
demands of the sport. Finally, it should be noted, that while the lower limb provides primary force
production in cycling, the musculature of the upper body plays a significant role in force transference
to the bike. In fact, Costes et al. [115] determined that increases in crank power are associated with
higher magnitudes of upper limb kinetics, while McDaniel et al. [116] reported that at least 9% of the
total contribution of pedal force in seated sprinting is known to derive from force transmission across
the hip. In such a case, the strength capacities of the upper limb segments and torso musculature are
also critical in enhancing rapid force production.
2.2.1 Functional Assessment of Athletes
The functional profile of athletes can be described by their power-force-velocity relationship [117].
Peak mechanical power is a key discriminator of sprinting ability and can be assessed directly on a bike
or cycle ergometer in short (e.g. ̴ 6-second) all-out efforts [16]. Using appropriate protocols and
instrumentation, the individual’s unique mechanical profile can be derived from the contributing factors
of force and velocity during pedalling. In controlled laboratory conditions, a number of protocols have
been utilised including repeated sprints on friction-braked ergometers against set braking forces [118],
and isokinetic ergometers [119] at multiple cadence, as well as single all-out tests against an appropriate
inertial load [120]. Tests alternatively capture data after reaching maximal velocity in the sprint [16] or

22
during the acceleratory phase [121]. High reliability is generally observed during such tests irrespective
of the ergometer or protocol [16]. Within days and between days reliability has been established in both
isokinetic (interday and intraday test-retest correlation coefficient, r > 0.9 for peak power) [119, 122]
and inertial load tests (e.g. peak power interday r = 0.99, intraday r = 0.97) [120, 123]. Force-velocity
profiles have also been presented from field-based performances of all-out sprinting over 65m [124]
and 80m [125] on gear-ratios providing a fixed inertial load. Comparisons have been made of functional
profiles derived from laboratory- and field- based assessments [124, 126]. Although Bertucci et al. [126]
found some distinction between profiles derived using a stationary-mounted standard racing bike with
that in field performance, Gardiner et al. [124] compared maximal torque- and power- pedalling rate
relationships using a laboratory-based ergometer with those on moving bicycles and found lack of any
significant difference in either regression coefficients or calculated variables. The Gardner et al. results
are noteworthy for the current studies, having critically examined a specifically elite track sprint cycling
cohort and, indeed, utilising an ergometer commonly used by this population in training.
A number of key functional descriptors can be derived in addition to maximal power (Pmax) from force-
or torque- velocity testing. Optimal cadence (Vopt) is notably related to fibre type distribution [127, 128]
and has been proposed as a surrogate means of fibre-type testing. Extrapolation of the force-velocity
(FV) regression line allows for the prediction of maximal isometric force (F0) and maximal unloaded
velocity (V0), with the slope of the regression analysis then uniquely specifying the individuals’
functional characteristic [129]. Driss et al. [118] showed that F0 is related to a rider’s strength
characteristics, showing a significant relationship between the indice and knee extensor force
production. Additionally, Jaafer et al. [130] showed that the value of F0 was highly reliable in repeat
testing on a friction-loaded ergometer, while V0 demonstrated more divergence. Representing the
shortening velocity of the fastest muscle fibres, Sasaki and Ishii [131] have demonstrated that, in vivo,
the value of V0 is affected by recruitment pattern. In such cases this may reflect the challenge of
affecting a consistent and successful control strategy in high leg speed pedalling [41]. Although
Bertucci et al. [132] were unable able to delineate performance level using these ‘classical’ profile

23
parameters, the authors established further parameters from the functional relationships, including
maximal power duration criteria, that uniquely distinguished the pedalling characteristics of elite
performers.
The bike, of course, provides the ideal monitoring tool. However, since a large component of sprint
cyclists’ training is conducted in the weight room, monitoring of performance progression in this
environment is also important. In many sports, weight-room based testing utilises loaded or unloaded
jumps to assess mechanical power, with such tests providing an indicative measure of the contribution
of stretch-shortening cycle function to force production [133, 134]. Their relevance in a predominantly
concentric sport is less clear, in fact, maximal power in a single jump test is not consistently related to
that assessed on the bike [127, 135-139]. While isometric force production in both single- and multi-
joint leg extension has been shown to be related to sprint cycling performance [9, 88], disparity is known
to exist between maximal strength expressed by athletes in dynamic lifts and their on-bike performance.
Functional FV profiles can be derived during resistance exercise performance from force and positional
transducers during execution of multi-joint lifts at incremental loads [140, 141]. In-keeping with bike
tests, results in the leg press [142], multi-joint leg extension [143], jump squats [144], squats [145] and
ballistic pushoffs [117], have demonstrated a quasi-linear relationship, contrasting the classic parabolic
Hill relationship observed in isolated muscles [146]. In weightlifting this has been explained by the
influence of segmental dynamics, increasingly cancelling muscle force production at higher limb
velocities [142]. Cycling characteristics are, instead, critically affected by activation dynamics, with the
relatively slow rise and decay time of the muscle active state increasingly impeding force production as
pedal rate increases, limiting time available [8, 147, 148]. Such differences make comparison of
function expressed in the two modalities challenging at system level. Indeed the disparate means of
deriving external ‘force’ ( i.e. braking force or acceleratory torque at a flywheel, crank torque, pedal
force at the drive train, or ground reaction force, which may or may not include body mass with load),
is similarly obstructive. In this regard it is worth noting, that, although the FV profiles in cycling
represent combined action of both flexor and extensor torques, Dorel [149] confirmed that the profiles

24
produced by distinct extension and flexion phases of the crank cycle are similarly linear. It is apparent
that gaps exist in understanding the association of on- and off- bike training. Bridging that gap would
help improve the application of gym training for sprint cyclists, and provide the basis for a more
meaningful interpretation of functional changes affected through gym intervention.
2.3 Biomechanics of Cycling
2.3.1 Bike Set-Up and Pedal Stroke
Cycling biomechanics are fundamentally characterised by the interaction of bike and rider. The bike-
rider interface constrains a number of aspects of biomechanics through, for example, bike geometry and
set-up, gear selection and crank length [13]. Establishing the correct bike fit is critical given that it
affects the ranges of motion through which the limbs can travel and hence operation along the force-
length (FL) relationships of muscles [150, 151]. A number of aspects can be altered, of which seat
height and set back (distance behind the crank bottom bracket) have been most frequently examined,
given their impact on positioning and hence kinematics and kinetics of performance [152-154]. Gearing
and crank length also effect muscle operation, both critically impacting pedal speed, which ultimately
determines shortening velocity of the uniarticulate muscles, and pedal rate, which affects muscle
excitation state [155]. Crank length has generally been considered as influencing power production
since it represents the moment arm about which pedal force acts. However, Martin et al. [12] determined
that, in cyclical activities, force production does not vary in a purely velocity-dependent manner, but is
interactively affected by the time-dependent effects on activation state. With longer cranks, maximal
power is achieved at lower pedal rates but at higher pedal velocities, power production being distinctly
affected by two different physiological constraints. Consequently, while crank length has been
confirmed as affecting metabolic cost, Martin et al. [156] determined that crank length actually only
substantially affected maximal power at extremes of length. The authors determined that standard crank
lengths used in practice (e.g. 170mm) would only compromise taller and shorter riders’ performance
by at most 0.5%.
25
To achieve maximum crank torque, application of force requires coordinating the limbs to deliver the
greater percentage tangential to the crank [157]. Pedalling technique is therefore considered a skilled
aspect of cycling performance, with ‘pedal stroke effectiveness’, the ratio of effective force (normal to
the pedal) to total force, referenced as a representative measure [17]. Motor control strategy affects
timing and activation of contributing muscles not only to deliver maximum force, but to ensure
movement kinematics of lower limb segments match the pedal trajectory [158]. While, Korff et al. [159]
demonstrated that a more effective pedal stroke can benefit mechanical efficiency (power output to
physiological cost), Bini and Diefenthaeler [160] determined that improving pedalling technique alone
cannot benefit power generation. Using pedal force as the basis for understanding cycling kinetics is
further confounded by observations that total force consists of both muscular and non-muscular
(gravitational and inertial) components (Figure 2.1). Although it is recognised that most of the effective
force, and hence positive power, is generated during the downstroke, the assumption that poor pedalling
technique can affect negative power during the upstroke is misguided [1]. Deconstructing the force
contributions shows that most of the negative power observed is due to gravity. Examination of
intentional alterations in pedalling technique, further shows that improving pedal force effectiveness
does not necessarily mean a more beneficial movement strategy [159]. For example increased pulling
action results in a higher contribution of leg flexors, which ultimately prove to be less efficient
musculature. Evaluation of kinetics at the pedal alone is insufficient for the purposes of a full
biomechanical analysis.
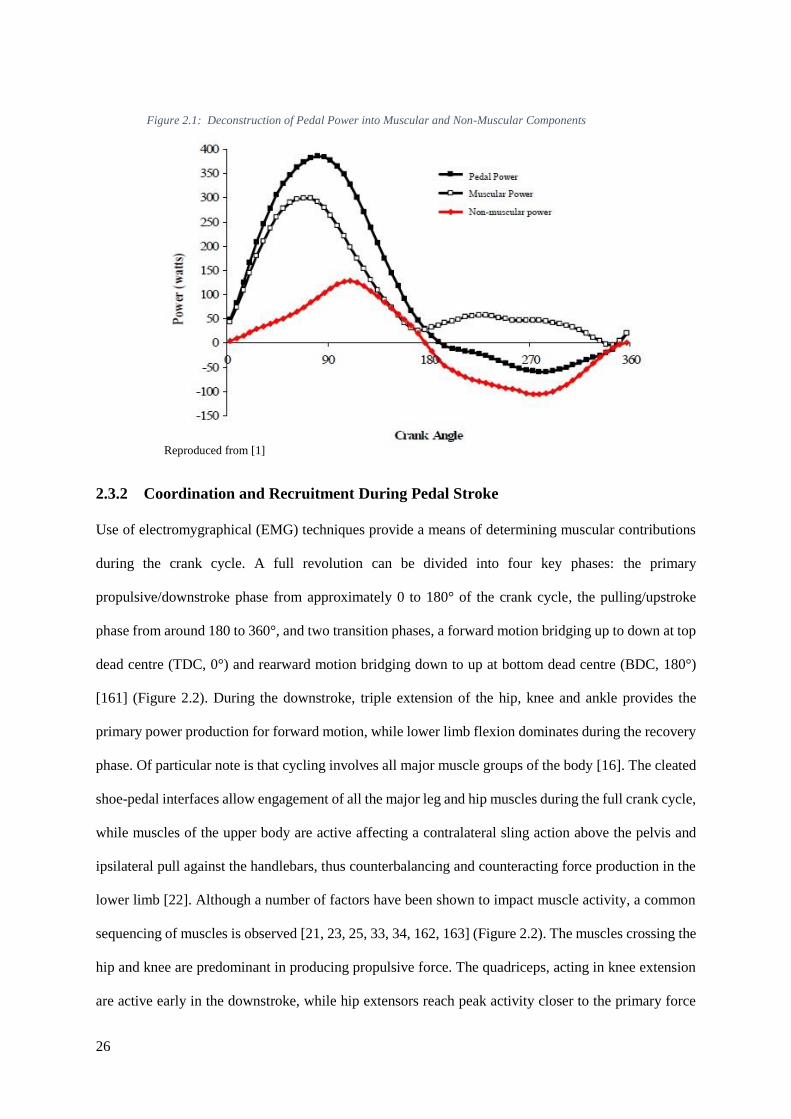
26
2.3.2 Coordination and Recruitment During Pedal Stroke
Use of electromygraphical (EMG) techniques provide a means of determining muscular contributions
during the crank cycle. A full revolution can be divided into four key phases: the primary
propulsive/downstroke phase from approximately 0 to 180° of the crank cycle, the pulling/upstroke
phase from around 180 to 360°, and two transition phases, a forward motion bridging up to down at top
dead centre (TDC, 0°) and rearward motion bridging down to up at bottom dead centre (BDC, 180°)
[161] (Figure 2.2). During the downstroke, triple extension of the hip, knee and ankle provides the
primary power production for forward motion, while lower limb flexion dominates during the recovery
phase. Of particular note is that cycling involves all major muscle groups of the body [16]. The cleated
shoe-pedal interfaces allow engagement of all the major leg and hip muscles during the full crank cycle,
while muscles of the upper body are active affecting a contralateral sling action above the pelvis and
ipsilateral pull against the handlebars, thus counterbalancing and counteracting force production in the
lower limb [22]. Although a number of factors have been shown to impact muscle activity, a common
sequencing of muscles is observed [21, 23, 25, 33, 34, 162, 163] (Figure 2.2). The muscles crossing the
hip and knee are predominant in producing propulsive force. The quadriceps, acting in knee extension
are active early in the downstroke, while hip extensors reach peak activity closer to the primary force
Figure 2.1: Deconstruction of Pedal Power into Muscular and Non-Muscular Components
Reproduced from [1]
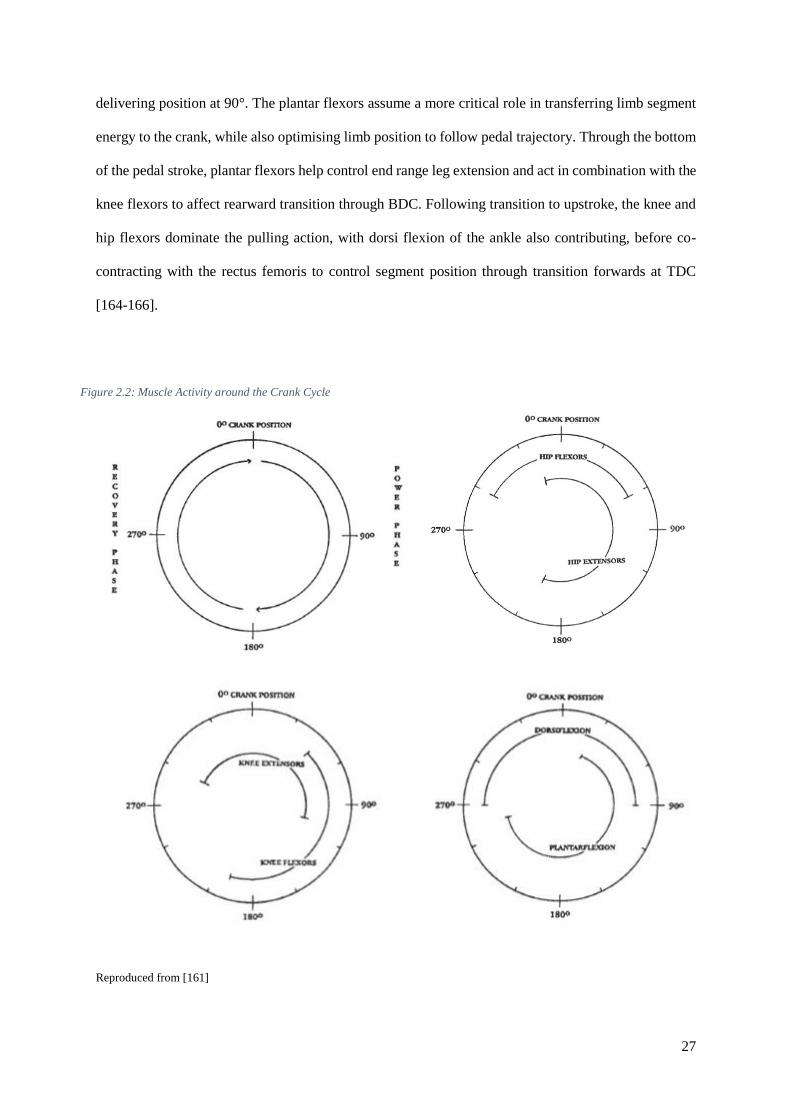
27
delivering position at 90°. The plantar flexors assume a more critical role in transferring limb segment
energy to the crank, while also optimising limb position to follow pedal trajectory. Through the bottom
of the pedal stroke, plantar flexors help control end range leg extension and act in combination with the
knee flexors to affect rearward transition through BDC. Following transition to upstroke, the knee and
hip flexors dominate the pulling action, with dorsi flexion of the ankle also contributing, before co-
contracting with the rectus femoris to control segment position through transition forwards at TDC
[164-166].
Reproduced from [161]
Figure 2.2: Muscle Activity around the Crank Cycle
28
Analysing muscle activity around the crank cycle, it is apparent that the uniarticulate muscles are the
primary power producers, while the biarticulate muscles more ostensibly contribute to limb positioning,
effective distribution of force between segments and fine control of net joint moments [22, 166]. Two-
joint muscle activity is seen to be more highly variable than uniarticulate muscle activity, suggestive of
their disparate roles in motor control strategies [16]. Co-contractions involving biarticulate muscles are
observed at a number of key phases during the crank cycle to enhance control, steer transition at TDC
and BDC and support joint stabilisation [165, 166]. The impact of such co-contractions can be seen to
alternatively affect net extensor or flexor torques, and, hence, also directly impact pedal force
production [167, 168]. The ankle proves to be a unique joint with respect to motor control solutions
[40]. Modelling of muscle excitation has determined that the extent of joint motion at the ankle may
depend on its primary task demands, i.e. whether it is acting to increase stiffness and stability for force
transference, store and release energy, or fine tune overall limb kinematics to maximise power
production and delivery to the pedal [22]. Martin and Brown [40] observed a reduction in ankle range
of motion under conditions of fatigue, and determined that, since the ankle ultimately transfers all
muscular power to the pedal, a stiffer ankle joint would minimise power loss, and, by reducing degrees
of freedom, simplify task demands. Modifications of ankle position also apparently allow the extension
phase to be extended benefiting increased power through the downstroke.
Electromyographical studies have demonstrated alterations in relative timing and coordination of
muscle activity in response to increasing limb speed [27]. Electromechanical delay represents a
relatively greater part of the pedal stroke at higher cadences, provoking suggestion that control strategies
may advance onset timing in an attempt to maintain peak force delivery at optimal crank angles [27].
This so-called “activation dynamics” hypothesis has been proposed as the primary muscle property
limiting performance [169] and forward dynamics modelling has further inferred its importance in
determining optimal cadence [8]. Although the effects of excitation and relaxation on power output is
irrefutable, the association with coordination strategies has been challenged; studies have observed

29
retardation of peak torque or peak power angle with cadence, while results with respect to muscle
activation timing are equivocal [148]. Ettema et al. [170] and Baum and Li [171] both present evidence
that excitations of lower limb muscles are disparately affected by cadence, meaning coordinative
strategy is certainly altered. Proximal to distal differences in activity changes consequently led to
questions around the influence of limb inertia [25]. Baum [172] decoupled the effects of movement
speed and inertia by contrasting performance at multiple cadences with performance where weight was
added to the distal thigh. Results suggest movement speed affects activity time, while limb inertia affects
activity magnitude. There is no doubt that high movement speeds present a unique motor control
challenge. EMG studies have demonstrated increasing antagonist activity and greater variability of
patterns with higher cadences [22, 173]. Increases in negative work, highlighting the need for greater
control of movement, have also been observed at fast limb speeds [94].
Refined skill development might suggest coordinative pattern be more consistent in expert performers.
However, Hug et al. [20] observed a high degree of variability in the activation patterns of highly trained
cyclists that was particularly prominent in the recovery phase of the crank cycle. Muscle redundancy
further confounds assessment of consistent patterns of muscle force production during motion. The
study of motor control suggests that recruitment strategies may utilise synergetic groups to alleviate the
complexity of motor control associated with skilled performance [35]. The phases of the pedal stroke
have led to a number of authors proposing that motor control strategies consist of activating distinct
functional groups around the crank cycle [174, 175]. Using forward dynamics processes, Raasch et al.
[166] determined that cycling performance could be modelled by two contralaterally alternating
agonist-antagonist groups (hip-knee flexors, hip-knee extensors). However, Hug et al. [174] assessed
EMG signals during both submaximal and maximal pedalling conditions, applying a decomposition
algorithm to determine the weighting of muscles within synergetic groups (“Muscle synergy vector”)
and relative contribution of an observed synergy to the activity pattern (“Synergy activation
coefficient”). Results determined that variability across a range of torque-velocity and posture
conditions could be explained by three synergetic groups. However, it is yet to be established whether
30
motor control solutions do indeed reflect the action of muscle synergies, as opposed to simply being an
optimisation function that acts to minimise motor effort [35]. Understanding the characteristics of elite
function through coordination strategy is, consequently, problematic.
2.3.3 Kinematics of the Pedal Stroke
The kinematics of cycling can be assessed by tracking limb segments and pedal motion using either
single- (2D) or multi- (3D) camera motion-capture systems. As a predominantly sagittal-plane motion,
most studies have concentrated on two-dimensional patterns [71], with displacements, velocities and
accelerations significantly influenced by riding position [34, 176], bike set-up [32, 152, 177], workload
[81], cadence [178] and fatigue [160]. Critical differences are observed in sagittal plane joint angles
when using 3D as compared to 2D video analysis, suggesting increased accuracy of 3D methodologies
[74]. Internal and external tibial rotation [179], hip adduction [81], frontal plane motion of the knee
[180], inversion and eversion of the foot [181], and other motions out with the sagittal plane have also
been observed and assessed [182], albeit more particularly referenced to injury predisposition than
cycling performance. Limb trajectories, mediated by seat position, fundamentally influence the patterns
of force production through FL and FV relationships [183, 184]. With seat height additionally impacting
the flexion/extension ratios of the lower limb joints, methods for achieving optimal bike-set up are
critical when attempting to maximise power production [31, 177]. Describing motion around the crank
cycle, standard crank trajectory observes a circular motion through 360°, with pedal orientation
assuming a sinusoidal pattern varying from ̴ 65° to 115° angle over a full revolution [185]. Pedalling
cadence and crank length also dictate velocity at the pedal. In seated pedalling the excursion of the hip
during the crank cycle is around 38-45°, while knee excursion ranges from 66-75°. Ultimately,
however, the excursion of the hip and knee is impacted by the riding position [161]. The thigh never
reaches vertical orientation and, in fact, neither the hip nor knee achieve full extension. Seated pedalling
sees the hip joint centre constrained to remaining behind the crank spindle, while in standing the rider
moves the hip towards the handlebars [176]. Effects of removing this constraint are substantial, with
far greater joint ranges of motion observed across the lower limb joints when in standing position [186].
31
Descriptions of ankle range of motion are more divergent than those of the hip and knee. Krause et al.
[176] presented increases from 17-20° in seated pedalling to 25° in standing, while Shemmel and Neal
[187] observed a 25° to 40° increase moving from seated to standing. In the seated riding position the
ankle transitions between dorsi- and plantar- flexion, while the standing position requires the ankle to
remain in plantarflexion contributing little to the pull pattern during upstroke. Based upon these data
Shemmel and Neal [187] highlight this would increase contribution of the plantarflexors to pedal force
during standing.
2.3.4 Upper Body Contribution
While upper body motion is, to an extent, constrained by gripping the handlebars, the high contribution
of hip joint reaction forces to pedal power suggests a substantial impact of upper body dynamics [116].
Transition from seated to standing is further known to affect an increase in upper body contribution
[115]. Upper body position also uniquely influences both internal and external factors associated with
power production [188]; trunk angle and forward lean are known to affect both force development in
the lower limb, as well as aerodynamics through frontal area, in other words critically affecting the
trade-off between power supply and demand. Savelberg et al. [34] determined that upper body position
had a significant impact not only on lower body kinematics but on patterns of lower limb muscle
activity. Observing that ankle musculature (though notably not knee) was particularly affected, the
authors suggest that changes in FL operation of the muscles crossing the hip may alter joint torque
distributions and, consequently, operation of more distal muscles. This appears to be confirmed by
Emanuelle et al. [188], who observed changes in joint-specific powers when shifting from an upright
to dropped/racing position. Savelberg et al. [34] further observed that upper body position influenced
the extent to which eccentric activity is observed through the pedal stroke. Although the bike itself is a
constraint that limits full limb extension and hence contribution of elastic tissue properties to force
production [189, 190], there is apparently some ability to modify conditions for energy storage and
release.
32
Upper body motion is also discriminatory of skill level. Participants of lower training status show a
greater propensity for changes in neuromuscular control due to body position [32], while greater lateral
and rotational spinal movement has also been observed in less-skilled riders [81]. Specific motion of
the pelvis is unique in cycling, having large angular excursions in non-sagittal planes [191] that
facilitates energy transfer from the upper to lower body [31, 192] and augments force production at the
hip [193]. Although the contribution of the pelvis has been examined with respect to power production
and injury predisposition, it has been acknowledged that inaccuracies in the marker definition for pelvic
tracking has impeded evaluation of its true contribution [194]. Despite the apparent simplicity afforded
by a prevalent plane of movement in cycling, such observations of non-sagittal plane movement of the
pelvis and upper body suggest that differences in outcomes through bi- as compared to tri- planar
biomechanical assessments might be observed.
2.3.5 Effects of Workload and Task Demands on the Biomechanics of Pedalling
A number of authors have provided evidence that the biomechanics of steady-state cycling are affected
by absolute [157] and relative [81] intensity of power demands. Kinematics analysis shows small but
significant changes, most prominently a reduction in hip range of motion and increase in ankle range
of motion, as workload increases [183, 195]. Examining changes at the crank and pedal in elite
performers, Kautz et al. [196] observed that higher workloads resulted in an increased vertical pedal
force and shift in pedal angle suggestive of a more ‘toe-up’ position during downstroke, while a positive
(propulsive), rather than negative (resistive), torque was observed during the upstroke.
Electromyography studies have observed greater magnitudes of activity as power demands increase
[31]. However, increased EMG activity is not always concurrent with higher power demands and, in
fact, power output is not clearly associated with the levels of activity of individual muscles [14].
Evidently a number of interactive changes in movement mechanics are affected in order to improve
whole limb power generation.
33
Beyond a simple increase in workload, demands of all-out sprinting present a substantially different
motor control problem to steady-state cycling conditions. Studies in running confirm that the strategies
providing optimal solutions in sprinting are quite distinct from those of paced running [197]. Although
there is a paucity of studies examining sprint cycling, existing results confirm critical differences in
recruitment strategies. Dorel et al. [23] observed a change in the relative contributions of muscles during
all-out sprint cycling, and, somewhat unexpectedly, found that activity levels were not systematically
maximal. Activity of the hip extensors, hip flexors and knee flexors were also seen to be greater than in
submaximal conditions. Driss et al. [16], therefore, proposed that sprinting is dependent on four, rather
than three synergetic groups: the uniarticulate hip and knee extensors, plantar flexors and biarticulate
hip extensors, uniarticulate hip and knee flexors, and dorsi flexors and biarticulate hip flexors. The
unique function of the ankle in sprinting also places exceptional demands on force production by the
plantar flexors. Indeed, the ankle has been suggested as representing a limiting factor in extended sprints
[40] and evidence suggests that energy transference during sprint cycling would require plantar flexor
force production in excess of the forces achieved in a maximal isometric contraction [16]. Eccentric
contractile conditions have been reported in the triceps surae complex during all-out pedalling, which
may reflect a strategy that optimises force production as well as effectively supporting energy storage
and release [198]. Finally, differences in EMG patterns between maximal (no-load) and submaximal
cadence conditions have been observed, suggesting that differences exist in pedalling strategies for
steady-state and sprint cycling performance [41]. Importantly, sprint cadences distinguish sprint trained
performers executing sprint trials; no-load maximal conditions can be performed at upwards of 250rpm
in skilled sprinters. This distinction is important in evaluating research since many studies report ‘high
cadence’ conditions in the range of 120rpm, which would represent mid-range cadences of highly
trained sprinters.
The ability to discriminate the effects of task-specific conditions on functional strategy is critical to a
concise biomechanical assessment. Understanding changes in the overarching muscle coordinative
pattern is difficult to infer from EMG analysis, while kinematic analysis clearly only provides
34
information about how the body is moving not how movement is being created or indeed, power
produced. Limitations are further apparent in assessing performance kinetics solely at the pedal or
crank. Muscle coordination is defined as being “a distribution of activation of force among individual
muscles to produce a given combination of joint moment” [23]. Hence, inverse dynamics provides a
useful solution to assessing cycling kinetics, allowing prediction of the summated muscle forces and
moments acting to affect movement at any joint, while additionally allowing deconstruction of muscular
and non-muscular components of force [37, 199]. Existing studies on joint kinetics have been shown to
augment the findings of EMG and kinematic analysis. For example, greater knee flexion and cross-hip
contributions to power production are observed in maximal as compared to submaximal conditions [39].
Changes in effort distribution through cadence [200], workload [173, 201], riding position , bike set-up
[202] and fatigue [203] have been evaluated using inverse solutions, while a small number of studies in
sprint cycling have already illustrated the need for further assessment of this distinct competitive
category [38-40, 42, 204, 205]. Following discussion of methodological processes for cycling-specific
analysis, a detailed examination of joint kinetics studies will, hereafter, be presented.
2.4 Measuring Cycling Kinetics and Kinematics
Advancing technology has made aspects of performance assessment accessible to the average rider.
Most competitive riders will have an on-board personal computer providing them with the ability to
monitor metrics such as speed, time, heart rate and cadence [206]. Power monitoring devices are
becoming similarly accessible, although accuracy and data resolution of consumer-level products are
not sufficient for high quality analysis [207]. The ability to take direct measurement from the bike
makes evaluation of basic performance mechanics comparatively easy in cycling. On the contrary,
detailed analysis is more challenging, with some aspects of current practices impeded by the
involvement of the bike; spatial limitations of utilising motion-capture systems, for example, restrict
testing protocols to using stationary bikes, while camera fields of vision to view kinematic markers are
further occluded by the bike frame [208]. The importance of testing processes and equipment has
35
already been presented and an understanding of the issues and options provides the basis for better
decision-making in this regard.
2.4.1 Kinetics
A number of devices exist for measuring external power in cycling. Most commonly used is the
Schoberer Rad Meßtechnik (SRM) system which uses strain gauge technology integrated into the drive-
side crank. Although both crank torque and angular velocity data can be extracted, the system cannot
provide independent assessment of forces produced by each limb. Further, Bini et al. [207]
demonstrated that crank based torque analysis overestimated power, underestimated torque and
increased peak torque angle as compared to instrumentation directly at the pedal. Assessing force at the
pedals facilitates independent bilateral force assessment and using triaxial sensors, provides information
pertaining to the three contributing orthogonal forces, given by the vertical, anterioposterior and
mediolateral components. Force transducers are further able to provide comparatively high resolution
data (e.g. 1000Hz compared to 250Hz of professional level crank technology) [209].
Although instrumented pedals are more accurate, integrated pedal systems are not readily available
[210]. Custom design solutions are therefore required and systems have been presented using either
strain gauges or piezoelectric transducers placed into the pedal body [211], housed in mounting systems,
or placed under the base of the pedal [212]. Most of the early literature in cycling used pedal systems
that restricted the use of standard pedal cleats commonly used in cycling [36]. The use of cleated pedals
by competitive riders preclude the use of an internal housing, and, to facilitate riders using their own
shoes/cleats, systems mounted directly under the cleat system are required. Voltage output from the
sensors is proportional to the deformation of the material through force applied. Determining the exact
relationship of force to voltage is critical to data accuracy. At low loads the material response is non-
linear hence initial processes require preloading the sensors so that applied forces occur during the linear
region of the deformation-voltage relationship. Thereafter static calibration of the pedal system requires
36
application of known loads in each direction, with voltage output then entered into a linear regression
model whose coefficients describe the sensor response along the current axis [213]. Calibration
processes are almost universally described as being conducted with pedals removed from the bike and
either suspension of calibrated weights [209] or force-displacement units [214] used to apply a known
load. In situ calibration processes have not been identified in any known studies. Accurate orientation
of the pedal is critical to ensuring force applied is in the intended direction and inclinometers are
commonly used in this regard. In defining the relationship of voltage to force, this process
fundamentally establishes the accuracy of kinetic data.
Temperature will also affect voltage readings during operation, with sensors known to drift over time.
Bini and Carpes [215] recommend that a 20-30 minutes warming up period, where the sensors are
powered up with no load applied, is adequate practice to ensure temperature stability. Critical sources
of error are introduced due to material response. Application of force in any direction compresses the
material causing expansion in the other two directions. Due to this ‘Poisson effect’, any voltage along
the primary axis is therefore accompanied by small cross-talk voltages along the other two axis [215].
Recording the cross-talk voltages allows determination of an inverse correction matrix that can be
applied as part of the calibration process [212, 216].
To provide associated angular velocity data, pedal systems utilise integrated or frame-mounted encoders
or potentiometers [212, 217]. Although providing a simple solution, encoders or potentiometers have
the potential to add considerable system complexity and/or alter the inertial load. Motion capture
systems provide an alternative, with velocity data able to be determined by differentiation of pedal
coordinate data. Pedal coordinate data can similarly be used to determine pedal inclination, providing a
means of resolving the applied forces into the global coordinate system for input to subsequent
modelling [209]. As will be discussed in greater detail later in this chapter, motion capture does
introduce process errors through inaccuracies of tracking, digitising and post-processing of positional
37
data [68]. However, the use of motion capture is, in any case, a necessity for dynamic modelling and
errors can be minimised by taking due care in methodological process.
With appropriate attention given to minimising sources of error, force pedal systems provide a sensitive
means of directly evaluating force production of each limb [207]. Methodologies for their use are well
established in cycling. Bini et al. [195] have reported that instrumented force pedals are highly reliable
in testing competitive riders. While most sensors offer the opportunity to assess triaxial forces, the crank
is constrained to move in two dimensions. Mediolateral forces do not directly contribute to crank
rotation and are generally excluded from performance related assessments [71]. However, one critical
aspect of 3D versus 2D modelling processes is locating the centre of pressure (COP) for kinetic input
to the model. Carmago-Junior et al. [66] determined the errors in COP data could significantly affect
calculation of joint moments in gait assessment, with errors being more prominent in distal segments,
and at higher movement velocities. While COP information is directly available from force platform
data, the intermediate cleat system is preventative to measuring COP directly in cycling. However, the
soles of cycling shoes are designed to be as stiff as possible in order to transmit force directly to the
shoe-cleat interface. Given that forces are fundamentally directed to the crank through the pedal spindle,
and that the shoe-cleat interface is optimally aligned immediately above the spindle, the pedal spindle
provides an appropriate axis for COP location [218].
2.4.2 Kinematics
Kinematic assessment requires positional tracking of joints and segments of the body in either 2D or
3D space. A number of systems are available either recording body position by tracking visual
landmarks or identifying the body in space through magnetic sensors [70, 208]. Visual systems use
either single- (2D) or multiple- (3D) camera setups to record the trajectories of anatomical and segment
tracking markers allowing evaluation of translation and rotational motion in the global coordinate
system [4]. The accuracy of the system can be defined by its ability to reconstruct position time-
38
histories, distinguish markers in close proximity, measure and represent distance and be sensitive to
fine movement [70]. Capture rate and the resolution of cameras fundamentally affects accuracy and
lower precision induces substantial errors, particularly where limb speeds are high and/or markers are
closely positioned. Considering the potential for divergent accuracy, Fonda et al. [177] found
significant differences between methods of assessing cycling kinematics and concluded that 3D systems
represented the gold standard. Bouillod et al. [219] further confirmed the high reliability of two different
3D systems and recommended that the Vicon system represented the best option for research purposes.
Only limited assessment has been made of existing technologies, of which no study has specifically
examined the accuracy of different methodologies in examining the high velocity motion inherent in
sprint cycling.
Seminal papers in cycling biomechanics have utilised stand-alone high-speed cameras, requiring
subsequent manual digitisation of trajectories and manual synchronisation of the kinetic and kinematic
data, adding further potential for error [36, 92-94]. Although cycling movement is predominantly in the
sagittal plane, Umberger and Martin [74] compared sagittal plane kinematics captured from 2D and 3D
processes and demonstrated some small but noticeable differences that may significantly impact
assessment of joint kinetics. While the emergence of 3D technology presents the opportunity to improve
accuracy of results, some barriers to use are evident with respect to cycling. Software for 3D systems
not only provide data acquisition solutions, but provide integrated post-processing and modelling
functions [70]. In such cases, kinetics are internally time-synchronised to positional data, but with force
data inherently linked to acquisition by in-floor force platforms. Pedal forces must, instead, be measured
on dynamically moving platforms that will be auxiliary to the primary system. The 3D systems also
present some limitations in being inherently less portable. Recognising that laboratory-constrained as
compared to field-based testing could potentially trade-off accuracy and validity, Elliot et al. [67]
compared the Vicon laboratory-based system with a video-based set up in cricket performance and
demonstrated a lower root mean square error for reconstructing joint angles in the Vicon system.
39
The marker set used to define the body is critical to ensuring accurate representation of segment position
[64]. A number of technical models and approaches have been used and supported by reliability testing
[220]. The pelvis model is particularly crucial in 3D and commonly tracks position of the left and right
anterior superior iliac spine (ASIS) and posterior superior iliac spine (PSIS) [221]. However, occlusion
of the ASIS marker is common in sporting movements affecting pelvic tracking [222], and would be
likely in the spinally-flexed cycling position. Alternative models have been proposed [222, 223], with
Borhani et al. [223] recommending addition of a cluster of markers at the sacrum to the standard ASIS
and PSIS markers. Markers represent one of the most critical errors in motion-analysis, through
inaccuracies of positioning on the body, tracking and coordinate reconstruction [68]. The largest error
contribution is frequently cited as “soft-tissue artifacts” due to movement of the markers on the soft
tissue with respect to the underlying skeleton [65]. While this is an unavoidable aspect of marker use,
careful marker application processes can minimise impact. The use of bony prominences is ideal for
accurate positioning being easily and repeatedly identifiable through palpation [224]. Such locations
are frequently used for identifying key anatomical landmarks defining the local coordinate system of
the segments.
Approximations of joint centres of rotation are particularly prone to introducing errors. While the knee
and ankle have reasonably well defined and identifiable axis of rotation, the hip joint centre is less
obvious or accessible. Accurate location of the hip joint centre presents one of the most demanding
challenges in movement analysis techniques [225]. In 2D methodologies the hip joint centre is
commonly represented as the greater trochanter. However, this approach has been shown to introduce
unacceptable errors [194, 225]. Examining the impact of hip joint centre definition in cycling, Neptune
and Hull [226] compared existing methodology with actual location defined by a cortical pin surgically
embedded at the joint centre. Thereafter defining an alternative prediction method to increase accuracy,
they confirmed the differential effects of hip joint centre location on joint kinetics during seated cycling
[194]. Influence of hip joint centre position has similarly been observed in joint kinetics of weightlifting.
Sinclair et al. [69] determined that moments at both the hip and knee are affected, in keeping with the
40
impact of hip joint centre in defining the thigh anatomical frame [225]. In 3D analysis, predictive and
functional methods of locating joint centres have been assessed. Bell et al. [221] compared the accuracy
of a number of predictive methods and noted some degree of inaccuracy in all approaches. Inaccurate
positioning has, further, been shown to impact hip joint moments [227]. By comparing actual position
located by x-ray, recommendations for the most accurate predictive position of the hip joint centre have
also been presented relative to the coordinate position of the ASIS and pubic symphosis [227].
Computed Tomography (CT) scans have been similarly utilised, providing a new methodology relative
to the inter-ASIS distance and PSIS-ASIS distance [228]. Two-target [221, 229] and three-target [230]
relative approaches have been presented and provide the basis for hip joint centre models used in
modelling software.
2.4.3 Inverse Dynamics Modelling
Inverse dynamics provides a means of predicting the net forces and moments that have contributed to
producing an end movement [231]. As a representation of total muscular effort this provides the ideal
means of assessing sports performance [36]. Inputs to the process are the biomechanical descriptors of
the end movement, i.e. movement kinetics and kinematics, alongside anthropometric information to
describe the athlete. Working back from external force production, the inverse process uses Newton-
Euler equations to calculate forces and moments acting on each segment in the linked system [4]. By
way of comparison, forward dynamics predicts outcome movements in response to given inputs [232].
The inverse solution progresses through the linked kinetic chain solving for the unknown joint reaction
forces and joint moments acting on each segment. The resulting joint kinetic information then provides
a means of evaluating the combined muscle activity associated with affecting movement at each joint,
hence creating performance of the movement [36]. As a predictive model, a number of assumptions and
process errors are inherent and the accuracy and reliability of inverse dynamics solutions have been the
subject of a substantial body of research [68]. For example, magnitudes of uncertainties in torque
estimates have been examined in gait analysis [68]. Of the various sources of quantifiable error, primary
contributors were apparently associated with segment angles and body segment parameters. Assessment

41
of outcomes must also acknowledge the contribution of co-contractions of agonist and antagonist
muscle groups since these can confound a direct association with muscular effort [233]. A number of
methodological approaches to the inverse dynamics solution can be taken, each with their own
advantages and limitations [64]. However, Cleather et al. [231] compared two of the most commonly
applied approaches in assessing weightlifting movements and found inter-segmental moments to be
equivalent in each case.
At the heart of the process is the definition of a linked-segment model, representing the mechanical
behaviour of the interconnected limb segments. Cycling research has commonly applied a closed chain
five-bar linkage with thigh, shank, foot and crank as moving links, and frame as the fixed link [82, 199,
234]. More recent studies have extended the models to include the pelvis segment [235-237] or full 19-
segment representations including torso and upper limb segments [115, 238]. In comparing modelling
approaches, attention given to contribution of the hip-pelvis interaction is particularly important. While
some studies have assumed a fixed hip position in seated cycling [82], other models have determined
that hip movement is insignificant [239]. However, Neptune and Hull [194] identified that this
introduces errors. The joint reaction force at the hip represents the summated action of all forces
transmitted across the hip and in such a case, the hip joint force redistributes power from the pelvis to
the thigh [31]. With a fixed hip position, power and work terms associated would be zero, yet evidence
supports that cross-hip power is significant and can be quite substantial in sprint cycling [116].
To solve for unknown forces and moments, a free-body diagram is created of the contributing segments
[4]. Inertial properties of each segment are critical to the solution [42]. Segment lengths are defined by
anthropometric measures assessed through the motion capture processes or else manually measured,
while segment inertial parameters, including mass, radius of gyration, centre of inertia position, are
determined by using established data. This tabular data has itself been the topic of some discussion,
with adjustments to commonly used values being presented [240, 241]. Given the high limb speeds
42
associated with sprint cycling, Wheat and Barratt [42] hypothesised the inaccurate inertial parameters
could contribute substantial errors in the model. Utilising probabilistic analysis, the authors examined
the uncertainties associated with differences in inertial data. Running repeat iterations on data collected
during sprinting at 120rpm and 160rpm, uncertainties at the knee and ankle joint powers were found to
be insignificant [42]. Magnitudes of uncertainty in peak hip joint power were considered meaningful,
but were inconsistent through the pedal stroke, particularly in the higher cadence condition. With the
advent and availability of 3D imaging technologies such as Magnetic Resonance Imaging and CT
scanning, there is some potential to identify individualised parameters. However, it has been
acknowledged that such techniques are currently time-consuming and expensive limiting opportunities
for the purposes of most research [242].
Accurate acquisition and processing of data is critical to the use of inverse solutions. Errors in the
positional data are multiplicative through the differentiation process that provides the movement
velocities and accelerations. In the bottom-up approach (solutions commencing at the external force
and working distal to proximal) both kinetic and kinematic errors propagate through the solutions
process, compounding errors at the proximal joints [4]. It is well established that the design parameters
for filtering kinetic and kinematic data is critical [4, 243] and exert an impact on joint kinetic results
[244]. It is imperative, therefore, through all steps of the process to assess and identify opportunities to
minimise errors.
Although the majority of cycling studies have been conducted using 2D data, examinations of non-
sagittal plane movement in cycling have demonstrated the importance of including triaxial pedal force
components in the analysis [245, 246]. In addition to aforementioned differences in kinematic data
assessed in 3D as compared to 2D [74], Quintana-Dugue et al. [247] compared 3D motion capture with
2D video in calculating crank torque from accelerational data. Validating their computational method
against torque directly measured at the crank, the authors showed that 3D was more accurate, but that
43
improvements could be made in the 2D process by correcting for pedal marker positional data.
Segmental data is more susceptible to restricting the dimensions included in the analysis. In flattened
projections of 3D into two dimensions, sagittal plane motion of the joints in the camera frame of
reference is not coincidental with the joint axis [76]. Joint centre definitions are similarly affected by
inaccuracies in the frame of reference and lack of precision in locating the actual axis of rotation [245].
Furthermore, the effects of camera parallax distort segment lengths during motion introducing dynamic
errors in the calculations that will vary with crank angle [71]. While no studies have directly compared
2D and 3D joint kinetics in cycling, Alkjaer et al. [76] demonstrated significant differences in the
magnitudes of joint moments during walking when using 2D and 3D methodologies. The time-
normalised profiles were consistent and inter-individual variation was not affected. Adjusting the 2D
joint centre locations based on position established in 3D reduced the disparity of hip and ankle results,
but notably not the knee, suggesting a greater impact of frame of reference.
The hip joint is particularly susceptible to 2D-3D differences, not only through the erroneous definition
of hip joint centre, but through the contribution of frontal plane motion of the pelvis and trunk. Eng and
Winter [75] compared 3D gait analysis with results of existing 2D studies and identified the significant
contribution of frontal plane work at the hip relating to controlling the trunk and pelvis against
gravitational load. Although cycling would not impose similar control demands, large frontal plane
pelvic excursions are apparent in trained cyclists [248], suggesting similar outcomes may be observed.
During the golf swing it has been shown that the impact of trunk and pelvic motions on lower limb
kinematics is augmented by analysis using 3D versus 2D processes [72]. Smith et al. [72] highlight that
errors are introduced by oversimplification of motion in 2D, and additionally emphasise that
biomechanical coupling in the lumbo-pelvic-hip complex is instrumental in defining hip kinetics.
Coupling patterns exist where movement in one direction, especially the trunk, influences movement
in another [249]. Studies of coupling have previously established the impact of errors using 2D as
opposed to 3D analysis [250]. Given that 9% of pedal power is transmitted from above the hip in
cycling, there is potential for a substantial contribution from biomechanical coupling [116]. Movement

44
mechanics suggest that lumbar spine coupled motions would most likely present through axial rotation
and lateral flexion, thereby introducing movement not accounted for in 2D analysis. Furthermore
McGill has demonstrated that interaction of the torso musculature with the hip can act to augment the
power producing capabilities of the hip joint [193, 251]. In such a case, the demand for maximal muscle
power in sprint cycling would likely see a greater contribution of cross-hip power. Based upon this
contention the accuracy of modelling methodology may, therefore, be of increased importance during
sprint cycling, and clearly warrants assessment.
2.5 Joint Kinetics in Cycling
As a biomechanical assessment, joint kinetic analysis provides the means to predict the muscular effort
involved in performance and determine the relative distribution of work across the contributing joints
[13]. Seminal papers used the analysis to describe function of the lower limb around the pedal stroke
[36]. Results across a large number of studies are consistent in the shape of the temporal profiles
observed, although a number of factors influence the magnitude and specific timing of key transitions
[7, 31, 185, 239, 252]. Hip torque is negative (extensor) across a large period of the crank cycle, until
around 220, with peak value generally around 100, maximum torque delivery by hip extensors
concurrent with the observed position of peak force delivery at the pedal. The hip then generates a small
flexor (positive) torque from 220 through the remainder of the cycle as hip flexors raise the thigh
towards top pedal position. Knee torque demonstrates first a positive (extensor) then negative (flexor)
torque during the downstroke. Peak flexor torque occurs just prior to BDC, before rising once more
towards generating an extensor torque ahead of TDC. The transition of extensor to flexor torque during
knee extension in the power phase, although influenced by both cadence [25] and training [253], is a
consistent observation. This provides evidence that the biarticulate muscles can aid control strategy
optimisation across the pedal stroke by ‘tuning’ the distribution of net joint torques to most effectively
meet task demands [168]. Gregor et al. [93] determined that their contribution during this phase provides
economy of motion; the two joint hip extensors continue delivering extensor moments without adding
demand on the knee extensors to overcome the flexor torque this enforces at the knee. Ankle torque is
45
negative (plantar flexor) until close to 200, remaining near zero through the remainder of the cycle.
Similar to the hip, peak ankle torque is observed around 100. However, its profile is seen to closely
follow that of the normal pedal force and it appears that the ankle joint acts to optimise stiffness and
maximise energy transfer from limb to crank [254].
Joint power profiles are predominantly positive around the crank cycle and, indeed, it has been shown
that most of the mechanical energy associated with cycling is produced by concentric contraction of the
lower limb muscles [255]. Profiles at each joint are seen to reflect positive generation of energy through
the first half of the crank cycle, whilst the knee additionally produces a secondary positive power peak
during the early part of recovery. Brief periods of energy absorption occur at the ankle immediately
following TDC and BDC, between the two positive power phases in the knee, and through most of
recovery in the hip [256]. Eccentric action of the ankle plantar flexors has been confirmed [92], while
Hawkins & Hull [257], assessing the existence of stretch-shortening cycle action during cycling, further
determined that both hip and knee extensors demonstrated brief periods of eccentric to concentric
action. In many studies, however, a further (much smaller) positive power phase at the hip is seen during
the second half of the crank cycle, the generation of which is associated with the torque accompanying
hip flexion towards TDC [252, 258, 259]. Such differences in profile description are indicative of high
variability between both subjects and test conditions. In fact, variability is a well-documented feature
of biomechanical studies of cycling, with disparities particularly prevalent at the hip [20, 260].
Whilst discrepancies are present in the relative peak torque values of each joint, the hip and knee peak
torques are larger than those of the ankle, reflecting their primary roles in propulsion [261]. Cycling has
been suggested as a knee dominant movement, with evidence suggesting that the knee contributes over
50% of the mechanical energy across a full crank cycle [256]. Additionally, over 6% of the work across
the crank cycle is derived from hip joint reaction force, confirming the contribution of musculature from
above the hip. Inspecting the crank cycle over the two primary phases of down- and up- stroke, Ericson
46
et al. [92] apparently confirmed knee dominance of the cycling movement, finding the knee extensors
contributed 39% of total positive work, hip extensors 27%, ankle plantar flexors 20%, with smaller
contributions from the knee flexors (10%) and hip flexors (4%). However, more recent studies have
disputed these findings, suggesting that hip extension provides the greatest contribution under a range
of cycling conditions [39, 40]. Mechanical power analysis [261] provides a means of interpreting the
task-specific role at each joint; net hip and knee torques are seen to generate energy, while ankle
transfers energy, with gravity augmenting the limb-crank energy transfer in both phases of the crank
cycle. Further optimisation modelling has confirmed these findings [262], while additionally providing
evidence of distinct roles for the biarticulate and uniarticulate muscles in this process [158]. Conflicting
demands of energy transfer at the hip, knee and ankle into translational movement at the pedal see the
biarticulate muscles adjusting the relative distribution of net moments, while uniarticulate muscles are
activated only when they are in a position to shorten and hence generate positive work. This underpins
the belief that biarticulate muscles function more in control and transfer of force, while the uniarticulate
muscles provide primary force production [95].
2.5.1 Effects of Workload and Cadence
Early research by Kautz and Jorge [37] presented a method whereby inverse dynamics could be used to
decompose pedal force into muscular and non-muscular (gravitational and inertial) components. This
methodology subsequently demonstrated that manipulations of cadence affected only the non-muscular
contribution, muscular moment remained relatively constant over most of the crank cycle. Other studies
[199, 234] have alternatively decomposed the joint-specific moments into kinematic moments, related
to the acceleration of the limb segments, and quasi-static moments associated with generating pedal
force. Static moments are dominated by the ankle, demonstrating that most of the ankle torque is
generating pedal power, with little needed to angularly accelerate the foot. In contrast, the combined
inertia of the proximal segments affect an increasing kinematic component at the hip and to a lesser
extent the knee, demonstrating their greater dependency on angular acceleration. The findings were
clearly related to changes in cadence. At low cadences pedal power must be generated by greater static

47
contributions, while high cadences demand an increased kinematic component. Both instances may
require a high total torque but by disparate contribution, suggesting an optimal cadence exists whereby
both contributions are minimised at each joint. The impact of limb inertia was later underscored by Li
and Caldwell [25] while examining the impact of different riding conditions on joint kinetics. Changing
pedal rate induced greater effects at the hip than knee or ankle due to the interrelation of inertial
properties with cadence. The impact of inertial properties of the limb segments on coordinative pattern
have been confirmed elsewhere in comparisons of cycling performance in children versus adults [263].
Children are seen to alter joint torque distribution to compensate for the lower segmental mass and
moments of inertia, hence substantially smaller gravitational and inertial components of pedal force.
A number of studies have examined the impact of cadence in steady-state conditions, presenting
somewhat disparate results. However, some distinction can be made in the study methodologies.
Evidently joint moment will increase with increasing work demands [36], hence a change in workload
affected by altering test cadence will confound clear interpretation of results. Wangerin et al.[36]
examined changes in submaximal workload with two cadence conditions (60 and 90rpm) in a small
cohort (2 pro and 2 recreational) of cyclists and determined that higher workloads increased joint
moments while higher pedal rates decreased them. Ericson et al. [252] reached similar conclusions,
although found response to cadence more robust. Broker and Gregor [256] supported this finding
examining the source and transfer of power through the lower limb and finding results were sensitive
to workload but insensitive to cadence over a small range of 90-110rpm. Examining the interaction of
cadence and workload through five different combinations, they did, however, observe that the hip joint
was substantially affected by both cadence and workload.
Although the absolute magnitudes observed at each joint are certainly affected by changes in demand,
of greater interest is whether joints respond differently to changing conditions. Specifically, is the
relative contribution of each joint impacted by different riding conditions? This would suggest a change
48
in the distribution of muscular effort, i.e. control strategy, under differing performance demands.
Ericson et al. [252] explored a range of cadences (40-100rpm) and found no impact on relative
distribution of work. Notably, the study did not use subjects experienced in cycling and the methodology
did not control workload. In such a case, increasing cadence affected a concurrent rise in power output.
However, Bini et al. [200] similarly found no significant change in relative contributions of the joints
to total work, although work produced by the knee did increase at the higher cadence. Here, the study
concentrated on only single small increment and decrement around freely chosen cadence. Further
examination of two lower cadences in a separate study by the same group found that ankle joint
contribution increased at 70rpm as compared to 40rpm. Alternatively, studies of Mornieux et al. [201]
and Sanderson et al. [264], maintained a fixed power output while assessing performance at 60, 80 and
100rpm, observing a decrease in the contribution of hip moment and increase in knee moment with
cadence, with the ankle contribution remaining unchanged. Increasing power output while holding
cadence fixed resulted in the opposite effect; a greater contribution was observed at the hip, and less at
the knee in higher power output conditions, ankle again remaining unaffected. Outcomes were the same
in both normoxic and hypoxic conditions, leading authors to assert that the coordinative pattern of
cycling is robust to changing environmental conditions. The same outcomes have, more recently, been
confirmed in joint powers of recreational cyclists over a cadence range of 60-110rpm [265].
The wide ranges of pedal rates that have been utilised by existing studies on the impact of cadence make
direct comparisons somewhat difficult. Confounding results further, Hoshikawa et al. [258] examined
cadences from 40rpm up to 120rpm and found the hip increased its contribution to total work, while
there was a decrease in the contribution of the knee. Limited influence of cadence observed at the ankle
appears to confirm the role of ankle musculature is stable across different demands, while those at the
hip and knee apparently are compensatory in maintaining force production. The Hoshikawa et al. [258]
study highlights the impact of training status, since relative values at the hip and ankle in trained cyclists
were significantly lower while the knee was higher than those of non-cyclists across almost all cadences.
This may be indicative of differences in coordinative pattern with training status and hence skill level.

49
In fact, while assessing improvements in pedalling technique, combined EMG and joint kinetic analysis
has suggested that more effective directing of pedal force round the crank cycle is accompanied by a
reorganisation of joint torque distribution and altered uni- and bi- articulate muscle patterns [253].
Unfortunately, most research in joint kinetics has utilised cyclists with limited or no training, with few
studies examining those of very high training status. It is unclear whether further changes in joint
kinetics would be observed in participants of advanced skill levels.
The ability to maintain effective pedal force direction with increasing limb speed is certainly a known
aspect of high performing cyclists. High cadence pedalling presents coordinative challenges. Neptune
and Herzog [94] tested competitive riders over cadences up to 120rpm and used the decomposition
technique to assess negative work. The positive correlation of negative muscular work with cadence
may suggest a reduced ability to effectively coordinate function at higher limb speeds. Ettema et al.
[170] examined the phases of joint power production in competitive cyclists tested over five cadences
(60-100rpm) and found the time course of muscle power was shifted later in the crank cycle with
increasing cadence. The observance of a fixed time lag and onset of muscle activation unrelated to
cadence, dispels the association of activation dynamics and electromechanical delay to cadence-related
coordinative changes, leading to the aforementioned assertion of the influence of limb inertia. The phase
shifts further means that cadence does not just alter performance along the FV relationship of muscles,
but more globally the coordinative strategy i.e. pedalling technique.
These findings are instrumental in determining the need to distinctly assess sprint performance.
Fundamentally the cadences observed in sprint competition extend beyond those assessed in the
aforementioned studies, with sprinters likely being more skilled in working at these limb speeds.
Further, attempts to interpret study findings in cycling are commonly approached from the perspective
of efficient movement. For example, Marsh et al. [233] and Redfield and Hull [82] maintain that the
observed trade-offs between hip and knee contributions reflect an optimisation strategy and that an
50
‘optimal pedalling cadence’ exists globally minimising work demands across the joints. However, since
sprinting requires maximal muscle output, an ‘optimal cadence’ would represent operation at a global
maximum of combined power-velocity relationships of muscles crossing each joint. The task demands
in sprinting would likely affect a strategic alteration of muscular effort in this regard. In all-out sprint
conditions, peak crank torque is higher at the end of the downstroke phase at leg speeds of 200rpm as
compared to those at low cadences (around 80rpm), while distinct patterns of energy transfer as well as
unique relationships in knee and ankle angles are also evident in high cadence pedalling [198]. This
provides additional evidence supporting a distinct optimal control pattern for high speed pedalling.
Only two studies have made direct comparison of maximal and submaximal cycling conditions, with
results providing strong evidence of the distinct neuromuscular characteristics of sprint cycling
performance. During isokinetic performance at a single cadence of 90rpm, Horscroft et al. [38]
determined that ankle joint power and cross-hip power (power transferred from the upper body) over a
full crank revolution were substantially greater in maximal conditions. Elmer et al. [39] compared
performance in a range of power outputs including maximal power. Separating the contributions of joint
extension and joint flexion across the revolution and using regression analysis across power conditions,
results show an increased dependency on knee flexion power at high power outputs. Notably values
show high inter-individual variability highlighting individuality of coordinative strategy in this
population. Previous study determined that emphasising the pulling action (i.e. flexor action) during the
upstroke improved pedal stroke effectiveness to the detriment of efficiency [159]. Elmer et al. [39]
proposed that the pulling strategy is, instead, beneficial under the altered task constraints of sprinting,
since performance is driven by demands for maximal muscle power rather than economic movement.
Subsequent 3D examination of workload and cadence in cycling supports these results, observing an
increased knee flexion moment with cadence, although knee abduction moments remained unaltered
[180]. Increased contribution of power transferred across the hip in maximal pedalling is a consistent
finding of studies [38, 39]. While it is acknowledged that additional upper body movement is
counterproductive when seeking to be efficient in submaximal performance, the upper body conversely
51
augments power production in maximal conditions. Elmer et al. [39] further isolated the effects of
maximal versus submaximal pedalling in assessment of duty cycle, showing that maximal conditions
resulted in an increased time in extension of all lower limb joints, aiding power production. Finally,
repeating the maximal trial at a second higher cadence (120rpm) the authors critically acknowledge that
leg speed impacts results (significant changes being particularly prominent in hip extension) and that
training status may be a factor resulting in differences between studies. These suggestions underscore
the need for a more highly specified evaluation of joint kinetics in sprint cyclists.
Few studies have examined cycling performance at extremely high cadences. A single study assessed
joint-specific power in maximal and submaximal high cadence cycling as a part of a case study of an
elite sprinter [41]. Results confirm the predominance of hip extension power, while noting a significant
contribution of hip flexion and the importance of hamstrings activity in transferring mechanical energy
between the knee and ankle. Martin et al. [266] compared joint-specific power across a range of
cadences from 58 to 190rpm during maximal conditions and found that, while the knee followed the
quadratic power-cadence relationship commonly observed at the crank, peak hip power continued to
increase to the highest of pedalling rates, whereas power at the ankle decreased at higher limb speeds.
In a separate study, the same laboratory also confirmed changes in relative contributions of each joint
with cadences across the same range [267]. A further study, comparing relative contribution in maximal
trials between 60 and 120rpm, confirmed only the decline in hip and ankle power [116]. Collectively,
these results suggest changes in joint kinetics are more apparent at the extremes of high cadence
pedalling. Since coordinative ability is challenged at high leg speeds and given the inherent variability
in pedalling technique at high cadence, it may be that that, as cadence rises, the cyclist is increasingly
unable to maintain the same recruitment strategy [22, 173]. However, to date, assessment at such
cadence ranges has been restricted to non-sprint trained athletes and it is unclear whether skilled
performers would show similar outcomes.
52
Research indicates that there may be unique interactions of joint-specific muscle function in maximal
cycling conditions. Over a cadence range of 60-180rpm, McDaniel et al. [205] observed a decrease in
relative ankle plantar flexion power and increase in hip extension and knee flexion powers with
increasing cadence, knee extension power remaining unaltered. The study further observed that hip
excursion increases while ankle excursion decreases with cadence. The interaction of the hip and ankle
appears to support findings of Fregly and Zajac [261] who previously determined that the ankle and hip
work synergistically in acting as a source (hip) and channel (ankle) for energy delivery to the crank,
where the knee works more independently. Control of ankle kinematics has, elsewhere, been proposed
as providing a means of affecting time in power-producing limb extension through the crank cycle [40].
Hence it would seem that the hip-ankle interaction provides both kinetic and kinematic benefit. Results
of this study highlight that the factors differentiating conditions in maximal as compared to submaximal
performance are likely unique to each joint. Distinct joint excursion and angular velocity profiles at
each joint as cadence changes, affect both the effect of time available, hence muscle active state, as well
as operation over the power-velocity relationship, producing unique constraints. With trade-offs
observed in hip-knee power production and hip-ankle energy transfer, such studies highlight the
importance of a joint-level analysis in understanding changes in performance at the crank.
Given the apparent importance of cross-hip power in maximal pedalling conditions, it is interesting to
note that only a single study has directly examined upper limb kinetics. Costes et al. [115] determined
that riding position and work conditions influence the magnitude of joint kinetics in the upper limb
joints. Standing position and higher power outputs were associated with higher magnitude of upper limb
kinetics, although pulling (not pushing) actions were only affected. Pulling on the handle bars is
acknowledged as a key part of the sprint cycling action, with the authors concluding that a greater
pulling action is needed to prevent body elevation when pedal reaction force becomes greater than body
mass. This may suggest that upper limb action is not a constituent part of cross-hip power, but that
alternatively, cross-hip power represents the reaction force of the back and contralateral leg.

53
2.5.2 Effects of Riding Position and Bike Set-Up
Since task specificity appears to have a critical impact on the distribution of muscular effort, it is
unsurprising that changing the relationship between the bike and rider has been shown to affect joint-
specific kinetics. Standing out of the saddle reduces the constraints on the hip position and indeed is
seen to alter function further down the kinetic chain. In submaximal riding, Li and Caldwell [25] noted
that a transition to standing affects an increase in ankle and knee moment and concomitant decrease in
hip moment. The importance of the upper body in sprinting is further emphasised by the finding that a
transition from seated to standing affects only the contribution of cross-hip reaction terms to crank
power [73]. Limited information from this abstract, however, precludes further comparison with the
submaximal study. Altering upper body position by changing handgrip position and hence trunk angle
also appears to affect joint power. Specifically, hip power is increases when riding in the dropped
handlebar position as compared to riding on the tops, with knee power increasing and ankle remaining
unchanged [188].
Seat height represents one of the most commonly explored changes to performance position. Altered
seat position affects knee kinematics, hence operation of muscles crossing the knee joint, to a greater
extent than either the hip or ankle. Research confirms a significant impact of seat height on knee joint
kinetics, although the extent of height changes appears to impact results. While Horscroft et al. [154]
found joint power distribution was unaltered by lowering saddle height, Bini et al. [202] found that knee
contribution to total work was only significantly different between a saddle height compared both above
and below the riders’ accustomed position. Tests of saddle heights above and below the position
recommended as optimal in maximal cycling suggests that a lower saddle height is related to a reduction
in power output, with knee, but not hip or ankle, moments decreased in this position [237]. Forward-aft
position of the saddle similarly shows pronounced affects at the knee, affecting shear, but not
compressive, forces present at the joint [268].
54
The interaction of seat height and foot position has been distinguished through the flexor and extensor
phases of muscle action [30]. Seat height affects knee flexor, but not extensor, contribution, while an
associated change in the anterior-posterior position of the foot on the pedal additionally altered
dorsiflexion moment. A later study by the same authors [269] determined that seat height and foot
position actually had a small effect on joint loading at both the knee and hip in some subjects suggesting
some variability in relative contribution of the joints. The shoe-pedal relationship introduces a number
of variables impacting ankle elevation, including pedal platform height, shoe sole thickness, cleat
thickness and ankle position above the foot sole. Pedal platform height adds complexity to the kinetic
analysis since the centre of pressure of the foot is not coincident with the pedal spindle axis [270].
Although pedal force application is unaffected by platform height, varying the height of the platform
does have an interactive effect with cadence that affects joint moments by up to 13% [270]. Combined
measures such as ‘posture height’, being saddle height, crank length, shoe cleat position, and saddle
setback and ‘posture length’ additionally associated with handlebar reach, are also seen to affect
performance at the pedal. Support for this contention can be found in the study by Hayot et al. [236]
where a preferred or forward position resulted in a larger knee power than a more backward position.
Crank length also affects the kinematic relationship of the linked-segment model. With cadence held
constant, a longer crank affects pedal speed, hence muscle shortening velocities of uniarticulate
muscles, while crank length alternatively affects the excursion length of the same muscles [11]. Barratt
et al. [7], compared two submaximal conditions where pedal rate and pedal speed were alternatively
held constant allowing independent assessment of the effects of pedal speed and crank length on joint
powers. Across cranks lengths from 150-190mm, the authors found increases in pedal speed and crank
length both affected increases in knee and hip angular excursion. While joint moments and powers were
less affected, a trend for decreases in knee extension power and increases in hip extension power was
observed with longer cranks. As previously discussed, Martin [1] dispelled myths around the influence
of crank length on maximum pedal power by demonstrating that the counteractive effects on pedal
speed and pedal rate must be considered in the analysis. Barratt et al. [204] extended this approach in
55
examining the effects of crank length on joint-specific power in maximal conditions. Examining the
same range of crank lengths as in the submaximal trials, at a constant pedalling rate (120rpm) crank
length effected small but significant differences in hip and knee joint powers between the extreme crank
length conditions. However, when cadence was optimised for maximum power production crank length
had no significant effect on any lower limb joint.
2.5.3 Effects of Fatigue and Other Influencing Factors
Mechanisms of fatigue are largely distinct in steady-state and maximal conditions. However, the
neuromuscular effects of fatigue are similarly explained through impaired force production and
movement control. The effects of fatigue on coordinative pattern have been demonstrated [29, 271] and
the relationship of joint kinetics to muscular effort provides similar insight into muscular stress [203].
While Amoroso et al. [272] observed changes in kinematics and kinetics of performance during a
constant cadence trial to exhaustion in competitive cyclists, the study failed to examine consequences
at joint level. However, conducting a similar protocol, Bini et al. [203] observed that ankle joint
contribution decreased while total absolute moment and hip and knee moments increased at the end of
the trial. It should be noted that cadence also declined by the final stages of the trial which may confound
results. In another study, Bini and colleagues [160] also assessed the impact of an incremental test to
exhaustion, thereby altering conditions to increase workload during the onset of fatigue. Here knee joint
contribution increased, while total absolute joint moment, knee moment, plantar flexor moment and hip
flexor moments were also observed alongside changes in hip and ankle kinematics.
The impact of fatigue on joint kinetics in maximum conditions has also been examined. Elmer et al.
[273] compared joint kinetics in maximal sprinting pre- and post- performance of a 10-minute time trial
at constant cadence. Joint-specific powers were non-significantly altered by the end of the time trial.
However, the post-time trial maximal test affected a decline in joint powers, with ankle plantarflexion
and knee flexion showing greater fatigue than both hip extension and knee extension. With maximal
56
performance affected and the time trial submaximal performance largely unaffected, the authors
conclude a distinct functional consequence of fatigue on maximal performance. However, it should be
noted that fixed duration time trial present substantially different performance strategies than time trials
to exhaustion and it is unclear whether the time trial would have represented similarly fatiguing steady-
state conditions. Assessing the effects of fatigue induced by maximal pedalling conditions themselves,
Martin and Brown [40] compared joint-specific power at the start, middle and end of a 30s all-out sprint
at 120rpm. Relative ankle plantar flexion power declined by the middle interval and was significantly
less than knee flexion and hip extension power in the final interval. Knee extension power was also
reduced below that of hip extension by the end of the trial, where knee flexion power was not
significantly different from the power achieved during hip extension. Time spent in joint extension also
declined.
Fatigue appears to most critically affect the ankle joint. Studies have highlighted the unique role of the
ankle in being responsible for force transference. Mornieux et al. [201] suggested that the ankle
musculature should function to maximise joint stiffness to aid function in this regard. A reduction in
ankle moment suggests impairment of this functional capacity during fatigue. Interestingly, in
submaximal conditions the ankle appears to increase range of motion during fatigue, while in maximal
conditions ankle joint excursion is reduced. The increased range of motion observed at the ankle during
steady-state fatigue has been suggested as a mechanism to offset the decline contractile capabilities by
increasing lengthening velocity [203]. Alternatively, in all-out conditions there is less movement in the
ankle that would minimise power loss while further reducing the degrees of freedom and constraining
control optimisation to support maintenance of maximum power [40]. While the influence of central
and peripheral components of fatigue are likely to be present in both submaximal and maximal
performance conditions, the differences in compensatory mechanics support the assertion that strategic
alterations in joint are at least a component part of functional changes observed at this joint.
57
Inverse dynamics approaches have also been used to examine a number of other factors influencing the
distribution of muscular effort in pedalling. A noncircular chainring apparently produces a similar joint
kinetic profile to standard circular chainring [274], although the extent of chainring ovality can affect
both knee and hip joint kinetics; chainrings of high ovality reduces relative knee power and increases
contribution of the hip, suggesting benefit to power production [275]. Elmer et al. [276] examined
eccentric cycling in a recumbent position finding that most of the power absorbed was at the knee, while
a subsequent study using an eccentric protocol as a fatiguing intervention prior to concentric
performance, confirmed knee extension as the greatest power absorber followed by hip extensor [277].
During subsequent maximal concentric pedalling knee extensor power was significantly reduced
whereas hip extensor power was unaffected. Several researchers have compared assisted single leg and
double-leg cycling. For example, Bini et al. [278] report reduced hip extensor moment and increased
knee flexor moment in single-leg assisted pedalling as compared to two-leg. Elmer et al. [279] compared
counterweighted and non-counterweighted single leg pedalling with the bilateral condition and
observed that relative ankle plantar flexion and hip extension work was greater with two-legged
pedalling. Counterweighting the passive pedal in single-leg pedalling has been reported as providing a
means of compensating for the inertial effect of the contralateral leg. While single-leg training
apparently provides beneficial peripheral adaptations, joint kinetic analysis, therefore, confirms that the
coordinative pattern of pedal stroke is altered in this condition. Such outcomes highlight that joint
kinetic analysis not only provides a means of describing control differences as a result of environmental
conditions, but can help inform decision-making in training prescription for cyclists.
2.6 Joint Kinetics in Weightlifting
A number of weightlifting exercises are commonly used to improve the strength capacities of cyclists.
The characteristic triple extension of hip, knee and ankle during primary power production of the
downstroke in cycling has led to the assumption that squat-based patterns and variations are ideal
resistance training exercises for cyclists [54]. However, the contribution that each joint makes to
muscular effort, hence coordinative pattern of lift execution, may be far from similar. Different exercise

58
variations have been shown to develop unique joint kinetic distributions reflecting the kinematic pattern
and position of the body through the lift, as well as kinetic differences affected by position and
magnitude of the external load [56-58, 280]. In a given exercise, altering limb segment angles through
changing aspects of technique, such as movement timing or foot placement [59-61, 281], can further
affect the relationship of force vectors at any joint to ground reaction force. A number of studies have
observed that both loading conditions and body position impact the effective moment arms at each joint,
directly impacting net moment [56, 91, 282]. In such a case, an understanding of the characteristics of
each exercise and ramification of changing their execution are critical to informing their application in
cycling.
External load is accepted as being the primary means of changing demands of any resistance training
exercise [283]. Indeed, load lifted is seen to be the main determinant of intersegmental moment at the
hip and vertical forces at each of the lower limb joints [284]. However, the three joints are seen to
respond uniquely to loading. Bryanton et al. [61] showed that relative muscular effort (RME) of the hip
extensors and ankle plantarflexors increased with load in the squat, where loading had little effect on
knee extensor RME. Split stance exercises are similarly consistent. In the lunge exercise, load has little
impact at the knee, while a linear increase in work is observed at the hip and ankle [285]. Knee response
to loading also appears distinct in explosive exercises. During the pull phase of the clean both hip
extensor and ankle plantar flexor moments continue to increase with load beyond where moment is
maximised at the knee [57].
To help improve athletic performance, weightlifting studies have frequently examined the optimal load
for developing power [283, 286]. However, Farris et al. [96] determined that peak external power,
observed between 40-60% 1RM (a load range also commonly referenced for power development in the
literature), actually represents a compromise in powers produced by each joint. The hip, knee and ankle
were found to be optimised for power production at unique loads. While Farris et al. [96] observed an

59
optimal load for knee power as 40% and hip 60% in the squat, Jandacka et al. [287] observed in the
squat jump that knee power was maximal at 0% of 1RM load, ankle at 70% of 1RM, while hip produced
a similar power across loads from 0-70% 1-RM. In contrast, Moir et al. [58], observed that the unloaded
condition maximised knee power, but found a unique maximal of 42% of 1RM at the hip. Jandacka et
al. determined that differences may be due to lack of control of squatting depth in the Moir study, which
would affect both joint torque and velocity developed through the concentric phase of the lift.
Understanding the effects of changing the technical conditions of different exercises can aid their
application by defining conditions that will maximise muscular effort of each joint [288]. However,
ultimately muscular effort must be related back to the external power being produced and some
consideration has been given to whether inference in joint powers could be made from examining
external power only. Kipp et al.[289] examined the correlation of joint powers to four common
measures of external power output in the clean exercise performed at various load, and determined that
the hip and knee showed the highest correlations to external power calculated by the work-energy
method at a load of 85% of 1RM. Peak sum of all joint powers was only correlated to external power
calculated by the impulse-momentum method at loads of 75 and 85% of 1RM. Results, therefore,
suggest joint powers are only predictive of external power outputs at higher loads and that the
contribution of the ankle may be more variable. Such findings may be equally true in other exercises.
Regression modelling of load lifted on hip and knee joint moments in the deadlift, further suggests
substantial variability in response [290].
The relative importance of the hip joint in squat-based movements is reported by a number of studies.
With hip extensor moments observed across the concentric phase of squat-based patterns, a consistent
linear relationship has been reported with load, in both standard lifts (such as squats, deadlifts and
lunges) [291], as well as explosive exercises such as jumps and Olympic lifts [57, 97]. Results highlight
an increased proportion of hip involvement as load increases. The hip is also observed as being the
60
limiting joint in squatting [292], while jump height is seen to be most critically dependent on hip power
[293]. In contrast, the knee and ankle appear influenced by more than just load and both exhibit distinct
patterns that are affected by load and load vector, technique and body position [291].
The ratio of hip:knee contribution is commonly used to classify exercises as so-called ‘hip dominant’
or ‘knee dominant’ [294]. The actions of the two primary power producing joints are frequently
observed as interacting in a compensatory manner with altered lifting conditions. Bryanton et al. [288]
observed that hip extensor activity, particularly the relative contribution of gluteus maximus versus
hamstrings, influences the relative muscular effort of the quadriceps, thereby affecting knee moments.
The knee has been the sole focus of a number of studies in both standard and explosive lifts, with
particular interest for injury and rehabilitation considerations in performing weightlifting movements
[282, 295-297]. Body position uniquely affects the moment arm and kinematics of the knee through the
combined effects of thigh and shank angle, such that even small technique variations can be either
beneficial or detrimental to knee loading [55]. Unlike the hip, during the concentric phase of lifts the
knee is commonly seen to observe phases of both flexor and extensor moment specific to lift conditions
[56]. Some explanation may be provided in understanding the role of the two-joint muscles through the
course of the lift. While acting in limb control and positioning as well as energy transfer between the
segments, their specific lines of action could actually, by vector summation, act to augment or diminish
net extensor moments [298]. Their role can certainly account for discrepancies in results and a potential
limitation of standard inverse dynamics techniques is the inability to adequately account for their actions
[95].
Ankle function shows substantial variability during various lifting conditions. A comparison of the
sumo and conventional deadlift found that, while the conventional position affected a net plantar flexion
moment at the ankle, the sumo position alternatively affect a net dorsiflexion [280]. The study similarly
showed that direction of ankle moment is affected by stance width in squatting [59]. Ankle moments
61
are frequently shown to be substantial in weightlifting, in many cases greater than those at the knee [57,
285]. The structure of the triceps surae complex is certainly related to the demands for high force
production at this joint [299], and, in fact, vertical forces in the deadlift are seen to be highest at the
ankle joint [284]. However, the relationship of ankle joint kinetics with load appears highly variable
[291]. Both standard lifts and explosive exercises have either no relationship [291], non-linear [63] or
linear [57] relationships of load to joint torque. In contrast, the range of motion of the ankle distinctly
affects power development. Kipp et al. [57] noted that joint excursion was much smaller in the ankle
than at the hip or knee, and, with joint angular velocity observed as being much lower, ankle joint power
was reasoned to be more highly dependent on joint torque profile. In support, Suchomel et al. [300]
showed that where the knee and hip joint angular velocities were responsive to load changes in both
jump squat and hang clean, the ankle was somewhat insensitive.
Disparities are often noticeable in examining the outcomes of comparable weightlifting studies and
appears only partially explained by differences in specific conditions of study design. A degree of inter-
subject variability is frequently reported [298]. Expertise in execution has been shown to impact both
the kinematic and kinetic profile of the lift being analysed. Assessment of deadlift performance in
skilled and unskilled competitors in powerlifting competition noted that unskilled performances showed
significantly higher variability in linear and angular accelerations [284]. Joint kinetics terms showed
similar relative distributions but differences in the magnitudes observed at each joint. However, Enoka
[63] determined that the ability to lift heavier loads was not simply due to a scaled increased in joint
moments but was critically impacted by the temporal organisation of intersegemental kinetics.
Examining the pull phase of the clean, a successful lift required generation of sufficient joint power and
optimal organisation of the phases of joint power production and absorption. The complex technical
aspect of weightlifting exercises has been argued as being a barrier to application in athlete development
[301]. Certainly, successful lift completion in clean pulls demands effective timing and relative
magnitudes of key interactions of kinematics and kinetics [302]. Such differences are apparent even in
62
highly trained competitive lifters, research demonstrating that control of knee position in the snatch
discriminates performance [303].
As in cycling assessment, methodological concerns are evident in weightlifting analysis. Re-examining
the deadlift technique comparison, Escamilla et al. [280] observed a number of differences between
results of 2D versus 3D analysis. Utilising both 2D and 3D processes in a further study of squatting, the
group also showed that 2D processes incurred errors in hip angle, ankle and knee moment arms and
hence moment terms [59]. The differences were significantly related to the stance width, with wide
stance observing greatest errors. In fact, knee moments were alternatively greater in wide stance in 3D
processing while they were less than narrow stance in 2D. Comparisons of stance elegantly highlight
the effects of 2D error through both camera parallax and misalignment of the joint coordinate axis. A
narrow stance places the thigh and shank segments in closer alignment with the anterior-posterior
coordinate axis, where a wide stance angles the segments outwards. Results of the two studies led
authors to conclude that 3D analysis is more accurate. As with cycling, squat-based weightlifting
exercises are predominantly sagittal plane. In contrast, however, bilateral, and to a lesser extent
unilateral, weightlifting exercises have far less hip movement out of the sagittal plane. Consequently,
errors associated with hip joint centre location are less prominent. Sinclair et al. [69] compared four hip
joint centre locating techniques assessing the back squat and significant differences were only observed
in the frontal and transverse planes. Consistency of inverse dynamics methodologies have also been
confirmed in weightlifting, with equivalent outcomes found using different analysis of joint kinetics in
push jerks, vertical jumps, and squats [231]. As crucial footnote to evaluating study outcomes, an
examination of the validity of joint kinetic measures observed that, while average and peak torque
values were both significantly correlated with task objectives in work-related tasks, only mean values
were significantly correlated in power-related tasks [304].
63
2.6.1 Standard Lifts
The squat has been most commonly examined and is the foundational movement pattern from which a
number of exercise variations are derived through manipulation of direction and positioning of the load,
limb position, joint excursion, as well as relative contribution of one or both legs [62, 91]. In squatting
with no additional load, peak knee moment is greater than that of the hip or ankle [231]. In contrast a
barbell squat is predominantly loaded at the hip, to a lesser extent ankle and least knee, although some
individual variation is apparent [298]. Other studies have equally found the knee outweighed
contribution of the ankle but not the hip [305, 306]. As previously noted, the influence of load is
certainly discriminatory. A consistent linear increase of the hip moment with load, alongside less
consistent effects at the knee and ankle can affect a shift in relative joint dominance at particular loads.
The depth of the squat also influences outcomes, with a squat to parallel depth demonstrating lower
relative muscular effort in both the hip and knee as compared to full range squat (below parallel). The
interaction of load and depth can, therefore, substantially alter the relative effort present at each joint
[61].
Small differences in left-right magnitudes of net joint moments can be present at each joint in squatting
[305]. Hip and ankle contribution have been observed as having a greater magnitude on the left, while
knee values were greater on the right [305]. In this study, all but one participant stated right leg
dominance, which may suggest an underlying relationship to coordinative strategy in a stronger leg. An
examination of squatting in long jumpers alternatively noticed that the take-off leg tended to show
greater extensor moments at the hip and ankle and non-take off leg at the knee [306]. Whilst this appears
to be at odds with the squatting study, the training/experience status and depth of the squat are quite
distinct in each study. Both of these factors would, therefore, critically affect outcomes. These results
serve to illustrate the impact of population and technique of execution on joint kinetic distribution.
Notably no studies have directly assessed differences with a left versus right driving leg in unilateral or
split stance lifts.
64
Key squat variations are affected by changing the bar position hence centre of mass of the system, which
consequently affects joint loading. As compared to a posterior shoulder (back squat) bar position, an
anterior shoulder (front squat) positioning of the bar affects a concomitant change in hip:knee
relationship. Examining knee function only, Gullet et al. [55] determined that, while overall muscle
recruitment was the same, the back squat had a greater knee extensor moment than the front racked
position. In contrast, Russell et al. [307] found similar knee extensor demands but determined that
changes in trunk inclination affected the trunk extensor moments more prevalently. Unfortunately, the
relative contribution of the knee to the other joints was not presented in these studies. Yet, while the
back squat has been shown in a number of studies as being dominated by hip extension [288, 298, 306,
308], knee moment is seen to be highest of the three joints in front squat [309]. However, the joint
loading pattern of the exercise can be affected by the direction of the load vector applied. By replacing
a standard free weight (barbell) with a flywheel/cable pulley load, Chiu et al. [309] showed that the
cable lift created greater contribution of the hip and ankle while decreasing the knee contribution. In
free-weight conditions there are constraints on the body position based on the necessity of maintaining
the system centre of mass between forefoot and heel [310]. The utilisation of pulleys or equipment that
constrain the direction of load application, provides a means of compensation by introducing reaction
forces against the system. Employing the guided bar tracks of the Smith machine, research has shown
that joint load distribution can be modulated by changing the relative body and equipment inclination;
a backward (forward) inclination decreased (increased) knee torque and increased (decreased) hip
torque [310].
Joint kinetics of the deadlift further demonstrate the impact of altering the load vector. The exercise is
characterised by the bar being lifted from a ‘dead’ position from the floor up, with the external mass
therefore non-axial and below the midline. The deadlift is commonly considered hip dominant and
studies have confirmed a far greater contribution of the hip as compared to either the knee or ankle,
citing impact of a relatively large moment arm of the bar to this joint [284]. However, different bar and
stance variations affect specific distribution of muscular effort. Cholewecki et al. [290] examined

65
performance of the lift in powerlifters who generally use either the wider stanced, ‘sumo’, position or
conventional position. The hip contributed 671Nm in sumo and slightly greater hip moment at 713Nm
in conventional position, both far in excess of the knee which contributed only 18Nm in each case.
Brown and Abani [284] confirmed the predominance of the hip in adolescent powerlifters, here noting
that the ankle, in fact, exceeded the contribution of the knee in both lift-off and knee-passing phases of
the lift. Further studies have confirmed that the two predominant lift styles affect both knee and ankle
contributions, as previously mentioned the ankle notably observes a net dorsiflexion (not plantarflexion)
moment, in the sumo lift [280]. Comparison of different bar types in the deadlift shows further
distinctions. Hexagonal versus straight bar position affects the loading vector of the lift as well as lift
kinematics. Although greater load can be lifted with the hex bar, hip and ankle moments are lower, and
knee higher, as compared to a straight bar lift [56].
In addition to the impact of the load position, changes in feet and knee positions significantly affect
joint moments. A comparison of stances in an unloaded squat used principle components analysis to
determine that a wider stance increased knee flexion moment [295]. Hip:knee extension ratio has also
been shown to be greater in the wide stance position with a compensatory increase (decrease) in hip
(knee) contribution apparent through altering stance [308]. In contrast, when comparing the back squat
with leg press exercise, research has shown knee forces to be higher in squatting although neither foot
height (leg press) nor foot angle (squat) affect magnitudes of forces [282]. However, the technique used
in the squat critically impacts the effects of stance alteration. Swinton et al. [91] found that the foot
position and shin angle of a traditional, powerlifting and box squat in combination with the concomitant
effect on the centre of mass displacement, created differences in the joint moments across all exercises.
The traditional squat showed the greatest peak moments at the ankle, while hip moment was greatest in
the powerlifting variation and knee in the box squat. Such results highlight the importance of moment
arms in accounting for joint-specific changes. Knee positioning during movement is also seen to affect
movement kinetics. Antererio-posterior knee position, as controlled by restricting forward knee
movement, affects trunk and shank angles, hence force distribution [311], while knee medial and
66
anterior displacement of the knee from neutral alignment is seen to affect both sagittal and frontal plane
torques of all three lower limb joints [312]. Altering toe angle also apparently affects non-sagittal plane
moments at the ankle [60], while a number of studies have shown that footwear, through affecting joint
angles and torso position, can alter the contributory pattern of the joints to the movement [313, 314].
Strength training ethos observes some division of opinion in the use of unilateral as compared to
bilateral lifts, given that higher absolute loads can be achieved in bilateral lifts [283, 315]. However,
joint-level analysis of unilateral and split stance variations present results that support their benefit with
studies confirming increased joint moments, hence muscular effort, in these positions. Stuart et al. [316]
compared knee joint moments in two squat variations with the lunge exercise and found a higher
maximum extensor moment in the lunge than either squat condition. Van Soest et al. [317] directly
compared unilateral and bilateral jumps, albeit in only unloaded, and found the single-leg execution
created higher peak torques at all joints. The effects of different variables were highlighted in this study,
with only mean values significantly higher in hip and ankle. Joint powers at the knee were contrastingly
lower in the unilateral variation, compared with the bilateral movements, while ankle was higher. A
number of aspects of technique execution and limb position can affect moment distribution in unilateral
exercises. Direction of the step taken during the lunging exercise affects joint loading, with a forward
direction showing higher demand on hip as compared to a lateral direction, which increases demand on
ankle and knee extensors [318]. A further study confirmed the dominance of the hip extensors in the
anterior lunge, while demonstrating that loading effects the three lower limb joints in a distinct manner
[285]. The position of both the dominant and supporting legs in these exercises is also seen to alter
contribution from the hip and ankle. Moment distribution in split squats is dependent on step length and
front knee position, while load alternatively affects the hip and ankle but not knee [319]. Varying the
position of the support leg in single leg squats affects similar outcomes; back (as compared to forward
or mid) position increases knee extensor and decreases hip extensor moment [62]. Finally, joint
contribution can also be altered by conducting the single leg squat on varying angles of a decline board,
a steeper angle increasing the knee moment and decreasing moments at the hip and ankle [320].
67
2.6.2 Ballistic and Explosive Lifts
Exercise selection for developing power as opposed to strength per se, generally utilise ballistic or
explosive movements [48, 283]. Jumping has been shown to be a hip dependent movement pattern and
is seen to have a similar contribution of hip extension as the back squat when compared at the same
load [293, 321]. In keeping with the increased movement speed and hence joint angular velocities of
the explosive exercise, joint powers are higher in the squat jump confirming their benefit for athletic
development [321]. Further, jump shrugs produce far higher joint angular velocities than hang cleans,
results being related these to the more ballistic nature of the lift [300]. While a number of standard lifts
have observed a higher contribution of the ankle moment than knee, in developing power the knee is
reported as higher than the ankle in both jumps and Olympic lifts [57, 58]. Kipp et al. [57] further noted
the differences in the relationships of joint torque and joint power at each joint to loading could be
explained by the contribution of joint angular velocity in the power term. In this study, joint angular
velocity had no apparent relationship to load at any joint and, in such a case, increased contribution of
the knee could be more related to the moment arm of the ground reaction force about the knee than the
external load.
Olympic weightlifting movements are known to demand high levels of external power delivery and
have, therefore, been recommended as the superior exercises for athlete development [283]. However,
the necessity for technical proficiency in these lifts has led to their application being questioned in lieu
of utilising loaded jumps to the same end [301]. The relationship of Olympic lifts to loaded jumping is
therefore of interest. Canavan et al. [322] compared snatch and vertical jump performance and
determined that the kinetics of performance were highly similar supporting the beneficial inclusion of
either type of exercise in athlete programming. However, joint level analysis is more revealing. Cleather
et al. [235] compared jumping and jerking concluding they had unique sagittal plane strategies. The
push jerk was observed to be more knee dominant, where vertical jump observed a more equal
contribution of hip and knee. The relationship between jumping and jerking did, however, appear to be
68
load dependent. Cushion et al. [323] concluded that there was a partial correspondence in push jerk,
unloaded countermovement jump and loaded jump squat with correlations between joint kinetic profiles
significant at certain loads. The relationship of each exercise with load was demonstrably exercise
depended, with push jerk displaying a much greater increase in joint moments with load than jumping.
A number of studies have described joint kinetics in Olympic lifts or derivatives. Relative importance
of the hip has been reported in snatch variations. Hip joint power is seen to be a critical determinant of
whole body power in the power snatch [324]. In the full snatch, knee joint moments are small,
representing a third of those at the hip, and are not correlated with load lifted [303]. In fact, higher
standard of lifters limit knee joint moment by control of knee position with respect to the ground
reaction force vector [303]. Examining joint torque during the pull phase of the clean exercise, Kipp et
al. [57] determined that hip torque dominated effort contribution, followed by the ankle. Increasing the
load lifted affected an increased torque at both joints to the highest load, where knee contribution peaked
at a 75% 1RM load suggesting little advantage of training heavier for this particular joint. Separately
comparing the power clean and jump shrug, the research group found joint, load and lift dependent
behaviour [325]. While positive work increased with load in both lifts, unique relative loads were found
to maximise work for each joint, with distribution of work across the joints further impacted distinctly
by load. Although Hayashi et al. [97] demonstrated that peak joint torques increased at all joints with
load during the pull phase of the clean, discriminatory effects on joint power was less clear due to an
inconsistent interaction of load with joint angular velocity. Since joint angular velocity is seen to be
higher when conducting explosive exercises in a ballistic manner, the weightlifting derivatives without
the catch phase may represent the ideal combination [300]. Such lifts have been shown to produce
superior external power, and indeed Kipp et al. [325] determined that the jump shrug had greater load-
averaged hip and knee positive work, and peak knee and ankle joint power. Further comparisons of
exercises would be beneficial in this regard.
69
2.7 Summary and Conclusions
Inverse dynamics provides an effective means of assessing the functional performance of athletes,
allowing prediction of the distribution of muscular effort across the joints during movement. Studies
reporting joint kinetics of cycling have demonstrated some distinctions in trials of all-out sprinting as
compared to steady-state conditions. Results also show a clear dependency on pedalling rate and riding
position, in particular whether conducting the trial in a seated or standing position. Sprint cycling
requires production of maximum muscular power output in both seated and standing positions, while
competitive cadences extend beyond 150rpm. At such high limb speeds the ability to effectively direct
force around the pedal stroke is challenged and studies have shown performance variability increases
at high cadence. Although expert performers are likely to express more skilled coordinative patterns,
no study has conducted a full joint-specific analysis in highly-trained sprint cyclists. In such cases,
current reports of joint kinetics of sprint cycling may be inconsistent and assessment of sprinting in an
appropriate population would be beneficial.
Two dimensional processes in inverse solutions are seen to be susceptible to inaccuracies when
compared against gold-standard 3D systems. Studies of movement involving significant frontal and
transverse plane motion or involving at least significant non-sagittal motion of the pelvis, have
concluded that the use of 3D motion capture techniques is essential. Although cycling is predominantly
a sagittal plane movement, non-sagittal plane motion of the pelvis is apparent, and, indeed cross-hip
joint-power contributions appear discriminatory in maximal conditions, particularly in standing. The
use of triaxial force data has been show as critical to accurate joint kinetic assessment in cycling.
However, it is unknown to what extent motion out of the sagittal plane at either the hip, knee or ankle
would additionally contribute to sagittal plane joint kinetics. Acquisition of force data and subsequent
synchronisation with kinematic data can be problematic in cycling and 3D processes require bespoke
solutions. System design facilitating 3D analysis, and subsequent evaluation of 3D as compared to 2D
outcomes, would inform biomechanical testing practices for high performance cycling.

70
Although resistance training is a constituent part of the training week of sprint cyclists, the relationship
of the applied exercises to the goal movement is poorly understood. Lower limb joint kinetics in
weightlifting are demonstrably affected by the skill level of the performer, position and magnitude of
the load, relationship of the body segments to the load position, as well as technical aspects of body
position and lift execution. For an accurate comparison with cycling, assessment of joint kinetics in
weightlifting must be done with applicable exercises and loads and using the same athletes. Conducting
a biomechanical analysis and comparison of both on- and off- bike training modalities in expert
performers would provide an effective means of better understanding appropriate exercise selection,
hence supporting improvements in training to the highest levels of performance in sprint cycling.

Chapters 3, 4 and 5 are not included in this version of the thesis
164
6 Summary, Conclusions and Recommendations
6.1 Thesis Summary and Implications
Biomechanical understanding of sports performance underpins training practices for athlete
development. Indeed, the principles of dynamic correspondence are dependent on a thorough
assessment of the movement kinematics and kinetics [5]. While being able to monitor small but
meaningful changes in movement is important in athlete development and performance [2], several
sources of error are common within various applied biomechanics methodologies [68]. There has been
little research examining the use of motion-capture technologies to assess sprint cycling performance,
and limited evidence of the reliability of the testing practices and results. Developing a means of
conducting cycling kinematic and kinetic assessments that are reproducible in repeat testing would
allow biomechanical data to become an integral part of performance monitoring processes for high
performance sprint cyclists. Cycling biomechanics are critically influenced by cadence and riding
position [364], yet detailed assessment of the effect of these factors on cycling kinematics and kinetics,
particularly in sprint cycling performance, is lacking. Testing reliability may, additionally, be affected
by both the cadence and riding position utilised in the testing protocol. Therefore, the aims of this thesis
were to: i) determine the accuracy and reliability of assessing the joint kinetics in highly-trained sprint
cyclists, ii) investigate the impact of changing cadence and riding position on joint kinetics and testing
reliability and iii) determine the similarities and differences in the athletes joint kinetics during sprint
cycling with those during execution of resistance training exercises used to develop athletes’ strength
characteristics. To achieve these aims a custom system was built and utilised in the three studies
comprising this project.
Key findings of this thesis are that: i) higher accuracy of results are obtained using 3D, compared with
2D joint kinetic analysis; ii) high reliability in crank power and total muscle power were observed using
3D analysis, particularly at a rider’s optimal cadence for power production; iii) reliability of joint-
165
specific powers were lower than observed in crank and total muscle power, with reliability values
impacted by cadence, and whether the power is assessed over the extension or flexion phase of joint
action; iv) mean and maximal crank and total muscle power demonstrate a quadratic relationship with
cadence, whereas the relationships observed at contributing joints are quadratic or linear (both positive
or negative); optimal cadence for maximising power production is, therefore, unique to each joint; v)
although the standing position allows greater power to be produced at the crank, riding position
distinctly effects the cadence relationships observed at the joints such that contribution of joint-specific
power to crank power is position dependent; vi) joint kinetics of both seated and standing sprint cycling
performance has similarities with those observed through specific phases of the clean exercise,
predominantly at the hip; vii) joint kinetics of other resistance exercises examined were uniquely
affected by the particular mechanics of the lift, with a relative hip- or knee- dominance observed.
Current biomechanics practices for assessing joint kinetics consider 3D methodologies as the gold
standard [177]. Indeed, while process errors are well documented in both 2D and 3D methodologies,
comparisons in non-cycling movements suggest 3D analysis is more accurate [72, 75]. However, 2D
systems offer increased flexibility and portability, which would be of particular benefit for regular
testing in the training and testing schedules of elite athletes [67]. To date, most studies in cycling have
been restricted to 2D systems. This is due to the predominance of movement in the sagittal-plane, and,
more critically, the challenges of integrating pedal force data into the data acquisition and modelling
packages of 3D systems [71]. As such, the first important outcome within this thesis was the design,
construction and refinement of a data acquisition and modelling system for high-level cycling analysis.
This system utilised custom force pedals that are both robust enough to withstand the forces delivered
by high level sprint cyclists but sensitive enough to detect small changes in force patterns. The data
acquisition and modelling aspects of the system were then designed to have flexibility that permits use
with either 2D or 3D techniques. As part of that design process a unique and custom-built solution for
force sensor calibration was also achieved allowing calibration to be conducted in situ, avoiding any
need to dismantle the pedal system. This system is appropriate for widespread use in cycling and has a
166
far wider scope than the research contained within this thesis. Indeed, the data capture system and
calibration devices developed in this thesis are now being utilised in the assessment of cycling
biomechanics of Australia’s most talented cyclists. It is noted that non-motion capture technologies,
such as the Martin laboratory’s integrated spatial linkage system [329], have been successfully used in
cycling research and may provide more flexible solutions in field-based settings. However, the
integrated spatial linkage system still only utilises 2D coordinate system, and indeed references
movement to the positioning to the hip joint centre position, which is susceptible to its own errors.
A number of limitations of biomechanical processes and current available technologies were overcome
by the methodologies utilised within this thesis. Although technology to assess kinetics at the crank is
widely available, Bini et al. [207] demonstrated that crank-based analysis overestimated power and
underestimated torque when compared with instrumented pedals. Data resolution of crank systems are,
at best, 250Hz where the pedal force system utilised within this thesis captured data at 1000Hz.
Furthermore, assessing crank power, rather than pedal and joint-specific power, provides only limited
information on performance. In sprint cycling, the ability to produce maximal muscular power is
discriminatory and, therefore it is important to assess how such power is being developed and delivered
[11]. Understanding of muscle mechanics indicates it is the coordinative pattern rather than individual
muscle capabilities that is critical to power production [14]. Yet, limitations are evident in analysis of
coordination patterns through EMG. Patterns are highly variable and the relationship of observed
activity to performance is not exact [20]. In fact, not all contributing muscles are recruited maximally
during sprint cycling performance [23]. The use of joint kinetic analysis in this thesis provided a non-
invasive means of evaluating the net muscle activity affecting movement at each joint and decomposing
muscular from non-muscular contributions to external power [36]. Results demonstrated clear benefit
of the joint kinetics testing process, providing confirmation that performance conditions such as cadence
and riding position impact the net muscular activity each joint; information unable to be ascertained at
crank level.
167
Outcomes of the first study provide the basis for selecting either 2D or 3D processes for assessing
cycling performance. Results indicate significant differences in hip, knee and hip transfer powers using
2D, compared with 3D methods. It may, therefore, be ideal to utilise 3D analysis techniques. However,
given that most athlete testing is assessing the impact of acute or chronic intervention, quantifying the
absolute values of data may not be critical, instead identifying relative changes may be more important.
In such cases, the 2D system may still provide an acceptable testing tool so long as the practitioner
appreciates the compromises in absolute profiles. The first hypothesis of this thesis was, therefore
substantiated, with greater accuracy in determining joint kinetics using a 3D, as compared to 2D system.
However, the second hypothesis stated that errors would be greatest at the hip. In fact, the knee and hip
transfer terms were most affected. These findings were largely due to movement out of the frontal plane
and, at the knee, errors in the segment lengths and moment arms through the crank cycle. The hypothesis
of significant differences at the hip was only partially supported. Magnitudes of hip powers were
unaffected, while phase shifts in the position of peak power around the crank cycle were apparent. These
phase shifts were largely due to differences in joint angular velocities, and hence related to established
range of motion differences as well as joint centre position. Alkaejer et al. [76] demonstrated that hip
(but not knee) errors could be reduced by utilising 3D positional data reduced to 2D, which although
confirming the relationship to hip joint centre location, does not assist improving a stand-alone 2D
system. However, it is plausible that the extent of errors in 2D as compared to 3D assessment could be
quantified and used to apply corrective adjustments to 2D results. This would be a fruitful area of
exploration for future research. In broader terms, results also confirm that a frontal-plane component
does make a significant contribution in sprint cycling. Results of Study One showed no interaction of
motion-capture condition with riding position and, as such, differences between 2D and 3D were
equivalent in and out the saddle. Comparisons of the two positions did, however, establish some key
distinctions of joint-kinetics when sprinting in the standing position. The comparison between standing
and seated sprinting was further extended in Study Two. Only a single study by Davidson et al., [73]
printed as abstract only, has examined sprinting out the saddle. This thesis, therefore, provides novel
data demonstrating that out of the saddle sprinting uniquely impacts the contributions at each joint.
168
While hip, hip transfer, muscle and crank powers across the full revolution were greater in standing,
compared with seated sprinting, decomposing the movement into extension and flexion phases
indicated that knee flexion power decreased, whereas hip flexion increased, during standing. Hip power
therefore contributed to greater total muscle and crank power in the standing compared with the seated
condition. Study Two showed that this compensatory shift of joint emphasis is further exaggerated at
higher cadences. While knee range of motion increased in standing, no such change was observed at
the hip. Yet the position of maxima and minima of joint excursion altered concomitant to the more
forward position of the body in standing, affecting a shift in the position of peak power delivery at the
crank. Joint powers also consistently reflected this phase advancement. Collectively, an extended duty
cycle through extension would augment power delivery. The more detailed analysis in this thesis
demonstrated that, in fact, conclusions drawn in the Davidson et al. abstract [73] only provide part
explanation for positional differences. Understanding these differences can assist the training process
for athletes. In terms of movement mechanics, sprinting effectively consists of two distinct movement
patterns that uniquely load the contributing muscles. Not only does this impact the understanding of
supply versus demand in the aerodynamic trade-offs in each position, but the strength characteristics
required by standing and seated sprinting require different training stimuli or emphasis in gym-based
interventions. The importance of understanding the unique relationships between sprinting and strength
exercises was extensively examined within Study Three, which highlighted that the torque-angular
velocity relationships in each riding position affects the relevance of particular conditioning exercises.
Study Two further determined that, while the total muscle power term reflects the quadratic power-
cadence relationships observed at the crank, the joints show distinct profiles. The third hypothesis
asserted that cadence conditions would affect joint power distribution. This hypothesis was, therefore,
confirmed. This highlights that disparate task demands affect the optimal coordinative strategy to
maximise global muscle power. Implications of this finding may be of critical importance in testing
practices, since test cadence is commonly selected to maximise external power. In fact, a novel finding
169
of this thesis is that optimal cadence at the crank will represent a compromise in joint-specific power
production. Assessment of maximal muscle function may, then require a joint-specific approach to
testing and analysis. The equivalent hypothesis (hypothesis four) on the effects of riding position was
confirmed with the exception of knee power. Results of Study Three additionally demonstrated the knee
torque-angular velocity characteristics are equivalent in each riding position. This provided explanation
for lack of main effect at the knee for riding position in Studies One and Two, though a significant
interaction of cadence and seating position did distinguish that knee power continued to increase in the
high cadence condition in standing. Hip power alternatively continued to increase at high cadence while
seated, and again these results emphasise that unique functional characteristics are required to optimise
performance in different riding conditions. In contrast, the ankle contributed greater power at low
compared to higher cadences. Study Three added to the unique findings presented in this thesis with
respect to the ankle. High torque conditions of low cadence pedalling require an ‘ankling’ motion that
assists in force production, while an ankle fixated in plantar flexion improves limb control and force
transference from the proximal joints at high cadences. These observations provide explanation for the
ankle power-cadence relationship observed in Study Two. Collectively, these results characterise that
the joints play distinct roles in different performance conditions. It is noted that joint-level analysis has
its limitations, and that, indeed, the relationship between joint- and muscle- level analysis is far from
trivial. However, the current research outcomes further our understanding of the biomechanics of skilled
sprint cycling performance and can significantly contribute to improving the training strategies for
sprint cycling. For example, previous studies have suggested that increased musculo-tendon stiffness at
the ankle discriminates higher performances in sprint cycling [112], and the current study provides
justification for training to that end. The distinct torque-angular velocity relationship of the ankle
requires consideration when applying commonly used ‘triple-extension’ patterns in the gym, since the
ankle does not perform in a congruent manner to the other two joints.
A number of findings of this thesis with respect to seated sprinting were consistent with previous study
results [40, 205, 266] and confirm that joint kinetics of sprint performance show some disparity from
170
those in submaximal conditions [38, 39]. There appears to be an increased contribution of upper body
and lower limb flexion in sprint cycling performance compared to submaximal riding. Although it has
been suggested that these strategies are inefficient in cycling [159], unlike the movement efficiency
demanded by steady-state riding, the goal task in sprinting is to achieve maximum muscular power
output. Prior studies have, therefore, suggested that in this context, joint flexion and upper body
movement would actually be beneficial [39]. Since existing studies have utilised non-sprint trained
populations it had previously not been confirmed whether the joint kinetic profiles observed would be
upheld in skilled performers. The data from this thesis indicates substantial similarities, although some
further nuances in performance were observed – notably the mechanics of the ankle and high
magnitudes of ankle power. However, without establishing the consistency of joint kinetic results, the
relationship of small observed changes in net moments and powers cannot be irrefutably related to
sprint-specific mechanics. It was hypothesised in this thesis that a high degree of reliability would be
observed of results in repeat testing. This was confirmed for data through the primary power phase of
performance. However, critically, flexion and upper body powers showed least within-days reliability;
coefficients of variation of flexor and upper body power were substantially higher than extension and
lower limb powers. Given that skilled performers are known to display greater consistency of movement
patterns [83, 333], poor reliability in this cohort is an interesting outcome. The variability of joint power
out with the primary power production phase may then either be related to being a less refined part of
the movement pattern, or equally may be evidence that the ancillary part of the movement fulfils a
dynamic optimisation role, varying in response to movement conditions in order to improve power
delivery to the crank.
High within-days reliability values of crank and muscle power confirm that total muscle power output
is relatively consistent within the cohort examined in this thesis. Notably, the muscle term is derived
from summated joint terms, and yet shows greater reliability than observed at the individual joints. In
such a case, although external power output is maintained, some inherent variability in the underlying
control strategy is, therefore, likely revealed through this analysis. With ankle power showing greater

171
variability than the hip and knee (as evidenced by higher CV), this may provide further evidence of the
joint’s role in ‘tuning’ overall limb and muscle function, movement dynamics altered to help optimise
power production around the crank cycle. The impact of cadence and riding position on the reliability
of power values suggest that variance is also greater out with ideal performance conditions for
maximising muscle power. Optimal cadence represents the pedal rate at which the athlete can generate
most external power output, in other words where a global maximum of muscle power output can be
achieved. The finding of greatest reliability at this cadence is a notable finding of this study, since it
confirms that the overall motor control pattern is most consistent at this pedal rate. Flexibility of the
motor domain may be more important where performance conditions are more challenging i.e. where
high muscle force or contraction velocities are required. Though again this could be reflective of less
refined movement control at the extremes of performance. It would be interesting to examine changes
in reliability following an extended period of training at such cadences or between populations of
different history.
Of course systematic error would substantially affect testing reliability. However, this would be
consistent across all trial conditions. Low between-weeks variances across all dependent variables
support the use of these testing practices for elite performance since accurate inference can be made
about changes observed in repeat testing. A unique aspect of the statistical approach used in Study Two
was the ability to partition the variance, allowing contributing factors in distinct performance conditions
to be established. The impact of trial conditions on reliability results are a key finding of this thesis and
provides important information for the application of joint kinetic testing. This is a consideration that
likely has relevance for joint kinetic testing in other sports. Controlling for between-athletes variances
in the modelling of all three studies was also a significant benefit of the methodology applied in this
thesis. The between-athlete variance accounted for the greater part of variance in Study Two and,
indeed, allowing the intercept of models to vary with athlete allowed identification of underlying
patterns that may have otherwise been clouded by individual differences. Individual response is a
challenging issue for sports science research where group means are required to confirm or refute
172
hypothesis. And yet individual differences are cornerstone of specificity in training prescription.
Including the athlete as a random term in model fit further revealed higher between-athlete variation in
resistance exercises as compared to cycling. This suggested that some individualisation in the ability to
express strength during lifting, where greater consistency is observed in their skilled movement pattern.
The application of the methodologies utilised in this thesis allow coaches and sports scientists to assess
how acute changes in functional conditions may impact future performance. For example, small
changes in bike set-up may appear to have little effect on power measured at the crank in acute testing,
where altered joint-specific power profile might provide insight into potential impact of the change.
Given that Martin and Brown [40] have established that the net muscular contribution at each joint is
uniquely affected by fatigue, changing the coordinative strategy could also impact performance by
creating a different muscular fatigue profile over the course of the sprint. The testing process could,
then, benefit determination of where an intervention to change or improve the contribution of supporting
muscle groups is needed, with repeat testing informing the efficacy of the intervention itself. Results of
Study Three provide particular benefit in this regard, allowing coaches to make informed decisions
around exercise selection. Disparity between the cycling and lifting performance of sprint cyclists is
commonly reported in training squads and, while FV profiles are generally used to examine the
functional performances of athletes, those derived from on and off the bike techniques are incomparable
[16, 140, 365]. Examination of the joint torque-angular velocity profiles in this thesis presented a novel
means of relating the performances. This provides the means for coaches to assess relative similarities
of movements and supports more informed decisions on exercise selection to target improvement in the
strength capabilities of specific muscular action. Since ‘strength’ represents force capabilities under
specific movement conditions, assessment of joint kinetics also provides the means to determine how
well performance in any exercise is meaningful to the context of their bike performance.

173
The finding of some similarities between the torque-angular velocity profiles of the clean and seated
and standing sprint, upholds hypothesis seven of this thesis. The association of distinct derivative phases
of the clean to each riding positions highlighted the impact of movement velocity on the relationship
between the exercise modalities. Ballistic exercises have previously been recommended as more
beneficial to improving power characteristics due to higher movement velocities and studies have
suggested that weightlifting derivatives that do not require the catch phase would be ideal [300]. Jump
squats are a commonly used exercise for training and testing power performance and, indeed the lower
technical demands of the jump may permit the development of higher joint torque through this exercise.
Additionally, previous research suggests jump shrugs may provide a better stimulus for power
development [325] and assessment of their relationship to the cycling movement would be beneficial.
Future research opportunities are, therefore, apparent in this area. The variation in joint dominance of
the strength exercises tested also confirmed hypothesis eight, since position of the load and kinematic
profile of the lift effected a unique joint kinetic profile in each exercise. Similarly hypothesis nine was
also confirmed, since hip and knee torque in each exercise was relatively greater or less than in seated
or standing cycling. This suggested relevance of utilising certain exercises in a joint-targeted manner,
exercise selection being focussed on a hip or knee emphasis. At the hip, maximum torque in the single
leg rack pull was distinguished as being substantially higher than produced on the bike, where at the
knee, the box step-up showed greater maximum torque. Greater torque demands in exercises where
primary drive happens through a single leading leg, supports the efficacy of unilateral lifts for strength
development.
The findings of this thesis can aid the specificity and individualisation of training prescription for sprint
cyclists. Results do, however, draw into question the overall ethos of gym based exercise to improve
bike related strength. Joint-specific maximum torque was higher on the bike than the bilateral (though
notably not unilateral) resistance exercises. Results of this thesis suggest that on-bike performance
conditions can be effectively manipulated to exaggerate loading emphasis towards joint-specific
strength improvement. Given the increased variance of torque production during lifts as compared to
174
bike performance, athletes would also be more able to express their maximum force characteristics in
this more-familiar movement pattern. Further, triple extension lifting patterns are most commonly
applied for training cyclists [54], yet the unique characteristics of the ankle on the bike would suggest
a somewhat distinct lower limb coordinative strategy. This would be further distinguished when
considering the contributions of the biarticulate muscles in the integrated movement. Cadence, and
hence FV conditions, can be easily manipulated on a bike and exaggerating the force demands at the
pedals is easy to achieve. In such a case, the bike itself could be used to provide an effective overload
as stimulus for strength gains.
Joint kinetic analysis provides an effective means of estimating net muscle action during movement,
and this thesis suggests it may be a useful tool to inform training practices for elite sprint cyclists. It
must be noted, however, that inverse dynamics fails to account for the activity of biarticulate muscles.
Previous studies have suggested some unique complexities in the cycling action in this regard [93, 168].
Indeed calculations of average joint moments in Study Three revealed phases of conflicting moment
and angular velocity direction suggesting the critical influence of biarticulate activity through particular
regions of the pedal stroke and particular phases of movement in the resistance exercises. This thesis
examined only the phases of extension where positive power was produced, permitting appropriate
comparison between the different exercise modalities. However, the full extent of biarticulate muscle
action across the pedal stroke would not be apparent using inverse dynamics. Approaches such as
biarticular load compensation [256] or static optimisation [366], may offer alternative solutions.
Additionally while the current testing system provided a novel solution to testing cycling biomechanics,
the equipment only permitted assessment in a stationary cycling position. Prior study has, in fact,
demonstrated compatibility of assessing power-cadence relationships on the SRM cycle ergometer used
in this study to field-performance in elite track sprint cyclists [124]. Hence, while further study
confirming this relationship is recommended, the current methodology can certainly be supported as
providing a meaningful context for the assessment of athlete characteristics. By answering some key
methodological questions and establishing fundamental joint-specific performance relationships, the
175
custom system and results of this thesis provide an increased understanding of joint kinetics in highly-
trained sprint cyclists. The information presented helps improve the testing and training processes of
the athletes and indeed, can be used to improve prescriptive practices. A number of novel outcomes
were presented in this thesis benefiting advancement of the sport.
6.2 Directions for Future Research
The custom testing equipment provided the foundations for this research. However, a number of aspects
of the design solution were challenging and present opportunity for future exploration. Unlike in-floor
force platforms, the exact centre of pressure of the force vector could not be established and warrants a
more accurate solution. A sensitivity analysis would also benefit understanding the impact of imprecise
centre of pressure location on outcome measures. Comparisons of the 2D and 3D methodologies
demonstrated the impact of distinct algorithms being applied in the background of different analysis
packages with, for example, filters designed to the same specifications producing marginally different
results. Improvements in the modelling process could also be affected through individualisation of the
inertial parameters. Although possible using current medical scanning devices, such processes are
highly expensive and an alternative solution is warranted. The 2D system is cheaper and more flexible
than 3D systems. However, the inherent nature of manual synchronisation and manual or semi-
automatic trajectory tracking creates a labour-intensive process. The accuracy of the 2D kinematics
could also be improved through increased data resolution. Again, costs are currently a deterrent, since
higher frame rates increase camera costs substantially. The pedal system itself also offers future research
potential in both the sensor technology and opportunity for wireless transmission of data.
Recommendations from Study One suggested that the ability to quantify the inaccuracies of 2D
processes may permit correction terms being applied to 2D outcomes. The reliability of the 2D testing
protocol should also be established to support regular testing. Differences in reliability results through

176
for example, skill level, or degree of fatigue could also be established. Since the reliability study
revealed that trial conditions impacted results, it would be similarly beneficial to assess the consistency
of performance in resistance exercises and, indeed, establish differences in using 2D processes for
assessing lifts. Testing of additional exercises, particularly jump squats and jump shrugs, would also be
highly beneficial. Additionally, although execution of the clean exercise demands maximal velocity
intent from the hang phase onwards, other lifts executed at non maximal loads may be executed with
less than maximal intent. A comparison of joint-specific torque-angular velocity characteristics of a full
spectrum of lifts across loads at maximal intent would augment current observations. With this
information, it may then be that joint kinetics could be predicted from bar velocities. Given that gym
testing often utilises linear position transducers attached to the bar in regular training sessions, this
would provide an easy means of determining relative joint loading in any exercise condition.
The methodologies of this thesis provide the means to assess the effects of acute and chronic
interventions on joint powers. Several areas of research would be of immediate benefit to the sport in
this regard, including bike-position and the effects of fatigue. The outcomes of this thesis also provide
the basis for a more extensive model of sprint cycling performance. Having built a profile of athlete
characteristics across riding and lifting conditions, and with individualised inertial parameters in the
model, the data could be used to provide predictive outcomes. Including the results of forward dynamics
solutions and as well as terms involving the power demand side of the equation would support a full
supply-demand model of sprint cycling. Some existing work from other laboratories has already
established some of the methodology needed to this end [367].
6.3 Conclusion
In summary, this thesis aimed to investigate the joint kinetics of highly-trained sprint cyclists and
provide information supporting the use of joint kinetic assessment as part of regular testing and training
practices. A custom-designed force pedal system was established and evaluation was made of its use as
177
part of 2D as compared to 3D analysis processes. Having established the greater accuracy of the 3D
system, the reliability of the 3D process was then analysed while simultaneously examining the impact
of cadence and seating condition on joint kinetics. Finally, comparison was made of joint kinetics of
sprint cycling with that of resistance exercises commonly used to improve the strength characteristics
of athletes in order to help improve the specificity of programming practices.
This thesis concludes the following:
1) Differences are apparent in sagittal-plane joint kinetics assessed in 2D as compared to 3D, with
magnitude of knee power lower and hip transfer power higher. Hip range of motion is
significantly lower when assessed in 2D, while position of peak hip power is shifted to later in
the pedal stroke. Such distinctions must be considered when comparing results of distinct
analysis processes.
2) 3D processes are recommended where absolute values of joint kinetic profiles are important.
The flexibility of 2D systems offer advantages in the training environment and 2D analysis still
provide a valid assessment tool where relative changes in profile are of interest or where
assessment is only concerned with the absolute values of unaffected measures.
3) A quadratic power-cadence relationship is observed at the crank and for total muscle power,
with absolute values greater in standing as compared to seated cycling. However, contribution
of each joint to total muscle power is uniquely related to both cadence and riding position. The
hip displays a linear maximum power-cadence relationship in seated but quadratic in standing,
while the knee displays the reverse. Ankle and hip transfer powers linearly declines with
cadence both seated and standing. Underlying strategies and effort distribution cannot,
therefore be directly inferred from power assessed at the crank, with optimal cadence for crank
power representing a compromise in joint-specific power production.
4) Reliability of crank and muscle power is high, with coefficient of variation particularly low at
the rider’s optimal cadence. While reliability of contributing joint powers is slightly lower,
control strategies appear to maintain consistent external power despite variability in the
178
underlying distribution of muscular effort. Some variation in joint powers may be important in
achieving dynamic optimisation of the task
5) While reliability at low to mid cadences is good in lower limb extension powers, high cadence
pedalling (particularly in standing), lower limb flexion power and hip transfer power values are
less consistent. Increased variation in these measures may be related both to the inherent
challenge of the movement conditions and to the need for greater flexibility of the control
domain in extreme performance conditions. Consideration must be given to unique
performance variability associated with different joints and trial conditions when examining
testing results.
6) Hip extensor torque is predominant in sprint cycling, and higher relative hip torques in the
clean, deadlift, Romanian deadlift and single rack pull present these as effective choices for
strength improvement at the hip for sprint cyclists.
7) The hip torque-angular velocity relationship of sprint performance in the saddle is equivalent
to that of the 2nd pull in the clean, while that of sprinting out the saddle is equivalent to the hang
pull, with differences largely related to the movement speed through each phase of the clean.
The clean therefore provides a somewhat similar stimulus at the hip as sprint cycling.
8) Knee torque is consistently much greater than in any phase of the clean and technical
complexities at the knee through the clean confound its relationship to sprint knee joint kinetics.
In contrast knee torque in the step-up exceeds that of sprint performance and may provide an
effective strength training stimulus for knee musculature.
9) Ankle torque-angular velocity relationships are distinct from all other joint-exercise conditions
in showing a positive linear relationship. The ankle is seen to function in a distinct manner,
benefitting high force production through ‘ankling’ action at low cadence, but becoming
increasingly fixated to allow for efficient force transference and maintaining limb trajectory at
high cadence. Optimisation of force production at the ankle for sprint cycling performance
must, therefore, be considered distinctly from the other contributing joints.
179
Overall findings of this thesis suggest joint kinetic analysis of highly-trained sprint cyclists can provide
information about underlying performance strategies that cannot be assessed through conventional
testing or through assessment solely at the crank. High reliability of the testing process for lower limb
joint extension supports its incorporation into regular testing practices for athletes. Consistent power at
the crank, in spite of variation in joint kinetics, suggests that the motor domain dynamically responds
to the task conditions and that some variability of muscle contribution is inherent in skilled riders. Future
research examining the extent to which this can be exploited to increase the global maximum power
produced would be beneficial. Reliability statistics presented in this thesis support monitoring processes
incorporating joint kinetic assessment, since the effects of both acute and chronic interventions can be
assessed in greater detail than is provided by crank power alone. In this regard the reliability statistics
presented provide critical information for accurate interpretation of results. The comparison of sprint
cycling and resistance exercise performance provided evidence that can help inform exercise selection
for strength development. The ability to monitor changes and target training intervention at joint level
present highly beneficial outcomes that provide immediate practical benefit for training athletes to the
highest levels of competition in sprint cycling.
180
7 References
1. Martin JC. Myth and science in cycling: Crank length and pedalling technique. Seminar
presentation. Edith Cowan University, Perth, WA, 2009.
2. Hopkins W, Hawley JA and Burke L, Design and analysis of research on sport performance
enhancement. Medicine and Science in Sports and Exercise, 1999. 31: 472-485.
3. Smith DJ, A framework for understanding the training process leading to elite performance.
Sports Medicine, 2003. 33(15): 1103-1126.
4. Winter DA, Biomechanics and motor control of human movement. 2009, Canada: John Wiley
& Sons.
5. Goodwin JE and Cleather DJ, The biomechanical principles underpinning strength and
conditioning, in Strength and conditioning for sports performance, I. Jeffreys and J. Moody,
Editors. 2016, Routledge. 36-66.
6. Jeukendrup AE and Martin J, Improving cycling performance: How should we spend our time
and money. Sports Medicine, 2001. 31(7): 559-559.
7. Barratt PR, Martin JC, Elmer SJ and Korff T, Effects of pedal speed and crank length on
pedaling mechanics during submaximal cycling. Medicine and Science in Sports and Exercise,
2016. 48(4): 705-713.
8. van Soest AJ and Casius LJ, Which factors determine the optimal pedaling rate in sprint
cycling? Medicine and Science in Sports and Exercise, 2000. 32(11): 1927-1934.
9. Kordi M, Goodall S, Barratt P, Rowley N, Leeder J and Howatson G, Relation between peak
power output in sprint cycling and maximum voluntary isometric torque production. Journal of
Electromyography and Kinesiology, 2017. 35: 95-99.
10. Fonda B and Sarabon N, Biomechanics of cycling. Sport Science Review, 2010. 19(1-2): 187-
210.

181
11. Martin JC, Davidson CJ and Pardyjak ER, Understanding sprint-cycling performance: The
integration of muscle power, resistance, and modeling. International Journal of Sports
Physiology and Performance, 2007. 2(1): 5-21.
12. Martin JC, Muscle power: The interaction of cycle frequency and shortening velocity. Exercise
and Sport Sciences Reviews, 2007. 35(2): 74-81.
13. de Groot G, Welbergen E, Clijsen L, Clarijs J, Cabri J and Antonis J, Power, muscular work,
and external forces in cycling. Ergonomics, 1994. 37(1): 31-42.
14. Wakeling JM, Blake OM and Chan HK, Muscle coordination is key to the power output and
mechanical efficiency of limb movements. Journal of Experimental Biology, 2010. 213(3):
487-492.
15. Theurel J, Crepin M, Foissac M and Temprado JJ, Effects of different pedalling techniques on
muscle fatigue and mechanical efficiency during prolonged cycling. Scandinavian Journal of
Medicine and Science in Sports, 2012. 22(6): 714-721.
16. Driss T and Vandewalle H, The measurement of maximal (anaerobic) power output on a cycle
ergometer: A critical review. BioMed Research International, 2013. 2013: 589361.
17. Bini RR, Hume P, Croft JL and Kilding A, Pedal force effectiveness in cycling: A review of
constraints and training effects. Journal of Science and Cycling, 2013. 2(1): 11-24.
18. Bini RR and Diefenthaeler F, Mechanical work and coordinative pattern of cycling: A literature
review. Kinesiology, 2009. 41(1): 25-39.
19. Dorel S, Fohanno V, Boucher M and Rao G. Neuromechanics of cycling: Opportunities for
optizing performance. in ISBS-Conference Proceedings Archive. 2016.
20. Hug F, Drouet JM, Champoux Y, Couturier A and Dorel S, Interindividual variability of
electromyographic patterns and pedal force profiles in trained cyclists. European Journal of
Applied Physiology, 2008. 104(4): 667-678.
21. Chapman AR, Vicenzino B, Blanch P, Knox JJ and Hodges PW, Leg muscle recruitment in
highly trained cyclists. Journal of Sports Sciences, 2006. 24(2): 115-124.
22. So RCH, Ng JKF and Ng GYF, Muscle recruitment pattern in cycling: A review. Physical
Therapy in Sport, 2005. 6(2): 89-96.
182
23. Dorel S, Guilhem G, Couturier A and Hug F, Adjustment of muscle coordination during an all-
out sprint cycling task. Medicine and Science in Sports and Exercise 2012. 44(11): 2154-2164.
24. MacIntosh BR, Neptune RR and Horton JF, Cadence, power, and muscle activation in cycle
ergometry. Medicine and Science in Sports and Exercise, 2000. 32(7): 1281-1287.
25. Li L, Neuromuscular control and coordination during cycling. Research Quarterly for Exercise
and Sport, 2004. 75(1): 16-22.
26. McGhie D and Ettema G, The effect of cadence on timing of muscle activation and mechanical
output in cycling: On the activation dynamics hypothesis. Journal of Electromyography and
Kinesiology, 2011. 21(1): 18-24.
27. Neptune RR, Kautz SA and Hull ML, The effect of pedaling rate on coordination in cycling.
Journal of Biomechanics, 1997. 30(10): 1051-1058.
28. Sanderson DJ, Martin P, Honeyman G and Keefer J, Gastrocnemius and soleus muscle length,
velocity, and EMG responses to changes in pedalling cadence. Journal of Electromyography
and Kinesiology, 2006. 16(6): 642-649.
29. Hautier C, Arsac LM, Deghdegh K, Souquet J, Belli A and Lacour J-R, Influence of fatigue on
EMG/force ratio and cocontraction in cycling. Medicine and Science in Sports and Exercise,
2000. 32(4): 839-843.
30. Ericson MO, On the biomechanics of cycling. A study of joint and muscle load during exercise
on the bicycle ergometer. Scandinavian Journal of Rehabilitation Medicine, Supplement, 1986.
16: 1-43.
31. Gregor RJ, Broker JP and Ryan MM, The biomechanics of cycling. Exercise and Sport Sciences
Reviews, 1991. 19: 127-169.
32. Chapman AR, Vicenzino B, Blanch P, Knox JJ, Dowlan S and Hodges PW, The influence of
body position on leg kinematics and muscle recruitment during cycling. Journal of Science and
Medicine in Sport, 2008. 11(6): 519-526.
33. Dorel S, Couturier A and Hug F, Influence of different racing positions on mechanical and
electromyographic patterns during pedalling. Scandanavian Journal of Medicine and Science
in Sports, 2009. 19(1): 44-54.
183
34. Savelberg HHCM, Van de Port IGL and Willems PJB, Body configuration in cycling affects
muscle recruitment and movement pattern. Journal of Applied Biomechanics, 2003. 19: 310-
324.
35. Hirashima M and Oya T, How does the brain solve muscle redundancy? Filling the gap between
optimization and muscle synergy hypotheses. Neuroscience Research, 2016. 104: 80-87.
36. Wangerin M, Schmitt S, Stapelfeldt B and Gollhofer A, Inverse dynamics in cycling
performance, in Advances in medical engineering. Springer proceedings in physics., Springer:
Berlin, Heidelberg. 329-334.
37. Kautz SA and Hull ML, A theoretical basis for interpreting the force applied to the pedal in
cycling. Journal of Biomechanics, 1993. 26(2): 155-165.
38. Horscroft RD, Davidson CJ, McDaniel J, Hunter EL, Grisham JD, McNeil JM, Gidley LD,
Carroll C, Thompson FT and Martin JD, Joint power distribution differs during maximal and
submaximal cycling. Medicine and Science in Sports and Exercise, 2005. 37(5): S123.
39. Elmer SJ, Barratt PR, Korff T and Martin JC, Joint-specific power production during
submaximal and maximal cycling. Medicine and Science in Sports and Exercise, 2011. 43(10):
1940-1947.
40. Martin JC and Brown NA, Joint-specific power production and fatigue during maximal cycling.
Journal of Biomechanics, 2009. 42(4): 474-479.
41. Liao H-T, Lin Y-C, Pandy M and Tang W-T. Kinetic properties and EMG activity of normal
and over-speed pedaling in track sprint cyclists: A case study. in ISBS-Conference Proceedings
Archive. 2013.
42. Wheat J and Barratt P. Influence of body segment inertia parameters on uncertainties in joint
specific power during sprint cycling: A monte carlo simulation. in ISBS-Conference
Proceedings Archive. 2016.
43. McLean BD and Parker AW, An anthropometric analysis of elite Australian track cyclists.
Journal of Sports Sciences, 1989. 7(3): 247-255.
44. Suchomel TJ, Nimphius S and Stone MH, The importance of muscular strength in athletic
performance. Sports Medicine, 2016. 46(10): 1419-1449.
184
45. Evans M, Strength and conditioning for cycling, in Strength and conditioning for sports
performance, I. Jeffreys and J. Moody, Editors. 2016, Routledge.
46. Munro LA and Haff GG, Sprint cycling, in Handbook of strength and conditioning: Sport-
specific programming for high performance, A. Turner, Editor. 2018, Routledge. 506-525.
47. Cormie P, McGuigan MR and Newton RU, Developing maximal neuromuscular power: Part 2
- training considerations for improving maximal power production. Sports Medicine, 2011.
41(2): 125-146.
48. Haff GG and Nimphius S, Training principles for power. Strength and Conditioning Journal,
2012. 34(6): 2-12.
49. Turner A, Training for power: Principles and practice. UKSCA, 2009. Summer(14): 20-32.
50. Baker DG and Newton RU, Comparison of lower body strength, power, acceleration, speed,
agility, and sprint momentum to describe and compare playing rank among professional rugby
league players. Journal of Strength and Conditioning Research, 2008. 22(1): 153-158.
51. Blazevich AJ, Jenkins, D.G., Predicting sprint running times from isokinetic and squat lift tests:
A regression analysis. Journal of Strength and Conditioning Research, 1998. 12(2): 101-103.
52. Comfort P, Stewart A, Bloom L and Clarkson B, Relationships between strength, sprint, and
jump performance in well-trained youth soccer players. Journal of Strength and Conditioning
Research, 2014. 28(1): 173-177.
53. Smirniotou A, Katsikas C, Paradisis G, Argeitaki P, Zacharogiannis E and Tziortzis S, Strength-
power parameters as predictors of sprinting performance. Journal of Sports Medicine and
Physical Fitness, 2008. 48(4): 447-454.
54. Parsons B, Resistance training for elite-level track cyclists. Strength and Conditioning Journal,
2010. 32(5): 63-68.
55. Gullett JC, Tillman MD, Gutierrez GM and Chow JW, A biomechanical comparison of back
and front squats in healthy trained individuals. Journal of Strength and Conditioning Research,
2008. 23(1): 284-292.
185
56. Swinton PA, Stewart A, Agouris I, Keogh JW and Lloyd R, A biomechanical analysis of
straight and hexagonal barbell deadlifts using submaximal loads. Journal of Strength and
Conditioning Research, 2011. 25(7): 2000-2009.
57. Kipp K, Harris C and Sabick MB, Lower extremity biomechanics during weightlifting exercise
vary across joint and load. Journal of Strength and Conditioning Research, 2011. 25(5): 1229-
1234.
58. Moir GL, Gollie JM, Davis SE, Guers JJ and Witmer CA, The effects of load on system and
lower-body joint kinetics during jump squats. Sports Biomechanics, 2012. 11(4): 492-506.
59. Escamilla RF, Fleisig GS, Lowry TM, Barrentine SW and Andrews JR, A three-dimensional
biomechanical analysis of the squat during varying stance widths. Medicine and Science in
Sports and Exercise 2001. 33(6): 984-998.
60. Liang K-H, Chang Y-W, Hsieh L-C and Wu H-W. The effect of foot position on kinetics of the
lower limbs during squat. in ISBS-Conference Proceedings Archive. 2013.
61. Bryanton MA, Kennedy MD, Carey JP and Chiu LZ, Effect of squat depth and barbell load on
relative muscular effort in squatting. Journal of Strength and Conditioning Research, 2012.
26(10): 2820-2828.
62. Khuu A, Foch E and Lewis CL, Not all single leg squats are equal: A biomechanical comparison
of three variations. International Journal of Sports Physical Therapy, 2016. 11(2): 201-211.
63. Enoka RM, Load- and skill-related changes in segmental contributions to a weightlifting
movement. Medicine and Science in Sports and Exercise 1988. 20(2): 178-187.
64. Riemer R and Hsiao-Wecksler ET, Improving joint torque calculations: Optimization-based
inverse dynamics to reduce the effect of motion errors. Journal of Biomechanics, 2008. 41(7):
1503-1509.
65. Cappozzo A, Three-dimensional analysis of human walking: Experimental methods and
associated artifacts. Human Movement Science, 1991. 10(5): 589-602.
66. Camargo-Junior F, Ackermann M, Loss JF and Sacco IC, Influence of center of pressure
estimation errors on 3D inverse dynamics solutions during gait at different velocities. Journal
of Applied Biomechanics, 2013. 29(6): 790-797.
186
67. Elliott BC, Alderson JA and Denver ER, System and modelling errors in motion analysis:
Implications for the measurement of the elbow angle in cricket bowling. Journal of
Biomechanics, 2007. 40(12): 2679-2685.
68. Riemer R, Hsiao-Wecksler ET and Zhang X, Uncertainties in inverse dynamics solutions: A
comprehensive analysis and an application to gait. Gait and Posture, 2008. 27(4): 578-588.
69. Sinclair J, Atkins S and Vincent H, Influence of different hip joint centre locations on hip and
knee joint kinetics and kinematics during the squat. Journal of Human Kinetics, 2014. 44(1): 5-
17.
70. Richards JG, The measurement of human motion: A comparison of commercially available
systems. Human Movement Science, 1999. 18(5): 589-602.
71. Bini RR and Carpes FP, Biomechanics of cycling. 2014, Switzerland: Springer International.
72. Smith AC, Roberts JR, Wallace ES, Kong P and Forrester SE, Comparison of two- and three-
dimensional methods for analysis of trunk kinematic variables in the golf swing. Journal of
Applied Biomechanics, 2016. 32(1): 23-31.
73. Davidson CJ, Horscroft RD, McDaniel J, Tomas A and Hunter EL, The biomechanics of
standing and seating maximal cycling power. Medicine and Science in Sports and Exercise,
2005. 37(5): S393.
74. Umberger BR and Martin PE, Testing the planar assumption during ergometer cycling. Journal
of Applied Biomechanics, 2001. 17(1): 55-62.
75. Eng JJ and Winter DA, Kinetic analysis of the lower limbs during walking: What information
can be gained from a three-dimensional model? Journal of Biomechanics, 1995. 28(6): 753-
758.
76. Alkjaer T, Simonsen EB and Dyhre-Poulsen P, Comparison of inverse dynamics calculated by
two- and three-dimensional models during walking. Gait and Posture, 2001. 13(2): 73-77.
77. Paton CD and Hopkins WG, Tests of cycling performance. Sports Medicine, 2001. 31(7): 489-
489.
78. Paton CD and Hopkins WG, Variation in performance of elite cyclists from race to race.
European Journal of Sport Science, 2006. 6(1): 25-31.
187
79. Flyger N, Variability in competitive performance of elite track cyclists, in International
Conference on Biomechanics in Sports, A.J. Harrison, R. Anderson, and I. Kenny, Editors.
2009: Limerick, Ireland.
80. Chiu LZ and Schilling BK, A primer on weightlifting: From sports to sports training. Strength
and Conditioning Journal, 2005. 27(1): 42-48.
81. Bini RR, Dagnese F, Rocha E, Silveira MC, Carpes FP and Mota CB, Three-dimensional
kinematics of competitive and recreational cyclists across different workloads during cycling.
European Journal of Sport Science, 2016. 16(5): 553-559.
82. Redfield R and Hull ML, On the relation between joint moments and pedalling rates at constant
power in bicycling. Journal of Biomechanics, 1986. 19(4): 317-329.
83. Chapman AR, Vicenzino B, Blanch P and Hodges PW, Patterns of leg muscle recruitment vary
between novice and highly trained cyclists. Journal of Electromyography and Kinesiology,
2008. 18(3): 359-371.
84. Coyle EF, Feltner ME, Kautz SA, Hamilton MT, Montain SJ, Baylor AM, Abraham LD and
Petrek GW, Physiological and biomechanical factors associated with elite endurance cycling
performance. Medicine and Science in Sports and Exercise, 1991. 23(1): 93-107.
85. Atkinson G, Davidson R, Jeukendrup A and Passfield L, Science and cycling: Current
knowledge and future directions for research. Journal of Sports Sciences, 2003. 21(9): 767-787.
86. Coyle EF, Physiological determinants of endurance exercise performance. Journal of Science
and Medicine in Sport, 1999. 2(3): 181-189.
87. O'Bryan SJ, Brown NA, Billaut F and Rouffet DM, Changes in muscle coordination and power
output during sprint cycling. Neuroscience Letters, 2014. 576: 11-16.
88. Stone MH, Sands WA, Carlock J, Callan S, Dickie D, Daigle K, Cotton J, Smith SL and
Hartman M, The importance of isometric maximum strength and peak rate-of-force
development in sprint cycling. Journal of Strength and Conditioning Research, 2004. 18(4):
878-884.
89. Gabbett TJ, Should all athletes do explosive lifting? International Journal of Sports Science and
Coaching, 2013. 8(3): 619-620.

188
90. Gamble P, Implications and applications of training specificity for coaches and athletes.
Strength and Conditioning Journal, 2006. 28(3): 54-58.
91. Swinton PA, Lloyd R, Keogh JW, Agouris I and Stewart AD, A biomechanical comparison of
the traditional squat, powerlifting squat, and box squat. Journal of Strength and Conditioning
Research, 2012. 26(7): 1805-1816.
92. Ericson MO, Bratt A, Nisell R, Arborelius UP and Ekholm J, Power output and work in
different muscle groups during ergometer cycling. European Journal of Applied Physiology
and Occupational Physiology, 1986. 55(3): 229-235.
93. Gregor RJ, Cavanagh PR and LaFortune M, Knee flexor moments during propulsion in cycling-
-a creative solution to lombard's paradox. Journal of Biomechanics, 1985. 18(5): 307-316.
94. Neptune RR and Herzog W, The association between negative muscle work and pedaling rate.
Journal of Biomechanics, 1999. 32(10): 1021-1026.
95. Cleather DJ, Goodwin JE and Bull AM, An optimization approach to inverse dynamics
provides insight as to the function of the biarticular muscles during vertical jumping. Annals of
Biomedical Engineering, 2011. 39(1): 147-160.
96. Farris DJ, Lichtwark GA, Brown NA and Cresswell AG, Deconstructing the power resistance
relationship for squats: A joint-level analysis. Scandinavian Journal of Medicine and Science
in Sports, 2016. 26(7): 774-781.
97. Hayashi R, Kariyama Y, Yoshida T, Takahashi K, Zushi A and Zushi K. Comparison of pull
and catch phases during clean exercise. in ISBS-Conference Proceedings Archive. 2016.
98. Craig NP and Norton KI, Characteristics of track cycling. Sports Medicine, 2001. 31(7): 457-
468.
99. Gardner AS, Martin DT, Barras M, Jenkins DG and Hahn AG, Power output demands of elite
track sprint cycling. International Journal of Performance Analysis in Sport, 2005. 5(3): 149-
154.
100. Faria EW, Parker DL and Faria IE, The science of cycling: Factors affecting performance - part
2. Sports Medicine, 2005. 35(4): 313-337.

189
101. Dorel S, Hautier CA, Rambaud O, Rouffet D, Van Praagh E, Lacour JR and Bourdin M, Torque
and power-velocity relationships in cycling: Relevance to track sprint performance in world-
class cyclists. International Journal of Sports Medicine, 2005. 26(9): 739-746.
102. Munro LA, Stannard SR, Fink PW and Foskett A, Potentiation of sprint cycling performance:
The effects of a high-inertia ergometer warm-up. Journal of Sports Sciences, 2017. 35(14):
1442-1450.
103. Tomas A, Ross EZ and Martin JC, Fatigue during maximal sprint cycling: Unique role of
cumulative contraction cycles. Medicine and Science in Sports and Exercise, 2010. 42(7):
1364-1369.
104. Gollnick PD, Relationship of strength and endurance with skeletal muscle structure and
metabolic potential. International Journal of Sports Medicine, 1982. 3(S1): 26-32.
105. Sale DG, Neural adaptation to resistance training. Medicine and Science in Sports and Exercise
1988. 20(5 Suppl): S135-145.
106. Haff GG, Stone M, OʼBryant HS, Harman E, Dinan C, Johnson R and Han K-H, Force-time
dependent characteristics of dynamic and isometric muscle actions. Journal of Strength and
Conditioning Research, 1997. 11(4): 269-272.
107. Aagaard P, Simonsen EB, Andersen JL, Magnusson P and Dyhre-Poulsen P, Increased rate of
force development and neural drive of human skeletal muscle following resistance training.
Journal of Applied Physiology, 2002. 93(4): 1318-1326.
108. McDaniel J, Elmer SJ and Martin JC, Limitations of relaxation kinetics on muscular work. Acta
Physiologica 2010. 198(2): 191-198.
109. Maffiuletti NA, Aagaard P, Blazevich AJ, Folland J, Tillin N and Duchateau J, Rate of force
development: Physiological and methodological considerations. European Journal of Applied
Physiology, 2016. 116(6): 1091-1116.
110. Burgess KE, Connick MJ, Graham-Smith P and Pearson SJ, Plyometric vs. Isometric training
influences on tendon properties and muscle output. Journal of Strength and Conditioning
Research, 2007. 21(3): 986-989.
190
111. Kubo K, Morimoto M, Komuro T, Yata H, Tsunoda N, Kanehisa H and Fukunaga T, Effects
of plyometric and weight training on muscle-tendon complex and jump performance. Medicine
and Science in Sports and Exercise, 2007. 39(10): 1801-1810.
112. Watsford M, Ditroilo M, Fernandez-Pena E, D'Amen G and Lucertini F, Muscle stiffness and
rate of torque development during sprint cycling. Medicine and Science in Sports and Exercise,
2010. 42(7): 1324-1332.
113. Ditroilo M, Watsford M, Fernandez-Pena E, D'Amen G, Lucertini F and De Vito G, Effects of
fatigue on muscle stiffness and intermittent sprinting during cycling. Medicine and Science in
Sports and Exercise, 2011. 43(5): 837-845.
114. Young WB, Transfer of strength and power training to sports performance. International
Journal of Sports Physiology and Performance, 2006. 1(2): 74-83.
115. Costes A, Turpin NA, Villeger D, Moretto P and Watier B, Influence of position and power
output on upper limb kinetics in cycling. Journal of Applied Biomechanics, 2016. 32(2): 140-
149.
116. McDaniel J, Gidley LD, Aleksandar T, Hunter EL, Grisham JD, McNeil JM, Carroll C,
Thompson FT, Davidson CJ and Horscroft RD, Joint power distribution at 60, 90, and 120 rpm
during seated maximal cycling. Medicine and Science in Sports and Exercise, 2005. 37(5):
S123.
117. Morin JB and Samozino P, Interpreting power-force-velocity profiles for individualized and
specific training. International Journal of Sports Physiology and Performance, 2016. 11(2):
267-272.
118. Driss T, Vandewalle H, Chevalier J-ML and Monod H, Force-velocity relationship on a cycle
ergometer and knee-extensor strength indices. Canadian Journal of Applied Physiology, 2002.
27(3): 250-262.
119. McCartney N, Heigenhauser GJ, Sargeant AJ and Jones NL, A constant-velocity cycle
ergometer for the study of dynamic muscle function. Journal of Applied Physiology:
Respiratory, Environmental and Exercise Physiology, 1983. 55(1 Pt 1): 212-217.

191
120. Martin JC, Wagner BM and Coyle EF, Inertial-load method determines maximal cycling power
in a single exercise bout. Medicine and Science in Sports and Exercise, 1997. 29(11): 1505-
1512.
121. Seck D, Vandewalle H, Decrops N and Monod H, Maximal power and torque-velocity
relationship on a cycle ergometer during the acceleration phase of a single all-out exercise.
European Journal of Applied Physiology and Occupational Physiology, 1995. 70(2): 161-168.
122. Baron R, Bachl N, Petschnig R, Tschan H, Smekal G and Pokan R, Measurement of maximal
power output in isokinetic and non-isokinetic cycling. A comparison of two methods.
International Journal of Sports Medicine, 1999. 20(8): 532-537.
123. Coso JD and Mora-Rodriguez R, Validity of cycling peak power as measured by a short-sprint
test versus the wingate anaerobic test. Applied Physiology, Nutrition and Metabolism, 2006.
31(3): 186-189.
124. Gardner AS, Martin JC, Martin DT, Barras M and Jenkins DG, Maximal torque- and power-
pedaling rate relationships for elite sprint cyclists in laboratory and field tests. European Journal
of Applied Physiology, 2007. 101(3): 287-292.
125. Debraux P, Manolova AV, Soudain-Pineau M, Hourde C and Bertucci W, Maximal torque and
power pedaling rate relationships for high level bmx riders in field tests. Journal of Science and
Cycling, 2013. 2(1): 51-57.
126. Bertucci W, Taiar R and Grappe F, Differences between sprint tests under laboratory and actual
cycling conditions. The Journal of Sports Medicine and Physical Fitness, 2005. 45(3): 277.
127. Hautier CA, Linossier MT, Belli A, Lacour JR and Arsac LM, Optimal velocity for maximal
power production in non-isokinetic cycling is related to muscle fibre type composition.
European Journal of Applied Physiology and Occupational Physiology, 1996. 74(1-2): 114-
118.
128. Hintzy F, Belli A, Grappe F and Rouillon JD, Optimal pedalling velocity characteristics during
maximal and submaximal cycling in humans. European Journal of Applied Physiology and
Occupational Physiology, 1999. 79(5): 426-432.

192
129. Samozino P, Edouard P, Sangnier S, Brughelli M, Gimenez P and Morin JB, Force-velocity
profile: Imbalance determination and effect on lower limb ballistic performance. International
Journal of Sports Medicine, 2014. 35(6): 505-510.
130. Jaafar H, Attiogbe E, Rouis M, Vandewalle H and Driss T, Reliability of force-velocity tests in
cycling and cranking exercises in men and women. Biomed Research International, 2015. 2015:
954780.
131. Sasaki K and Ishii N, Unloaded shortening velocity of voluntary and electrically activated
human dorsiflexor muscles in vivo. PLoS One, 2010. 5(9): e13043.
132. Bertucci W, Taiar R, Toshev Y and Letellier T, Comparison of biomechanical criteria in cycling
maximal effort test. International Journal of Sports Science and Engineering, 2008. 2(1): 36-
46.
133. Coburn JW, Measuring power. Strength and Conditioning Journal, 2012. 34(6): 25-28.
134. Maulder P and Cronin J, Horizontal and vertical jump assessment: Reliability, symmetry,
discriminative and predictive ability. Physical Therapy in Sport, 2005. 6(2): 74-82.
135. Davies C, Wemyss-Holden J and Young K, Measurement of short term power output:
Comparison between cycling and jumping. Ergonomics, 1984. 27(3): 285-296.
136. Dore E, Bedu M and Van Praagh E, Squat jump performance during growth in both sexes:
Comparison with cycling power. Research Quarterly for Exercise and Sport, 2008. 79(4): 517-
524.
137. Driss T, Vandewalle H and Monod H, Maximal power and force-velocity relationships during
cycling and cranking exercises in volleyball players. Journal of Sports Medicine and Physical
Fitness, 1998. 38: 286-293.
138. Ravier G, Grappe F and Rouillon JD, Application of force-velocity cycle ergometer test and
vertical jump tests in the functional assessment of karate competitor. Journal of Sports Medicine
and Physical Fitness, 2004. 44(4): 349-355.
139. Vandewalle H, Peres G, Heller J, Panel J and Monod H, Force-velocity relationship and
maximal power on a cycle ergometer. Correlation with the height of a vertical jump. European
Journal of Applied Physiology and Occupational Physiology, 1987. 56(6): 650-666.
193
140. Harris NK, Cronin J, Taylor K-L, Boris J and Sheppard J, Understanding position transducer
technology for strength and conditioning practitioners. Strength and Conditioning Journal,
2010. 32(4): 66-79.
141. Jidovtseff B, Harris NK, Crielaard J-M and Cronin JB, Using the load-velocity relationship for
1rm prediction. Journal of Strength and Conditioning Research, 2011. 25(1): 267-270.
142. Bobbert MF, Why is the force-velocity relationship in leg press tasks quasi-linear rather than
hyperbolic? Journal of Applied Physiology, 2012. 112(12): 1975-1983.
143. Yamauchi J and Ishii N, Relations between force-velocity characteristics of the knee-hip
extension movement and vertical jump performance. Journal of Strength and Conditioning
Research, 2007. 21(3): 703-709.
144. Sheppard JM, Cormack S, Taylor K-L, McGuigan MR and Newton RU, Assessing the force-
velocity characteristics of the leg extensors in well-trained athletes: The incremental load power
profile. Journal of Strength and Conditioning Research, 2008. 22(4): 1320-1326.
145. Rahmani A, Viale F, Dalleau G and Lacour J-R, Force/velocity and power/velocity
relationships in squat exercise. European Journal of Applied Physiology, 2001. 84(3): 227-232.
146. Wickiewicz TL, Roy RR, Powell PL, Perrine JJ and Edgerton VR, Muscle architecture and
force-velocity relationships in humans. Journal of Applied Physiology, 1984. 57(2): 435-443.
147. Bobbert MF, Casius LJ and Van Soest AJ, The relationship between pedal force and crank
angular velocity in sprint cycling. Medicine and Science in Sports and Exercise, 2016. 48(5):
869-878.
148. Samozino P, Horvais N and Hintzy F, Why does power output decrease at high pedaling rates
during sprint cycling? Medicine and Science in Sports and Exercise 2007. 39(4): 680-687.
149. Dorel S, Couturier A, Lacour J-R, Vandewalle H, Hautier C and Hug F, Force-velocity
relationship in cycling revisited. Medicine and Science in Sports and Exercise, 2010. 42(6):
1175-1183.
150. Rankin JW and Neptune RR. Determination of the optimal seat position that maximizes average
crank power: A theoretical study. in Proceedings of the North American Congress on
Biomechanics. 2008.
194
151. Rankin JW and Neptune RR, The influence of seat configuration on maximal average crank
power during pedaling: A simulation study. Journal of Applied Biomechanics, 2010. 26(4):
493-500.
152. Bini RR. Effects of saddle position on pedalling technique and methods to assess pedalling
kinetics and kinematics of cyclists and triathletes. Thesis. Doctor of Philosophy, Auckland
University of Techcnology, 2011.
153. Diefenthaeler F, Bini RR, Laitano OL, Guimarães AC, Nabinger E, Carpes FP and Bolli CM,
Assessment of the effects of saddle position on cyclists' pedaling technique. Medicine and
Science in Sports and Exercise, 2006. 38(5): S181.
154. Horscroft RD, Davidson CJ, McDaniel J, Wagner BM and Martin JC, Effects of saddle height
on joint power distribution. Medicine and Science in Sports and Exercise, 2003. 35(1): S16.
155. Martin J and Spirduso W, Determinants of maximal cycling power: Crank length, pedaling rate
and pedal speed. European Journal of Applied Physiology, 2001. 84(5): 413-418.
156. Martin JC and Spirduso WW, Determinants of maximal cycling power: Crank length, pedaling
rate and pedal speed. European Journal of Applied Physiology, 2001. 84(5): 413-418.
157. Sanderson DJ, The influence of cadence and power output on the biomechanics of force
application during steady-rate cycling in competitive and recreational cyclists. Journal of Sports
Sciences, 1991. 9(2): 191-203.
158. van Ingen Schenau GJ, Boots PJ, de Groot G, Snackers RJ and van Woensel WW, The
constrained control of force and position in multi-joint movements. Neuroscience, 1992. 46(1):
197-207.
159. Korff T, Romer LM, Mayhew IAN and Martin JC, Effect of pedaling technique on mechanical
effectiveness and efficiency in cyclists. Medicine and Science in Sports and Exercise, 2007.
39(6): 991-995.
160. Bini RR and Diefenthaeler F, Kinetics and kinematics analysis of incremental cycling to
exhaustion. Sports Biomechanics, 2010. 9(4): 223-235.
161. Wozniak Timmer CA, Cycling biomechanics: A literature review. Journal of Orthopaedic and
Sports Physical Therapy, 1991. 14(3): 106-113.
195
162. Hug F and Dorel S, Electromyographic analysis of pedaling: A review. Journal of
Electromyography and Kinesiology, 2009. 19(2): 182-198.
163. Rouffet DM, Mornieux G, Zameziati K, Belli A and Hautier CA, Timing of muscle activation
of the lower limbs can be modulated to maintain a constant pedaling cadence. Journal of
Electromyography and Kinesiology, 2009. 19(6): 1100-1107.
164. Raasch CC. Coordination of pedaling: Functional muscle groups and locomotor strategies.
Thesis. Doctor of Philosophy, Stanford Univesity, 1996.
165. Raasch CC and Zajac FE, Locomotor strategy for pedaling: Muscle groups and biomechanical
functions. Journal of Neurophysiology, 1999. 82(2): 515-525.
166. Raasch CC, Zajac FE, Ma B and Levine WS, Muscle coordination of maximum-speed pedaling.
Journal of Biomechanics, 1997. 30(6): 595-602.
167. Savelberg HH and Meijer K, Contribution of mono- and biarticular muscles to extending knee
joint moments in runners and cyclists. Journal of Applied Physiology, 2003. 94(6): 2241-2248.
168. van Ingen Schenau G, Dorssers W, Welter T, Beelen A, De Groot G and Jacobs R, The control
of mono‐articular muscles in multijoint leg extensions in man. Journal of Physiology, 1995.
484(1): 247-254.
169. Neptune RR and Kautz SA, Muscle activation and deactivation dynamics: The governing
properties in fast cyclical human movement performance? Exercise and Sport Sciences
Reviews, 2001. 29(2): 76-80.
170. Ettema G, Loras H and Leirdal S, The effects of cycling cadence on the phases of joint power,
crank power, force and force effectiveness. Journal of Electromyography and Kinesiology,
2009. 19(2): e94-101.
171. Baum BS and Li L, Lower extremity muscle activities during cycling are influenced by load
and frequency. Journal of Electromyography and Kinesiology, 2003. 13(2): 181-190.
172. Baum BS. Investigation of the differences between inertial and cadence effects on
neuromuscular coordination during cycling. Thesis. Master of Science, Louisiana State
University, 2001.
196
173. Sanderson DJ, Hennig EM and Black AH, The influence of cadence and power output on force
application and in-shoe pressure distribution during cycling by competitive and recreational
cyclists. Journal of Sports Sciences, 2000. 18(3): 173-181.
174. Hug F, Turpin NA, Couturier A and Dorel S, Consistency of muscle synergies during pedaling
across different mechanical constraints. Journal of Neurophysiology, 2011. 106(1): 91-103.
175. Wakeling JM and Horn T, Neuromechanics of muscle synergies during cycling. Journal of
Neurophysiology, 2009. 101(2): 843-854.
176. Krause M, Cycling kinematics: A comparative analysis of pedaling in seated versus standing
cycling. 2004. Retrieved from:
http://www.academia.edu/11479657/Cycling_Kinematics_A_comparative_analysis_of_pedali
ng_in_seated_versus_standing_cycling
177. Fonda B, Sarabon N and Li FX, Validity and reliability of different kinematics methods used
for bike fitting. Journal of Sports Sciences, 2014. 32(10): 940-946.
178. Bini RR, Tamborindeguy AC and Mota CB, Effects of saddle height, pedaling cadence, and
workload on joint kinetics and kinematics during cycling. Journal of Sport Rehabilitation, 2010.
19(3): 301-314.
179. Gardner JK, Zhang S, Liu H, Klipple G, Stewart C, Milner CE and Asif IM, Effects of toe-in
angles on knee biomechanics in cycling of patients with medial knee osteoarthritis. Clinical
Biomechanics, 2015. 30(3): 276-282.
180. Fang Y, Fitzhugh EC, Crouter SE, Gardner JK and Zhang S, Effects of workloads and cadences
on frontal plane knee biomechanics in cycling. Medicine and Science in Sports and Exercise,
2015. 48(2): 260-266.
181. Callaghan MJ, Lower body problems and injury in cycling. Journal of Bodywork and
Movement Therapies, 2005. 9(3): 226-236.
182. Burnett AF, Cornelius MW, Dankaerts W and O'Sullivan P B, Spinal kinematics and trunk
muscle activity in cyclists: A comparison between healthy controls and non-specific chronic
low back pain subjects-a pilot investigation. Manual Therapy, 2004. 9(4): 211-219.

197
183. Ericson MO, Nisell R and Nemeth G, Joint motions of the lower limb during ergometer cycling.
Journal of Orthopaedic and Sports Physical Therapy, 1988. 9(8): 273.
184. Yoshihuku Y and Herzog W, Optimal design parameters of the bicycle-rider system for
maximal muscle power output. Journal of Biomechanics, 1990. 23(10): 1069-1079.
185. Caldwell GE, Hagberg JM, McCole SD and Li L, Lower extremity joint moments during uphill
cycling. Journal of Applied Biomechanics, 1999. 15(2): 166-181.
186. Caldwell GE, Li L, McCole SD and Hagberg JM, Pedal and crank kinetics in uphill cycling.
Journal of Applied Biomechanics, 1998. 14(3): 245-259.
187. Shemmel JB and Neal RJ. The kinematics of uphill, out of the saddle cycling. in The North
American Congress on Biomechanics. 1998. University of Waterloo, Ontario, Canada.
188. Emanuele U, Horn T and Denoth J. Influence of racing position on cycling patterns. in ISBS-
Conference Proceedings Archive. 2011.
189. Ronnestad BR and Mujika I, Optimizing strength training for running and cycling endurance
performance: A review. Scandinavian Journal of Medicine and Science in Sports, 2014. 24:
603-612.
190. van Ingen Schenau GJ, de Koning JJ and de Groot G, Optimisation of sprinting performance in
running, cycling and speed skating. Sports Medicine, 1994. 17(4): 259-275.
191. Sauer JL, Potter JJ, Weisshaar CL, Ploeg H-L and Thelen DG, Influence of gender, power, and
hand position on pelvic motion during seated cycling. Medicine and Science in Sports and
Exercise, 2007. 39(12): 2204.
192. van Ingen Schenau G, Van Woensel W, Boots P, Snackers R and De Groot G, Determination
and interpretation of mechanical power in human movement: Application to ergometer cycling.
European Journal of Applied Physiology and Occupational Physiology, 1990. 61(1-2): 11-19.
193. McGill S, Core training: Evidence translating to better performance and injury prevention.
Strength and Conditioning Journal, 2010. 32(3): 33-46.
194. Neptune RR and Hull ML, Methods for determining hip movement in seated cycling and their
effect on kinematics and kinetics. Journal of Applied Biomechanics, 1996. 12(4): 493-507.
198
195. Bini RR and Hume PA, Between-day reliability of pedal forces for cyclists during an
incremental cycling test to exhaustion. Isokinetics and Exercise Science, 2013. 21(3): 203-209.
196. Kautz SA, Feltner ME, Coyle EF and Baylor AM, The pedaling technique of elite endurance
cyclists: Changes with increasing workload at constant cadence. International Journal of Sports
Biomechanics, 1991. 7(1): 29-53.
197. Dorn TW, Schache AG and Pandy MG, Muscular strategy shift in human running: Dependence
of running speed on hip and ankle muscle performance. Journal of Experimental Biology, 2012.
215(11): 1944-1956.
198. Capmal S and Vandewalle H, Interpretation of crank torque during an all-out cycling exercise
at high pedal rate. Sports Engineering, 2010. 13(1): 31-38.
199. Redfield R and Hull M. Joint moments and pedalling rates in bicycling. in ISBS-Conference
Proceedings Archive. 1984.
200. Bini RR, Rossato M, Diefenthaeler F and Carpes FP, Pedaling cadence effects on joint
mechanical work during cycling. Isokinetics and Exercise Science, 2010. 18(1): 7-13.
201. Mornieux G, Guenette JA, Sheel AW and Sanderson DJ, Influence of cadence, power output
and hypoxia on the joint moment distribution during cycling. European Journal of Applied
Physiology, 2007. 102(1): 11-18.
202. Bini RR, Hume PA and Kilding AE, Saddle height effects on pedal forces, joint mechanical
work and kinematics of cyclists and triathletes. European Journal of Sport Science, 2014. 14(1):
44-52.
203. Bini RR, Diefenthaeler F and Mota CB, Fatigue effects on the coordinative pattern during
cycling: Kinetics and kinematics evaluation. Journal of Electromyography and Kinesiology,
2010. 20(1): 102-107.
204. Barratt PR, Korff T, Elmer SJ and Martin JC, Effect of crank length on joint-specific power
during maximal cycling. Medicine and Science in Sports and Exercise 2011. 43(9): 1689-1697.
205. McDaniel J, Behjani NS, Elmer SJ, Brown NA and Martin JC, Joint-specific power-pedaling
rate relationships during maximal cycling. Journal of Applied Biomechanics, 2014. 30(3): 423-
430.
199
206. Passfield L, Hopker JG, Jobson S, Friel D and Zabala M, Knowledge is power: Issues of
measuring training and performance in cycling. Journal of Sports Sciences, 2017. 35(14): 1426-
1434.
207. Bini RR, Hume PA and Cerviri A, A comparison of cycling SRM crank and strain gauge
instrumented pedal measures of peak torque, crank angle at peak torque and power output.
Procedia Engineering, 2011. 13: 56-61.
208. Cockcroft SJ. An evaluation of inertial motion capture technology for use in the analysis and
optimization of road cycling kinematics. Thesis. Master of Science and Engineering,
Stellenbosch: University of Stellenbosch, 2011.
209. Bini RR, Diefenthaeler F and Carpes FP, Determining force and power in cycling: A review of
methods and instruments for pedal force and crank torque measurements. International
SportMed Journal, 2014. 15(1): 96-112.
210. Stapelfeldt B, Mornieux G, Oberheim R, Belli A and Gollhofer A, Development and evaluation
of a new bicycle instrument for measurements of pedal forces and power output in cycling.
International Journal of Sports Medicine, 2007. 28(4): 326-332.
211. Lee J-H, Choi J-S, Kang D-W, Seo J-W, Kim J-Y, Kim D-H, Yang S-T and Tack G-R,
Development of a system for measuring the three-axis pedal force in cycling and its
applications. International Journal of Mechanical, Aerospace, Industrial, Mechatronic and
Manufacturing Engineering, 2015. 9(2): 235-238.
212. Drouet J-M, Champoux Y and Dorel S, Development of multi-platform instrumented force
pedals for track cycling, in The engineering of sport 7. 2009. 263-271.
213. Nabinger E. Analise dinamometrica tridimensional da pedalada de ciclistas. Thesis. Doctor of
Engineering, Universidade Federal do Rio Grande do Sul, 2006.
214. Coleman SG and Hale T. The use of force pedals for analysis of cycling sprint performance. in
ISBS-Conference Proceedings Archive. 1998.
215. Bini RR and Carpes FP, Measuring pedal forces, in Biomechanics of cycling. 2014, Springer
International: Switzerland. 13-21.
200
216. Carpes FP. Desenvolvimento de um sistema de pedais dinamometricos para avaliacao
biomecanica no ciclismo. Thesis. Master of Engineering, Universidade Federal de Santa Maria,
2006.
217. Reiser R, Peterson M and Broker J, Instrumented bicycle pedals for dynamic measurement of
propulsive cycling loads. Sports Engineering, 2003. 6(1): 41-48.
218. Gregor RJ and Wheeler JB, Biomechanical factors associated with shoe/pedal interfaces. Sports
Medicine, 1994. 17(2): 117-131.
219. Bouillod A, Costes A, Soto-Romero G, Brunet E and Grappe F. Validity and reliability of the
3D motion analyzer in comparison with the vicon device for biomechanical pedalling analysis.
in 4th International Congress on Sport Sciences Research and Technology Support. 2016.
220. Stief F, Bohm H, Michel K, Schwirtz A and Doderlein L, Reliability and accuracy in three-
dimensional gait analysis: A comparison of two lower body protocols. Journal of Applied
Biomechanics, 2013. 29(1): 105-111.
221. Bell AL, Pedersen DR and Brand RA, A comparison of the accuracy of several hip center
location prediction methods. Journal of Biomechanics, 1990. 23(6): 617-621.
222. Bruno P and Barden J, Comparison of two alternative technical marker sets for measuring 3D
pelvic motion during gait. Journal of Biomechanics, 2015. 48(14): 3876-3882.
223. Borhani M, McGregor AH and Bull AM, An alternative technical marker set for the pelvis is
more repeatable than the standard pelvic marker set. Gait and Posture, 2013. 38(4): 1032-1037.
224. Cappozzo A, Catani F, Croce UD and Leardini A, Position and orientation in space of bones
during movement: Anatomical frame definition and determination. Clinical Biomechanics,
1995. 10(4): 171-178.
225. Camomilla V, Cereatti A, Vannozzi G and Cappozzo A, An optimized protocol for hip joint
centre determination using the functional method. Journal of Biomechanics, 2006. 39(6): 1096-
1106.
226. Neptune RR and Hull ML, Accuracy assessment of methods for determining hip movement in
seated cycling. Journal of Biomechanics, 1995. 28(4): 423-437.

201
227. Kirkwood RN, Culham EG and Costigan P, Radiographic and non-invasive determination of
the hip joint center location: Effect on hip joint moments. Clinical Biomechanics, 1999. 14(4):
227-235.
228. Reize P, Muller O, Motzny S and Wulker N, Prediction of the location of the centre of rotation
of the hip joint external landmarks. Z Orthop Ihre Grenzgeb, 2006. 144(5): 492-496.
229. Bush TR and Gutowski PE, An approach for hip joint center calculation for use in seated
postures. Journal of Biomechanics, 2003. 36(11): 1739-1743.
230. Seidel GK, Marchinda DM, Dijkers M and Soutas-Little RW, Hip joint center location from
palpable bony landmarks--a cadaver study. Journal of Biomechanics, 1995. 28(8): 995-998.
231. Cleather DJ and Bull AM, Influence of inverse dynamics methods on the calculation of inter-
segmental moments in vertical jumping and weightlifting. Biomedical Engineering Online,
2010. 9(1): 74-85.
232. Buchanan TS, Lloyd DG, Manal K and Besier TF, Neuromusculoskeletal modeling: Estimation
of muscle forces and joint moments and movements from measurements of neural command.
Journal of Applied Biomechanics, 2004. 20(4): 367-395.
233. Marsh AP, Martin PE and Sanderson DJ, Is a joint moment-based cost function associated with
preferred cycling cadence? Journal of Biomechanics, 2000. 33(2): 173-180.
234. Hull ML and Jorge M, A method for biomechanical analysis of bicycle pedalling. Journal of
Biomechanics, 1985. 18(9): 631-644.
235. Cleather DJ, Goodwin JE and Bull AM, Inter-segmental moment analysis characterises the
partial correspondence of jumping and jerking. Journal of Strength and Conditioning Research,
2013. 27(1): 89-100.
236. Hayot C, Decatoire A, Bernard J, Monnet T and Lacouture P, Effects of ‘posture length’ on
joint power in cycling. Procedia Engineering, 2012. 34: 212-217.
237. Vrints J, Koninckx E, Van Leemputte M and Jonkers I, The effect of saddle position on
maximal power output and moment generating capacity of lower limb muscles during isokinetic
cycling. Journal of Applied Biomechanics, 2011. 27(1): 1-7.
202
238. Rannama I, Port K, Bazanov B and Pedak K, Sprint cycling performance and asymmetry.
Journal of Human Sport and Exercise, 2015. 10(Proc1): S248-258.
239. Yamazaki H and Matsuda A, Joint torque evaluation of lower limbs in bicycle pedaling.
Procedia Engineering, 2016. 147: 263-268.
240. De Leva P, Adjustments to Zatsiorsky-Seluyanov's segment inertia parameters. Journal of
Biomechanics, 1996. 29(9): 1223-1230.
241. Dumas R, Cheze L and Verriest J-P, Adjustments to McConville et al. And Young et al. Body
segment inertial parameters. Journal of Biomechanics, 2007. 40(3): 543-553.
242. Venture G, Ayusawa K and Nakamura Y. Motion capture based identification of the human
body inertial parameters. in 30th Annual International Conference of the IEEE. 2008. IEEE.
243. Elmer SJ and Martin JC, Fourier series approximations and low pass filtering: Facilitating
learning of digital signal processing for biomechanics students. SportScience, 2009. 13: 1-8.
244. Kristianslund E, Krosshaug T and Van den Bogert AJ, Effect of low pass filtering on joint
moments from inverse dynamics: Implications for injury prevention. Journal of Biomechanics,
2012. 45(4): 666-671.
245. Gregersen CS and Hull ML, Non-driving intersegmental knee moments in cycling computed
using a model that includes three-dimensional kinematics of the shank/foot and the effect of
simplifying assumptions. Journal of Biomechanics, 2003. 36(6): 803-813.
246. Ruby P, Hull ML and Hawkins D, Three-dimensional knee joint loading during seated cycling.
Journal of Biomechanics, 1992. 25(1): 41-53.
247. Quintana-Duque JC, Dahmen T and Saupe D, Estimation of torque variation from pedal motion
in cycling. International Journal of Computer Science in Sport, 2015. 14(1): 34-50.
248. Sauer JL, Potter JJ, Weisshaar CL, Ploeg HL and Thelen DG, Biodynamics. Influence of
gender, power, and hand position on pelvic motion during seated cycling. Medicine and Science
in Sports and Exercise, 2007. 39(12): 2204-2211.
249. Huijbregts P, Lumbar spine coupled motions: A literature review with clinical implications.
Orthopaedic Division Review, 2004: 21-25.
203
250. Cook C and Showalter C, A survey on the importance of lumbar coupling biomechanics in
physiotherapy practice. Manual Therapy, 2004. 9(3): 164-172.
251. McGill SM, McDermott A and Fenwick CM, Comparison of different strongman events: Trunk
muscle activation and lumbar spine motion, load, and stiffness. Journal of Strength and
Conditioning Research, 2009. 23(4): 1148-1161.
252. Ericson MO, Mechanical muscular power output and work during ergometer cycling at
different work loads and speeds. European Journal of Applied Physiology and Occupational
Physiology, 1988. 57(4): 382-387.
253. Hasson CJ, Caldwell GE and van Emmerik RE, Changes in muscle and joint coordination in
learning to direct forces. Human Movement Science, 2008. 27(4): 590-609.
254. Zajac FE, Neptune RR and Kautz SA, Biomechanics and muscle coordination of human
walking. Part i: Introduction to concepts, power transfer, dynamics and simulations. Gait and
Posture, 2002. 16(3): 215-232.
255. Kautz SA and Neptune RR, Biomechanical determinants of pedaling energetics: Internal and
external work are not independent. Exercise and Sport Sciences Reviews, 2002. 30(4): 159-
165.
256. Broker JP and Gregor RJ, Mechanical energy management in cycling: Source relations and
energy expenditure. Medicine and Science in Sports and Exercise, 1994. 26(1): 64-74.
257. Hawkins D and Hull M, A method for determining lower extremity muscle-tendon lengths
during flexion/extension movements. Journal of Biomechanics, 1990. 23(5): 487-494.
258. Hoshikawa H, Takahashi K, Ohashi K and Tamaki K, Contribution of the ankle, knee, and hip
joints to mechanical energy in cycling. Journal of Biomechanics, 2007. 40: S750.
259. Neptune RR and van den Bogert AJ, Standard mechanical energy analyses do not correlate with
muscle work in cycling. Journal of Biomechanics, 1998. 31(3): 239-245.
260. Gregor RJ, Biomechanics of cycling, in Exercise and sport science, W.E. Garrett and D.T.
Kirkendall, Editors. 2000, Lippincott Williams and Wilkins: Philadelphia. 515-537.
261. Fregly BJ and Zajac FE, A state-space analysis of mechanical energy generation, absorption,
and transfer during pedaling. Journal of Biomechanics, 1996. 29(1): 81-90.
204
262. Gonzalez H and Hull ML, Multivariable optimization of cycling biomechanics. Journal of
Biomechanics, 1989. 22(11-12): 1151-1161.
263. Brown NA and Jensen JL, The role of segmental mass and moment of inertia in dynamic-
contact task construction. Journal of Motor Behaviour, 2006. 38(4): 313-328.
264. Sanderson DJ, Mornieux G, Guenette JA and Sheel AW. Influence of cadence, power output
and hypoxia on the joint powers and muscle excitation during cycling. in North American
Congress on Biomechanics. 2008. University of British Columbia, Universitat Freiburg.
265. Skovereng K, Ettema G and van Beekvelt MC, Oxygenation, local muscle oxygen consumption
and joint specific power in cycling: The effect of cadence at a constant external work rate.
European Journal of Applied Physiology, 2016. 116(6): 1207-1217.
266. Martin JC, Pettitt RW and Wagner BM, Peak instantaneous joint power during maximal
cycling. Medicine and Science in Sports and Exercise, 2002. 34(5): S90.
267. Pettitt RW, Wagner BM and Martin JC, Average joint power during maximal cycling. Medicine
and Science in Sports and Exercise, 2002. 34(5): S173.
268. Bini RR, Hume PA, Lanferdini FJ and Vaz MA, Effects of moving forward or backward on the
saddle on knee joint forces during cycling. Physical Therapy in Sport, 2013. 14(1): 23-27.
269. Ericson MO, Bratt A, Nisell R, Nemeth G and Ekholm J, Load moments about the hip and knee
joints during ergometer cycling. Scandinavian Journal of Rehabilitation Medicine, 1986. 18(4):
165-172.
270. Hull ML and Gonzalez HK, The effect of pedal platform height on cycling biomechanics.
International Journal of Sport Biomechanics, 1990. 6(1): 1-17.
271. Sarre G, Lepers R and van Hoecke J, Stability of pedalling mechanics during a prolonged
cycling exercise performed at different cadences. Journal of Sports Sciences, 2005. 23(7): 693-
701.
272. Amoroso A, Sanderson DJ and Henning E. Kinematic and kinetic changes in cycling resulting
from fatigue. in Proceedings of 14th International Congress of Biomechanics. Paris. 1993.
205
273. Elmer SJ, Marshall CS, Wehmanen K, Amann M, McDaniel J, Martin DT and Martin JC,
Effects of locomotor muscle fatigue on joint-specific power production during cycling.
Medicine and Science in Sports And Exercise 2012. 44(8): 1504-1511.
274. Han RPS, Thomlinson MA and Tu YS, Kinematics and kinetics of a non-circular bicycle drive
system. Mechanism and Machine Theory, 1991. 26(4): 375-388.
275. Strutzenberger G, Wunsch T, Kroell J, Dastl J and Schwameder H, Effect of chainring ovality
on joint power during cycling at different workloads and cadences. Sports Biomechanics, 2014.
13(2): 97-108.
276. Elmer SJ, Madigan ML, LaStayo PC and Martin JC, Joint-specific power absorption during
eccentric cycling. Clinical Biomechanics, 2010. 25(2): 154-158.
277. Elmer SJ and Martin JC, Joint-specific power loss after eccentric exercise. Medicine and
Science in Sports and Exercise 2010. 42(9): 1723-1730.
278. Bini RR, Jacques TC and Vaz MA, Joint torques and patellofemoral force during single-leg
assisted and unassisted cycling. Journal of Sport Rehabilitation, 2016. 25(1): 40-47.
279. Elmer SJ, McDaniel J and Martin JC, Biomechanics of counterweighted one-legged cycling.
Journal of Applied Biomechanics, 2016. 32(1): 78-85.
280. Escamilla RF, Francisco AC, Fleisig GS, Barrentine SW, Welch CM, Kayes AV, Speer KP and
Andrews JR, A three-dimensional biomechanical analysis of sumo and conventional style
deadlifts. Medicine and Science in Sports and Exercise 2000. 32(7): 1265-1275.
281. Kipp K, Redden J, Sabick MB and Harris C, Weightlifting performance is related to kinematic
and kinetic patterns of the hip and knee joints. Journal of Strength and Conditioning Research,
2012. 26(7): 1838-1844.
282. Escamilla RF, Fleisig GS, Zheng N, Lander JE, Barrentine SW, Andrews JR, Bergemann BW
and Moorman CT, 3rd, Effects of technique variations on knee biomechanics during the squat
and leg press. Medicine and Science in Sports and Exercise 2001. 33(9): 1552-1566.
283. Kawamori N and Haff GG, The optimal training load for the development of muscular power.
Journal of Strength and Conditioning Research, 2004. 18(3): 675-684.
206
284. Brown EW and Abani K, Kinematics and kinetics of the deadlift in adolescent power lifters.
Medicine and Science in Sports and Exercise, 1985. 17(5): 554-566.
285. Riemann BL, Lapinski S, Smith L and Davies G, Biomechanical analysis of the anterior lunge
during 4 external-load conditions. Journal of Athletic Training, 2012. 47(4): 372-378.
286. Pazin N, Bozic P, Bobana B, Nedeljkovic A and Jaric S, Optimum loading for maximizing
muscle power output: The effect of training history. European Journal of Applied Physiology,
2011. 111(9): 2123-2130.
287. Jandacka D, Uchytil J, Farana R, Zahradnik D and Hamill J, Lower extremity power during the
squat jump with various barbell loads. Sports Biomechanics, 2014. 13(1): 75-86.
288. Bryanton MA, Carey JP, Kennedy MD and Chiu LZ, Quadriceps effort during squat exercise
depends on hip extensor muscle strategy. Sports Biomechanics, 2015. 14(1): 122-138.
289. Kipp K, Harris C and Sabick MB, Correlations between internal and external power outputs
during weightlifting exercise. Journal of Strength and Conditioning Research, 2013. 27(4):
1025-1030.
290. Cholewicki J, McGill SM and Norman RW, Lumbar spine loads during the lifting of extremely
heavy weights. Medicine and Science in Sports and Exercise, 1991. 23(10): 1179-1186.
291. Flanagan SP and Salem GJ, Lower extremity joint kinetic responses to external resistance
variations. Journal of Applied Biomechanics, 2008. 24(1): 58-68.
292. Flanagan SP, Kulik JB and Salem GJ, The limiting joint during a failed squat: A biomechanics
case series. Journal of Strength and Conditioning Research, 2015. 29(11): 3134-3142.
293. Lees A, Vanrenterghem J and De Clercq D, The maximal and submaximal vertical jump:
Implications for strength and conditioning. Journal of Strength and Conditioning Research,
2004. 18(4): 787-791.
294. Beardsley C and Contreras B, The increasing role of the hip extensor musculature with heavier
compound lower-body movements and more explosive sport actions. Strength and
Conditioning Journal, 2014. 36(2): 49-55.
207
295. Almosnino S, Kingston D and Graham RB, Three-dimensional knee joint moments during
performance of the bodyweight squat: Effects of stance width and foot rotation. Journal of
Applied Biomechanics, 2013. 29(1): 33-43.
296. Rao G, Amarantini D and Berton E, Influence of additional load on the moments of the agonist
and antagonist muscle groups at the knee joint during closed chain exercise. Journal of
Electromyography and Kinesiology, 2009. 19(3): 459-466.
297. Souza AL and Shimada SD, Biomechanical analysis of the knee during the power clean. Journal
of Strength and Conditioning Research, 2002. 16(2): 290-297.
298. Robertson D, Wilson J-MJ and Pierre TAS, Lower extremity muscle functions during full
squats. Journal of Applied Biomechanics, 2008. 24(4): 333-339.
299. Amoroso AT. The influence of seat height on the mechanical function of the human
gastrocnmeius, soleus, and tibialis anterior muscles during steady-state cycling. Thesis. Master
of Science, University of British Columbia, 1994.
300. Suchomel TJ, Wright GA and Lottig J. Lower extremity joint velocity comparisons during the
hang power clean and jump shrug at various loads. in ISBS-Conference Proceedings Archive.
2014.
301. Suchomel TJ, Comfort P and Stone MH, Weightlifting pulling derivatives: Rationale for
implementation and application. Sports Medicine, 2015. 45(6): 823-839.
302. Kipp K, Redden J, Sabick M and Harris C, Kinematic and kinetic synergies of the lower
extremities during the pull in olympic weightlifting. Journal of Applied Biomechanics, 2012.
28(3): 271-278.
303. Baumann W, Gross V, Quade K, Galbierz P and Schwirtz A, The snatch technique of world
class weightlifters at the 1985 world championships. International Journal of Sport
Biomechanics, 1988. 4(1): 68-89.
304. Flanagan SP and Salem GP, The validity of summing lower extremity individual joint kinetic
measures. Journal of Applied Biomechanics, 2005. 21(2): 181-188.
305. Flanagan SP and Salem GJ, Bilateral differences in the net joint torques during the squat
exercise. Journal of Strength and Conditioning Research, 2007. 21(4): 1220-1226.

208
306. Kobayashi Y, Kubo J, Matsuo A, Matsubayashi T, Kobayashi K and Ishii N, Bilateral
asymmetry in joint torque during squat exercise performed by long jumpers. Journal of Strength
and Conditioning Research, 2010. 24(10): 2826-2830.
307. Russell PJ and Phillips SJ, A preliminary comparison of front and back squat exercises.
Research Quarterly for Exercise and Sport, 1989. 60(3): 201-208.
308. Lahti J. Effects of internal kinetics and muscle activity during the wide and narrow barbell back
squat. Thesis. Master of Science, University of Jyvaskyla, 2017.
309. Chiu LZ and Salem GJ, Comparison of joint kinetics during free weight and flywheel resistance
exercise. Journal of Strength and Conditioning Research, 2006. 20(3): 555-562.
310. Biscarini A, Botti FM and Pettorossi VE, Joint torques and joint reaction forces during squatting
with a forward or backward inclined smith machine. Journal of Applied Biomechanics, 2013.
29(1): 85-97.
311. Fry AC and Kraemer WJ, Comment on a preliminary comparison of front and back squat
exercises. Research Quarterly for Exercise and Sport, 1990. 61(2): 210-214.
312. Slater LV and Hart JM, The influence of knee alignment on lower extremity kinetics during
squats. Journal of Electromyography and Kinesiology, 2016. 31: 96-103.
313. Legg HS, Glaister M, Cleather DJ and Goodwin JE, The effect of weightlifting shoes on the
kinetics and kinematics of the back squat. Journal of Sports Sciences, 2017. 35(5): 508-515.
314. Southwell DJ, Petersen SA, Beach TA and Graham RB, The effects of squatting footwear on
three-dimensional lower limb and spine kinetics. Journal of Electromyography and
Kinesiology, 2016. 31: 111-118.
315. Lauder MA and Lake JP, Biomechanical comparison of unilateral and bilateral power snatch
lifts. Journal of Strength and Conditioning Research, 2008. 22(3): 653-660.
316. Stuart MJ, Meglan DA, Lutz GE, Growney ES and An KN, Comparison of intersegmental
tibiofemoral joint forces and muscle activity during various closed kinetic chain exercises.
American Journal of Sports Medicine, 1996. 24(6): 792-799.

209
317. van Soest AJ, Roebroeck ME, Bobbert MF, Huijing PA and van Ingen Schenau GJ, A
comparison of one-legged and two-legged countermovement jumps. Medicine and Science in
Sports and Exercise, 1985. 17(6): 635-639.
318. Riemann B, Congleton A, Ward R and Davies GJ, Biomechanical comparison of forward and
lateral lunges at varying step lengths. Journal of Sports Medicine and Physical Fitness, 2013.
53(2): 130-138.
319. Schutz P, List R, Zemp R, Schellenberg F, Taylor WR and Lorenzetti S, Joint angles of the
ankle, knee, and hip and loading conditions during split squats. Journal of Applied
Biomechanics, 2014. 30(3): 373-380.
320. Zwerver J, Bredeweg SW and Hof AL, Biomechanical analysis of the single-leg decline squat.
British Journal of Sports Medicine, 2007. 41(4): 264-268.
321. Sugisaki N, Kurokawa S, Okada J and Kanehisa H, Difference in the recruitment of hip and
knee muscles between back squat and plyometric squat jump. PLoS One, 2014. 9(6): e101203.
322. Canavan PK, Garrett GE and Armstrong LE, Kinematic and kinetic relationships between an
olympic-style lift and the vertical jump. Journal of Strength and Conditioning Research, 1996.
10: 127-130.
323. Cushion EJ, Goodwin JE and Cleather DJ, Relative intensity influences the degree of
correspondence of jump squats and push jerks to countermovement jumps. Journal of Strength
and Conditioning Research, 2016. 30(5): 1255-1264.
324. Lee S, DeRosia KD and Lamie LM, Evaluating the contribution of lower extremity kinetics to
whole body power output during the power snatch. Sports Biomechanics, 2017: 1-13.
325. Kipp K, Malloy PJ, Smith J, Giordanelli MD, Kiely MT, Geiser CF and Suchomel TJ,
Mechanical demands of the hang power clean and jump shrug: A joint-level perspective.
Journal of Strength and Conditioning Research, 2016. 32(2): 466-474.
326. Dawson B, Muscle phosphocreatine repletion following single and repeated short sprint efforts.
Scandanavian Journal of Medicine and Science in Sports, 1997. 7: 206-213.
327. Burnham KP and Anderson DR, Multimodel inference: Understanding aic and bic in model
selection. Sociological Methods and Research, 2004. 33(2): 261-304.
210
328. Pinheiro J, Bates D, DebRoy R, Sarkar D and Team RC, Nlme: Linear and nonlinear mixed
effects models. R package version 3.1-137, 2018.
329. Martin JC, Elmer SJ, Horscroft RD, Brown NA and Schultz BB, A low-cost instrumented
spatial linkage accurately determines asis position during cycle ergometry. Journal of Applied
Biomechanics, 2007. 23(3): 224-229.
330. Mornieux G, Zameziati K, Mutter E, Bonnefoy R and Belli A, A cycle ergometer mounted on
a standard force platform for three-dimensional pedal forces measurement during cycling.
Journal of Biomechanics, 2006. 39(7): 1296-1303.
331. Cormie P, McGuigan MR and Newton RU, Developing maximal neuromuscular power: Part 1
- biological basis of maximal power production. Sports Medicine, 2011. 41(1): 17-38.
332. Sargeant AJ, Structural and functional determinants of human muscle power. Experimental
Physiology, 2007. 92(2): 323-331.
333. Chapman A, Vicenzino B, Blanch P and Hodges P, Do differences in muscle recruitment
between novice and elite cyclists reflect different movement patterns or less skilled muscle
recruitment? Journal of Science and Medicine in Sport, 2009. 12(1): 31-34.
334. Li L and Caldwell GE, Task specific coordination of leg muscles during cycling, in 18
International Symposium on Biomechanics in Sports. 2000.
335. Davidson CJ, Wagner BM and Martin JC, Seated and standing maximal neuromuscular cycling
power. Medicine and Science in Sports and Exercise, 2004. 36(5): S344.
336. Mok K-M, Petushek E and Krosshaug T, Reliability of knee biomechanics during a vertical
drop jump in elite female athletes. Gait and Posture, 2016. 46: 173-178.
337. Mok KM, Bahr R and Krosshaug T, Reliability of lower limb biomechanics in two sport-
specific sidestep cutting tasks. Sports Biomechanics, 2017: 1-11.
338. Bates D, Maechler M, Bolker B and Walker S, Fitting linear mixed-effects modesl using lme4.
Journal of Statistical Software. 67(1): 1-48.
339. Schwarz G, Estimating the dimension of a model. Annals of Statistics, 1978. 6(2): 461-464.
340. Jaric S, Force-velocity relationship of muscles performing multi-joint maximum performance
tasks. International Journal of Sports Medicine, 2015. 36(09): 699-704.
211
341. Martin JC, Brown NA, Anderson FC and Spirduso WW, A governing relationship for repetitive
muscular contraction. Journal of Biomechanics, 2000. 33(8): 969-974.
342. MacIntosh BR, Gardiner PF and McComas AJ, Skeletal muscle: Form and function. Second
ed. 2006, Champaign, IL.: Human Kinetics.
343. Komi PV and Ishikawa M, Muscle: Producing force and movement, in The olympic textbook
of science in sport, R.J. Maughan, Editor. 2009, Blackwell Publishing: West Sussex, UK. 7-24.
344. Mornieux G, Stapelfeldt B, Gollhofer A and Belli A, Effects of pedal type and pull-up action
during cycling. International Journal of Sports Medicine, 2008. 29(10): 817-822.
345. Freund HJ, Motor unit and muscle activity in voluntary motor control. Physiological Reviews,
1983. 63(2): 387-436.
346. Alemdaroğlu U, The relationship between muscle strength, anaerobic performance, agility,
sprint ability and vertical jump performance in professional basketball players. Journal of
Human Kinetics, 2012. 31(1): 149-158.
347. Bracko MR and George JD, Prediction of ice skating performance with off-ice testing in
women's ice hockey players. Journal of Strength and Conditioning Research, 2001. 15(1): 116-
122.
348. Bret C, Rahmani A, Dufour AB, Messonnier L and Lacour JR, Leg strength and stiffness as
ability factors in 100 m sprint running. Journal of Sports Medicine and Physical Fitness, 2002.
42(3): 274-281.
349. Cronin JB and Hansen KT, Strength and power predictors of sports speed. Journal of Strength
and Conditioning Research, 2005. 19(2): 349-357.
350. Maulder PS, Bradshaw EJ and Keogh J, Jump kinetic determinants of sprint acceleration
performance from starting blocks in male sprinters. Journal of Sports Science and Medicine,
2006. 5(2): 359-366.
351. Meylan C, McMaster T, Cronin J, Mohammad NI, Rogers C and deKlerk M, Single-leg lateral,
horizontal, and vertical jump assessment: Reliability, interrelationships, and ability to predict
sprint and change-of-direction performance. Journal of Strength and Conditioning Research,
2009. 23(4): 1140-1147.
212
352. West DJ, Owen NJ, Cunningham DJ, Cook CJ and Kilduff LP, Strength and power predictors
of swimming starts in international sprint swimmers. Journal of Strength and Conditioning
Research, 2011. 25(4): 950-955.
353. Young W, McLean B and Ardagna J, Relationship between strength qualities and sprinting
performance. Journal of Sports Medicine and Physical Fitness, 1995. 35(1): 13-19.
354. Burr JF, Jamnik VK, Dogra S and Gledhill N, Evaluation of jump protocols to assess leg power
and predict hockey playing potential. Journal of Strength and Conditioning Research, 2007.
21(4): 1139-1145.
355. Chelly MS, Chérif N, Amar MB, Hermassi S, Fathloun M, Bouhlel E, Tabka Z and Shephard
RJ, Relationships of peak leg power, 1 maximal repetition half back squat, and leg muscle
volume to 5-m sprint performance of junior soccer players. Journal of Strength and
Conditioning Research, 2010. 24(1): 266-271.
356. Chelly SM and Denis C, Leg power and hopping stiffness: Relationship with sprint running
performance. Medicine and Science in Sports and Exercise, 2001. 33(2): 326-333.
357. Harris NK, Cronin JB, Hopkins WG and Hansen KT, Relationship between sprint times and
the strength/power outputs of a machine squat jump. Journal of Strength and Conditioning
Research, 2008. 22(3): 691-698.
358. Bissas AI and Havenetidis K, The use of various strength-power tests as predictors of sprint
running performance. The Journal of Sports Medicine and Physical Fitness, 2008. 48(1): 49-
54.
359. Folland JP, Buckthorpe MW and Hannah R, Human capacity for explosive force production:
Neural and contractile determinants. Scandinavian Journal of Medicine and Science in Sports,
2014. 24(6): 894-906.
360. Samozino P, Rejc E, Di Prampero PE, Belli A and Morin JB, Optimal force-velocity profile in
ballistic movements--altius: Citius or fortius? Medicine and Science in Sports and Exercise,
2012. 44(2): 313-322.
361. Blackwood B, Clean variation for enhanced performance. Strength and Conditioning Journal,
2004. 26(4): 74-76.
213
362. Gülch RW, Force-velocity relations in human skeletal muscle. International Journal of Sports
Medicine, 2008. 15(1): S2-S10.
363. Patterson RP and Moreno MI, Bicycle pedalling forces as a function of pedalling rate and power
output. Medicine and Science in Sports and Exercise, 1990. 22(4): 512-516.
364. Too D, Biomechanics of cycling and factors affecting performance. Sports Medicine, 1990.
10(5): 286-302.
365. Jidovtseff B, Cronin J, Harris N and Quievre J, Mechanical comparison of eight vertical jump
exercises. Computer Methods in Biomechanics and Biomedical Engineering, 2010. 13(S1): 77-
78.
366. Menard M, Domalain M, Decatoire A and Lacouture P, Influence of saddle setback on knee
joint forces in cycling. Sports Biomechanics, 2018: 1-13.
367. Martin JC, Gardner AS and Barras M, Modeling sprint cycling using field-derived parameters
and forward integration. Medicine and Science in Sports and Exercise, 2006. 38(3): 592-597.
214
8 Appendices
Appendix A – Contribution of Work
STUDY 1
System Design and Construction:
Lynne A. Munro (69%), Geoff Wanders (25%), Tom Kepple (5%), Joan Charmant (1%)
Calibration System Design:
Assoc. Prof. Chris R. Abbiss (60%), Lynne A. Munro (30%), Nadija Vrdoljak (10%)
Calibration Process:
Lynne A. Munro (80%), Assoc. Prof. Chris R. Abbiss (20%)
Data Collection:
Lynne A. Munro (95%), Nicholas Flyger (5%)
Data Analysis:
Lynne A. Munro (85%), Nicholas Flyger (15%)
Statistical Analysis:
Lynne A. Munro (70%), Nicholas Flyger (30%)
STUDY 2
System Design and Construction:
Lynne A. Munro (69%), Geoff Wanders (25%), Tom Kepple (5%), Joan Charmant (1%)

215
Calibration System Design:
Assoc. Prof. Chris R. Abbiss (60%), Lynne A. Munro (30%), Nadija Vrdoljak (10%)
Calibration Process:
Lynne A. Munro (80%), Assoc. Prof. Chris R. Abbiss (20%)
Data Collection:
Lynne A. Munro (95%), Nicholas Flyger (5%)
Data Analysis:
Lynne A. Munro (80%), Nicholas Flyger (20%)
Statistical Analysis:
Lynne A. Munro (60%), Nicholas Flyger (23%), Dr. Andrew D. Govus (17%)
STUDY 3
System Design and Construction:
Lynne A. Munro (69%), Geoff Wanders (25%), Tom Kepple (5%), Joan Charmant (1%)
Calibration System Design:
Assoc. Prof. Chris R. Abbiss (60%), Lynne A. Munro (30%), Nadija Vrdoljak (10%)
Calibration Process:
Lynne A. Munro (80%), Assoc. Prof. Chris R. Abbiss (20%)
Data Collection:
Lynne A. Munro (90%), Nicholas Flyger (5%), Scott Baker (5%)

216
Data Analysis:
Lynne A. Munro (80%), Nicholas Flyger (15%), Scott Baker (5%)
Statistical Analysis:
Lynne A. Munro (80%), Nicholas Flyger (20%)