Embed Size (px)
Citation preview
U.S. Department of the InteriorU.S. Geological Survey
Open-File Report 2015–1093
Assessment of Interim Flow Water-Quality Data of the San Joaquin River Restoration Program and Implications for Fishes, California, 2009–11

Cover. San Joaquin River in Central Valley. Copyright image 000027139714, iStock.com website, used with permission.

Assessment of Interim Flow Water-Quality Data of the San Joaquin River Restoration Program and Implications for Fishes, California, 2009–11
By Marissa L. Wulff and Larry R. Brown
Open-File Report 2015–1093
U.S. Department of the InteriorU.S. Geological Survey
U.S. Department of the InteriorSALLY JEWELL, Secretary
U.S. Geological SurveySuzette M. Kimball, Acting Director
U.S. Geological Survey, Reston, Virginia: 2015
For more information on the USGS—the Federal source for science about the Earth, its natural and living resources, natural hazards, and the environment—visit http://www.usgs.gov or call 1–888–ASK–USGS.
For an overview of USGS information products, including maps, imagery, and publications, visit http://www.usgs.gov/pubprod/.
Any use of trade, firm, or product names is for descriptive purposes only and does not imply endorsement by the U.S. Government.
Although this information product, for the most part, is in the public domain, it also may contain copyrighted materials as noted in the text. Permission to reproduce copyrighted items must be secured from the copyright owner.
Suggested citation:Wulff, M.L., and Brown L.R., 2015, Assessment of interim flow water-quality data of the San Joaquin River restora-tion program and implications for fishes, California, 2009–11: U.S. Geological Survey Open-File Report 2015–1093, 25 p., http://dx.doi.org/10.3133/OFR20151093.
ISSN 2331-1258 (online)

iii
Contents
Abstract ...........................................................................................................................................................1Introduction.....................................................................................................................................................1 Purpose and Scope ..........................................................................................................................2 Description of the Study Area ........................................................................................................3Methods...........................................................................................................................................................3 Sample Collection and Reporting ..................................................................................................3 Sampling Locations ..........................................................................................................................4 Sampling Frequency ........................................................................................................................4 Methods .............................................................................................................................................5Results and Discussion .................................................................................................................................8 Concentrations Found and Comparisons to Biologically Based Thresholds .........................8
Water Quality ..................................................................................................................8 Sediment Quality ............................................................................................................8
Sampling Frequency ......................................................................................................................15 Sampling Locations ........................................................................................................................15 Sample Media .................................................................................................................................16 Sample Processing ........................................................................................................................16 Determining Relevance to Fishes ................................................................................................16References Cited..........................................................................................................................................19Appendix A. Water-quality data used in this report ...........................................................................21Appendix B. Analyte method description for water-quality and sediment-sample analysis ......22Appendix C. Sediment-quality data used in this report .....................................................................24
Figure 1. Map showing the location of the San Joaquin River Restoration Project
restoration reach, San Joaquin River, central California, reach sections, and sampling sites ...................................................................................................................2

iv
Tables 1. Water-quality and sediment monitoring-site locations ..........................................................4 2. Summary of all constituents measured in water and laboratory reporting limits.
Multiple reporting limits are listed for constituents that were analyzed by using different reporting limits for different sets of samples .........................................................5
3. Summary of all constituents measured in sediment with laboratory reporting limits ......7 4. Date and location of water-quality and sediment samples collected for the
San Joaquin River Restoration Project (SJRRP) during 2009–11 .......................................9 5. Summary of water-quality constituents above laboratory reporting limits, 2009–11 ......10 6. Summary of sediment sample constituents above laboratory reporting limits,
2009–11 ........................................................................................................................................11 7. U.S. Environmental Protection Agency (USEPA) Office of Pesticide Programs’
freshwater aquatic life benchmarks and criteria .................................................................12 8. Sediment results from site 9 in 2009 compared to sediment-quality targets and
benchmark toxicity thresholds ................................................................................................16 9. San Joaquin River Restoration Program (SJRRP) reporting limits above
U.S. Environmental Protection Agency (USEPA) Office of Pesticide Programs’ freshwater aquatic life benchmarks and criteria ..................................................................18
Conversion Factors
SI to Inch/Pound
Multiply By To obtain
Length
centimeter (cm) 0.3937 inch (in.)meter (m) 3.281 foot (ft) kilometer (km) 0.6214 mile (mi)
Volume
liter (L) 33.82 ounce, fluid (fl. oz)liter (L) 0.2642 gallon (gal)
Horizontal coordinate information is referenced to the North American Datum of 1983 (NAD 83).
Concentrations of chemical constituents in water are given either in milligrams per liter (mg/L) or micrograms per liter (µg/L).
v
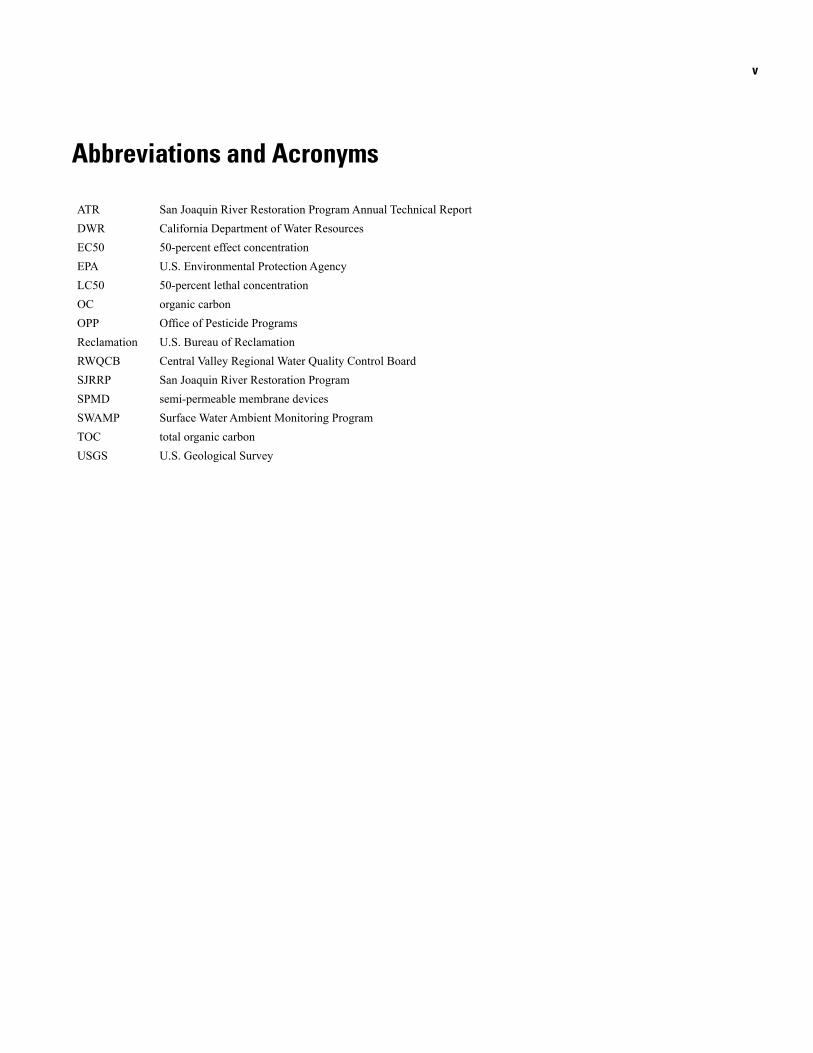
Abbreviations and Acronyms
ATR San Joaquin River Restoration Program Annual Technical ReportDWR California Department of Water ResourcesEC50 50-percent effect concentration EPA U.S. Environmental Protection AgencyLC50 50-percent lethal concentrationOC organic carbonOPP Office of Pesticide ProgramsReclamation U.S. Bureau of ReclamationRWQCB Central Valley Regional Water Quality Control BoardSJRRP San Joaquin River Restoration ProgramSPMD semi-permeable membrane devicesSWAMP Surface Water Ambient Monitoring Program TOC total organic carbonUSGS U.S. Geological Survey

Assessment of Interim Flow Water-Quality Data of the San Joaquin River Restoration Program and Implications for Fishes, California, 2009–11
By Marissa L. Wulff and Larry R. Brown
Abstract After more than 50 years of extensive water diversion
for urban and agriculture use, a major settlement was reached among the U.S. Departments of the Interior and Commerce, the Natural Resources Defense Council, and the Friant Water Users Authority in an effort to restore the San Joaquin River. The settlement received Federal court approval in October 2006 and established the San Joaquin River Restoration Pro-gram, a multi-agency collaboration between State and Federal agencies to restore and maintain fish populations, including Chinook salmon, in the main stem of the river between Friant Dam and the confluence with the Merced River. This is to be done while avoiding or minimizing adverse water sup-ply effects to all of the Friant Division contractors that could result from restoration flows required by the settlement. The settlement stipulates that water- and sediment-quality data be collected to help assess the restoration goals. This report summarizes and evaluates water-quality data collected in the main stem of the San Joaquin River between Friant Dam and the Merced River by the U.S. Bureau of Reclamation for the San Joaquin River Restoration Program during 2009–11. This summary and assessment consider sampling frequency for adequate characterization of variability, sampling locations for sufficient characterization of the San Joaquin River Restora-tion Program restoration reach, sampling methods for appro-priate media (water and sediment), and constituent reporting limits. After reviewing the water- and sediment-quality results for the San Joaquin River Restoration Program, several sug-gestions were made to the Fisheries Management Work Group, a division of the San Joaquin River Restoration Program that focuses solely on the reintroduction strategies and health of salmon and other native fishes in the river. Water-quality results for lead and total organic carbon exceeded the Surface Water Ambient Monitoring Program Basin Plan Objectives for the San Joaquin Basin, and results for copper exceeded the U.S. Environmental Protection Agency Office of Pesti-cide Programs’ aquatic-life chronic and acute benchmarks for invertebrates. One sediment sample contained detections of pyrethroid pesticides bifenthrin, lambda-cyhalothrin, and total permethrin at concentrations above published chronic toxicity thresholds.
IntroductionThe San Joaquin River Restoration Program (SJRRP) is
a multi-agency collaboration to restore flows and fish to the San Joaquin River from Friant Dam to the confluence with the Merced River (fig.1). Member agencies include the U.S. Bureau of Reclamation (Reclamation), U.S. Fish and Wild-life Service (USFWS), National Marine Fisheries Service (NMFS), California Department of Fish and Wildlife (DFW), California Department of Water Resources (DWR), U.S. Geo-logical Survey (USGS), and private consultants. The SJRRP is the result of a settlement reached by the U.S. Departments of the Interior and Commerce, the Natural Resources Defense Council, and the Friant Water Users Authority in October 2006. The settlement has two major goals. The first goal is to restore and maintain fish populations, including naturally reproducing and self-sustaining populations of Chinook salmon Oncorhynchus tshawytscha in the main stem of the San Joaquin River between Friant Dam and the confluence with the Merced River. The second goal of the settlement is to reduce or avoid adverse water supply effects for all of the Friant Division contractors that could result from the flows required by the settlement. The release of interim flows began in October 2009 and continues until full restoration flows begin. Interim flows are meant to allow implementing agen-cies the opportunity to collect data related to flow; seepage losses; and fish needs, such as passage requirements, habitat quality, temperature constraints, and holding-pool availability, to aid in the implementation of full restoration flows.
There has been a variety of research on San Joaquin River water and sediment quality, particularly concerning the effect of agricultural pesticides and drainage water on aquatic and terrestrial environmental quality and biota (Saiki and oth-ers, 1993; Giddings and others, 2000; Domagalski and others, 2010); however, most of this work has been done downstream of the SJRRP restoration reach, where the river remains peren-nial. There are little data available from the SJRRP restora-tion reach before the agreement was reached, and there has been little interpretation or review of the specific water- and sediment-quality data collected for the SJRRP. The San Joa-quin River Restoration Program water- and sediment-quality results have been reported in previous SJRRP Annual Techni-cal Reports (San Joaquin River Restoration Program, 2010b), but little attention has been given to interpreting these results for possible effects on salmon and other native fish species that live in the San Joaquin River.
2 Assessment of Interim Flow Water-Quality Data of the San Joaquin River Restoration Program and Implications for Fishes, California, 2009–11
Purpose and Scope
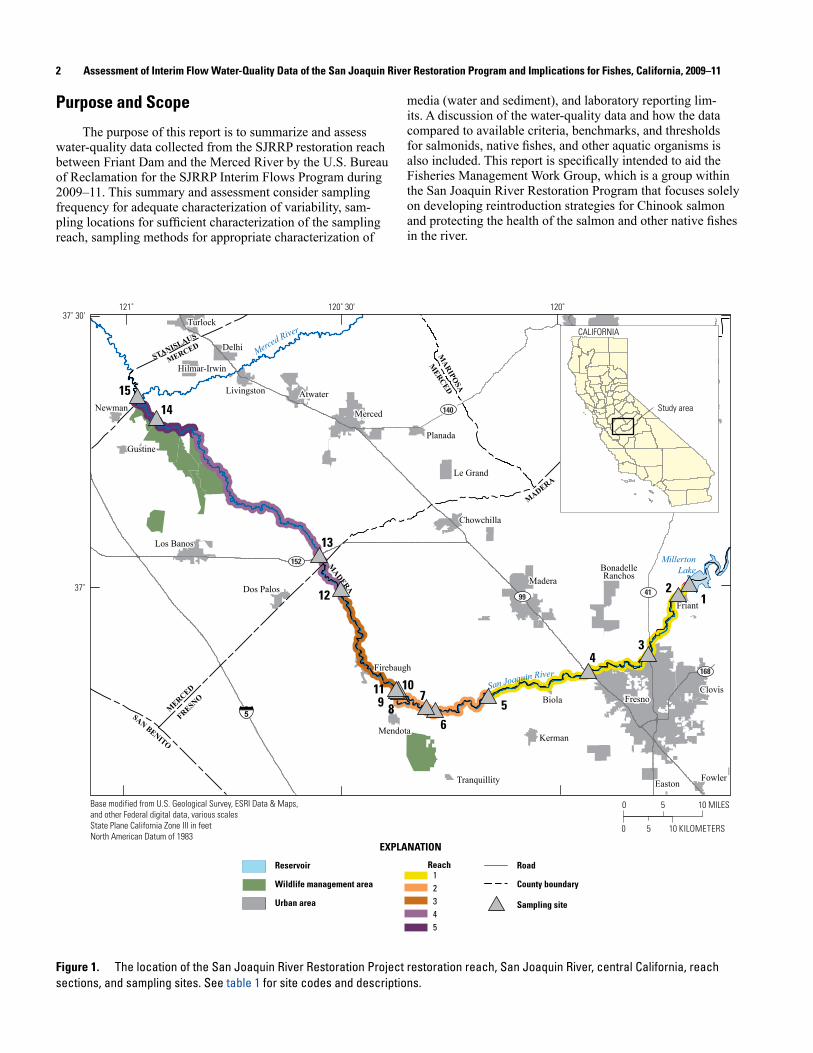
The purpose of this report is to summarize and assess water-quality data collected from the SJRRP restoration reach between Friant Dam and the Merced River by the U.S. Bureau of Reclamation for the SJRRP Interim Flows Program during 2009–11. This summary and assessment consider sampling frequency for adequate characterization of variability, sam-pling locations for sufficient characterization of the sampling reach, sampling methods for appropriate characterization of
media (water and sediment), and laboratory reporting lim-its. A discussion of the water-quality data and how the data compared to available criteria, benchmarks, and thresholds for salmonids, native fishes, and other aquatic organisms is also included. This report is specifically intended to aid the Fisheries Management Work Group, which is a group within the San Joaquin River Restoration Program that focuses solely on developing reintroduction strategies for Chinook salmon and protecting the health of the salmon and other native fishes in the river.
sac15-0553_fig 01
Bootjack
Yosem ite L akes
O akhurst
MillertonLake
MARIPO
SA
MADERA
MADERA
0 5 10 MILES
0 5 10 KILOMETERS
EXPLANATION
Reservoir
Wildlife management area
Urban area
Road
County boundary12345
Reach
121˚ 120˚ 30'37˚ 30'
37˚
120˚
LivingstonLivingston
Hilmar-IrwinHilmar-Irwin
TurlockTurlock
DelhiDelhi
NewmanNewman
GustineGustine
AtwaterAtwater
MercedMerced
PlanadaPlanada
Le GrandLe Grand
ChowchillaChowchilla
MaderaMadera
FriantFriant
BiolaBiola
EastonEaston
KermanKerman
TranquillityTranquillity
MendotaMendota
FirebaughFirebaugh
Dos PalosDos Palos
Los BanosLos Banos
FowlerFowler
FresnoFresnoClovisClovis
BonadelleRanchos
BonadelleRanchos
STANISLAUS
MERCED
MERCED
FRESNO
MERCED
SAN BENITO
5
Merced River
San Joaquin River
Study area
CALIFORNIA
99
140
152
41
168
Base modified from U.S. Geological Survey, ESRI Data & Maps, and other Federal digital data, various scalesState Plane California Zone III in feetNorth American Datum of 1983
Sampling site
6
789
12
34
5
10
12
13
1415
11
Figure 1. The location of the San Joaquin River Restoration Project restoration reach, San Joaquin River, central California, reach sections, and sampling sites. See table 1 for site codes and descriptions.

Methods 3
Description of the Study Area
The San Joaquin River is one of two major contribut-ing rivers to the Sacramento-San Joaquin Delta, the landward reach of the San Francisco Estuary. The San Joaquin River is the second largest river in California, with a length of over 480 kilometers (km; 300 miles), and has three major tributar-ies: the Merced, Tuolumne, and Stanislaus Rivers. Beginning in the Sierra Nevada Mountains, the river and its tributaries are extensively diverted for agricultural use in the San Joaquin Valley before reaching the Sacramento–San Joaquin Delta (fig. 1). Friant Dam was completed in 1942, forming Millerton Reservoir, which is a reservoir that stores surface water for irrigation and flood-control purposes. From Friant Dam, water is diverted north through the Madera Canal and south through the Friant-Kern Canal to irrigation districts that provide water for agricultural uses throughout the valley. Before the settle-ment, there was a small release for riparian-water users that maintained flow for some distance downstream from the dam. Water diversion downstream from Friant Dam generally removed most of the water from the natural channel, often leaving the river dry at Gravelly Ford (fig. 1). Downstream from Gravelly Ford, the San Joaquin River is either dry or wetted in sections as a result of water transport between diver-sions or collection of agricultural return water. The SJRRP focuses solely on the stretch of river between Friant Dam, near Fresno, California, to the confluence with the Merced River, which is a distance of 245 km (152 river miles; fig. 1).
The SJRRP restoration reach has been divided into five separate reaches to address variations in channel morphol-ogy, water presence and source, land use, vegetation, and infrastructure along the river (fig. 1). Reach 1 extends from Friant Dam to Gravelly Ford, is perennial, and has been mined for instream gravel. Mining and agriculture are the major land uses for this reach, and riparian vegetation is present in most of reach 1. Reach 2 begins at Gravelly Ford and ends at Mendota Dam. This reach is a meandering, low-gradient channel that is dry the majority of the year, except following flood releases. The Chowchilla Bypass Bifurcation Structure divides reach 2 into two subsections: reach 2A has pasture and grassland vegetation and reach 2B has a narrow strip of ripar-ian vegetation bordering the channel. Backwater coming from Mendota Pool causes a section of reach 2B to be perennial. Reach 3 begins downstream of Mendota Pool and extends to Sack Dam. Land use in reach 3 is primarily agriculture with some urban development and a narrow section of riparian veg-etation along the channel. The Delta-Mendota Canal, which delivers water to Mendota Pool, provides flow to this section of the river all year. At the end of this reach, Sack Dam diverts the water from Mendota Pool to the Arroyo Canal. Reach 4 extends from Sack Dam to the confluence with Bear Creek and the Eastside Bypass; this reach rarely contains water because of the diversion at Sack Dam. Reach 4 is divided into three subsections: 4A, 4B1, and 4B2. Reach 4A extends from Sack Dam to the Sand Slough Control Structure and is sparsely veg-etated. Reach 4B1, from Sand Slough Control Structure to the
confluence with the Mariposa Bypass, has been dry for more than 40 years, except for agricultural return flows. Reach 4B2, from the confluence of the Mariposa Bypass to the confluence of the Eastside Bypass, is where flood flows from the bypass return to the main stem of the San Joaquin River, creating a section of wide floodplain and natural vegetation. Reach 5 extends from the confluence of the Eastside Bypass to the con-fluence with the Merced River and contains water all year as a result of agriculture return flows from Mud and Salt Sloughs. Reach 5 has less agricultural land use than most other reaches and public wildlife areas managed for a variety of plant and wildlife species.
MethodsAll data in this report were collected by Reclamation
personnel and are publicly available from the Environmental Monitoring Database (U.S. Bureau of Reclamation, 2013). For this report, the accumulated water-quality data were first compiled and organized by location and date. The data were then compared to thresholds, benchmarks, and criteria obtained from literature sources for effects of water quality on aquatic organisms. This report specifically discusses the results of the SJRRP water-quality monitoring during interim flows and how exposure to various constituents in the river could affect the fishes in the SJRRP restoration reach. Detailed information about constituent concentrations, site locations, and collection dates are available in appendix D of the SJRRP Annual Technical Report (ATR; San Joaquin River Restoration Project, 2010a). Constituents that were not detected during SJRRP sampling are not discussed, unless recommendations were made to lower current laboratory reporting limits. All data that were downloaded from the Reclamation database and discussed in this report are available in appendixes A and C.
Sample Collection and Reporting
Water and sediment samples were collected by Reclama-tion personnel in accordance with the Central Valley Regional Water Quality Control Board (RWQCB) and California Surface Water Ambient Monitoring Program (SWAMP) guide-lines. Sample collection and processing also followed Provi-sion 22 of the State Water Resources Control Board Division of Water Rights Order WR 2009-0058-DWR and corrected WR 2010-0029-DWR, which is further described in appendix D of the ATR and the Interim Flow Program water-quality monitoring plan (San Joaquin River Restoration Program, 2010a, 2010c). The Water Rights Order requires the SJRRP implementing agencies to monitor water-quality to determine whether there are adverse effects associated with the Interim Flows Program and to evaluate whether additional measures are needed to address water-quality issues on the basis of sampling data. Water and sediment sampling for the Interim Flows Program are mandated and amended as described in
4 Assessment of Interim Flow Water-Quality Data of the San Joaquin River Restoration Program and Implications for Fishes, California, 2009–11
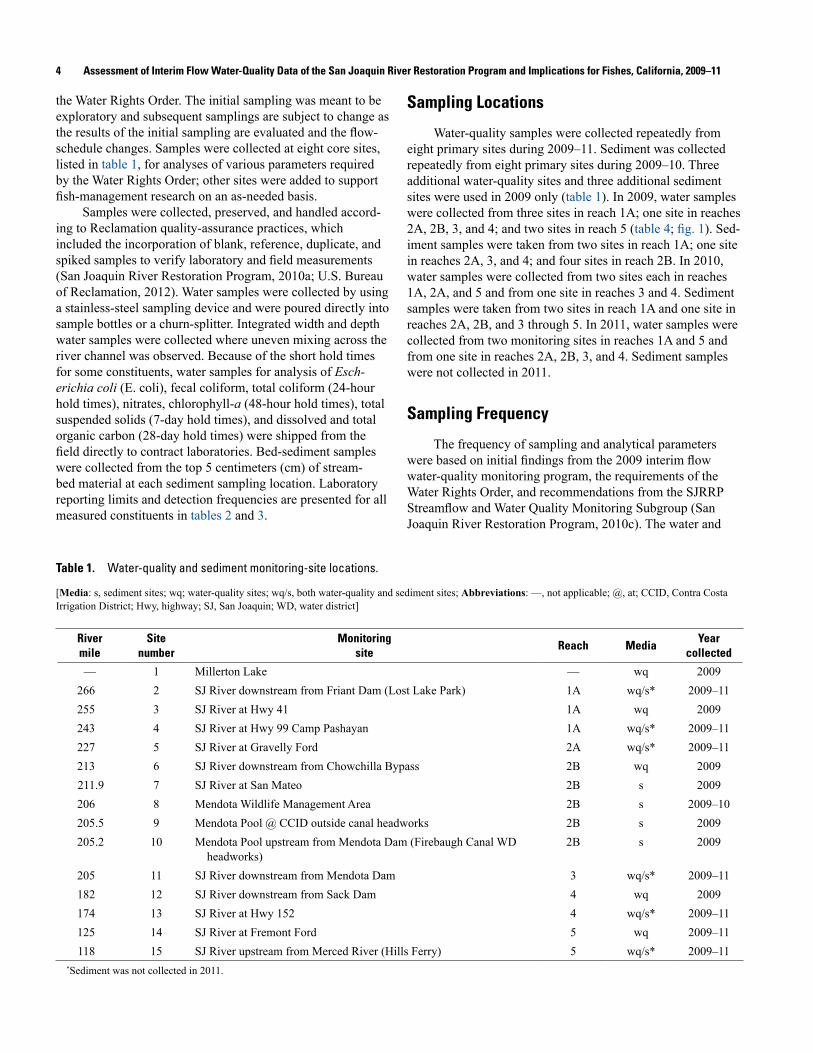
the Water Rights Order. The initial sampling was meant to be exploratory and subsequent samplings are subject to change as the results of the initial sampling are evaluated and the flow-schedule changes. Samples were collected at eight core sites, listed in table 1, for analyses of various parameters required by the Water Rights Order; other sites were added to support fish-management research on an as-needed basis.
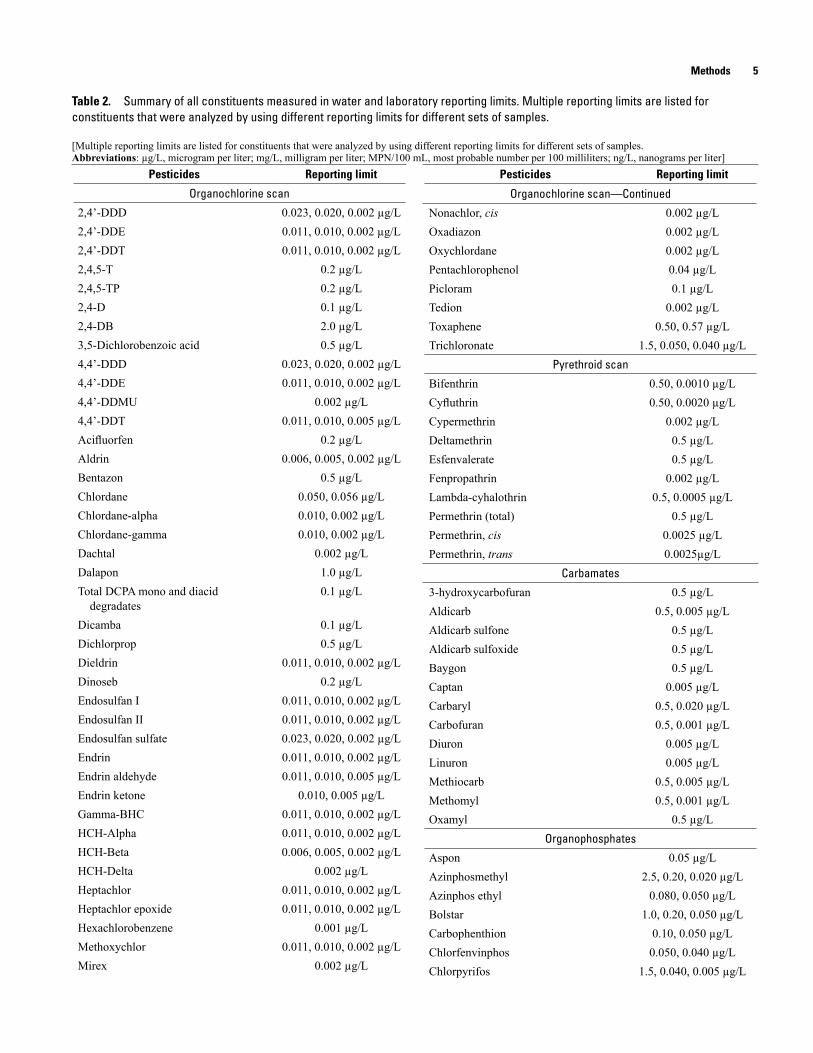
Samples were collected, preserved, and handled accord-ing to Reclamation quality-assurance practices, which included the incorporation of blank, reference, duplicate, and spiked samples to verify laboratory and field measurements (San Joaquin River Restoration Program, 2010a; U.S. Bureau of Reclamation, 2012). Water samples were collected by using a stainless-steel sampling device and were poured directly into sample bottles or a churn-splitter. Integrated width and depth water samples were collected where uneven mixing across the river channel was observed. Because of the short hold times for some constituents, water samples for analysis of Esch-erichia coli (E. coli), fecal coliform, total coliform (24-hour hold times), nitrates, chlorophyll-a (48-hour hold times), total suspended solids (7-day hold times), and dissolved and total organic carbon (28-day hold times) were shipped from the field directly to contract laboratories. Bed-sediment samples were collected from the top 5 centimeters (cm) of stream-bed material at each sediment sampling location. Laboratory reporting limits and detection frequencies are presented for all measured constituents in tables 2 and 3.
Sampling Locations
Water-quality samples were collected repeatedly from eight primary sites during 2009–11. Sediment was collected repeatedly from eight primary sites during 2009–10. Three additional water-quality sites and three additional sediment sites were used in 2009 only (table 1). In 2009, water samples were collected from three sites in reach 1A; one site in reaches 2A, 2B, 3, and 4; and two sites in reach 5 (table 4; fig. 1). Sed-iment samples were taken from two sites in reach 1A; one site in reaches 2A, 3, and 4; and four sites in reach 2B. In 2010, water samples were collected from two sites each in reaches 1A, 2A, and 5 and from one site in reaches 3 and 4. Sediment samples were taken from two sites in reach 1A and one site in reaches 2A, 2B, and 3 through 5. In 2011, water samples were collected from two monitoring sites in reaches 1A and 5 and from one site in reaches 2A, 2B, 3, and 4. Sediment samples were not collected in 2011.
Sampling Frequency
The frequency of sampling and analytical parameters were based on initial findings from the 2009 interim flow water-quality monitoring program, the requirements of the Water Rights Order, and recommendations from the SJRRP Streamflow and Water Quality Monitoring Subgroup (San Joaquin River Restoration Program, 2010c). The water and
Table 1. Water-quality and sediment monitoring-site locations.
[Media: s, sediment sites; wq; water-quality sites; wq/s, both water-quality and sediment sites; Abbreviations: —, not applicable; @, at; CCID, Contra Costa Irrigation District; Hwy, highway; SJ, San Joaquin; WD, water district]
River mile
Site number
Monitoring site
Reach MediaYear
collected
— 1 Millerton Lake — wq 2009266 2 SJ River downstream from Friant Dam (Lost Lake Park) 1A wq/s* 2009–11255 3 SJ River at Hwy 41 1A wq 2009243 4 SJ River at Hwy 99 Camp Pashayan 1A wq/s* 2009–11227 5 SJ River at Gravelly Ford 2A wq/s* 2009–11213 6 SJ River downstream from Chowchilla Bypass 2B wq 2009211.9 7 SJ River at San Mateo 2B s 2009206 8 Mendota Wildlife Management Area 2B s 2009–10205.5 9 Mendota Pool @ CCID outside canal headworks 2B s 2009205.2 10 Mendota Pool upstream from Mendota Dam (Firebaugh Canal WD
headworks)2B s 2009
205 11 SJ River downstream from Mendota Dam 3 wq/s* 2009–11182 12 SJ River downstream from Sack Dam 4 wq 2009174 13 SJ River at Hwy 152 4 wq/s* 2009–11125 14 SJ River at Fremont Ford 5 wq 2009–11118 15 SJ River upstream from Merced River (Hills Ferry) 5 wq/s* 2009–11
*Sediment was not collected in 2011.
Methods 5
Table 2. Summary of all constituents measured in water and laboratory reporting limits. Multiple reporting limits are listed for constituents that were analyzed by using different reporting limits for different sets of samples.
[Multiple reporting limits are listed for constituents that were analyzed by using different reporting limits for different sets of samples. Abbreviations: µg/L, microgram per liter; mg/L, milligram per liter; MPN/100 mL, most probable number per 100 milliliters; ng/L, nanograms per liter]
Pesticides Reporting limit
Organochlorine scan
2,4’-DDD 0.023, 0.020, 0.002 µg/L2,4’-DDE 0.011, 0.010, 0.002 µg/L 2,4’-DDT 0.011, 0.010, 0.002 µg/L 2,4,5-T 0.2 µg/L 2,4,5-TP 0.2 µg/L2,4-D 0.1 µg/L2,4-DB 2.0 µg/L3,5-Dichlorobenzoic acid 0.5 µg/L4,4’-DDD 0.023, 0.020, 0.002 µg/L 4,4’-DDE 0.011, 0.010, 0.002 µg/L 4,4’-DDMU 0.002 µg/L4,4’-DDT 0.011, 0.010, 0.005 µg/L Acifluorfen 0.2 µg/LAldrin 0.006, 0.005, 0.002 µg/L Bentazon 0.5 µg/LChlordane 0.050, 0.056 µg/L Chlordane-alpha 0.010, 0.002 µg/L Chlordane-gamma 0.010, 0.002 µg/L Dachtal 0.002 µg/LDalapon 1.0 µg/LTotal DCPA mono and diacid
degradates0.1 µg/L
Dicamba 0.1 µg/LDichlorprop 0.5 µg/LDieldrin 0.011, 0.010, 0.002 µg/L Dinoseb 0.2 µg/LEndosulfan I 0.011, 0.010, 0.002 µg/L Endosulfan II 0.011, 0.010, 0.002 µg/L Endosulfan sulfate 0.023, 0.020, 0.002 µg/L Endrin 0.011, 0.010, 0.002 µg/L Endrin aldehyde 0.011, 0.010, 0.005 µg/L Endrin ketone 0.010, 0.005 µg/L Gamma-BHC 0.011, 0.010, 0.002 µg/L HCH-Alpha 0.011, 0.010, 0.002 µg/L HCH-Beta 0.006, 0.005, 0.002 µg/L HCH-Delta 0.002 µg/LHeptachlor 0.011, 0.010, 0.002 µg/L Heptachlor epoxide 0.011, 0.010, 0.002 µg/L Hexachlorobenzene 0.001 µg/LMethoxychlor 0.011, 0.010, 0.002 µg/L Mirex 0.002 µg/L
Pesticides Reporting limit
Organochlorine scan—Continued
Nonachlor, cis 0.002 µg/LOxadiazon 0.002 µg/LOxychlordane 0.002 µg/LPentachlorophenol 0.04 µg/LPicloram 0.1 µg/LTedion 0.002 µg/LToxaphene 0.50, 0.57 µg/L Trichloronate 1.5, 0.050, 0.040 µg/L
Pyrethroid scan
Bifenthrin 0.50, 0.0010 µg/L Cyfluthrin 0.50, 0.0020 µg/L Cypermethrin 0.002 µg/LDeltamethrin 0.5 µg/LEsfenvalerate 0.5 µg/LFenpropathrin 0.002 µg/LLambda-cyhalothrin 0.5, 0.0005 µg/LPermethrin (total) 0.5 µg/LPermethrin, cis 0.0025 µg/LPermethrin, trans 0.0025µg/L
Carbamates
3-hydroxycarbofuran 0.5 µg/LAldicarb 0.5, 0.005 µg/L Aldicarb sulfone 0.5 µg/LAldicarb sulfoxide 0.5 µg/LBaygon 0.5 µg/LCaptan 0.005 µg/LCarbaryl 0.5, 0.020 µg/L Carbofuran 0.5, 0.001 µg/L Diuron 0.005 µg/LLinuron 0.005 µg/LMethiocarb 0.5, 0.005 µg/L Methomyl 0.5, 0.001 µg/L Oxamyl 0.5 µg/L
Organophosphates
Aspon 0.05 µg/LAzinphosmethyl 2.5, 0.20, 0.020 µg/L Azinphos ethyl 0.080, 0.050 µg/L Bolstar 1.0, 0.20, 0.050 µg/L Carbophenthion 0.10, 0.050 µg/L Chlorfenvinphos 0.050, 0.040 µg/L Chlorpyrifos 1.5, 0.040, 0.005 µg/L

6 Assessment of Interim Flow Water-Quality Data of the San Joaquin River Restoration Program and Implications for Fishes, California, 2009–11
Pesticides Reporting limit
Organophosphates—Continued
Chlorpyrifos, methyl 0.050, 0.040 µg/L Ciodrin 0.05 µg/LCoumaphos 1.0, 0.40, 0.050 µg/L Demeton 3.0 µg/LDemeton-o 1.0 µg/LDemeton-s 2.0, 0.10, 0.050 µg/L Diazinon 0.50, 0.040, 0.005 µg/L Dichlorfenthion 0.050, 0.040 µg/L Dichlorvos 0.50, 0.10, 0.050 µg/L Dicrotophos 0.05 µg/LDimethoate 1.5, 0.20, 0.030 µg/L Dioxathion 0.05 µg/LDisulfoton 1.0, 0.10, 0.020 µg/L Epn 1.2 µg/LEthion 0.050, 0.040 µg/L Ethoprop 1.5, 0.10, 0.050 µg/L Famphur 1.0, 0.40, 0.050 µg/L Fenitrothion 0.050, 0.040 µg/L Fensulfothion 2.5, 0.20, 0.050 µg/L Fenthion 2.5, 0.50, 0.040 µg/L Fonophos 0.050, 0.040 µg/L Glyphosate 6.0 µg/LLeptophos 0.050, 0.040 µg/L Malathion 2.0, 0.10, 0.020 µg/L Merphos 5.0, 0.050 µg/L Methidathion 0.10, 0.020 µg/L Mevinphos 6.2, 0.10, 0.050 µg/L Naled 2.0, 0.50, 0.050 µg/L O,O,O-Triethylphosphorothioate 0.5 µg/LParathion, ethyl 1.0 µg/LParathion, methyl 4.0 µg/LPhorate 1.2, 0.10, 0.020 µg/L Phosmet 0.20, 0.02 µg/L Phosphamadon 0.05 µg/LRonnel 10, 0.10, 0.050 µg/L Sulfotep 1.5, 0.050, 0.040 µg/L Terbufos 0.050, 0.040 µg/L Tetrachlorvinphos 3.5, 0.10, 0.050 µg/L Thionazin 1.0, 0.050, 0.040 µg/L Tokuthion 1.6, 0.10, 0.050 µg/L
Pesticides Reporting limit
Organophosphates—Continued
Trichlorfon 0.05 µg/LTotal suspended solids 1.0–43 mg/LTotal organic carbon 0.6, 0.3 mg/LDissolved organic carbon 0.3 µg/L
Nutrients
Ammonia as N 0.5, 0.05 mg/LChlorophyll A 2.0–6.0 µg/LNitrate + nitrite as N 0.05 µg/LNitrate as N 0.05 mg/LNitrite as N 0.03 mg/LPhosphorus, total as P 0.05 mg/LTotal Kjeldhal nitrogen (TKN) 0.5, 0.2 mg/L
Bacteria
Escherichia coli (E. coli) 1.0, 2.0 MPN/100 mLFecal coliform 2.0 MPN/100 mLTotal coliform 1.0–2.0/100 ml
Trace elements, cations
Calcium 1.0, 5.0 mg/LMagnesium 1.0, 5.0 mg/LPotassium 1.0, 5.0 mg/LSodium 1.0, 5.0, 10 mg/L
Trace elements, anions
Alkalinity 5.0 mg/LBicarbonate alkalinity 5.0 mg/LCarbonate alkalinity 5.0 mg/LChloride 0.4–2.0 mg/LHydroxide alkalinity 5.0 mg/LSulfate 0.4–2.0 mg/L
Trace elements, total
Arsenic 0.5 µg/LBoron 10.0 µg/LChromium 0.5 µg/LCopper 0.5 µg/LLead 0.5 µg/LMercury 200, 100, 2.0 ng/LMolybdenum 0.5 µg/LNickel 1.0 µg/LSelenium 0.8, 0.4 µg/LZinc 2.0 µg/L
Table 2. Summary of all constituents measured in water and laboratory reporting limits. Multiple reporting limits are listed for constituents that were analyzed by using different reporting limits for different sets of samples.—Continued
[Multiple reporting limits are listed for constituents that were analyzed by using different reporting limits for different sets of samples. Abbreviations: µg/L, microgram per liter; mg/L, milligram per liter; MPN/100 mL, most probable number per 100 milliliters; ng/L, nanograms per liter]

Methods 7
Table 3. Summary of all constituents measured in sediment with laboratory reporting limits.
[Abbreviations: —, not available; μg/g, micrograms per gram; µg/kg, microgram per kilogram; ng/g, nanograms per gram]
Pesticides Reporting limit
Organochlorine scan
2,4’-DDD 1.0–8.7 ng/g2,4’-DDE 2.0–8.7 ng/g4,4’-DDD 0.65–8.7 ng/g4,4’-DDE 2.0–8.7 ng/g4,4’-DDMU 3.0–4.4 ng/g4,4’-DDT 0.65–87 ng/gAldrin 1.0–1.5 ng/gChlordane, technical 6.1–13.0 µg/kgChlordane-alpha 1.0–1.5 ng/gChlordane-gamma 1.0–1.5 ng/gDachtal 0.99–1.5 ng/gDieldrin 0.50–51.0 ng/gEndosulfan I 2.0–2.9 ng/gEndosulfan II 6.8 ng/gEndosulfan sulfate 5.5 ng/gEndrin 0.65–87.0 ng/gGamma-BHC 0.5–51 ng/gHCH-alpha 0.50–0.73 ng/gHCH-beta 1.0–1.5 ng/gHeptachlor 1.0–1.5 ng/gHeptachlor epoxide 0.65–8.4 ng/gHexachlorobenzene 0.69–1.0 ng/gMethoxychlor 3.0–4.4 ng/gMirex 1.5–2.2 ng/gNonachlor, cis 0.99–1.5 ng/gNonachlor, trans 5.8–11 ng/gOxadiazon 0.99–1.5 ng/gOxychlordane 0.99–1.5 ng/g
Pesticides Reporting limit
Pyrethroid scan
Bifenthrin 0.0012–21.0 µg/kgCyfluthrin 0.0047–21.0 µg/kgCypermethrin 4.7–8.6 ng/gEsfenvalerate 13–22 µg/kgFenpropathrin 4.7–8.6 ng/gLambda-cyhalothrin 0.0023–22.0 µg/kgPermethrin (total) 13–22 µg/kgPermethrin, cis 5.8–11.0 ng/gPermethrin, trans 5.8–11.0 ng/g
Organophosphates
Chlorpyrifos 0.46–0.59 ng/gTrace elements, total
Arsenic 0.5–1.3 µg/gChromium 0.5–1.0 µg/gCopper 0.5–1.0 µg/gLead 0.5–1.3 µg/gMercury 0.0117–0.3 µg/gNickel 1.0 µg/gSelenium 2.5–4.4 µg/gZinc 1.5–2.0 µg/gTotal Organic Carbon (TOC) 2,000–2,500 µg/gDissolved Organic Carbon
(DOC)2,000 µg/g
Percentage of solids —Pecentage of moisture —H. azteca survival —H. azteca dry weight —
8 Assessment of Interim Flow Water-Quality Data of the San Joaquin River Restoration Program and Implications for Fishes, California, 2009–11
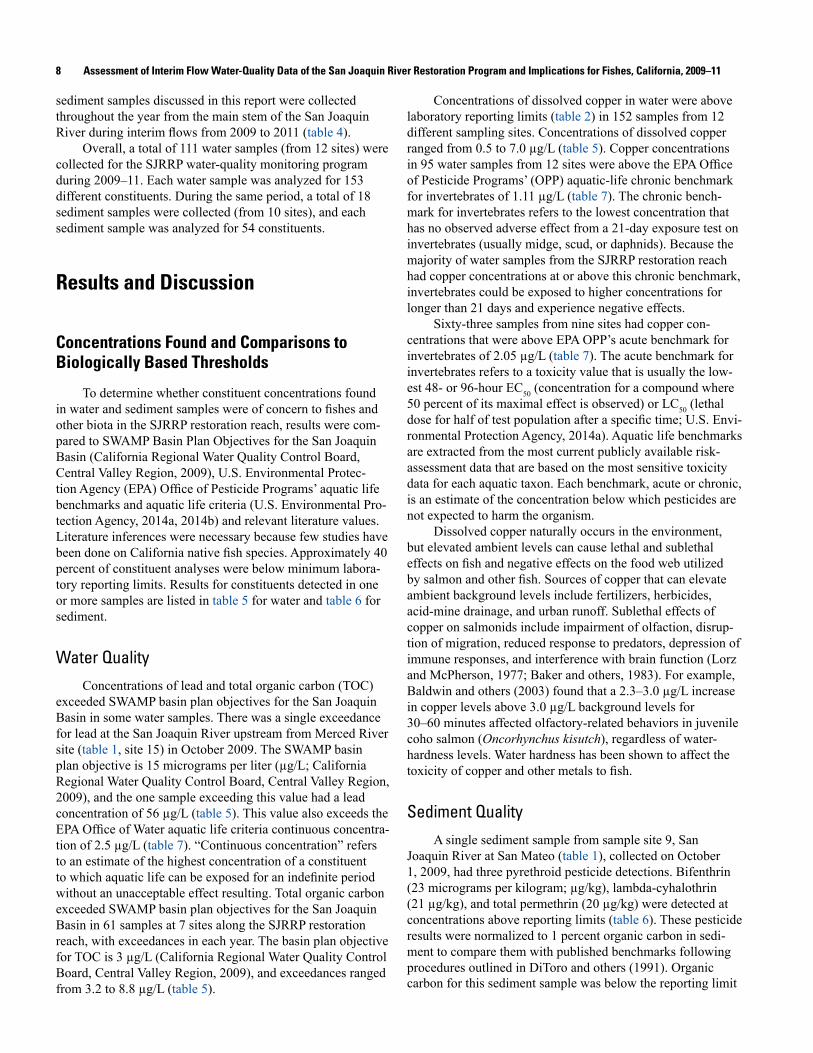
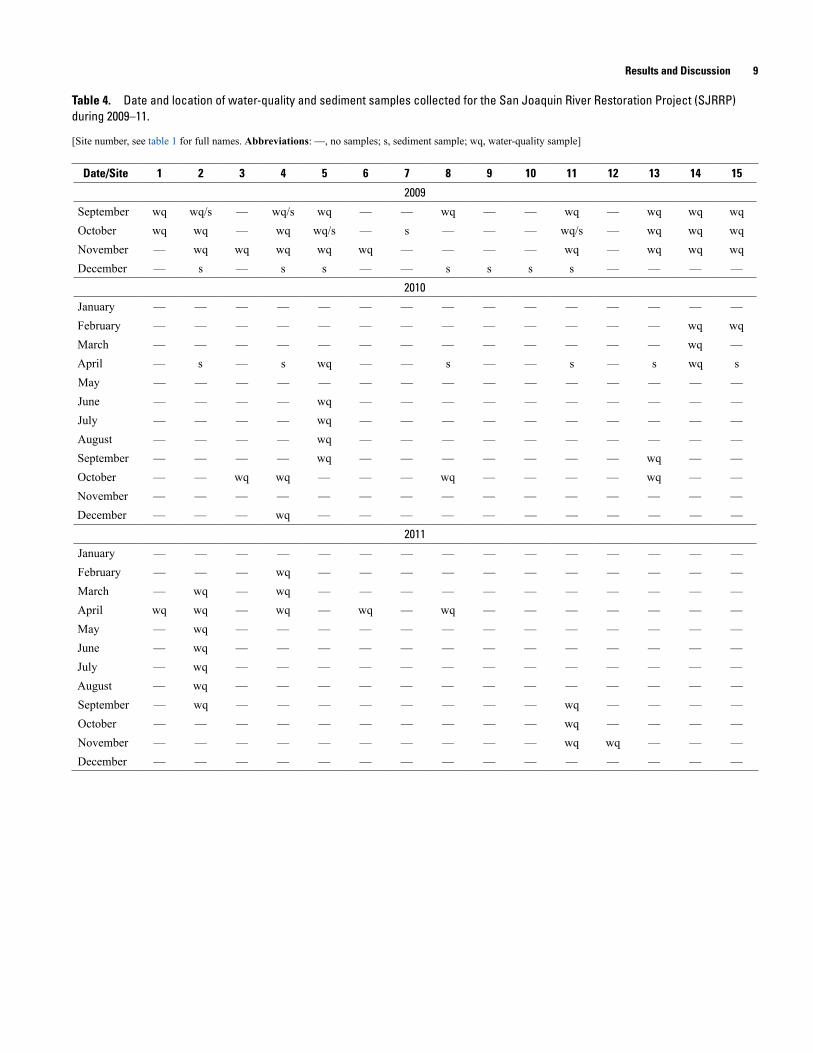
sediment samples discussed in this report were collected throughout the year from the main stem of the San Joaquin River during interim flows from 2009 to 2011 (table 4).
Overall, a total of 111 water samples (from 12 sites) were collected for the SJRRP water-quality monitoring program during 2009–11. Each water sample was analyzed for 153 different constituents. During the same period, a total of 18 sediment samples were collected (from 10 sites), and each sediment sample was analyzed for 54 constituents.
Results and Discussion
Concentrations Found and Comparisons to Biologically Based Thresholds
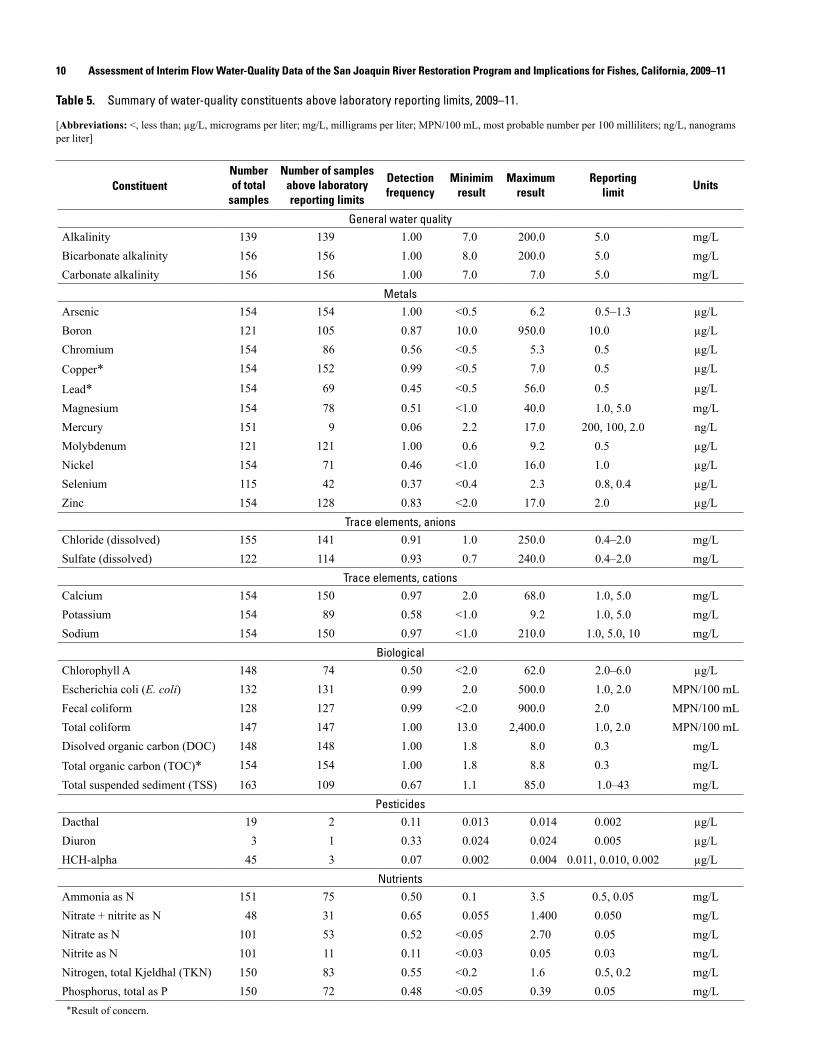
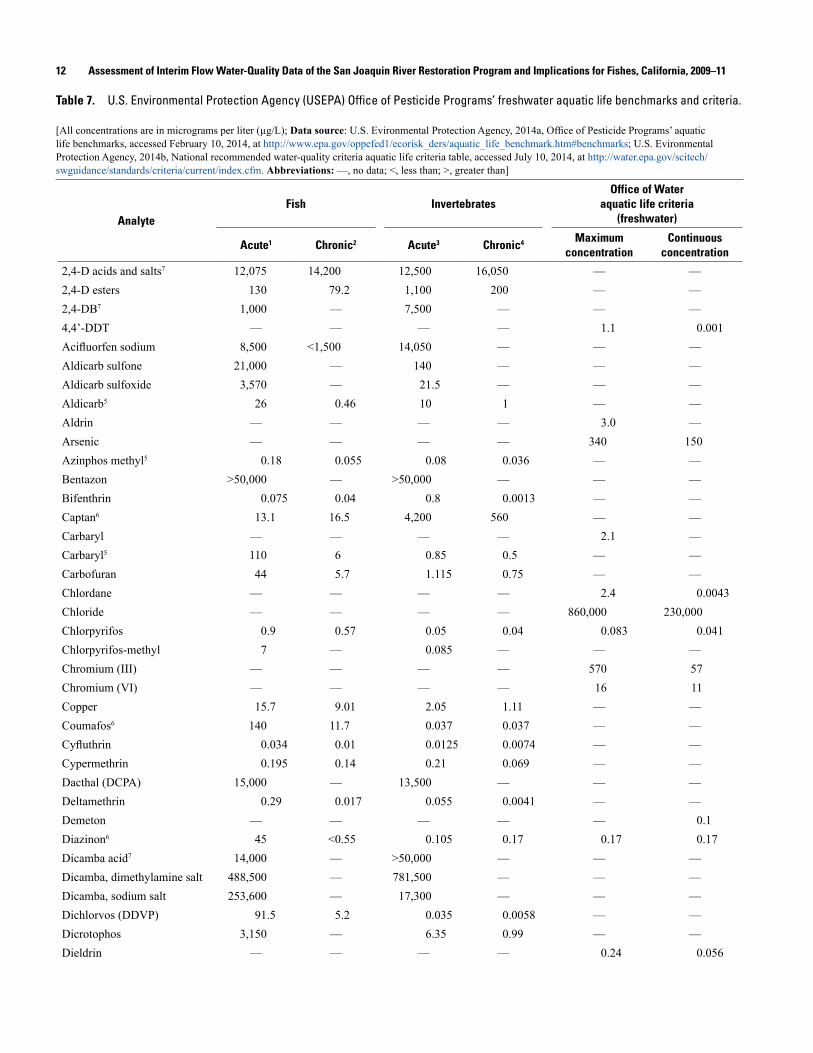
To determine whether constituent concentrations found in water and sediment samples were of concern to fishes and other biota in the SJRRP restoration reach, results were com-pared to SWAMP Basin Plan Objectives for the San Joaquin Basin (California Regional Water Quality Control Board, Central Valley Region, 2009), U.S. Environmental Protec-tion Agency (EPA) Office of Pesticide Programs’ aquatic life benchmarks and aquatic life criteria (U.S. Environmental Pro-tection Agency, 2014a, 2014b) and relevant literature values. Literature inferences were necessary because few studies have been done on California native fish species. Approximately 40 percent of constituent analyses were below minimum labora-tory reporting limits. Results for constituents detected in one or more samples are listed in table 5 for water and table 6 for sediment.
Water QualityConcentrations of lead and total organic carbon (TOC)
exceeded SWAMP basin plan objectives for the San Joaquin Basin in some water samples. There was a single exceedance for lead at the San Joaquin River upstream from Merced River site (table 1, site 15) in October 2009. The SWAMP basin plan objective is 15 micrograms per liter (µg/L; California Regional Water Quality Control Board, Central Valley Region, 2009), and the one sample exceeding this value had a lead concentration of 56 µg/L (table 5). This value also exceeds the EPA Office of Water aquatic life criteria continuous concentra-tion of 2.5 µg/L (table 7). “Continuous concentration” refers to an estimate of the highest concentration of a constituent to which aquatic life can be exposed for an indefinite period without an unacceptable effect resulting. Total organic carbon exceeded SWAMP basin plan objectives for the San Joaquin Basin in 61 samples at 7 sites along the SJRRP restoration reach, with exceedances in each year. The basin plan objective for TOC is 3 µg/L (California Regional Water Quality Control Board, Central Valley Region, 2009), and exceedances ranged from 3.2 to 8.8 µg/L (table 5).
Concentrations of dissolved copper in water were above laboratory reporting limits (table 2) in 152 samples from 12 different sampling sites. Concentrations of dissolved copper ranged from 0.5 to 7.0 µg/L (table 5). Copper concentrations in 95 water samples from 12 sites were above the EPA Office of Pesticide Programs’ (OPP) aquatic-life chronic benchmark for invertebrates of 1.11 µg/L (table 7). The chronic bench-mark for invertebrates refers to the lowest concentration that has no observed adverse effect from a 21-day exposure test on invertebrates (usually midge, scud, or daphnids). Because the majority of water samples from the SJRRP restoration reach had copper concentrations at or above this chronic benchmark, invertebrates could be exposed to higher concentrations for longer than 21 days and experience negative effects.
Sixty-three samples from nine sites had copper con-centrations that were above EPA OPP’s acute benchmark for invertebrates of 2.05 µg/L (table 7). The acute benchmark for invertebrates refers to a toxicity value that is usually the low-est 48- or 96-hour EC50 (concentration for a compound where 50 percent of its maximal effect is observed) or LC50 (lethal dose for half of test population after a specific time; U.S. Envi-ronmental Protection Agency, 2014a). Aquatic life benchmarks are extracted from the most current publicly available risk-assessment data that are based on the most sensitive toxicity data for each aquatic taxon. Each benchmark, acute or chronic, is an estimate of the concentration below which pesticides are not expected to harm the organism.
Dissolved copper naturally occurs in the environment, but elevated ambient levels can cause lethal and sublethal effects on fish and negative effects on the food web utilized by salmon and other fish. Sources of copper that can elevate ambient background levels include fertilizers, herbicides, acid-mine drainage, and urban runoff. Sublethal effects of copper on salmonids include impairment of olfaction, disrup-tion of migration, reduced response to predators, depression of immune responses, and interference with brain function (Lorz and McPherson, 1977; Baker and others, 1983). For example, Baldwin and others (2003) found that a 2.3–3.0 µg/L increase in copper levels above 3.0 µg/L background levels for 30–60 minutes affected olfactory-related behaviors in juvenile coho salmon (Oncorhynchus kisutch), regardless of water-hardness levels. Water hardness has been shown to affect the toxicity of copper and other metals to fish.
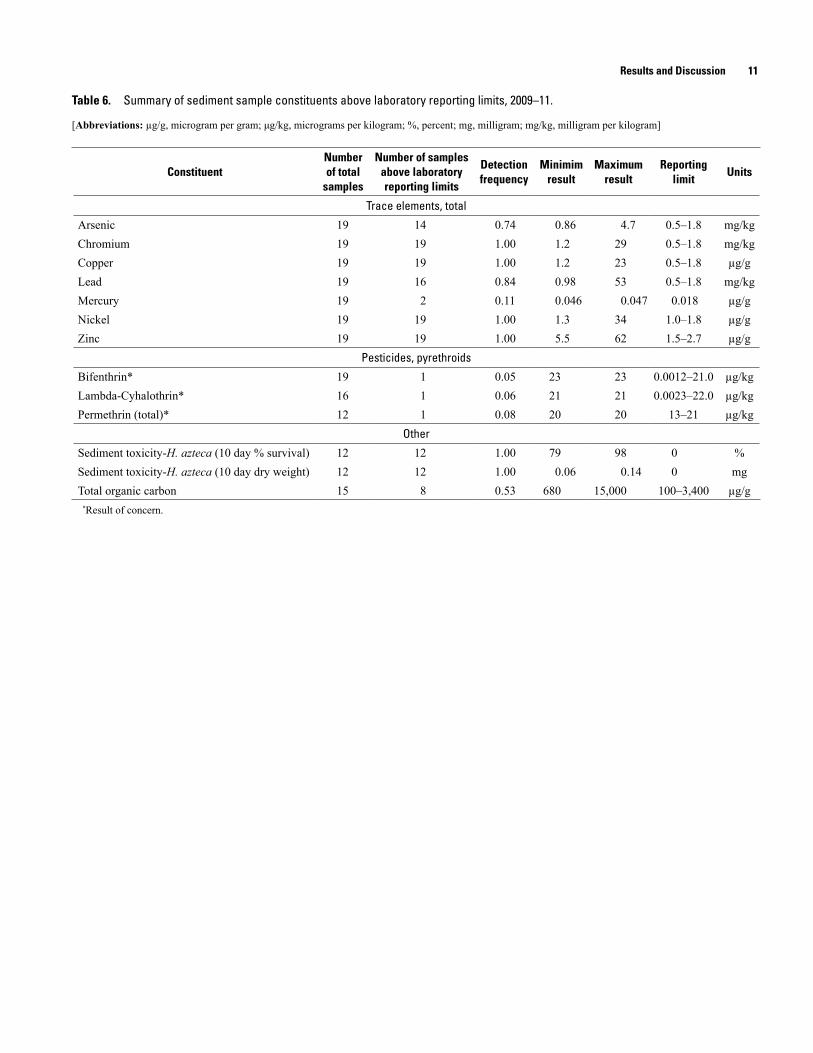
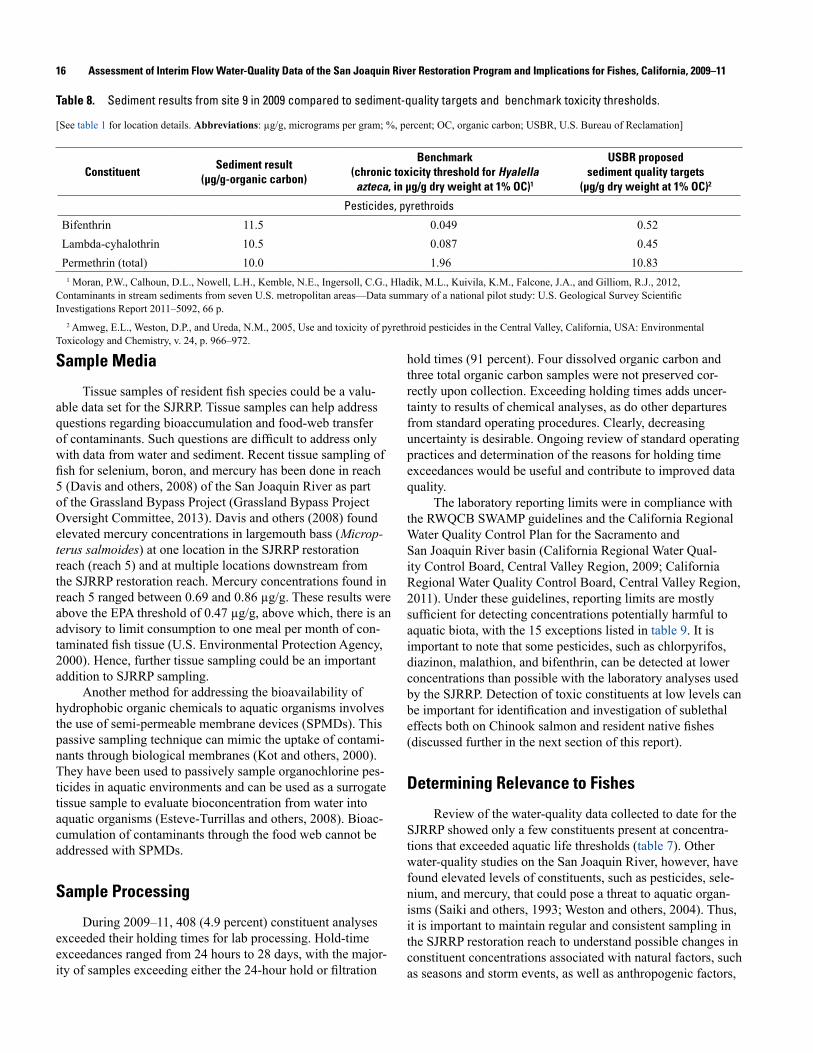
Sediment QualityA single sediment sample from sample site 9, San
Joaquin River at San Mateo (table 1), collected on October 1, 2009, had three pyrethroid pesticide detections. Bifenthrin (23 micrograms per kilogram; µg/kg), lambda-cyhalothrin (21 µg/kg), and total permethrin (20 µg/kg) were detected at concentrations above reporting limits (table 6). These pesticide results were normalized to 1 percent organic carbon in sedi-ment to compare them with published benchmarks following procedures outlined in DiToro and others (1991). Organic carbon for this sediment sample was below the reporting limit
Results and Discussion 9
Table 4. Date and location of water-quality and sediment samples collected for the San Joaquin River Restoration Project (SJRRP) during 2009–11.
[Site number, see table 1 for full names. Abbreviations: —, no samples; s, sediment sample; wq, water-quality sample]
Date/Site 1 2 3 4 5 6 7 8 9 10 11 12 13 14 15
2009
September wq wq/s — wq/s wq — — wq — — wq — wq wq wqOctober wq wq — wq wq/s — s — — — wq/s — wq wq wqNovember — wq wq wq wq wq — — — — wq — wq wq wqDecember — s — s s — — s s s s — — — —
2010
January — — — — — — — — — — — — — — —February — — — — — — — — — — — — — wq wqMarch — — — — — — — — — — — — — wq —April — s — s wq — — s — — s — s wq sMay — — — — — — — — — — — — — — —June — — — — wq — — — — — — — — — —July — — — — wq — — — — — — — — — —August — — — — wq — — — — — — — — — —September — — — — wq — — — — — — — wq — —October — — wq wq — — — wq — — — — wq — —November — — — — — — — — — — — — — — —December — — — wq — — — — — — — — — — —
2011
January — — — — — — — — — — — — — — —February — — — wq — — — — — — — — — — —March — wq — wq — — — — — — — — — — —April wq wq — wq — wq — wq — — — — — — —May — wq — — — — — — — — — — — — —June — wq — — — — — — — — — — — — —July — wq — — — — — — — — — — — — —August — wq — — — — — — — — — — — — —September — wq — — — — — — — — wq — — — —October — — — — — — — — — — wq — — — —November — — — — — — — — — — wq wq — — —December — — — — — — — — — — — — — — —
10 Assessment of Interim Flow Water-Quality Data of the San Joaquin River Restoration Program and Implications for Fishes, California, 2009–11
Table 5. Summary of water-quality constituents above laboratory reporting limits, 2009–11.
[Abbreviations: <, less than; µg/L, micrograms per liter; mg/L, milligrams per liter; MPN/100 mL, most probable number per 100 milliliters; ng/L, nanograms per liter]
ConstituentNumber of total
samples
Number of samples above laboratory reporting limits
Detection frequency
Minimim result
Maximum result
Reporting limit
Units
General water qualityAlkalinity 139 139 1.00 7.0 200.0 5.0 mg/LBicarbonate alkalinity 156 156 1.00 8.0 200.0 5.0 mg/LCarbonate alkalinity 156 156 1.00 7.0 7.0 5.0 mg/L
MetalsArsenic 154 154 1.00 <0.5 6.2 0.5–1.3 µg/LBoron 121 105 0.87 10.0 950.0 10.0 µg/LChromium 154 86 0.56 <0.5 5.3 0.5 µg/L
Copper* 154 152 0.99 <0.5 7.0 0.5 µg/L
Lead* 154 69 0.45 <0.5 56.0 0.5 µg/L
Magnesium 154 78 0.51 <1.0 40.0 1.0, 5.0 mg/LMercury 151 9 0.06 2.2 17.0 200, 100, 2.0 ng/LMolybdenum 121 121 1.00 0.6 9.2 0.5 µg/LNickel 154 71 0.46 <1.0 16.0 1.0 µg/LSelenium 115 42 0.37 <0.4 2.3 0.8, 0.4 µg/LZinc 154 128 0.83 <2.0 17.0 2.0 µg/L
Trace elements, anionsChloride (dissolved) 155 141 0.91 1.0 250.0 0.4–2.0 mg/LSulfate (dissolved) 122 114 0.93 0.7 240.0 0.4–2.0 mg/L
Trace elements, cationsCalcium 154 150 0.97 2.0 68.0 1.0, 5.0 mg/LPotassium 154 89 0.58 <1.0 9.2 1.0, 5.0 mg/LSodium 154 150 0.97 <1.0 210.0 1.0, 5.0, 10 mg/L
BiologicalChlorophyll A 148 74 0.50 <2.0 62.0 2.0–6.0 µg/LEscherichia coli (E. coli) 132 131 0.99 2.0 500.0 1.0, 2.0 MPN/100 mLFecal coliform 128 127 0.99 <2.0 900.0 2.0 MPN/100 mLTotal coliform 147 147 1.00 13.0 2,400.0 1.0, 2.0 MPN/100 mLDisolved organic carbon (DOC) 148 148 1.00 1.8 8.0 0.3 mg/L
Total organic carbon (TOC)* 154 154 1.00 1.8 8.8 0.3 mg/L
Total suspended sediment (TSS) 163 109 0.67 1.1 85.0 1.0–43 mg/LPesticides
Dacthal 19 2 0.11 0.013 0.014 0.002 µg/LDiuron 3 1 0.33 0.024 0.024 0.005 µg/LHCH-alpha 45 3 0.07 0.002 0.004 0.011, 0.010, 0.002 µg/L
NutrientsAmmonia as N 151 75 0.50 0.1 3.5 0.5, 0.05 mg/LNitrate + nitrite as N 48 31 0.65 0.055 1.400 0.050 mg/LNitrate as N 101 53 0.52 <0.05 2.70 0.05 mg/LNitrite as N 101 11 0.11 <0.03 0.05 0.03 mg/LNitrogen, total Kjeldhal (TKN) 150 83 0.55 <0.2 1.6 0.5, 0.2 mg/LPhosphorus, total as P 150 72 0.48 <0.05 0.39 0.05 mg/L*Result of concern.
Results and Discussion 11
Table 6. Summary of sediment sample constituents above laboratory reporting limits, 2009–11.
[Abbreviations: µg/g, microgram per gram; μg/kg, micrograms per kilogram; %, percent; mg, milligram; mg/kg, milligram per kilogram]
ConstituentNumber of total
samples
Number of samples above laboratory reporting limits
Detection frequency
Minimim result
Maximum result
Reporting limit
Units
Trace elements, total
Arsenic 19 14 0.74 0.86 4.7 0.5–1.8 mg/kgChromium 19 19 1.00 1.2 29 0.5–1.8 mg/kgCopper 19 19 1.00 1.2 23 0.5–1.8 µg/gLead 19 16 0.84 0.98 53 0.5–1.8 mg/kgMercury 19 2 0.11 0.046 0.047 0.018 µg/gNickel 19 19 1.00 1.3 34 1.0–1.8 µg/gZinc 19 19 1.00 5.5 62 1.5–2.7 µg/g
Pesticides, pyrethroids
Bifenthrin* 19 1 0.05 23 23 0.0012–21.0 µg/kgLambda-Cyhalothrin* 16 1 0.06 21 21 0.0023–22.0 µg/kgPermethrin (total)* 12 1 0.08 20 20 13–21 µg/kg
Other
Sediment toxicity-H. azteca (10 day % survival) 12 12 1.00 79 98 0 %Sediment toxicity-H. azteca (10 day dry weight) 12 12 1.00 0.06 0.14 0 mgTotal organic carbon 15 8 0.53 680 15,000 100–3,400 µg/g
*Result of concern.
12 Assessment of Interim Flow Water-Quality Data of the San Joaquin River Restoration Program and Implications for Fishes, California, 2009–11
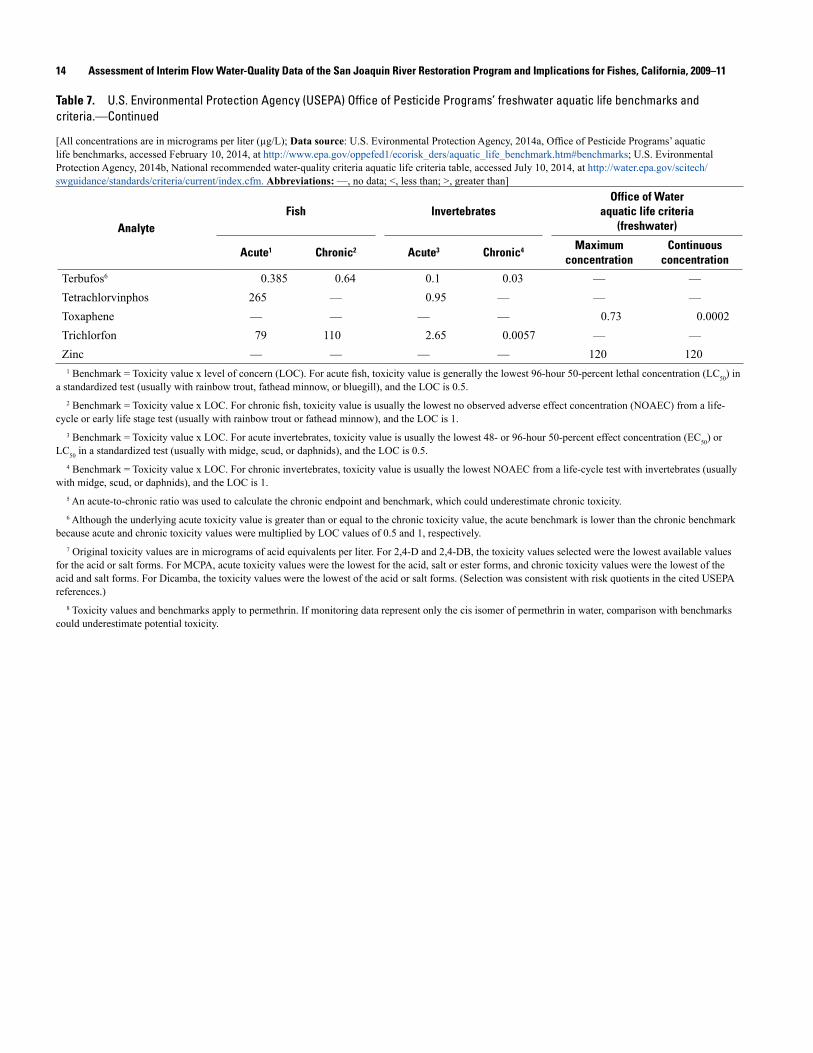
Table 7. U.S. Environmental Protection Agency (USEPA) Office of Pesticide Programs’ freshwater aquatic life benchmarks and criteria.
[All concentrations are in micrograms per liter (µg/L); Data source: U.S. Evironmental Protection Agency, 2014a, Office of Pesticide Programs’ aquatic life benchmarks, accessed February 10, 2014, at http://www.epa.gov/oppefed1/ecorisk_ders/aquatic_life_benchmark.htm#benchmarks; U.S. Evironmental Protection Agency, 2014b, National recommended water-quality criteria aquatic life criteria table, accessed July 10, 2014, at http://water.epa.gov/scitech/swguidance/standards/criteria/current/index.cfm. Abbreviations: —, no data; <, less than; >, greater than]
Office of Water Fish Invertebrates aquatic life criteria
Analyte
2,4-D acids and salts7
Acute1
12,075
Chronic2
14,200
Acute3 Chronic4
12,500 16,050
(freshwater)
Maximum Continuousconcentration concentration
— —2,4-D esters 130 79.2 1,100 200 — —2,4-DB7 1,000 — 7,500 — — —4,4’-DDT — — — — 1.1 0.001Acifluorfen sodium 8,500 <1,500 14,050 — — —Aldicarb sulfone 21,000 — 140 — — —Aldicarb sulfoxide 3,570 — 21.5 — — —Aldicarb5 26 0.46 10 1 — —Aldrin — — — — 3.0 —Arsenic — — — — 340 150Azinphos methyl5 0.18 0.055 0.08 0.036 — —Bentazon >50,000 — >50,000 — — —Bifenthrin 0.075 0.04 0.8 0.0013 — —Captan6 13.1 16.5 4,200 560 — —Carbaryl — — — — 2.1 —Carbaryl5 110 6 0.85 0.5 — —Carbofuran 44 5.7 1.115 0.75 — —Chlordane — — — — 2.4 0.0043Chloride — — — — 860,000 230,000Chlorpyrifos 0.9 0.57 0.05 0.04 0.083 0.041Chlorpyrifos-methyl 7 — 0.085 — — —Chromium (III) — — — — 570 57Chromium (VI) — — — — 16 11Copper 15.7 9.01 2.05 1.11 — —Coumafos6 140 11.7 0.037 0.037 — —Cyfluthrin 0.034 0.01 0.0125 0.0074 — —Cypermethrin 0.195 0.14 0.21 0.069 — —Dacthal (DCPA) 15,000 — 13,500 — — —Deltamethrin 0.29 0.017 0.055 0.0041 — —Demeton — — — — — 0.1Diazinon6 45 <0.55 0.105 0.17 0.17 0.17Dicamba acid7 14,000 — >50,000 — — —Dicamba, dimethylamine salt 488,500 — 781,500 — — —Dicamba, sodium salt 253,600 — 17,300 — — —Dichlorvos (DDVP) 91.5 5.2 0.035 0.0058 — —Dicrotophos 3,150 — 6.35 0.99 — —Dieldrin — — — — 0.24 0.056

Results and Discussion 13
Table 7. U.S. Environmental Protection Agency (USEPA) Office of Pesticide Programs’ freshwater aquatic life benchmarks and criteria.—Continued
[All concentrations are in micrograms per liter (µg/L); Data source: U.S. Evironmental Protection Agency, 2014a, Office of Pesticide Programs’ aquatic life benchmarks, accessed February 10, 2014, at http://www.epa.gov/oppefed1/ecorisk_ders/aquatic_life_benchmark.htm#benchmarks; U.S. Evironmental Protection Agency, 2014b, National recommended water-quality criteria aquatic life criteria table, accessed July 10, 2014, at http://water.epa.gov/scitech/swguidance/standards/criteria/current/index.cfm. Abbreviations: —, no data; <, less than; >, greater than]
AnalyteFish Invertebrates
Office of Water aquatic life criteria
(freshwater)
Acute1 Chronic2 Acute3 Chronic4 Maximumconcentration
Continuousconcentration
Dimethoate5 3,100 430 21.5 0.5 — —Disulfoton5 19.5 4 1.95 0.01 — —Diuron6 200 26.4 80 200 — 0.056Endosulfan 0.05 0.11 0.3 0.01 0.22 —Endosulfan sulfate 1.9 — 150 — — —Endrin — — — — 0.086 0.036Esfenvalerate5 0.035 0.035 0.025 0.017 — —Ethoprop 150 24 22 0.8 — —Fenitrothion 860 46 1.15 0.087 — —Fenpropathrin 1.1 0.091 0.265 0.064 — —Fenthion 415 7.5 2.6 0.013 — —Gamma-BHC (Lindane) — — — — 0.95 —Glyphosate6 21,500 1,800 26,600 49,900 — —Heptachlor — — — — 0.52 0.0038Heptachlor epoxide — — — — 0.52 0.0038Lambda-cyhalothrin 0.105 0.031 0.0035 0.002 — —Lead — — — — 65 2.5Linuron5 1,500 5.58 60 0.09 — —Malathion 16.5 8.6 0.295 0.035 — 0.1Mercury — — — — 1.4 0.77Methidathion6 1.1 6.3 1.5 0.66 — —Methiocarb 218 50 3.5 0.1 — —Methomyl5 160 12 2.5 0.7 — —Methoxychlor 7.5 — 0.7 — — 0.03Mirex — — — — — 0.001Naled 46 2.9 0.07 0.045 — —Nickel — — — — 470 52Oxadiazon 440 0.88 1,090 30 — —Oxamyl6 2,100 770 90 27 — —Parathion — — — — 0.0651 0.013Permethrin8 0.395 0.0515 0.0106 0.0014 — —Phorate 1.175 0.34 0.3 0.21 — —Phosmet 35 3.2 1 0.8 — —Picloram acid 2,750 — 17,200 — — —Picloram potassium salt 6,500 550 34,150 11,800 — —Picloram TIPA salt 187,500 — — — — —Selenium — — — — — 5
14 Assessment of Interim Flow Water-Quality Data of the San Joaquin River Restoration Program and Implications for Fishes, California, 2009–11
Table 7. U.S. Environmental Protection Agency (USEPA) Office of Pesticide Programs’ freshwater aquatic life benchmarks and criteria.—Continued
[All concentrations are in micrograms per liter (µg/L); Data source: U.S. Evironmental Protection Agency, 2014a, Office of Pesticide Programs’ aquatic life benchmarks, accessed February 10, 2014, at http://www.epa.gov/oppefed1/ecorisk_ders/aquatic_life_benchmark.htm#benchmarks; U.S. Evironmental Protection Agency, 2014b, National recommended water-quality criteria aquatic life criteria table, accessed July 10, 2014, at http://water.epa.gov/scitech/swguidance/standards/criteria/current/index.cfm. Abbreviations: —, no data; <, less than; >, greater than]
AnalyteFish Invertebrates
Office of Water aquatic life criteria
(freshwater)
Acute1 Chronic2 Acute3 Chronic4 Maximumconcentration
Continuousconcentration
Terbufos6 0.385 0.64 0.1 0.03 — —Tetrachlorvinphos 265 — 0.95 — — —Toxaphene — — — — 0.73 0.0002Trichlorfon 79 110 2.65 0.0057 — —Zinc — — — — 120 120
1 Benchmark = Toxicity value x level of concern (LOC). For acute fish, toxicity value is generally the lowest 96-hour 50-percent lethal concentration (LC50) in a standardized test (usually with rainbow trout, fathead minnow, or bluegill), and the LOC is 0.5.
2 Benchmark = Toxicity value x LOC. For chronic fish, toxicity value is usually the lowest no observed adverse effect concentration (NOAEC) from a life-cycle or early life stage test (usually with rainbow trout or fathead minnow), and the LOC is 1.
3 Benchmark = Toxicity value x LOC. For acute invertebrates, toxicity value is usually the lowest 48- or 96-hour 50-percent effect concentration (EC50) or LC50 in a standardized test (usually with midge, scud, or daphnids), and the LOC is 0.5.
4 Benchmark = Toxicity value x LOC. For chronic invertebrates, toxicity value is usually the lowest NOAEC from a life-cycle test with invertebrates (usually with midge, scud, or daphnids), and the LOC is 1.
5 An acute-to-chronic ratio was used to calculate the chronic endpoint and benchmark, which could underestimate chronic toxicity.6 Although the underlying acute toxicity value is greater than or equal to the chronic toxicity value, the acute benchmark is lower than the chronic benchmark
because acute and chronic toxicity values were multiplied by LOC values of 0.5 and 1, respectively.7 Original toxicity values are in micrograms of acid equivalents per liter. For 2,4-D and 2,4-DB, the toxicity values selected were the lowest available values
for the acid or salt forms. For MCPA, acute toxicity values were the lowest for the acid, salt or ester forms, and chronic toxicity values were the lowest of the acid and salt forms. For Dicamba, the toxicity values were the lowest of the acid or salt forms. (Selection was consistent with risk quotients in the cited USEPA references.)
8 Toxicity values and benchmarks apply to permethrin. If monitoring data represent only the cis isomer of permethrin in water, comparison with benchmarks could underestimate potential toxicity.

Results and Discussion 15
of 2000 micrograms per gram (µg/g), or 0.2 percent, which was understandable for a sediment sample that primarily contained sand (98.9 percent). Pesticide results were organic carbon-normalized, assuming 0.2 percent organic carbon. This provided the lowest organic carbon-normalized concentration, given the reporting limit.
Organic carbon-normalized results for bifenthrin and lambda-cyhalothrin were above the Reclamation proposed sediment-quality targets for pyrethroids (written commun., J. Eldredge, U.S. Bureau of Reclamation, May 12, 2014) as well as the chronic toxicity thresholds proposed by Moran and others (2012) for Hyalella azteca at 1 percent organic carbon. Organic carbon-normalized results for total permethrin exceeded chronic toxicity thresholds proposed by Moran and others (2011; table 8). This was the only sediment sample that contained pesticides above the reporting limits and the only sediment sample taken from this location. These results showed that pesticides are present in this reach of the San Joaquin River, and follow up sampling would be benefi-cial to the SJRRP.
A study on the effects of sediment-bound bifenthrin on gizzard shad (Dorosoma cepedianum) found that an 8-day exposure to a bifenthrin concentration of 7.75 µg/kg in sedi-ment induced complete mortality (Drenner and others,1992). Partial mortality and stress behaviors were observed at concentrations between 0.185 and 1.55 µg/kg. The gizzard shad belongs to the same family (Clupeidae) as is the threadfin shad (Dorosoma petenense), a species introduced to California and a member of the ‘deep-bodied’ fish assemblage, which is expected to occupy the valley floor portions of the SJRRP restoration reach (McBain and Trush, 2002). This assemblage also includes the native species Sacramento perch (Archop-lites interruptus), hitch (Lavinia exilicauda), and Sacramento blackfish (Orthodon microlepidotus). The gizzard shad feeds on zooplankton, as do many species found in the San Joa-quin River, such as threadfin shad, Sacramento blackfish, and hitch. In the same study, copepod nauplii (larvae) experienced significant mortality on day four and seven of exposure, when bifenthrin concentrations in sediment ranged between 0.090 and 7.75 µg/kg (Drenner and others, 1992). Copepods are a group of zooplankton that is likely to be food for zooplankton-consuming fishes. Also, the larvae of almost all fishes con-sume zooplankton, including copepods, for at least a short time as they grow. These data indicated that sustained high concentrations of bifenthrin both can have direct effects and indirect effects on fishes through the food web. Although data for native species were not available, high concentrations of bifenthrin in the SJRRP restoration reach could be a concern because of potential direct effects on fish and invertebrates. Reduced production of aquatic invertebrates consumed by fishes could result in decreased growth and poor condition of resident and migratory fishes, including Chinook salmon.
The lambda-cyhalothrin sediment concentration was 21 µg/kg (10.5 µg/g organic carbon-normalized), a sediment-bound concentration harmful to aquatic invertebrates as found in sediment toxicity tests with amphipods (Weston and others, 2004; Amweg and others, 2005). A report by Moran and others
(2012) that derived chronic toxicity thresholds for pyrethroid compounds in stream sediments found the chronic toxicity threshold for Hyalella azteca at 1-percent organic carbon to be 0.087 µg/g. This indicated that, similar to bifenthrin, lambda-cyhalothrin both can have direct and indirect effects on fishes through the food web.
Sampling Frequency
Water quality was generally sampled once a month, and sediment quality was sampled once a year, but not at every site. Continuing a minimum of monthly water sampling is suggested so that a thorough understanding of the effects of interim flows on water quality can be developed. Ideally, a more consistent sampling routine could be established to evaluate pesticide concentrations and presence in the SJRRP restoration reach better (Crawford, 2004). Routine sediment sampling might be considered, with sediment sampling done at the same time each year, ideally, before flow increases from fall releases. The data collected during interim flows can provide a valuable baseline for any water-quality assessment carried out after full implementation of restoration flows.
Storm sampling might be considered to determine if there are pulses of contaminants in the SJRRP restoration reach during storm events. In-stream concentrations of constituents that come primarily from surface runoff, such as pesticides, can increase dramatically during a storm event and could have toxic effects on aquatic organisms. Kratzer (1999) found that concentrations of the pesticide diazinon were highly variable during winter storms, and some storm samples had diazinon concentrations high enough to be acutely toxic to aquatic invertebrates. Thus, it can be important to sample water quality both during base flows and high flows in order to accurately monitor the water quality of the river (Orlando and others, 2003; Weston and others, 2004; Smalling and others, 2005; Hladik and others, 2009 ). Storm sampling is labor intensive and requires careful planning. If such a study is undertaken by the SJRRP, a study design should be developed by appropriate experts.
Sampling Locations
As of 2012, sampling included at least two locations in every reach, except for reaches 3 and 4, where access to the river is restricted. The SJRRP might consider adding water and sediment sampling sites upstream and downstream from the confluence of Bear Creek with the San Joaquin River to deter-mine if Bear Creek contributes any significant concentrations of sampled constituents (fig. 1). Including sampling locations upstream and downstream from Bear Creek would add one sample site both to reaches 4 and 5 resulting in a more even distribution of sample locations in the SJJRP restoration reach. Even distribution of sampling locations can be important for developing an accurate representation of the water quality.
16 Assessment of Interim Flow Water-Quality Data of the San Joaquin River Restoration Program and Implications for Fishes, California, 2009–11
Table 8. Sediment results from site 9 in 2009 compared to sediment-quality targets and benchmark toxicity thresholds.
[See table 1 for location details. Abbreviations: µg/g, micrograms per gram; %, percent; OC, organic carbon; USBR, U.S. Bureau of Reclamation]
ConstituentSediment result
(µg/g-organic carbon)
Benchmark (chronic toxicity threshold for Hyalella azteca, in µg/g dry weight at 1% OC)1
USBR proposed sediment quality targets
(µg/g dry weight at 1% OC)2
Pesticides, pyrethroids
Bifenthrin 11.5 0.049 0.52Lambda-cyhalothrin 10.5 0.087 0.45Permethrin (total) 10.0 1.96 10.83
1 Moran, P.W., Calhoun, D.L., Nowell, L.H., Kemble, N.E., Ingersoll, C.G., Hladik, M.L., Kuivila, K.M., Falcone, J.A., and Gilliom, R.J., 2012, Contaminants in stream sediments from seven U.S. metropolitan areas —Data summary of a national pilot study: U.S. Geological Survey Scientific Investigations Report 2011–5092, 66 p.
2 Amweg, E.L., Weston, D.P., and Ureda, N.M., 2005, Use and toxicity of pyrethroid pesticides in the Central Valley, California, USA: Environmental Toxicology and Chemistry, v. 24, p. 966–972.
Sample Media
Tissue samples of resident fish species could be a valu-able data set for the SJRRP. Tissue samples can help address questions regarding bioaccumulation and food-web transfer of contaminants. Such questions are difficult to address only with data from water and sediment. Recent tissue sampling of fish for selenium, boron, and mercury has been done in reach 5 (Davis and others, 2008) of the San Joaquin River as part of the Grassland Bypass Project (Grassland Bypass Project Oversight Committee, 2013). Davis and others (2008) found elevated mercury concentrations in largemouth bass (Microp-terus salmoides) at one location in the SJRRP restoration reach (reach 5) and at multiple locations downstream from the SJRRP restoration reach. Mercury concentrations found in reach 5 ranged between 0.69 and 0.86 µg/g. These results were above the EPA threshold of 0.47 µg/g, above which, there is an advisory to limit consumption to one meal per month of con-taminated fish tissue (U.S. Environmental Protection Agency, 2000). Hence, further tissue sampling could be an important addition to SJRRP sampling.
Another method for addressing the bioavailability of hydrophobic organic chemicals to aquatic organisms involves the use of semi-permeable membrane devices (SPMDs). This passive sampling technique can mimic the uptake of contami-nants through biological membranes (Kot and others, 2000). They have been used to passively sample organochlorine pes-ticides in aquatic environments and can be used as a surrogate tissue sample to evaluate bioconcentration from water into aquatic organisms (Esteve-Turrillas and others, 2008). Bioac-cumulation of contaminants through the food web cannot be addressed with SPMDs.
Sample Processing
During 2009–11, 408 (4.9 percent) constituent analyses exceeded their holding times for lab processing. Hold-time exceedances ranged from 24 hours to 28 days, with the major-ity of samples exceeding either the 24-hour hold or filtration
hold times (91 percent). Four dissolved organic carbon and three total organic carbon samples were not preserved cor-rectly upon collection. Exceeding holding times adds uncer-tainty to results of chemical analyses, as do other departures from standard operating procedures. Clearly, decreasing uncertainty is desirable. Ongoing review of standard operating practices and determination of the reasons for holding time exceedances would be useful and contribute to improved data quality.
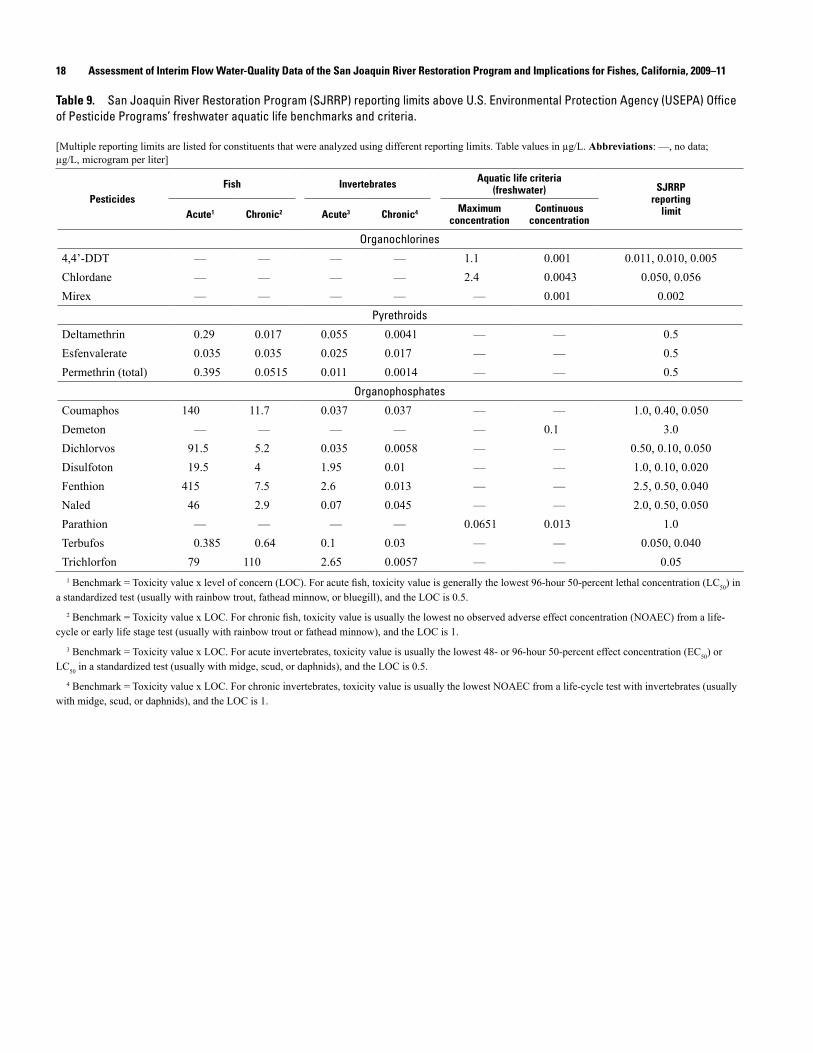
The laboratory reporting limits were in compliance with the RWQCB SWAMP guidelines and the California Regional Water Quality Control Plan for the Sacramento and San Joaquin River basin (California Regional Water Qual-ity Control Board, Central Valley Region, 2009; California Regional Water Quality Control Board, Central Valley Region, 2011). Under these guidelines, reporting limits are mostly sufficient for detecting concentrations potentially harmful to aquatic biota, with the 15 exceptions listed in table 9. It is important to note that some pesticides, such as chlorpyrifos, diazinon, malathion, and bifenthrin, can be detected at lower concentrations than possible with the laboratory analyses used by the SJRRP. Detection of toxic constituents at low levels can be important for identification and investigation of sublethal effects both on Chinook salmon and resident native fishes (discussed further in the next section of this report).
Determining Relevance to Fishes
Review of the water-quality data collected to date for the SJRRP showed only a few constituents present at concentra-tions that exceeded aquatic life thresholds (table 7). Other water-quality studies on the San Joaquin River, however, have found elevated levels of constituents, such as pesticides, sele-nium, and mercury, that could pose a threat to aquatic organ-isms (Saiki and others, 1993; Weston and others, 2004). Thus, it is important to maintain regular and consistent sampling in the SJRRP restoration reach to understand possible changes in constituent concentrations associated with natural factors, such as seasons and storm events, as well as anthropogenic factors,

Results and Discussion 17
such as changes in restoration flows, restoration of floodplains, and changes in agricultural practices. In addition, reporting limits for 15 pesticides are above the EPA OPP aquatic life benchmark and criteria levels (table 9), and therefore, sam-pling results can not accurately reflect all potential effects of these pesticides on aquatic life in the SJRRP restoration reach. Monitoring results should be evaluated on a regular basis in the context of current research on the effects of contami-nants in surface waters on aquatic biota. Such evaluation can guide refinements in the water-quality monitoring program and implementation activities to address issues related to fish restoration better.
The SJRRP is managing for Chinook salmon and other native fishes that are part of the same food web. Unfortunately, there is little published information on aquatic food webs of the rivers in the area. For salmonid populations, in general, there is little information about toxic effects of pesticides on aquatic invertebrates and how such effects move up the food web (Macneale and others, 2010). Research in other systems indicated that applications of pesticides can have a strong negative effect on the food web. Relyea and Diecks (2008) looked at food-web effects of the insecticide malathion on a frog population in an outdoor mesocosm study and found that all levels of application (10–250 µg/L) over short periods (1–4 days) caused a decline in zooplankton, which caused a cascading decline in all other species in the study. They also found that repeated applications of low doses caused a greater negative response than a single application of a high dose. The importance of pesticide exposures in aquatic habitats to different organisms depends on a variety of factors, including pesticide-use patterns, synergetic and antagonistic effects of multiple pesticides, variability in the fate of various pesticides in relation to degradation times, and uptake rates and binding ability of soils (Kuivila and Foe, 1995; Nowell and others, 1999; Oros and Werner, 2005; Laetz and others, 2009 ).
Sublethal effects of pesticides could be of concern for aquatic organisms in the San Joaquin River. Sublethal effects include reductions in growth, swimming behavior, and repro-ductive success in fish and aquatic invertebrates as well as suppressed immune system response, often at much lower than lethal concentrations (Oros and Werner, 2005). Organophos-phates and carbamates are two classes of pesticides that are of particular concern because both affect the nervous system (Fulton and Key, 2001). For example, a 2-hour exposure to the organophosphate insecticide diazinon was found to decrease olfactory-mediated alarm responses in Chinook salmon at concentrations of 1.0 µg/L. A 24-hour exposure to diazinon at concentrations ranging from 0.1 to 10.0 µg/L disrupted the ability of Chinook salmon males to return to their home stream (Scholz and others, 2000). All organophosphate and carbamate insecticides have been shown to inhibit acetylcholinesterase
(AChE), an important chemical for the transmission of nerve impulses in the nervous system and muscles of juvenile steel-head and coho salmon. Reduction of AChE activity has been linked to decreased swimming behavior and prey consumption by juvenile salmon (Sandahl and Jenkins, 2002; Sandahl and others, 2005). The carbamate insecticide carbofuran is thought to have sublethal effects on reproduction in Atlantic salmon (Waring and Moore, 1997). The presence of these and other pesticides are well documented on the San Joaquin River and its tributaries (Orlando and others, 2004; Domagalski and others, 2010); however, pesticide use is complex because new compounds increase in use and previously used compounds decline in use for various reasons. To date, the results from the SJRRP water and sediment sampling show few exceed-ances of aquatic life benchmarks, yet it is possible that aquatic organisms in the river are exposed to concentrations both of pesticides and other potentially harmful constituents that are sufficient to cause sublethal effects.
Data collected to date indicate that water quality is not a major impediment to restoration of Chinook salmon and native fishes in the SJRRP restoration reach. Restoration flows and the final configuration of the restored channel have not yet been decided, however. Continued monitoring of water and sediment quality is advisable as the SJRRP moves forward. This assessment has indicated several possible modifications that can be considered by the SJRRP as water-quality monitor-ing continues:
• Do monthly water-quality sampling throughout the year.
• Do sediment sampling at the same time each year.
• Evaluate the desirability of storm sampling.
• Add sample sites upstream and downstream from the Bear Creek confluence to help determine the effect of Bear Creek inflow to the SJRRP restoration reach.
• Evaluate the desirability of tissue sampling in the entire SJRRP restoration reach.
• Use SPMDs for passive (bioavailable) pesticide sam-pling.
• Review and revise standard operating procedures to minimize exceedances of sample holding times and other sources of uncertainty.
• Expand literature review to determine thresholds for sublethal effects of contaminants detected in the SJRRP.
• Lower reporting limits for pesticides to help determine potential effects on the aquatic food web.
18 Assessment of Interim Flow Water-Quality Data of the San Joaquin River Restoration Program and Implications for Fishes, California, 2009–11
Table 9. San Joaquin River Restoration Program (SJRRP) reporting limits above U.S. Environmental Protection Agency (USEPA) Office of Pesticide Programs’ freshwater aquatic life benchmarks and criteria.
[Multiple reporting limits are listed for constituents that were analyzed using different reporting limits. Table values in µg/L. Abbreviations: —, no data; µg/L, microgram per liter]
PesticidesFish Invertebrates Aquatic life criteria
(freshwater) SJRRP reporting
limitAcute1 Chronic2 Acute3 Chronic4 Maximum concentration
Continuous concentration
Organochlorines
4,4’-DDT — — — — 1.1 0.001 0.011, 0.010, 0.005Chlordane — — — — 2.4 0.0043 0.050, 0.056Mirex — — — — — 0.001 0.002
Pyrethroids
Deltamethrin 0.29 0.017 0.055 0.0041 — — 0.5Esfenvalerate 0.035 0.035 0.025 0.017 — — 0.5Permethrin (total) 0.395 0.0515 0.011 0.0014 — — 0.5
Organophosphates
Coumaphos 140 11.7 0.037 0.037 — — 1.0, 0.40, 0.050Demeton — — — — — 0.1 3.0Dichlorvos 91.5 5.2 0.035 0.0058 — — 0.50, 0.10, 0.050Disulfoton 19.5 4 1.95 0.01 — — 1.0, 0.10, 0.020Fenthion 415 7.5 2.6 0.013 — — 2.5, 0.50, 0.040Naled 46 2.9 0.07 0.045 — — 2.0, 0.50, 0.050Parathion — — — — 0.0651 0.013 1.0Terbufos 0.385 0.64 0.1 0.03 — — 0.050, 0.040Trichlorfon 79 110 2.65 0.0057 — — 0.05
1 Benchmark = Toxicity value x level of concern (LOC). For acute fish, toxicity value is generally the lowest 96-hour 50-percent lethal concentration (LC50) in a standardized test (usually with rainbow trout, fathead minnow, or bluegill), and the LOC is 0.5.
2 Benchmark = Toxicity value x LOC. For chronic fish, toxicity value is usually the lowest no observed adverse effect concentration (NOAEC) from a life-cycle or early life stage test (usually with rainbow trout or fathead minnow), and the LOC is 1.
3 Benchmark = Toxicity value x LOC. For acute invertebrates, toxicity value is usually the lowest 48- or 96-hour 50-percent effect concentration (EC50) or LC50 in a standardized test (usually with midge, scud, or daphnids), and the LOC is 0.5.
4 Benchmark = Toxicity value x LOC. For chronic invertebrates, toxicity value is usually the lowest NOAEC from a life-cycle test with invertebrates (usually with midge, scud, or daphnids), and the LOC is 1.

References Cited 19
References Cited
Amweg, E.L., Weston, D.P., and Ureda, N.M., 2005, Use and toxicity of pyrethroid pesticides in the Central Valley, California, USA: Environmental Toxicology and Chemistry, v. 24, p. 966–972.
Baker, R.J., Knittel, M.D., and Fryer, J.L., 1983, Susceptibility of Chinook salmon, Oncorhynchus tshawytscha (Walbaum), and rainbow trout, Salmo gairdneri Richardson, to infection with Vibrio anguillarum following sublethal copper expo-sure: Journal of Fish Diseases, v. 3, p. 267–275.
Baldwin, D.H., Sandahl, J.F., Labenia, J.S., and Scholz, N.L., 2003, Sublethal effects of copper on coho salmon: impacts on non-overlapping receptor pathways in the peripheral olfactory nervous system: Environmental Toxicology and Chemistry, v. 22, p. 2266–2274.
California Regional Water Quality Control Board, Central Valley Region, 2009, Surface Water Ambient Monitoring Program San Joaquin River Basin: Main Stem and Drainage Basin Sites, October 2000–September 2005, appendix Q: Water Quality Objectives/Goals and Related Beneficial Use tables, 9 p., http://www.waterboards.ca.gov/rwqcb5/water_issues/swamp/water_quality_reports/sjr_wq_study_00_05/app_q.pdf.
California Regional Water Quality Control Board, Central Val-ley Region, 2011, The Water Quality Control Plan (Basin Plan) for the California Regional Water Quality Control Board: Central Valley Region: Sacramento River and San Joaquin River Basins (4th ed.), 148 p. http://www.water-boards.ca.gov/rwqcb5/water_issues/basin_plans/sacsjr.pdf
Crawford, C.G., 2004, Sampling strategies for estimating acute and chronic exposures of pesticides in streams: Jour-nal of the American Water Resources Association, v. 40, no. 2, p. 485–502.
Davis, J.A., Greenfield, B.K., Ichikawa, G., and Stephenson, M., 2008, Mercury in sport fish from the Sacramento-San Joaquin Delta region, California, USA: Science of The Total Environment, v. 391, p. 66–75.
Di Toro, D.M., Zarba, C.S., Hansen, D.J., Berry, W.J., Swartz, R.C., Cowan, C.E., Pavlou, S.P., Allen, H.E., Thomas, N.A., and Paquin, P.R., 1991, Technical basis for establishing sediment quality criteria for nonionic organic chemicals using equilibrium partitioning: Environmental Toxicology and Chemistry, v. 10, p. 1541–1583.
Domagalski, J.L., Weston, D.P., Zhang, M., and Hladik, M., 2010, Pyrethroid insecticide concentrations and toxicity in streambed sediments and loads in surface waters of the San Joaquin Valley, California, USA: Environmental Toxicology and Chemistry, v. 29, p. 813–823.
Drenner, R.W., Hoagland, K.D., Smith, J.D., Barcellona, W.J., Johnson, P.C., Palmeiri, M.A., and Hobson, J.F., 1992, Effects of sediment bound bifenthrin on gizzard shad and plankton in experimental tank mesocosms: Environmental Toxicology and Chemistry, v. 12, p. 1297–1306.
Esteve-Turrillas, F.A., Yusà, V., Pastor, A., de la Guardia, M., 2008, New perspectives in the use of semipermeable membrane devices as passive samplers: Talanta, v. 74, p. 443–457.
Fulton, M.H., and Key, P.B., 2001, Acetylcholinesterase inhibition in estuarine fish and invertebrates as an indicator of organophosphorus insecticide exposure and effects: Envi-ronmental Toxicology and Chemistry, v. 20, p. 37–45.
Giddings, J.M., Hall, L.W., and Solomon, K.R., 2000, Eco-logical risks of diazinon from agricultural use in the Sacra-mento–San Joaquin River Basins, California: Risk Analysis, v. 20, p. 545–572.
Grassland Bypass Project Oversight Committee (GBPOC), 2013, Grassland Bypass Project Annual Report 2010–2011, Contribution No. 697: Richmond, Calif., San Francisco Estuary Institute , 312 p. http://www.sfei.org/sites/default/files/GBP10-11%20FINAL%20web-web.pdf
Hladik, M.L., Domagalski, J.L., and Kuivila, K.M., 2009, Concentrations and loads of suspended sediment-associated pesticides in the San Joaquin River, California, and tributar-ies during storm events: Science of the Total Environment, v. 408, p. 356–364.
Kiffney, P.M., and Scholz, N.L., 2010, Pesticides, aquatic food webs, and the conservation of Pacific salmon: Frontiers in Ecology and the Environment, v. 8, p. 475–482.
Kot, A., Zabiegala, B., and Namiesnik, J., 2000, Passive sampling for long-term monitoring of organic pollutants in water: Trends in Analytical Chemistry, v. 19, p. 446–459.
Kratzer, C.R., 1999, Transport of diazinon in the San Joaquin River basin, California: Journal of the American Water Resources Association, v. 35, p. 379–395.
Kuivila, K.M., and Foe, C.G., 1995, Concentrations, transport and biological effects of dormant spray pesticides in the San Francisco Estuary, California: Environmental Toxicology and Chemistry, v. 14, p. 1141–1150.
Laetz, C.A., Baldwin, D.H., Collier, T.K., Hebert, V., Stark, J.D., and Scholz, N.L., 2009, The synergistic toxicity of pesticide mixtures: implications for risk assessment and the conservation of endangered Pacific salmon: Environmental Health Perspectives, v. 3, p. 348–353.Macneale, K.H.,
Lorz, H., and McPherson, B., 1977, Effects of Copper and Zinc on Smoltification of Coho Salmon. Corvallis, Ore. : Springfield, Va.: Environmental Protection Agency, Office of Research and Development, Corvallis Environmental Research Laboratory.
20 Assessment of Interim Flow Water-Quality Data of the San Joaquin River Restoration Program and Implications for Fishes, California, 2009–11
McBain and Trush, Inc.,eds., 2002, San Joaquin River Res-toration Study Backgroud Report, Chap. 7, 109 p., http://www.waterboards.ca.gov/waterrights/water_issues/pro-grams/bay_delta/bay_delta_plan/water_quality_control_planning/docs/sjrf_spprtinfo/mcbainandtrush_2002.pdf
Moran, P.W., Calhoun, D.L., Nowell, L.H., Kemble, N.E., Ingersoll, C.G., Hladik, M.L., Kuivila, K.M., Falcone, J.A., and Gilliom, R.J., 2012, Contaminants in stream sediments from seven U.S. metropolitan areas—Data summary of a National Pilot Study: U.S. Geological Survey Scientific Investigations Report 2011–5092, 66 p.
Nowell, L.H., Capel, P.D., and Dileanis, P.D., 2009, Pesticides in Stream Sediment and Aquatic Biota—Distribution,Trends, and Governing Factors: Boca Raton, Fla., CRC Press, Pesticides in the Hydrologic System series, v. 4, 1040 p.
Orlando, J.L., Jacobson, L.A., and Kuivila, K.M., 2004, Dissolved pesticide and organic carbon concentrations detected in surface waters, northern Central Valley, Cali-fornia, 2001–02: U.S. Geological Survey Open-File Report 2004–1214, 32 p.
Orlando, J.L., Kuivila, K.M. and Whitehead, A., 2003, Dis-solved pesticide concentrations detected in storm-water runoff at selected sites in the San Joaquin River Basin, Cali-fornia, 2000–01: U.S. Geological Survey Open File Report 2003–101, 16 p.
Oros, D.R. and Werner, I., 2005, Pyrethroid Insecticides: An Analysis of Use Patterns, Distributions, Potential Toxicity and Fate in the Sacramento–San Joaquin Delta and Central Valley: White Paper for the Interagency Ecological Pro-gram, SFEI Contribution 415: Oakland, California, San Francisco Estuary Institute, 113 p.
Relyea, R.A., and Diecks, N., 2008, An unforeseen chain of events: lethal effects of pesticides on frogs at sublethal con-centrations: Ecological Applications, v. 18, p. 1728–1742.
Saiki, M.K., Jenning, M.R., Brumbaugh, W.G., 1993, Boron, molybdenum, and selenium in aquatic food chains from the lower San Joaquin river and its tributaries, California: Archives of Environmental Contamination and Toxicology, v. 24, p 307–319.
Sandahl, J.F., and Jenkins, J.J., 2002, Pacific steelhead (Oncorhynchus mykiss) exposed to chlorpyrifos: benchmark concentration estimates for acetylcholinesterase inhibi-tion: Environmental Toxicology and Chemistry, v. 21, p. 2452–2458.
Sandahl, J.F., Baldwin, D.H., Jenkins, J.J., and Scholz, N.L., 2005, Comparative thresholds for acetylcholinesterase inhi-bition and behavioral impairment in coho salmon exposed to chlorpyrifos: Environmental Toxicology and Chemistry, v. 24, p. 136–145.
San Joaquin River Restoration Program 2010a, 2009–13 Interim Flow Release Program, Water Qual-ity Monitoring Plan, 44 p., http://www.restoresjr.net/download/program-documents/program-docs-2010/20100108SJRRPWQMP2010-2013.pdf
San Joaquin River Restoration Program 2010b, 2010 Annual Technical Report, http://www.restoresjr.net/wp-content/uploads/Program_Docs/20110502_ATR_Main_Body.pdf
San Joaquin River Restoration Program, 2010c, 2010 Annual Technical Report, appendix D, http://www.restoresjr.net/ wp-content/uploads/Program_Docs/20110502_AppD_SWQuality.pdf
Scholz, N.L., Truelove, N.K., French, B.L., Berejikian, B.A., Quinn, T.P., Casillas, E., and Collier, T.K., 2000, Diazinon disrupts antipredator and homing behaviors in Chinook salmon (Oncorhynchus tshawytscha): Canadian Journal of Fisheries and Aquatic Sciences, v. 57, p. 1911–1918.
Smalling, K.L., Orlando, J.L., and Kuivila, K.M., 2005, Analysis of pesticides in surface water and sediment from Yolo Bypass, California, 2004–05: U.S. Geological Survey Scientific Investigations Report 2005–5220, 20 p.
U. S. Bureau of Reclamation, 2013, Mid-Pacific Region Environmental Monitoring Database – Query all program information [interim flow]: U.S. Bureau of Reclamation database, accessed March 11, 2013, at http://www.usbr.gov/mp/mp150/mp157/env_home.cfm.
U. S. Environmental Protection Agency, 2000, Guidance for assessing chemical contaminant data for use in fish adviso-ries, risk assessment and fish consumption limits, 3rd ed., v. 2.: Washington, D.C., U.S. Environmental Protection Agency, document no. EPA-823-B-00-008, http://www.epa.gov/waterscience/fishadvice/volume2/index.html.
U. S. Environmental Protection Agency, 2014a, Office of Pes-ticide Programs’ Aquatic Life Benchmarks, accessed Febru-ary 10, 2014, at http://www.epa.gov/oppefed1/ecorisk_ders/aquatic_life_benchmark.htm#benchmarks.
U. S. Environmental Protection Agency, 2014b, National rec-ommended water quality criteria, aquatic life criteria table, accessed July 10, 2014, at http://water.epa.gov/scitech/swguidance/standards/criteria/current/index.cfm.
Waring, C.P., and Moore, A., 1997, Sublethal effects of a car-bamate pesticide on pheromonal mediated endocrine func-tion in mature male Atlantic salmon (Salmo salar L.) parr: Fish Physiology and Biochemistry, v. 17, p. 203–211.
Weston, D.P., You, J., and Lydy, M.J., 2004, Distribution and toxicity of sediment-associated pesticides in agriculture-dom-inated water bodies of California’s Central Valley: Environ-mental Science and Technology, v. 38, p. 2752–2759.
Appendix A. Water-quality data used in this report 21
Appendix A. Water-quality data used in this report
Appendix A. U.S. Bureau of Reclamation water-quailty data used in this Report. (Provided as a Microsoft Excel™ file)
Files are available at http://pubs.usgs.gov/of/2015/1093/.

22 Assessment of Interim Flow Water-Quality Data of the San Joaquin River Restoration Program and Implications for Fishes, California, 2009–11
Appendix B. Analyte method description for water quality and sediment-sample analysis
[Abbreviations: &, and; %, percent; As, arsenic; B, boron; Ca, calcium; CaCO3, calcium carbonate; Cu, copper; Cr, chromium; EPA, U.S. Environmental Protection Agency; Hg, mercury; HPLC, high performance liquid chromatography; K, potassium; Mg, magnesium; Mo, molybdenum; N, nitrogen; Na, sodium; Ni, nickel; NO2, nitrite; NO3, nitrate; P, phosphorus; Pb, lead; Se, selenium; SM, standard method; Zn, zinc]
Water quality
Method Method title Analyte Reference
EPA 150.1 pH pH http://www.epa.gov/region6/qa/qadevtools/mod5_sops/field_measurements/29palms_field_ph.pdf
EPA 1631E Mercury in water by oxidation, purge and trap, and cold vapor atomic fluorescence spectrometry
Mercury http://water.epa.gov/scitech/methods/cwa/metals/mercury/index.cfm
EPA 200.7 Determination of metals and trace elements in water and wastes by inductively coupled plasma-atomic emission spectrometry
total: B, Ca, K, Mg, Na http://water.epa.gov/scitech/methods/cwa/bioindicators/upload/2007_07_10_methods_method_200_7.pdf
EPA 200.8 Determination of trace elements in water and wastes by inductively coupled plasma-mass spectrometry
total: As, Cu, Cr, Pb, Mo, Ni, Zn
http://water.epa.gov/scitech/methods/cwa/bioindicators/upload/2007_07_10_methods_method_200_8.pdf
EPA 245.1 Determination of mercury in water by cold vapor atomic absorption spectrometry
total Hg http://water.epa.gov/scitech/methods/cwa/bioindicators/upload/2007_07_10_methods_method_245_1.pdf
EPA 300.0 Determination of inorganic anions by ion chromatography
total: Chloride and sulfate http://water.epa.gov/scitech/methods/cwa/bioindicators/upload/2007_07_10_methods_method_300_0.pdf
EPA 310.1 Alkalinity (titrimetric, pH 4.5) Alkalinity, bicarbonate, carbonate
http://www.caslab.com/EPA-Methods/PDF/EPA-Method-3101.pdf
EPA 350.1 Determination of ammonia nitrogen by semi-automated colorimetry
Ammonia as N http://water.epa.gov/scitech/methods/cwa/bioindicators/upload/2007_07_10_methods_method_350_1.pdf
EPA 351.2 Determination of total Kjeldahl nitrogen by semi-automated colorimetry
Total Kjeldahl nitrogen http://water.epa.gov/scitech/methods/cwa/bioindicators/upload/2007_07_10_methods_method_351_2.pdf
EPA 3510 Separatory funnel liquid-liquid extraction Organochlorine, organophosphorus pesticides
http://www.epa.gov/osw/hazard/testmethods/sw846/pdfs/3510c.pdf
EPA 353.2 Determination of nitrate-nitrite by sutomated colorimetry
NO3(N), NO2(N) http://water.epa.gov/scitech/methods/cwa/bioindicators/upload/2007_07_10_methods_method_353_2.pdf
EPA 365.4 Phosphorus, total, colorimetric, automated, block digester, automated analyzer II
Phosphorus, total as P http://water.epa.gov/scitech/methods/cwa/bioindicators/upload/2007_07_10_methods_method_365_4.pdf
EPA 415.1 Total organic carbon in water (combustion or oxidation)
Organic carbon, total organic carbon
http://www.epa.gov/region9/qa/pdfs/415_1dqi.pdf
EPA 515.4 Determination of chlorinated acids in drinking water by liquid-liquid microextraction, derivatization, and fast gas chromatography with electron capture detection
Organochlorines http://www.epa.gov/ogwdw/methods/pdfs/methods/met515_4.pdf
EPA 531.2 Measurement of n-methylcarbamoyloximes and n-methylcarbamates in water by direct aqueous injection HPLC with postcolumn derivatization
Carbamates http://www.epa.gov/ogwdw/methods/pdfs/methods/met531_2.pdf
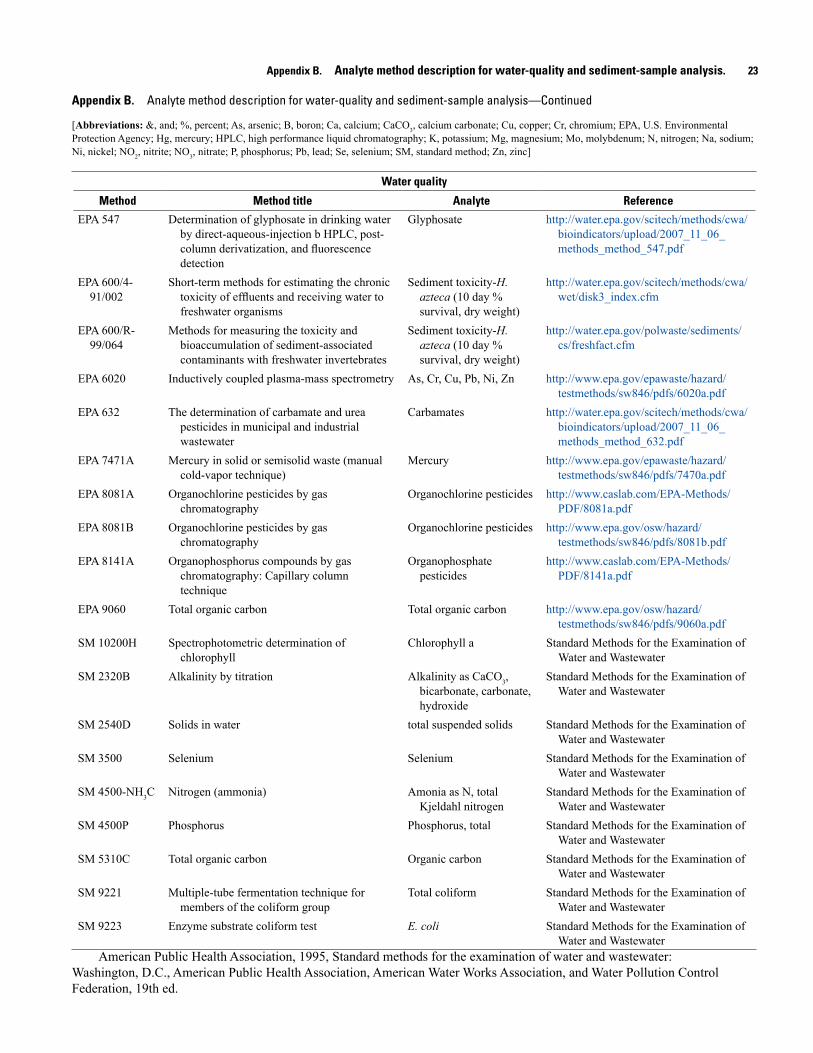
Appendix B. Analyte method description for water-quality and sediment-sample analysis. 23
Appendix B. Analyte method description for water-quality and sediment-sample analysis—Continued
[Abbreviations: &, and; %, percent; As, arsenic; B, boron; Ca, calcium; CaCO3, calcium carbonate; Cu, copper; Cr, chromium; EPA, U.S. Environmental Protection Agency; Hg, mercury; HPLC, high performance liquid chromatography; K, potassium; Mg, magnesium; Mo, molybdenum; N, nitrogen; Na, sodium; Ni, nickel; NO2, nitrite; NO3, nitrate; P, phosphorus; Pb, lead; Se, selenium; SM, standard method; Zn, zinc]
Water quality
Method Method title Analyte Reference
EPA 547 Determination of glyphosate in drinking water by direct-aqueous-injection b HPLC, post-column derivatization, and fluorescence detection
Glyphosate http://water.epa.gov/scitech/methods/cwa/bioindicators/upload/2007_11_06_methods_method_547.pdf
EPA 600/4-91/002
Short-term methods for estimating the chronic toxicity of effluents and receiving water to freshwater organisms
Sediment toxicity-H. azteca (10 day % survival, dry weight)
http://water.epa.gov/scitech/methods/cwa/wet/disk3_index.cfm
EPA 600/R-99/064
Methods for measuring the toxicity and bioaccumulation of sediment-associated contaminants with freshwater invertebrates
Sediment toxicity-H. azteca (10 day % survival, dry weight)
http://water.epa.gov/polwaste/sediments/cs/freshfact.cfm
EPA 6020 Inductively coupled plasma-mass spectrometry As, Cr, Cu, Pb, Ni, Zn http://www.epa.gov/epawaste/hazard/testmethods/sw846/pdfs/6020a.pdf
EPA 632 The determination of carbamate and urea pesticides in municipal and industrial wastewater
Carbamates http://water.epa.gov/scitech/methods/cwa/bioindicators/upload/2007_11_06_methods_method_632.pdf
EPA 7471A Mercury in solid or semisolid waste (manual cold-vapor technique)
Mercury http://www.epa.gov/epawaste/hazard/testmethods/sw846/pdfs/7470a.pdf
EPA 8081A Organochlorine pesticides by gas chromatography
Organochlorine pesticides http://www.caslab.com/EPA-Methods/PDF/8081a.pdf
EPA 8081B Organochlorine pesticides by gas chromatography
Organochlorine pesticides http://www.epa.gov/osw/hazard/testmethods/sw846/pdfs/8081b.pdf
EPA 8141A Organophosphorus compounds by gas chromatography: Capillary column technique
Organophosphate pesticides
http://www.caslab.com/EPA-Methods/PDF/8141a.pdf
EPA 9060 Total organic carbon Total organic carbon http://www.epa.gov/osw/hazard/testmethods/sw846/pdfs/9060a.pdf
SM 10200H Spectrophotometric determination of chlorophyll
Chlorophyll a Standard Methods for the Examination of Water and Wastewater
SM 2320B Alkalinity by titration Alkalinity as CaCO3, bicarbonate, carbonate, hydroxide
Standard Methods for the Examination of Water and Wastewater
SM 2540D Solids in water total suspended solids Standard Methods for the Examination of Water and Wastewater
SM 3500 Selenium Selenium Standard Methods for the Examination of Water and Wastewater
SM 4500-NH3C Nitrogen (ammonia) Amonia as N, total Kjeldahl nitrogen
Standard Methods for the Examination of Water and Wastewater
SM 4500P Phosphorus Phosphorus, total Standard Methods for the Examination of Water and Wastewater
SM 5310C Total organic carbon Organic carbon Standard Methods for the Examination of Water and Wastewater
SM 9221 Multiple-tube fermentation technique for members of the coliform group
Total coliform Standard Methods for the Examination of Water and Wastewater
SM 9223 Enzyme substrate coliform test E. coli Standard Methods for the Examination of Water and Wastewater
American Public Health Association, 1995, Standard methods for the examination of water and wastewater: Washington, D.C., American Public Health Association, American Water Works Association, and Water Pollution Control Federation, 19th ed.
24 Assessment of Interim Flow Water-Quality Data of the San Joaquin River Restoration Program and Implications for Fishes, California, 2009–11
Appendix C. Sediment-quality data used in this report
Appendix C. U.S. Bureau of Reclamation sediment-quailty data used in this Report. (Provided as a Microsoft Excel™ file)
Files are available at http://pubs.usgs.gov/of/2015/1093/.

Appendix C. Sediment-quality data used in this report 25

Prepared by the Sacramento Publishing Service Center.
For more information concerning this report, contact:
DirectorU.S. Geological SurveyCalifornia Water Science Center6000 J Street, Placer HallSacramento, CA [email protected]
or visit our Web site at:http://ca.water.usgs.gov

Wulff and Brow
n—A
ssessment of Interim
Flow W
ater-Quality D
ata of the San Joaquin River Restoration Program and Im
plications for Fishes, California, 2009–11—
Open-File Report 2015–1093
ISSN 2331-1258 (online)http://dx.doi.org/10.3133/OFR20151093