Embed Size (px)
Citation preview
ΦAbstract – Condition monitoring of inverter-fed drives is gaining a more important role. Inverter operation enables maximum utilization of a drive. However, some parasitic phenomena may occur, e.g. bearing currents, temperature increase due to additional losses and stress caused by fast voltage rise times. With focus in this work on stator winding insulation an online monitoring method is presented to detect changes in the insulation strength. The insulation health state is assessed at a thermal aged machine by voltage step excitation of the inverter. A change of the electrical strength is evaluated with the transient current response measured for each phase with the built-in sensors of the inverter. The proposed method is able to detect insulation deterioration before an actual short circuit occurs. The results are compared with the insulation condition parameters resulting from additional off-line low-voltage and high-voltage measurements.
Index Terms—AC machines; Accelerated aging; Fault detection; Insulation testing; Pulse width modulation inverters; Stators;
I. INTRODUCTION
n modern traction drives, ac machines are fed by voltage source inverters (VSI), operating under harsh
environmental conditions. Frequent and heavy load cycles as well as parasitic phenomena due to the inverter-fed operation, e.g. additional losses resulting in a temperature increase or overvoltages caused by high voltage rise dv/dt-rate. The additional stress due to inverter operation results in a reduction of lifetime of the machine. Thus, condition monitoring is required to enable a safe and reliable operation of a drive over decades. This work focuses on monitoring of the stator insulation condition of a 5.5kW random wound induction machine. A fault in the stator winding system is one of the main reasons causing an outage of a machine [1]-[2]. Typically, the winding insulation condition is assessed with nondestructive diagnostic tests, for example insulation resistance, dissipation factor or partial discharge measurements [3]. Often these tests deliver significant information only if a fault has developed and thus cannot be exploited for lifetime estimation. Additionally, some of these tests can only be applied off-line, and require at least partly The work to this investigation was supported by the Austrian Research Promotion Agency (FFG) under project number 83 84 78. C. Zoeller is with the Institute of Energy Systems and Electrical Drives, Vienna University of Technology, 1040 Vienna, Austria (e-mail: [email protected]). M.A. Vogelsberger is with Bombardier Transportation Austria GmbH, Internal Supply Chain (ISC); Drives, 1220, Vienna, Austria (e-mail: [email protected]). Th. M. Wolbank is with the Institute of Energy Systems and Electrical Drives, Vienna University of Technology, 1040 Vienna, Austria (e-mail: [email protected]).
disassembled machine or a short outage/turnaround. The approach in this paper aims to detect imminent insulation degradation on-line, during the operation of the machine. This facilitates predictive maintenance, since the insulation state can be estimated and further actions for repairs can be introduced without taking the machine out of service. The inverter is used to generate a simple voltage step separately for each phase within defined intervals, during startup or shut down of the drive, as this would not affect the control of the machine. With the built-in current transducers the transient current response is recorded and analyzed for the evaluation of the insulation health state. The method is implemented as a comparative method, which means that the results from a known healthy machine state are compared to the actual machine state to detect a change in the insulation state. Due to the fact that no additional signal injection source or sensor equipment is needed and the method can be applied on-line, system reliability can be kept high.
II. MAIN APPROACH OF INSULATION CONDITION
MONITORING
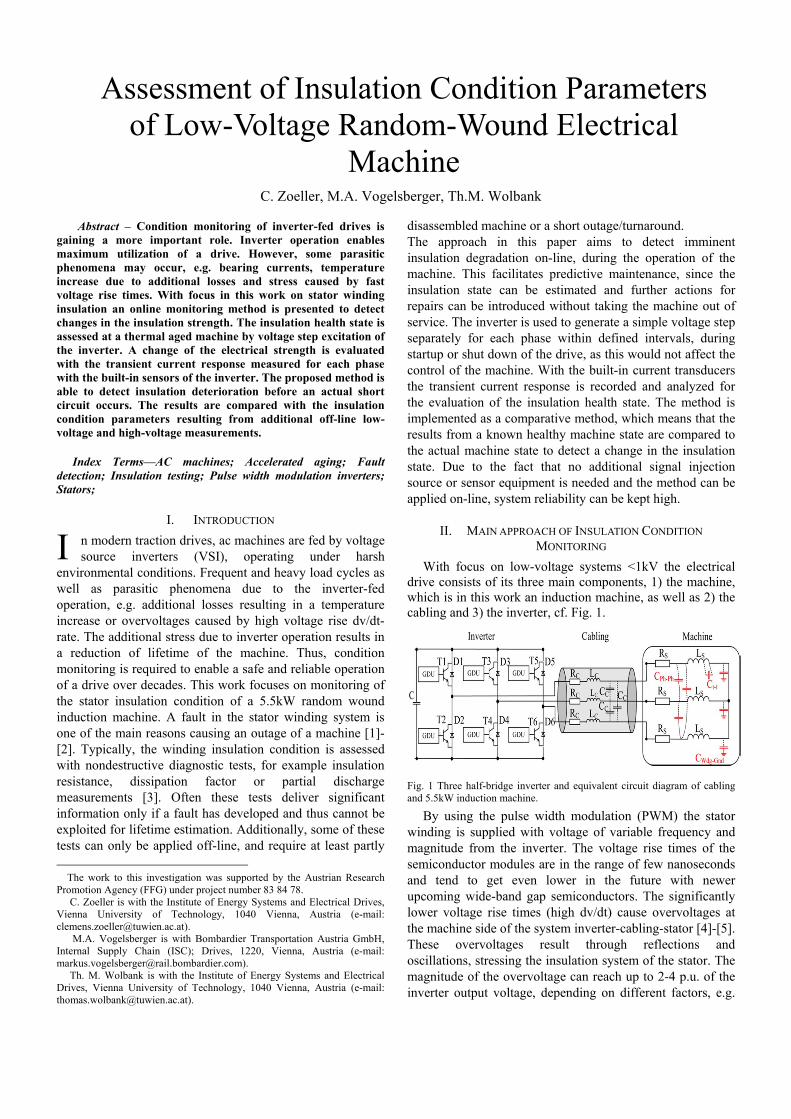
With focus on low-voltage systems <1kV the electrical drive consists of its three main components, 1) the machine, which is in this work an induction machine, as well as 2) the cabling and 3) the inverter, cf. Fig. 1.
Fig. 1 Three half-bridge inverter and equivalent circuit diagram of cabling and 5.5kW induction machine.
By using the pulse width modulation (PWM) the stator winding is supplied with voltage of variable frequency and magnitude from the inverter. The voltage rise times of the semiconductor modules are in the range of few nanoseconds and tend to get even lower in the future with newer upcoming wide-band gap semiconductors. The significantly lower voltage rise times (high dv/dt) cause overvoltages at the machine side of the system inverter-cabling-stator [4]-[5]. These overvoltages result through reflections and oscillations, stressing the insulation system of the stator. The magnitude of the overvoltage can reach up to 2-4 p.u. of the inverter output voltage, depending on different factors, e.g.
Assessment of Insulation Condition Parameters of Low-Voltage Random-Wound Electrical
Machine C. Zoeller, M.A. Vogelsberger, Th.M. Wolbank
I
cable length, voltage rise time, switching transition etc.. The reflection phenomena are also visible in the current
trace after the inverter switching transition. The transient decaying oscillation will be investigated in the later section, since the assessment of the insulation state is based on a change of the transient current oscillation.
The deterioration of the insulation usually is a slowly developing process. As aforementioned in the introduction the condition of the insulation winding system is typically assessed with different industrially well known methods and measurements, which can be separated in off- or on-line methods [6]-[7]. They all have in common that additional signal injection or measurement equipment is needed. Further, the results of these measurements convey little information about the winding condition or only trends collected over a complete life cycle of a machine can give information about the predictability of a method. In [8] investigations with accelerated aging of insulation systems in a stator slot model by applying thermal exposure show, that one of the main parameter that is linked with insulation degradation is the measurable insulation capacitance. The insulation capacitance of the specimen is decreasing after each applied aging cycle. In a final state these values keep constant and saturate until the breakdown of the insulation occurs.
Considering the above presented inverter-cabling-machine system a change of the parasitic insulation capacitances, also change the impedance of the machine and thus the reflection phenomena and transient current response. Additionally in [8], in connection with the capacitance decrease the deviation in the current response after voltage step excitation is visible.
III. ACCELERATED AGING
The purpose of accelerated aging is to speed up a specific failure process by increasing one or more stresses above the normal level. This will result in a much shorter time to failure.
In this work the winding of the test machine was aged only thermally, this allows analyzing the impact only of this kind of stress and delivers insights into changes of the electrical strength. The accelerated aging procedure is established in accordance with the IEEE standard 1107-1996 [9]. By conducting heat exposures in repeated cycles with temperatures above the normal level, deterioration of the insulation materials are evoked. Thermal cycling also occurs in practical operation when a drive rapidly changes load, causing a high current in the winding and resulting in a rapidly changing conductor temperature. The conductors, insulation materials as well as the stator laminations expand and contract with different strengths due to their thermal coefficients of expansion. This gradually fatigue results in cracks within the insulation.
The selected temperature and exposure periods are chosen with the target to reach up an expedient number of cycles until failure of the insulation system is validated (typically aim at 10 cycles). The stator winding system of the test machine (5.5kW induction machine) consists of round
enameled copper wire (diameter 1.58 mm), which is a winding wire according to EN13601 Cu-ETP with insulation consisting of polyesterimide and polyamide-imide as the over coat. The resin is single component, monomer and volatile organic compound (VCO) free, based on specially modified unsaturated polyester. The materials ensure a thermal durability and overload stability and are classified with thermal class 155 according to IEC 60085 (class F). Due to the insulation class F, the duration and aging temperature of a cycle is defined according to standard, see Table 1.
TABLE 1 SUGGESTED TEMPERATURE AND EXPOSURE PERIODS
Class temperature
(F - 155°C) Days/cycle
Std. IEEE 1107-96 220-230 1-2
Furthermore, it should be mentioned what should be understood by the term ‘aging’. The term aging refers to all processes causing irreversible changes in parts of the specimen, which ultimately reduce the electrical strength and finally result in a failure. Not with the term ‘aging’ should be connected reversible changes, in principle, even if those in the individual case lead to failure of the equipment. Such reversible changes, for example, depending on the ambient conditions should not be addressed as ‘aging’. This could be the inclusion of water leading to a local degradation of the insulation material, without irreversible changes.
It has to be considered that statistical variations exist even if identical specimens are analyzed. That means that if a failure of one specimen occurs after specific hours, the next sample may survive significantly longer or shorter. The time to failure also vary widely between different types of stresses, e.g. thermal and mechanical. Statistical methods are the only way to analyze the results and give evidence about the possible lifetime of the insulation system.
However, in this work the target of the accelerated aging process is not a statement about the longevity of the insulation material, but the detection of winding insulation deterioration based on changes in the high frequency behavior of the current response after step excitation.
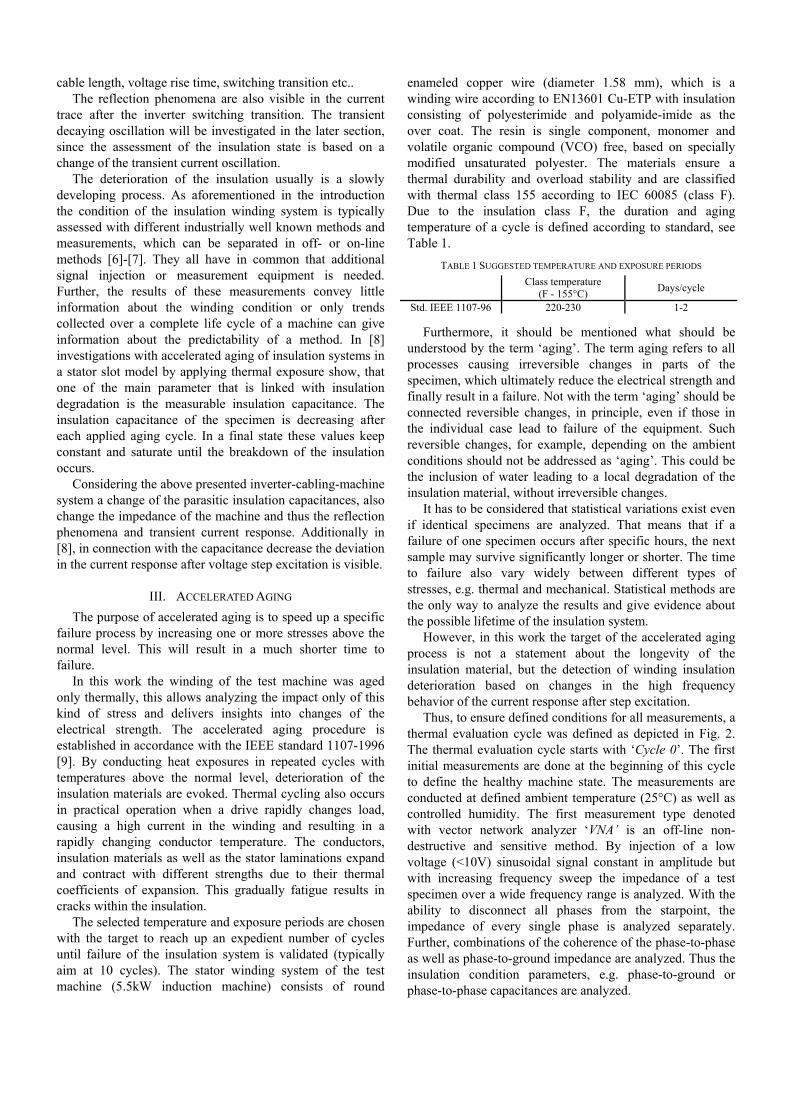
Thus, to ensure defined conditions for all measurements, a thermal evaluation cycle was defined as depicted in Fig. 2. The thermal evaluation cycle starts with ‘Cycle 0’. The first initial measurements are done at the beginning of this cycle to define the healthy machine state. The measurements are conducted at defined ambient temperature (25°C) as well as controlled humidity. The first measurement type denoted with vector network analyzer ‘VNA’ is an off-line non-destructive and sensitive method. By injection of a low voltage (<10V) sinusoidal signal constant in amplitude but with increasing frequency sweep the impedance of a test specimen over a wide frequency range is analyzed. With the ability to disconnect all phases from the starpoint, the impedance of every single phase is analyzed separately. Further, combinations of the coherence of the phase-to-phase as well as phase-to-ground impedance are analyzed. Thus the insulation condition parameters, e.g. phase-to-ground or phase-to-phase capacitances are analyzed.
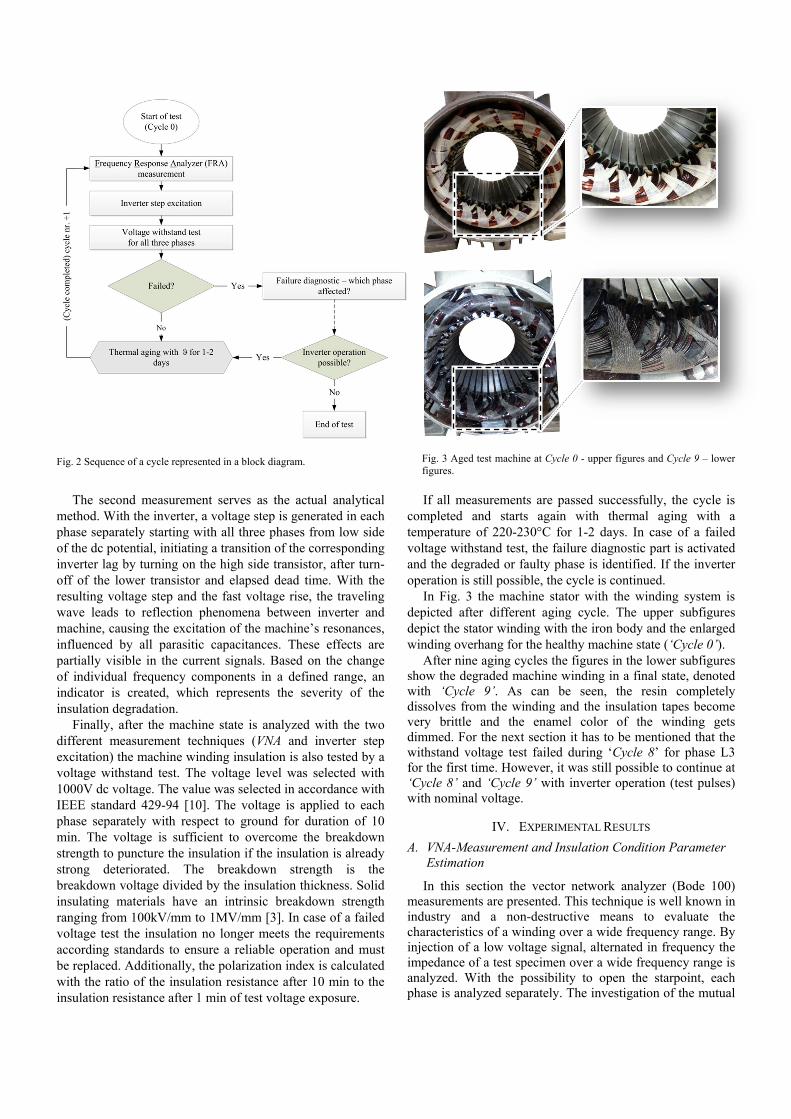
Fig. 2 Sequence of a cycle represented in a block diagram.
Fig. 3 Aged test machine at Cycle 0 - upper figures and Cycle 9 – lower figures.
The second measurement serves as the actual analytical
method. With the inverter, a voltage step is generated in each phase separately starting with all three phases from low side of the dc potential, initiating a transition of the corresponding inverter lag by turning on the high side transistor, after turn-off of the lower transistor and elapsed dead time. With the resulting voltage step and the fast voltage rise, the traveling wave leads to reflection phenomena between inverter and machine, causing the excitation of the machine’s resonances, influenced by all parasitic capacitances. These effects are partially visible in the current signals. Based on the change of individual frequency components in a defined range, an indicator is created, which represents the severity of the insulation degradation.
Finally, after the machine state is analyzed with the two different measurement techniques (VNA and inverter step excitation) the machine winding insulation is also tested by a voltage withstand test. The voltage level was selected with 1000V dc voltage. The value was selected in accordance with IEEE standard 429-94 [10]. The voltage is applied to each phase separately with respect to ground for duration of 10 min. The voltage is sufficient to overcome the breakdown strength to puncture the insulation if the insulation is already strong deteriorated. The breakdown strength is the breakdown voltage divided by the insulation thickness. Solid insulating materials have an intrinsic breakdown strength ranging from 100kV/mm to 1MV/mm [3]. In case of a failed voltage test the insulation no longer meets the requirements according standards to ensure a reliable operation and must be replaced. Additionally, the polarization index is calculated with the ratio of the insulation resistance after 10 min to the insulation resistance after 1 min of test voltage exposure.
If all measurements are passed successfully, the cycle is completed and starts again with thermal aging with a temperature of 220-230°C for 1-2 days. In case of a failed voltage withstand test, the failure diagnostic part is activated and the degraded or faulty phase is identified. If the inverter operation is still possible, the cycle is continued.
In Fig. 3 the machine stator with the winding system is depicted after different aging cycle. The upper subfigures depict the stator winding with the iron body and the enlarged winding overhang for the healthy machine state (‘Cycle 0’).
After nine aging cycles the figures in the lower subfigures show the degraded machine winding in a final state, denoted with ‘Cycle 9’. As can be seen, the resin completely dissolves from the winding and the insulation tapes become very brittle and the enamel color of the winding gets dimmed. For the next section it has to be mentioned that the withstand voltage test failed during ‘Cycle 8’ for phase L3 for the first time. However, it was still possible to continue at ‘Cycle 8’ and ‘Cycle 9’ with inverter operation (test pulses) with nominal voltage.
IV. EXPERIMENTAL RESULTS
A. VNA-Measurement and Insulation Condition Parameter Estimation
In this section the vector network analyzer (Bode 100) measurements are presented. This technique is well known in industry and a non-destructive means to evaluate the characteristics of a winding over a wide frequency range. By injection of a low voltage signal, alternated in frequency the impedance of a test specimen over a wide frequency range is analyzed. With the possibility to open the starpoint, each phase is analyzed separately. The investigation of the mutual
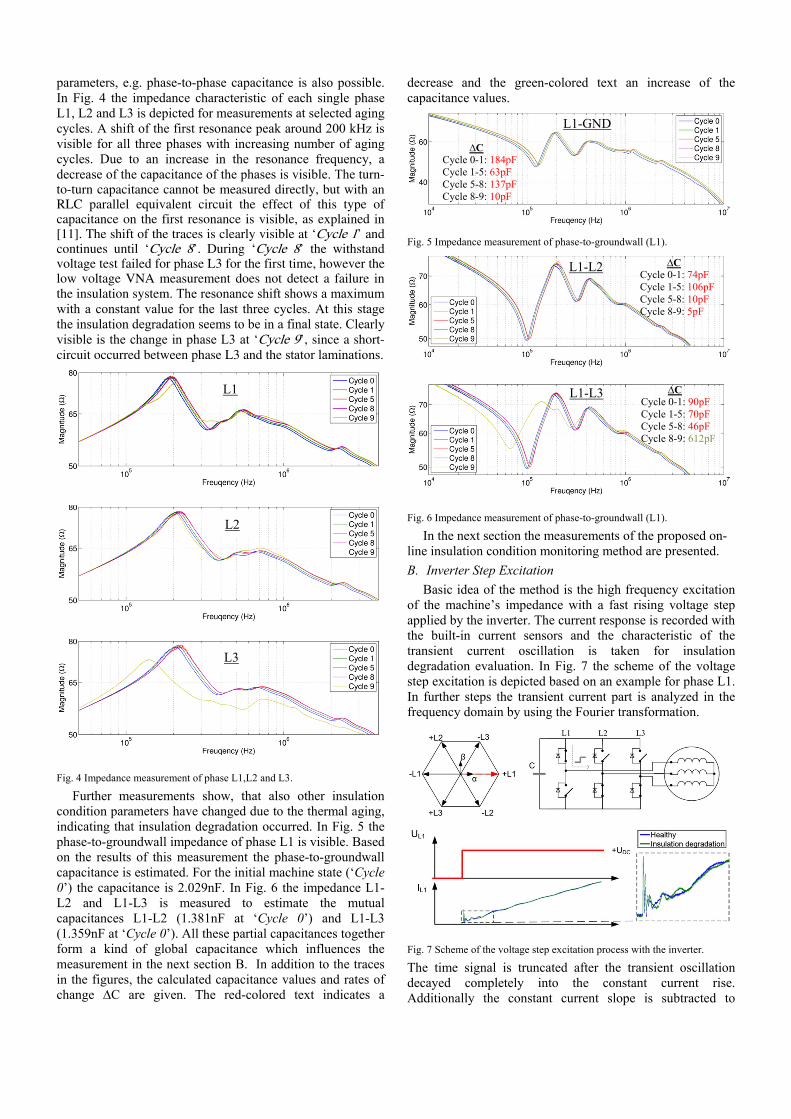
parameters, e.g. phase-to-phase capacitance is also possible. In Fig. 4 the impedance characteristic of each single phase L1, L2 and L3 is depicted for measurements at selected aging cycles. A shift of the first resonance peak around 200 kHz is visible for all three phases with increasing number of aging cycles. Due to an increase in the resonance frequency, a decrease of the capacitance of the phases is visible. The turn-to-turn capacitance cannot be measured directly, but with an RLC parallel equivalent circuit the effect of this type of capacitance on the first resonance is visible, as explained in [11]. The shift of the traces is clearly visible at ‘Cycle 1’ and continues until ‘Cycle 8’. During ‘Cycle 8’ the withstand voltage test failed for phase L3 for the first time, however the low voltage VNA measurement does not detect a failure in the insulation system. The resonance shift shows a maximum with a constant value for the last three cycles. At this stage the insulation degradation seems to be in a final state. Clearly visible is the change in phase L3 at ‘Cycle 9’, since a short-circuit occurred between phase L3 and the stator laminations.
Fig. 4 Impedance measurement of phase L1,L2 and L3.
Further measurements show, that also other insulation condition parameters have changed due to the thermal aging, indicating that insulation degradation occurred. In Fig. 5 the phase-to-groundwall impedance of phase L1 is visible. Based on the results of this measurement the phase-to-groundwall capacitance is estimated. For the initial machine state (‘Cycle 0’) the capacitance is 2.029nF. In Fig. 6 the impedance L1-L2 and L1-L3 is measured to estimate the mutual capacitances L1-L2 (1.381nF at ‘Cycle 0’) and L1-L3 (1.359nF at ‘Cycle 0’). All these partial capacitances together form a kind of global capacitance which influences the measurement in the next section B. In addition to the traces in the figures, the calculated capacitance values and rates of change ∆C are given. The red-colored text indicates a
decrease and the green-colored text an increase of the capacitance values.
Fig. 5 Impedance measurement of phase-to-groundwall (L1).
Fig. 6 Impedance measurement of phase-to-groundwall (L1).
In the next section the measurements of the proposed on-line insulation condition monitoring method are presented.
B. Inverter Step Excitation
Basic idea of the method is the high frequency excitation of the machine’s impedance with a fast rising voltage step applied by the inverter. The current response is recorded with the built-in current sensors and the characteristic of the transient current oscillation is taken for insulation degradation evaluation. In Fig. 7 the scheme of the voltage step excitation is depicted based on an example for phase L1. In further steps the transient current part is analyzed in the frequency domain by using the Fourier transformation.
Fig. 7 Scheme of the voltage step excitation process with the inverter.
The time signal is truncated after the transient oscillation decayed completely into the constant current rise. Additionally the constant current slope is subtracted to
L1
L2
L3
∆C Cycle 0-1: 184pF Cycle 1-5: 63pF Cycle 5-8: 137pF Cycle 8-9: 10pF
∆C Cycle 0-1: 74pF Cycle 1-5: 106pF Cycle 5-8: 10pF Cycle 8-9: 5pF
∆C Cycle 0-1: 90pF Cycle 1-5: 70pF Cycle 5-8: 46pF Cycle 8-9: 612pF
L1-GND
L1-L2
L1-L3
prevent any influences due to inherent asymmetries of the machine, e.g. slotting.
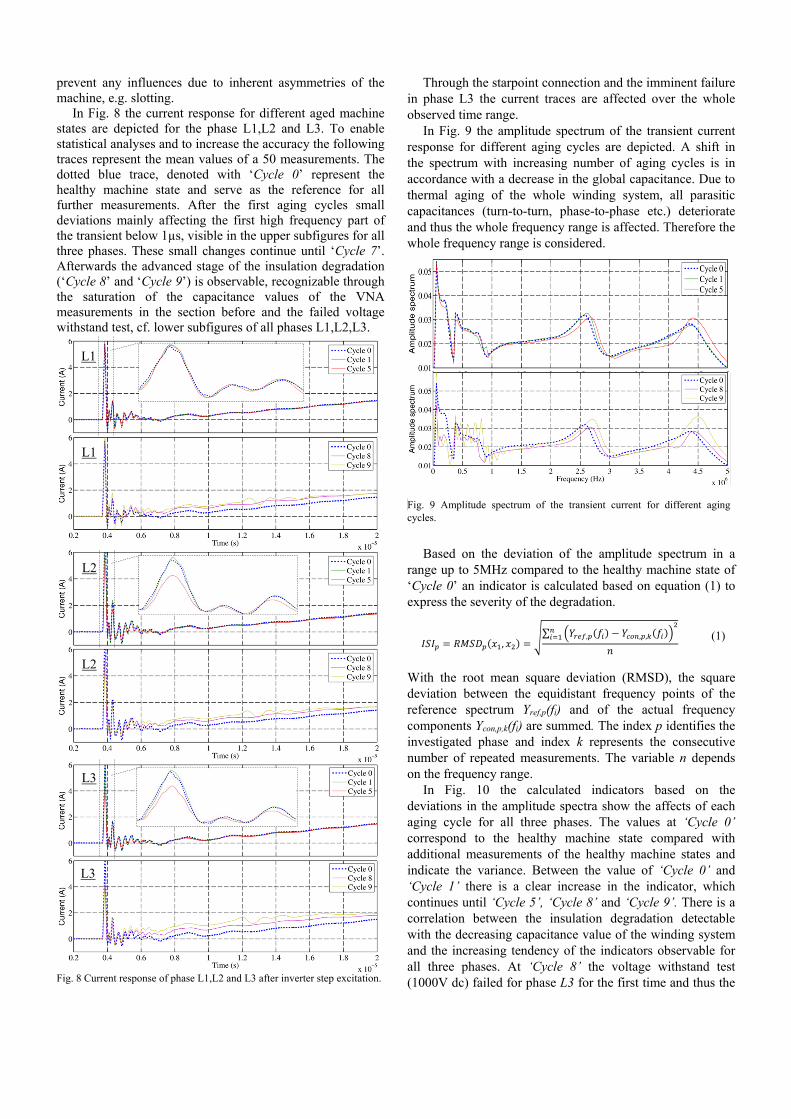
In Fig. 8 the current response for different aged machine states are depicted for the phase L1,L2 and L3. To enable statistical analyses and to increase the accuracy the following traces represent the mean values of a 50 measurements. The dotted blue trace, denoted with ‘Cycle 0’ represent the healthy machine state and serve as the reference for all further measurements. After the first aging cycles small deviations mainly affecting the first high frequency part of the transient below 1µs, visible in the upper subfigures for all three phases. These small changes continue until ‘Cycle 7’. Afterwards the advanced stage of the insulation degradation (‘Cycle 8’ and ‘Cycle 9’) is observable, recognizable through the saturation of the capacitance values of the VNA measurements in the section before and the failed voltage withstand test, cf. lower subfigures of all phases L1,L2,L3.
Fig. 8 Current response of phase L1,L2 and L3 after inverter step excitation.
Through the starpoint connection and the imminent failure in phase L3 the current traces are affected over the whole observed time range.
In Fig. 9 the amplitude spectrum of the transient current response for different aging cycles are depicted. A shift in the spectrum with increasing number of aging cycles is in accordance with a decrease in the global capacitance. Due to thermal aging of the whole winding system, all parasitic capacitances (turn-to-turn, phase-to-phase etc.) deteriorate and thus the whole frequency range is affected. Therefore the whole frequency range is considered.
Fig. 9 Amplitude spectrum of the transient current for different aging cycles.
Based on the deviation of the amplitude spectrum in a range up to 5MHz compared to the healthy machine state of ‘Cycle 0’ an indicator is calculated based on equation (1) to express the severity of the degradation.
, ∑ , , ,
(1)
With the root mean square deviation (RMSD), the square deviation between the equidistant frequency points of the reference spectrum Yref,p(fi) and of the actual frequency components Ycon,p,k(fi) are summed. The index p identifies the investigated phase and index k represents the consecutive number of repeated measurements. The variable n depends on the frequency range.
In Fig. 10 the calculated indicators based on the deviations in the amplitude spectra show the affects of each aging cycle for all three phases. The values at ‘Cycle 0’ correspond to the healthy machine state compared with additional measurements of the healthy machine states and indicate the variance. Between the value of ‘Cycle 0’ and ‘Cycle 1’ there is a clear increase in the indicator, which continues until ‘Cycle 5’, ‘Cycle 8’ and ‘Cycle 9’. There is a correlation between the insulation degradation detectable with the decreasing capacitance value of the winding system and the increasing tendency of the indicators observable for all three phases. At ‘Cycle 8’ the voltage withstand test (1000V dc) failed for phase L3 for the first time and thus the
L1
L1
L2
L2
L3
L3
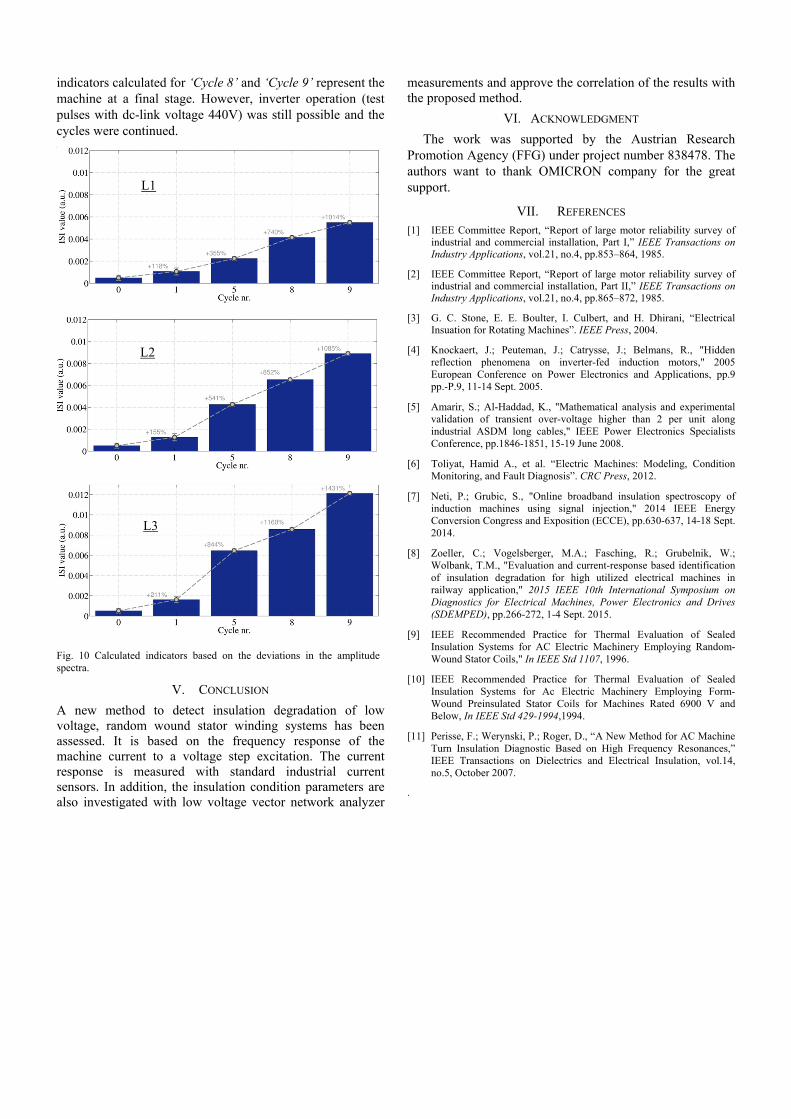
indicators calculated for ‘Cycle 8’ and ‘Cycle 9’ represent the machine at a final stage. However, inverter operation (test pulses with dc-link voltage 440V) was still possible and the cycles were continued.
Fig. 10 Calculated indicators based on the deviations in the amplitude spectra.
V. CONCLUSION
A new method to detect insulation degradation of low voltage, random wound stator winding systems has been assessed. It is based on the frequency response of the machine current to a voltage step excitation. The current response is measured with standard industrial current sensors. In addition, the insulation condition parameters are also investigated with low voltage vector network analyzer
measurements and approve the correlation of the results with the proposed method.
VI. ACKNOWLEDGMENT
The work was supported by the Austrian Research Promotion Agency (FFG) under project number 838478. The authors want to thank OMICRON company for the great support.
VII. REFERENCES [1] IEEE Committee Report, “Report of large motor reliability survey of
industrial and commercial installation, Part I,” IEEE Transactions on Industry Applications, vol.21, no.4, pp.853–864, 1985.
[2] IEEE Committee Report, “Report of large motor reliability survey of industrial and commercial installation, Part II,” IEEE Transactions on Industry Applications, vol.21, no.4, pp.865–872, 1985.
[3] G. C. Stone, E. E. Boulter, I. Culbert, and H. Dhirani, “Electrical Insuation for Rotating Machines”. IEEE Press, 2004.
[4] Knockaert, J.; Peuteman, J.; Catrysse, J.; Belmans, R., "Hidden reflection phenomena on inverter-fed induction motors," 2005 European Conference on Power Electronics and Applications, pp.9 pp.-P.9, 11-14 Sept. 2005.
[5] Amarir, S.; Al-Haddad, K., "Mathematical analysis and experimental validation of transient over-voltage higher than 2 per unit along industrial ASDM long cables," IEEE Power Electronics Specialists Conference, pp.1846-1851, 15-19 June 2008.
[6] Toliyat, Hamid A., et al. “Electric Machines: Modeling, Condition Monitoring, and Fault Diagnosis”. CRC Press, 2012.
[7] Neti, P.; Grubic, S., "Online broadband insulation spectroscopy of induction machines using signal injection," 2014 IEEE Energy Conversion Congress and Exposition (ECCE), pp.630-637, 14-18 Sept. 2014.
[8] Zoeller, C.; Vogelsberger, M.A.; Fasching, R.; Grubelnik, W.; Wolbank, T.M., "Evaluation and current-response based identification of insulation degradation for high utilized electrical machines in railway application," 2015 IEEE 10th International Symposium on Diagnostics for Electrical Machines, Power Electronics and Drives (SDEMPED), pp.266-272, 1-4 Sept. 2015.
[9] IEEE Recommended Practice for Thermal Evaluation of Sealed Insulation Systems for AC Electric Machinery Employing Random-Wound Stator Coils," In IEEE Std 1107, 1996.
[10] IEEE Recommended Practice for Thermal Evaluation of Sealed Insulation Systems for Ac Electric Machinery Employing Form-Wound Preinsulated Stator Coils for Machines Rated 6900 V and Below, In IEEE Std 429-1994,1994.
[11] Perisse, F.; Werynski, P.; Roger, D., “A New Method for AC Machine Turn Insulation Diagnostic Based on High Frequency Resonances,” IEEE Transactions on Dielectrics and Electrical Insulation, vol.14, no.5, October 2007.
.
L1
L2
L3