Embed Size (px)
Citation preview
Assessment of Inflammation in an Acute on Chronic Model of Inflammatory Bowel Disease with Ultrasound Molecular Imaging Steven Machtaler et al
Supplementary Methods:
Establishment of Acute Colitis in Mice with Normal Colon
Acute colitis on non-inflamed colons was induced in 45 male 6-8 week old BALB/c mice (Jackson
Laboratories, USA) using the contact sensitizing allergen 2.4.6-trinitrobenzenesulfonic acid (TNBS;
Sigma-Aldrich, St. Louis MO) according to previously reported methods 1. In brief, on day -8, an
approximately 1.5 cm x 1.5 cm region of skin on the back between the shoulders was shaved using an
electric razor and 150 µl of a pre-sensitization solution (1% TNBS solution in 4:1 solution of acetone and
olive oil) was placed on the skin and allowed to absorb. On day 0, while mice were anesthetized with 2%
isoflurane in 2 L of oxygen per minute, a lubricated catheter (PE 90; Becton Dickinson, Sparks, MD) was
inserted 4 cm into the colon and a TNBS solution (1:1; 5% TNBS in H20 and 100% ethanol; total injection
volume, 100 μl per mouse) was administered (Figure 1A). In a control group (n = 30), an ethanol solution
only (1:1; 100% ethanol and H20) was administered. An additional 6 mice were utilized as day 0 control
only (no treatment). Mice were weighed prior to imaging in each group.
Dual-Selectin Targeted Contrast Microbubbles
Microbubbles consisted of a perfluorobutane/nitrogen core and a lipid-shell composed of a mixture of 1,2-
distearoyl-sn-glycero-3-phosphocholine (DSPC; Genzyme Pharmaceutical, Liestal, Switzerland), palmitic
acid (Fluka, Buchs, Switzerland), and 1,2-distearoyl-sn-glycero-3-phosphoethanolamine-N-
[maleimide(polyethylene glycol)-2000] (DSPE-PEG2000-maleimide, Avanti Polar Lipids, Alabaster, AL)2.
The targeting peptide, rPSGL, was a recombinant analogue of human PSGL-1 (containing the first 47
amino acids), which also reacts with murine P- and E- selectin that was fused to a human Fc domain to
produce rPSGL-Ig3 (kindly provided by Y’s Therapeutics, San Bruno, USA).
Immunofluorescence Staining for P-selectin and E-selectin and Vascular Area Measurement
After formalin fixation, tissues were cryoprotected in 30% sucrose/PBS (Sigma Aldrich, St. Louis, MO)
overnight and then embedded and frozen in optimum cutting temperature compound (OCT; Fisher
Scientific, Pittsburgh, PA). Ten-micrometer frozen tissue sections were sectioned by using a
cryomicrotome and mounted on microscope slides. Sections were incubated in PBS for 10 minutes to
remove the remaining OCT and permeabilized for 10 min in 0.5% Triton-X 100 in PBS. Sections were
then blocked in a 3% bovine serum albumin solution (Sigma-Aldrich, St. Louis, MO, USA) containing 3%
goat serum and 3% donkey serum for 30 min at room temperature prior to incubation with primary
antibodies (rat anti-mouse CD31; BD Biosciences, San Jose, CA), rabbit anti-mouse P-selectin (Abcam,
Cambridge, MA), or rabbit anti-mouse E-selectin (Abcam). Primary antibodies were visualized with
AlexaFluor488 donkey anti-rat IgG (Invitrogen Life Technologies, Grand Island, NY) and AlexaFluor 546
goat anti-rabbit IgG (Invitrogen Life Technologies). The F-actin cytoskeleton was visualized using
AlexaFluor 633-phalloidin (Invitrogen Life Technologies). Samples were mounted using ProLong Gold
mounting media (Invitrogen Life Technologies). Samples were imaged using a Zeiss LSM510
metaconfocal microscope (Zeiss, Thornwood, NT, USA) with a 20X objective using a 3 X 3 tiled confocal
micrograph.
Quantitative Assessment of P- and E- Selectin Expression
Three non-overlapping fields within each colon cross section were imaged. CD31 staining was used to
identify blood vessels, and regions of interest (ROI) were automatically drawn around each vessel in the
field by first converting the images to 8-bit, then applying a threshold to create a binary image of the
vessels, and using that to define the blood vessel ROI. The coordinates of each ROI were copied and
applied to the P-selectin or E-selectin channel, where the intensity was then quantified by measuring the
mean fluorescent intensity (MFI; arbitrary units from 0-255) within each ROI. P- and E-selectin positive
vessels were defined as having a mean fluorescent intensity greater than or equal to a threshold value
which was determined from the control colon samples (P-selectin MFI threshold: 15 a.u., E-selectin MFI
threshold: 50 a.u.) as described previously4.
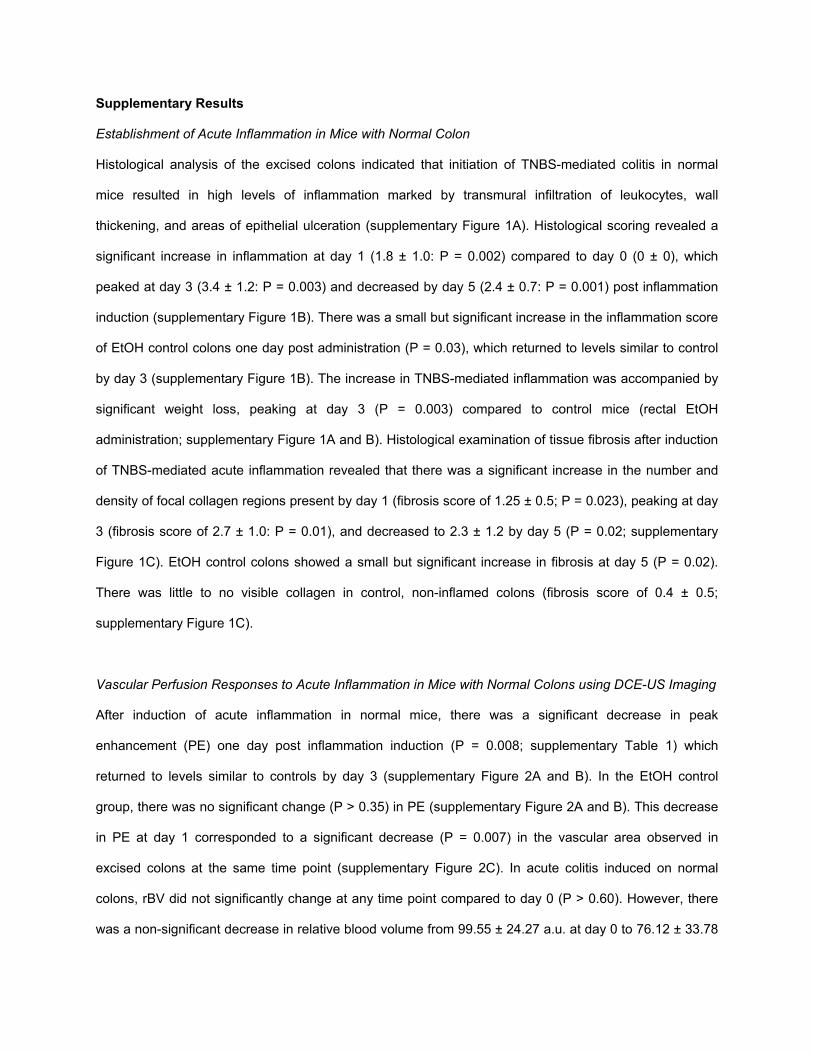
Supplementary Results
Establishment of Acute Inflammation in Mice with Normal Colon
Histological analysis of the excised colons indicated that initiation of TNBS-mediated colitis in normal
mice resulted in high levels of inflammation marked by transmural infiltration of leukocytes, wall
thickening, and areas of epithelial ulceration (supplementary Figure 1A). Histological scoring revealed a
significant increase in inflammation at day 1 (1.8 ± 1.0: P = 0.002) compared to day 0 (0 ± 0), which
peaked at day 3 (3.4 ± 1.2: P = 0.003) and decreased by day 5 (2.4 ± 0.7: P = 0.001) post inflammation
induction (supplementary Figure 1B). There was a small but significant increase in the inflammation score
of EtOH control colons one day post administration (P = 0.03), which returned to levels similar to control
by day 3 (supplementary Figure 1B). The increase in TNBS-mediated inflammation was accompanied by
significant weight loss, peaking at day 3 (P = 0.003) compared to control mice (rectal EtOH
administration; supplementary Figure 1A and B). Histological examination of tissue fibrosis after induction
of TNBS-mediated acute inflammation revealed that there was a significant increase in the number and
density of focal collagen regions present by day 1 (fibrosis score of 1.25 ± 0.5; P = 0.023), peaking at day
3 (fibrosis score of 2.7 ± 1.0: P = 0.01), and decreased to 2.3 ± 1.2 by day 5 (P = 0.02; supplementary
Figure 1C). EtOH control colons showed a small but significant increase in fibrosis at day 5 (P = 0.02).
There was little to no visible collagen in control, non-inflamed colons (fibrosis score of 0.4 ± 0.5;
supplementary Figure 1C).
Vascular Perfusion Responses to Acute Inflammation in Mice with Normal Colons using DCE-US Imaging
After induction of acute inflammation in normal mice, there was a significant decrease in peak
enhancement (PE) one day post inflammation induction (P = 0.008; supplementary Table 1) which
returned to levels similar to controls by day 3 (supplementary Figure 2A and B). In the EtOH control
group, there was no significant change (P > 0.35) in PE (supplementary Figure 2A and B). This decrease
in PE at day 1 corresponded to a significant decrease (P = 0.007) in the vascular area observed in
excised colons at the same time point (supplementary Figure 2C). In acute colitis induced on normal
colons, rBV did not significantly change at any time point compared to day 0 (P > 0.60). However, there
was a non-significant decrease in relative blood volume from 99.55 ± 24.27 a.u. at day 0 to 76.12 ± 33.78
a.u. (P = 0.1906) at day 1, which returned to levels similar to controls by day 3 (supplementary Table 1;
supplementary Figure 2D and E).
Assessment of Inflammation using Ultrasound Molecular Imaging Targeted to P- and E-Selectin
Induction of acute inflammation in mice with normal colons resulted in a significant increase in the
ultrasound molecular imaging signal obtained using MBselectin (30.1 ± 13.7 a.u.; P < 0.0001) one day post
TNBS administration, which decreased by day 3 (15.0 ± 8.7 a.u.: P = 0.0003) and reached levels similar
to day 0 (2.7 ± 2.0 a.u.) by day 5 (3.6 ± 5.3; supplementary Figure 3A and B). There was no significant
increase in ultrasound molecular imaging signal in control mice after EtOH administration (P > 0.99;
supplementary Figure 3A and B). Ultrasound molecular imaging using MBControl also resulted in no
significant targeted signal compared to day 0 in all treatments (P > 0.29; supplementary Figure 3B).
Ex Vivo Analysis of P- and E-Selectin Expression
After induction of acute colitis in mice with normal colons, there was a significant increase in the
percentage of P-selectin expressing vessels, which peaked at day 1 post TNBS administration (27.2 ±
16.6 % of vessels; P < 0.0001), and declined to levels similar to control (8.3 ± 5.1 % of vessels) by day 5
(6.1 ± 4.5 % of vessels; supplementary Figure 4A and C). Similarly, the percentage of E-selectin positive
vessels significantly increased from day 0 (1.7 ± 1.7 % of vessels) to 8.75 ± 5.3 % of vessels by day 1 (P
= 0.009), and gradually declined by day 5 (4.6 ± 3.8 % of vessels; supplementary Figure 4B and D).
Supplementary References
1. Wirtz S, Neufert C, Weigmann B, et al. Chemically induced mouse models of intestinal inflammation. Nature protocols 2007;2:541-6.
2. Schneider M, Anantharam B, Arditi M, et al. BR38, a new ultrasound blood pool agent. Invest Radiol 2011;46:486-94.
3. Bettinger T, Bussat P, Tardy I, et al. Ultrasound molecular imaging contrast agent binding to both E- and P-selectin in different species. Invest Radiol 2012;47:516-23.
4. Wang H, Machtaler S, Bettinger T, et al. Molecular Imaging of Inflammation in Inflammatory Bowel Disease with a Clinically Translatable Dual-Selectin-targeted US Contrast Agent: Comparison with FDG PET/CT in a Mouse Model. Radiology 2013;267:818-829.
Supplementary Figures:
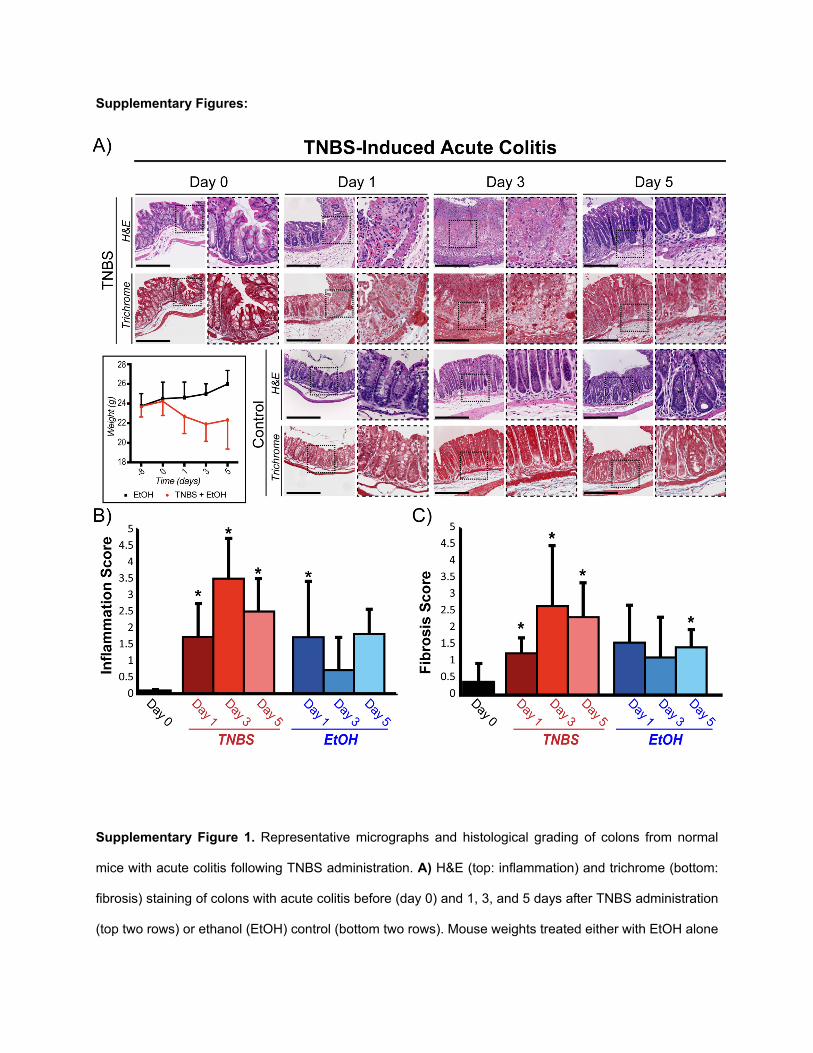
Supplementary Figure 1. Representative micrographs and histological grading of colons from normal
mice with acute colitis following TNBS administration. A) H&E (top: inflammation) and trichrome (bottom:
fibrosis) staining of colons with acute colitis before (day 0) and 1, 3, and 5 days after TNBS administration
(top two rows) or ethanol (EtOH) control (bottom two rows). Mouse weights treated either with EtOH alone

or both EtOH and TNBS are also plotted for the different time points starting at day -8 (bottom left). Inset
dashed boxes represent zoomed region of the micrographs (right panel at each time point). Scale bar =
500 µm. Bar graphs summarize means ± standard deviations of histological scoring of inflammation
grading based on H&E staining (B) and scoring of fibrosis based on trichrome staining (C). * denotes P <
0.05.
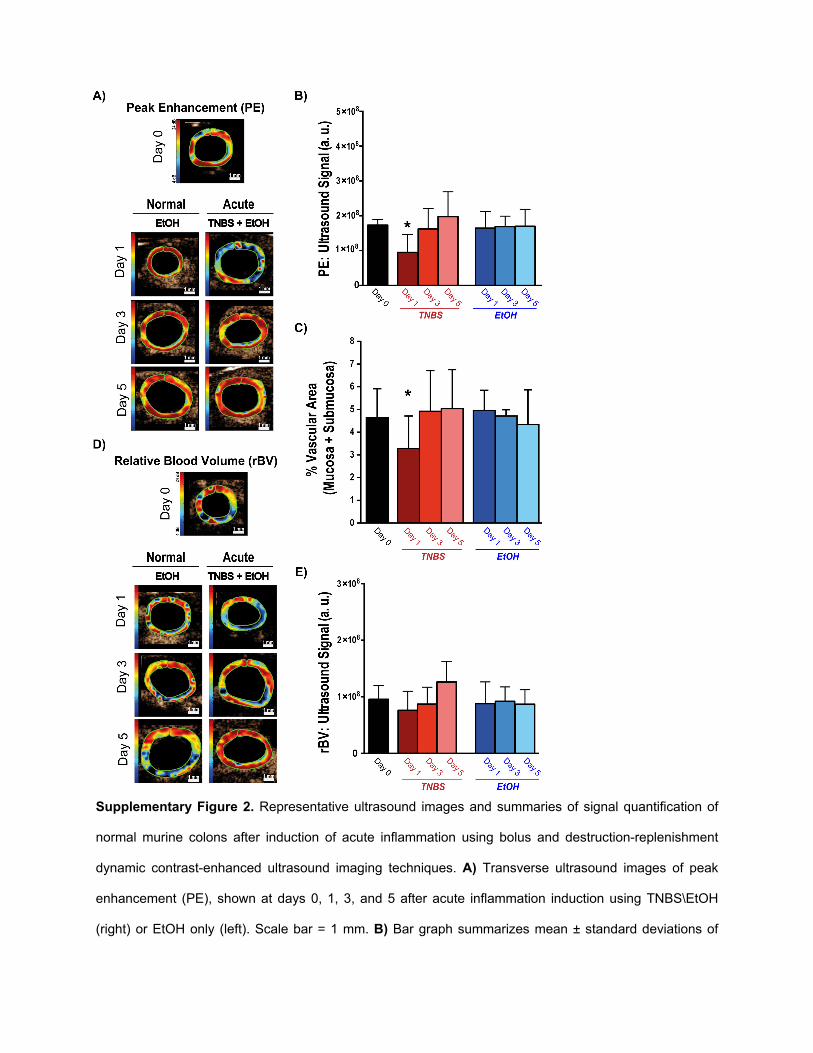
Supplementary Figure 2. Representative ultrasound images and summaries of signal quantification of
normal murine colons after induction of acute inflammation using bolus and destruction-replenishment
dynamic contrast-enhanced ultrasound imaging techniques. A) Transverse ultrasound images of peak
enhancement (PE), shown at days 0, 1, 3, and 5 after acute inflammation induction using TNBS\EtOH
(right) or EtOH only (left). Scale bar = 1 mm. B) Bar graph summarizes mean ± standard deviations of

quantitate PE values; * denotes P < 0.008). C) Bar graph summarizes mean ± standard deviations of the
vascular area quantified as the percentage CD31 positive vessels in mucosa and submucosa of bowel; *
denotes P < 0.05). D) Transverse ultrasound images show relative blood volume (rBV) imaged 0, 1, 3,
and 5 days after acute inflammation induction using TNBS/EtOH (right) or EtOH only (left). Scale bar = 1
mm. E) Bar graph summarizes mean ± standard deviations of quantitate rBV values; * denotes P < 0.008.
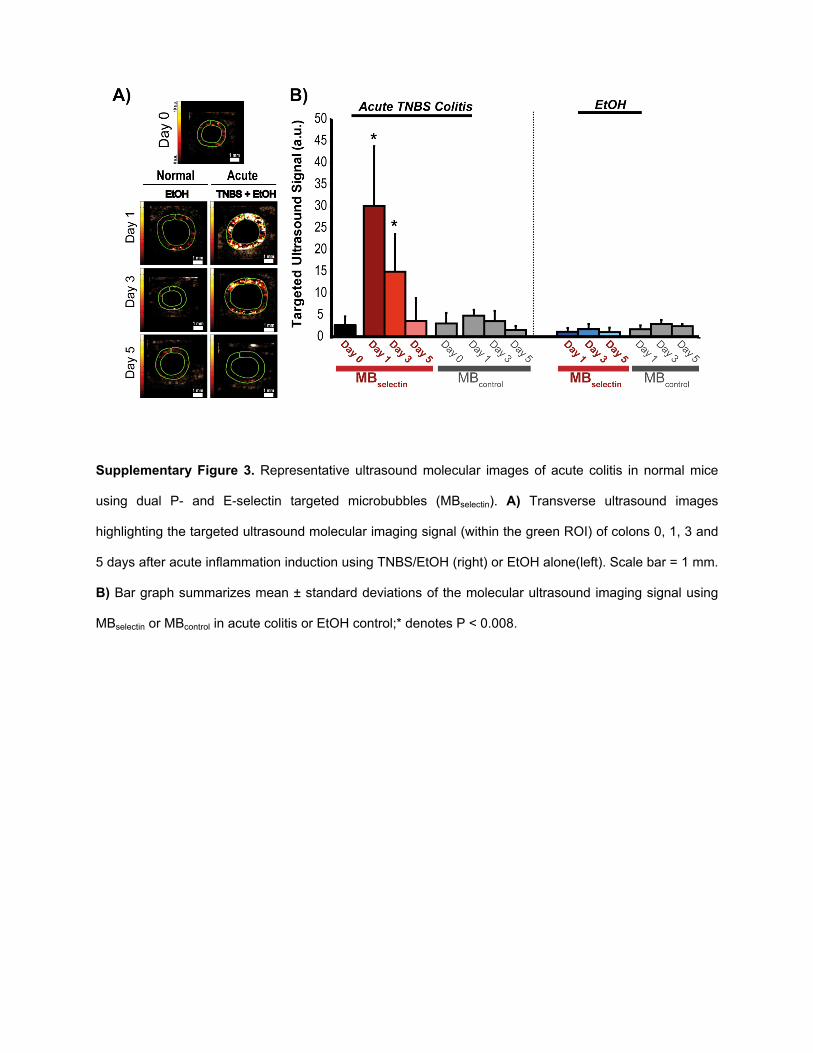
Supplementary Figure 3. Representative ultrasound molecular images of acute colitis in normal mice
using dual P- and E-selectin targeted microbubbles (MBselectin). A) Transverse ultrasound images
highlighting the targeted ultrasound molecular imaging signal (within the green ROI) of colons 0, 1, 3 and
5 days after acute inflammation induction using TNBS/EtOH (right) or EtOH alone(left). Scale bar = 1 mm.
B) Bar graph summarizes mean ± standard deviations of the molecular ultrasound imaging signal using
MBselectin or MBcontrol in acute colitis or EtOH control;* denotes P < 0.008.
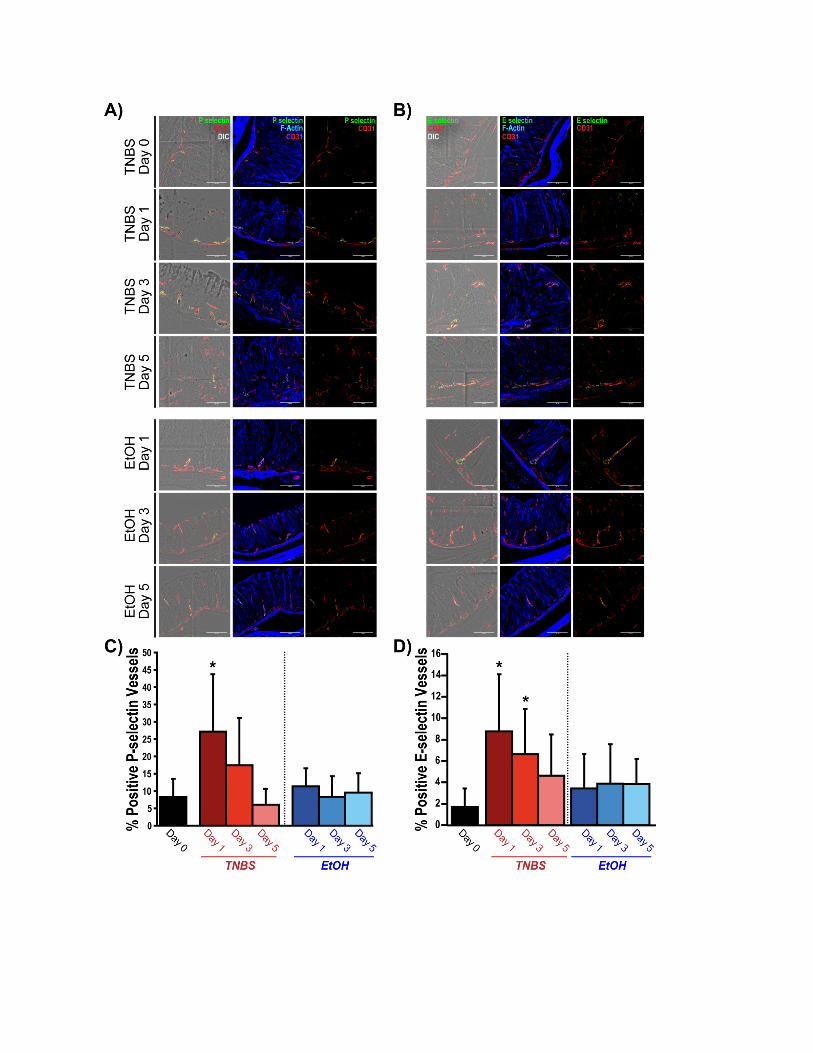
Supplementary Figure 4. Ex vivo analysis of P- and E- selectin expression in normal colons after
induction of acute colitis. A) Confocal micrographs show P-selectin expression (green) within the
vasculature (CD31, red) of colons before (day 0) and 1, 3 and 5 days after TNBS/EtOH (top) or EtOH
(bottom) administration. Expression of P-selectin and CD31 is overlaid on top of differential interference
contrast (DIC; left panels) and F-actin (middle, blue) in order to observe tissue and cellular morphology.
B) Confocal micrographs show E-selectin expression (green) within the vasculature (CD31, red) of colons
before (day 0) and 1, 3 and 5 days after TNBS/EtOH (top) or EtOH (bottom) administration. Expression of
E-selectin and CD 31 is overlaid on top of DIC (left panels) or F-actin (middle, blue) in order to observe
tissue and cellular morphology. Scale bar = 100 µm. C, D) Quantification of the percentage of vessels
expressing P-selectin (C) or E-selectin (D) within the colon before (day 0) and 1, 3 and 5 days after
TNBS/EtOH or EtOH administration;* denotes P < 0.05.
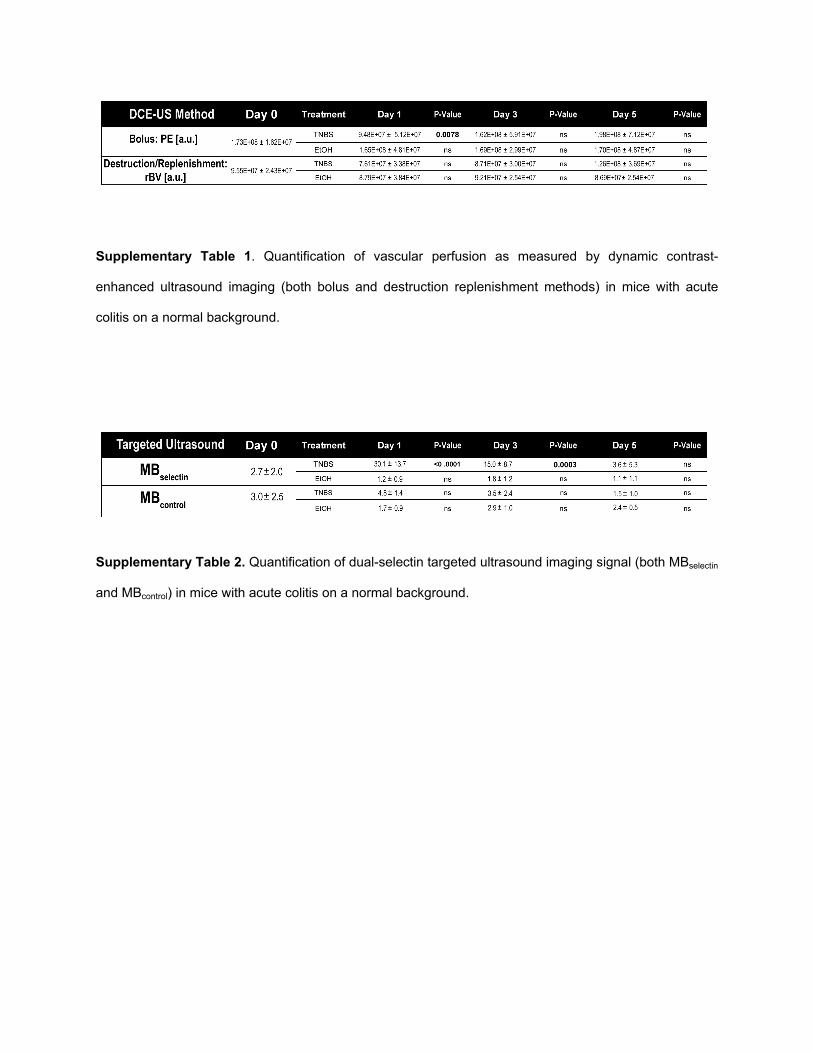
Supplementary Table 1. Quantification of vascular perfusion as measured by dynamic contrast-
enhanced ultrasound imaging (both bolus and destruction replenishment methods) in mice with acute
colitis on a normal background.
Supplementary Table 2. Quantification of dual-selectin targeted ultrasound imaging signal (both MBselectin
and MBcontrol) in mice with acute colitis on a normal background.