Embed Size (px)
Citation preview
Roomvent 2007: 10th International Conference on Air Distribution in Rooms
Helsinki, June 13-15, 2007
Center for the Built Environment (CBE) http://www.cbe.berkeley.edu Page 1
Roomvent 2007, Helsinki
Edward ArensCenter for the Built Environment
UC Berkeley
Assessment of Indoor Climate:Learning from Buildings
Roomvent 2007, Helsinki
Outdoor climate
Roomvent 2007, Helsinki
Indoor climate
Roomvent 2007, Helsinki
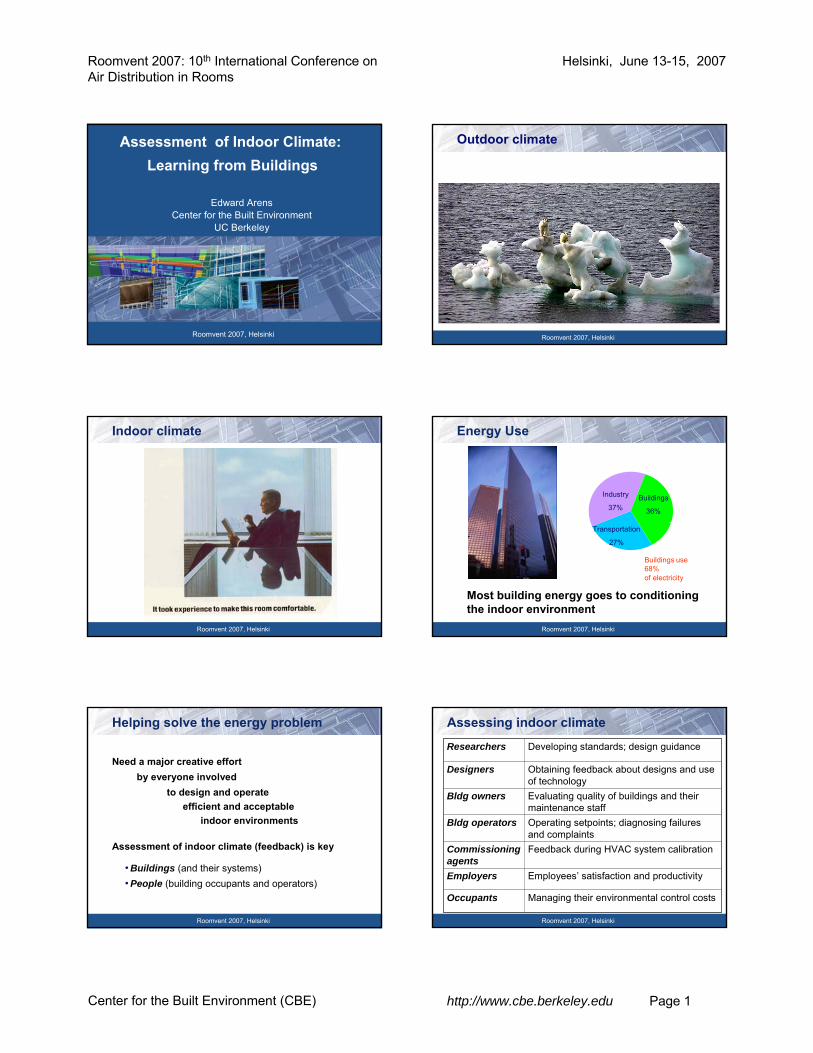
Energy Use
Buildings
36%
Industry
37%
Transportation
27%
Buildings use 68%of electricity
Most building energy goes to conditioning the indoor environment
Roomvent 2007, Helsinki
Helping solve the energy problem
Need a major creative effort by everyone involved
to design and operateefficient and acceptable
indoor environments
Assessment of indoor climate (feedback) is key
• Buildings (and their systems)• People (building occupants and operators)
Roomvent 2007, Helsinki
Assessing indoor climate
Managing their environmental control costsOccupants
Employees’ satisfaction and productivityEmployers
Feedback during HVAC system calibrationCommissioning agents
Operating setpoints; diagnosing failures and complaints
Bldg operators
Evaluating quality of buildings and their maintenance staff
Bldg owners
Obtaining feedback about designs and use of technology
Designers
Developing standards; design guidanceResearchers

Roomvent 2007: 10th International Conference on Air Distribution in Rooms
Helsinki, June 13-15, 2007
Center for the Built Environment (CBE) http://www.cbe.berkeley.edu Page 2
Roomvent 2007, Helsinki
Assessment techniques
1. Mobile comfort carts2. Stationary indoor climate monitor 3. Commissioning cart with wireless sensor array4. Homeowners’ energy information system5. ‘Right-now’ surveys6. Comfort polling station7. Web-based indoor environmental quality survey
These appear in example research projects
Roomvent 2007, Helsinki
Example 1: research on thermal comfort
ASHRAE research on operating buildings in 1980’s and 90’s
• Was Standard 55 being followed in real buildings?
• Were the criteria correct?
Involved detailed measurement of physical environment and occupant responses
160 bldgs
Roomvent 2007, Helsinki
Thermal comfort assessment carts
Mark 1
Mark 2
Roomvent 2007, Helsinki
“Right now” occupant survey – scales
Roomvent 2007, Helsinki
Analyzing the ASHRAE comfort database:
Centrally-controlled HVAC bldgs Naturally ventilated buildings
Predicted: Lab-based PMV modelObserved: Field-based adaptive model
2021222324252627
-5 0 5 10 15 20 25 30 35outdoor temperature index, ET* (oC)
indoo
r com
fort t
emp’
Top (
o C)
2021222324252627
-5 0 5 10 15 20 25 30 35indoo
r com
fort t
emp’
Top (
o C)
outdoor temperature index, ET* (oC)
deDear and Brager used these data to develop the Adaptive Comfort Model, now in Std. 55, for operable windows
Roomvent 2007, Helsinki
Example 2: Commissioning cart project
The commissioning cart was inspired and funded by the New York Times
• One of three specialized carts for commissioning new building systems in their headquarters
• Lighting• Shades• Underfloor thermal and
ventilation system

Roomvent 2007: 10th International Conference on Air Distribution in Rooms
Helsinki, June 13-15, 2007
Center for the Built Environment (CBE) http://www.cbe.berkeley.edu Page 3
Roomvent 2007, Helsinki
Commissioning for thermal stratification
0
1
2
3
4
5
6
7
8
9
10
11
69 70 71 72 73 74 75 76 77 78 79 80 81 82
Room Temperature, °F
Hei
ght,
ft
1.0 cfm/sq. ft0.6 cfm/sq. ft0.3 cfm/sq. ft
5°F ∆TASHRAE Std.55-2004
Still satisfies vertical temperature difference (5°F) with 40% less air
Roomvent 2007, Helsinki
Commissioning cart
Temperature profiling up to 5 meters
Telescoping stratification measurement tree
Data acquisition boards
Lanyard for raising tree
12 VDC Battery power system
Cart laptop computer
Pressure sensor, with plastic tubing tether (with internal thermocouple)
Roomvent 2007, Helsinki
Cart display screens
200 artificial loads70 motes
Roomvent 2007, Helsinki
Examples 3 & 4: assessment for ‘demand response’
Electrical demand shedding and shifting (precooling):3. residential4. commercial
Cal ISO Daily Peak LoadsJanuary 1, 2000 - December 31, 2000
20
25
30
35
40
45
50
Jan-00
Feb-00
Mar-00
Apr-00
May-00
Jun-00
Jul-0
0
Aug-00
Sep-00
Oct-00
Nov-00
Dec-00
GW
Peak Day August 16 - 43.5 GW
Commercial AC
Residential AC
10 GW!!
Roomvent 2007, Helsinki
Demand-responseelectrical appliance manager
Real-time Meter
Utility
Price
Elec
tricit
y use
d
Occupancy sensors
Power sensor
Temperature sensors
Power actuators
Price Indicator
Roomvent 2007, Helsinki
Adjust position
Start/stop on/off
Provide information
Reset setpoint
Suggest action
Shading
Window
Blinds
AC
Vent
Refriger
Computer
Office devices
Lights
Thermal comfort
Temperature, radiation, air velocity, humidity, preference
Occupancy
Motion, sound, CO2, schedule
Envelope
Window position, blind position, air velocity
HVAC
Temperature, humidity, pressure, air velocity
Lighting
IlluminationGlare
Energy and Power
Voltage, current, power factor, fuel flow, price
•Informing occupants;
•Manual actuation
•Automatic actuation
New integrated building control system
Expanded user interface for input, data output, advice
Ambient intelligence
Roomvent 2007: 10th International Conference on Air Distribution in Rooms
Helsinki, June 13-15, 2007
Center for the Built Environment (CBE) http://www.cbe.berkeley.edu Page 4
Roomvent 2007, Helsinki
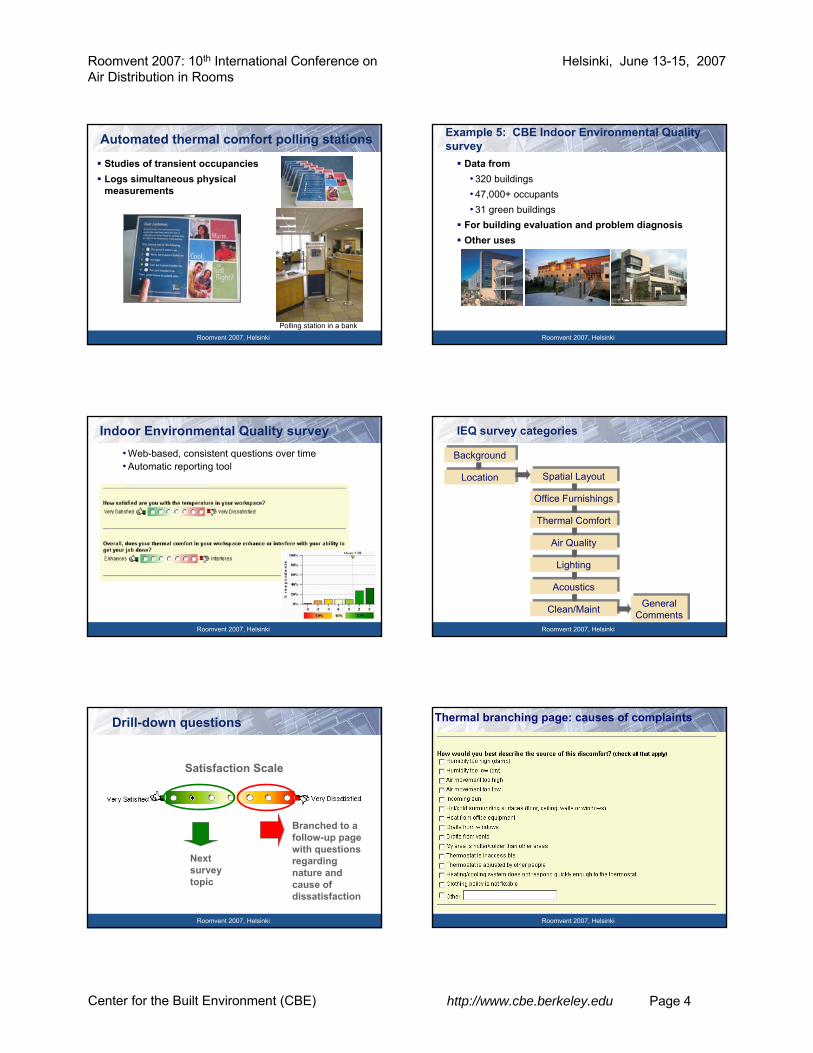
Automated thermal comfort polling stations
Studies of transient occupanciesLogs simultaneous physical measurements
Polling station in a bankRoomvent 2007, Helsinki
Example 5: CBE Indoor Environmental Quality survey
Data from• 320 buildings• 47,000+ occupants• 31 green buildings
For building evaluation and problem diagnosisOther uses
Roomvent 2007, Helsinki
Indoor Environmental Quality survey• Web-based, consistent questions over time• Automatic reporting tool
Roomvent 2007, Helsinki
Spatial LayoutSpatial Layout
Office FurnishingsOffice Furnishings
Thermal ComfortThermal Comfort
Air QualityAir Quality
LightingLighting
AcousticsAcoustics
Clean/MaintClean/MaintGeneral
CommentsGeneral
Comments
LocationLocation
BackgroundBackground
IEQ survey categories
Roomvent 2007, Helsinki
Drill-down questions
Satisfaction Scale
Next survey topic
Branched to a follow-up page with questions regarding nature and cause of dissatisfaction
Roomvent 2007, Helsinki
Thermal branching page: causes of complaints

Roomvent 2007: 10th International Conference on Air Distribution in Rooms
Helsinki, June 13-15, 2007
Center for the Built Environment (CBE) http://www.cbe.berkeley.edu Page 5
Roomvent 2007, Helsinki
IEQ Survey results
Roomvent 2007, Helsinki
14%13%15%
19%16%16%
6%
-
2,000
4,000
6,000
8,000
10,000
-3 -2 -1 0 1 2 3
Num
ber o
f res
pson
ses
very dissatisfied very satisfied
Thermal satisfaction: 2nd lowest category
“How satisfied are you with the temperature in your workspace?”
Overall: 58% of respondents satisfied
Roomvent 2007, Helsinki
14%15%
24%21%
15%
9%
1% 1%
0102030405060
0-9%
10-1
9%20
-29%
30-3
9%40
-49%
50-5
0%60
-69%
70-7
9%80
-89%
90-9
9%10
0%
Percent satisfied
Num
ber o
f bui
ldin
gsx
Distribution of thermal satisfaction
Percent satisfied: Top 4 points (>=0) on 7-point satisfaction scale
11% of buildings meet acceptability standard
Roomvent 2007, Helsinki
9% 10%13%
23%
18%19%
8%
-
2,000
4,000
6,000
8,000
10,000
-3 -2 -1 0 1 2 3
Num
ber o
f res
pson
ses
very dissatisfied very satisfied
Air quality satisfaction: 3rd lowest category“How satisfied are you with the air quality in your workspace (i.e. stuffy/stale air, cleanliness, odors)?”
Overall: 68% of respondents satisfied
Roomvent 2007, Helsinki
1%
8%
19%20%
25%
15%
9%
2%1%
0102030405060
0-9%
10-1
9%20
-29%
30-3
9%40
-49%
50-5
0%60
-69%
70-7
9%80
-89%
90-9
9%10
0%
Percent satisfied
Num
ber o
f bui
ldin
gsx
Distribution of air quality satisfaction
Percent satisfied: Top 4 points (≥0) on 7-point satisfaction scale
26% of buildings meet acceptability standard
Roomvent 2007, Helsinki
Thermal satisfaction, by building type
Mean Scores - Thermal ComfortLEED (n=31) compared to CBE database (n=257)
-3
0
3
0% 25% 50% 75% 100%
Percentile Rank
Mea
n Sa
tisfa
ctio
n Sc
ore
leed median: 0.42db median: -0.13
mixed mode median: 0.62
LEED (n=31), mixed mode (n=5) compared to CBE database (n=257)
Data for evolving green building design criteria

Roomvent 2007: 10th International Conference on Air Distribution in Rooms
Helsinki, June 13-15, 2007
Center for the Built Environment (CBE) http://www.cbe.berkeley.edu Page 6
Roomvent 2007, Helsinki
Air quality satisfaction, by building type
Mean Scores - Air QualityLEED (n=31) com pared to CBE database (n=257)
-3
0
3
0% 25% 50% 75% 100%
Percentile Rank
Mea
n Sa
tisfa
ctio
n Sc
ore
leed m edian: 1.21
db m edian: 0.21
mixed mode median: 1.95
LEED (n=31), mixed mode (n=5) compared to CBE database (n=257)
Roomvent 2007, Helsinki
Green buildings and acoustic satisfaction
Mean Scores - Acoustic QualityLEED (n=31) compared to CBE database (n=257)
-3
0
3
0% 25% 50% 75% 100%
Percentile Rank
Mea
n Sa
tisfa
ctio
n Sc
ore
leed median: -0.15db median: -0.25
Roomvent 2007, Helsinki
An office building in Virginia:
Overall Building: High (+)
Workplace: Low (-)
Lighting: Very High (++)
Air Quality: Very High (++)
Thermal Comfort: Low (-)
Acoustics: Very Low (--)
Response Rate: 69%
‘Green Building Confessions’…
* (Compared to the CBE database of projects)
Roomvent 2007, Helsinki
Air Quality• Higher satisfaction than
average for all CBE surveys
Thermal Comfort• Significant variation among
buildings• Low cost-driven design
decisions = low satisfaction rate
• Limited controls impacts satisfaction
Green Building Confessions…
Overall Satisfaction - Air QualityHOK Buildings Compared to CBE Database
-3
0
3
0% 25% 50% 75% 100%
Percentile Rank
Mea
n Sa
tisfa
ctio
n Sc
ore
Overall Satisfaction - Thermal ComfortHOK Buildings Compared to CBE Database
-3
0
3
0% 25% 50% 75% 100%Percentile Rank
Mea
n Sa
tisfa
ctio
n Sc
ore
Roomvent 2007, Helsinki
Example 6: Field study research on air movement
Roomvent 2007, Helsinki
Window-ventilated open-plan office building
CBE IEQ survey for background• two seasons• ~100 occupants/season (half of the
building population)
Repeated “right now” survey• two week test period each season• 38 occupants/season• Total more than 2000 surveys
Ambient measurements• air and globe temperatures, humidity,
and air velocity at 38 workstations• Continuously during both seasons

Roomvent 2007: 10th International Conference on Air Distribution in Rooms
Helsinki, June 13-15, 2007
Center for the Built Environment (CBE) http://www.cbe.berkeley.edu Page 7
Roomvent 2007, Helsinki
Desktop indoor climate monitor (ICM)
Anemometer(air speed)
Shielded Dry Bulb Globe
Temperature
Monitoring station and voting box units, Fishman and Pimbert, 1978
Roomvent 2007, Helsinki
ICMs
ICM application will be described later..
Roomvent 2007, Helsinki
“Right now” survey – air movement questions
Roomvent 2007, Helsinki
“Right now” survey:air movement preference question
Many more people wanted more air movement than less
Summer, N = 1040 Winter, N = 1028
want more 45% (n=468)
want less 3% (n=31)
no change 52% (n=540)
want more 28% (n=288)
want less 4% (n=41)
no change 68% (n=699)
Roomvent 2007, Helsinki
Thermal sensation and air movement preference
Roomvent 2007, Helsinki
10% of the measured velocity > 0.2 m/s, N=194
Higher velocities--above the 0.2 m/s draft limit
Roomvent 2007: 10th International Conference on Air Distribution in Rooms
Helsinki, June 13-15, 2007
Center for the Built Environment (CBE) http://www.cbe.berkeley.edu Page 8
Roomvent 2007, Helsinki
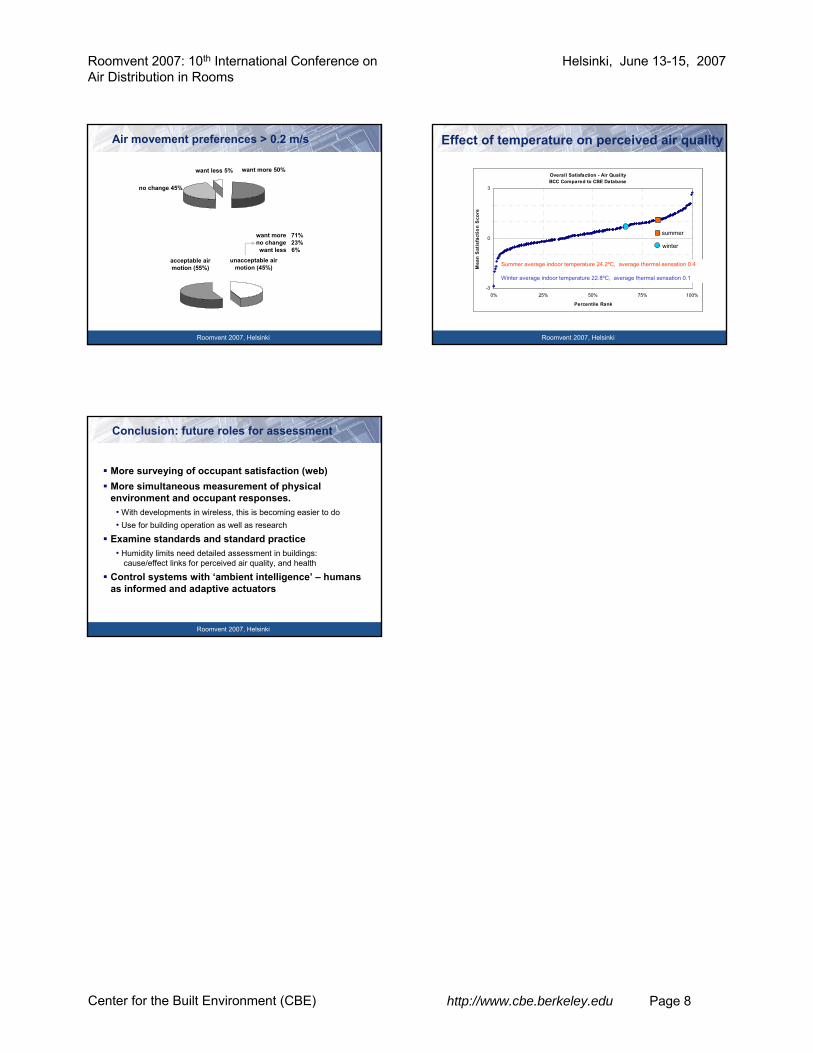
Air movement preferences > 0.2 m/s
want more 50%
no change 45%
want less 5%
unacceptable air motion (45%)
acceptable air motion (55%)
want more 71%no change 23%want less 6%
Roomvent 2007, Helsinki
Effect of temperature on perceived air quality
Overall Satisfaction - Air QualityBCC Compared to CBE Database
-3
0
3
0% 25% 50% 75% 100%
Percentile Rank
Mea
n S
atis
fact
ion
Sco
re
summer
winter
Overall Satisfaction - Air QualityBCC Compared to CBE Database
-3
0
3
0% 25% 50% 75% 100%
Percentile Rank
Mea
n S
atis
fact
ion
Sco
re
summer
winter
Summer average indoor temperature 24.2ºC, average thermal sensation 0.4
Winter average indoor temperature 22.8ºC, average thermal sensation 0.1
Roomvent 2007, Helsinki
Conclusion: future roles for assessment
More surveying of occupant satisfaction (web)More simultaneous measurement of physical environment and occupant responses.
• With developments in wireless, this is becoming easier to do• Use for building operation as well as research
Examine standards and standard practice• Humidity limits need detailed assessment in buildings:
cause/effect links for perceived air quality, and health
Control systems with ‘ambient intelligence’ – humans as informed and adaptive actuators