Embed Size (px)
Citation preview

2013
Commissioned by MOHCW
with support from MCHIP
February 2013
Assessment of Health Data Quality in Manicaland Province

2
TABLE OF CONTENTS
ACKNOWLEDGEMENTS ......................................................................................................................................... 3
ABBREVIATIONS ..................................................................................................................................................... 3
DEFINITIONS .......................................................................................................................................................... 4
1. BACKGROUND/CONTEXT ............................................................................................................................... 5
2. PROBLEM STATEMENT AND ASSESSMENT OBJECTIVES ................................................................................ 7
3. METHODOLOGY ............................................................................................................................................. 7
4. FINDINGS ..................................................................................................................................................... 10
5. DISCUSSION AND RECOMMENDATIONS ..................................................................................................... 23
6. ANNEXES ...................................................................................................................................................... 27
Annex 1: Health Facilities Assessed ..................................................................................................................... 27
Annex 2: List of Enumerators .............................................................................................................................. 27
Annex 3: List of People Interviewed .................................................................................................................... 27
Annex 4: Data Collection Tools Used ................................................................................................................... 29
Annex 5: Quality of System Component Scores for All Sites Assessed (Related to MNCH Services) .................. 48
Annex 6: Assessment of District Level (DHIO) Data Management and Reporting Systems, by District ............. 49
Annex 7: Quality of System Component Scores for All Sites Assessed (Related to EPI Services) ....................... 56
Annex 8: Quality of System Component Scores for Manicaland Province/Districts Assessed (Sub-criteria
Details, EPI DQS Tool) .......................................................................................................................................... 58
Annex 9: Quality of System Component Scores for HFs Assessed (Sub-criteria Details, EPI DQS Tool) ............. 60
Annex 10: Verification Factors, by Health Facility and Indicator ........................................................................ 62

3
ACKNOWLEDGEMENTS
This data quality self-assessment, conducted in 21 health facilities in Manicaland province, was made possible with financial and technical support from USAID/MCHIP Zimbabwe. The MOHCW and MCHIP would like to thank the team of assessors (comprised of seven provincial and district-level MOHCW staff and three MCHIP Zimbabwe staff) for carrying out this activity, as well as all Manicaland health facility staff who participated in the assessment and who provided access to health facility data to the assessment team.
ABBREVIATIONS AEFI Adverse Event Following Immunization ANC Antenatal Care ARI Acute Respiratory Infection CHD Central Hospital Departments DHE District Health Executive DHIO District Health Information Officer DHIS District Health Information Software DMO District Medical Officer DQS Data Quality Self-Assessment EDC Epidemiology and Disease Control EPI Expanded Program on Immunization HF Health Facility HIS Health Information System HMIS Health Management Information System M&E Monitoring and Evaluation MCHIP Maternal and Child Health Integrated Program MNCH Maternal, Newborn and Child Health MOHCW Ministry of Health and Child Welfare NHIO National Health Information Officer NHIS National Health Information System PCV Pneumococcal Conjugate Vaccine PD Principal Director PHE Provincial Health Executive PHIO Provincial Health Information Officer PMD Provincial Medical Director PMTCT Prevention of Mother to Child Transmission of HIV PS Permanent Secretary QSI Quality of System Index RDQA Routine Data Quality Assessment RHC Rural Health Center USAID United States Agency for International Development VPD Vaccine Preventable Disease WHO World Health Organization

4
DEFINITIONS
Availability: Refers to the accessibility of the data collection and/or reporting tools. The assessment looked at whether the tools were readily accessible for review.
Completeness: Refers to whether all the fields in the data collection or reporting tools are completed.
Data Quality Self-assessment (DQS): A DQS focuses on applying the data quality standards and examining the systems and approaches for collecting data to determine whether they are likely to produce high quality data over time. In other words, if the data quality standards are met and the data collection methodology is well designed, then it is likely that good quality data will result.
Indicator: A measurable characteristic or variable, which represent project progress.
Monitoring and Evaluation (M&E): Monitoring and evaluation are fundamental aspects of good programme management at all levels. M&E:
o Provides data on programme progress and effectiveness o Improves programme management and decision-making o Allows accountability to stakeholders, including funders o Provides data to plan future resource needs o Provides data useful for policy-making and advocacy
Over-reporting: This is when the reported data is higher than what is in the primary data collection tools.
Timeliness: Refers to whether the reports are submitted to the next level on time. It is defined as a percentage with the number of reports that were received on time (by the deadline) as the numerator and the number of reports received during a period of time as denominator
Under-reporting: This is when the reported data is lower than what is in the primary data collection tools.
Verification factor: Ratio of the recounted value of the indicator relative to the reported value.

5
Figure 1: Flow of health information from district to national level (extracted from the National Health Information Strategy, 2009-2014).
1. BACKGROUND/CONTEXT The availability of high quality health data is crucial for monitoring the progress and performance of health programs and for making decisions about health program policy, planning, implementation, and resource allocation. “High quality” data is typically defined as data that meets accepted standards for variables such as reliability, completeness, validity/accuracy, consistency, and timeliness. Data quality self-assessments (DQS) are a means for program implementers to assess the quality of routine data being generated by the health system, through a structured process aimed at determining the accuracy of reported health data and the quality of health data monitoring systems. According to a World Health Organization (WHO) guide on DQS tools1, “the DQS aims to diagnose problems and provide orientation to improve monitoring and use of data for action”. As part of ongoing activities to strengthen data quality improvement processes within Manicaland province, in February-March 2013, the MOHCW conducted a DQS exercise, which included health information offices and select health facilities in all seven districts of Manicaland. The DQS examined routine health data covering the period January-December 2012. Twenty-one health facilities (three from each district) were purposively selected to participate in the assessment.
Generation and Flow of Routine Health Information As described in the Zimbabwe National Health Information Strategy (2009-2014), information plays a critical role in health strategy development and policy formulation as well as in the effective planning, coordination, and delivery of health services. In order for information to be truly useful however, it must be based on good quality data which is credible, reliable, and timely, and which is accessible to stakeholders at all levels. Figure 1 shows how routine health data flows from (as well as within) one level to the next of the national health information system (NHIS). Routine health data flows both vertically and horizontally, with data generally flowing upward and feedback ideally flowing back downward from one management level to another. At health facility level, routine data is consolidated and reported to the district level using tools/registers including the T5 (outpatient department data), the T9, the HS3/5 (for admitting facilities), weekly diseases surveillance data, etc. The T5 is submitted to the district level in hard copy (paper) form. At district level, the District Health Information Officer (DHIO) enters facility data received into an electronic database (also known as the District Health Information Software or DHIS), and then transmits the DHIS database (via email, a USB/memory stick device, or a CD) to the Provincial Health Information
1 WHO, 2005. “The immunization data quality self-assessment (DQS) tool”, available at: www.who.int/vaccines-
documents/

6
Officer (PHIO). The PHIO aggregates all district data received and transmits (electronically) provincial data to the national level. (Note that some exceptions to this flow exist, e.g., higher-level facilities such as the provincial and central hospitals send their data directly to the PHIO or National Health Information officer (NHIO)). Based on information transmitted, feedback is supposed to be given to lower levels from the levels above in order to improve program implementation, planning, etc. Finally, in addition to the NHIS, health data is also generated from other sources such as the vital registration system, population censuses, and ad hoc surveys and assessments.
Data Quality Self-Assessment According to WHO reference materials on the topic2, the DQS process is comprised of a review of data accuracy at different levels of the health information system and a self-designed questionnaire monitoring quality issues such as the availability and use of health information tools and the recording and reporting practices of health workers. DQS findings are “analyzed, strengths and weaknesses identified, conclusions reached and practical recommendations made”, with recommendations aimed at strengthening health workers’ (and other health stakeholders’) use of accurate, timely, and complete data for action at all levels. In addition to WHO DQS guidelines, guidelines on Routine Data Quality Assessment (RDQA) were developed by MEASURE Evaluation in 20083 which break the DQS process down into two main steps: (1) health information system assessment and (2) health data verification. Each of these items is described briefly below:
1. Health information system assessment: This involves the assessment of the data management system from health facility to provincial levels, in order to ascertain whether the system conforms to accepted data quality standards.
2. Health data verification: This
involves assessors tracking given data of interest back to their original source documents, confirming that source/supporting documentation is available, and comparing reported data to source data in order to check for accuracy of reporting (see Figure 2). “Verification factors” were then calculated based on what was recounted during the DQS relative to what was originally reported by health workers/information managers.
In addition to these two steps, the DQS process should be concluded with development of action plans based on DQS findings, given that findings are only useful if they result in stakeholder reflection and development of a plan of actionable items aimed at improving identified gaps.
2 WHO, 2005. “The immunization data quality self-assessment (DQS) tool”, available at: www.who.int/vaccines-
documents/ 3 MEASURE Evaluation, 2008. “Routine Data Quality Assessment (RDQA) Tool, Guidelines for Implementation for HIV,
TB & Malaria programmes”, available at: http://www.cpc.unc.edu/measure/tools/monitoring-evaluation-systems/data-quality-assurance-tools
Service Delivery Site 5
Monthly Report
ARV Nb. 50
Service Delivery Site 6
Monthly Report
ARV Nb. 200
Source Document 1
Source Document 1
District 1
Monthly Report
SDS 1 45
SDS 2 20
TOTAL 65
District 4
Monthly Report
SDP 5 50
SDP 6 200
TOTAL 250
District 3
Monthly Report
SDS 4 75
TOTAL 75
M&E Unit/National
Monthly Report
District 1 65
District 3 75
TOTAL 435
District 4 250
Service Delivery Site 3
Monthly Report
ARV Nb. 45
Source Document 1
Service Delivery Site 4
Monthly Report
ARV Nb. 75
Source Document 1
Service Delivery Site 1
Monthly Report
ARV Nb. 45
Source Document
1
Service Delivery Site 2
Monthly Report
ARV Nb. 20
Source Document 1
District 2
Monthly Report
SDS 3 45
TOTAL 45
District 2 45
Figure 2: Data verification procedure – data is traced from higher level reports back to original source documents to verify accuracy in reporting from one level to the next.

7
2. PROBLEM STATEMENT AND ASSESSMENT OBJECTIVES
Problem Statement The quality of data currently being collected in Manicaland and reported through the national health management information system (HMIS) is not well known or documented. Manicaland province has never specifically conducted a province-wide, comprehensive data quality self-assessment to ascertain the quality of its routine health data.
Assessment Question To what extent does the data currently being collected in Manicaland and reported through the HMIS meet data quality standards as defined by international DQS protocols4?
Assessment Objectives The broad objective of the DQS was to verify the quality of reported data in Manicaland for key selected maternal, newborn, and child health (MNCH, including immunization) indicators and to assess the ability of the HMIS to collect, manage, and report high quality data.
Specific objectives of the DQS were to:
1. Assess strengths and weakness of the HMIS data collection and reporting system as it is being implemented in Manicaland province,
2. Review the timeliness, completeness, and availability of health data collection tools and reports (specifically the T5 reporting form) at provincial, district, and health facility levels,
3. Verify consistency of select MNCH indicator data between levels of the HMIS, and 4. Make recommendations for HMIS strengthening that stakeholders can use to develop and
implement action plans in Manicaland.
3. METHODOLOGY Using the WHO DQS and MEASURE Evaluation RDQA methodology and tools as guides, in February-March 2013 the MOHCW/MCHIP conducted an integrated MNCH-focused DQS exercise in Manicaland comprised on two main steps: (1) a health information system assessment and (2) a health data verification activity as follows:
1. An assessment of the data management system at health facility, district, and provincial levels was carried out to determine the current skills, practices, and gaps associated with routine health data collection, compilation, reporting, and file storage and retrieval. This part of the DQS involved interviewing relevant data management focal persons about their knowledge and current practices related to health data management.
2. Data verification was carried out at health facility, district, and provincial levels and consisted of tracing monthly reported data back to original source documents and comparing data sets to determine their accuracy, reliability, and completeness.
The following section describes in more specific terms the DQS design, process, data collection tools, etc.
Site Selection The following sites were purposively selected to participate in the DQS:
the Manicaland Provincial Health Information Office,
all seven District Health Information Offices in Manicaland, and
4 MEASURE Evaluation, 2008. “Routine Data Quality Assessment (RDQA) Tool, Guidelines for Implementation for HIV,
TB & Malaria programmes”, available at: http://www.cpc.unc.edu/measure/tools/monitoring-evaluation-systems/data-quality-assurance-tools

8
21 health facilities in Manicaland (three from each of the seven districts), purposively selected based on the following criteria: one high volume site, one medium volume site, and one low volume site per district, excluding those facilities that were participating in a Pneumococcal Vaccine Post-Introduction Evaluation exercise taking place during the same time period as the DQS. (See Annex 1 for a list of health facilities assessed.)
Enumerators The DQS was conducted by a team of ten enumerators (see Annex 2 for list of enumerators) representing both MOHCW and MCHIP. MOHCW staff included the Manicaland Provincial Health Information Officer (PHIO), the Assistant PHIO, District Health Information Officers (DHIO) from Makoni and Chimanimani, and the Manicaland Vaccine Stores Manager. Three MCHIP staff also participated. Enumerators were divided into teams which were each responsible for conducting the DQS in their assigned sites (generally two districts per team). Enumerators were trained by MCHIP staff in DQS methodology over a period of two days prior to the start of field work.
Data Collection The DQS was designed as a descriptive cross-sectional study using both qualitative and quantitative methods. The period of review for the DQS covered routine health data collected from January to December 2012. The DQS involved reviewing and analyzing routine MNCH (including EPI) health data contained within:
primary data collection tools (i.e., T series forms, registers) from 21 health facilities (note that for the purpose of this exercise, only indicators that are subsequently reported to higher levels via the summary T5 were assessed),
summary T5 forms sent from health facilities to district health information offices as well as DHIS data at district level, and
DHIS data at provincial level. Qualitative assessment methods were also used to interview responsible staff/health workers at health facility, district, and provincial levels about health information systems and practices. See Annex 3 for a list of people interviewed.
Data Collection Tools At all three levels (health facility, district and province), two tools were used for data collection: (1) a checklist for assessing the quality of the data management system and (2) a data verification tool. The checklist for assessing the quality of the data management system served as a guide for interviews and discussions with data management/health information focal persons. The checklist was divided into two separate versions: (1) one specific to maternal, newborn, and child health and containing questions about five “quality system components”5 and (2) one specific to immunization containing six quality components. The quality system components assessed on the MNCH side were:
1. M&E structure, functions and capabilities: looking at the presence of designated staff responsible for reviewing HMIS reports prior to submission to the next level; whether these people have clearly defined roles and responsibilities; and whether they receive(d) any training in data management.
5 Quality components are mostly referred to as “criteria” or “dimensions”. These terms are normally used
synonymously.
Enumerators during DQS training.
9
2. Indicator definitions and reporting guidelines: looking at presence of written guidelines articulating what data is supposed to be reported on, to whom, how, and when.
3. Data collection and reporting forms and tools: looking at the presence of clear instructions on how to complete data collection and reporting forms/tools; use of standard reporting forms/tools; and the availability of reporting forms/tools.
4. Data management processes: looking at the presence of data management quality controls; presence of written backup procedures for computerized systems; and data storage practices (especially regarding maintaining data confidentiality).
5. Links with national reporting system: looking at the use of relevant national forms/tools at provincial/district level for data collection and reporting, and reporting using a single channel of the national information system.
The functionality6 of each quality system component was assessed at each assessment site and quality index scores (ranging from 0 to 3) were issued for each component. A score of “0” was assigned where a particular quality component was found to be “not applicable”; a score of “1” was assigned when the quality component was “not functional”; a score of “2” was assigned when a quality component was “partially functional”; and a score of “3” was assigned when a quality component was “fully functional”. For the EPI side, quality of system components assessed included7:
1. Recording: looking at the availability of T6 sheets for vaccinations; use of EPI registers; use of stock cards for vaccine management; ability of health workers to record vaccinations on the child health card; etc.
2. Reporting: looking at whether reports (T5 form) were correctly and completely filled in; whether forms have been stamped and/or signed by the nurse-in-charge; etc.
3. Archiving (paper-based and computerized): looking at the physical availability of reports (the T5); whether reports were being kept in one secured location; etc.
4. Demographics: looking at the availability of population data for a given catchment area; whether target population information was displayed; etc.
5. Core outputs/analysis: looking at a site’s ability to track immunization defaulters; availability of immunization monitoring charts, monthly charts/graphs of vaccine preventable diseases; etc.
6. Evidence of using data for action: looking at whether areas of low immunization access were being identified as well as evidence of relevant follow up actions; interaction of health facilities with their communities regarding immunization; etc.
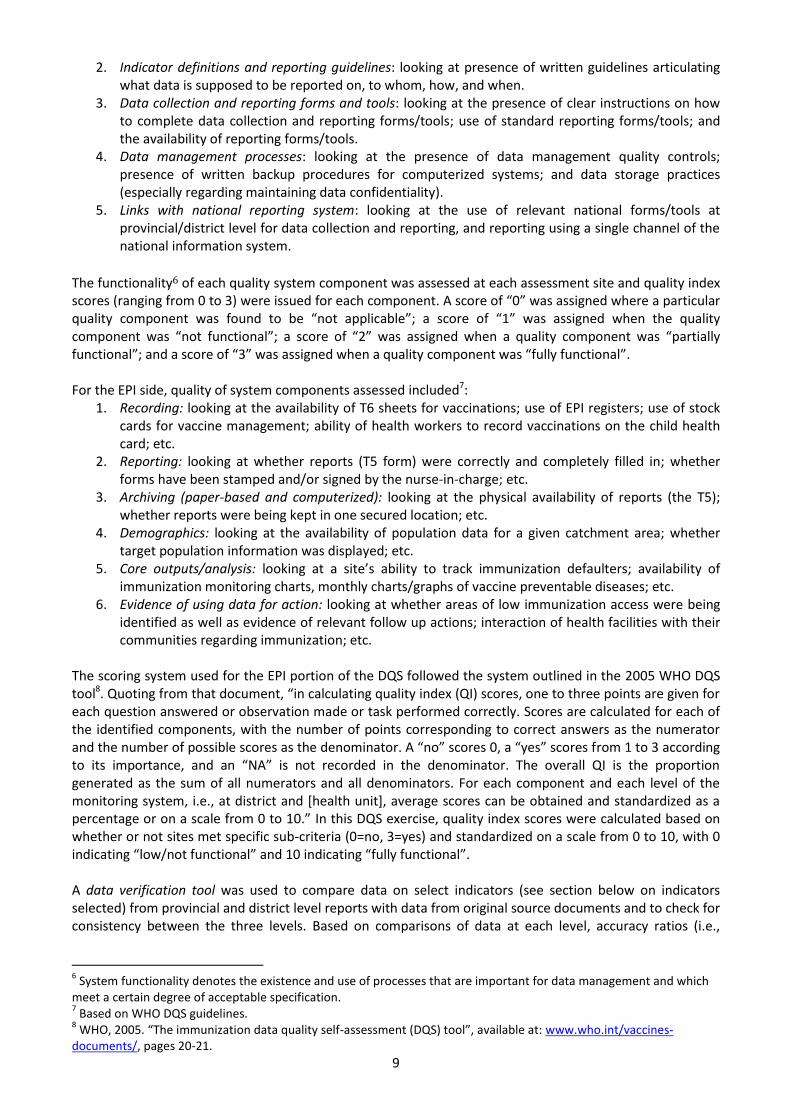
The scoring system used for the EPI portion of the DQS followed the system outlined in the 2005 WHO DQS tool8. Quoting from that document, “in calculating quality index (QI) scores, one to three points are given for each question answered or observation made or task performed correctly. Scores are calculated for each of the identified components, with the number of points corresponding to correct answers as the numerator and the number of possible scores as the denominator. A “no” scores 0, a “yes” scores from 1 to 3 according to its importance, and an “NA” is not recorded in the denominator. The overall QI is the proportion generated as the sum of all numerators and all denominators. For each component and each level of the monitoring system, i.e., at district and [health unit], average scores can be obtained and standardized as a percentage or on a scale from 0 to 10.” In this DQS exercise, quality index scores were calculated based on whether or not sites met specific sub-criteria (0=no, 3=yes) and standardized on a scale from 0 to 10, with 0 indicating “low/not functional” and 10 indicating “fully functional”. A data verification tool was used to compare data on select indicators (see section below on indicators selected) from provincial and district level reports with data from original source documents and to check for consistency between the three levels. Based on comparisons of data at each level, accuracy ratios (i.e.,
6 System functionality denotes the existence and use of processes that are important for data management and which
meet a certain degree of acceptable specification. 7 Based on WHO DQS guidelines.
8 WHO, 2005. “The immunization data quality self-assessment (DQS) tool”, available at: www.who.int/vaccines-
documents/, pages 20-21.

10
verification factors) were calculated for each indicator. Verification factors indicate whether data for particular indicators is being over- or under-reported to the next level. At district level, enumerators compared data reported on the T5 by selected health facilities with data that was entered into the electronic database (DHIS) for those same facilities. The purpose of this was to: (1) assess whether DHIOs are accurately entering T5 data into the DHIS system, and (2) assess the extent to which select indicator data are being over- or under-reported to the next level (i.e., to the province). At provincial level, enumerators compared select indicator data in the PHIO’s electronic database (DHIS) with data for the same indicators reported in the DHIS at district level. The purpose of this was to: (1) assess whether data is being transmitted accurately from the districts to the province, and (2) assess the extent of transmission errors if present. See Annex 4 for data collection tools used in the DQS.
Indicators Selected for the DQS Six MNCH-related indicators were selected for assessment based on mutual MOHCW and MCHIP programmatic interest, as well as the impression that data quality for these particular indicators was somewhat erratic throughout 2012 (e.g., particularly data on ARI and malaria). The selected indicators were (primary data sources of the indicators are shown in brackets):
1. Number of pregnant women receiving first ANC (ANC register) 2. Number of institutional live births (delivery register) 3. Number of cases of malaria tested in children under 5 (T3) 4. Number of confirmed cases of malaria in children under 5 (T3) 5. Number of moderate ARI cases in children under 5 (T3) 6. Number of children less than 12 months who received Penta 3 vaccination (T6, EPI register)
Data Analysis Data was collected and entered into electronic DQS and RDQA templates by enumerators at the end of each day. Data analysis was then conducted using Excel and SPSS 16.0.
Action Plan Development While specific action plans were not developed at the time of DQS data collection, this report presents findings and recommendations that the MOHCW and MCHIP will use to develop action plans for provincial and district-level health information offices and health facilities in Manicaland.
4. FINDINGS
4.1 Quality of System Components As described above, the quality of system index (QSI) is a quantitative measure of the overall quality of a data management system, calculated as an aggregated mean score of all available quality indicators. On the MNCH side, scores (ranging from 0 to 3) were assigned for each of five quality components (M&E structure, functions and capabilities; indicator definitions and reporting guidelines; data collection and reporting forms/tools; data management processes; and links with the national reporting system) based on whether sites met specific standards under each component. See Figure 3 below for an example of index scores for the quality components related to MNCH systems and Table 1 for the standards or sub-elements that comprise the index scores. Also see Annex 5 for index scores for all sites assessed and Annex 6 for sub-element scores for all District Health Information Offices. On the EPI side, scores (ranging from 0 to 10) were assigned for each of seven quality components (recording; reporting; paper-based archiving; computerized archiving; demographics; core outputs/analysis; and evidence of using data for action), again based on pre-determined sub-criteria (see Annex 4 – Tools 3a and 3b – for specific sub-criteria). See Annex 7 for QSI scores in this area for all sites assessed as well as Annex 8 and 9 for details about site performance in achieving specific sub-criteria).

11
4.1.1 Quality of system components: provincial level
Figure 3 shows scores for the five quality components of the data management system at Manicaland provincial level (PHIO office), using the MNCH DQS tool. Figure 3: Quality assessment scores for the provincial level data management system (using the MNCH DQS tool)
(NB: “0”=quality component was “not applicable”; “1”=quality component was “not functional”; “2”=quality component was “partially functional”; “3”=quality component was “fully functional”.)
The Provincial Health Information Office scored well in terms of having fully functional M&E structure, functions and capabilities; data collection and reporting forms/tools; and links with the national HMIS reporting system (see Table 1 for specific sub-criteria met under each of these categories). In the area of data management processes, the provincial level met all sub-criteria except having a written procedure to address late, incomplete, inaccurate and missing reports as well as following-up with service points on data quality issues. The most problematic area at provincial level was that related to indicator definitions and reporting guidelines (scoring a 1 out of 3 in this area, i.e., “not functional”). Under this area, the provincial office was found to be lacking in written guidelines from the national level regarding what the provincial level is supposed to report on, how data is supposed to be reported, to whom reports should be submitted, and when reports are due to the national level (see Table 1). Table 1: Quality assessment findings for the provincial level data management system (specific sub-criteria using the MNCH DQS tool)
Part 2. Systems Assessment
I - M&E Structure, Functions and Capabilities DQS
finding Comments
1 There are designated staff responsible for reviewing the quality of data (i.e., accuracy, completeness and timeliness) received from sub-reporting levels (e.g., service points).
Yes - completely
HIO and assistant
2 There are designated staff responsible for reviewing aggregated numbers prior to submission to the next level (e.g., to the central M&E Unit).
Yes - completely
3 All relevant staff have received training on the data management processes and tools.
Yes - completely
II- Indicator Definitions and Reporting Guidelines DQS
finding Comments
The M&E Unit has provided written guidelines to each sub-reporting level on …
4 ...what they are supposed to report on. No - not at
all No written guidelines
5 … how (e.g., in what specific format) reports are to be submitted.
No - not at all
6 … to whom the reports should be submitted. No - not at
3.00
1.00
3.00 2.71
3.00 0
1
2
3
M&E Structure, Functions and
Capabilities
IndicatorDefinitions
and ReportingGuidelines
Data-collection and Reporting Forms / Tools
DataManagement
Processes
Links with National Reporting
System

12
all
7 … when the reports are due. No - not at
all
III- Data-collection and Reporting Forms/Tools DQS
finding Comments
8 Clear instructions have been provided by the M&E Unit on how to complete the data collection and reporting forms/tools.
Yes - completely
DHIS manual
9 The M&E Unit has identified standard reporting forms/tools to be used by all reporting levels
Yes - completely
DHIS
10 The standard forms/tools are consistently used by the Service Delivery Site.
Yes - completely
11 All source documents and reporting forms relevant for measuring the indicator(s) are available for auditing purposes (including dated print-outs in case of computerized system).
Yes - completely
DHIS – electronic
IV- Data Management Processes DQS
finding Comments
12 Feedback is systematically provided to all service points on the quality of their reporting (i.e., accuracy, completeness and timeliness).
Yes - completely
Completeness on submitted data sent to the districts regularly quarterly by email
13 If applicable, there are quality controls in place for when data from paper-based forms are entered into a computer (e.g., double entry, post-data entry verification, etc).
Yes - completely
Use DHIS
14 If applicable, there is a written back-up procedure for when data entry or data processing is computerized.
Yes - completely
DHIS manual
15 If yes, the latest date of back-up is appropriate given the frequency of update of the computerized system (e.g., back-ups are weekly or monthly).
Yes - completely
First week of February
16 Relevant personal data are maintained according to national or international confidentiality guidelines.
Yes - completely
Password and access to the database is restricted
17
The recording and reporting system avoids double counting people within and across Service Delivery Points (e.g., a person receiving the same service twice in a reporting period, a person registered as receiving the same service in two different locations, etc).
Yes - completely
18 There is a written procedure to address late, incomplete, inaccurate and missing reports; including following-up with service points on data quality issues.
No - not at all
V - Links with National Reporting System DQS
finding Comments
19 When applicable, the data are reported through a single channel of the national reporting system.
Yes - completely
DHIS
20 When available, the relevant national forms/tools are used for data-collection and reporting.
Yes - completely
DHIS
21 The system records information about where the service is delivered (i.e. region, district, ward, etc.)
Yes - completely
22 ….if yes, place names are recorded using standardized naming conventions.
Yes - completely
Figure 4 shows scores for the quality components of the data management system at Manicaland provincial level (PHIO office), using the EPI DQS tool to evaluate EPI-related components of the HMIS system. Figure 4: Quality assessment scores for the provincial level data management system (using the EPI DQS tool)

13
(NB: scores are on a scale of 0 to 10, with “0”= low/not functional to “10” = fully functional.)
The Provincial Health Information Office was found to have robust computerised archiving and recording capacities but weaker systems in the areas of demographics, reporting, core outputs/analysis, and data use. Noted were delays in submission of reports from the districts to the province, for example incomplete report submissions for December 2012 (see Annex 8 for specific details). In terms of core outputs, the province did not have EPI targets that are split by strategy (i.e., fixed site versus mobile outreach). Also, there was no monthly graph or line list for monitoring measles cases, which would facilitate better monitoring of areas of low measles vaccine coverage and enable follow up action. In terms of data use, reasons behind high Penta1-Penta 3 drop-out rates have not been identified or documented at provincial level.
4.1.2 Quality of system components: district level
Figure 5 shows aggregate (average) scores for the five quality components of the data management system for all seven Manicaland District Health Information Offices using the MNCH DQS tool. Figure 5: Quality assessment scores for the district level data management system using the MNCH DQS tool (mean scores from 7 districts)
(NB: “0”=quality component was “not applicable”; “1”=quality component was “not functional”; “2”=quality component was “partially functional”; “3”=quality component was “fully functional”.)
6.67
8.33
3.64
5.16 5.56
10.00
10.00
-
2
4
6
8
10Demographics
Archiving(paper based)
Reporting
Core outputsData use
Recording
ComputerisedArchiving
2.86
1.36
2.44 2.06
3.00
0
1
2
3
M&E Structure, Functions and
Capabilities
IndicatorDefinitions
and ReportingGuidelines
Data-collection and Reporting Forms / Tools
DataManagement
Processes
Links with NationalReporting
System
14
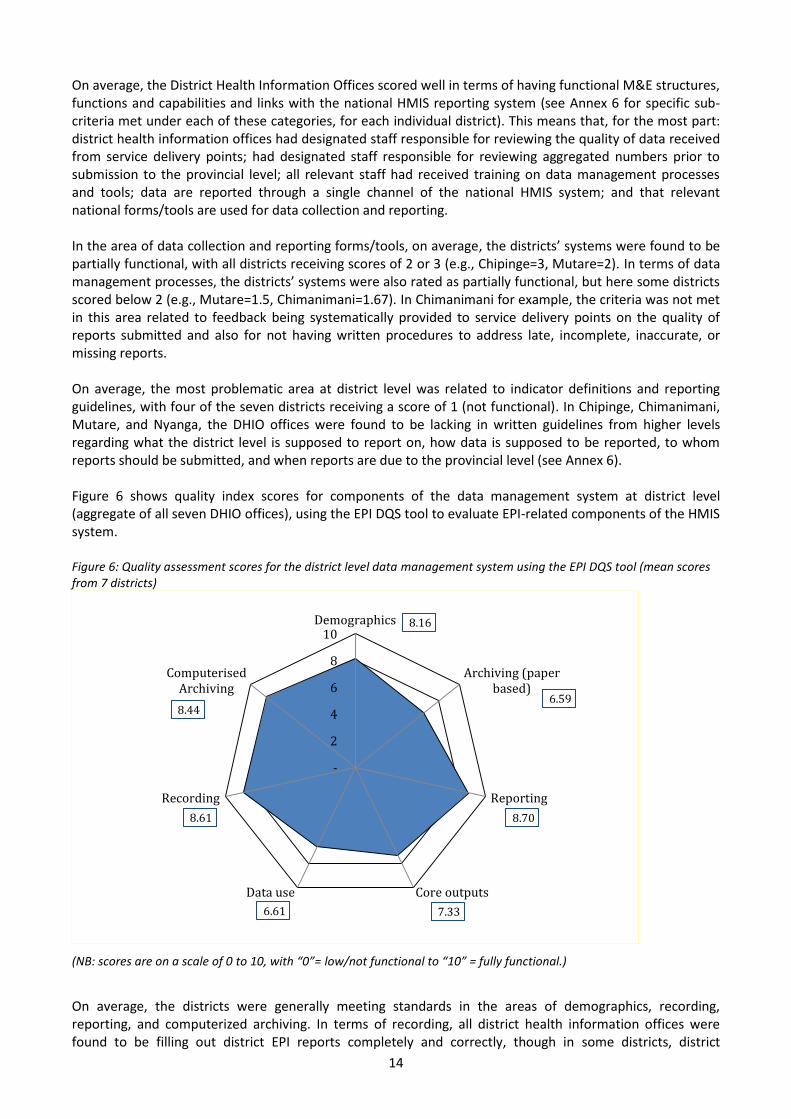
On average, the District Health Information Offices scored well in terms of having functional M&E structures, functions and capabilities and links with the national HMIS reporting system (see Annex 6 for specific sub-criteria met under each of these categories, for each individual district). This means that, for the most part: district health information offices had designated staff responsible for reviewing the quality of data received from service delivery points; had designated staff responsible for reviewing aggregated numbers prior to submission to the provincial level; all relevant staff had received training on data management processes and tools; data are reported through a single channel of the national HMIS system; and that relevant national forms/tools are used for data collection and reporting. In the area of data collection and reporting forms/tools, on average, the districts’ systems were found to be partially functional, with all districts receiving scores of 2 or 3 (e.g., Chipinge=3, Mutare=2). In terms of data management processes, the districts’ systems were also rated as partially functional, but here some districts scored below 2 (e.g., Mutare=1.5, Chimanimani=1.67). In Chimanimani for example, the criteria was not met in this area related to feedback being systematically provided to service delivery points on the quality of reports submitted and also for not having written procedures to address late, incomplete, inaccurate, or missing reports. On average, the most problematic area at district level was related to indicator definitions and reporting guidelines, with four of the seven districts receiving a score of 1 (not functional). In Chipinge, Chimanimani, Mutare, and Nyanga, the DHIO offices were found to be lacking in written guidelines from higher levels regarding what the district level is supposed to report on, how data is supposed to be reported, to whom reports should be submitted, and when reports are due to the provincial level (see Annex 6). Figure 6 shows quality index scores for components of the data management system at district level (aggregate of all seven DHIO offices), using the EPI DQS tool to evaluate EPI-related components of the HMIS system. Figure 6: Quality assessment scores for the district level data management system using the EPI DQS tool (mean scores from 7 districts)
(NB: scores are on a scale of 0 to 10, with “0”= low/not functional to “10” = fully functional.)
On average, the districts were generally meeting standards in the areas of demographics, recording, reporting, and computerized archiving. In terms of recording, all district health information offices were found to be filling out district EPI reports completely and correctly, though in some districts, district
8.16
6.59
8.70
7.33 6.61
8.61
8.44
-
2
4
6
8
10Demographics
Archiving (paperbased)
Reporting
Core outputsData use
Recording
ComputerisedArchiving

15
managers were found not to know the annual vaccine requirements for their district, did not have up to date logs for tracking syringe supply and delivery to HFs, and staff were not aware of standard operating procedures for recording a severe adverse event following immunization (see Annex 8 for results by district). In the area of paper-based archiving, copies of all district reports (that were sent to more central levels) could be found on the day of the assessment, but in only one out of seven district offices had all HF data from the previous month been processed at the time of the DQS. District offices performed better in the area of computerized archiving, with all offices able to produce official immunization tabulations for the previous year from electronically archived information. In terms of core outputs and analysis, all district offices except one had a chart/table of immunization coverage (monitoring chart) for the current year at the time of the assessment; all districts except one was recording and monitoring the completeness of immunization reporting from HF level; all districts except one was monitoring HF/district vaccine wastage; and all districts met the criteria for monitoring the immunization drop-out rate. However only four of seven districts were found to be graphing/tracking the incidence of vaccine-preventable diseases by month. Finally, in terms of using data for action, four of seven districts were found to be analyzing HF data regularly with HF staff and six of seven districts met the criteria for monitoring HF vaccine stock outs. In contrast, only two of seven districts send regular monthly written feedback to HFs and six of seven districts report having problems with completeness and timeliness of HF reports.
4.1.3 Quality of system components: health facility level
Figure 7 shows aggregate (average) scores for the five quality components of the data management system for all 21 health facilities assessed using the MNCH DQS tool. Figure 7: Quality assessment scores for the HF level data management system using the MNCH DQS tool (mean scores from 21 health facilities)
(NB: “0”=quality component was “not applicable”; “1”=quality component was “not functional”; “2”=quality component was “partially functional”; “3”=quality component was “fully functional”.)
On average, the 21 HF assessed had strong links with the national reporting system (see Annex 5 for individual HF scores in each of the component areas). HFs assessed generally had strong M&E structures, functions, and capabilities (i.e., had someone dedicated to reviewing aggregated data (T5) prior to submission to the district level, had someone responsible for recording data in registers/tally sheets, etc.).
2.62
1.24
2.68
2.24
2.98 0
1
2
3
M&EStructure,
Functions andCapabilities
IndicatorDefinitions
and ReportingGuidelines
Data-collection
and Reporting Forms / Tools
DataManagement
Processes
Links with NationalReporting
System

16
For example, bigger hospitals like Regina, Hauna, St. Peters, and Murambinda currently have health information clerks onsite who work closely with the hospital matrons in ensuring that the T5s submitted to district level are clearly reviewed prior to submission. Even so, only 7 of 21 HFs (33%) stated that all relevant staff had received training on data management processes and tools (e.g., HFs said that only one of two nurses had been trained, only the Nurse in Charge had been trained, etc.), and other HFs mentioned that relevant staff lack clear terms of references regarding managing data. In terms of indicator definitions and reporting guidelines, the majority of HFs were lacking in this area, with 15 of 21 HFs (71%) lacking in written guidelines regarding what the HF level is supposed to report on, how data is supposed to be reported, to whom reports should be submitted, and when reports are due to the district level. As a result, it was noted that HFs have developed their own (ad hoc) guidelines in terms of reporting deadlines and data flow (i.e., to whom reports are supposed to be submitted). In terms of data collection and reporting forms/tools, most HFs had and were using standard reporting forms/tools (NB: the T12 was not included in the list of standardized forms/tools though the lack of a standardized T12 was noted), but 14 of 21 (67%) said that they either did not have or only had partial instructions on how to complete data collection and reporting forms/tools. Regarding data management processes, the majority of HFs were found to be “partially functional” in this area, but two common problems identified were: 6 of 21 HFs (29%) were not maintaining patients’ personal data according to national or international confidentiality guidelines, and 8 of 21 HFs (38%) were not recording and/or reporting data in such a way as to avoid “double counting people within and across service delivery points (e.g., a person receiving the same service twice in a reporting period, a person registered as receiving the same service in two different locations, etc)”. Figure 8 shows quality index scores for components of the data management system at HF level (aggregate of all 21 HFs assessed), using the EPI DQS tool to evaluate EPI-related components of the HMIS system. Figure 8: Quality assessment scores for the HF level data management system using the EPI DQS tool (mean scores from 7 districts)
(NB: scores are on a scale of 0 to 10, with “0”= low/not functional to “10” = fully functional.)
On average, the 21 HFs assessed were strongest in the recording component, with 19 of 21 sites (90%) using registers for recording individual information about child immunizations; 20 of 21 sites (95%) using registers for recording individual information about women’s tetanus toxoid immunizations; and 18 of 20 sites (90%) having tally sheets for infant vaccinations easily available and having entries for the previous immunization day (see Annex 9 for results by HF). However, six of 21 sites (29%) did not have up to date stock cards/ledgers for all vaccines on the day of the assessment; five of 21 sites (24%) did not have vaccine receipt ledgers that were complete for the whole year; and seven of 21 sites (33%) do not record vaccine
6.61
6.74
6.22
6.69
7.25
7.92
-
2
4
6
8
10Demographics
Archiving
Reporting
Core outputs
Data use
Recording
17
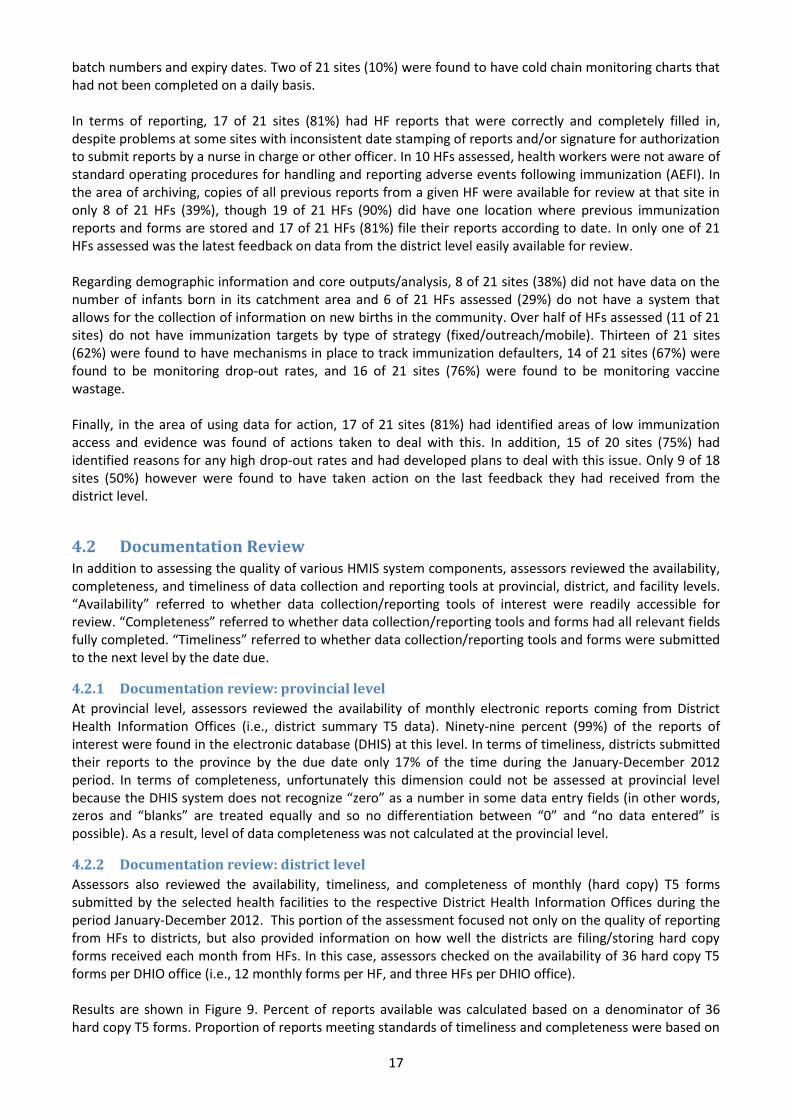
batch numbers and expiry dates. Two of 21 sites (10%) were found to have cold chain monitoring charts that had not been completed on a daily basis. In terms of reporting, 17 of 21 sites (81%) had HF reports that were correctly and completely filled in, despite problems at some sites with inconsistent date stamping of reports and/or signature for authorization to submit reports by a nurse in charge or other officer. In 10 HFs assessed, health workers were not aware of standard operating procedures for handling and reporting adverse events following immunization (AEFI). In the area of archiving, copies of all previous reports from a given HF were available for review at that site in only 8 of 21 HFs (39%), though 19 of 21 HFs (90%) did have one location where previous immunization reports and forms are stored and 17 of 21 HFs (81%) file their reports according to date. In only one of 21 HFs assessed was the latest feedback on data from the district level easily available for review. Regarding demographic information and core outputs/analysis, 8 of 21 sites (38%) did not have data on the number of infants born in its catchment area and 6 of 21 HFs assessed (29%) do not have a system that allows for the collection of information on new births in the community. Over half of HFs assessed (11 of 21 sites) do not have immunization targets by type of strategy (fixed/outreach/mobile). Thirteen of 21 sites (62%) were found to have mechanisms in place to track immunization defaulters, 14 of 21 sites (67%) were found to be monitoring drop-out rates, and 16 of 21 sites (76%) were found to be monitoring vaccine wastage. Finally, in the area of using data for action, 17 of 21 sites (81%) had identified areas of low immunization access and evidence was found of actions taken to deal with this. In addition, 15 of 20 sites (75%) had identified reasons for any high drop-out rates and had developed plans to deal with this issue. Only 9 of 18 sites (50%) however were found to have taken action on the last feedback they had received from the district level.
4.2 Documentation Review In addition to assessing the quality of various HMIS system components, assessors reviewed the availability, completeness, and timeliness of data collection and reporting tools at provincial, district, and facility levels. “Availability” referred to whether data collection/reporting tools of interest were readily accessible for review. “Completeness” referred to whether data collection/reporting tools and forms had all relevant fields fully completed. “Timeliness” referred to whether data collection/reporting tools and forms were submitted to the next level by the date due.
4.2.1 Documentation review: provincial level
At provincial level, assessors reviewed the availability of monthly electronic reports coming from District Health Information Offices (i.e., district summary T5 data). Ninety-nine percent (99%) of the reports of interest were found in the electronic database (DHIS) at this level. In terms of timeliness, districts submitted their reports to the province by the due date only 17% of the time during the January-December 2012 period. In terms of completeness, unfortunately this dimension could not be assessed at provincial level because the DHIS system does not recognize “zero” as a number in some data entry fields (in other words, zeros and “blanks” are treated equally and so no differentiation between “0” and “no data entered” is possible). As a result, level of data completeness was not calculated at the provincial level.
4.2.2 Documentation review: district level
Assessors also reviewed the availability, timeliness, and completeness of monthly (hard copy) T5 forms submitted by the selected health facilities to the respective District Health Information Offices during the period January-December 2012. This portion of the assessment focused not only on the quality of reporting from HFs to districts, but also provided information on how well the districts are filing/storing hard copy forms received each month from HFs. In this case, assessors checked on the availability of 36 hard copy T5 forms per DHIO office (i.e., 12 monthly forms per HF, and three HFs per DHIO office). Results are shown in Figure 9. Percent of reports available was calculated based on a denominator of 36 hard copy T5 forms. Proportion of reports meeting standards of timeliness and completeness were based on

18
the action number of T5 forms available (in other words, the denominator used to calculate timeliness and completeness was the number of reports physically found on site at the time of assessment). Figure 9: Availability, timeliness, and completeness of reporting to District Health Information Offices (n = monthly T5 forms from 21 health facilities, 3 HFs per district)
Overall, 96% of the T5 reports submitted by the 21 health facilities were located at the district offices. Of these, 79% were submitted on time and 90% were complete. Some districts (HFs and/or DHIO offices) were performing better than others however, particularly in the areas of timeliness and completeness. For example, all 36 monthly T5s from selected HFs in Chipinge were available at the DHIO office on the day of the assessment. Of these 36 reports, all were submitted on time and were complete (the fields on the T5 were completely filled in). In Buhera on the other hand, only 31 of 36 T5 reports (86%) were available on the day of the assessment, and of these, only 54.8% had been submitted to the district office on time (though reports submitted were filled in completely). In Makoni, the T5 submission tracking sheet used at the DHIO office had not been completed from September to December 2012, and consequently the timeliness variable could only be calculated for the period January-August 2012.
4.2.3 Documentation review: health facility
level
At facility level, enumerators assessed the physical availability and completeness of source documents (ANC register, delivery register, EPI register, and T3 tally sheet) containing data on the six selected MNCH/EPI indicators. Results are shown in Figure 10. As at district level, completeness of documentation was only assessed for actual documents available at the time of the assessment.
86
.1%
10
0.0
%
10
0.0
%
91
.7%
97
.2%
10
0.0
%
94
.4%
54
.8%
75
.0%
10
0.0
%
82
.3%
68
.6%
80
.6%
94
.1%
10
0.0
%
10
0.0
%
10
0.0
%
61
.0%
10
0.0
%
10
0.0
%
67
.6%
0%
20%
40%
60%
80%
100%
120%
%
Availability Timeliness Completeness
Assessors conducting the DQS at Buhera Rural Hospital.

19
Figure 10: Availability of source documents in 21Manicaland HFs and completeness of data in source documents found (n=21 HFs assessed)
Source documents covering all or part of the period under review were missing for all indicators assessed, though problems were greater for tally sheets than for registers. ANC registers covering the period January-December 2012 were only found in 81% (17 of 21) facilities visited and only 86% of HFs had 2012 delivery registers available. Likewise, only 57% of HFs assessed could produce original source documents (i.e., the T3) for 2012 related to malaria and only 43% of HFs had all 2012 T3s where moderate cases of ARI in children <5 were tallied (NB: the T3 is used to tally both malaria and ARI cases, but ARI cases are more common and thus health workers sometimes use ad hoc forms to continue tallying ARI cases). Ninety-five percent of HFs assessed were able to produce EPI registers covering the period Jan-Dec 2012. In terms of completeness, available ANC and delivery registers were found to be more complete than T3 tally sheets found on the day of the assessment. Common reasons tally sheets were deemed incomplete included failing to record dates and in some cases putting tallies but not indicating totals (see photo below). Concerns about low levels of completeness on the T3 forms is compounded by the fact that completeness as shown above was only calculated for reports available on the day of the assessment; it could not be determined at HF level how complete/incomplete data was on reports that have gone missing since 2012.
Regarding the EPI register, of the 20 HFs with a 2012 register available on the day of the assessment, in only 14% of cases (3 of 21 HFs) was the EPI register filled out completely for the period under review.
4.3 Data Verifications Finally, data verification exercises were conducted at all three levels. At provincial level, comparisons were made between indicator data in the electronic database at the Provincial Health Information Office for the selected 21 health facilities and data for the same HFs/indicators in the district level’s electronic database. At district level, indicator data in their electronic database for the selected HFs was then compared with data from original hard copy T5 forms from the selected HFs. At HF level, assessors compared indicator data from
81% 86%
57% 57%
43%
95%
76% 81%
62% 67% 67%
14%
0%10%20%30%40%50%60%70%80%90%
100%
Number ofpregnant women
receiving firstANC
Number ofinstitutional live
births
Number ofsuspected casesof malaria tested
in Children <5
Number ofconfirmed cases
of malaria inchildren <5
Number of casesof moderate ARI
in children<5
Number ofchildren < 1 year
who receivedPenta 3
% o
f H
ealt
h F
acili
ties
Available Complete
No Serial
number and
date

20
primary data collection tools (registers, tally sheets) with data on summary T5 forms found at each facility. The results of these data verifications are shown below.
4.3.1 Data verification: provincial level
Data verification was done at provincial level comparing what was in the DHIS at that level with what was in the DHIS at district level for the selected indicators and health facilities. “Verification factors” (VF) were
calculated thusly: VF =
, based on data from the 21 selected health
facilities. Data for the selected EPI indicator was not compared at this level. Verification factors (VF) calculated for this level should be interpreted as follows:
100%: complete match, i.e., indicator data in the DHIS at provincial level matched completely corresponding indicator data in the DHIS at district level for the selected health facilities.
Less than 100%: data did not match; indicator data in the DHIS at provincial level was higher than corresponding indicator data in the DHIS at district level for the selected health facilities. When reporting to the national level, a VF <100% indicates that data is being over-reported.
More than 100%: data did not match; indicator data in the DHIS at provincial level was lower than corresponding indicator data in the DHIS at district level for the selected health facilities. When reporting to the national level, a VF >100% indicates that data is being under-reported.
Figure 11 shows results of the data verification at provincial level. In only one case (number of pregnant women receiving first ANC) did provincial level data match exactly the data being stored at district level. In the case of number of confirmed cases of malaria in children <5 and number of cases of moderate ARI in children <5, data at provincial level was lower than data at district level for these two indicators, meaning that when reported to national level, the province under-reported this data. In the case of suspected cases of malaria tested in children <5, the province would have slightly over-reported data to the national level. The biggest gap in accuracy found between data at the two levels was in regards to number of institutional live births (VF=60%). According to the DHIS at district level, a total of 8,399 live births were recorded for the selected 21 HFs for 2012. However, at provincial level, a total of 14,110 live births were recorded, giving a VF
of
.
Figure 11: Data verification factors at provincial level (provincial data relative to district data)
4.3.2 Data verification: district level
VFs were calculated at this level by dividing indicator data from monthly summary T5 forms submitted to the districts by indicator data from the district DHIS, for the 21 selected health facilities, i.e.,
VFs=
.
100%
60%
98% 103% 101%
0%
20%
40%
60%
80%
100%
120%
Number of pregnantwomen receiving first
ANC
Number of institutionallive births
Number of suspectedcases of malaria tested in
Children <5
Number of confirmedcases of malaria in
children <5
Number of cases ofmoderate ARI in
children<5
Ver
ific
atio
n F
acto
r(%
)

21
VFs at this level should be interpreted as follows:
100%: complete match, i.e., indicator data in the DHIS at district level matched completely corresponding indicator data in the T5s from the selected health facilities.
Less than 100%: data did not match; indicator data in the DHIS at district level was higher than corresponding indicator data from the T5s for the selected health facilities. When reporting to the provincial level, a VF <100% indicates that data is being over-reported by the district.
More than 100%: data did not match; indicator data in the DHIS at district level was lower than data from the T5s for the selected health facilities. When reporting to the provincial level, a VF >100% indicates that data is being under-reported by the district.
Figure 12 shows results of the data verification at district level. For the most part, accuracy of data between district and HF levels was reasonably strong, with few major problems detected for the period under review in Chimanimani, Mutare, Mutasa, and Nyanga. In Chipinge, problems were found with both over- and under-reporting of most indicators. In Buhera and Makoni, large problems were found with both over- and under-reporting of all indicators to the provincial level. In Buhera in particular, there was a very large difference between what was reported on T5s in 2012 for the number of suspected cases of malaria tested in children <5 (41 cases), versus what was recorded in the district DHIS for this same indicator (103 cases). These figures
result in a VF for this indicator of
. These figures indicate that Buhera district significantly over-
reported data on this indicator to the provincial level. In Makoni on the other hand, the total number of pregnant women receiving first ANC was 1,344 as reported through the T5s, versus 1,059 as recorded in the
district DHIS. The VF given these figures is
, indicating that Makoni district significantly under-
reported this data to the provincial level. Figure 12: Data verification factors at district level (district data relative to HF data)
4.3.3 Data verification: health facility level
Data verification was done within all 21 selected health facilities as well. Verification factors were calculated by dividing figures from primary data sources like ANC registers, delivery registers, and tally sheets by figures for the same indicators from the HFs’ summary T5 forms ( i.e., VFs= ( )
( ) ). Where summary T5s could not be located at the
facility, copies of the same T5s were located at district level and referenced.
96
%
10
0%
10
6%
12
7%
10
1%
10
0%
10
2%
99
%
10
0%
10
6%
12
0%
99
%
10
0%
10
1%
40
%
10
0%
10
7%
90
% 10
2%
10
0%
10
2%
78
%
10
0%
10
3%
84
% 1
00
%
10
0%
10
2%
97
%
10
0%
10
0%
94
%
10
3%
10
0%
10
3%
10
0%
10
0%
93
%
12
2%
10
0%
10
0%
10
0%
0%
20%
40%
60%
80%
100%
120%
140%
Buhera Chimanimani Chipinge Makoni Mutare Mutasa Nyanga
Ver
ific
atio
n F
acto
r(%
)
Number of pregnant women receiving first ANC Number of institutional live births
Number of suspected cases of malaria tested in Children <5 Number of confirmed cases of malaria in children <5
Number of cases of moderate ARI in children<5 Number of children < 12 months of age who received penta 3

22
VFs at this level should be interpreted as follows:
100%: complete match, i.e., indicator data in primary data collection tools (registers or tally sheets) matched completely corresponding indicator data in the T5s.
Less than 100%: data did not match; indicator data in primary data collection tools (registers or tally sheets) was lower than corresponding indicator data in the T5s. When reporting to the district level, a VF <100% indicates that data is being over-reported by the HF.
More than 100%: data did not match; indicator data in primary data collection tools (registers or tally sheets) was higher than data in the T5s. When reporting to the district level, a VF >100% indicates that data is being under-reported by the HF.
Annex 10 shows specific verification factor scores, by health facility, for each selected MNCH indicator. Table 2 shows a summary of the percent of HFs achieving VFs of <91%, between 91-110%, and >110%, by indicator (note that the acceptable verification factor should lie between 91% and 110% according to international standards. Thus, in this case, ranges were used to denote high/low level of data accuracy, rather than strict cut offs of 100%, <100%, and >100%). Table 2: Summary of the percent of HFs achieving VFs of <91%, between 91-110%, and >110%, by indicator
Indicator % of health facilities achieving
VFs of less than 91%
(over-reporting)
VFs between 91-110%
(acceptable range)
VFs of more than 110%
(under-reporting)
Number of pregnant women receiving first ANC 9.5% 85.7% 4.8%
Number of institutional live births 5% 95% 0
Number of suspected cases of malaria in children <5 38.1% 47.6% 14.3%
Number of confirmed cases of malaria in children <5 28.6% 57.1% 14.3%
Number of cases of moderate ARI in children <5 28.6% 57.1% 14.3%
For number of pregnant women receiving first ANC, 86% (18 out of 21) of sampled facilities had verification factors between 91% and 110% (the acceptable range). For the number of institutional live births, 95% (20 out of 21) of facilities had VFs within the acceptable range. Around half of sampled health facilities had verification factors within the acceptable range for the child health indictors (malaria cases suspected, malaria cases confirmed, moderate ARI cases), indicating that this data was routinely over- or under-reported by HFs in 2012 (Table 2). In terms of specific HFs which had multiple VFs outside the acceptable range for 2012, Buhera Rural Health Center (RHC) over- or under-reported data for all five of the indicators during the 2012 period, and Chikukwa RHC, Tanganda RHC, Murambinda Hospital, Rusape General Hospital, and Weya Rural Hospital over- or under-reported data for three of the five health indicators over the course of 2012 (see Annex 10). For EPI, HF data on number of children <1 receiving Penta 3 was compared between multiple source documents (i.e., between the EPI register, T6 tally sheet, T5 summary form, and EPI monitoring charts) to check for accuracy in recording/reporting between documents. Since data from one document is used to complete the other documents (i.e., each child recorded on the T6 should also be recorded in the EPI register; data from the T6 should be aggregated at the end of each month and reported on the T5; data from the T5 should then be recorded on the EPI monitoring chart), in theory there should be no variability from one document to another (i.e., all figures should be the same). Figure 13 shows results of this part of the data verification activity, by district.

23
Figure 13: Comparison of data on # of children <1 receiving Penta 3, as reported/recorded in various EPI source documents in 2012, by district (data from 21 HFs)
Figure 13 shows significant variability in data recorded/reported in EPI source documents for 2012. If data accuracy for this indicator was high, each column within a district would be equal (or approximately equal) but as shown in this figure, within every district there are issues with consistency in recording/reporting EPI data in official documents. Specifically, use of EPI registers is clearly low in each district, indicating that some children are either left out of the register or their immunization histories are not recorded completely in the register.
5. DISCUSSION AND RECOMMENDATIONS
Discussion
At Provincial and District Level
As found in this DQS, Zimbabwe’s health information system is well developed and generally functioning, and provides some MNCH/EPI data which can be used for decision-making and program improvement purposes. In Manicaland, this DQS found that during the 2012 period, the PHIO and DHIO offices had functional M&E structures, functions and capabilities and strong links with the national HMIS reporting system. Despite this, there were also areas where need for improvements was noted. Major findings at all levels included a general lack of written standard guidelines and indicator definitions provided by the Health Information Unit at MoHCW head office to the province, districts and health facilities. These guidelines are very important in ensuring that compilation of data from source documents and reporting are based on sufficiently documented guidance. In addition, provincial/district levels were generally found to be lacking written procedures to address late, incomplete, inaccurate and/or missing reports, as well as clear guidance on responsibilities for follow-up with lower-level offices/HFs as it regards data quality issues. Perhaps because of this, the DQS found that at provincial and district levels, feedback mechanisms (i.e., feedback being systematically provided to service delivery points on the quality of reports submitted) were relatively weak and require strengthening. On the EPI side, districts were generally meeting standards in the areas of demographics, recording, reporting, and computerized archiving. All district health information offices were found to be filling out district EPI reports completely and correctly; all district offices except one had a chart/table of immunization coverage (monitoring chart) for the current year at the time of the assessment; all districts except one was recording and monitoring the completeness of immunization reporting from HF level; all districts except one was monitoring HF/district vaccine wastage; and all districts met the criteria for monitoring the immunization drop-out rate. In contrast, district managers in some districts were found not to know the
23
4 34
4
27
2
76
0
28
7
27
9
32
5
11
95
56
5
41
1
83
0 93
0
32
9
51
4
12
41
89
2
40
5
99
6
92
5
61
7
52
1
11
37
79
6
21
5
10
29
86
9
50
0
50
6
0
200
400
600
800
1000
1200
1400
Buhera Chimanimani Chipinge Makoni Mutare Mutasa Nyanga
Tota
l nu
mb
er o
f ch
ildre
n <
1 r
ecei
vin
g P
enta
3
Total from EPI registers Total from Tally Sheets (T6)
Total from monthly report (T5) Total from Monitoring Charts

24
annual vaccine requirements for their district, did not have up to date logs for tracking syringe supply and delivery to HFs, and staff were not aware of standard operating procedures for recording a severe adverse event following immunization. Other areas needing strengthening at district level included: only one out of seven district offices had all HF EPI data from the previous month processed at the time of the DQS; only four of seven districts were found to be graphing/tracking the incidence of vaccine-preventable diseases by month; only two of seven districts sent regular monthly written feedback to HFs; and six of seven districts reported having problems with completeness and timeliness of HF reports received. These are areas where additional training for DHIO staff (and HF staff) may be required. In terms of the availability, timeliness, and completeness of monthly electronic reports, availability (i.e., storage/filing) of reports at the PHIO/DHIO offices was not generally a problem, though timeliness was a challenge from district to province level (with districts only submitting their reports to the province by the due date 17% of the time during the January-December 2012 period). HFs performed better in terms of submission timeliness, with 79% of HF T5s found to have been submitted on time to the district offices. In terms of completeness, 90% of HF T5 forms were submitted complete to the districts. Finally, results of the data verification exercise at provincial and district levels indicate challenges with data accuracy/consistency between levels as well as over- or under-reporting health data to higher reporting levels. The biggest gap in data accuracy found between data at provincial/districts levels was in regards to number of institutional live births (VF=60%). According to the DHIS at district level, a total of 8,399 live births were recorded for the selected 21 HFs for 2012, compared to a total of 14,110 live births recorded at provincial level, indicating that this data was substantially over-reported to the national level. At district level, few major problems were detected for the period under review in Chimanimani, Mutare, Mutasa, and Nyanga. In Chipinge, Buhera, and Makoni however, problems were found with both over- and under-reporting of most HF indicator data to the provincial level. In Buhera for example, there was a very large difference between what was reported on T5s in 2012 for the number of suspected cases of malaria tested in children <5 (41 cases), versus what was recorded in the district DHIS for this same indicator (103 cases), indicating that Buhera district significantly over-reported this data to the provincial level. Possible reasons for data inaccuracy between provincial/district/HF levels include data entry errors (where data is incorrectly transcribed or entered into databases) or issues with loss/unavailability of source documents for data entry staff to refer to or validate data entries against. High levels of over- or under-reporting of routine health data is a serious issue, as errors occurring at one level are carried over by the next level (as well as potentially amplified further) and can result in national-level data that no longer reflects the real situation on the ground. If stakeholders then base their decision-making on faulty data, it is less likely that their anticipated results will be achieved.
At Health Facility Level
At HF level, training and sensitization of staff in HIS appears to be lacking, with only 7 of 21 HFs (33%) stating that all relevant staff had received training on data management processes and tools, and some HFs mentioning that relevant staff lack clear terms of references regarding managing data. Lack of clear roles and responsibilities may be associated with the general lack of written guidelines found regarding what HFs are supposed to report on, how data is supposed to be reported, to whom reports should be submitted, and when reports are due to the district level. It was noted in this DQS that as a result of this gap, some HFs have developed their own (ad hoc) guidelines in terms of reporting deadlines and data flow. While this response shows initiative and motivation on the part of these HFs, adopting ad hoc practices introduces unwanted variability into the HIS system. The DQS found issues in terms of the archiving/storage/filing of source documents at HF level, with documents missing for all or part of the period under review for all indicators assessed. Problems were greater for tally sheets than for registers, likely due the physical format of tally sheets (multiple individual pieces of paper) versus registers (one book which is used all year long). [Note that one HMIS tool that was not specifically included in this assessment but which was noted by assessors as being necessary is the T12 (Outpatient Department or OPD register). Currently the T12 is not standardized and thus HFs use counter
25
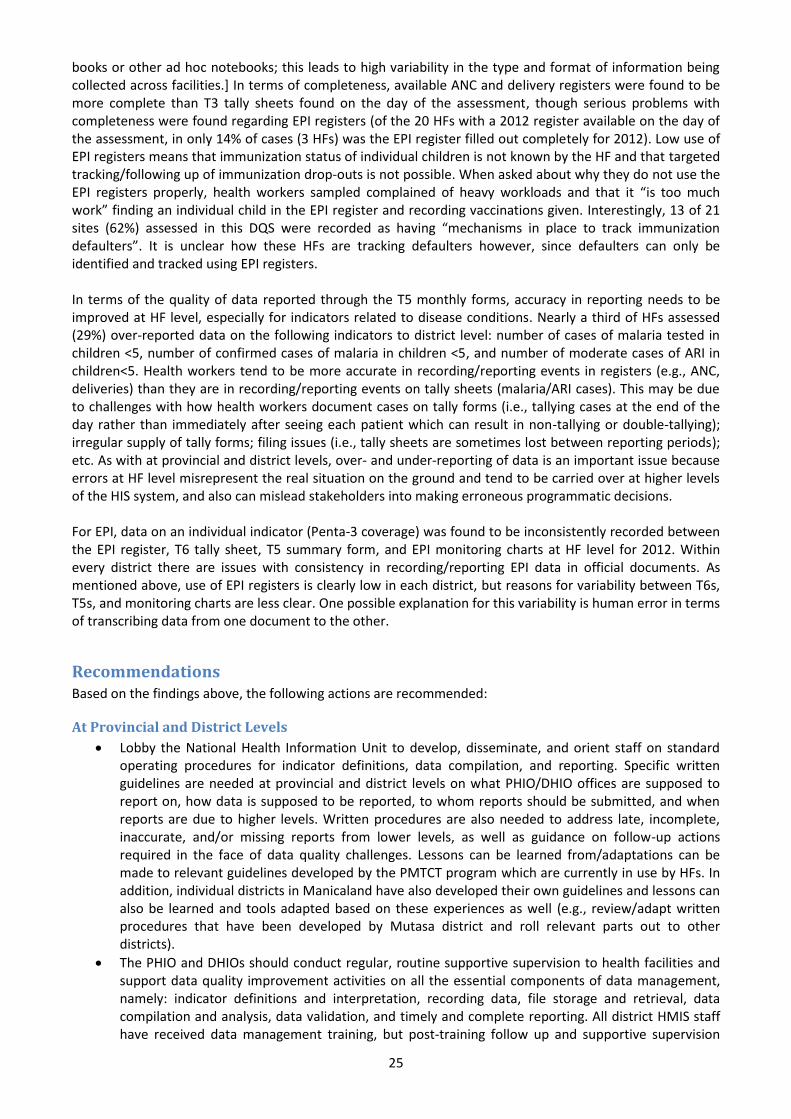
books or other ad hoc notebooks; this leads to high variability in the type and format of information being collected across facilities.] In terms of completeness, available ANC and delivery registers were found to be more complete than T3 tally sheets found on the day of the assessment, though serious problems with completeness were found regarding EPI registers (of the 20 HFs with a 2012 register available on the day of the assessment, in only 14% of cases (3 HFs) was the EPI register filled out completely for 2012). Low use of EPI registers means that immunization status of individual children is not known by the HF and that targeted tracking/following up of immunization drop-outs is not possible. When asked about why they do not use the EPI registers properly, health workers sampled complained of heavy workloads and that it “is too much work” finding an individual child in the EPI register and recording vaccinations given. Interestingly, 13 of 21 sites (62%) assessed in this DQS were recorded as having “mechanisms in place to track immunization defaulters”. It is unclear how these HFs are tracking defaulters however, since defaulters can only be identified and tracked using EPI registers. In terms of the quality of data reported through the T5 monthly forms, accuracy in reporting needs to be improved at HF level, especially for indicators related to disease conditions. Nearly a third of HFs assessed (29%) over-reported data on the following indicators to district level: number of cases of malaria tested in children <5, number of confirmed cases of malaria in children <5, and number of moderate cases of ARI in children<5. Health workers tend to be more accurate in recording/reporting events in registers (e.g., ANC, deliveries) than they are in recording/reporting events on tally sheets (malaria/ARI cases). This may be due to challenges with how health workers document cases on tally forms (i.e., tallying cases at the end of the day rather than immediately after seeing each patient which can result in non-tallying or double-tallying); irregular supply of tally forms; filing issues (i.e., tally sheets are sometimes lost between reporting periods); etc. As with at provincial and district levels, over- and under-reporting of data is an important issue because errors at HF level misrepresent the real situation on the ground and tend to be carried over at higher levels of the HIS system, and also can mislead stakeholders into making erroneous programmatic decisions. For EPI, data on an individual indicator (Penta-3 coverage) was found to be inconsistently recorded between the EPI register, T6 tally sheet, T5 summary form, and EPI monitoring charts at HF level for 2012. Within every district there are issues with consistency in recording/reporting EPI data in official documents. As mentioned above, use of EPI registers is clearly low in each district, but reasons for variability between T6s, T5s, and monitoring charts are less clear. One possible explanation for this variability is human error in terms of transcribing data from one document to the other.
Recommendations Based on the findings above, the following actions are recommended:
At Provincial and District Levels
Lobby the National Health Information Unit to develop, disseminate, and orient staff on standard operating procedures for indicator definitions, data compilation, and reporting. Specific written guidelines are needed at provincial and district levels on what PHIO/DHIO offices are supposed to report on, how data is supposed to be reported, to whom reports should be submitted, and when reports are due to higher levels. Written procedures are also needed to address late, incomplete, inaccurate, and/or missing reports from lower levels, as well as guidance on follow-up actions required in the face of data quality challenges. Lessons can be learned from/adaptations can be made to relevant guidelines developed by the PMTCT program which are currently in use by HFs. In addition, individual districts in Manicaland have also developed their own guidelines and lessons can also be learned and tools adapted based on these experiences as well (e.g., review/adapt written procedures that have been developed by Mutasa district and roll relevant parts out to other districts).
The PHIO and DHIOs should conduct regular, routine supportive supervision to health facilities and support data quality improvement activities on all the essential components of data management, namely: indicator definitions and interpretation, recording data, file storage and retrieval, data compilation and analysis, data validation, and timely and complete reporting. All district HMIS staff have received data management training, but post-training follow up and supportive supervision

26
need to be strengthened. Data quality improvement activities should focus on timely and participatory data reviews, discussion, feedback, action-planning and implementation, and active monitoring of progress on data improvement activities by the PHIO/DHIOs.
The PHIO and DHIOs should perform routine and detailed analyses of T5 reports submitted by HFs and provide constructive and immediate feedback in the form of written summaries. Monthly monitoring of T5 should include examining reports for completeness and timeliness, as well as analysis of trends in health data from month to month. Feedback between the province/districts and HFs should be timely, complete, and actionable; should flow in both directions; and progress in implementing follow up actions should be monitored closely.
Support strengthened and consistent use of the EPI register by health workers through sensitization and training (e.g. Immunization in Practice training), as well as through provision of regular review, feedback, and supportive supervision. EPI register data is critical for following up individual children and tracking immunization drop-outs; without EPI register data no targeted interventions or follow up actions can be initiated by the province/districts for reducing the number of unvaccinated children in Manicaland.
Routine data verification exercises led by the PHIO/DHIOs/HWs and data quality self-assessments (perhaps just focusing on one or two indicators as time allows) should be made a routine part of ongoing supportive supervision of all health workers delivering MNCH/EPI services.
Lastly, HIS program managers at national, provincial, and district levels should review closely the information included in this report in Annexes 5-10, and should formulate targeted action plans for each level of the health information chain. Information contained in the Annexes provide sufficient data to initiate focused discussions with stakeholders and to implement specific actions that will result in improvements to data availability, quality, and timeliness, and ultimately, to improved data use and decision-making.
At Health Facility Level
Health facility supervisors/managers should request specific HIS training for untrained staff and, when training opportunities arise, should send relevant and appropriate staff to training (i.e., avoid sending staff to training who do not have any data collection/management/reporting responsibilities). Health facility staff should also proactively request post-training follow up, supportive supervision, and on-the-job training/mentorship support from the DHIO/districts.
Health facility staff should conduct internal data quality verification exercises often, with technical support and supervision from the district if needed, in order to identify quality gaps and develop/implement interventions for data quality improvement.
Health facilities should adopt a system of: (a) summarizing data at the end of the clinic day to minimize the accumulation of files/tallies at the end of the month, and (b) assigning or sharing the responsibility of compiling data amongst team members (with a clear designation of role/responsibility and description of work to be done).
The Sister/Nurse in Charge should endorse all T5s submitted each month, reviewing for accuracy and completeness before signing off to the next level.
Health facilities should (with assistance from the districts and province), develop a storage policy and filling practices that allow easy retrieval of documents (data collection and reporting tools) for auditing purposes.
Facilities should ensure that the EPI register is utilized such that all children under one year old in the catchment area are registered in the facility EPI register. Village Health Workers can be used to help update the register for children vaccinated at outreach points.
Lastly, HIS program managers at provincial and district levels should work closely with relevant HF staff to review closely the information included in this report (especially in Annexes 5, 7, 9, and 10), and should formulate targeted action plans for each HF based on this information. There is sufficient data in the Annexes in this report to initiate focused discussions with relevant stakeholders and to implement specific actions that will result in improvements to data availability, quality, and timeliness at HF level, and ultimately, to improved data use and decision-making in HFs and beyond.

27
6. ANNEXES
Annex 1: Health Facilities Assessed Health Facility District
1. Murambinda Hospital Buhera
2. Buhera RHC Buhera
3. Berenyazvivi RHC Buhera
4. Rusitu Mission Hospital Chimanimani
5. Chikukwa RHC Chimanimani
6. Mutambara Mission Hospital Chimanimani
7. Manzvire RHC Chipinge
8. Tanganda RHC Chipinge
9. St Peters Mission Hospital Chipinge
10. Rusape General Hospital Makoni
11. Weya Rural Hospital Makoni
12. Chinyudze RHC Makoni
13. Marange Rural Hospital Mutare
14. Bezel bridge RHC Mutare
15. Chitakatira RHC Mutare
16. Tsonzo RHC Mutasa
17. Hauna Hospital Mutasa
18. Zongoro clinic Mutasa
19. Nyarumvurwe clinic Nyanga
20. Nyatate clinic Nyanga
21. Regina Mission Hospital Nyanga
Annex 2: List of Enumerators 1. Gibson Chikono PHIO (Manicaland) 2. Miriam Munzara (Shawatu) Assistant PHIO (Manicaland) 3. Rosah Musika Community Health Sister (Chimanimani) 4. Christine Jombo Vaccine Stores Manager (Manicaland) 5. Tawanda Mushore DHIO (Makoni) 6. George Muresherwa DHIO (Chimanimani) 7. Kumbirai Zvirahwa FCH Nurse (Nyanga) 8. Adelaide Shearley Immunization and Child Health Advisor(MCHIP) 9. Frank Chikhata M&E Officer (MCHIP) 10. Grant Nyasulu Immunization Coordinator (MCHIP)
Annex 3: List of People Interviewed Manicaland Province
G. Chikono PHIO
M. Shawatu PHIO Assistant Buhera District
J. Nyawo DNO
R. Muzhizhizhi Community Health Nurse
Mrs Mukono Assistant DHIO
Sr Barbara Matron – Murambinda Mission Hospital
Aleck Mutibu HIO – Murambinda Mission Hospital

28
Mr Mashamba Nurse in Charge-Buhera rural hospital
Mr Nhubu FCH focal person-Buhera rural hospital
P. Kazuva PCN- Berenyazvivi clinic
N. Rusere Nurse Aide- Berenyazvivi clinic Chimanimani District
Sr. A. Bingura CHN
E. Mashapa SCN - Chikukwa
M. Chingwaru Rusitu
Mr. Miratu Matron – Mutambara Mission Hospital Chipinge District
P. Chikono DHIO
Sr. Mandevhana CHN
M. Ruwanya RGN - Manzvire
B. Simango PCN - Tanganda
N. Mugarisi Acting Sr in Charge - St Peters Makoni District
B. Benza DNO
Hofisi Community Health Nurse
D. Mapingire Community Health Nurse
Mr P. Chikaunda Assistant DHIO
Matron Nengomasha Matron – Rusape General Hospital
C. Chibowa Sister in Charge Maternity –Rusape General Hospital
Sr Nyembezi FCH Focal person _Rusape General Hospital
Simango RGN – Weya hospital
Nhidza RGN – Chinyudze clinic
R. Chadzingwa PCN- Chinyudze clinic Mutasa District
Sr Nyakwima CHN
Mrs Mandimutsira DHIO
Sr Zirema SCN -Tsonzo
Mr Chakandinakira HIO – Hauna Hospital
Sr Mashingaidze Matron – Hauna Hospital
T. Zirema SIC – Zongoro clinic Mutare District
R. Nyasulu CHN
Mrs J. Chatora DHIO
Sr Mawoyo PCN – Chitakatira clinic
Mugadza RGN-Marange
E. Borewore PCN- Bezely bridge Nyanga District
Sr Mubaiwa Community Health Nurse
Mr Chihota DHIO
Mrs Nyapira Assistant DHIO
Sr Chindedza PCN- Nyarumvurwe clinic
Mr Nyamuziwa PCN – Nyatate clinic
Sr Albertina Matron- Regina Coeli Mission Hospital
Mr Chakandinakira HIO- Regina Coeli Mission Hospital

Annex 4: Data Collection Tools Used
Tool 1. Data Verification Sheet - Health facility
Name of Health Facility:
Province
District
Date of Review
Reporting Period Verified
Part 1: Data Verifications
A - Documentation Review: Number of
pregnant women
receiving first ANC
Number of institutional
live births
Number of suspected
cases of malaria tested in children <5
Number of confirmed
cases of malaria in
children <5
Number of cases of
moderate ARI in children<5
COMMENTS Mo. Activity
Jan
Copy the number of people, cases or events reported from the electronic T5 at the district [A]
Copy the number of people, cases or events reported by the site during the reporting period from the T5 [B]
Recount the number of people, cases or events recorded during the reporting period by reviewing the source documents. [C]
Feb
Copy the number of people, cases or events reported from the electronic T5 at the district [A]
Copy the number of people, cases or events
reported by the site during the reporting period from the T5 [B]
Recount the number of people, cases or events recorded during the reporting period by reviewing

30
the source documents. [C]
Mar
Copy the number of people, cases or events reported from the electronic T5 at the district [A]
Copy the number of people, cases or events reported by the site during the reporting period from the T5 [B]
Recount the number of people, cases or events recorded during the reporting period by reviewing the source documents. [C]
Apr
Copy the number of people, cases or events reported from the electronic T5 at the district [A]
Copy the number of people, cases or events reported by the site during the reporting period from the T5 [B]
Recount the number of people, cases or events recorded during the reporting period by reviewing the source documents. [C]
May
Copy the number of people, cases or events reported from the electronic T5 at the district [A]
Copy the number of people, cases or events reported by the site during the reporting period from the T5 [B]
Recount the number of people, cases or events recorded during the reporting period by reviewing the source documents. [C]
Jun
Copy the number of people, cases or events reported from the electronic T5 at the district [A]
Copy the number of people, cases or events reported by the site during the reporting period from the T5 [B]

31
Recount the number of people, cases or events recorded during the reporting period by reviewing the source documents. [C]
Jul
Copy the number of people, cases or events reported from the electronic T5 at the district [A]
Copy the number of people, cases or events reported by the site during the reporting period from the T5 [B]
Recount the number of people, cases or events recorded during the reporting period by reviewing the source documents. [C]
Aug
Copy the number of people, cases or events reported from the electronic T5 at the district [A]
Copy the number of people, cases or events reported by the site during the reporting period from the T5 [B]
Recount the number of people, cases or events recorded during the reporting period by reviewing the source documents. [C]
Sep
Copy the number of people, cases or events reported from the electronic T5 at the district [A]
Copy the number of people, cases or events reported by the site during the reporting period from the T5 [B]
Recount the number of people, cases or events recorded during the reporting period by reviewing the source documents. [C]
Oct
Copy the number of people, cases or events reported from the electronic T5 at the district [A]
Copy the number of people, cases or events reported by the site during the reporting period

32
from the T5 [B]
Recount the number of people, cases or events recorded during the reporting period by reviewing the source documents. [C]
Nov
Copy the number of people, cases or events reported from the electronic T5 at the district [A]
Copy the number of people, cases or events reported by the site during the reporting period from the T5 [B]
Recount the number of people, cases or events recorded during the reporting period by reviewing the source documents. [C]
Dec
Copy the number of people, cases or events reported from the electronic T5 at the district [A]
Copy the number of people, cases or events reported by the site during the reporting period from the T5 [B]
Recount the number of people, cases or events recorded during the reporting period by reviewing the source documents. [C]
Tool 2. System Assessment Sheet – Health Facility (NB: similar tool was used to assess district and provincial level)
Name of Health Facility:
District, Province
Indicator(s) Reviewed:
Date of Review (dd/mm/yyyy)
Reporting Period Verified
Part 1: Data Verifications
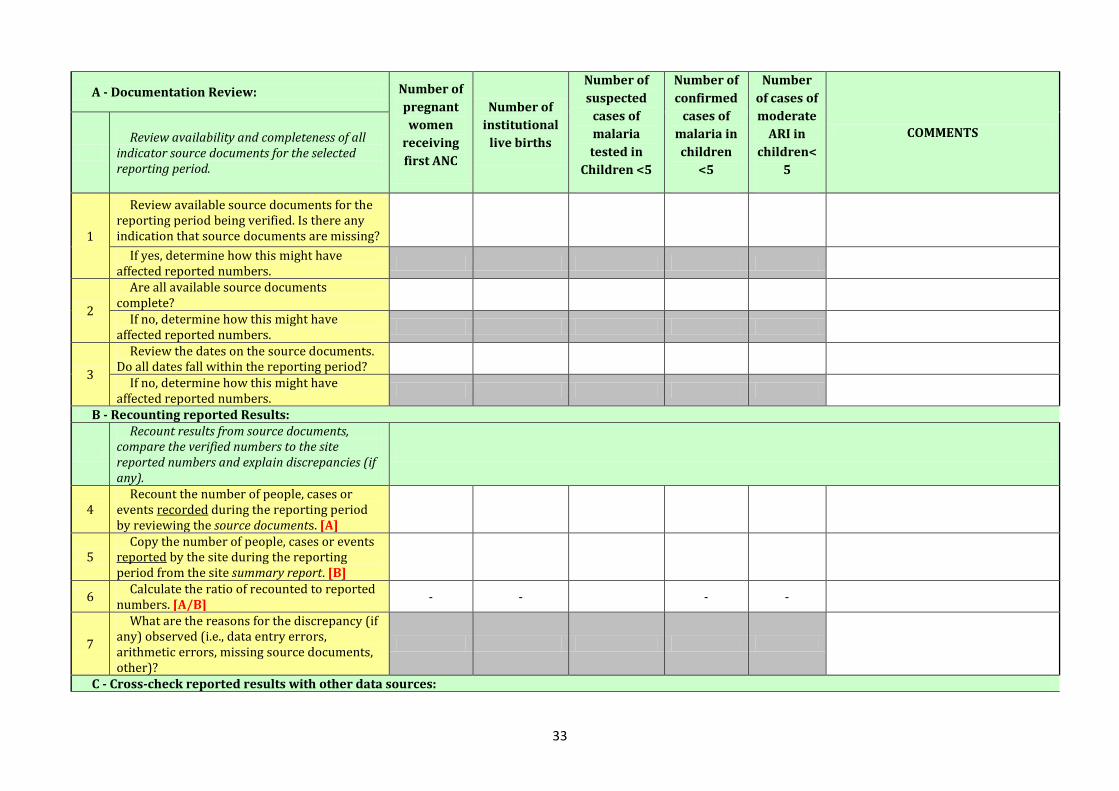
33
A - Documentation Review: Number of
pregnant
women
receiving
first ANC
Number of
institutional
live births
Number of
suspected
cases of
malaria
tested in
Children <5
Number of
confirmed
cases of
malaria in
children
<5
Number
of cases of
moderate
ARI in
children<
5
COMMENTS
Review availability and completeness of all
indicator source documents for the selected reporting period.
1
Review available source documents for the reporting period being verified. Is there any indication that source documents are missing?
If yes, determine how this might have affected reported numbers.
2
Are all available source documents complete?
If no, determine how this might have affected reported numbers.
3
Review the dates on the source documents. Do all dates fall within the reporting period?
If no, determine how this might have affected reported numbers.
B - Recounting reported Results:
Recount results from source documents, compare the verified numbers to the site reported numbers and explain discrepancies (if any).
4 Recount the number of people, cases or
events recorded during the reporting period by reviewing the source documents. [A]
5 Copy the number of people, cases or events
reported by the site during the reporting period from the site summary report. [B]
6 Calculate the ratio of recounted to reported
numbers. [A/B] - - - -
7
What are the reasons for the discrepancy (if any) observed (i.e., data entry errors, arithmetic errors, missing source documents, other)?
C - Cross-check reported results with other data sources:

34
Cross-checks can be performed by examining separate inventory records documenting the quantities of treatment drugs, test-kits or ITNs purchased and delivered during the reporting period to see if these numbers corroborate the reported results. Other cross-checks could include, for example, randomly selecting 20 patient cards and verifying if these patients were recorded in the unit, laboratory or pharmacy registers. To the extent relevant, the cross-checks should be performed in both directions (for example, from Patient Treatment Cards to the Register and from Register to Patient Treatment Cards).
8 List the documents used for performing the
cross-checks.
9 Describe the cross-checks performed?
10 What are the reasons for the discrepancy (if
any) observed?
Part 2. Systems Assessment
Component of the M&E System
Answer Codes: Yes -
completely Partly
No - not at all N/A
REVIEWER COMMENTS (Please provide detail for each response not coded "Yes - Completely". Detailed
responses will help guide strengthening measures. )
I - M&E Structure, Functions and Capabilities
1
There are designated staff responsible for reviewing aggregated numbers prior to submission to the next level (e.g., to districts, to regional offices, to the central M&E Unit).
2 The responsibility for recording the delivery
of services on source documents is clearly assigned to the relevant staff.
3 All relevant staff have received training on
the data management processes and tools.
II- Indicator Definitions and Reporting Guidelines
The M&E Unit has provided written guidelines to each sub-reporting level on …
4 ...what they are supposed to report on.
5 … how (e.g., in what specific format)
reports are to be submitted.
6 … to whom the reports should be
submitted.
7 … when the reports are due. III - Data-collection and Reporting Forms and Tools
8 Clear instructions have been provided by
the M&E Unit on how to complete the data collection and reporting forms/tools.
9 The M&E Unit has identified standard

35
reporting forms/tools to be used by all reporting levels
10 The standard forms/tools are consistently
used by the Health facility
11
All source documents and reporting forms relevant for measuring the indicator(s) are available for auditing purposes (including dated print-outs in case of computerized system).
12
The data collected on the source document has sufficient precision to measure the indicator(s) (i.e., relevant data are collected by sex, age, etc. if the indicator specifies desegregation by these characteristics).
IV- Data Management Processes
13
If applicable, there are quality controls in place for when data from paper-based forms are entered into a computer (e.g., double entry, post-data entry verification, etc).
14 If applicable, there is a written back-up
procedure for when data entry or data processing is computerized.
15
….if yes, the latest date of back-up is appropriate given the frequency of update of the computerized system (e.g., back-ups are weekly or monthly).
16 Relevant personal data are maintained
according to confidentiality guidelines.
17
The recording and reporting system avoids double counting people within and across Service Delivery Points (e.g., a person receiving the same service twice in a reporting period, a person registered as receiving the same service in two different locations, etc).
V - Links with National Reporting System
19 When available, the relevant national
forms/tools are used for data-collection and reporting.
20 When applicable, data are reported through
a single channel of the national information

36
systems.
21 The system records information about
where the service is delivered (i.e. region, district, ward, etc.)
Any other comments:
-------------------------------------------------------------------------------------------------------------------------------------------------------------------------------------------------------------------------
-------------------------------------------------------------------------------------------------------------------------------------------------------------------------------------------------------------------------
------------------------------------------------------------------------------------------------------------------------------------------------------------------------------------------------------------------

37
Tool 3a. System Assessment Sheet – DISTRICT LEVEL (EPI)
Standard questions to assess the quality of the monitoring system
(NB: Similar tool with relevant questions was used to assess the provincial level)
QUESTIONS ON QUALITY (QQ), DISTRICT LEVEL
Name of District: __________________________________Date of Assessment (dd/mm/yyyy)____________________________________________
Enumeration team:__________________________________________________________________________________________________________
Question This question is designed to find out: Response
(Y,N or N/A) Comments
Recording component (district)
1 Are vaccine receipts and issues recorded in a vaccine ledger?
To assess appropriate record-keeping of vaccine receipts and issues.
2 Does the district manager know the annual vaccine requirements for the district?
3 Is the lot number/batch number and expiry date of the vaccine recorded?
4 Is the current ledger up to date for a given vaccine (or vitamin A)?
5 Is there a log of syringe supply and delivery to HU up to date?
Is the stock available identical to the quantity recorded in the register (count).
6 Are district staff aware of standard operating procedures to record a severe adverse event following immunization (AEFI)?
7 Do the district’s reports (found at district level) have at least one date stamped or written on them?
Determine what proportion of correct HU reports you would need to answer “Yes”. Define for which period (e.g. for the previous year) Define the date significance: the date the report was signed the date of receipt at district level (stamped or written

38
on it by the district office)
8 Are the district reports (that are sent to more central levels) completely and correctly filled in?
To select a number of fields to be checked in all district reports and check whether these have been correctly filled in.
Question This question is designed to find out: Response
(Y,N or N/A) Comments
Archiving component (district)
9 Is there a separate file or sub-file for each HF and are the reports inside filed by date?
Storage should facilitate retrieval and monitoring (and be well organized).
10 Have all HU data from the previous month been processed?
11 Are supervisory reports available?
12 Are copies of the last feedback to the health facilities easily available?
13 Can copies of all district reports (that were sent to more central levels) be found?
Computerized archiving (district)
14 If the district is computerized is the last date of backup within one week? (look at the date the file was created on the diskette)
Check diskette for last saved date; look at the file creation date.
15 Can the official immunization tabulations for the previous year be reproduced from an archived electronic file?
To check official immunization tabulations = final summary of previous year data.
16 If more than one computer has immunization data, is there either a functioning network or a written, well-organized method of data transfer? (If yes, read it.)

39
17 Is the date of printing /production on every tabulation/chart produced or, if the data is archived, is there a date showing when the archived file was created?
Question This question is designed to find out: Response
(Y,N or N/A) Comments
Reporting component (district)
18 Have the district reports of the last year month been sent on time?
19 Is the procedure for dealing with late reports known and applied?
20 Did all the monthly (quarterly) reports from the HUs use the same form/format for the current year?
21 Is there a system for investigation of individual reports of adverse events following immunization (AEFI) from the district to the higher level functioning/operational?
Serious AEFIs should be rapidly reported and investigated. Investigators should be looking for any evidence of programmatic error that must be rapidly corrected and/or rumours that cause problems.
22 Did all the visited HUs report adequate supply of administrative forms tally sheets/reporting forms/health cards?
Question This question is designed to find out: Response
(Y,N or N/A) Comments
Demographic information component (district)
23 Is the district denominator for immunization of infants and pregnant women (and school children, if applicable) known?
Known: the interviewed senior staff member should be able to tell (without looking) approximately how many infants the district contained and how the figure was calculated (if relevant).
24 Is there a district map of the catchment area showing HUs and providing immunization strategies (fixed, outreach, mobile)?
Ideally, the map should include denominator, target, type of strategy.

40
25 Is the proportion of infants per strategy-type known for the district?
Usually fixed – outreach – mobile team, etc. This should be used in a district microplan.
26 Has the same denominator for child immunization been used on different tabulations, reports, charts, tables, etc?
Indicate for which year.
27 Are the denominators used in the current year different from the denominators used in the previous year?
Should be different from previous year.
28 For the previous year, is the district denominator value (for child immunizations) found at the district the same as that used at national level?
29 Is the denominator established independently?
The denominator should be established independently from locally set-up targets.
30 Are the denominators of each HU available for the previous year?
Answer “Yes” if available. Totals should add up to the district total.
31 For the previous year, has only one denominator value (check at least total population) been seen in all health projects/programmes?
Check with various initiatives (e.g. polio, nutrition, malaria) whether the denominator is consistent at district level.
Question This question is designed to find out: Response (Y,N or N/A)
Comments
Core outputs/analyses component (district)
32 Is there a target number of children that the district strives to vaccinate during a calendar year or reporting period?
33 Is there a chart or table of immunization coverage by report period for the current year (monitoring chart)?
Is it on display? Is it UP TO DATE? Does it cover all antigens?

41
34 Is the completeness of the immunization reporting from HU recorded and monitored at district level?
District staff should be able to describe what percentage of HU reports was received on time, received but not on time, and not received at all during the previous year or the last months.
35 Does the district record and monitor timeliness for HU immunization reporting?
District staff should be able to say (based on printed information) what percentage of HU reports was received on time during the previous year or the last months.
36 Is the drop-out rate monitored? Discuss the importance and reasons for drop-outs. Are there managerial practices that could be changed to reduce the drop-out rate?
37 Is there monitoring of HU/district vaccine wastage?
Discuss the importance and reasons for wastage.
38 Is there a graph by month of the incidence of vaccine-preventable diseases (VPDs) – broken down by VPD?
How do these data correspond to coverage data (i.e. more cases in areas with poor coverage). When was the last VPD outbreak? Was it investigated? Why did it occur?
39 Is an up-to-date chart/table of the completeness of the current year’s immunization data available?
Completeness = reports received or not received from the HUs. (Here the score 0/1 is only for completeness.)
40 Is the HU performance monitored at the district level?
Monitoring of HUs: graph/figures showing how all HUs are performing during the current year.
41 Are supervision activities monitored?
A written schedule of supervision that includes visiting every HU within a specific period of time.
42 Has the district selected an indicator for the monitoring of immunization safety?
Question This question is designed to find out: Response (Y,N or N/A)
Comments
Evidence of using data for action (district)
43 Is there an analysis of HU data performed regularly with HU staff?
Analysis can be done within supervisory visits, meetings at district level, etc. Explore the quality of analysis as well as the exhaustiveness of the HUs said to be analysed: none of them should be left out.
44 Do you send regular monthly written feedback to the HUs?

42
45 Are areas of low access identified and evidence of action taken to deal with it?
Discuss the importance and reasons for low access. How do the three strategies (fixed site, outreach and mobile teams) relate to the issue of access in the district?
46 Have reasons for any high drop-out been identified, and are there plans/actions to deal with it?
Are there managerial practices that could be changed to reduce the drop-out rate?
47 Is there monitoring of HU vaccine stock-outs? (A stock-out is an interruption in vaccine supply [for any vaccine].)
The manager should be able to say (based on written information) whether any HU has encountered a vaccine stock-out. If no vaccine stock-out is reported, ensure that the monitoring is possible and is being implemented. Staff should be monitoring the level of reserve stocks and taking action if stock goes below a specified reserve level.
48 Are there problems with completeness and timeliness of reports?
Are the late or incomplete reports usually from the same HUs. What was done to follow them up? What other actions were taken to encourage/induce timely reporting.
49 Are the recommendations made for the last three supervisory visits followed up in subsequent visits?
50 Has the monitoring of the selected immunization safety indicator been adequate during the last 12 months?
51 Are surveillance and coverage data compared to look for inconsistencies and then followed up to understand why?
Any other comments: -------------------------------------------------------------------------------------------------------------------------------------------------------------------------------------------------------------------------
-------------------------------------------------------------------------------------------------------------------------------------------------------------------------------------------------------------------------
-------------------------------------------------------------------------------------------------------------------------------------------------------------------------------------------------------------------------
-------------------------------------------------------------------------------------------------------------------------------------------------------------------------------------------------------------------------

43
Tool 3b. System Assessment Sheet – Health Facility (EPI)
Standard questions to assess the quality of the monitoring system
QUESTIONS ON QUALITY (QQs), HEALTH FACILITY (HF) LEVEL
Name of Health Facility:___________________________________ Name of District: __________________________________
Date of Assessment (dd/mm/yyyy)____________________________________________
Enumeration team:__________________________________________________________________________________________________________
Question This question is designed to find out: Response (Y,N or N/A)
Comments
Recording component (HF)
1 Are there tally sheets for infant vaccinations on the desk (or easily available) and do they have entries for the last immunization day?
The main concern is evidence of use of availability (official form) and tally sheet.
2 Are registers used for recording individual information about child immunizations?
Each HF should have a book or register where each immunization history can be registered and traced back.
3 Can a child’s vaccination history be easily and rapidly retrieved in the registers?
A new dose should not be entered as a complete new entry but entered in the location where previous doses have been entered. Score 0 if the register is used as a new entry for any immunization.
4 Are registers (or pre-printed forms) used for recording individual information about women’s TT immunizations?
There may be registers or health cards if cards kept in HF.
5 Observe at least five vaccinations: Were all vaccinations well registered on the child health card/tally sheet/register?
6 Are individual immunization records used, updated and given to the child’s caretaker at the time of the immunization visit?
Blank cards should be available in the HF. Immunization cards are often integrated in “Child Health Card” or other health cards.
Question This question is designed to find out: Response (Y,N or
Comments

44
N/A)
7 Ask the child’s caretaker: Do you know the expected date of receiving vaccine?
Find out whether the expected dates are known.
8 Is the ledger/stock card up to date for all vaccines and/or a selected vaccine?
Up to date = all receipts and issues recorded immediately. Check against stock (in the refrigerator). Compare the date of last entry and the date of the last immunization session.
9 Is the receipt of a selected vaccine in the ledger complete for the entire year?
10 Is there a log (vaccine ledger/stock card) for receipt/issuing of syringes supplied (AD/non-AD reconstitution syringes)?
Can perform a stock check.
11 Does the HF record vaccine batch-number and expiry date?
12 Are all individual T3, T5, T6 forms and Master Card available for the entire previous year?
Individual recording form = tally sheet or register.
13 Are trained Health Workers able to record Penta1 Penta 3 and measles on the card? (test them with blank Baby Health Cards)
Need to define how the scoring will be if a perfect score is not obtained.
14 Is the cold chain temperature monitoring chart completed daily?
Check the chart and compare the latest reported temperature with the actual temperature in the refrigerator.
Question This question is designed to find out: Response (Y,N or N/A)
Comments
Reporting component (HF)
15 Have all reports for the previous year been signed by the nurse-in-charge or officer authorized to submit the HF report?
Score for example: If >50% reports are signed score “Yes”. If <50% discuss with the HF why some have not been signed.
16 Does each report from the previous year have at least one date stamped or written on it by the HF – either as “signed date” or “compiled date”?
If >50% reports are signed score “Yes”. If <100% discuss with the HF why some have no data stamped or written in. This can be answered at district level.

45
17 Are the HF reports correctly filled in? Select a number of fields to be checked in all HF reports and check whether these have been filled in correctly.
18 Are health staff aware of standard operating procedures and the necessary forms to complete if there is a report of a severe AEFI?
Ask health staff what is supposed to be done if a child becomes severely ill or dies after a vaccination. Ask to see any forms that are to be used.
19 Are the HF reports completely filled in? Select a number of fields to be checked in all HF reports from the previous year and check whether these have been filled in.
Question This question is designed to find out: Response (Y,N or N/A)
Comments
Archiving component (HF)
20 Can copies of all previous reports from this HF be found in the HF?
For current and previous year.
21 Is there one location where the previous immunization reports and recording forms are stored?
22 Are the reports of the HF organized in a file by date?
The main concern is that the reports are easily retrievable.
23 Are HF reports available for the entire year?
24 Are the child registers available for all periods of the previous year?
25 Can all tally sheets covering the previous year be found?
26 Are registers for TT vaccinations to pregnant women available for the entire previous year?
27 Is the latest feedback on data from district easily available?
Question This question is designed to find out: Response (Y,N or N/A)
Comments
Demographic information component (HF)

46
28 Does the HF have data on the number of infants born in its catchment area?
The number of births should be different from the previous year. Discuss if there is a difference with the denominator available at more central level. Discuss ways to collect denominator information from community (e.g. birth register), data from national immunization days (NIDs), or other sources. Discuss if the target was set up by the district or HF level.
29 Does the HF have the target population displayed?
Discuss how realistic the value is.
30 Does the HF have a system that allows the collection of information on new births in the community?
This may include community health workers, traditional birth attendants, outreach clinics, etc. A system means (a) organized way to collect the information in every village/community and (b) a written track available at the HF.
31 Does the HF have a target by type of strategy (fixed/outreach/mobile) with a map showing the catchment area by strategy including the outreach villages?
Question This question is designed to find out: Response (Y,N or N/A)
Comments
Core outputs/analysis (HF)
32 Does the HF have a (target) number of children that it strives to vaccinate during a calendar year or a reporting period?
33 Is there a mechanism in place to track defaulters?
Can be an appropriate use of a correctly filled register, tickler file, etc. When was the last time a child was followed up?
34 Does the HF have achievements split by type of strategy – fixed/outreach/mobile?
It is important is to know the proportion of numbers actually reached by each strategy.
35 Does the HF have an up-to-date chart or table (preferably on display) showing the number of vaccinations by report period for the current year?
Monitoring coverage chart – must be UP TO DATE.

47
36 Is there a monthly chart/graph of VPD cases (broken down by VPD)?
How do these data correspond to coverage data (i.e. more cases in areas with poor coverage). When was the last VPD outbreak? Was it investigated? Why did it occur?
37 Does the HF monitor drop-out rate? Preferably on display with the same monitoring chart as the coverage one, but score 1 if the health worker can tell you the drop-out rate for his HF. Discuss the importance and reasons for drop-outs.
38 Does the HF monitor vaccine wastage? Discuss the reasons for wastage and any ways it might be reduced. Discuss whether the health worker knows how much the vaccine wastage is and how it can be calculated.
Question This question is designed to find out: Response (Y,N or N/A)
Comments
Evidence of using data for action component (HF)
39 Are areas of low access identified and is there evidence of actions taken to deal with this?
If there is low access (evidenced by low BCG or DTP1 coverage), how does it relate to the effectiveness of the three strategies (fixed site, outreach and/or mobile teams).
40 Have reasons for any high drop-out been identified; are there plans/actions to deal with this?
Are there any managerial practices that can be changed?
41 Have actions been taken on the last feedback from the district?
42 Is there interaction with the community regarding immunization? Ask for information on “what” and “when”?
Are health staff actively involved in any community committees or meetings on health, investigations of outbreaks or any rumours of AEFIs, etc?
Any other comments: ----------------------------------------------------------------------------------------------------------------------------- -----------------------------------------------------------------
-------------------------------------------------------------------------------------------------------------------------------------------------------------------------- ---------------------------------------------------
------------------------------------------------------------------------------------------------------------------------------------------------------------------------------------------------------------- ----------------
------------------------------------------------------------------------------------------------------------------- ----------------------------------------------------------------------------------------------------------

48
Annex 5: Quality of System Component Scores for All Sites Assessed (Related to MNCH Services)
I II III IV V
Av
erag
e (p
er s
ite)
M&E Structure, Functions and
Capabilities
Indicator Definitions and Reporting
Guidelines
Data-collection and Reporting Forms /
Tools
Data Management Processes
Links with National
Reporting System
Provincial level
1 Manicaland 3.00 1.00 3.00 2.71 3.00 2.54
District level
1 1
Nyanga 2.67 1.00 2.33 2.00 3.00 2.20
2 Mutasa 3.00 2.50 2.50 2.86 3.00 2.77
3 Mutare 3.00 1.00 2.00 1.50 3.00 2.10
4 Buhera 3.00 1.75 2.50 2.56 3.00 2.56
5 Chimanimani 3.00 1.00 2.25 1.67 3.00 2.18
6 Chipinge 2.67 1.00 3.00 1.71 3.00 2.28
7 Makoni 2.67 1.25 2.50 2.13 3.00 2.31
Health Facility level
1 Nyatate clinic 2.67 1.00 2.20 2.00 3.00 2.17
2 Nyarumvurwe clinic 1.67 1.00 2.60 2.00 3.00 2.05
3 Regina Mission Hosp 3.00 2.50 2.40 2.40 3.00 2.66
4 Zongoro clinic 2.33 1.00 2.40 2.00 3.00 2.15
5 Tsonzo RHC 2.67 1.00 2.80 2.00 3.00 2.29
6 Hauna Hosp 3.00 1.00 2.40 2.20 3.00 2.32
7 Chitakatira RHC 2.33 1.00 2.80 2.50 3.00 2.33
8 Rusitu Mission Hosp 2.67 1.00 3.00 2.50 3.00 2.43
9 Chikukwa 2.67 1.25 3.00 2.67 3.00 2.52
10 Mutambara Mission Hosp 2.67 1.00 2.60 3.00 3.00 2.45
11 Manzvire 2.67 1.00 3.00 2.67 3.00 2.47
12 Marange 3.00 1.00 2.60 2.00 3.00 2.32
13 Tanganda 3.00 1.00 3.00 2.00 3.00 2.40
14 Murambinda Hosp 2.00 1.25 2.60 2.60 3.00 2.29
15 Buhera RHC 2.67 2.00 2.60 1.00 3.00 2.25
Colour Code Key
Green 2.5 - 3.0 Yes,
completely
Yellow 1.5 - 2.5 Partly
Red < 1.5 No, not at
all

49
Annex 6: Assessment of District Level (DHIO) Data Management and Reporting Systems, by District
District: Buhera
Part 2. Systems Assessment
I - M&E Structure, Functions and Capabilities
1 There are designated staff responsible for reviewing the quality of data (i.e., accuracy, completeness and timeliness) received from sub-reporting levels (e.g., service points).
Yes - completely
2 There are designated staff responsible for reviewing aggregated numbers prior to submission to the next level (e.g., to the central M&E Unit).
Yes - completely
3 All relevant staff have received training on the data management processes and tools. Yes - completely Most health workers have not received training on data management processes and tools
II- Indicator Definitions and Reporting Guidelines The M&E Unit has provided written guidelines to each sub-reporting level on …
4 ...what they are supposed to report on. No - not at all No written guidelines. Information only shared verbally
5 … how (e.g., in what specific format) reports are to be submitted. No - not at all verbal guideline only, no written guideline or procedure manual
6 … to whom the reports should be submitted. Partly submits to the DMO 7 … when the reports are due. Partly no due dates III- Data-collection and Reporting Forms/Tools
8 Clear instructions have been provided by the M&E Unit on how to complete the data collection and reporting forms/tools.
No - not at all No M&E module
9 The M&E Unit has identified standard reporting forms/tools to be used by all reporting levels Yes - completely T5, HS3/5,T2 10 ….The standard forms/tools are consistently used by the Service Delivery Site. Yes - completely
11 All source documents and reporting forms relevant for measuring the indicator(s) are available for auditing purposes (including dated print-outs in case of computerized system).
Yes - completely
IV- Data Management Processes
12 Feedback is systematically provided to all service points on the quality of their reporting (i.e., accuracy, completeness and timeliness).
Yes - completely Feedback given to facilities by the DNO
13 If applicable, there are quality controls in place for when data from paper-based forms are Yes - completely
16 Berenyazvivi 2.67 2.00 2.50 1.00 3.00 2.23
17 Rusape Gen Hosp 2.67 1.50 2.60 3.00 3.00 2.55
18 Weya Rural Hosp 2.67 1.00 2.80 2.00 3.00 2.29
19 Chinyudze RHC 2.67 1.00 3.00 3.00 3.00 2.53
20 Berzel bridge 2.67 1.00 2.80 3.00 3.00 2.49
21 St Peters 2.67 1.00 2.60 1.60 3.00 2.17
Average (per functional area) 2.69 1.26 2.63 2.22 3.00 2.36

50
entered into a computer (e.g., double entry, post-data entry verification, etc).
14 If applicable, there is a written back-up procedure for when data entry or data processing is computerized.
Yes - completely
15 If yes, the latest date of back-up is appropriate given the frequency of update of the computerized system (e.g., back-ups are weekly or monthly).
Yes - completely 20th of the following month
16 Relevant personal data are maintained according to national or international confidentiality guidelines.
No - not at all ANC Register was easily accessible to members of the public
17 There is a written procedure to address late, incomplete, inaccurate and missing reports; including following-up with service points on data quality issues.
Yes - completely
18 If data discrepancies have been uncovered in reports from service points, the Intermediate Aggregation Levels (e.g., districts or regions) have documented how these inconsistencies have been resolved.
No - not at all The H. F. Is just followed up by phone or verbally
V - Links with National Reporting System
19 When applicable, the data are reported through a single channel of the national reporting system.
Yes - completely
20 When available, the relevant national forms/tools are used for data-collection and reporting. Yes - completely
21 The system records information about where the service is delivered (i.e. region, district, ward, etc.)
Yes - completely
District: Chimanimani
Part 2. Systems Assessment
I - M&E Structure, Functions and Capabilities
1 There are designated staff responsible for reviewing the quality of data (i.e., accuracy, completeness and timeliness) received from sub-reporting levels (e.g., service points).
Yes - completely
2 There are designated staff responsible for reviewing aggregated numbers prior to submission to the next level (e.g., to the central M&E Unit).
Yes - completely
3 All relevant staff have received training on the data management processes and tools. Yes - completely II- Indicator Definitions and Reporting Guidelines The M&E Unit has provided written guidelines to each sub-reporting level on … 4 ...what they are supposed to report on. No - not at all
5 … how (e.g., in what specific format) reports are to be submitted. No - not at all
6 … to whom the reports should be submitted. No - not at all
7 … when the reports are due. No - not at all
III- Data-collection and Reporting Forms / Tools
8 Clear instructions have been provided by the M&E Unit on how to complete the data collection and reporting forms/tools.
Yes - completely
9 The M&E Unit has identified standard reporting forms/tools to be used by all reporting levels Yes - completely 10 The standard forms/tools are consistently used by the Service Delivery Site. Partly
11
All source documents and reporting forms relevant for measuring the indicator(s) are available for auditing purposes (including dated print-outs in case of computerized system).
No - not at all
IV- Data Management Processes
12 Feedback is systematically provided to all service points on the quality of their reporting (i.e., accuracy, completeness and timeliness).
No - not at all
13 If applicable, there are quality controls in place for when data from paper-based forms are Yes - completely

51
entered into a computer (e.g., double entry, post-data entry verification, etc).
14 If applicable, there is a written back-up procedure for when data entry or data processing is computerized.
No - not at all
15 If yes, the latest date of back-up is appropriate given the frequency of update of the computerized system (e.g., back-ups are weekly or monthly).
No - not at all
16 Relevant personal data are maintained according to national or international confidentiality guidelines.
Yes - completely
17 There is a written procedure to address late, incomplete, inaccurate and missing reports; including following-up with service points on data quality issues.
No - not at all
18 If data discrepancies have been uncovered in reports from service points, the Intermediate Aggregation Levels (e.g., districts or regions) have documented how these inconsistencies have been resolved.
N/A
V - Links with National Reporting System
19 When applicable, the data are reported through a single channel of the national reporting system.
Yes - completely
20 When available, the relevant national forms/tools are used for data-collection and reporting. Yes - completely
21 The system records information about where the service is delivered (i.e. region, district, ward, etc.)
Yes - completely
District: Chipinge Part 2. Systems Assessment I - M&E Structure, Functions and Capabilities
1 There are designated staff responsible for reviewing the quality of data (i.e., accuracy, completeness and timeliness) received from sub-reporting levels (e.g., service points).
Yes - completely
2 There are designated staff responsible for reviewing aggregated numbers prior to submission to the next level (e.g., to the central M&E Unit).
Yes - completely
3 All relevant staff have received training on the data management processes and tools. Partly
II- Indicator Definitions and Reporting Guidelines The M&E Unit has provided written guidelines to each sub-reporting level on … 4 ... what they are supposed to report on. No - not at all
5 … how (e.g., in what specific format) reports are to be submitted. No - not at all
6 … to whom the reports should be submitted. No - not at all
7 … when the reports are due. No - not at all
III- Data-collection and Reporting Forms / Tools
8 Clear instructions have been provided by the M&E Unit on how to complete the data collection and reporting forms/tools.
Yes - completely
9 The M&E Unit has identified standard reporting forms/tools to be used by all reporting levels Yes - completely 10 The standard forms/tools are consistently used by the Service Delivery Site. Yes - completely
11 All source documents and reporting forms relevant for measuring the indicator(s) are available for auditing purposes (including dated print-outs in case of computerized system).
Yes - completely
IV- Data Management Processes
12 Feedback is systematically provided to all service points on the quality of their reporting (i.e., accuracy, completeness and timeliness).
No - not at all
13 If applicable, there are quality controls in place for when data from paper-based forms are Yes - completely

52
entered into a computer (e.g., double entry, post-data entry verification, etc).
14 If applicable, there is a written back-up procedure for when data entry or data processing is computerized.
No - not at all
15 If yes, the latest date of back-up is appropriate given the frequency of update of the computerized system (e.g., back-ups are weekly or monthly).
No - not at all
16 Relevant personal data are maintained according to national or international confidentiality guidelines.
Yes - completely
17 There is a written procedure to address late, incomplete, inaccurate and missing reports; including following-up with service points on data quality issues.
No - not at all
18 If data discrepancies have been uncovered in reports from service points, the Intermediate Aggregation Levels (e.g., districts or regions) have documented how these inconsistencies have been resolved.
Partly
V - Links with National Reporting System
19 When applicable, the data are reported through a single channel of the national reporting system.
Yes - completely
20 When available, the relevant national forms/tools are used for data-collection and reporting. Yes - completely
21 The system records information about where the service is delivered (i.e. region, district, ward, etc.)
Yes - completely
District: Makoni Part 2. Systems Assessment I - M&E Structure, Functions and Capabilities
1 There are designated staff responsible for reviewing the quality of data (i.e., accuracy, completeness and timeliness) received from sub-reporting levels (e.g., service points).
Yes - completely The DNO
2 There are designated staff responsible for reviewing aggregated numbers prior to submission to the next level (e.g., to the central M&E Unit).
Yes - completely DMO, DNO
3 All relevant staff have received training on the data management processes and tools. Partly Most health workers have not received training on data management processes and tools
II- Indicator Definitions and Reporting Guidelines The M&E Unit has provided written guidelines to each sub-reporting level on …
4 ...what they are supposed to report on. No - not at all No written guidelines. Information only shared verbally
5 … how (e.g., in what specific format) reports are to be submitted. No - not at all verbal guideline only, no written guideline or procedure manual
6 … to whom the reports should be submitted. No - not at all Not documented, only told to report to the DMO
7 … when the reports are due. Partly This was agreed nationally but written guideline document not available
III- Data-collection and Reporting Forms / Tools
8 Clear instructions have been provided by the M&E Unit on how to complete the data collection and reporting forms/tools.
Yes - completely
9 The M&E Unit has identified standard reporting forms/tools to be used by all reporting levels Yes - completely 10 The standard forms/tools are consistently used by the Service Delivery Site. Yes - completely

53
11 All source documents and reporting forms relevant for measuring the indicator(s) are available for auditing purposes (including dated print-outs in case of computerized system).
No - not at all Some T5 from facilities could not be located
IV- Data Management Processes
12 Feedback is systematically provided to all service points on the quality of their reporting (i.e., accuracy, completeness and timeliness).
Yes - completely Feedback given to facilities by the DNO
13 If applicable, there are quality controls in place for when data from paper-based forms are entered into a computer (e.g., double entry, post-data entry verification, etc).
No - not at all After being entere in the commputor data is not verified, it is submitted without double checking with paper T5s
14 If applicable, there is a written back-up procedure for when data entry or data processing is computerized.
No - not at all Back up procedure not documented although back-up is done monthly
15 If yes, the latest date of back-up is appropriate given the frequency of update of the computerized system (e.g., back-ups are weekly or monthly).
Yes - completely
16 Relevant personal data are maintained according to national or international confidentiality guidelines.
Yes - completely
17 There is a written procedure to address late, incomplete, inaccurate and missing reports; including following-up with service points on data quality issues.
Partly
No written procedure, but all facilities with late submissions or incomplete reports are written on a follow up list submitted to the DNO and they are followed up from the DNO's office.
18 If data discrepancies have been uncovered in reports from service points, the Intermediate Aggregation Levels (e.g., districts or regions) have documented how these inconsistencies have been resolved.
No - not at all The H. F. Is just followed up by phone or verbally
V - Links with National Reporting System
19 When applicable, the data are reported through a single channel of the national reporting system.
Yes - completely
20 When available, the relevant national forms/tools are used for data-collection and reporting. Yes - completely
21 The system records information about where the service is delivered (i.e. region, district, ward, etc.)
Yes - completely
District: Mutasa
Part 2. Systems Assessment I - M&E Structure, Functions and Capabilities
1 There are designated staff responsible for reviewing the quality of data (i.e., accuracy, completeness and timeliness) received from sub-reporting levels (e.g., service points).
Yes - completely
2 There are designated staff responsible for reviewing aggregated numbers prior to submission to the next level (e.g., to the central M&E Unit).
Yes - completely
3 All relevant staff have received training on the data management processes and tools. Yes - completely II- Indicator Definitions and Reporting Guidelines The M&E Unit has provided written guidelines to each sub-reporting level on …
4 ... what they are supposed to report on. Partly
5 … how (e.g., in what specific format) reports are to be submitted. Yes - completely
6 … to whom the reports should be submitted. Partly
7 … when the reports are due. Yes - completely III- Data-collection and Reporting Forms / Tools

54
8 Clear instructions have been provided by the M&E Unit on how to complete the data collection and reporting forms/tools.
No - not at all
9 The M&E Unit has identified standard reporting forms/tools to be used by all reporting levels Yes - completely 10 The standard forms/tools are consistently used by the Service Delivery Site. Yes - completely
11 All source documents and reporting forms relevant for measuring the indicator(s) are available for auditing purposes (including dated print-outs in case of computerized system).
Yes - completely
IV- Data Management Processes
12 Feedback is systematically provided to all service points on the quality of their reporting (i.e., accuracy, completeness and timeliness).
Yes - completely
13 If applicable, there are quality controls in place for when data from paper-based forms are entered into a computer (e.g., double entry, post-data entry verification, etc).
Yes - completely
14 If applicable, there is a written back-up procedure for when data entry or data processing is computerized.
Yes - completely
15 If yes, the latest date of back-up is appropriate given the frequency of update of the computerized system (e.g., back-ups are weekly or monthly).
Yes - completely
16 Relevant personal data are maintained according to national or international confidentiality guidelines.
Partly
17 There is a written procedure to address late, incomplete, inaccurate and missing reports; including following-up with service points on data quality issues.
Yes - completely
18 If data discrepancies have been uncovered in reports from service points, the Intermediate Aggregation Levels (e.g., districts or regions) have documented how these inconsistencies have been resolved.
Yes - completely
V - Links with National Reporting System
19 When applicable, the data are reported through a single channel of the national reporting system.
Yes - completely
20 When available, the relevant national forms/tools are used for data-collection and reporting. Yes - completely
21 The system records information about where the service is delivered (i.e. region, district, ward, etc.)
Yes - completely
District: Mutare Part 2. Systems Assessment I - M&E Structure, Functions and Capabilities
1 There are designated staff responsible for reviewing the quality of data (i.e., accuracy, completeness and timeliness) received from sub-reporting levels (e.g., service points).
Yes - completely
2 There are designated staff responsible for reviewing aggregated numbers prior to submission to the next level (e.g., to the central M&E Unit).
Yes - completely
3 All relevant staff have received training on the data management processes and tools. Yes - completely II- Indicator Definitions and Reporting Guidelines The M&E Unit has provided written guidelines to each sub-reporting level on … 4 ...what they are supposed to report on. No - not at all
5 … how (e.g., in what specific format) reports are to be submitted. No - not at all
6 … to whom the reports should be submitted. No - not at all
7 … when the reports are due. No - not at all
III- Data-collection and Reporting Forms / Tools

55
8 Clear instructions have been provided by the M&E Unit on how to complete the data collection and reporting forms/tools.
No - not at all
9 The M&E Unit has identified standard reporting forms/tools to be used by all reporting levels Yes - completely
10 The standard forms/tools are consistently used by the Service Delivery Site. Yes - completely
11 All source documents and reporting forms relevant for measuring the indicator(s) are available for auditing purposes (including dated print-outs in case of computerized system).
No - not at all
IV- Data Management Processes
12 Feedback is systematically provided to all service points on the quality of their reporting (i.e., accuracy, completeness and timeliness).
No - not at all
13 If applicable, there are quality controls in place for when data from paper-based forms are entered into a computer (e.g., double entry, post-data entry verification, etc).
Yes - completely
14 If applicable, there is a written back-up procedure for when data entry or data processing is computerized.
No - not at all
15 If yes, the latest date of back-up is appropriate given the frequency of update of the computerized system (e.g., back-ups are weekly or monthly).
N/A
16 Relevant personal data are maintained according to national or international confidentiality guidelines.
No - not at all Files are kept in an unlockable cabinet
17 There is a written procedure to address late, incomplete, inaccurate and missing reports; including following-up with service points on data quality issues.
No - not at all
18 If data discrepancies have been uncovered in reports from service points, the Intermediate Aggregation Levels (e.g., districts or regions) have documented how these inconsistencies have been resolved.
No - not at all
V - Links with National Reporting System
19 When applicable, the data are reported through a single channel of the national reporting system.
Yes - completely
20 When available, the relevant national forms/tools are used for data-collection and reporting. Yes - completely
21 The system records information about where the service is delivered (i.e. region, district, ward, etc.)
Yes - completely
District: Nyanga Part 2. Systems Assessment I - M&E Structure, Functions and Capabilities
1 There are designated staff responsible for reviewing the quality of data (i.e., accuracy, completeness and timeliness) received from sub-reporting levels (e.g., service points).
Yes - completely The DHIO
2 There are designated staff responsible for reviewing aggregated numbers prior to submission to the next level (e.g., to the central M&E Unit).
Yes - completely Community sister and DHIO
3 All relevant staff have received training on the data management processes and tools. Partly One of the two trained II- Indicator Definitions and Reporting Guidelines The M&E Unit has provided written guidelines to each sub-reporting level on … 4 ...what they are supposed to report on. No - not at all Guidelines there but not written 5 … how (e.g., in what specific format) reports are to be submitted. No - not at all Guidelines there but not written 6 … to whom the reports should be submitted. No - not at all Guidelines there but not written 7 … when the reports are due. No - not at all Guidelines there but not written III- Data-collection and Reporting Forms / Tools
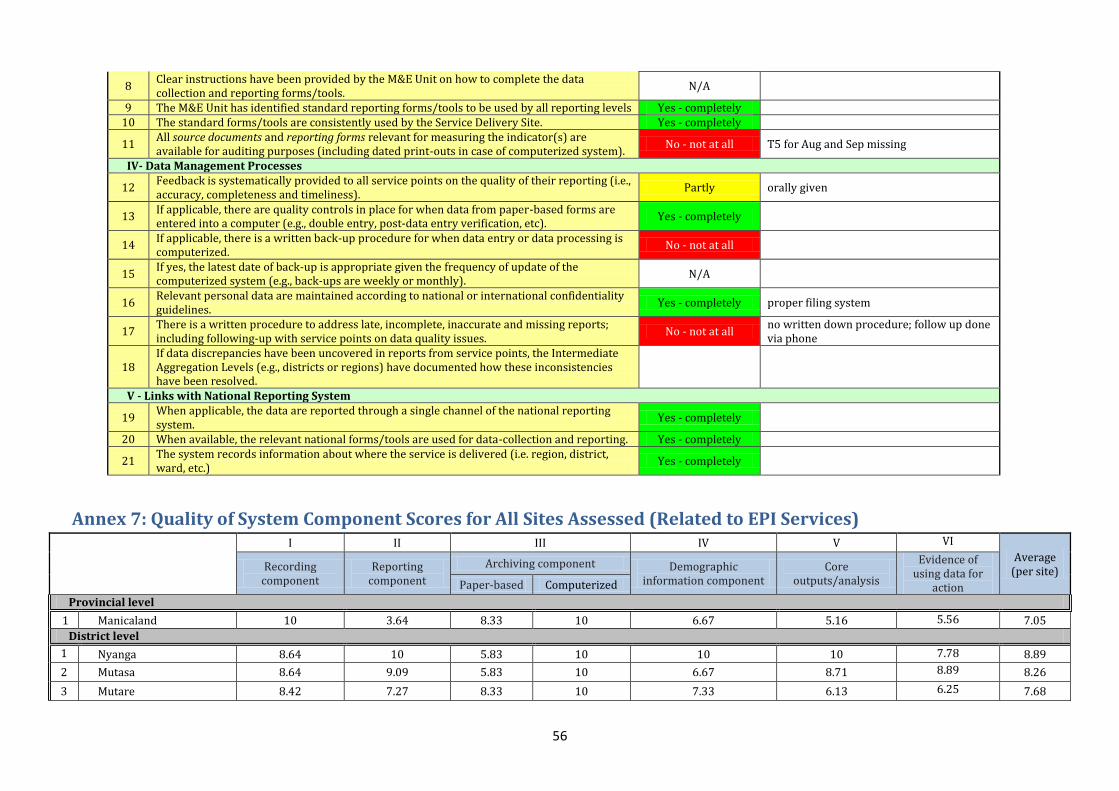
56
8 Clear instructions have been provided by the M&E Unit on how to complete the data collection and reporting forms/tools.
N/A
9 The M&E Unit has identified standard reporting forms/tools to be used by all reporting levels Yes - completely 10 The standard forms/tools are consistently used by the Service Delivery Site. Yes - completely
11 All source documents and reporting forms relevant for measuring the indicator(s) are available for auditing purposes (including dated print-outs in case of computerized system).
No - not at all T5 for Aug and Sep missing
IV- Data Management Processes
12 Feedback is systematically provided to all service points on the quality of their reporting (i.e., accuracy, completeness and timeliness).
Partly orally given
13 If applicable, there are quality controls in place for when data from paper-based forms are entered into a computer (e.g., double entry, post-data entry verification, etc).
Yes - completely
14 If applicable, there is a written back-up procedure for when data entry or data processing is computerized.
No - not at all
15 If yes, the latest date of back-up is appropriate given the frequency of update of the computerized system (e.g., back-ups are weekly or monthly).
N/A
16 Relevant personal data are maintained according to national or international confidentiality guidelines.
Yes - completely proper filing system
17 There is a written procedure to address late, incomplete, inaccurate and missing reports; including following-up with service points on data quality issues.
No - not at all no written down procedure; follow up done via phone
18 If data discrepancies have been uncovered in reports from service points, the Intermediate Aggregation Levels (e.g., districts or regions) have documented how these inconsistencies have been resolved.
V - Links with National Reporting System
19 When applicable, the data are reported through a single channel of the national reporting system.
Yes - completely
20 When available, the relevant national forms/tools are used for data-collection and reporting. Yes - completely
21 The system records information about where the service is delivered (i.e. region, district, ward, etc.)
Yes - completely
Annex 7: Quality of System Component Scores for All Sites Assessed (Related to EPI Services)
I II III IV V VI
Average (per site) Recording
component Reporting
component
Archiving component Demographic information component
Core outputs/analysis
Evidence of using data for
action Paper-based Computerized
Provincial level
1 Manicaland 10 3.64 8.33 10 6.67 5.16 5.56 7.05
District level
1 1
Nyanga 8.64 10 5.83 10 10 10 7.78 8.89
2 Mutasa 8.64 9.09 5.83 10 6.67 8.71 8.89 8.26
3 Mutare 8.42 7.27 8.33 10 7.33 6.13 6.25 7.68

57
4 Buhera 10 7.27 6.67 10 6.92 2.26 4.44 6.79
5 Chimanimani 7.27 10 7.5 6.25 8.67 7.1 5.56 7.48
6 Chipinge 8.64 10 5.83 5.0 7.33 8.06 6.67 7.36
7 Makoni 8.64 7.27 6.00 10.0 10 9.03 6.67 8.23
Health Facility level 9
1 Nyatate clinic 8.93 3.64 6.36 6.67 6.84 10.0 7.07
2 Nyarumvurwe clinic 7.92 4.55 7.27 10.00 8.42 10.0 8.03
3 Regina Mission Hosp 10.0 2.73 8.0 5.56 10.0 5.0 6.88
4 Zongoro clinic 8.24 9.09 0.91 10.00 10.0 7.50 7.62
5 Tsonzo RHC 8.70 7.27 8.18 10.0 8.42 10.0 8.76
6 Hauna Hosp 5.95 3.64 4.55 7.78 6.84 10.0 6.46
7 Chitakatira RHC 8.53 7.27 7.27 4.44 6.84 10.0 7.39
8 Rusitu Mission Hosp 5.59 10.0 8.18 10.0 7.89 7.50 8.19
9 Chikukwa 9.38 10.0 8.18 4.44 4.74 5.00 6.96
10 Mutambara Mission Hosp 7.42 6.36 4.55 7.78 6.32 7.50 6.65
11 Manzvire 5.29 4.55 8.18 4.44 4.74 7.50 5.78
12 Marange 6.76 1.25 5.45 3.33 6.32 2.50 4.27
13 Tanganda 9.12 10.0 8.18 10.0 2.11 7.50 7.82
14 Murambinda Hosp 8.65 6.36 7.27 3.33 4.74 7.50 6.31
15 Buhera RHC 10.0 1.82 9.09 3.33 6.84 5.00 6.01
16 Berenyazvivi 7.30 4.55 8.18 3.33 3.68 7.50 5.76
17 Rusape Gen Hosp 8.38 4.55 7.27 0 4.74 0 4.16
18 Weya Rural Hosp 9.19 9.09 6.36 10.0 6.84 10.0 8.58
19 Chinyudze RHC 10.0 10.0 8.18 10.0 10.0 5.0 8.86
20 Berzel bridge 9.19 10.0 8.18 10.0 8.42 10.0 9.3
21 St Peters 2.65 3.64 1.82 4.44 6.32 10.0 4.81
Average (per functional area) 8.19 6.72 6.76 6.98 6.81 7.13 7.15
9 At facility level, the archiving only looked at the manual, paper-based component.
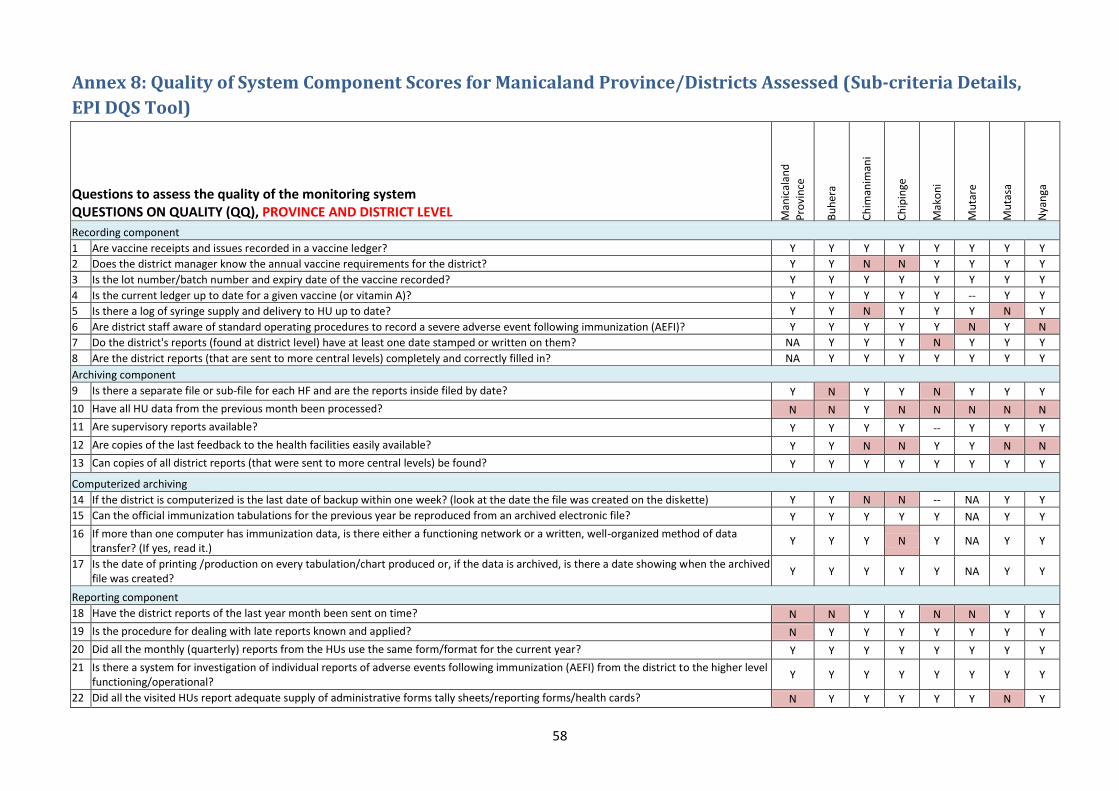
58
Annex 8: Quality of System Component Scores for Manicaland Province/Districts Assessed (Sub-criteria Details,
EPI DQS Tool)
Questions to assess the quality of the monitoring system QUESTIONS ON QUALITY (QQ), PROVINCE AND DISTRICT LEVEL M
anic
alan
d
Pro
vin
ce
Bu
her
a
Ch
iman
iman
i
Ch
ipin
ge
Mak
on
i
Mu
tare
Mu
tasa
Nya
nga
Recording component
1 Are vaccine receipts and issues recorded in a vaccine ledger? Y Y Y Y Y Y Y Y
2 Does the district manager know the annual vaccine requirements for the district? Y Y N N Y Y Y Y
3 Is the lot number/batch number and expiry date of the vaccine recorded? Y Y Y Y Y Y Y Y
4 Is the current ledger up to date for a given vaccine (or vitamin A)? Y Y Y Y Y -- Y Y
5 Is there a log of syringe supply and delivery to HU up to date? Y Y N Y Y Y N Y
6 Are district staff aware of standard operating procedures to record a severe adverse event following immunization (AEFI)? Y Y Y Y Y N Y N
7 Do the district's reports (found at district level) have at least one date stamped or written on them? NA Y Y Y N Y Y Y
8 Are the district reports (that are sent to more central levels) completely and correctly filled in? NA Y Y Y Y Y Y Y
Archiving component
9 Is there a separate file or sub-file for each HF and are the reports inside filed by date? Y N Y Y N Y Y Y
10 Have all HU data from the previous month been processed? N N Y N N N N N
11 Are supervisory reports available? Y Y Y Y -- Y Y Y
12 Are copies of the last feedback to the health facilities easily available? Y Y N N Y Y N N
13 Can copies of all district reports (that were sent to more central levels) be found? Y Y Y Y Y Y Y Y
Computerized archiving
14 If the district is computerized is the last date of backup within one week? (look at the date the file was created on the diskette) Y Y N N -- NA Y Y
15 Can the official immunization tabulations for the previous year be reproduced from an archived electronic file? Y Y Y Y Y NA Y Y
16 If more than one computer has immunization data, is there either a functioning network or a written, well-organized method of data transfer? (If yes, read it.)
Y Y Y N Y NA Y Y
17 Is the date of printing /production on every tabulation/chart produced or, if the data is archived, is there a date showing when the archived file was created?
Y Y Y Y Y NA Y Y
Reporting component
18 Have the district reports of the last year month been sent on time? N N Y Y N N Y Y
19 Is the procedure for dealing with late reports known and applied? N Y Y Y Y Y Y Y
20 Did all the monthly (quarterly) reports from the HUs use the same form/format for the current year? Y Y Y Y Y Y Y Y
21 Is there a system for investigation of individual reports of adverse events following immunization (AEFI) from the district to the higher level functioning/operational?
Y Y Y Y Y Y Y Y
22 Did all the visited HUs report adequate supply of administrative forms tally sheets/reporting forms/health cards? N Y Y Y Y Y N Y
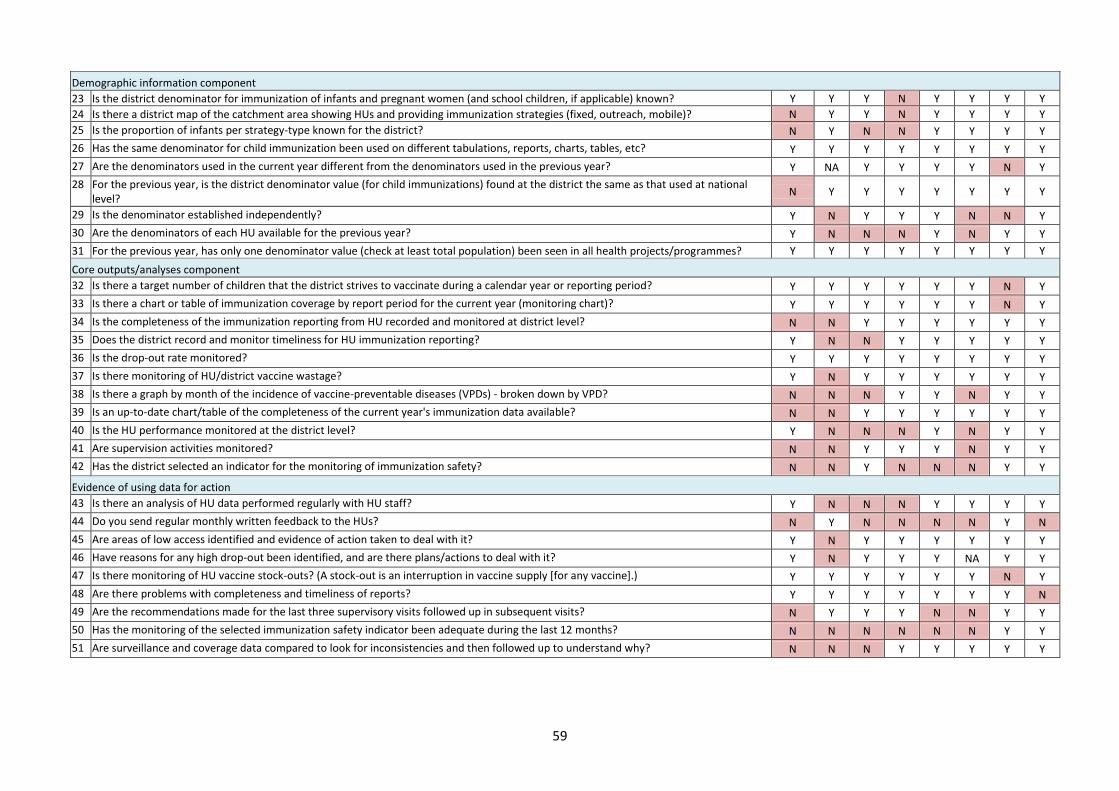
59
Demographic information component
23 Is the district denominator for immunization of infants and pregnant women (and school children, if applicable) known? Y Y Y N Y Y Y Y
24 Is there a district map of the catchment area showing HUs and providing immunization strategies (fixed, outreach, mobile)? N Y Y N Y Y Y Y
25 Is the proportion of infants per strategy-type known for the district? N Y N N Y Y Y Y
26 Has the same denominator for child immunization been used on different tabulations, reports, charts, tables, etc? Y Y Y Y Y Y Y Y
27 Are the denominators used in the current year different from the denominators used in the previous year? Y NA Y Y Y Y N Y
28 For the previous year, is the district denominator value (for child immunizations) found at the district the same as that used at national level?
N Y Y Y Y Y Y Y
29 Is the denominator established independently? Y N Y Y Y N N Y
30 Are the denominators of each HU available for the previous year? Y N N N Y N Y Y
31 For the previous year, has only one denominator value (check at least total population) been seen in all health projects/programmes? Y Y Y Y Y Y Y Y
Core outputs/analyses component
32 Is there a target number of children that the district strives to vaccinate during a calendar year or reporting period? Y Y Y Y Y Y N Y
33 Is there a chart or table of immunization coverage by report period for the current year (monitoring chart)? Y Y Y Y Y Y N Y
34 Is the completeness of the immunization reporting from HU recorded and monitored at district level? N N Y Y Y Y Y Y
35 Does the district record and monitor timeliness for HU immunization reporting? Y N N Y Y Y Y Y
36 Is the drop-out rate monitored? Y Y Y Y Y Y Y Y
37 Is there monitoring of HU/district vaccine wastage? Y N Y Y Y Y Y Y
38 Is there a graph by month of the incidence of vaccine-preventable diseases (VPDs) - broken down by VPD? N N N Y Y N Y Y
39 Is an up-to-date chart/table of the completeness of the current year's immunization data available? N N Y Y Y Y Y Y
40 Is the HU performance monitored at the district level? Y N N N Y N Y Y
41 Are supervision activities monitored? N N Y Y Y N Y Y
42 Has the district selected an indicator for the monitoring of immunization safety? N N Y N N N Y Y
Evidence of using data for action
43 Is there an analysis of HU data performed regularly with HU staff? Y N N N Y Y Y Y
44 Do you send regular monthly written feedback to the HUs? N Y N N N N Y N
45 Are areas of low access identified and evidence of action taken to deal with it? Y N Y Y Y Y Y Y
46 Have reasons for any high drop-out been identified, and are there plans/actions to deal with it? Y N Y Y Y NA Y Y
47 Is there monitoring of HU vaccine stock-outs? (A stock-out is an interruption in vaccine supply [for any vaccine].) Y Y Y Y Y Y N Y
48 Are there problems with completeness and timeliness of reports? Y Y Y Y Y Y Y N
49 Are the recommendations made for the last three supervisory visits followed up in subsequent visits? N Y Y Y N N Y Y
50 Has the monitoring of the selected immunization safety indicator been adequate during the last 12 months? N N N N N N Y Y
51 Are surveillance and coverage data compared to look for inconsistencies and then followed up to understand why? N N N Y Y Y Y Y

60
Annex 9: Quality of System Component Scores for HFs Assessed (Sub-criteria Details, EPI DQS Tool)
Questions to assess the quality of the monitoring system QUESTIONS ON QUALITY (QQ), HEALTH FACILITY LEVEL
Buhera Chimanimani Chipinge Makoni Mutare Mutasa Nyanga
Mu
ram
bin
da
Ho
spit
al
Bu
her
a R
HC
Ber
enya
zviv
i RH
C
Ru
situ
Mis
sio
n H
osp
ital
Ch
iku
kwa
RH
C
Mu
tam
bar
a M
issi
on
Ho
spit
al
Man
zvir
e R
HC
Tan
gan
da
RH
C
St P
eter
s M
issi
on
Ho
spit
al
Ru
sap
e G
ene
ral H
osp
ital
Wey
a R
ura
l Ho
spit
al
Ch
inyu
dze
RH
C
Mar
ange
Ru
ral H
osp
ital
Bez
el b
rid
ge R
HC
Ch
itak
atir
a R
HC
Tso
nzo
RH
C
Hau
na
Ho
spit
al
Zon
goro
clin
ic
Nya
rum
vurw
e cl
inic
Nya
tate
clin
ic
Reg
ina
Mis
sio
n H
osp
ital
Recording component (HF)
1 Are there tally sheets for infant vaccinations on the desk (or easily available) and do they have entries for the last immunization day?
Y Y Y Y Y Y Y N N Y Y NA Y Y Y Y Y Y Y Y Y
2 Are registers used for recording individual information about child immunizations?
Y Y Y Y Y Y Y Y Y N Y Y Y Y Y N Y Y Y Y Y
3 Can a child's vaccination history be easily and rapidly retrieved in the registers?
Y Y Y Y Y Y Y Y N N Y Y Y Y Y Y N N -- Y Y
4 Are registers (or pre-printed forms) used for recording individual information about women's TT immunizations?
Y Y Y Y Y Y Y Y Y Y Y Y Y Y Y Y Y Y N Y Y
5 Observe at least five vaccinations: Were all vaccinations well registered on the child health card/tally sheet/register?
Y Y Y NA NA NA NA NA N Y Y Y Y Y NA N Y -- -- --
6 Are individual immunization records used, updated and given to the child's caretaker at the time of the immunization visit?
Y Y Y Y Y Y N Y N Y Y Y Y Y Y NA Y N -- -- NA
7 Ask the child's caretaker: Do you know the expected date of receiving vaccine?
N Y N N Y NA N Y N Y N Y Y N N NA N -- -- -- NA
8 Is the ledger/stock card up to date for all vaccines and/or a selected vaccine?
Y Y N N Y N N Y N Y Y Y N Y Y Y Y Y Y Y Y
9 Is the receipt of a selected vaccine in the ledger complete for the entire year? Y Y N N Y Y N Y N Y Y Y N Y Y Y Y Y Y Y Y
10 Is there a log (vaccine ledger/stock card) for receipt/issuing of syringes supplied (AD/non-AD reconstitution syringes)?
N Y N N -- Y Y Y N N Y Y N Y N NA N Y N Y --
11 Does the HF record vaccine batch-number and expiry date? Y Y Y N N N N Y N Y Y Y N Y Y Y Y N Y Y Y
12 Are all individual T3, T5, T6 forms and Master Card available for the entire previous year?
Y Y Y Y Y N Y Y N Y Y Y N Y Y Y N Y Y N Y
13 Are trained Health Workers able to record Penta1 Penta 3 and measles on the card? (test them with blank Baby Health Cards)
Y Y Y Y Y Y Y Y NA Y Y Y Y Y Y NA N Y -- Y Y
14 Is the cold chain temperature monitoring chart completed daily? Y Y Y N Y Y N Y Y Y Y Y Y Y Y Y Y Y Y Y Y
Reporting component (HF)

61
15 Have all reports for the previous year been signed by the nurse-in-charge or officer authorized to submit the HF report?
N N N Y Y Y N Y N N Y Y N Y Y Y N Y N N N
16 Does each report from the previous year have at least one date stamped or written on it by the HF - either as "signed date" or "compiled date"?
N Y Y Y Y Y Y Y Y Y N Y N Y Y Y N Y Y N N
17 Are the HF reports correctly filled in? Y Y Y Y Y N Y Y N Y Y Y Y Y Y Y Y N Y Y N
18 Are health staff aware of standard operating procedures and the necessary forms to complete if there is a report of a severe AEFI?
Y N N Y -- N Y Y Y N Y Y -- Y N N N Y N N N
19 Are the HF reports completely filled in? Y N Y Y Y Y N Y N Y Y Y N Y Y Y Y Y Y Y Y
Archiving component (HF)
20 Can copies of all previous reports from this HF be found in the HF? Y N Y Y Y N Y Y N Y N Y N Y Y Y N N Y N Y
21 Is there one location where the previous immunization reports and recording forms are stored?
Y Y Y Y Y Y Y Y N Y Y Y Y Y Y Y Y N Y Y Y
22 Are the reports of the HF organized in a file by date? Y Y Y Y Y N Y Y N Y Y Y Y Y Y Y N N Y Y Y
23 Are HF reports available for the entire year? Y Y Y Y Y N Y Y N Y Y Y N Y Y Y N N Y Y --
24 Are the child registers available for all periods of the previous year? Y Y Y Y Y Y Y Y Y N Y Y Y Y N Y Y N Y Y Y
25 Can all tally sheets covering the previous year be found? Y Y Y Y Y N Y Y N Y N Y N Y Y Y N N Y Y Y
26 Are registers for TT vaccinations to pregnant women available for the entire previous year?
N Y Y Y Y Y Y Y Y Y Y Y Y Y Y Y Y Y N N Y
27 Is the latest feedback on data from district easily available? N Y N N N N N N N N N N N N N N N N N N N
Demographic information component (HF)
28 Does the HF have data on the number of infants born in its catchment area?
N N N Y N Y N Y Y N Y Y N Y N Y Y Y Y Y Y
29 Does the HF have the target population displayed? Y Y Y Y Y Y Y Y N N Y Y Y Y Y Y Y Y Y N N
30 Does the HF have a system that allows the collection of information on new births in the community?
N N N Y Y Y Y Y Y N Y Y N Y Y Y Y Y Y Y N
31 Does the HF have a target by type of strategy (fixed/outreach/mobile) with a map showing the catchment area by strategy including the outreach villages?
N N N Y N N N Y N N Y Y N Y N Y N Y Y Y Y
Core outputs/analysis (HF)
32 Does the HF have a (target) number of children that it strives to vaccinate during a calendar year or a reporting period?
Y Y Y Y Y Y Y Y Y N Y Y Y Y Y Y Y Y Y Y Y
33 Is there a mechanism in place to track defaulters? N Y Y N N N N Y N N Y Y N Y Y Y Y Y Y Y Y
34 Does the HF have achievements split by type of strategy - fixed/outreach/mobile?
N N N N N N N N N N N NA N Y N N N Y Y N Y
35 Does the HF have an up-to-date chart or table (preferably on display) showing the number of vaccinations by report period for the current year?
Y Y N Y Y Y N N Y Y Y Y Y Y Y Y Y Y Y Y Y
36 Is there a monthly chart/graph of VPD cases (broken down by VPD)? N N N Y N N Y N Y N N Y Y N Y Y Y Y Y Y Y
37 Does the HF monitor drop-out rate? N Y N Y N Y Y N N Y Y Y N Y Y Y N Y Y Y Y
38 Does the HF monitor vaccine wastage? Y Y Y Y Y Y N N Y Y Y Y Y Y N Y Y Y N N Y
Evidence of using data for action component (HF)
39 Are areas of low access identified and is there evidence of actions taken to deal with this?
Y N N Y Y Y Y Y Y N Y Y N Y Y Y Y Y Y Y Y

62
40 Have reasons for any high drop-out been identified; are there plans/actions to deal with this?
Y Y Y Y N Y Y Y Y N Y N N Y Y Y NA Y Y Y N
41 Have actions been taken on the last feedback from the district? Y Y Y N N N N N Y N Y N N Y Y Y NA Y NA -- N
42 Is there interaction with the community regarding immunization? Ask for information on "what" and "when"?
N N Y Y Y Y Y Y Y N Y Y Y Y Y Y Y N Y Y Y
Annex 10: Verification Factors, by Health Facility and Indicator
Health Facility
Indicator
# pregnant women receiving first ANC
# institutional live births
# suspected cases of malaria tested in children <5
# confirmed cases of malaria in children <5
# cases of moderate ARI in children<5
Nyatate clinic 109.4% 109.1% 86.6% 94.6% 119.6%
Nyarumvurwe clinic 100.0% 97.0% 101.3% 95.5% 99.7%
Regina Mission Hosp 91.3% 98.8% 107.8% 100.0% 99.0%
Zongoro clinic 98.2% 100.0% 68.5% 100.0% 93.2%
Tsonzo RHC 97.8% 100.0% 91.7% 100.0% 98.3%
Hauna Hosp 100.5% 100.7% 96.2% 96.5% 73.2%
Chitakatira RHC 101.5% 103.5% 108.9% 119.0% 112.1%
Rusitu Mission Hosp 103.4% 97.9% 99.5% 114.7% 103.9%
Chikukwa 97.1% 104.2% 80.9% 85.7% 90.1%
Mutambara Mission Hosp 100.0% 99.9% 99.5% 100.0% 100.0%
Manzvire 98.6% 96.9% 82.4% 100.0% 20.2%
Marange 100.0% 99.6% 96.7% 100.0% 99.4%
Tanganda 113.7% 100.0% 112.6% 93.0% 78.1%
Murambinda Hosp 48.3% 96.9% 70.2% 125.0% 94.9%
Buhera RHC 89.4% 89.1% 160.0% 50.0% 46.8%
Berenyazvivi 101.6% 100.0% - 0.0% 100.7%
Rusape Gen Hosp 104.3% 98.9% 14.2% 27.3% 54.3%
Weya Rural Hosp 108.7% 107.6% 126.9% 58.8% 80.5%
Chinyudze RHC 100.6% 102.1% 101.5% 109.1% 100.0%
Berzel bridge 104.4% 100.0% 94.4% 89.5% 94.7%
St Peters 108.1% 109.4% 79.5% 101.9% 120.9%
Average 99.0% 101.0% 94.0% 89.0% 90.0%
NB:
*Pink = VFs of more than 110%. When reporting to the district level, a VF >110% indicates that data is being under-reported by the HF. *Green = VFs of less than 91%. When reporting to the district level, a VF <91% indicates that data is being over-reported by the HF.