Embed Size (px)
Citation preview
International Research Journal of Engineering and Technology (IRJET) e-ISSN: 2395 -0056
Volume: 03 Issue: 02 | Feb-2016 www.irjet.net p-ISSN: 2395-0072
© 2016, IRJET | Impact Factor value: 4.45 | ISO 9001:2008 Certified Journal | Page 552
ASSESSMENT OF GROUNDWATER QUALITY INDEX USING GIS AT
TIRUPATHI, INDIA
K.AMBIGA1
1Assistant Professor – II, Civil and Structural Engineering, SCSVMV University, Enathur, Kanchipuram.
Abstract - Groundwater is the most important natural resource required for drinking to many people around the world, especially in rural areas. An attempt has been made in order to determine spatial distribution of groundwater quality parameters and to identify places with the best quality for drinking within the study area based on: an integrated analysis of physical-chemical parameters, use of Geographical Information System and Water Quality Index calculation. The physico-chemical results were compared to the standard guideline values as recommended by the Bureau of Indian standards for drinking and public health in order to have an overview of the present groundwater quality. According to the overall assessment of the basin, almost all the parameters analysed are above the desirable limits of standards. Using Geographic Information System, spatial distribution maps of physico-chemcial parameters and Water quality index have been created. The spatial analysis of ground water quality patterns of the study area shows that the Total Dissolved Solids values are similar throughout the sample station. The spatial distribution map of Total hardness shows that a majority of the groundwater samples are in the permissible limit only. The index was used to assess the suitability of groundwater from the study area for human consumption. From the index assessment, over 82% of the water samples fall within the ‘‘Poor’’, are unsuitable for drinking purposes.
Key Words: Ground water; Water Quality Parameters; Water Quality Index; Spatial Distribution; Geographic Information
System
1. INTRODUCTION
The availability of a water supply adequate in terms of both quantity and quality is essential to human existence. The demand for water has increased over the years and this has led to water scarcity in many parts of the world. The situation is aggravated by the problem of water pollution or contamination. India is heading towards a freshwater crisis mainly due to improper management of water resources and environmental degradation. This leads to lack of access to safe potable water supply to millions of people. This freshwater crisis is already evident in many parts of India, varying in scale and intensity depending mainly on the time of the year. According to WHO organization, about 80% of all the diseases in human beings are water borne. Further the groundwater, and the pollutants it may carry move with such a low velocity that it may take considerable time for the contaminants to move away from the source of pollution and also degradation in the groundwater quality may remain undetected for years. Once the groundwater is contaminated, its quality cannot be restored by arresting the pollutants from the source. It therefore becomes imperative to regularly monitor the quality of groundwater and to device ways and means to protect it. Water quality index is one of the most effective tools to communicate information on overall quality status of water to the concerned user community and policy makers. Thus, it becomes an important parameter for the assessment and management of groundwater. The purpose of the present study is to estimate the groundwater quality in the Tirupati and thematically represent it using Geographic Information System (GIS) for understanding of the present scenario at a glance.GIS can be used as a powerful tool for developing solutions for water resources problems for assessing water quality, determining water availability, preventing flooding, understanding the natural environment, and managing water resources on a local or regional scale.
1.1 Study Area
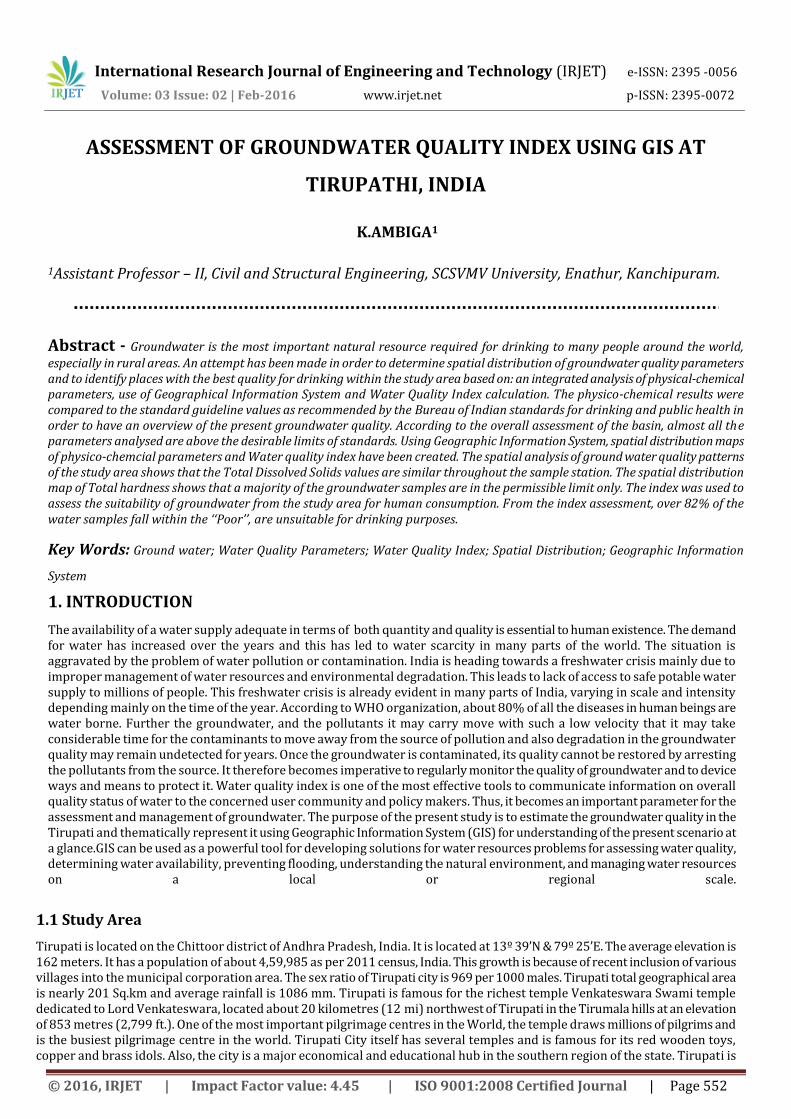
Tirupati is located on the Chittoor district of Andhra Pradesh, India. It is located at 13º 39’N & 79º 25’E. The average elevation is 162 meters. It has a population of about 4,59,985 as per 2011 census, India. This growth is because of recent inclusion of various villages into the municipal corporation area. The sex ratio of Tirupati city is 969 per 1000 males. Tirupati total geographical area is nearly 201 Sq.km and average rainfall is 1086 mm. Tirupati is famous for the richest temple Venkateswara Swami temple dedicated to Lord Venkateswara, located about 20 kilometres (12 mi) northwest of Tirupati in the Tirumala hills at an elevation of 853 metres (2,799 ft.). One of the most important pilgrimage centres in the World, the temple draws millions of pilgrims and is the busiest pilgrimage centre in the world. Tirupati City itself has several temples and is famous for its red wooden toys, copper and brass idols. Also, the city is a major economical and educational hub in the southern region of the state. Tirupati is
International Research Journal of Engineering and Technology (IRJET) e-ISSN: 2395 -0056
Volume: 03 Issue: 02 | Feb-2016 www.irjet.net p-ISSN: 2395-0072
© 2016, IRJET | Impact Factor value: 4.45 | ISO 9001:2008 Certified Journal | Page 553
also the largest Metropolitan city in Rayalaseema and Southern Andhra Pradesh, and is the 4th largest city in terms of stand-alone city basis. People in this area majorly depend upon ground water for drinking and other purposes. For the past few years, Tirupati is facing a severe water scarcity due to rapid growth of population.
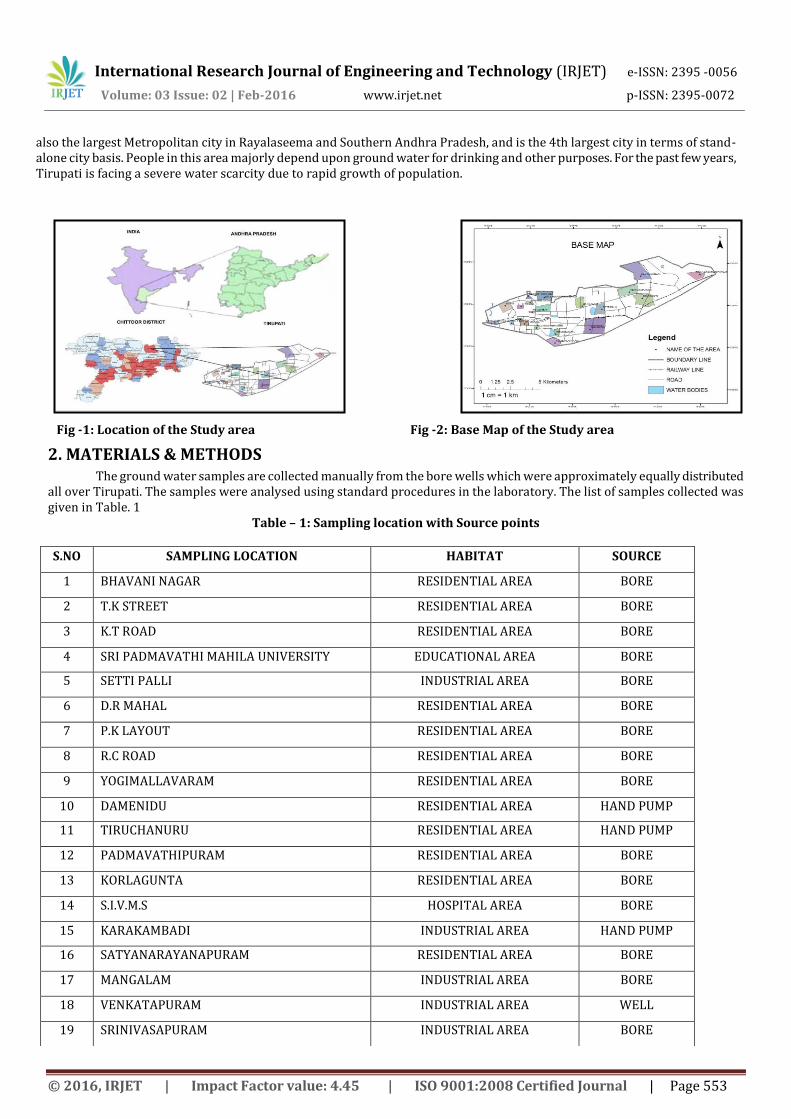
Fig -1: Location of the Study area Fig -2: Base Map of the Study area
2. MATERIALS & METHODS The ground water samples are collected manually from the bore wells which were approximately equally distributed
all over Tirupati. The samples were analysed using standard procedures in the laboratory. The list of samples collected was given in Table. 1
Table – 1: Sampling location with Source points
S.NO SAMPLING LOCATION HABITAT SOURCE
1 BHAVANI NAGAR RESIDENTIAL AREA BORE
2 T.K STREET RESIDENTIAL AREA BORE
3 K.T ROAD RESIDENTIAL AREA BORE
4 SRI PADMAVATHI MAHILA UNIVERSITY EDUCATIONAL AREA BORE
5 SETTI PALLI INDUSTRIAL AREA BORE
6 D.R MAHAL RESIDENTIAL AREA BORE
7 P.K LAYOUT RESIDENTIAL AREA BORE
8 R.C ROAD RESIDENTIAL AREA BORE
9 YOGIMALLAVARAM RESIDENTIAL AREA BORE
10 DAMENIDU RESIDENTIAL AREA HAND PUMP
11 TIRUCHANURU RESIDENTIAL AREA HAND PUMP
12 PADMAVATHIPURAM RESIDENTIAL AREA BORE
13 KORLAGUNTA RESIDENTIAL AREA BORE
14 S.I.V.M.S HOSPITAL AREA BORE
15 KARAKAMBADI INDUSTRIAL AREA HAND PUMP
16 SATYANARAYANAPURAM RESIDENTIAL AREA BORE
17 MANGALAM INDUSTRIAL AREA BORE
18 VENKATAPURAM INDUSTRIAL AREA WELL
19 SRINIVASAPURAM INDUSTRIAL AREA BORE
International Research Journal of Engineering and Technology (IRJET) e-ISSN: 2395 -0056
Volume: 03 Issue: 02 | Feb-2016 www.irjet.net p-ISSN: 2395-0072
© 2016, IRJET | Impact Factor value: 4.45 | ISO 9001:2008 Certified Journal | Page 554
20 RENIGUNTA INDUSTRIAL AREA BORE
International Research Journal of Engineering and Technology (IRJET) e-ISSN: 2395 -0056
Volume: 03 Issue: 02 | Feb-2016 www.irjet.net p-ISSN: 2395-0072
© 2016, IRJET | Impact Factor value: 4.45 | ISO 9001:2008 Certified Journal | Page 555
The Parameters, which are analysed during water analysis, Ph, Temperature, Total alkalinity, TDS, EC, Total hardness ,Calcium, Magnesium, Chloride, Iron, Fluoride, Nitrate, Sodium, Potassium, Sulphate, Phosphate.
2.1 Determination of Water Quality Index The WQI has been calculated to evaluate the suitability of groundwater quality of the study area for drinking purposes.
The WHO (2004) standards for drinking purposes have been considered for the calculation of WQI. For the calculation of WQI, Nine parameters such as: pH, TDS, Total Hardness, Calcium, Magnesium, Sulphates, Chlorides, Fluorides, Nitrates have been used. To compute WQI four steps are followed.
2.1.1 First Step: Each of 9 parameters has been assigned a weight (wi) according to its relative importance in the overall quality of water for drinking purposes. The maximum weight of 5 has been assigned to parameters such as nitrate due to their major importance in water quality assessment (Srinivasamoorthy et al., 2008). Other parameters like calcium, magnesium, sodium and potassium were assigned a weight between 1 and 5 depending on their importance in the overall quality of water for drinking purposes.
2.1.2 Second Step: The relative weight (Wi) is computed using a weighted arithmetic index method given below (Brown et al., 1972; Horton, 1965; Tiwari and Manzoor, 1988) in the following steps.
Where, Wi is the relative weight, wi is the weight of each parameter and n is the number of parameter. 2.1.3 Third Step: A quality rating scale (Qi) for each parameter is assigned by dividing its concentration in each water
sample by its respective standard according to the guidelines of WHO (2004) and then multiplied by 100. Qi = (Ci / Si) × 100 Where Qi is the quality rating, Ci is the concentration of each chemical parameter in each water sample in mg/L and Si is the WHO drinking water standard for each chemical parameter in mg/L according to the guidelines of WHO (2004) 2.1.4 Fourth Step: The SIi is first determined for each chemical parameter, which is then used to determine the WQI as per
the following equation: SIi = Wi × Qi Where SIi is the sub index of ith parameter and Qi is the rating based on concentration of ith parameter. The overall water quality index (WQI) was calculated by adding together each sub index values of each groundwater samples as follows:
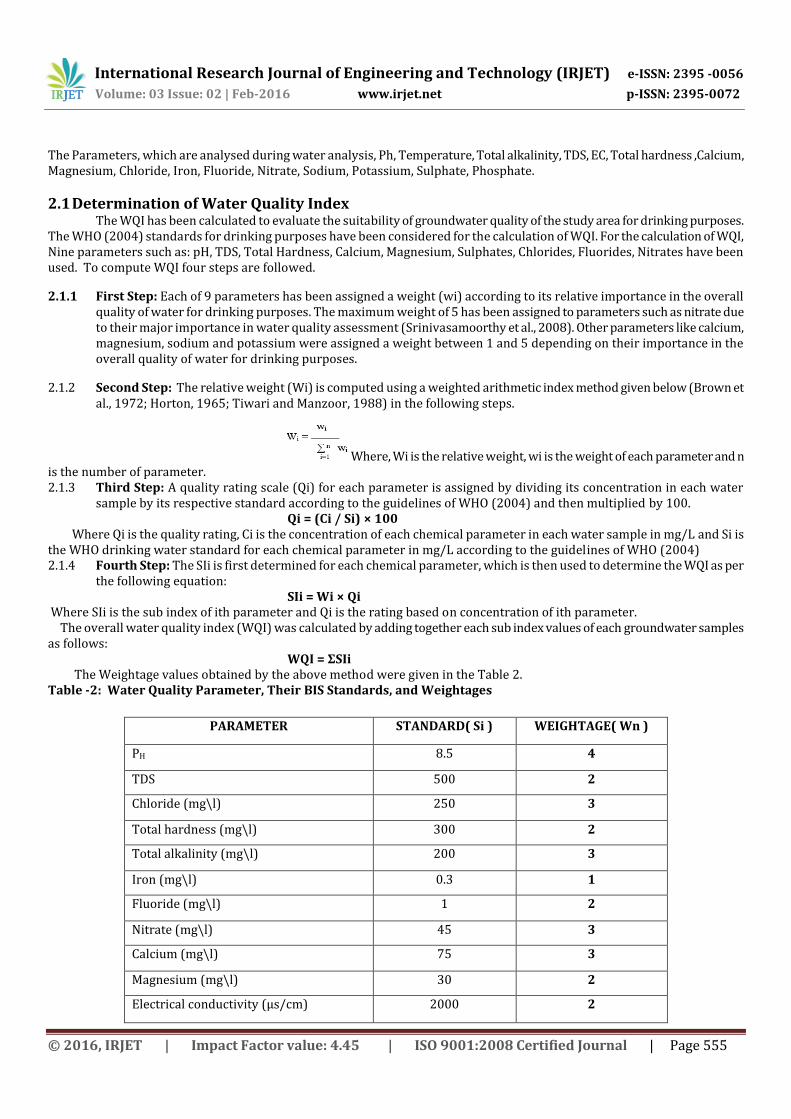
WQI = ΣSIi The Weightage values obtained by the above method were given in the Table 2. Table -2: Water Quality Parameter, Their BIS Standards, and Weightages
PARAMETER STANDARD( Si ) WEIGHTAGE( Wn )
PH 8.5 4
TDS 500 2
Chloride (mg\l) 250 3
Total hardness (mg\l) 300 2
Total alkalinity (mg\l) 200 3
Iron (mg\l) 0.3 1
Fluoride (mg\l) 1 2
Nitrate (mg\l) 45 3
Calcium (mg\l) 75 3
Magnesium (mg\l) 30 2
Electrical conductivity (µs/cm) 2000 2
International Research Journal of Engineering and Technology (IRJET) e-ISSN: 2395 -0056
Volume: 03 Issue: 02 | Feb-2016 www.irjet.net p-ISSN: 2395-0072
© 2016, IRJET | Impact Factor value: 4.45 | ISO 9001:2008 Certified Journal | Page 556
Sodium (mg\l) 200 2
Potassium 12 1
Sulphate( mg\l) 200 2
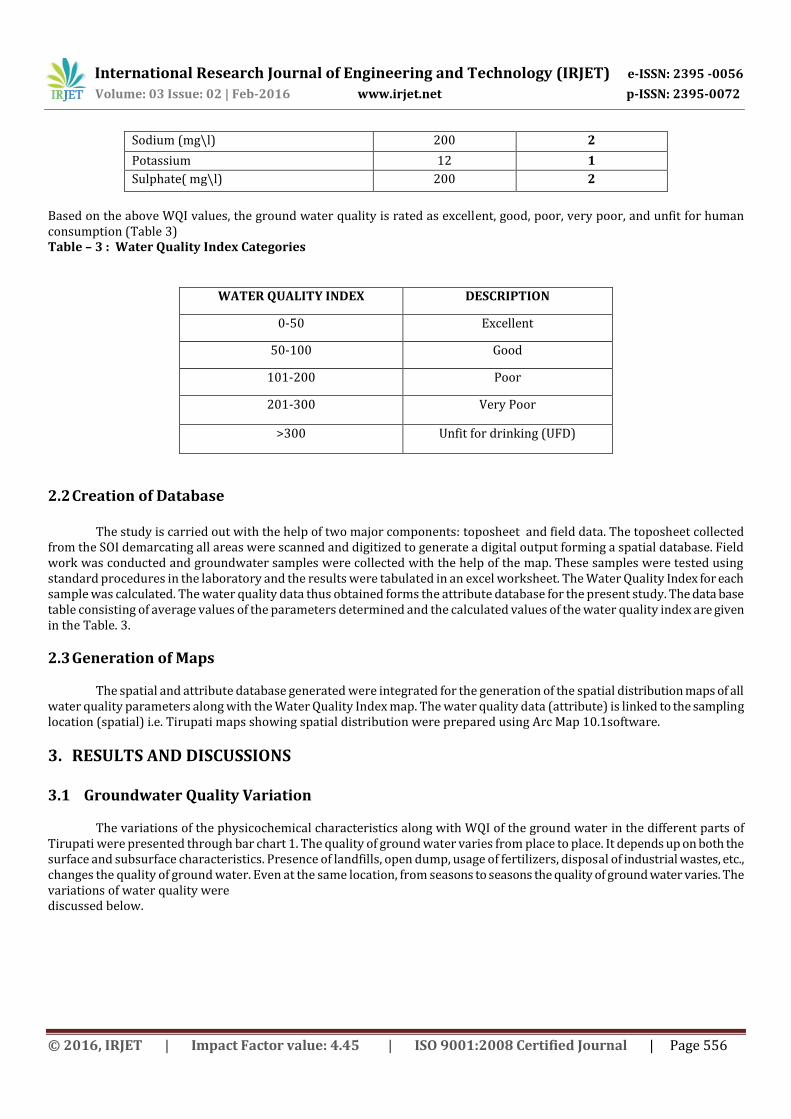
Based on the above WQI values, the ground water quality is rated as excellent, good, poor, very poor, and unfit for human consumption (Table 3) Table – 3 : Water Quality Index Categories
WATER QUALITY INDEX DESCRIPTION
0-50 Excellent
50-100 Good
101-200 Poor
201-300 Very Poor
>300 Unfit for drinking (UFD)
2.2 Creation of Database The study is carried out with the help of two major components: toposheet and field data. The toposheet collected
from the SOI demarcating all areas were scanned and digitized to generate a digital output forming a spatial database. Field work was conducted and groundwater samples were collected with the help of the map. These samples were tested using standard procedures in the laboratory and the results were tabulated in an excel worksheet. The Water Quality Index for each sample was calculated. The water quality data thus obtained forms the attribute database for the present study. The data base table consisting of average values of the parameters determined and the calculated values of the water quality index are given in the Table. 3.
2.3 Generation of Maps The spatial and attribute database generated were integrated for the generation of the spatial distribution maps of all
water quality parameters along with the Water Quality Index map. The water quality data (attribute) is linked to the sampling location (spatial) i.e. Tirupati maps showing spatial distribution were prepared using Arc Map 10.1software.
3. RESULTS AND DISCUSSIONS
3.1 Groundwater Quality Variation
The variations of the physicochemical characteristics along with WQI of the ground water in the different parts of Tirupati were presented through bar chart 1. The quality of ground water varies from place to place. It depends up on both the surface and subsurface characteristics. Presence of landfills, open dump, usage of fertilizers, disposal of industrial wastes, etc., changes the quality of ground water. Even at the same location, from seasons to seasons the quality of ground water varies. The variations of water quality were discussed below.
International Research Journal of Engineering and Technology (IRJET) e-ISSN: 2395 -0056
Volume: 03 Issue: 02 | Feb-2016 www.irjet.net p-ISSN: 2395-0072
© 2016, IRJET | Impact Factor value: 4.45 | ISO 9001:2008 Certified Journal | Page 557
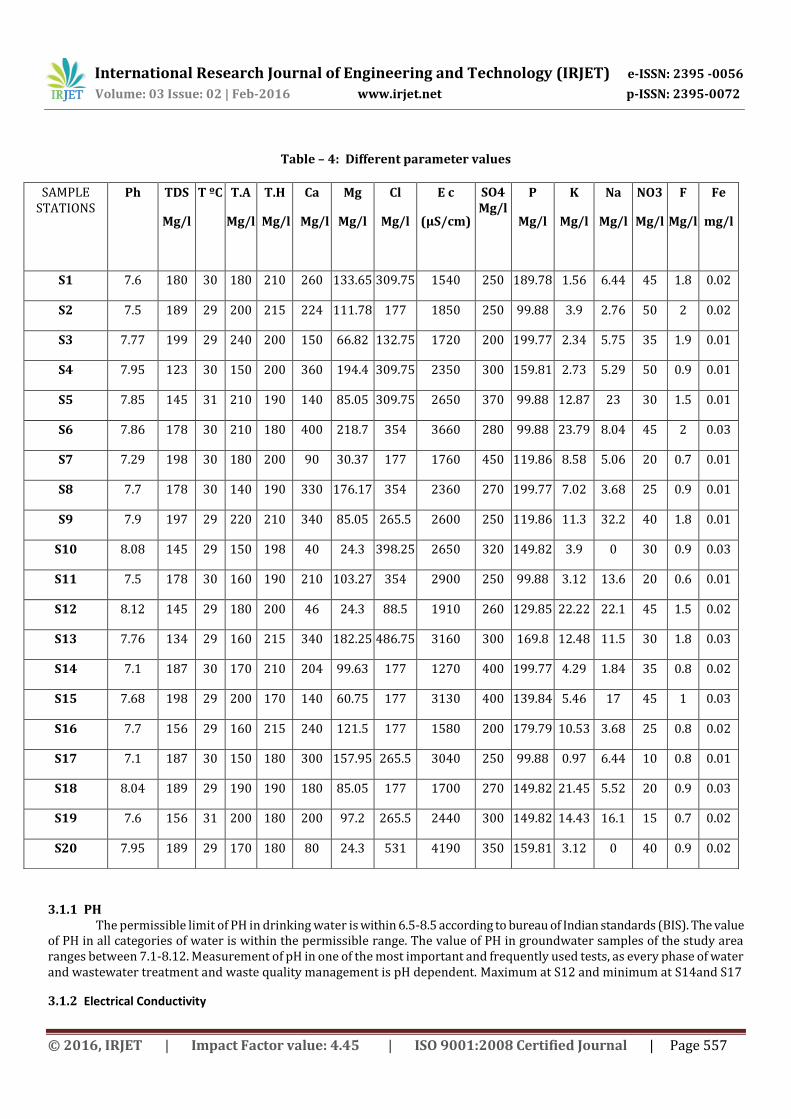
Table – 4: Different parameter values
3.1.1 PH The permissible limit of PH in drinking water is within 6.5-8.5 according to bureau of Indian standards (BIS). The value
of PH in all categories of water is within the permissible range. The value of PH in groundwater samples of the study area ranges between 7.1-8.12. Measurement of pH in one of the most important and frequently used tests, as every phase of water and wastewater treatment and waste quality management is pH dependent. Maximum at S12 and minimum at S14and S17
3.1.2 Electrical Conductivity
SAMPLE STATIONS
Ph TDS
Mg/l
T ºC
T.A
Mg/l
T.H
Mg/l
Ca
Mg/l
Mg
Mg/l
Cl
Mg/l
E c
(μS/cm)
SO4 Mg/l
P
Mg/l
K
Mg/l
Na
Mg/l
NO3
Mg/l
F
Mg/l
Fe
mg/l
S1 7.6 180 30 180 210 260 133.65 309.75 1540 250 189.78 1.56 6.44 45 1.8 0.02
S2 7.5 189 29 200 215 224 111.78 177 1850 250 99.88 3.9 2.76 50 2 0.02
S3 7.77 199 29 240 200 150 66.82 132.75 1720 200 199.77 2.34 5.75 35 1.9 0.01
S4 7.95 123 30 150 200 360 194.4 309.75 2350 300 159.81 2.73 5.29 50 0.9 0.01
S5 7.85 145 31 210 190 140 85.05 309.75 2650 370 99.88 12.87 23 30 1.5 0.01
S6 7.86 178 30 210 180 400 218.7 354 3660 280 99.88 23.79 8.04 45 2 0.03
S7 7.29 198 30 180 200 90 30.37 177 1760 450 119.86 8.58 5.06 20 0.7 0.01
S8 7.7 178 30 140 190 330 176.17 354 2360 270 199.77 7.02 3.68 25 0.9 0.01
S9 7.9 197 29 220 210 340 85.05 265.5 2600 250 119.86 11.3 32.2 40 1.8 0.01
S10 8.08 145 29 150 198 40 24.3 398.25 2650 320 149.82 3.9 0 30 0.9 0.03
S11 7.5 178 30 160 190 210 103.27 354 2900 250 99.88 3.12 13.6 20 0.6 0.01
S12 8.12 145 29 180 200 46 24.3 88.5 1910 260 129.85 22.22 22.1 45 1.5 0.02
S13 7.76 134 29 160 215 340 182.25 486.75 3160 300 169.8 12.48 11.5 30 1.8 0.03
S14 7.1 187 30 170 210 204 99.63 177 1270 400 199.77 4.29 1.84 35 0.8 0.02
S15 7.68 198 29 200 170 140 60.75 177 3130 400 139.84 5.46 17 45 1 0.03
S16 7.7 156 29 160 215 240 121.5 177 1580 200 179.79 10.53 3.68 25 0.8 0.02
S17 7.1 187 30 150 180 300 157.95 265.5 3040 250 99.88 0.97 6.44 10 0.8 0.01
S18 8.04 189 29 190 190 180 85.05 177 1700 270 149.82 21.45 5.52 20 0.9 0.03
S19 7.6 156 31 200 180 200 97.2 265.5 2440 300 149.82 14.43 16.1 15 0.7 0.02
S20 7.95 189 29 170 180 80 24.3 531 4190 350 159.81 3.12 0 40 0.9 0.02
International Research Journal of Engineering and Technology (IRJET) e-ISSN: 2395 -0056
Volume: 03 Issue: 02 | Feb-2016 www.irjet.net p-ISSN: 2395-0072
© 2016, IRJET | Impact Factor value: 4.45 | ISO 9001:2008 Certified Journal | Page 558
Electrical conductivity is the ability of water to allow electric current Through it and is expressed in micro mhos per centimeter (µ mhos/cm). Conductivity value of fresh waters is in the range of 5 to 500 µmhos/cm. Maximum value of 4190µ
mhos/cm was observed at while minimum value was 1270µ mhos/cm at
3.1.3. Total Alkalinity
The values of alkalinity at stations were found in the range of 140-240mg/l. The alkalinity values for all seasons
fluctuate from 30-40mg/l. The value shows that there is very little fluctuation in alkalinity in the area. Maximum at 240 mg/l
and minimum at 140 mg/l.
3.1.4. Total Hardness
Hardness is frequently used as an assessment of the quality of water supplies. The hardness of a water is governed by the content of calcium and magnesium salts (temporary hardness), largely combined with bicarbonate and carbonate and
with sulphates, chlorides, and other an ions of mineral acids (permanent hardness)maximum at , 215mg/l and
minimum at 180 mg/l.
3.1.5 Iron
High levels of iron are attributed to the dominating literatic soil. Iron in drinking water may be present as geological sources, industrial wastes and domestic discharges and also from mining products. Excess amount of iron i.e., more than 10mg/l causes rapid increase in respiration, pulse rate and coagulation of blood vessels. The concentration of iron in all water
samples of the study area ranges from 0.01-0.03 mg/l. Maximum at 0.03 mg/l and minimum at
0.01 mg/l.
3.1.6 Fluoride
The fluoride concentrations were found to be in the range of 0.6-2.0 mg/l in ground water, fluoride concentrations vary with the type of rock that the water flows through but do not usually exceed 10mg/l. Presence of large quantities fluoride
is associated with dental and skeletal fluorosis and inadequate amounts with dental caries. Maximum at 2 mg/l and
minimum at 0.6 mg/l.
3.1.7 Nitrate
The nitrite concentration in the study area ranges from 10-50 mg/l. The permissible limit of nitrate is 45mg/l. Nitrates generally occur in trace quantities in surface waters but may attain high levels in ground waters. It can be toxic to certain aquatic organisms even at concentrations of 100mg/l. In excessive limits, it contributes to the illness known as
methenogobinemia in infants. Maximum at 50 mg/l and minimum at 10 mg/l.
3.1.8 Calcium The maximum permissible and allowable concentration of calcium in drinking water in study area ranges between 2-
20 mg/l. Calcium is a major constituent of various types of rocks. Calcium is a cause for hardness in water and incrustation in boilers. Calcium is an essential constituent of human being. The low content of calcium in drinking water may cause rickets and
defective teeth. It is essential for nervous system, cardiac function and coagulation of blood. Maximum at 400 mg/l and
minimum at 0 mg/l.
3.1.9 Chloride
The chloride concentration in the study area ranges from 2.5-15 mg/l. The permissible limit of chlorides is 250mg/l. High chloride content may harm metallic pipes and structures as well as growing plants. Chlorides in excess imparts the salty
International Research Journal of Engineering and Technology (IRJET) e-ISSN: 2395 -0056
Volume: 03 Issue: 02 | Feb-2016 www.irjet.net p-ISSN: 2395-0072
© 2016, IRJET | Impact Factor value: 4.45 | ISO 9001:2008 Certified Journal | Page 559
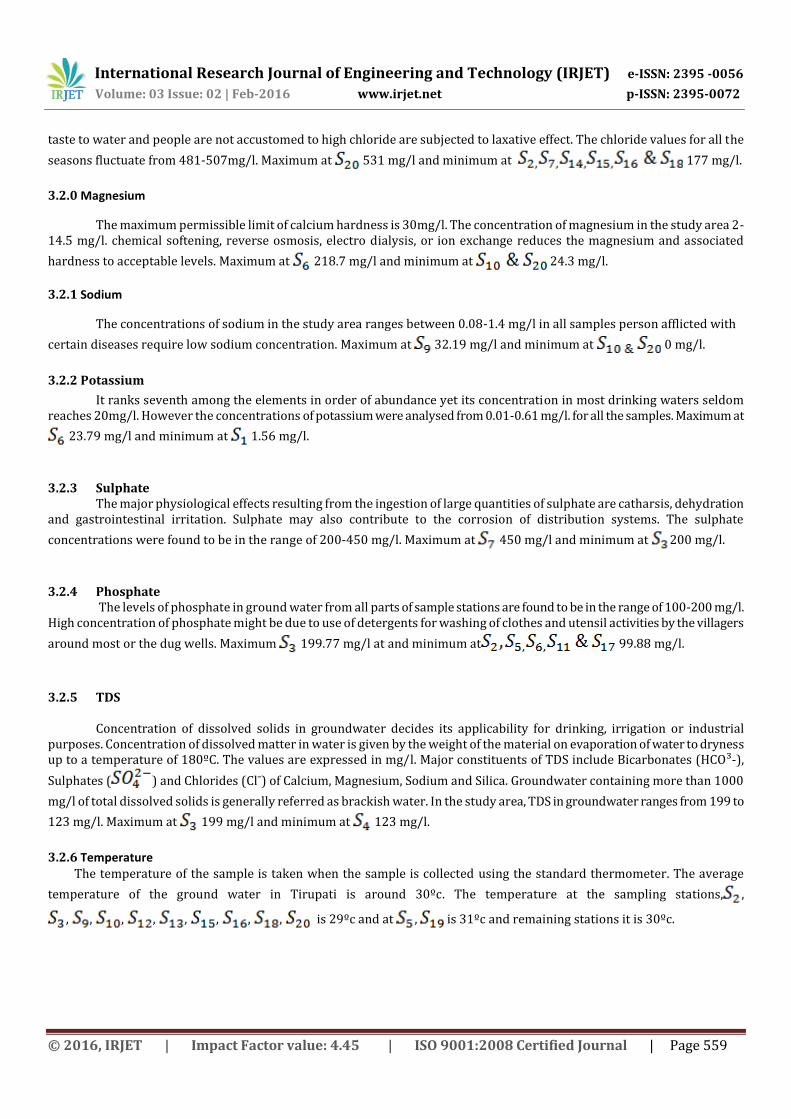
taste to water and people are not accustomed to high chloride are subjected to laxative effect. The chloride values for all the
seasons fluctuate from 481-507mg/l. Maximum at 531 mg/l and minimum at 177 mg/l.
3.2.0 Magnesium
The maximum permissible limit of calcium hardness is 30mg/l. The concentration of magnesium in the study area 2-14.5 mg/l. chemical softening, reverse osmosis, electro dialysis, or ion exchange reduces the magnesium and associated
hardness to acceptable levels. Maximum at 218.7 mg/l and minimum at 24.3 mg/l.
3.2.1 Sodium
The concentrations of sodium in the study area ranges between 0.08-1.4 mg/l in all samples person afflicted with
certain diseases require low sodium concentration. Maximum at 32.19 mg/l and minimum at 0 mg/l.
3.2.2 Potassium
It ranks seventh among the elements in order of abundance yet its concentration in most drinking waters seldom reaches 20mg/l. However the concentrations of potassium were analysed from 0.01-0.61 mg/l. for all the samples. Maximum at
23.79 mg/l and minimum at 1.56 mg/l.
3.2.3 Sulphate The major physiological effects resulting from the ingestion of large quantities of sulphate are catharsis, dehydration
and gastrointestinal irritation. Sulphate may also contribute to the corrosion of distribution systems. The sulphate
concentrations were found to be in the range of 200-450 mg/l. Maximum at 450 mg/l and minimum at 200 mg/l.
3.2.4 Phosphate The levels of phosphate in ground water from all parts of sample stations are found to be in the range of 100-200 mg/l.
High concentration of phosphate might be due to use of detergents for washing of clothes and utensil activities by the villagers
around most or the dug wells. Maximum 199.77 mg/l at and minimum at 99.88 mg/l.
3.2.5 TDS Concentration of dissolved solids in groundwater decides its applicability for drinking, irrigation or industrial
purposes. Concentration of dissolved matter in water is given by the weight of the material on evaporation of water to dryness up to a temperature of 180ºC. The values are expressed in mg/l. Major constituents of TDS include Bicarbonates (HCO³-),
Sulphates ( ) and Chlorides (Clˉ) of Calcium, Magnesium, Sodium and Silica. Groundwater containing more than 1000
mg/l of total dissolved solids is generally referred as brackish water. In the study area, TDS in groundwater ranges from 199 to
123 mg/l. Maximum at 199 mg/l and minimum at 123 mg/l.
3.2.6 Temperature The temperature of the sample is taken when the sample is collected using the standard thermometer. The average
temperature of the ground water in Tirupati is around 30ºc. The temperature at the sampling stations, ,
, , , , , , , , is 29ºc and at , is 31ºc and remaining stations it is 30ºc.
International Research Journal of Engineering and Technology (IRJET) e-ISSN: 2395 -0056
Volume: 03 Issue: 02 | Feb-2016 www.irjet.net p-ISSN: 2395-0072
© 2016, IRJET | Impact Factor value: 4.45 | ISO 9001:2008 Certified Journal | Page 560
International Research Journal of Engineering and Technology (IRJET) e-ISSN: 2395 -0056
Volume: 03 Issue: 02 | Feb-2016 www.irjet.net p-ISSN: 2395-0072
© 2016, IRJET | Impact Factor value: 4.45 | ISO 9001:2008 Certified Journal | Page 561
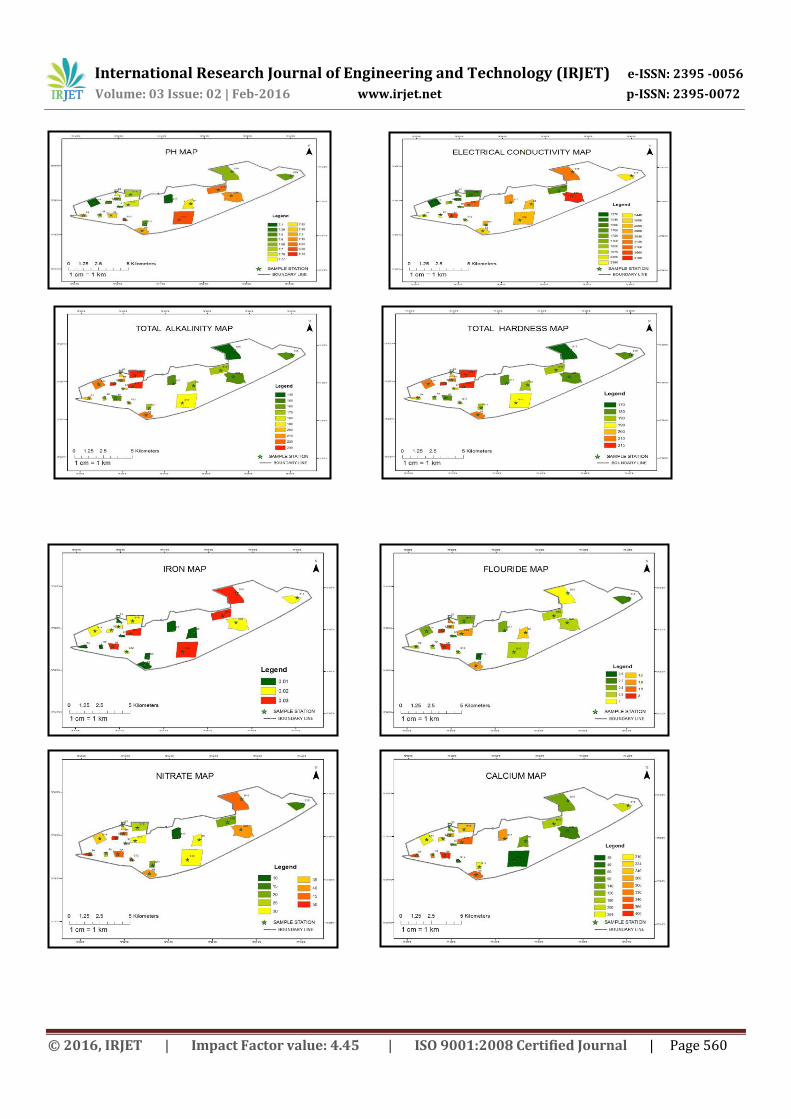
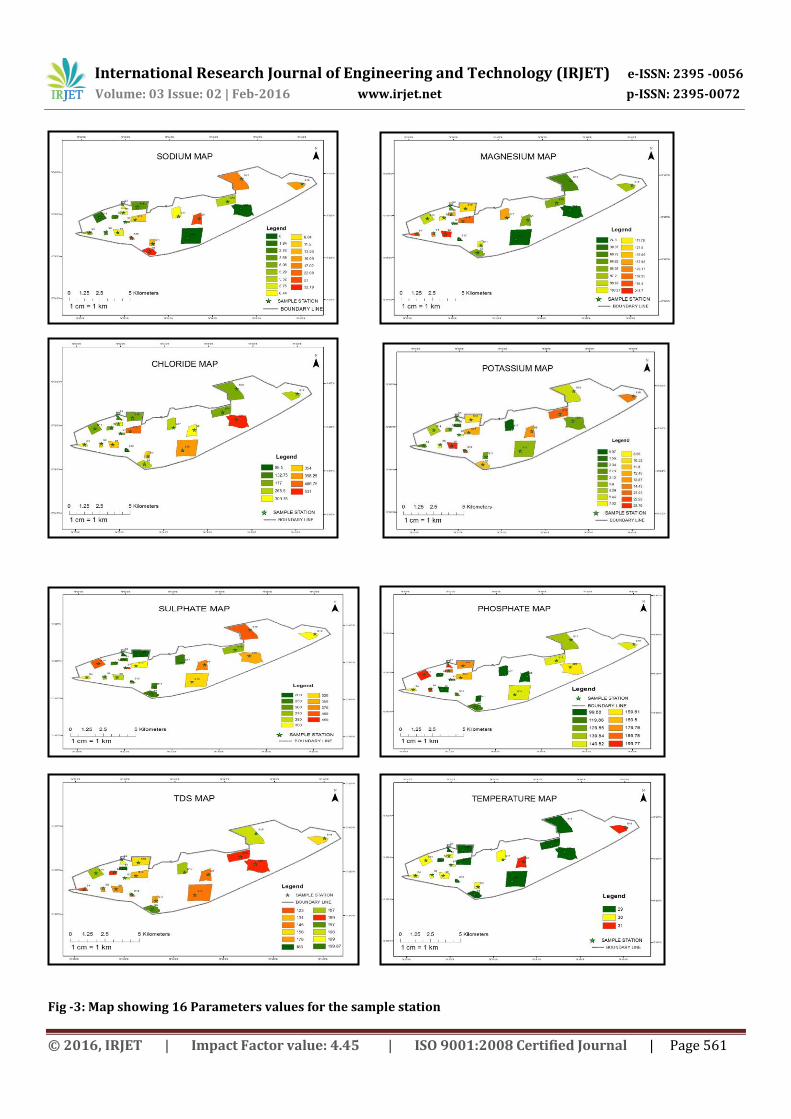
Fig -3: Map showing 16 Parameters values for the sample station
International Research Journal of Engineering and Technology (IRJET) e-ISSN: 2395 -0056
Volume: 03 Issue: 02 | Feb-2016 www.irjet.net p-ISSN: 2395-0072
© 2016, IRJET | Impact Factor value: 4.45 | ISO 9001:2008 Certified Journal | Page 562
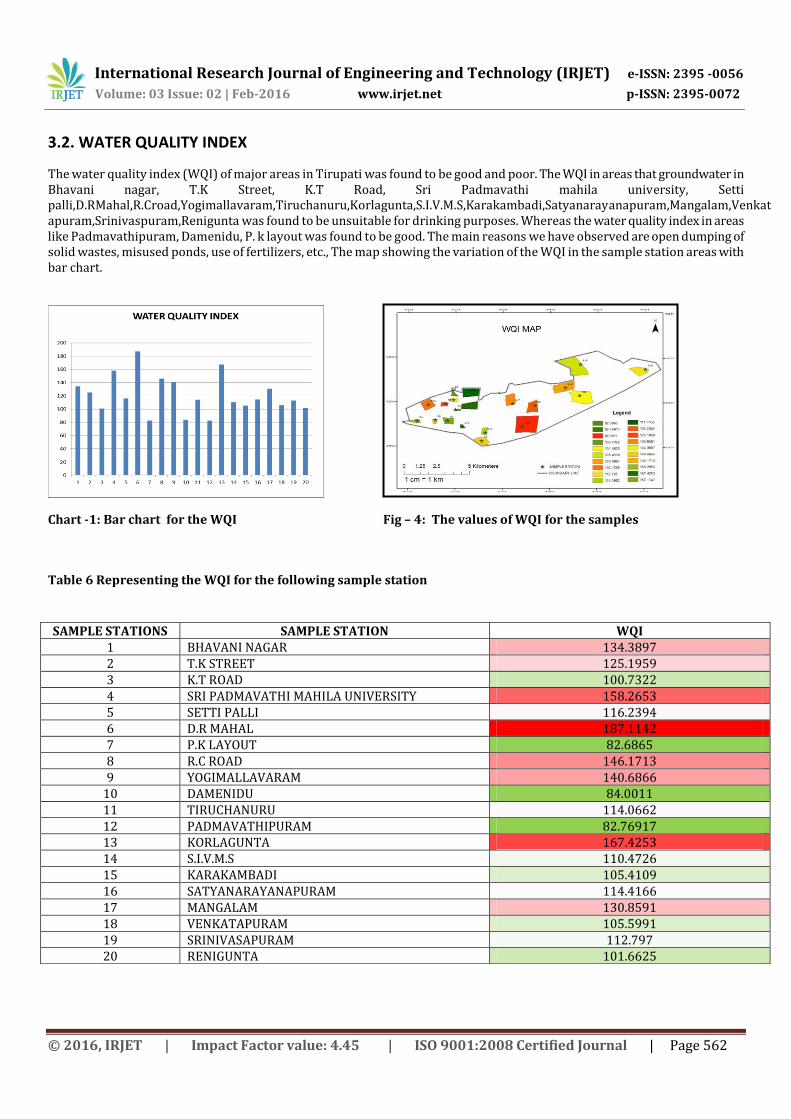
3.2. WATER QUALITY INDEX
The water quality index (WQI) of major areas in Tirupati was found to be good and poor. The WQI in areas that groundwater in Bhavani nagar, T.K Street, K.T Road, Sri Padmavathi mahila university, Setti palli,D.RMahal,R.Croad,Yogimallavaram,Tiruchanuru,Korlagunta,S.I.V.M.S,Karakambadi,Satyanarayanapuram,Mangalam,Venkatapuram,Srinivaspuram,Renigunta was found to be unsuitable for drinking purposes. Whereas the water quality index in areas like Padmavathipuram, Damenidu, P. k layout was found to be good. The main reasons we have observed are open dumping of solid wastes, misused ponds, use of fertilizers, etc., The map showing the variation of the WQI in the sample station areas with bar chart.
Chart -1: Bar chart for the WQI Fig – 4: The values of WQI for the samples
Table 6 Representing the WQI for the following sample station
SAMPLE STATIONS SAMPLE STATION WQI 1 BHAVANI NAGAR 134.3897 2 T.K STREET 125.1959 3 K.T ROAD 100.7322 4 SRI PADMAVATHI MAHILA UNIVERSITY 158.2653 5 SETTI PALLI 116.2394 6 D.R MAHAL 187.1142 7 P.K LAYOUT 82.6865 8 R.C ROAD 146.1713 9 YOGIMALLAVARAM 140.6866
10 DAMENIDU 84.0011 11 TIRUCHANURU 114.0662 12 PADMAVATHIPURAM 82.76917 13 KORLAGUNTA 167.4253 14 S.I.V.M.S 110.4726 15 KARAKAMBADI 105.4109 16 SATYANARAYANAPURAM 114.4166 17 MANGALAM 130.8591 18 VENKATAPURAM 105.5991 19 SRINIVASAPURAM 112.797 20 RENIGUNTA 101.6625
International Research Journal of Engineering and Technology (IRJET) e-ISSN: 2395 -0056
Volume: 03 Issue: 02 | Feb-2016 www.irjet.net p-ISSN: 2395-0072
© 2016, IRJET | Impact Factor value: 4.45 | ISO 9001:2008 Certified Journal | Page 563
4. CONCLUSION The present work reveals whether the water is suitable or unsuitable for drinking purposes in the area. The major conclusions drawn from the study were given below. It is observed that the areas like Bhavani nagar, T.K Street, K.T Road, Sri Padmavathi mahila university, Settipalli,D.R. Mahal, R.C road, Yogmallavaram, Tiruchanuru, Korlagunta, S.I.V.M.S, Karakambadi, Satyanarayanapuram, Mangalam, Venkatapuram, Srinivaspuram,Renigunta had water quality which is poor for drinking. Necessary measures are to be taken to supply safe drinking water to the people living in the villages. It is observed that the fluoride concentration is high in the area, D.R Mahal, Bhavani nagar, T. k Street, k.t road, Settipalli, Yogimallavaram, Padmavathipuram, Korlagunta. In other areas it is found to be within desired limits.Renigunta, Srinivaspuram, Mangalam, korlagunta, Tiruchanuru, Damenidu, Yogimallavaram, R.C Road, D.R Mahal , settipalli, Sri Padmavathi Mahila university, Bhavani nagar was found to be affected by the high chloride concentration whereas the other areas found to be having chloride concentration with in permissible limits.Alkalinity was found to be high in the areas like K.T road, settipalli, D.r Mahal, Yogimallavaram.Total hardness was found to be high in Bhavani nagar, T.K.Street, Yogimallavaram, Satyanarayanapuram, Korlagunta, S.I.V.M.S to be high Whereas the other areas found to be having hardness with in permissible limits. Total dissolved salts were within in the permissible limit for all areas ph was found to be within the permissible limit in all the areas, Highest Ph can be seen at Padmavathipuram which is 8.12.Iron also found be within the permissible limit in all the areas. Potassium was found to be high in the areas like settipalli, D.R Mahal, Padmavathipuram, korlagunta, Venkatapuram, Srinivaspuram, remaining areas was within the permissible limit. Sodium was found to be within in the permissible limit for all areas. Calcium was found to be high in all areas Except Damenidu, Padmavathipuram. Nitrate was found to be high in the areas like T.K Street, and Sri Padmavathi Mahila University, remaining areas are all lies in the permissible limit. Electrical conductivity Sri Padmavathi mahila university, Settipalli, D.R Mahal, R.C Road, Yogimallavaram, Damenidu, Tiruchanuru, korlagunta, Karkambadi, Mangalam, Srinivaspuram, Renigunta was found to be high. Sulphur was found to be high except in K.T Road, Satyanarayanapuram. Magnesium was found to be high except in Renigunta, Padmavathipuram, Damenidu. As WQI is more than 100 for Bhavani nagar, T.K Street, K.T Road, Sri Padmavathi mahila university, Setti palli, D.R Mahal, R.C road, Yogimallavaram,Tiruchanuru,Korlagunta,S.I.V.M.S,Karakambadi,Satyanarayanapuram,Mangalam,Venkatapuram,Srinivaspuram,Renigunta, water in these areas are poor for drinking. The final output has been given in the thematic representation of ground water quality. The analysis suggests that the groundwater of the area needs some degree of treatment before consumption. The study helps us to understand the quality of the water as well as to develop suitable management practices to protect the ground water resources. WQI is less than 100 in only three areas Padmavathipuram, Damenidu, P. k layout which doesn’t require further treatment and hence it can be consumed directly.
REFERENCES:
[1] APHA, 2005. Standard methods for the examination of water and wastewater. American Public Health Association, Washington D.C. [2] BIS, 2003. Indian standard for drinking water specification – 10500. Bureau of Indian Standards, New Delhi. [3] Mohammad Alam and Pathak J.K, 2011. Rapid Assessment of Water Quality Index of Ramganga River, Western Uttar Pradesh (India) Using a Computer Programme, Nature and Science: 1-8. [4] Mouna Ketata-Rokbani, Moncef Gueddari and Rachida Bouhlila, 2011. Use of Geographical Information System and Water Quality Index to Assess Groundwater Quality in El Khairat Deep Aquifer (Enfidha, Tunisian Sahel). Iranica Journal of Energy & Environment Vol.2 (2): 133-144 [5] Manjunatha .H, Arvinda. H.B. and Puttaih. E.T, 2011. Subsurface water quality of Challakera Taluk, Kartnataka. Indian J.Env.Prot., 31(6) : 511 – 513. [6] Mangukiya Rupal, Bhattacharya Tanushree and Chakraborty Sukalyan, 2012. Quality Characterization of Groundwater using Water Quality Index in Surat city, Gujarat, India. International Research Journal of Environment Sciences Vol. 1(4): 14-23
[7] Rizwan Reza and Gurdeep Singh, 2010. Assessment of Ground Water Quality Status by Using Water Quality Index Method in Orissa, India. World Applied Sciences Journal Vol.9 (12): 1392-1397
International Research Journal of Engineering and Technology (IRJET) e-ISSN: 2395 -0056
Volume: 03 Issue: 02 | Feb-2016 www.irjet.net p-ISSN: 2395-0072
© 2016, IRJET | Impact Factor value: 4.45 | ISO 9001:2008 Certified Journal | Page 564
[8] Tiwari.R.N, 2011. Assessment of groundwater quality and pollution potential of Jawa Block Rewa District, Madhya Pradesh, India. Proceedings of the International Academy of Ecology and Environmental Sciences., 1(3-4): 202-212. [9] Ahmad I. Khwakaram, Salih N. Majid, Nzar Y. Hama, 2012. Determination of Water Quality Index (WQI) for Qalyasan Stream in Sulaimani City/ Kurdistan Region of Iraq. International journal of plant, animal and environmental sciences Vol. 2 (4) [10] Nanda Balan.I, M.Shivakumar, Madan Kumar .P.D, 2012. An assessment of groundwater quality using water quality index in Chennai, TamilNadu, India. Chronicles of young Scientists., 3(2): 146 – 150. [11] Srinivas.P, Pradeep Kumar. G. N, Srinivasa Prasad. A, Hemalatha. T, 2011. Generation of Groundwater Quality Index Map –A Case Study Civil and Environmental Research Vol. 1, No.2
[12] Ramakrishnaiah.C.R,Sadashivaiahand.C, Ranganna .G, 2009 Assessment of Water Quality Index for the Groundwater in Tumkur Taluk, Karnataka State, India, E-Journal of Chemistry, 6(2), 523-530 [13] Moharir.A, Ramteka D.S, Moghe C.A, Wate. S.R. and Sarin R, 2002. Surface and Groundwater Quality Assessment in Bina Region. Indian J.Env.Prot., 22(9): 961- 969. [14]Srinivasa Gowd.S Pradip K.Govil, 2008. Distribution of heavy metals in surface water of Ranipet industrial area in Tamil Nadu, India. Environ Monit Assess., 136: 197 - 207. [15] Joshi.V.A, Manivel.U, Ravindar Rao.R, and Kelkar. P.S, 2002. Water Quality Assessment in Ramanathapuram District. Indian J.Env.Prot., 22(9): 970- 977. [16] Ibrahim Bathusha.M and Saseetharan .M.K, 2006. Statistical study on Physico – Chemical Characteristics of groundwater of Coimbatore South zone. Indian J.Env.Prot., 26(6): 508 – 515. June 2006. [17] Palanisamy.P.N, Geetha.A, Sujatha.M, Sivakumar.P and Karunakaran.K, 2007. Assessment of Ground Water Quality in and around Gobichettipalayam Town Erode District, Tamilnadu. E-Journal of Chemistry., 4(3): 434-439.
[18] Ashwini.V. Chandekar and Kamble.R.K, 2010. Groundwater Fluoride in Rajura Tehsil in Chandrapur District, Maharashtra. Indian J.Env.Prot., 30(10): 823 - 831. [19] Gautam. D.K. and Sharma.M.R, 2011. Water Quality Modeling and Management of Seer stream in lower Himalayas. Indian J.Env.Prot., 1,(1): 73 - 83.
[20] Charmaine Jerome and Anitha Plus, 2011. Evalution of Groundwater Quality in an industrial; Area in Bangalore, Karnataka. Indian J.Env.Prot., 31(3): 203 – 216. [21] Maheswari. J. and Sankar.K, 2011. Groundwater Quality Assessment in Vaippar River Basin Tamilnadu (India). International Journal of Current Research., 3(12):149-152.
[22] Rosario Arun Kumar.X, Giridharan.L, Shyamala.J, Velmurugan.P.M and Jayaprakash.M, 2012. Geochemical Assessment of Ground Water Quality in Cuddalore, Tamil Nadu, Sea Coast of India. World Applied Sciences Journal., 17 (8) : 1033-1039. [23] Mangukiya Rupal, Bhattacharaya Tannushree and Chakraborty Sukalyan, 2012. Quality Characterization of Groundwater using Water Quality Index in Surat city, Gujarat, India. Int.Res.J.Envitonmental Sci., Vol.1(4): 14-23. [24] Girija.T.R., Mahanta.C, and Chandramouli.V (2007), Water Quality Assessment of an untreated effluent impacted urban stream: the Bharalu Tributary of the Brahmaputra River, India.


![Sri Ramajayam Tirumala Tirupathi Pathayathirai Trust …ttptrust.com/register-list.pdf · Sri Ramajayam Tirumala Tirupathi Pathayathirai Trust [Reg] West Mambalam Chennai 600 033](https://img.pdfslide.us/doc/110x75/5af7cc477f8b9aac248c4620/sri-ramajayam-tirumala-tirupathi-pathayathirai-trust-ramajayam-tirumala-tirupathi.jpg)