Embed Size (px)
Citation preview
International Journal of Science and Research (IJSR) ISSN (Online): 2319-7064
Index Copernicus Value (2013): 6.14 | Impact Factor (2015): 6.391
Volume 5 Issue 5, May 2016
www.ijsr.net Licensed Under Creative Commons Attribution CC BY
Assessment of Ground Water Quality: Selected
Villages of Mahabubnagar Mandal & District,
Telangana State (India)
Dasaiah Srinivasulu1, Eshwar Chandra
2, Sateesh Kumar
3, Rahul
4, Santhosh
5, Gayathri
6
1Assistant Professor & In Charge, Environmental Engineering Lab, Department of Environmental Studies, Jaya Prakash Narayan College of
Engineering, Mahabubnagar, Telangana-509 001
2, 3, 4, 5, 6B.Tech Students, Department of Civil Engineering, Jaya Prakash Narayan College of Engineering, Mahabubnagar, Telangana-509
001.
Abstract: Present study aimed to analyse and compare the ground water quality with WHO standards of selected villages of
Mahabubnagar mandal. Ground water samples collected where ground water is the only source for drinking. All the ground water
samples were subjected to analysis of physico chemical parameters such as colour, turbidity, total dissolved solids, pH, electrical
conductivity, chlorides, total hardness, nitrates, fluoride, sulphates etc. The obtained results compared with WHO standards. Findings
reveal that ground water quality of the villages were deteriorating, most of the parameters found excess in limit. Almost all ground water
samples in study area found unfit for drinking purpose. It is suggesting that the evaluation of water quality parameters as well as water
quality management practices should be carried out periodically to protect water resources. The awareness campaign of waterborne
diseases and importance of safe water for human health should be commenced by Rural Water Supply and Sanitation (RWS)
department.
Keywords: Ground water, turbidity, pH, Electrical Conductivity, Hardness, dissolved solids
1. Introduction
Three fourth of the earth surface covered by water resources.
Water is very important to life. Water quality is critical
factor affecting human health and welfare. Studies showed
that approximately 1.7million deaths and 1.9 million
disabilities worldwide are attributable to unsafe water, poor
sanitation and hygiene. The problem is backward socio
economic development resulting in one of lowest standard of
living, poor environmental conditions and low level of social
services.
Ground water is an important resource for domestic and
agriculture in both rural and urban areas of India. The
chemical composition of ground water is very important
criteria that determine the quality of water. Water quality is
very important and often degraded due to agriculture,
industrial and human activities. Even though the natural
environmental processes provide by means of removing
pollutants from water, there are definite limits. It is upto the
people to provide security to protect and maintain the quality
of water. Drinking water with good quality is very important
to improve the life of people and prevent form diseases.
Pollution of ground water comes from many sources such as
discharge of waste, pesticide residues from agriculture,
industries and municipalities are the main sources.
Sometimes surface runoff also brings mud, leaves and
human and animal wastes into surface water bodies. The
pollutants may enter directly into the ground water and
contaminating it.
1.1. Study Area
Mahabub nagar is the first largest district in Telangana state
interms of area(18432 sq.km) covered. It is also also known
as Palamoor. Mahabubnagar district head quarters town
named after Mir Mahabub Alikhan, the Nizam of
Hyderabad. It extends from north latitude 770 55
’ 00
’’ and 17
0
20’ 00
’’ and east longitude 77
0 15
, 00
’’ and covered in the
survey of India topographical maps no. 56G and 56K. The
area of the district having four revenue divisions, 64
mandals and 1554 revenue villages.
In this area, the natural resources availability is very high
but facing very difficulty with water resources due to less
rainfall and high evaporation rate. Even though water
resources very less in quantity, due to lack of awareness in
farmer community available present water bodies are also
under contamination. Hence the present study has been
under taken to determine the physico chemical
characteristics of ground water in selected villages of
Mahabubnagar mandal where the ground water is the main
source for drinking.
2. Materials and Methods
The sampling places are referred as stations and coded as S1
to S15. The stations are represented as Ramreddy gudem
(S1), Bokkalonipally(S2), Zamisthapur(S3), Telugu
gudem(S4), Oblaipally(S5), Machenpally(S6), Nehru
Nagar(S7), Ramchandra puram(S8), Chowder pally(S9),
Appai pally(S10), Narsapur(S11) Dharmapur(S12),
Alipur(S13), Kodur(S14) and Oblaipally Thanda(S15) which
are comes under Mahabubnagar mandal. Water sample were
collected from various bore wells of respective villages. The
samples were collected in 1000ml plastic bottles which were
Paper ID: NOV163398 2368
International Journal of Science and Research (IJSR) ISSN (Online): 2319-7064
Index Copernicus Value (2013): 6.14 | Impact Factor (2015): 6.391
Volume 5 Issue 5, May 2016
www.ijsr.net Licensed Under Creative Commons Attribution CC BY
previously washed drenched overnight with 5% of HNO3
solution to avoid contamination. During sampling extra care
was taken and plastic bottles were rinsed several times with
the water being collected. All the samples were found
odourless and colourless. After sampling onsite analysis was
done for Temperature, pH, Electrical Conductivity due to
their unsteadiness in nature. Samples were then transferred
to Environmental Engineering lab, Jaya Prakash Narayan
College of Engineering, Dharmapur, Mahabubnagar and
kept at 80 C-10
0 C in refrigerator prior the time of analysis.
3. Results and Discussion
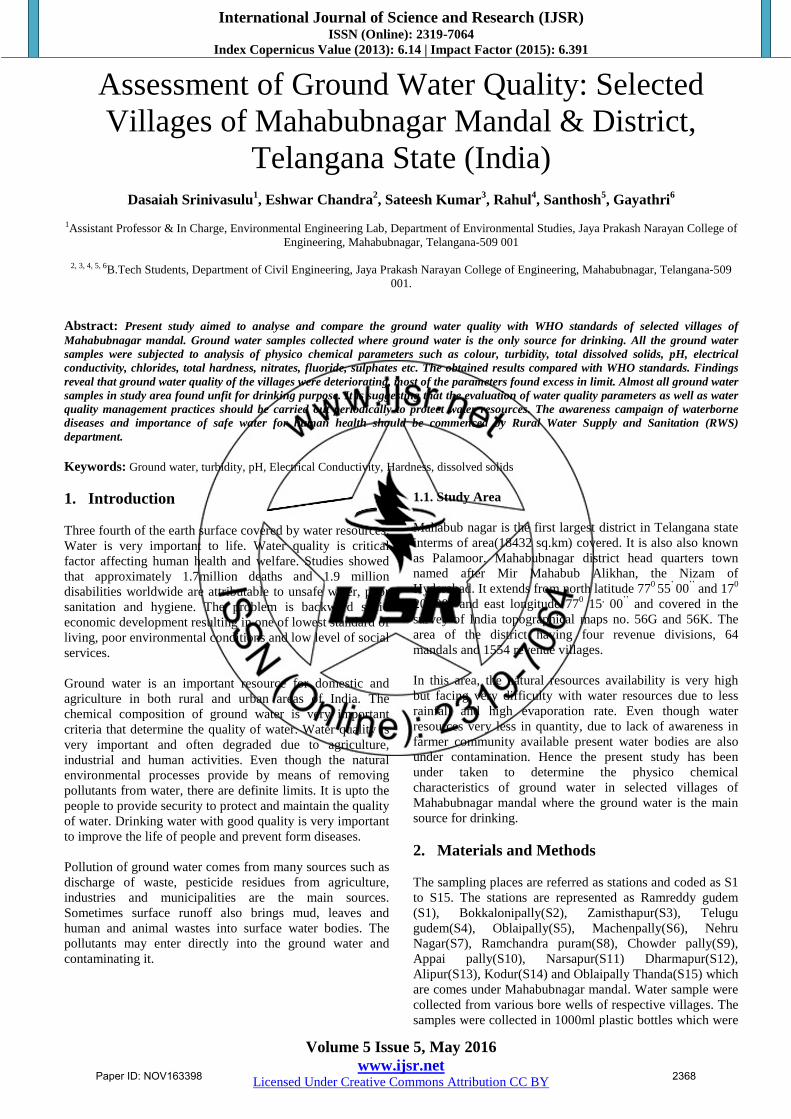
Table 1: Physico chemical analysis results of ground water samples of Mahabubnagar mandal Name of the Village pH EC TDS TA TH F Cl NO3 So4
Ram reddy gudem(S1) 7.09 1802 955 552 416 1.65 348 19 111
Bokkaloni pally(S2) 7.11 1644 871 552 412 1.57 388 24 66
Zamistapur(S3) 8.19 1641 869 576 360 1.91 328 17 59
Telugu gudem(S4) 7.68 1412 748 356 268 1.34 236 26 52
Oblaipally(S5) 7.78 1515 802 384 236 1.63 308 17 41
Machen pally(S6) 7.59 2710 1436 432 712 1.12 672 109 112
Nehru nagar(S7) 7.2 612 324 264 164 1.16 92 40 18
Ram chandra puram(S8) 7.82 709 375 172 152 1.24 52 27 17
Chowder pally(S9) 7.12 1216 644 544 318 1.37 240 26 38
Appaipally(S10) 7.89 1788 947 584 348 1.16 360 26 57
Narsapur(S11) 7.35 1180 625 188 136 1.81 92 6 99
Dharmapur(S12) 7.14 1574 834 596 412 1.62 428 864 64
Alipur(S13) 7.19 2760 1462 516 700 1.6 668 132 122
Kodur(S14) 7.8 1775 937 576 332 1.13 302 24 54
Oblaipally Thanda(S15) 7.8 1672 816 390 243 1.7 315 21 48
All parameters are expressed in mg/lit. except pH and EC. EC in μS/cm.
3.1. pH of water
The pH of water is refers to the measure of hydrogen ions
concentration in water. It ranges from 0 to 14. In general,
water with a pH of 7 is considered neutral while lower of it
referred acidic and a pH greater than 7 known as basic.
Normally, water pH ranges from 6 to 8.5. It is noticed that
water with low pH is tend to be toxic and with high degree
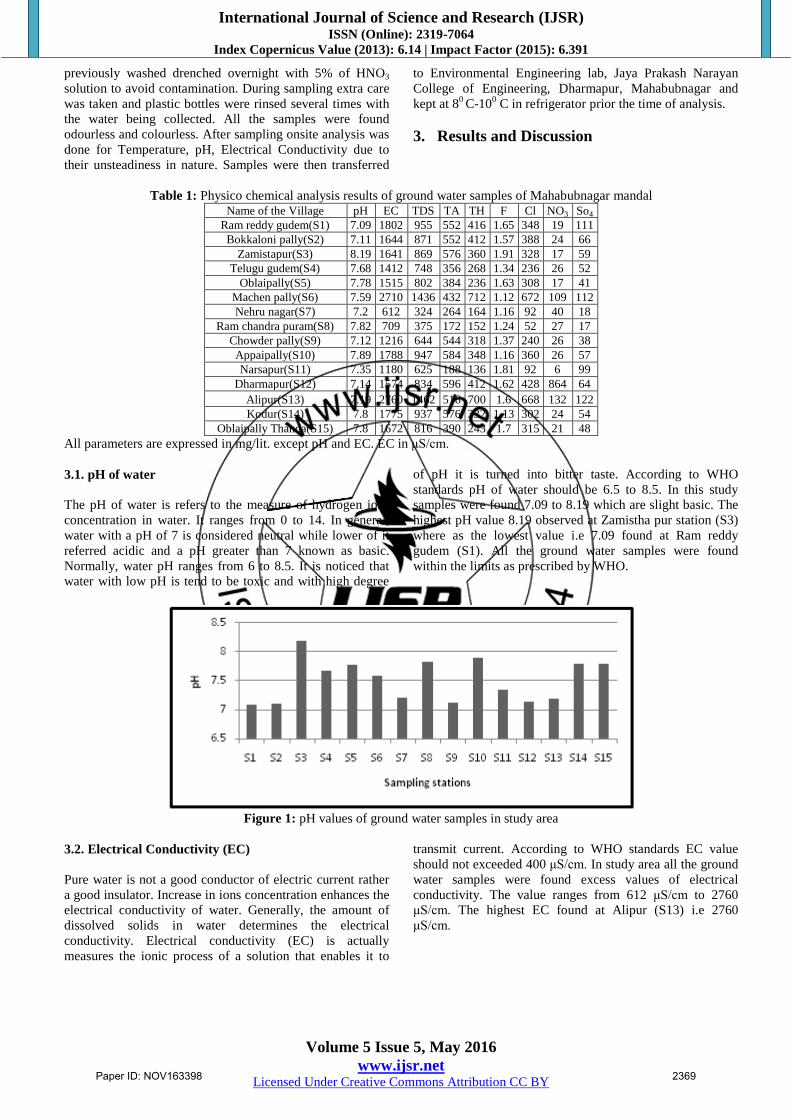
of pH it is turned into bitter taste. According to WHO
standards pH of water should be 6.5 to 8.5. In this study
samples were found 7.09 to 8.19 which are slight basic. The
highest pH value 8.19 observed at Zamistha pur station (S3)
where as the lowest value i.e 7.09 found at Ram reddy
gudem (S1). All the ground water samples were found
within the limits as prescribed by WHO.
Figure 1: pH values of ground water samples in study area
3.2. Electrical Conductivity (EC)
Pure water is not a good conductor of electric current rather
a good insulator. Increase in ions concentration enhances the
electrical conductivity of water. Generally, the amount of
dissolved solids in water determines the electrical
conductivity. Electrical conductivity (EC) is actually
measures the ionic process of a solution that enables it to
transmit current. According to WHO standards EC value
should not exceeded 400 μS/cm. In study area all the ground
water samples were found excess values of electrical
conductivity. The value ranges from 612 μS/cm to 2760
μS/cm. The highest EC found at Alipur (S13) i.e 2760
μS/cm.
Paper ID: NOV163398 2369
International Journal of Science and Research (IJSR) ISSN (Online): 2319-7064
Index Copernicus Value (2013): 6.14 | Impact Factor (2015): 6.391
Volume 5 Issue 5, May 2016
www.ijsr.net Licensed Under Creative Commons Attribution CC BY
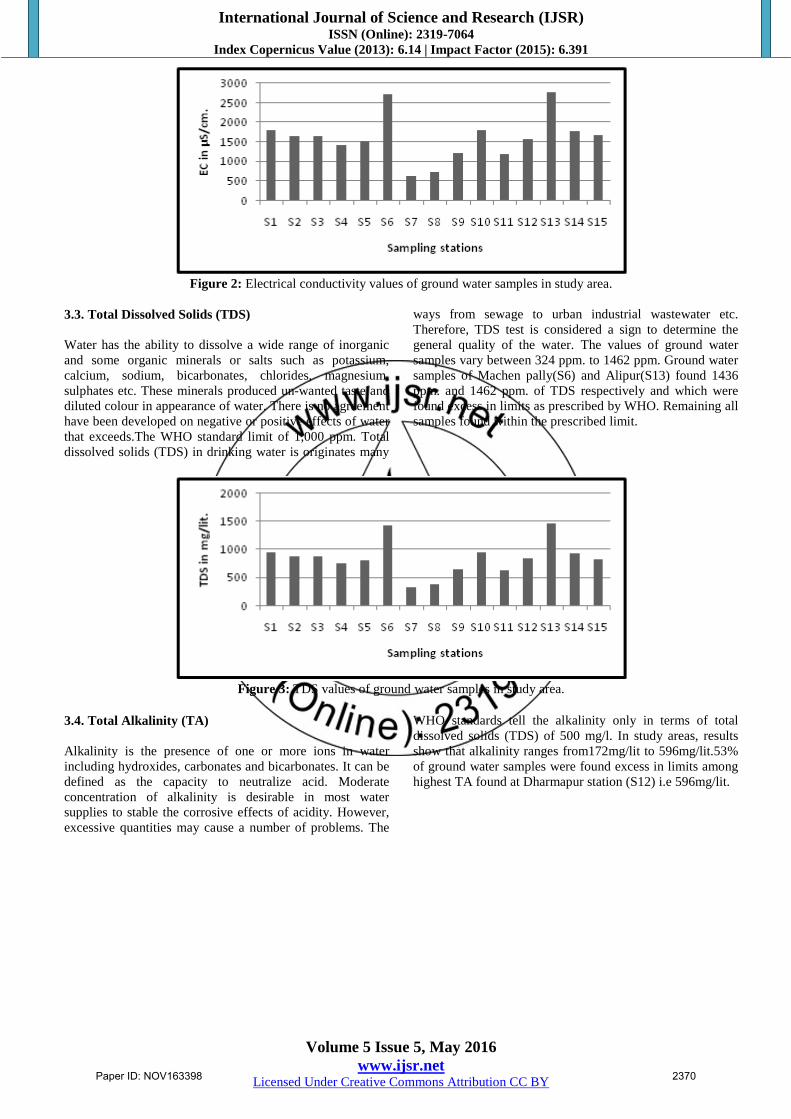
Figure 2: Electrical conductivity values of ground water samples in study area.
3.3. Total Dissolved Solids (TDS)
Water has the ability to dissolve a wide range of inorganic
and some organic minerals or salts such as potassium,
calcium, sodium, bicarbonates, chlorides, magnesium,
sulphates etc. These minerals produced un-wanted taste and
diluted colour in appearance of water. There is no agreement
have been developed on negative or positive effects of water
that exceeds.The WHO standard limit of 1,000 ppm. Total
dissolved solids (TDS) in drinking water is originates many
ways from sewage to urban industrial wastewater etc.
Therefore, TDS test is considered a sign to determine the
general quality of the water. The values of ground water
samples vary between 324 ppm. to 1462 ppm. Ground water
samples of Machen pally(S6) and Alipur(S13) found 1436
ppm. and 1462 ppm. of TDS respectively and which were
found excess in limits as prescribed by WHO. Remaining all
samples found within the prescribed limit.
Figure 3: TDS values of ground water samples in study area.
3.4. Total Alkalinity (TA)
Alkalinity is the presence of one or more ions in water
including hydroxides, carbonates and bicarbonates. It can be
defined as the capacity to neutralize acid. Moderate
concentration of alkalinity is desirable in most water
supplies to stable the corrosive effects of acidity. However,
excessive quantities may cause a number of problems. The
WHO standards tell the alkalinity only in terms of total
dissolved solids (TDS) of 500 mg/l. In study areas, results
show that alkalinity ranges from172mg/lit to 596mg/lit.53%
of ground water samples were found excess in limits among
highest TA found at Dharmapur station (S12) i.e 596mg/lit.
Paper ID: NOV163398 2370
International Journal of Science and Research (IJSR) ISSN (Online): 2319-7064
Index Copernicus Value (2013): 6.14 | Impact Factor (2015): 6.391
Volume 5 Issue 5, May 2016
www.ijsr.net Licensed Under Creative Commons Attribution CC BY
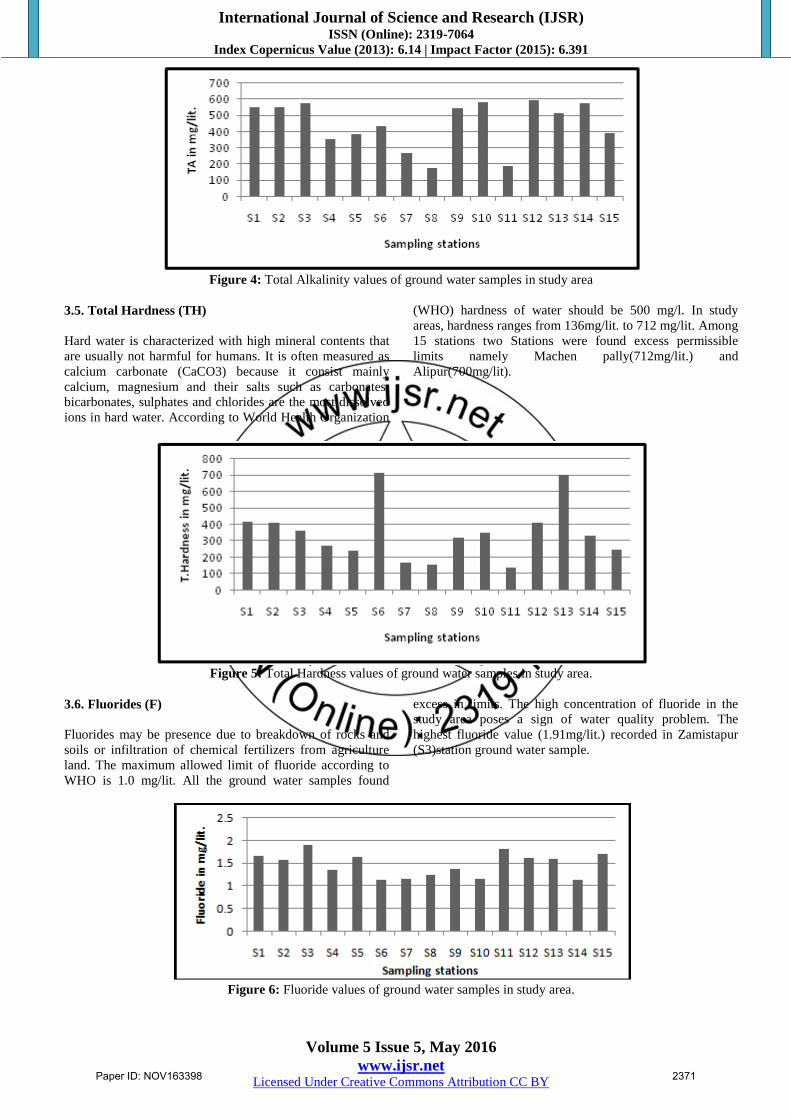
Figure 4: Total Alkalinity values of ground water samples in study area
3.5. Total Hardness (TH)
Hard water is characterized with high mineral contents that
are usually not harmful for humans. It is often measured as
calcium carbonate (CaCO3) because it consist mainly
calcium, magnesium and their salts such as carbonates,
bicarbonates, sulphates and chlorides are the most dissolved
ions in hard water. According to World Health Organization
(WHO) hardness of water should be 500 mg/l. In study
areas, hardness ranges from 136mg/lit. to 712 mg/lit. Among
15 stations two Stations were found excess permissible
limits namely Machen pally(712mg/lit.) and
Alipur(700mg/lit).
Figure 5: Total Hardness values of ground water samples in study area.
3.6. Fluorides (F)
Fluorides may be presence due to breakdown of rocks and
soils or infiltration of chemical fertilizers from agriculture
land. The maximum allowed limit of fluoride according to
WHO is 1.0 mg/lit. All the ground water samples found
excess in limits. The high concentration of fluoride in the
study area poses a sign of water quality problem. The
highest fluoride value (1.91mg/lit.) recorded in Zamistapur
(S3)station ground water sample.
Figure 6: Fluoride values of ground water samples in study area.
Paper ID: NOV163398 2371
International Journal of Science and Research (IJSR) ISSN (Online): 2319-7064
Index Copernicus Value (2013): 6.14 | Impact Factor (2015): 6.391
Volume 5 Issue 5, May 2016
www.ijsr.net Licensed Under Creative Commons Attribution CC BY
3.7. Chloride (Cl)
Chloride is mainly obtained from the dissolution of salts of
hydrochloric acid as table salt (NaCl), sodium carbonate
added through industrial waste, sewage, sea water etc.
Surface water bodies often have low concentration of
chlorides as compare to ground water. It has key importance
for metabolism activity in human body and other main
physiological processes. According to WHO standards
concentration of chloride should not exceed 250 mg/l. In
study areas, results clear that the concentration of Chloride
ranges from 52mg/lit to 672 mg/lit. 66% samples were found
excess in limits as prescribed by WHO.
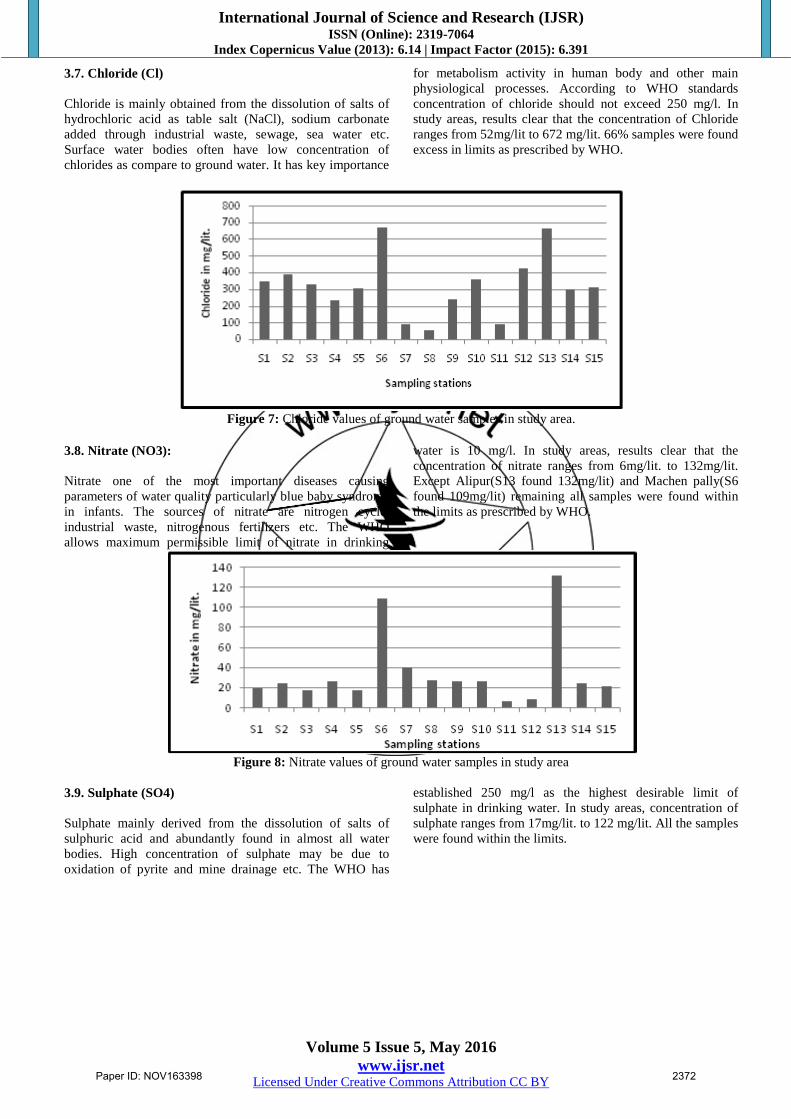
Figure 7: Chloride values of ground water samples in study area.
3.8. Nitrate (NO3):
Nitrate one of the most important diseases causing
parameters of water quality particularly blue baby syndrome
in infants. The sources of nitrate are nitrogen cycle,
industrial waste, nitrogenous fertilizers etc. The WHO
allows maximum permissible limit of nitrate in drinking
water is 10 mg/l. In study areas, results clear that the
concentration of nitrate ranges from 6mg/lit. to 132mg/lit.
Except Alipur(S13 found 132mg/lit) and Machen pally(S6
found 109mg/lit) remaining all samples were found within
the limits as prescribed by WHO.
Figure 8: Nitrate values of ground water samples in study area
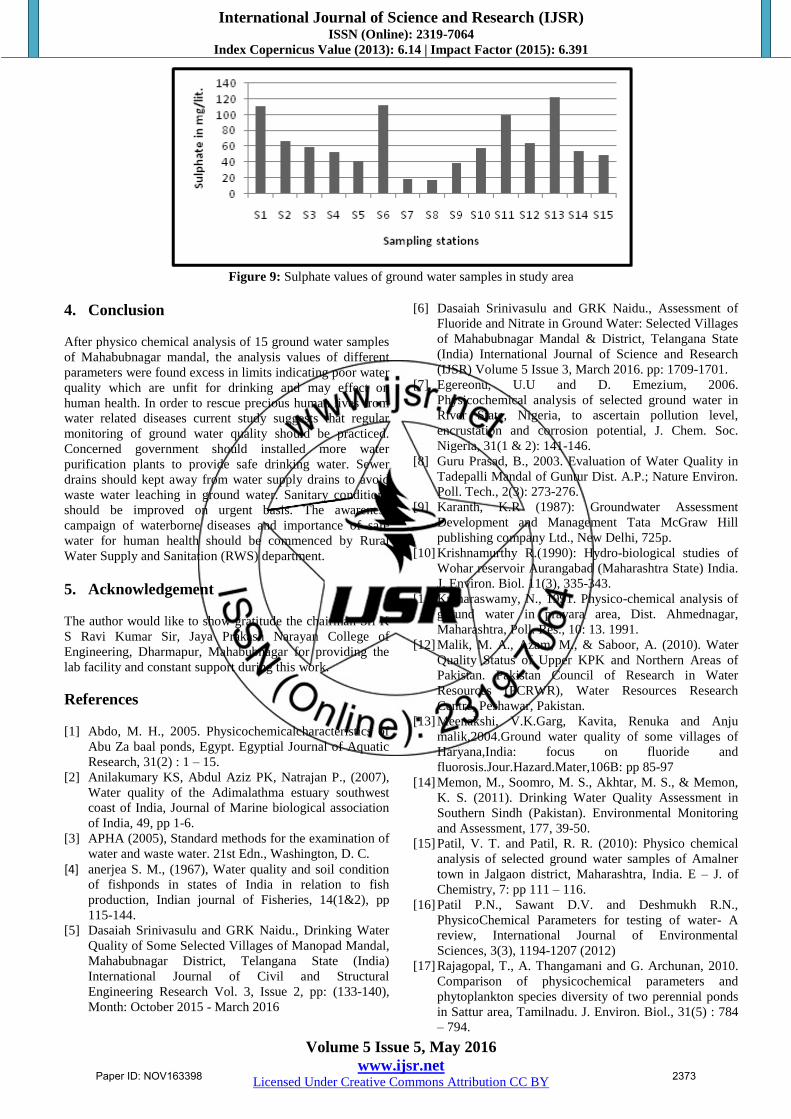
3.9. Sulphate (SO4)
Sulphate mainly derived from the dissolution of salts of
sulphuric acid and abundantly found in almost all water
bodies. High concentration of sulphate may be due to
oxidation of pyrite and mine drainage etc. The WHO has
established 250 mg/l as the highest desirable limit of
sulphate in drinking water. In study areas, concentration of
sulphate ranges from 17mg/lit. to 122 mg/lit. All the samples
were found within the limits.
Paper ID: NOV163398 2372
International Journal of Science and Research (IJSR) ISSN (Online): 2319-7064
Index Copernicus Value (2013): 6.14 | Impact Factor (2015): 6.391
Volume 5 Issue 5, May 2016
www.ijsr.net Licensed Under Creative Commons Attribution CC BY
Figure 9: Sulphate values of ground water samples in study area
4. Conclusion
After physico chemical analysis of 15 ground water samples
of Mahabubnagar mandal, the analysis values of different
parameters were found excess in limits indicating poor water
quality which are unfit for drinking and may effect on
human health. In order to rescue precious human lives from
water related diseases current study suggests that regular
monitoring of ground water quality should be practiced.
Concerned government should installed more water
purification plants to provide safe drinking water. Sewer
drains should kept away from water supply drains to avoid
waste water leaching in ground water. Sanitary conditions
should be improved on urgent basis. The awareness
campaign of waterborne diseases and importance of safe
water for human health should be commenced by Rural
Water Supply and Sanitation (RWS) department.
5. Acknowledgement
The author would like to show gratitude the chairman Sri K
S Ravi Kumar Sir, Jaya Prakash Narayan College of
Engineering, Dharmapur, Mahabubnagar for providing the
lab facility and constant support during this work.
References
[1] Abdo, M. H., 2005. Physicochemicalcharacteristics of
Abu Za baal ponds, Egypt. Egyptial Journal of Aquatic
Research, 31(2) : 1 – 15.
[2] Anilakumary KS, Abdul Aziz PK, Natrajan P., (2007),
Water quality of the Adimalathma estuary southwest
coast of India, Journal of Marine biological association
of India, 49, pp 1-6.
[3] APHA (2005), Standard methods for the examination of
water and waste water. 21st Edn., Washington, D. C. [4] anerjea S. M., (1967), Water quality and soil condition
of fishponds in states of India in relation to fish
production, Indian journal of Fisheries, 14(1&2), pp
115-144. [5] Dasaiah Srinivasulu and GRK Naidu., Drinking Water
Quality of Some Selected Villages of Manopad Mandal,
Mahabubnagar District, Telangana State (India)
International Journal of Civil and Structural
Engineering Research Vol. 3, Issue 2, pp: (133-140),
Month: October 2015 - March 2016
[6] Dasaiah Srinivasulu and GRK Naidu., Assessment of
Fluoride and Nitrate in Ground Water: Selected Villages
of Mahabubnagar Mandal & District, Telangana State
(India) International Journal of Science and Research
(IJSR) Volume 5 Issue 3, March 2016. pp: 1709-1701.
[7] Egereonu, U.U and D. Emezium, 2006.
Physicochemical analysis of selected ground water in
River State, Nigeria, to ascertain pollution level,
encrustation and corrosion potential, J. Chem. Soc.
Nigeria, 31(1 & 2): 141-146.
[8] Guru Prasad, B., 2003. Evaluation of Water Quality in
Tadepalli Mandal of Guntur Dist. A.P.; Nature Environ.
Poll. Tech., 2(3): 273-276.
[9] Karanth, K.R (1987): Groundwater Assessment
Development and Management Tata McGraw Hill
publishing company Ltd., New Delhi, 725p.
[10] Krishnamurthy R.(1990): Hydro-biological studies of
Wohar reservoir Aurangabad (Maharashtra State) India.
J. Environ. Biol. 11(3), 335-343.
[11] Kumaraswamy, N., 1991. Physico-chemical analysis of
ground water in pravara area, Dist. Ahmednagar,
Maharashtra, Poll. Res., 10: 13. 1991.
[12] Malik, M. A., Azam, M., & Saboor, A. (2010). Water
Quality Status of Upper KPK and Northern Areas of
Pakistan. Pakistan Council of Research in Water
Resources (PCRWR), Water Resources Research
Centre, Peshawar, Pakistan.
[13] Meenakshi, V.K.Garg, Kavita, Renuka and Anju
malik,2004.Ground water quality of some villages of
Haryana,India: focus on fluoride and
fluorosis.Jour.Hazard.Mater,106B: pp 85-97
[14] Memon, M., Soomro, M. S., Akhtar, M. S., & Memon,
K. S. (2011). Drinking Water Quality Assessment in
Southern Sindh (Pakistan). Environmental Monitoring
and Assessment, 177, 39-50.
[15] Patil, V. T. and Patil, R. R. (2010): Physico chemical
analysis of selected ground water samples of Amalner
town in Jalgaon district, Maharashtra, India. E – J. of
Chemistry, 7: pp 111 – 116.
[16] Patil P.N., Sawant D.V. and Deshmukh R.N.,
PhysicoChemical Parameters for testing of water- A
review, International Journal of Environmental
Sciences, 3(3), 1194-1207 (2012)
[17] Rajagopal, T., A. Thangamani and G. Archunan, 2010.
Comparison of physicochemical parameters and
phytoplankton species diversity of two perennial ponds
in Sattur area, Tamilnadu. J. Environ. Biol., 31(5) : 784
– 794.
Paper ID: NOV163398 2373
International Journal of Science and Research (IJSR) ISSN (Online): 2319-7064
Index Copernicus Value (2013): 6.14 | Impact Factor (2015): 6.391
Volume 5 Issue 5, May 2016
www.ijsr.net Licensed Under Creative Commons Attribution CC BY
[18] Rao, N. S. 2006. Seasonal variation of groundwater
quality in a part of Guntur District, Andhra Pradesh,
India. Environmental Geology. 49, 413-429.
[19] S. A. Makwana, C. G. Patel and T. J. Patel, Physico-
Chemical analysis of drinking water of Gandhinagar
District Arch. Appl. Sci. Res., 4 (1), 2012, 461-464.
[20] Venkatachalam M.R. and Jebanesan. A., 1998.
Correlation among water quality parameters for
Groundwater in Chidambaram town. Indian Journal of
Environmental Protection. 18(10): 734- 738.
[21] W. H. O. (2009) Guidelines for drinking water quality
Vol1. Recommendations. World Health Organization,
Geneva. pp 130.
Paper ID: NOV163398 2374