Embed Size (px)
Citation preview

FINAL REPORT
ASSESSMENT OF GREENHOUSE GAS MITIGATION TECHNOLOGIES FOR
NON-ENERGY SECTOR IN CAMBODIA
Cambodia's Country Study Team: Project Steering Committee: H.E. Prach Sun, Chairman National Project Coordinator: Mr. Tin Ponlok National Technical Committee:
- H.E. Khieu Muth, Chairman of the National Technical Committee - Mr. Sum Thy, Ministry of Environment (MoE) Department of Pollution Control - Mr. Heng Chan Thoeun, MoE Department of Nature Conservation & Protection - Mr. Chea Chan Thou, MoE Department of Planning and Legal Affairs - Mr. Uy Kamal, MoE Department of Natural Resource Assessment & Environmental Data
Management - Mr. Va Chanmakaravuth, Ministry of Industry, Mines and Energy - Mr. Am Phirum, Ministry of Agriculture, Forestry and Fisheries - Mr. You Dara, Ministry of Public Works and Transport - Mr. Kim Soben, Royal University of Agriculture - Mr. Sok Vannaren, Ministry of Agriculture, Forestry and Fisheries
Technical Review: - Dr. Rizaldi Boer, Bogor Agricultural University, Indonesia
Phnom Penh, March 2003 Front cover photos: Ruber Plantation in Kampong Cham, Rainfed Paddy Field in Kandal, Stoeung Meanchey Dumping Site
C A M B O D I A Climate Change Enabling Activity Project, Phase 2
CMB/97/G31 MoE
ii
TABLE OF CONTENTS
I. GENERAL INTRODUCTION 1
1.1. Background 1 1.2. General Objective 1 1.3. Specific Objectives 1 1.4. References 2
II. ASSESSMENT OF GREENHOUSE GAS MITIGATION TECHNOLOGIES FOR FORESTRY SECTOR 3 2.1. Introduction 3 2.2. Internationally Existing Greenhouse Gas Mitigation 4
Technologies 2.2.1. Type of Mitigation Activities in Forestry Sector 4 2.2.2. Assessment of Mitigation Potential 6
2.3. Implementation of Mitigation Technologies in Cambodia 9 2.3.1. Forest Protection and Management 9 2.3.2. Sink Enhancement 11
2.4. Programs for the Implementation of Mitigation Technologies and their Prospect in Cambodia 14 2.4.1. Forest Protection and Management 14 2.4.2. Sink Enhancement 16 2.4.3. Potential Land for Forest Carbon Project 16
2.5. Evaluation of Mitigation Options 18 2.6. Barriers for the Implementation of Mitigation Technologies 18
2.6.1. Sector Policy 18 2.6.2. Barriers and Incentives for Implementation 20
2.7. Strategic Recommendation 22 2.8. References 23
III. ASSESSMENT OF GREENHOUSE GAS MITIGATION TECHNOLOGIES FOR AGRICULTURE SECTOR 25
3.1. Introduction 25 3.2. Internationally Existing Less Greenhouse Gas
Emission Technologies 25 3.2.1. Rice Cultivation 27 3.2.2. Livestock 33
3.3. Evaluation of Mitigation Options 35 3.4. Barrier for the Implementation of Mitigation Options 37
3.4.1. Institutional Barriers 37 3.4.2. Policy and Regulations Barriers 38 3.4.3. Technology Barriers 38 3.4.4. Socio-economic and Equity Barriers 40
3.5. Strategic Recommendation 40

iii
3.6. References 42 IV. WASTE 45
4.1. Introduction 45 4.2. Available Options to Reduce GHG Emissions From Waste 46
4.2.1. Types of Wastes 46 4.2.2. Options to Reduce GHG Emissions from Waste 46
4.3. Potential Options to Reduce GHG Emissions from Wastes in Cambodia 48
4.3.1. Waste Generation in Cambodia 48 4.3.2. Potential Mitigation Options 52
4.4. Barriers for the Implementation 53 4.5. Strategic Recommendation 54 4.6. References 57
V. POTENTIAL FINANCIAL SOURCES TO CO-FINANCE GHG MITIGATION PROJECTS 58
5.1. Kyoto Market 58 5.2. Non-Kyoto Markets 58 5.3. Other Source of Funding Under the UNFCCC
and the Kyoto Protocol 60 5.4. References 61
VI. CONCLUSION AND RECOMMENDATION 62 6.1. Reference 64

1
I. GENERAL INTRODUCTION 1.2. Background Climate change is a global problem, which has brought countries throughout the world to work together to mitigate the problem under an international convention called the United Nations Framework Convention on Climate Change (UNFCCC). The Convention was adopted at the UNCED in Rio de Janeiro in 1992 and has the objective “to stabilize atmospheric greenhouse gas concentration at a level that would prevent dangerous anthropogenic interference with the climate system”. A subsequent action following the UNFCCC was the Kyoto Protocol. It proposed that the Annex 1 countries (developed countries) are obliged to reduce their level of greenhouse gas (GHG) emissions by 5.2 % from their 1990 level within the 2008-2012 period. The Non-Annex 1 Countries (developing countries), like Cambodia, that are exempt from the obligation to reduce GHG emissions, can implement GHG mitigation activities with support from developed countries as mentioned under Article 4.5 of the UNFCCC either through transfer of environmentally friendly technologies, enhancement of indigenous capacities and developing countries technologies. In the meantime, Cambodia has identified a number of GHGs mitigation options that can potentially be implemented (MoE, 2001a; 2001b). However, the assessment of these technologies was still limited. On the other hand, there is a number of internationally existing less GHG emission technologies that may fit Cambodian condition. Therefore, further assessment of these available technologies for Cambodia is important. Barriers for their implementation should be identified. This will assist Cambodia in setting up their policies and measures that are supportive to the ultimate objective of the Convention. 1.2. General Objective The general objective of this study is to examine technology needs for reducing GHG emissions, enhancing sinks, and capacity building to assess technology needs and identification of barriers for their implementation. 1.5. Specific Objectives This study has the following specific objectives: • To identify internationally existing less greenhouse gases emission technologies; • To assess the potential of GHG mitigation technologies applicable for Cambodia; • To identify barriers for the implementation of the GHG mitigation technologies in
Cambodia; and • To develop strategic recommendation for increasing Cambodia's opportunity to
implement GHG mitigation technologies.

2
1.6. References MoE. 2001a. Final draft report "Greenhouse Gas Mitigation Analysis Land Use, Land
Use Change and Forestry, and Agriculture". Climate Change Enabling Activity Project, CMB/97/G31. Ministry of Environment. Cambodia.
MoE. 2001a. Final draft report "Greenhouse Gas Mitigation Analysis: Energy and
Transport". Climate Change Enabling Activity Project, CMB/97/G31. Ministry of Environment. Cambodia.

3
VII. ASSESSMENT OF GREENHOUSE GAS MITIGATION TECHNOLOGIES FOR FORESTRY SECTOR
2.1. Introduction Forestry sector contributes significantly to the increase of GHG concentration in the atmosphere. In the period of 1980-1989, the rate of global GHG emissions from land use change (LUC) was about 1.7+0.8 Gt C yr-1 (it includes the net emission from wood harvesting and agricultural soils), one third of the emissions from fossil fuel combustion and cement production (Houghton et al., 1999, 2000). Carbon emissions from LUC that occur in tropical countries are mostly as a result of deforestation (Houghton, 1996), i.e. about 1.4 to 1.6 Gt C yr-1. Many studies indicated that deforestation is often associated with rural poverty and population growth, which force rural people to encroach onto forest areas in search of new cultivatable land and harvest forest products to increase their income. In 1998, Associates in Rural Development stated that with the current population growth rate of 3%, the population of Cambodia would double in size within the next twenty-five years, resulting in greater pressure on forestland (Bottomley, 2000). The production of fuel wood and charcoal in forest supply areas that close to roads and rivers may be greater than log production. Over the last thirty years the inability of the state to manage the forest resources has been largely due to the war, which ended in 1998. In the last five years, logging increased due to the need for increased income. Log production reached the highest levels in Cambodia in 1997 with 4.3 million cubic meters being cut from over 7 million hectares of forests. Illegal timber felling accounted for at least 92% of total production (Bottomley, 2000). These facts suggest that logging activities, rural poverty and clearance of forests for agricultural purposes are major causes of deforestation in Cambodia. In the Cambodia’s Initial National Communication, the forestry sector has been found as the major source of CO2 emissions (97%) followed by the energy sector (3%), while other sectors were only minor contributors (MoE, 2001). However, the capacity of the forestry sector to remove CO2 from the atmosphere is much higher than the rate of its emissions. In 1994, this sector removed 64,850 Gg of CO2-eq. and emitted 59,708 Gg of CO2-eq. Therefore, the forestry sector could offset all GHG emissions of other sectors. As GHG emissions from this sector tends to increase due to the increasing rate of deforestation, further efforts to reduce carbon emissions and to increase carbon sequestration is required and these efforts will keep Cambodia as net sinker country. This section reviews available GHG mitigation technologies in the forestry sector and assesses their potential for implementation in Cambodia.

4
2.2. Internationally Existing GHG Mitigation Technologies Forestry sector not only contributes significantly to the increase of GHG concentration in the atmosphere, but also contributes significantly to the decrease of the GHGs. Major human activities that lead to the increase of GHG concentration from this sector are conversion of forest or/and land use with high biomass density to other uses with no or less biomass density, and wood harvesting. Whereas, activities related to the avoidance of deforestation or maintaining forest stands and increasing forest cover by planting trees can be defined as mitigation activities. These activities will reduce or limit GHG emissions to atmosphere and increase carbon sequestration from the atmosphere. Thus in general, mitigation technologies in this sector could be broadly categorized into three, i.e. forest protection or conservation, sink enhancement and carbon substitution (Trexler et al., 2000). The following sections discuss briefly types of mitigation activities under the three categories, and the assessment of mitigation potential of the activities in other countries in particular Asian countries
2.2.1. Type of Mitigation Activities in Forestry Sector Forest Protection and Management. All activities related to the protection of existing carbon reservoirs from loses due to deforestation, forest and land degradation, urbanization, and other land management practices fall under this category. Thus the basic activity is to control the release of carbon stocked in the standing forest into the atmosphere, such as the use or implementation of improved technologies combined with better management and harvesting policies that lead to the decrease of carbon emission to the atmosphere. It also include adopting socially acceptable programs of forest protection, improving management of parks and protected areas; ensuring satisfactory natural regeneration of harvested forests and forests damaged by fire; improving forest fire suppression and management capabilities; adopting reduced-impact logging practices. Sink Enhancement. Activities fall under this category are all efforts that lead to the increase of carbon stock in a unit of land either through intensifying forest areas or increasing soil carbon density or increasing carbon storage capacity in stable wood products. The major activities have implemented in many countries to increase carbon sink are tree plantation, agro-forestry, and other forests. C-Substitution. The utilizing biomass to carbon substitution for wood fuel use, either directly through production of biomass energy or indirectly, by substituting wood for cement, or other fossil fuel products etc. can be fall under this category. These activities will have double benefits, if woods used for producing the energy and construction are from plantation established in degraded lands. The first, the increase in use of biomass energy will directly reduce the use of fossil fuel-based energy. The second, planting trees in the degraded lands will increase carbon sequestration and therefore reduce the concentration of CO2 in the atmosphere as long as the plantation is kept in perpetuity.

5
Description of technologies that have been implemented in many countries according to the above three categories are presented in Table 2.1.
Table 2.1. Description of GHG mitigation technologies in forestry sector
Category/Types of Technologies
Description
1. Forest Protection and Management Protecting Forest Efforts to reduce the destruction or conversion of protection forest or production
forest to other non-forest uses. For example: move from shifting to permanent intensive agriculture/pasture. This option is a good long-term mitigation option to reduce emissions from land use changes that involve shifting agriculture or pasture. This requires investment in the necessary infrastructure and extension services necessary to convert shifting farmers/ranchers into sedentary land users. This option should be examined in the context of the respective country's rural development goals and policies. Another example is supplementary economic activities for shifting farmers. This may boost their earnings and as such reduce their demand on forest land for subsistence. Measures which increase the opportunities for harvesting and marketing of non-timber forest products such as nuts, honey and fiber are good candidates. Also, introducing small-scale rural industries such as carpentry, brick making, weaving, etc may stem the rate of deforestation associated with subsistence farming. This option can not be treated in isolation from the country's rural development plans. However, within the development context, such an option should be very attractive1.
Improvement of harvesting techniques (silviculture), e.g. Reduce Impact Logging
Silviculture systems could be broadly divided into two systems, i.e. selection system (polycyclic) and shelterwood systems (monocyclic)2. The Selection System aims to keep all-aged stands through timber cuttings at shorter intervals. Many light cuttings are made. Seedlings will become established in small gaps. Under this system, two or more intensive harvests are possible during one rotation. The selective felling of exploitable trees is done over an area at periodic intervals. The shelterwood system is introduced usually when it became necessary to harvest more intensively and regeneration is not assured under the selection system. Basically, the shelterwood system attempts to produce a uniform crop of trees from young regeneration through both heavy harvesting and broad silviculture treatments. A new even-aged tree is established by applying preparatory and establishment cuttings to natural regeneration (i.e. seedlings and saplings) of the desired trees. At an appropriate time the remaining over-storey is removed.
Improvements in the product conversion and utilization efficiency
Improvements in the product conversion and utilization efficiency can reduce emissions significantly. This will involve technological intervention and tend to find wide applicability in a region of which forest industries are dominated by mills which have a conversion efficiency of less than 25 percent in pitsawing and about 40 percent in conventional sawmills3. Improving various operational aspects of machinery and equipment in the wood industries may boost the amount of biomass converted to wood products by a significant proportion. Replacing the old generation of mills in the sector by a newer vintage can easily double the conversion efficiency in some cases. Installing capacities for residue utilization for bio-fuels and tertiary products also maximizes useful biomass utilization and reduces emissions.
2. Sink Enhancement Analog Forest Analog forests attempt to reverse the loss of forest cover by planting trees and
lesser plants on deforested lands, regenerating the structure and functions of original forests. This is also commonly called as enhance regeneration or enrichment planting.

6
Category/Types of Technologies
Description
Reforestation Planting trees on degraded land in forest area. Afforestation Conversion of non-forest area into forest area by planting trees Timber Plantation Large-scale plantings in degraded land using short-rotation species, or long
rotation species or exotic species with intensive management for wood production Agroforetry (Social forestry)
Improving carbon sequestration and storage in both soil and biomass through planting trees intercropped with annual crops for the purpose of producing both agriculture and forest products or planting trees following contour for wind and soil protection, as well as for providing agriculture and wood products. Long rotation systems that use trees for windbreaks, border planting and over-storey shade can sequester carbon for many decades4.
Urban forest Tree planting activities include parks and gardens, green belts, residential shade trees, and road side and demarcation trees in the rural areas. Urban tree planting offers advantages of reducing greenhouse gas by sequestering carbon, and reducing energy consumption for air conditioning. At high latitude countries, urban tree planting provides shelter that reduces heating system emissions in winter. Based on the study done by USDA Forest service and Houston Green, the use of tree cover could reduce the use of energy by 16 % or avoid the loss of USD55 million5.
3. C-Substitution Biomass for power generation (electricity) using Co-generation or gasification technology6
Co-generation technology, biomass is used as fuel on the boiler system which is produced high pressure super heated steam. The steam provided heat energy and also mechanical energy for steam turbine which is couple with generator to produce electricity. In this technology, biomass is converted into heat energy and mechanical energy or electricity for many kinds of application. Co-generation technology mostly popular in industrial sector for example in CPO and sugarcane industries which use their biomass waste as feedstock of Co-generators. Gasification technology, biomass is converted into combustible gas (CO, methane and other hydrocarbon) for use on internal combustion engine to produce mechanical energy, or produce electricity when the engine couple with generator. The feedstock for gasification could be: wood from dedicated plantation (energy plantation), thin twigs and branches from plantations and forests, logging and milling residue, crop residues, shrubs and weeds.
Stoves for cooking Replacing stoves for cooking with lower higher thermal efficiency (5-10%) with the higher one (40%).
Biogas Biogas (a mixture of about 60% methane and 40% carbon dioxide), a combustible gas produced by anaerobic fermentation of cellulosic materials such as animal dung, plant leaves and waste from food processing and household. Biogas can be combusted directly as source of heat for cooking or used with internal combustion engines for mechanical or electrical applications. This energy will replace the use of kerosene.
Source: 1 Makundi (1998); 2Appanah (1998); 3 Solberg (1988); 4Sathaye and Meyers (1995); 5American Forest (2001); 6Ravindranath et al. (2000) 2.2.2. Assessment of Mitigation Potential
Carbon mitigation potential and cost-effectiveness of GHG mitigation technologies in forestry sector will vary by locations and by type of options (Table 2.2). This variation is due to the variation in technology, economic and financial conditions. As an example of a technical concern is that the performance of a technology may differ from one country to another. An example of an economic factor is the somewhat arbitrary choice of discount rate and time horizon for project evaluation.

7
Asian Least Cost Greenhouse Gas Abatement Strategy (ALGAS) study has identified and assessed the GHGs mitigation potential of several options in Asian countries. It was found that mitigation potential of the options varied considerably, i.e. from 3.7 tC/ha up to 505 tC/ha. Similarly for life cycle cost and the benefits. The life cycle cost as low as 0.07 $/tC was observed Indonesia, and as high as 58.5 $/tC was observed in Pakistan. However, all of the studies did not consider cost for carbon monitoring. In the context of forest carbon project, carbon monitoring is required. This is to quantify the carbon benefit generated by the projects. Experiences from AIJ projects showed that a large financial factor in forest carbon projects is cost of the continuous monitoring and verification. These expenses, added to other transaction costs, can substantially affect a project’s total cost (La Rovere, 1998). Therefore, in the light of CDM projects, the impact of inclusion transaction costs on the GHG abatement costs needs to be done. Table 2.2. Mitigation potential and cost-effectiveness of forestry sector mitigation options
Country Mitigation Options Mitigation
Potential (tC/ha)
PV of Lifecycle cost of Mitigation
($/tC)
NPV (PV Benefit-PV Cost $/tC)
Bangladesh1 • Long rotation • Medium rotation • Short rotation • Medium rotation (Sal plantation)• Medium rotation (Participatory
coastal plantation) • Short rotation (Participatory
woodlot plantation)
116.0 92.0 34.0 98.0 63.0
34.0
1.80 2.70 7.80 2.40 2.60
6.20
2.45 8.07 1.60 5.66 0.77
6.46
China1 • Agro-forestry • Short rotation • Long rotation • Enhanced natural regeneration
(ENR)
3.7-19.3 33.0-125.0 10.0-75.8 24.0-59.3
11.00-18.00 7.00-9.00 4.00-8.00
1.00
(-3.40)-8.40 3.40-11.40 (-2.90)-3.5 (-0.90)-2.20
India1 • Natural regeneration
• ENR in marginally degraded land
• ENR in degraded land • Private land
77.0 171.0
138.0 83.0
3.35 18.87
23.38 8.96
7.51 12.67
5.93 31.87
Indonesia2
• Forest protection • Reduce impact logging (RIL) • ENR • Reforestation using fast
growing species (no harvesting) • Reforestation using slow
growing species (no harvesting) • Timber plantation (short
rotation) • Timber plantation (long rotation)• Agroforestry • Bioelectricity
55-220 49 70
49-101
94-336
56-122
134-334 94
50-185
1.18 0.07 0.25
0.85-13.13
0.48-2.34
3.87-33.20
1.04-5.70 4.44 20.81
-0.52 -0.01 -0.19
(-6.89)-(-0.81)
(-0.16)-(-0.04)
2.0-6.57
(-0.14)-(2.99) 2.02
5.26-6.75 Republic of Korea1
• Improved management of natural forest
99.4
8.10
-5.56

8
Country Mitigation Options Mitigation Potential (tC/ha)
PV of Lifecycle cost of Mitigation
($/tC)
NPV (PV Benefit-PV Cost $/tC)
• Urban forestry • Enhanced regeneration of Larix
leptolesis • Enhanced regeneration of Pinus
koraiensis
299.0 123.0
85.0
9.48 14.30
21.93
-9.02 -10.45
-17.55
Mongolia1 • Natural regeneration • Private forest • Agro-forestry • Shelter belt
67.5 99.2 9.8
101.7
0.82 1.06 0.93 1.99
-81.00 -53.00 1.01 -1.98
Myanmar1 • Reforestation-short • Reforestation-long • Natural regeneration • Forest protection
55.0 155.0 33.0 47.0
9.01 1.87 0.86 0.00
19.28 2.22 0.13 -2.87
Pakistan1 • Conifer protection forest • ENR of conifer forest • Reforestation of conifer forest • Riverine forest plantation • Commercial plantation • Watershed management • Agro-forestry • Plantations on agricultural land • Rangeland management
41.6 33.8 39.1 32.9 54.6 26.7 29.7 7.5
20.0
2.86 7.05 12.66 25.41 58.50 15.80 0.55 0.60 12.51
26.90 11.50 27.90 38.00 87.50 1.10 1.40 2.40 2.00
Philippines1 • Forest protection + sustainable management
• Forest protection – total log ban • Forest plantation – long • Forest plantation – short • Urban forestry
215.0
215.0 236.0 505.0 90.0
1.26
0.50 2.16 0.86 5.42
315.34
-261.33 118.59 0.02 0.00
Thailand1 • Forest protection & reforestation for conservation in protected area
• Forest protection & reforestation for conservation in community forests
• Short rotation in community forests
• Long rotation in community forests
• Short rotation in non-protected areas
• Medium rotation in non-protected areas
38.6
38.1
185.5
169.0
158.9
112.5
7.52
10.72
2.94
3.25
2.94
4.31
-6.30
-7.60
-0.80
-3.20
-0.90
1.40
Vietnam1 • Enhanced natural regeneration • Long rotation • Short rotation • Forest protection: forest areas • Forest protection: degraded
forest areas • Scattered trees
57.1 68.2 42.9
106.9 64.3
64.0
1.03 1.83 2.45 0.39 0.65
1.07
1.50 -1.20 13.80 1.20 1.50
13.70
Source: 1ALGAS (1998), 2Boer et al. (1998) and Boer (2001)

9
2.3. Implementation of Mitigation Technologies in Cambodia At present, there are a number of agencies responsible for managing Cambodian forests and lands. First is the Ministry of Environment (MoE). This ministry is responsible for managing forestlands in protected areas (about 25-30% of the total forestlands). Second is the Department of Forestry and Wildlife (DoFW). This Department is responsible to manage forestlands in flooded forest area (including forests around Tonle-Sap and Mekong River and mangrove which occupy 5% of total forestland but much of them are overlapped with protected area), and other forestlands. Third is Concession Companies, which is responsible to manage forestland in concession areas (35-40% of the total forestland) under the control of DoFW. Fourth is Private Businessman, which is responsible to manage lands in concession areas under the control of Ministry of Agriculture, Forestry and Fisheries (MAFF). Fifth is Provincial Forestry Officers (PFOs) and DoFW which are responsible for managing forestlands in tree Planting Stations (about 14 stations under DoFW and 30 stations under PFOs. One station may control about 1000 ha of forestland). Sixth is community or local authorities or privates which is responsible to manage lands outside forestlands and community lands. These agencies have implemented a number of mitigation activities. The following section describes briefly the implementation of the mitigation program. 2.3.1. Forest Protection and Management The Royal Government of Cambodia (RGC) fully recognizes the need for protecting forests for both economic values and environmental benefits. With the support of various donors, it has taken some decisive measures to protect the remaining forest. Cambodia also has a high percentage of the country designated as protected areas. As of 1993, all edaphic forests and some 2.8 million hectares of dry land forest were put under the National Protected Area System, which presently has 23 protected areas. The total protected area is 3,568,100 hectares, 19.7 % of the country’s total land area. These areas are classified as National Parks, Wildlife Sanctuaries, Protected Landscapes and Multiple-Use Areas. Unfortunately, the effectiveness of management and protection of these areas is very limited. The effectiveness and long-term effect of the current forest and protected areas management practices remain questionable. The RGC issued the Protected Areas Law which define the jurisdiction and responsibilities of the MoE in the management of the National Protected Area System (NPAS). The law is aimed to (MoE, 2002):
• Manage and implement effectively the conservation of biodiversity and sustainable use of natural resources within the NPAS;
• Determine the standards and procedures for the management of the NPAS; • Provide the mechanisms and procedures to establish protected areas or to modify
their category; • Define the responsibilities and involvement of protected area communities and
public at large; and

10
• Implement regional and international conventions, protocols and agreements pertaining to the protection of biodiversity and ecosystems inside the NPAS.
Currently, the RGC has adopted sub-decrees on conservation forests with the total area of about one million ha or 5.75% of Cambodia’s total areas. This includes conservation of wildlife and gene resources, conservation of watershed and bio-diversity, conservation area and zoological park. Furthermore, forest area under protected areas is about 4.4 million ha or 41% of Cambodia’s total areas (DoFW, 2002). From 1999 to 2000, the RGC has reviewed the contractual compliance of the concessionaires. As a result of the review, 11 forest concession agreements covering 16 concession areas (approximately 2,437,970 ha) were terminated. These forest areas have been declared as conservation forests. In addition, the Cambodian Government has also announced a crackdown on illegal logging and has closed down many sawmills. It is expected that these actions will lead to reduce rate of deforestation and illegal logging activities (MoE, 2001a). In order to strengthen the implementation of forest conservation program, the DoFW will seek both technical and financial support for establishing forestry scientific research base to promote sustainable management, utilization and development of forest resources, leading to establishment of forest and wildlife research institute with sufficient infrastructure and facilities to develop human resources for forest research works and to establish links and cooperation with forest research institutes in the region and worldwide. In addition, the DoFW will complete the draft of wildlife management and conservation law with broad public consultation, and will conduct wildlife research and wildlife inventory, classify and manage special wildlife habitats, further expand publication and extension on wildlife, and encourage investment projects on wildlife improvement and reproduction. In order to achieve sustainable management through the utilization of forest resources in sustainable ways, the awareness of concession companies and communities to the importance of forest as well as their capability in managing the forest in sustainable way should be increased. The DoFW (2000) has set up program to achieve this goal. The main actions will be undertaken are: • To develop standardized regulations and codes of practices for sustainable forest
management planning system. These include (i) guidelines for forest concession management planning system; (ii) guidelines for inventories in the forest management cycle; (iii) Biodiversity conservation guidelines for the managed forest; (iv) Guidelines for socio-economic survey of communities surrounding forest concession areas; (v) timber theft management guidelines; (vi) the Cambodian forest harvest code of practice; (vii) construction guidelines for forest engineering works; (viii) guidelines for environmental impact assessment for forest concession; and (ix) guidelines for special management area.
• To review and improve domestic wood supply through survey, data collection and workshop and to discuss actual local wood consumption requirement and wood supply procedures. These include: (i) allocation of 20% harvested timbers from forest concessions for domestic use; (ii) allocation and granting of annual coupes

11
through bidding; and (iii) establishment of community forestry and promotion of tree planting by local communities.
• To conduct forest resource assessment and zoning by producing a series of forest cover maps every three years, using satellite imagery and forest statistic calculation, for year 2000-2001 and 2003 to 2004. These will include (i) formulation of criteria for forest zoning and on-ground demarcation; (ii) study of forest classified before 1970; and (iii) identification and classification of watershed areas and selection of pilot areas for management exercise.
• To further strengthen the monitoring and control of forest illegal activities in forest concessions.
• To improve technical capacity, through training extension and exercise of standardized technical guidelines and regulation, codes of practice and recent technologies in forest management and production, for all stakeholders: local foresters, producers and communities etc.
• To extent all new guidelines and regulations relevant to forestry sector to all provincial forestry officers and concessionaires.
One step that has been implemented by the RGC is issuing a regulation and enforcement logging techniques imposed on concessionaires, namely selected cutting and planting, and selective cutting and line planting. This regulation is expected will reduce the logging damage and ease the monitoring process. Uncontrolled logging of trees has resulted in excessive damage to the value of the residual forest for the future timber production. The logging activities would destroy on the young trees that un-harvested with DBH<60 cm. Theses leading to the decrease on future biomass increment and yield of marketable timber. By proving logging technique, the amount of trees have been damaged would be reduced dramatically. The reduction of impact logging includes all efforts to minimize damage both to the soil and the residual stands during the selective logging as harvest planting, directional felling and other environmentally sound management techniques (Republic of Indonesia, Ministry of Environment, 2001). 2.3.3. Sink Enhancement Reforestation. From 1985 to 2000 the total area of forest plantation established was 8701 ha which included trees planted on National Arbor Day. The rate of reforestation varies from year to year, beginning with 289 ha in 1985 and increasing to 897 ha in 2000 (Figure 2.1). Acacia is a common tree species planted in reforestation program. From the 2000 Financial Proposal submitted to the government by the DoFW, it was indicated that Acacia accounted for 73% of all trees planted in reforestation programs. Tectona grandis, mixed tree and Pahudia coohinchinnensis accounted for 8, 8 and 3%, respectively. In addition, the DoFW has distributed 2 million seedlings of mixed tree species to local people and various institutions, and cooperated with NGOs conducting extension to local people to protect forests and actively plant trees, especially through school children. The DFW has also been promoting the establishment of nurseries throughout Cambodia, selection of appropriate tree species for planting, and expansion of reforestation schemes, forest extension, and community forestry programs.

12
Figure 2.1: Reforestation Rate in the Period of 1985-2000 (DoFW, 2001) Reforestation activities have been done in many places, in particular Koh Kong, Takeo, Kandal, Kampong Thom, Kampong Chhnang, Pursat, Kampong Cham, Kampong Speu, Prey Veng, Svay Rieng, Kampot provinces. Rate of success of reforestation program was quite variable, i.e. between 60 and 80% (Personal Communication with DoFW, 2002). Tree Plantation in Tree Planting Stations. PFOs and DoFW has also managed small portion of selected forestlands in several stations for the establishment of tree plantation (Yoshida, 2002). The main three species were Acacia and Eucalyptus. Maisak (Tectona gradis or teak), chhou teal teuk (Dipterocarpus alatus) and other local species were also planted in some areas. At the end of 2001, it was reported that a total of about 5.5 thousand ha of degraded forestland has been planted covering 13 districts in 8 provinces. There are about 80 thousand hectares still remain for rehabilitation (Table 2.3). According to DoFW statistics, the 5.5 thousand hectares were done by DoFW alone, while the PFOs planted an area of about 3.35 thousand hectares. Thus in total, the area of tree plantation under this program was about 8.9 thousand ha.
Table 2.3. Rehabilitation of forestland by DoFW
Name of Station District Province Established
Year Forestland Areas (ha)
Reforested Areas, ha
(2001) Teuk Char Cheung Prey Kampong Cham 1996 1,190 60 Mear Nork Samakki Mean
Chey Kampong Chhang 1997 29,065 535
Osandan/Chouk sor
Rolea Pier/Kompong Trolach
Kampong Chhang 1989 750 279
Sre Khlong Phnom Srouch Kampong Speu 1990 17,158 177 Phnom Kray Chbar Morn Kampong Speu 1988 725 410 Toul Prich Ang Snourl Kandal 1985 380 351 Phnom Aithdroch Ponghea Lueu Kandal 1994 40 19 Angkor Chay Angkor Chay Kampot 1999 3,909 0
0100200300400500600700800900
1000
1985
1986
1987
1988
1989
1990
1991
1992
1993
1994
1995
1996
1997
1998
1999
2000
Ref
ores
tatio
n A
rea
(ha)

13
Name of Station District Province Established Year
Forestland Areas (ha)
Reforested Areas, ha
(2001) Kamchay Mear Kamchay Mear Prey Veng 1989 8,705 438 Ba Phnom Ba Phnom Prey Veng 1985 469 465 Romeas Haek Romeas Haek Svay Rieng 1985 8,002 1,069 Krosang Romeas Haek Svay Rieng 1990 5,012 430 Phnom Tamao Bati Takeo 1993 2,500 290 Banteay Angkor Tram Kok Takeo 1985 1,100 813 Kbal Chhay Sihanoukville 1999 6,027 200 Total 85,032 5,536 Source: Yoshida (2002) Community Forestry. Community forestry is an important forest management alternative to industrial forest concessions, in which the forest management authority is conveyed to local communities. It was estimated that there are about 22 small-scale community forests that have been established (WWF, 2000). Most of the projects were in pilot scales and model of community forestry in specific target areas. These initiatives have been beneficial in promoting forestry and demonstrating community forestry, in raising awareness regarding community forestry, and encouraging a favorable policy climate. They remain, however small scale and have not yet reached a significant number community or forest area. Some initiatives also support institutional strengthening. These include institutional capacity building activities in the Department of Forestry and Wildlife, the Ministry of Environment and international and non-government organizations (Henderson, 1999). Private Forest. Private forest is forest plantation or natural forest that grew on the private land and has been listed under the state’s law and regulation (RGC, 2002). Thus, the program is carried out by private-owners and they have the right to develop and get benefit from this forest personally. The program is implemented only a few area in the country. Agroforestry. Agroforestry system held considerable potential for improving carbon sequestration and shortage in both soil and biomass though planting trees inter-cropped with annual crops for the purpose of producing agriculture, fruit and forest products. This system has been largely used in highland area. Types of trees used in this system are long rotation species and sometimes fruit tress such as mango. It is imperative that agroforestry and other system such as agroforestry livestock farming system (agrosilvopastural) should be planned in such a way to strike a balance between preserving the beneficial hydrologic role of forest ecosystems and increasing food production (RGC,2001).

14
2.4. Programs for the Implementation of Mitigation Technologies and their Prospect in Cambodia
2.4.1. Forest Protection and Management DoF/MAFF (2001) has proposed an area of about 402,000 ha located in the Central Cardamoms Protected Forest to be designated as area for conservation of watershed and biodiversity. It was considered that (i) the Central Cardamoms is of outstanding national, regional and global important for biodiversity conservation; (ii) watershed protection value alone justifies that the Central Cardamoms should be a permanently protected forest and watershed that lie within the forest estate surrounding the Central Cardamoms should also be protected; and (iii) recent discovery of archaeological sites in the Central Cardamoms highlights that this area is of potentially great culture significance for Cambodia. Therefore, MAFF issued a declaration, called prakas, for suspending all commercial forestry activities, clearing and hunting in this area. It was found that timber harvested in the Central Cardamoms is not commercially viable. The Central Cardamom is located in the southwest Cambodia, mostly in Koh Kong and Pursat provinces, and small area in Kampong Speu province. According to the research and assessment by Cardamom Conservation Program and Conservation International with Department of Forestry and Wildlife (2001), the entire Cardamom Mountain Range represents one of Mainland Asia’s last remaining wilderness total about one million ha of virtually undisturbed forest. Two important decisions that have been made under International Conservation (CI) of the Memorandum of Understanding (MOU) are: - Declaration of the Central Cardamom as a permanently protected forest under the
jurisdiction of the MAFF by March, 2002; - Putting the Central Cardamoms, together with Phnom Samkos, into the government’s
tentative list of World Heritage Sites (WHS) by October, 2002. Based on forest condition data (Table 2.4), it was shown that disturbed forests/forest mosaic, mangrove and inundated forest would be potential for the implementation of ENR, while undisturbed forest allocated for concessionaires would be potential for the implementation of RIL. The disturbed forests were normally has crown cover between 20% and 70%, and forest mosaics about 20%. Whereas, the undisturbed forests have crown cover more than 70%. From the satellite assessment, potential area for the implementation of ENR would be more than 6 million ha, while for the implementation of RIL would be around 1-2 million ha using assumption that only ¼ of forest concession areas remain undisturbed (Table 2.5). In 1999, it was estimated that total of forest area under concession was about 6.5 million ha.

15
Table 2.4. Crown cover and description of each forest type in Cambodia No Forest
Type/Land Use Crown Cover
Description/Comments
1 Evergreen dense >70%
2 Evergreen disturbed
20%-70%
3 Evergreen mosaic
20%
They usually contain multi-storied forests where trees keep their leaves during the whole year. They comprise the lowland tropical rainforests, the hill evergreen forests and the dry evergreen forests. A certain percentage of deciduous trees may be included as well and most deciduous forests may not be discernible from the evergreen forests. Coniferous forests (pines) may also be included because they could not be mapped as a separate class consistently.
4 Mixed dense >70%
5 Mixed disturbed 20%-70%
6 Mixed mosaic 20%-40%
They contain a variable percentage of evergreen and deciduous trees. The percentage of deciduous trees may vary from some 30 to some 70%. The variability of this class is high as it is stretching from the moist mixed deciduous forests to the mixed deciduous and to a more humid version of the dry deciduous forests. Some parts of dry evergreen forests are mapped in this class as well.
7 Undisturbed Deciduous
20%-40%
8 Deciduous mosaic
20%-40%
Deciduous forest is an open forest consisting of a few trees where most of their leaves are deciduous in dry season. These relatively species-poor, wholly deciduous forests are dominated by Dipterocarps and feature a sparse understorey subject to frequent fires.
9 Mangrove 40%-50% Tidal forest on the mud flats at the mouth of streams and along the shore of shallow bays. The dominant species are Rhizophora conjugata (Kongkang Nhy), Rizophora mucronata (Kongkang Chmul), Ceriops spp., Bruiera spp., Caralia sp. and the families of Verbenaceae (Avicennia sp.), Sonneratiaceae, and Palmae (Nypa fructicans). Rhizophora conjugata and Rhi. mucronata. Rhizophora spp. reach a height of 15 to 20 m and diameters measured at 1.3 m high from ground vary from 30-40 cm, depending on natural factors (soil condition, location etc.). This forest is heavily degraded due to illegal logging for charcoal production. About 80% of this forest is already disturbed. The government has implemented mangrove reforestation program since 2000.
10 Inundated 20%-40% This forest type is found in Cambodia around the Tonle Sap Lake. Most of the forests are low and disturbed. In many cases, there is only a mosaic remaining.
11 Forest Regrowth 20%-40% Vegetation with tree height ranges between 5 m and 10 m1. It comprises areas with a continuous, usually dense layer of smaller trees. Stunted forests which grow very slowly due to poor site conditions may look similar to this category and therefore it is included in this class. The class 'forest regrowth' does not include other regrowth of shrubs, small bamboo or even very small trees growing directly after shifting cultivation. Differentiated between this class and woodland/shrubland on the basis of satellite images alone, is difficult.
Source: MoE (2003)

16
Table 2.5. Total area of undisturbed and disturbed forests potential for the implementation of RIL and ENR
Undisturbed Disturbed Forest Category
1993 1997 1993 1997 Evergreen 723,468 686,672 3,835,474 3,817,583 Mixed 123,108 119,425 1,734,581 1,708,532 Deciduous 4,857,745 4,773,911 447,314 454,915 Forest regrowth 440,939 379,305 Mangrove 77,669 72,835 Inundated 349,475 335,304 Total 5,704,321 5,580,008 6,885,452 6,768,474
Source: DoFW (1999) 2.4.2. Sink Enhancement According to the tree-planting program of the DoFW, in the second five year plan (2001-2005), the RGC will implement planting activities in degraded forest and land through various programs. The rate of planting would be about:
- 50,000 ha/year for forest plantation program; - 120 ha/year for National Arbor Day Program; - 16,000 ha/year for community forest program.
Total area available for the implementation reforestation is also quite large, i.e. about 2 million ha (Table 2.6).
Table 2.6. Potential area for the implementation of sink enhancement projects
Land Category 1993 1997
Grassland 476,804 488,643 Wood/Shrubland dry 1,267,770 1,165,377 Wood/Shrubland inundated 377,401 348,971 Mosaic cropping (crown cover <30%) 198,879 285,155 TOTAL 2,320,854 2,288,146 Source: DoFW (1999). 2.4.3. Potential Land for Forest Carbon Project The Kyoto Protocol provides opportunity for developed countries to implement project in developing countries to meet their GHG emission reduction commitment, and assist developing countries in achieving the sustainable development. This mechanism is called as Clean Development Mechanism (CDM). For forestry sector, it has been agreed that types of forestry project eligible under CDM are limited to afforestation and reforestation only. In the Marrakesh accord, it implies that reforestation is tree planting activities carried out in forest land which has not been forest since 31 December 1989, while afforestation is tree planting activities carried out in a land which has been used for at least 50 years for non-forest use. This planting activity should allow the land to
17
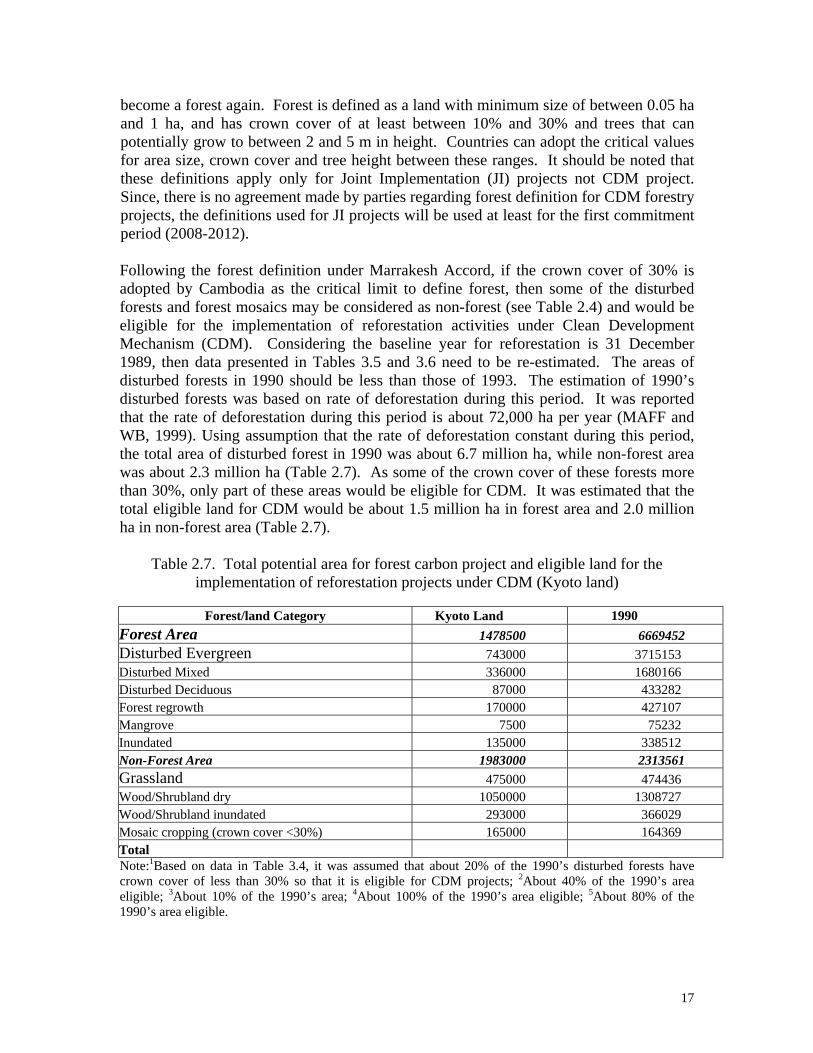
become a forest again. Forest is defined as a land with minimum size of between 0.05 ha and 1 ha, and has crown cover of at least between 10% and 30% and trees that can potentially grow to between 2 and 5 m in height. Countries can adopt the critical values for area size, crown cover and tree height between these ranges. It should be noted that these definitions apply only for Joint Implementation (JI) projects not CDM project. Since, there is no agreement made by parties regarding forest definition for CDM forestry projects, the definitions used for JI projects will be used at least for the first commitment period (2008-2012). Following the forest definition under Marrakesh Accord, if the crown cover of 30% is adopted by Cambodia as the critical limit to define forest, then some of the disturbed forests and forest mosaics may be considered as non-forest (see Table 2.4) and would be eligible for the implementation of reforestation activities under Clean Development Mechanism (CDM). Considering the baseline year for reforestation is 31 December 1989, then data presented in Tables 3.5 and 3.6 need to be re-estimated. The areas of disturbed forests in 1990 should be less than those of 1993. The estimation of 1990’s disturbed forests was based on rate of deforestation during this period. It was reported that the rate of deforestation during this period is about 72,000 ha per year (MAFF and WB, 1999). Using assumption that the rate of deforestation constant during this period, the total area of disturbed forest in 1990 was about 6.7 million ha, while non-forest area was about 2.3 million ha (Table 2.7). As some of the crown cover of these forests more than 30%, only part of these areas would be eligible for CDM. It was estimated that the total eligible land for CDM would be about 1.5 million ha in forest area and 2.0 million ha in non-forest area (Table 2.7).
Table 2.7. Total potential area for forest carbon project and eligible land for the implementation of reforestation projects under CDM (Kyoto land)
Forest/land Category Kyoto Land 1990
Forest Area 1478500 6669452 Disturbed Evergreen 743000 3715153 Disturbed Mixed 336000 1680166 Disturbed Deciduous 87000 433282 Forest regrowth 170000 427107 Mangrove 7500 75232 Inundated 135000 338512 Non-Forest Area 1983000 2313561 Grassland 475000 474436 Wood/Shrubland dry 1050000 1308727 Wood/Shrubland inundated 293000 366029 Mosaic cropping (crown cover <30%) 165000 164369 Total Note:1Based on data in Table 3.4, it was assumed that about 20% of the 1990’s disturbed forests have crown cover of less than 30% so that it is eligible for CDM projects; 2About 40% of the 1990’s area eligible; 3About 10% of the 1990’s area; 4About 100% of the 1990’s area eligible; 5About 80% of the 1990’s area eligible.

18
2.5. Evaluation of Mitigation Options The MoE (2001) has evaluated the cost effectiveness of five mitigation options, namely reforestation with short rotation (RSR), reforestation with long rotation (RLR), reforestation using fast growing species (RFG), reforestation using slow growing species (RLG) and forest protection (FP). The mitigation potential of the five options ranged from 43 to 141 tC/ha (Table 2.8). RLG and FP have mitigation potential of more than 100 tC/ha, while the other three have less than 100 tC/ha. In table3 has shown in terms of investment cost, FP is the lowest (2.5US$/ha), while RSR is the highest (47US$/ha). Life cycle cost for sequestered carbon ranged from 0.28 US$/tC to 1.78US$/tC, while the net present value of benefit ranges from –0.77 to 4.66 US$/tC. Options that gave positive benefits were only RLR and RSR (from harvested wood). The others options gave negative benefits since no wood harvesting is allowed. Costs of carbon abatement of this study were slightly lower that the mean global cost. For low latitude regions, mean global cost for carbon abatement was between 2 and 7 US$/tC (Sathaye, 1999)
Table 2.8. Comparison of the Five Mitigation Options
Initial Cost PV of Cost NPV of Benefit Mitigation Option
Mitigation Potential (t C/ha) $/tC $/ha $/tC $/ha $/tC $/ha
RLR 120 0.29 35.4 0.41 48.8 0.05 6.0
RSR 43 1.10 47.2 1.78 76.2 4.66 199.8
RLG 141 0.18 25.4 0.28 39.2 -0.26 -36.4
RFG 92 0.28 25.4 0.43 39.2 -0.32 -29.1
FP 137 0.02 2.5 0.51 70.0 -0.77 -105.7 Source: MoE, 2001a 2.6. Barriers for the Implementation of Mitigation Technologies 2.8.1. Sector Policy
Status and condition of forest and land is largely determined by the existence of the government policies in the forest sector and also in other sectors. Therefore, one needs to identify and describe the policies, which may be necessary to implement the mitigation options. Makundi (1998) stated that these policies could be divided into two groups, i.e. biomass sector policies and non-biomass sector policies. Biomass sector policies are related to the maintenance of carbon stock and/or enhancement of carbon sinks, while non-biomass policies are intended for the management of the other sectors of the economy, but have large influences on the depletion of the carbon stock, and at times may provide a disincentive to increasing forest and rangeland cover

19
Example of biomass sector policies may include: (i) Development of forest protection and conservation policies that deal with
preservation of existing forest cover. In developing these policies, both national and local measures to preserve existing vegetation cover should be considered. For example, local or national laws prohibiting conversion of steep slopes to agricultural lands, or gazetting vulnerable ecosystems into nature reserves.
(ii) Sharing responsibility between communities and government. In this policies,
local communities and the central agencies share the responsibility in managing the forest and benefits from the protected areas. It is expected that this policies will reduce "encroachment" by the surrounding population. Such policies have been applied effectively in many developing countries. A recent example is the shared wildlife management in Zimbabwe.
(iii) Policies that govern wood extraction from forest. These policies govern timber
harvest concessions covering allowable cut, concession duration, levels and structures of fees and royalties. These policies may even include logging ban in specified ecosystems. Policies, which emphasize export of higher value timber products and ultimately a ban on log exports, may reduce the rate of forest degradation associated with the forest sector's contribution to the country's foreign exchange earnings.
(iv) Tax rebates and dissemination policies governing the adoption of efficient
charcoal kilns and wood stoves have been shown to substantially affect success of such programs in the bio-energy field.
(v) Aggressive afforestation and reforestation policies both by villagers and forest
departments will help expand the carbon sinks in the country, including incentives for private ownership of some forest resources.
Examples of non-biomass policies may include: (i) Land tenure policies that do not encourage private ownership of public lands with
an express mandate to develop the land. Policies to the contrary have been shown to encourage wasteful conversion of forests to other land uses so as to meet the criteria for property rights assignment.
(ii) Land tenure policies that increase the certainty of tenure tend to make the owners
of the land to plant and retain trees on their land. Such policies will be necessary in those mitigation options in agroforestry and of wood fuel plantations.
(iii) Agricultural policies, which do not encourage extensive and wasteful conversion
of natural forests to agricultural lands. Policies which emphasize more intensive farming and conversion of less marginal woodlands tend to lead to production of

20
the same agricultural output from less area, using the same amount of resources. To an extent, similar policies can selectively be applied to pasture management.
(iv) Infra-structural policies governing mining, dam construction, road construction
can reduce unnecessary emissions. (v) Taxes, credits, and pricing policies also play an important part In many African
countries, the Stumpage price is too low to guarantee a supply of funds to reforest and manage the logging areas.
2.6.2. Barriers and Incentives for Implementation The policies described above may not easily be translated to mitigation programs/measures due to the existence of barriers and lack of incentives to implement them. A diverse array of criteria will have to be satisfied before a project can be implemented. The analyst should identify, describe and propose likely solutions to these barriers. Based on study of Yoshida (2002) and discussion with the sector, it was revealed that the most common barriers to the implementation of biomass sector policies in Cambodia can be divided into four categories: (i) policy/regulatory barriers, (ii) institutional barriers, (iii) technological barriers, and (iv) socio-economical barriers. The following sections discussed each barrier category. (a) Policy and Regulatory Barriers
Limited law enforcement on forest regulations may be one of the important barriers for the implementation of mitigation options in Cambodia. On the other hand, the government does not have appropriate policies, clear goals and ideas on exact role of each stakeholder (government, community, private individuals and investors) in forest rehabilitation. No clear policy framework. The incentive for good performance in forest management by concessionaires does not exist or low. There are no adequate financial incentives for forest conservation, reforestation, and maintenance of reforested area. The other important factor that may hindrance the implementation of mitigation options is land tenure and land law. Most of the protected areas and protection forest have not been surveyed and boundaries are not clearly demarcated. There are overlap between concession forest, community lands and protected areas. Policy barriers to harvesting, marketing of forest products, pricing, tariffs and quotas for exports and imports may also hinder implementation of some of the mitigation options. For the future development, a penalty and reward system should be properly designed. Awareness of concessionaires and other stakeholders on the benefit of implementing environmental technology as GHG mitigation technology should be promoted. Information to policy-makers regarding the total and average cost to sequester carbon should be developed and a diverse array of criteria will have to be satisfied before a project can be implemented. These may include the ease of implementation,

21
identification of the project's beneficiaries and losers, together with institutional and legal considerations. (b) Institutional Barriers Insufficient coordination between relevant ministries and other stakeholders in forest utilization, weak of institutional participation, complex bureaucracy system, and top-down approaches in program development, may be important factors that affect the successful implementation of mitigation options in Cambodia. Also, institutions necessary to allow and enable local communities, farmers, industries and local governments for participation in the options may not exist or inadequate in the country. Moreover, there are serious gap and overlaps in the mandate of institutions, limited interactions among farmers and extension agents, weak dissemination system for new technology, and inadequate extension service. (c) Technological Barriers Limited scientific data on silvicultural, ecosystem management and pastoral practices, including soil conservation; is a serious impediment in evaluation and implementation of various options. This is a serious impediment in Cambodia. Availability of high quality planting material and cultural practices for high yields, and inadequate experience for selection of species appropriate for a certain location, and harvesting techniques for sustainable yields may also be lacking. From observation, it was found that selection of tree species based on market demand to be planted is mostly not suitable to the environmental condition of sites, the indigenous technology on local species is not recognized, and the technique of silviculture used does not fulfill technical requirement. Also, in the short to medium term, there may be a lack of qualified local personnel to carry out the projects as well as provide extension services necessary for the successful involvement of local populations. (d) Socio-economical Barriers The important socio-economic barriers for the implementation of mitigation options are lack of funding, no incentive provided for long-term investments either by the private sector or by community, lack of infrastructure such as road for transporting end products to the market and uncertainty in prices. The borrowing rates from banks may also be too high for private investors and or local communities to get credit for these projects. Barriers for specific options have been identified. For protected area and forest protection, the barriers are limited budget, and low salary and no incentive. For community forestry is inadequate financing from government. For agro-forestry is lack of market for local fruit production to be exported, price of product is not constant which may affect farmers, lack of fund for vegetable and cash crops research activities, and lack of market information.

22
Other sectors like agriculture may compete for labor with the above mentioned biomass sectors, depending on the types of crops and the seasonal demands on labor. Procedures and mechanisms for identifying of beneficiaries, cost-bearers and ways to apportion credit from the options may be a barrier to implementation. 2.9. Strategic Recommendation There is a need for establishment of appropriate legal and policy frameworks, protected area management plans, and an effective monitoring system. Strengthening law enforcement and community participation in protected area management are also critical. Programmes for protecting critical wildlife habitats and for the expansion of species and forest communities, should also be enhanced in particular in the likely affected areas. Programmes to rehabilitate the protected forests also need to be promoted through enhanced natural regeneration techniques using native and exotic tree species. Issuing new forest law, sub-decree on forest management and other regulation related to the forestry sector by the DoFW allowing or encouraging the stakeholders to participate in the implementation of mitigation activities is encouraged. On the other hand, boundaries between community lands, production forests and protected areas should be clearly demarcated. Continuous improvement of monitoring and controlling system for forest illegal activities should be in place. Standardized regulations and codes of Practice for Sustainable Forest Management Planning System, sub-decrees on forest community management, national and provincial program for seasonal crop diversification and rotation should be formulated. At present, drafts law on Natural Protected Area of the Ministry of Environment, Department of Nature Conservation and Protection which further strengthen the monitoring and control of forest illegal activities has been produced. Strengthening institutional cooperation among relevant agencies, and promoting the establishment of tree nurseries throughout Cambodia should be prioritized. Strategies to strengthen institutional capacity, pursuit public participation and improve linkage of information sharing should be set up. Infrastructure for transporting forest and agriculture products to the market should be improved as well as dissemination system of new technology to farmers. Community participatory management should also be encouraged. DoFW should try to mobilize financial sources from bi-lateral or multilateral to support activities related to the improvement of technical staff and extension workers capability through training on standardized technical guideline, codes, and recent technology in forest management and production. Technologies for forest fire management should also be introduced to all stakeholders. Deeply study on the agricultural marketing system and establishment of open market is encouraged.

23
2.8. References ADB/GEF/UNDP, 1998. Asia Least-cost Greenhouse Gas Abatement Strategy
(ALGAS): Summary Report. Manila, Philippines. Appanah, S. 1998. Management of natural forest. Boer, R. 2001. Economic assessment of mitigation options for enhancing and maintaining
carbon sink capacity in Indonesia. Mitigation and Adaptation Strategy for Global Change 6:257-290.
Boer, R., Gintings, A.N., and Bey, A. 1998. Greenhouse gas inventory and abatement
strategy for forestry and land use change sector. Indonesian Journal of Agrometerology 13:26-46
Bottomley, R. 2000. Structure Analysis of Deforestation in Cambodia: “with a focus on
Ratanakiri Province, Northeast Cambodia”, Cambodia. DoF/MAFF. 2001. To Declare the Central Cardamoms Protected Forest, Submission to
the Council of Ministers, Department of Forestry and Wildlife, Ministry of Agriculture, Forestry and Fisheries, Cambodia.
DoFW. 1999. Cambodia Forest Cover Assessment. DoFW. 2000. The Second Five-Year Plan for The Forestry Sector 2001-2005,
Department of Forestry and Wildlife, Cambodia. DoFW. 2002. Cambodia Forest Policy Review, Department of Forestry and Wildlife,
Ministry of Agriculture, Forestry and Fisheries, Cambodia. Final Draft. 2002. Sub Decree on Community Forestry, Cambodia. Halsnæs,K. Callaway, J.M., Meyer, H.J.,1999. Economics of Greenhouse Gas
Limitations Main report: Methodological Guidelines. Henderson, D. 1999. The Forest Sector in Cambodia: Crisis and Opportunity, Phnom
Penh, Cambodia. IPCC, 2000. Land Use, Land-Use Change, and Forestry, Cambridge University Press. La Rovere., E.L. 1998. The challenge of limiting greenhouse gas emissions through
Activities Implemented Jointly in developing countries: A Brazilian perspective. Environmental Energy Division, Ernest Orlando Lawrence Berkeley National Laboratory, 43p.

24
Makundi, W. 1998. Mitigation options in forestry, land-use change and biomass burning in Africa. Lawrence Berkeley National Laboratory. Report Number LBNL-42767. Submitted to U.S. Environmental Protection Agency through the U.S. Department of Energy. Berkeley.
MoE. 2003. Improvement of activity data and emission factors for forestry sector in
Cambodia. Report submitted to UNDP under Climate Change Enabling Activity Project Phase II. Ministry of Environment. Cambodia
MoE. 2001a. Final Draft on Greenhouse Gas Mitigation Analysis Land Use, Land Use
Change and Forestry, and Agriculture, Ministry of Environment, Cambodia. MoE. 2001b. Final Draft on Vulnerability and Adaptation Assessment to Climate Change
in Cambodia, Ministry of Environment, Cambodia. MoE. 2002. Draft Protected Areas Law, Ministry of Environment, Cambodia. Ravindranath, N.H., Rao, K.U., Natarajan, B, and Monga, P. 2000. Renewable Energy
and Environment. Centre for Environmental Education. McGraw Hill, New Delhi.
Republic of Indonesia, Ministry of Environment. 2001. Identification of Less
Greenhouse Gases Emission Technologies in Indonesia. RGC, 2001. Second Five Year Socio-Economic Development Plan 2001-2005, Royal
Government of Cambodia. RGC, 2002. Law on Forest, Royal Government of Cambodia. Sathaye, J. 1999. Climate change mitigation: Forestry potential in developing countries.
In International Workshop on ‘Development of Climate Change Action Plans’. Asian Development Bank, Manila.
Sathaye, J. and Meyers, S. 1995. Greenhouse gas mitigation assessment: A Guidebook.
Environmental Science and Technology Library. Kluwer Academic Publisher. Solberg B. 1988. Choice of Technology in Less Industrialized Countries with Particular
Reference to Forestry and Saw Milling. Report No. 3, Aas-NLH, Norway. Trexler, M. C., Kosloff, L. H., and Gibbon, R. 2000. Forest after the Kyoto Protocol: A
review of key questions and issues. In “Climate Change and Development” (L. Gomez-Echeverri, ed.), pp. 131-152. UNDP.
Yoshida, K. 2002. Draft Final Report Study on: Development of Forest Management
Plan for Forest Rehabilitation and Extension Stations, Department Forestry and Wildlife and Japan International Cooperation Agency, Cambodia.

25
VIII. ASSESSMENT OF GREENHOUSE GAS MITIGATION TECHNOLOGIES FOR AGRICULTURE SECTOR
3.6. Introduction Agriculture sector in Cambodia contributes about 10,560 Gg of CO2 equivalent or about 18% of total GHG emission in the country in 1994 ( MoE, 2002). Efforts to reduce the GHGs emission from this sector would contribute modestly to the reduction of GHG emission of the country. There are many options available such as carbon sequestration by soils and in other ways, capturing methane emission from manure and agriculture waste, improving water management in irrigated rice, and increasing feed efficiency for livestock to reduce methane emission. Each of this mitigation option, however, requires farmers to change their existing practices, and need for technology transfer (IPCC, 2000). This chapter discusses potential mitigation technologies available for this sector and their potential for implementation in Cambodia. Barriers for their implementation as well as strategies to remove the barriers are also discussed briefly. 3.7. Internationally Existing Less Greenhouse Gas Emission Technologies In the 1996 IPCC guideline, GHGs emission from this sector can be divided into five sources namely: 1. Domestic Livestock (Enteric Fermentation and Manure Management). During
digestive process in which carbohydrates are broken down by micro-organisms into simple molecules for absorption into the blood-stream of ruminant animals (e.g. cattle, sheep), large amount of methane is produced. However, the amount of CH4 that is released depends upon the type, age and weight of the animal and the quantity and quality of the feed consumed. Methane from the management of animal manure occurs as the result of its decomposition under anaerobic conditions. These conditions often occur when a large number of animals are managed in a confined area (e.g., dairy farms, beef feedlots, and swine and poultry farms).
2. Rice Cultivation (Flooded Rice Fields). Methane emission occurs as a result of
anaerobic decomposition of organic material in flooded rice fields. This gas escapes to the atmosphere primarily by diffusive transport through the rice plants during the growing season. Upland rice fields, which are not flooded, do not produce significant quantities of CH4.
3. Prescribed Burning of Savannas. Alternating wet and dry seasons controls the growth
of savannas. Most of the growth occurs during the wet season, while burning of savannas occur during dry season due to man-made and/or natural fires. This process will result in nutrient recycling and regrowth of the savannas. Large scale burning takes place primarily in the humid savannas because the arid savannas lack sufficient grass cover to sustain fire. Savannas are burned every one to four years on average. The burning of savannas results in instantaneous emissions of carbon dioxide

26
including methane, carbon monoxide, nitrous oxide and oxides of nitrogen. However, because the vegetation regrowth between the burning cycles, the carbon dioxide released to the atmosphere is reabsorbed during the next vegetation growth period. Therefore, in the burning of savannas only emission of non-CO2 should be accounted for.
4. Field Burning of Agricultural Residues. Most of farming activities produce large
quantities of agricultural residues. Burning of these residues in the fields is a common agricultural practice, particularly in developing countries and this burning process will be a source of methane, carbon monoxide, nitrous oxide and nitrogen oxides emissions.
5. Agricultural Soils. All agriculture soils may emit and absorb GHGs. At least there
are three types of emission from the soils, namely (1) direct emissions of N2 O from agricultural soils (including glasshouse systems farming and excluding effects of grazing animals) (2) direct soil emissions of N2 O from animal production and (3) indirect emissions of N2 O from nitrogen used in agriculture.
Contribution of this sector to the global GHG emission is quite significant (Table 3.1). Some of practices that have been implemented in many countries to reduce the greenhouse gas emissions from this sector (Table 3.2). The following sections only discuss a bit detail the available internationally mitigation technologies for agriculture sector which may be relevant to Cambodia.
Table 3.1. CO2 equivalent of GHGE from agriculture sector
CH4 Emissions in Terms of CO2-Eqv. (Gg)
CH4 Emissions in Terms of CO2-
Eqv. (Gg)
Total Emissions
(CH4+NO2+NOx+CO) in CO2-
Eqv. (Gg)
CH4 Emissions
as % of Total
Emissions
% Share of Agri. Sector to Energy Sector (+ Industrial
Processes) Emissions
(CO2-Eqv.)
Country
Rice Livestock Others* Bangladesh 16,107 12,432 99 28,638 28,729 99 165 China 234,465 99,372 - 333,837 333,837 100 14 India 85,470 177,828 2,436 265,734 325,180 81 55 Indonesia 53,403 16,779 969 71,151 75,332 94 46 RoKorea 8,694 3,885 - 12,579 12,886 98 5 Mongolia - 5,124 - 5,124 5,124 100 38 Myanmar 27,888 9,240 19 37,147 39,203 95 626 Pakistan 11,046 33,957 54 45,057 48,285 93 8 Philippines 11,907 6,657 563 19,127 26,700 72 56 Thailand 37,506 13,566 463 51,535 74,187 70 15 Vietnam 36,855 9,618 850 47,323 96,372 49 231 Total 523,341 388,458 5,453 917,252 1,065,835 Asia 1,407,000 525,000 1,932,000 Global 1,512,000 1,596,000 3,108,000 * Includes Savannah burning, agricultural soils and burning of soil residue. Source: ADB/GEF/UNDP (1998)

27
Table 3.2. List of practices to reduce CH4 and N2O emission from agricultural system
Mitigations
Estimated Decrease due to Practice (TG CH4 or N2O-N/yr)
Ruminant Livestock 29.0 (12.0 – 44.0) Improve diet quality and nutrient balance 25.0 (10.0 –35.0) Increase feed digestibility 2.0 (1.0 –3.0) Production-enhancing agents 2.0 (1.0 –3.0) Improve animal genetics - Improve reproduction efficiency - Livestock Manure 5.1 (2.6 - 8.7) Covered lagoon 3.4 (2.0 - 6.8) Small digester 1.7 (0.6-1.9) Large digester Flooded Rice 20.0 (8.0 –35.0) Irrigation management 5.0 (3.3-9.9) Nutrient management 10.0 (2.5 - 15.0) New Cultivars and other cultural practices 5.0 (2.5 - 10) Biomass Burning 6.0 (3.0 – 9.0) Incorporate crop residues into soil - Increase the productivity of lands - Lengthen the rotation time - Agriculture Soils 0.68 Match N supply with crop demand 0.24 Tighten N flow cycles 0.14 Use advanced fertilizer techniques 0.15 Optimize tillage, irrigation and drainage 0.15
Source: Metz et al. (2000) 3.7.1. Rice Cultivation Pressure on Asia's land resources to produce more rice will aggravate in the coming years due to increasing population and demand for food and this may lead to the significant increase in GHGs emission from this sector, in particular methane and nitrous oxide (Wassmann et al., 2000). Therefore, efforts to reduce methane emission from rice cultivation will contribute significantly to the stabilization of GHG concentration in the atmosphere. Soil microorganisms such as bacteria govern the formation and distribution of GHGs in the soils. Physio-chemical characteristics of the soil, such as its redox potential (Eh), soil acidity (pH), and nutrient availability will affect directly or indirectly activities of these microorganism. These characteristics are also affected by many factors such water management, organic matter application, fertilization, soil cultivation, etc. Thus emission of GHG from rice field such as methane, is governed by a complex set of parameters that link the physical and biological characteristics of flooded soil environment with specific agricultural management practice.

28
Impact of different management practices has been addressed in several field studies. The studies has shown that rate of methane emissions from paddy field was determined by organic amendment, water management, fertilizer management and rice cultivars. Thus, the emissions rates varied in a very wide range from 5 to 634 kg CH4/ha, depending on season and crop managements. The following sections describe the a number of mitigation options and their potential in reducing the rate of methane emissions from rice cultivation. (a) Water Management Water management is the main factor influencing the gas exchange between soil and atmosphere. It has direct impact on the entire processes involved in methane emission: its production, oxidation and transportation (Setyanto & Hidayat, 2001). On the other hand, supply of water may incur cost some rice farmers, e.g., through pumping. Moreover, water will be come a scarce commodity in the future. Water saving techniques can offer distinct trade-offs for mitigating CH4 emissions. For example intermittent irrigation or non-continuous flooded can substantially increase water use efficiency (Didiek, 1998), and good timing of drainage and irrigation is essential to prevent soil compaction and subsequent water losses in re-flooding the field (Tuong et al., 1996). These practices will reduce the emission without harming the yield significantly (Makarim et al., 1996; Makarim & Setyanto, 1998; Sass et al., 2002). Studies in Indonesia showed that the rate of methane emission decrease significantly with the change of water management from continuous flooded to non-continues flooded, and in many cases, yield of rice was not affected significantly (Table 3.3). Other study in China (Corton et al., 2000) showed that mid-season drainage of rice field for short-term periods at the end of tillering and before heading improved yields and reduced emission. Midseason drainage as a strategy to reduce CH4 emission should be on a short duration (7-10 day) and timed when the rice plants have use up the fertilizer N applied at basal and vegetative stages. Reflooding should be done before the application of N fertilizer at the panicle initiation stage. Intermittent irrigation, though it significantly reduced (92%) CH4 emission, must be carefully evaluated as a mitigation strategy.

29
Table 3.3. Effect of water conditions, irrigated or continuous system versus rainfed or non continuous systems on methane emission and rice yield, Central java, Indonesia
Water Condition Methane Emission
(kgCH4/ha/season) Rice Yield (t/ha)
Rainy season 1993/19941
Irrigated/continuous flooded Rainfed/non-continuous flooded
197 26
7.0 4.3
Dry season 19941
Irrigated/continuous flooded Rainfed/non-continuous flooded
155 60
2.9 3.8
Rainy season 1994/19951
Irrigated/continuous flooded Rainfed/non-continuous flooded
145 90
4.6 4.9
Dry season 19951
Irrigated/continuous flooded Rainfed/non-continuous flooded
256 89
3.8 3.5
Planting season 20002
Irrigated/continuous flooded Intermittently flooded Saturated
143
25 79
6.5 4.9 5.8
Source: 1Makarim et al. (1996); 2 Setyanto et al. (1997) (b) Organic Amendment
Organic matter functions as carbon source for soil microorganism, a nutrient source for crop and as soil physical improper. However, organic carbon is also a source of CH4 production, while organic nitrogen is a source for N2O production. Therefore, organic management as well as soil and water condition, determines the level of GHGs emission (Setyanto & Hidayat, 2001). Several experiments show that application of rice straw 1-2 month before rice fields flooded may reduce methane emission as much as 15-50% compared with direct application at the beginning of flooding. Composting of rice straw or straw application in to dry fields may become more useful, because nutrient available increase while methane emission decrease (Makarim & Setyanto, 1998). Base on the content of readily mineralizable carbon, rice straw or green manure produces more CH4 than the humified substrate such as compost. Application of 12 ton /ha composted material, that has higher degree of humification, to a Gleysol and Andosol reduce in 62 and 40% lower CH4 emission rate, respectively, when compared with incorporation of 6 ton /ha rice straw (Indonesia ALGAS, 1997). Organic input promoted CH4 production and emission. Selecting the appropriate organic manure type (i.e. decomposed manure) and application method may reduce CH4 emission without a yield decrease (Lu et al., 2000). Studies on the effect of different source/type of organic matter on methane emission and rice yield at Jakenan, Indonesia showed that rate of methane emissions decreased as the organic matter application increased (Table 3.4). Studies from other countries also gave

30
similar results. The application of 12 t/ha of compost emitted less methane (40-60%) as compared to the application of 6 t/ha fresh rice straw (Setyanto & Hidayat, 2001).
Table 3.4. Effect of organic matter (OM) application on CH4 emission
Treatment CH4 Emission (kg/ha) Grain Yield (t/ha)
Rainy season 1995 Without OM; irrigated 145 4.6 Without OM; rainfed 90 4.9 2.5t FYM/ha; rainfed 78 4.1 5.0t FYM/ha; rainfed 84 5.0 Dry season 1996 Without OM; irrigated 256 3.8 Without OM; rainfed 89 3.5 2.5t FYM/ha; rainfed 96 3.5 5.0t FYM/ha; rainfed 101 3.1 Source: Makarim (1996) (c) Fertilization
Fertilization improves plant growth and generally increases CH4 emissions. Effects of different N fertilizer on CH4 production from soil incubation studies have been reported by Wang et al., (1992). Addition of urea did not increase total production of CH4 but stimulated CH4 production in the acid soil, possibly because of a short-term increase in pH after urea hydrolysis and a resulting decrease in Eh. Application of nitrate-containing fertilizer the soil Eh and results in a decrease in both the rate and the total amount of CH4 production. Sulfate containing fertilizer decreases CH4 production especially when applied in large amounts. Schütz et al., (1992) reported that application of ammonium sulfate to the surface reduced CH4 emission by 6%, and if it was incorporated into the soil, the CH4 emission reduction increased up to 62%. Lindau et al., (1993) found that sodium sulfate was more effective than ammonium sulfate in reducing CH4 emission. Application of 100kg/ha ammonium sulfate will provide sulfate concentrations in the soil solution that may reduce CH4 production. Sulfate reduction will rapidly deplete the sulfate pool. The magnitude of decrease of CH4 emission by sulfate containing N fertilizer depends on the reoxidation of sulfides (Neue et al., 1995). However, the effect of ammonium sulfate on yield was not reported. Setyanto et al. (1997) reported that the effect of mineral fertilizer such as tablet urea, prilled urea and ammonium sulfate on methane emission was also affected by method of their application (Table 3.5). Incorporation of sulfate containing N-fertilizer into soil also reduced methane emission. The use of ammonium sulfate as N-fertilizer to replace urea resulted in a 5-25 % decrease in CH4. In the Philippines, the use of ammonium sulfate reduced emission by up to 24-36% (Corton, 2000).

31
Table 3.5. Effect of fertilizer application methods on methane emission of the rainfed and irrigated rice fields in Central Java, Indonesia
Treatment CH4 Emission (kg/ha) Grain Yield (t/ha)
Prilled urea, broadcast 3x, irrigated 180 5.2 Prilled urea, broadcast 2x, irrigated 182 5.1 Prilled urea, broadcast 1x, irrigated 109 4.0 Prilled urea, deep placement, irrigated 152 4.6 Ammonium phosphate, broadcast 3x, irrigated 170 6.2 Ammonium phosphate, broadcast 2x, irrigated 175 5.5 Ammonium phosphate, broadcast 1x, irrigated 99 4.5 Ammonium phosphate, deep placement, irrigated 136 4.5 Tablet urea, deep placement, irrigated 157 5.9 Prilled urea, irrigated 171 7.4 Tablet urea, irrigated 105 7.5 Prilled urea, rainfed 32 6.9 Tablet urea, rainfed 39 6.9 Source: Setyanto et al. (1997 and 1999). (d) Rice Cultivar Wide variation in the amount of CH4 emitted by different cultivars has also been observed. The structure of the aerenchyma, particularly the intersection between root and shoot aerenchyma, controls the diffusion of CH4. The development of new rice cultivars with a low potential for CH4 emission is an attractive mitigation option, but the inheritance of these traits and their relationship with yield potential must still explored. Soil and environmental factor may have an impact on the ability of the rice plant to emit CH4, which adds another facet to the selection of varieties with a low potential to emit CH4 (Ranganathan et al., 1995). Root exudates of rice plants may present a significant source of methane in paddy field. Varieties that reduce root exudation will result in reduced methane production in the soil and consequently reduced methane emission to the atmosphere. Such varieties also have potential to produce high yields, sine root exudation of carbon compounds may present a significant loss of photosynthate of the rice plants. Other indicators of variety characteristics, which relate to GHGs emission, are as follows: tiller numbers, total biomass, growth duration, and root oxidizing power. Field experiment conducted in Pati, Indonesia, found that methane emission from different rice varieties ranged from 68 kg/ha to 330kg/ha (Table 4.6). However, no correlation between methane emission and rice grain yield were observed. Thus, it is possible to fine varieties that emit less methane but produce higher yield on the same rice fields (Setyanto and Hidayat, 2001).

32
Table 3.6. Yield and CH4 emission of several rice varieties in irrigated lowland rice in Pati, Indonesia.
Rice Varieties Growth Day CH4 Emission
(kg/ha) Grain Yield
(t/ha) IR64 105 86 3.8 Cisadane 125 206 4.0 Memberamo 105 115 5.1 IR36 105 112 4.9 Dodokan 98 74 3.2 IR72 115 330 4.6 Batang Ani 108 169 4.9 Source: Wihardjaka (1997) (e) Cultural Practice
Only a few information available concerning the effects of cultural practice (e.g., soil tillage, puddling, seeding, transplanting, pest control) on methane emission is available up to now. Nevertheless, evaluation of cultural practice related to CH4 emission and their risk/benefit studies are absolutely necessary. Several researches on the effect of cultural practice on methane emission from rice fields have been conducted in China, India, Indonesia and Philippines (Table 4.7). The practice of direct seeding alone accounted for a reduction effect of 16-22% in the seasonal emissions as compared with the practice of transplanting. Direct seeded develops high root biomass during early stages and reaches maximum root biomass soon after panicle initiation (De Datta & Nantasomsaran, 1991). Roots of transplanted rice develop slower but can penetrate into the deeper layer of the puddled soil as compared with the relatively compact soil under direct seedling. Direct seeding is getting increasingly popular in major rice growing region. Substantial saving in labor requirements make this type of crop establishment economically viable, although yield are lower (Wassmann et al., 2000). The options include zero tillage technique was shown to reduce CH4 emission by 35.9 kg/ha. This may be due to the absence of soil disturbance, which could prevent immediate release of CH4. On the other hand, this technique may produce a penalty to the rice yield by 12.5 per cent of reduction due to less favorable soil environment to support crop growth. This technique is promising, as it does not require cultivation. However, considering the yield loss, it might not be an interesting option to farmers in general (Setyanto & Hidayat, 2001).

33
Table 4.7. Effect of different cultural practices (direct seeded vs. transplanting) on CH4 emission of the rice fields
Treatment CH4 Emission (kg/ha) Grain Yield (t/ha)
Transplanted 20X20; irrigated 166 4.5 Direct seeded; 20X20;irrigated 152 7.1 Direct seeded; 15X20;rainfed 28 6.5 Direct seeded; 20X20;rainfed 19 4.4 Transplanted 20X20;irrigated 134 2.6 Direct seeded; 20X20;irrigated 90 3.8 Direct seeded; 15X20;rainfed 66 3.6 Direct seeded; 20X20;rainfed 163 2.9 Source: Makarim and Setyanto (1995) 3.7.2. Livestock Asian countries have been reported to emit about 16,169 Gg of CH4 in 1990 (Ravindranath, 1996) from livestock. This huge amount of emission emitted into the atmosphere might cause adverse impact on climate. Historical data suggested that livestock population in Asian countries would double by the year 2020. In the case of no alternative to reduce the emissions, this emission would have significant contribution to the increase of GHGs concentration in the atmosphere. The following discusses some mitigation options that have been identified. (a) Enteric Fermentation The concept of methane emission reduction from livestock sector is prioritized via mechanical and chemical feed processing, strategic supplementation, enhancing agents, genetic improvement, and reproductive improvement (Halsnæs et al., 1999). Studies in some Asian countries showed that all mitigation options provided benefits. They did not only reduce CH4 emission, but also increased milk and meat production. Mitigation potential of the options ranged from 2 to 38.8 kg/animal/yr with mitigation cost of less than US$ 2 per kilogram of CH4 reduction, except Republic of Korea (Table 3.8).

34
Table 3.8. Mitigation options, mitigation potential and costs for the livestock sector in several Asian countries
Country Mitigation Options Mitigation
Potential (kg/head/yr)
Mitigation Cost ($/kg
CH4)
Investment Cost
($/head/yr)
NPV of Benefits
($/kg CH4)
Impact on Milk
Yield (%) Bangladesh • Molasses-urea block - 0.92 - - 25 China • "licking brick"
• Ammonia treatment of straw 15.5 5.3
1.25 1.85
8.4 11.3
- -
+20-30 15
Indonesia • Providing mineral block • Use of local crop residue • Artificial insemination • Modified rumen • Increased digestibility • Biogas plant
22.2 16.6 8.3
13.8 8.3
38.8
0.24 0.24 1.09 1.39 1.87 0.65
40 40 40 40 64 60
11.46 2.55
159.81 3.97 5.09
-
+16-50 +22
+157 - - -
RoKorea • Manure Management • Chemical feed treatment • Productivity performance
2.0 15.0 5.0
-35.30 3.60 8.20
70.5+70.5 65.5+32.7
109.6+35.9
12.10 1.70 6.10
- 8 5
Myanmar • Urea-molasses block • Urea treatment of straw
14.0 6.0
3.13 3.47
43.8 20.8
1.75 3.06
+20 +20-30
Pakistan • Multi-nutrient feed block 17.0 10.80 23.0 70.60 10
Vietnam • Chemical feed treatment for improve varieties
7.5 0.40 3.0 0.07 5-10
India • Molasses-urea block 2.4 Mt/yr - 47 - - Source: ADB/GEF/UNDP (1998) (b) Manure Management Methane emission from livestock manure is planed to reduce by three primarily options such as covered lagoon, small digester and large digester. Biogas production by recovering the methane emission from anaerobic fermentation, is now considered by many countries as a potential mitigation option around the world, particularly Indonesia, China, India and Republic of Korea. The recovered methane gas can be use directly on the farm to supply various energy end uses, or can collected and sold, or it can be used to fuel boilers that provide the energy to generate electricity. The remaining by-product of anaerobic decomposition, contained in the slurry or liquid effluent, can be use as crop fertilizer, animal feed, and as supplements for aquaculture. Biogas can also improve the quality of life for rural women. Evaluation of options for reducing CH4 emission reduction showed that the potential mitigation of the options ranged from 2 to 39 kg/head/year (Table 3.9).

35
Table 3.9. Mitigation potential of options in Asian countries
Category and Types of Mitigation Options
Countries Analyzing the
Options
Features Mitigation Potential,
(kg/head/yr) CH4 mitigation from enteric fermentation Providing mineral blocks/MNB
Indonesia, China
10-30% increase in milk yield (only for dairy cattle), enhances protein use efficiency, enhances feed conversion efficiency
15.4 (3.8 - 27)
Molasses-urea block Indonesia, Bangladesh, Myanmar, India
Increases feed conversion efficiency, 25% increase in milk yield, CH4 reduced by 27%, 60% increase in animal productivity
14.0
Urea treatment of straw China, Indonesia, Myanmar, Vietnam
Rice straw soaked in 2% urea for 15d, improves digestibility up to 25%, 15-20% achievable in field, milk yield increases by 20-30%
6.1 (3.8 - 8.3)
Chemical/mechanical feed treatment
Vietnam, RoKorea
Improves digestibility by 5%, enhances weight gain (6kg/yr), 10-30% reduction in CH4
10 (5 -15)
Genetic improvements Indonesia 10% reduction in CH4 (IPCC), 160% increase in milk yield
8.3
Manure management Biogas plant Indonesia,
RoKorea, China
70% reduction in CH4 emissions (where lagooning is practiced)
2 - 39
Source: ADB/GEF/UNDP (1998) 3.8. Evaluation of Mitigation Options Cambodia has conducted a study to evaluate potential of mitigation options for reducing methane emission from rice paddy under Climate Change Enabling Activity Phase 1 (MoE, 2002). Due to data limitation, the options being evaluated during the study were only intermittent (Int), direct seeded rice (Direct), manure application and zero tillage in both seasons, dry season (DS) and wet season (WS). It was found that the incremental benefit per hectare increased exponentially with mitigation potential while incremental benefit per ton of methane decreased exponentially with the mitigation potential (Fig. 3.1).

36
Figure 3.1: Relationship between Incremental Benefit and Mitigation Potential (MoE, 2001a)
The study further evaluated the potential application of the options in Cambodia. It was stated that total area of 2.1 million ha was available for implementing the mitigation options (potential scenario). Considering the barriers, in the short term this potential might not be able to be achieved. Furthermore, the study suggested that if the methane emission from agriculture sector would be reduced by 10% through the implementation of the seven options (mitigation scenario), total area required would be about 0.424 million ha (Table 3.10).
Table 3.10: Area Allocated for Each Option for Potential and Mitigation Scenarios No. Options Score Land Allocation under
Potential Scenario (Hectares)
Land Allocation under Mitigation Scenario
(Hectares) 1 Dry Season Intermittent 8.20 76,000 16,000 2 Dry Season Directed seed 6.90 64,000 33,000 3 Dry Season Manure 8.32 77,000 68,000 4 Dry Season Zero 2.63 24,000 18,000 5 Wet Season Direct 6.53 627,000 69,000 6 Wet Season Manure 8.20 786,000 140,000 7 Wet Season Zero 5.24 503,000 80,000
TOTAL 2,158,000 424,000 Source: MoE (2001a). Land allocation for each option was determined based on several attributes, namely Profitability, Yield, Potential emissions reduction, applicability, and Social acceptability. Option with the highest land allocation was the most preferred option. Further analysis showed that if the mitigation scenario were implemented, total methane emissions that can be reduced by the mitigation scenario would be about 40,000 tonnes (Figure 3.2). The cumulative incremental benefit was 21,307 US$. As the incremental benefit is positive, this means that by implementing the mitigation scenario, farmers will
0
10
20
30
40
50
60
70
80
0 100 200 300
Potential Mitigation (kg/ha/season)
Incr
emen
tal b
enef
it (U
S$/
ha)
1
2
56
37
4
0100200300400500600700800900
0 100 200 300
Mitigation potential (kg/ha/season)
Incr
emen
tal b
enef
it (U
S$/
t CH
4)
6
3
72
5
1
4
1=DSInt 2=DSDirect 3=DSManure 4=DSZero 5=WSDirect 6=WSManure 7=WSZero
1=DSInt 2=DSDirect 3=DSManure 4=DSZero 5=WSDirect 6=WSManure 7=WSZero

37
get dual benefit. The first is that farmer will receive more benefit and the second is that rate of methane emission decreases. Therefore, encouraging farmers to adopt the options is very important not only for the environmental benefits but also for the improvement of farmers’ income.
Figure 3.2. Carbon Emissions Reduction Initiative (CERI) for the Mitigation Scenario (MoE, 2002)
3.9. Barrier for the Implementation of Mitigation Options The studies have shown that adoption and implementation of mitigation options in agriculture sector is not only provide benefits for the environment but also increase farmers’ income. However, level of adoption of the mitigation technologies is very limited due to a number of barriers. There are four barriers that may hinder the adoption and the implementation of the options namely: (i) institutions, (ii) policy and regulation, (iii) technology, and (iv) socio-economic. 3.9.1. Institutional Barriers
Weak coordination between relating agencies to perform the technologies, unclear mandates between the Ministry of Agriculture, Fisheries and Forestry (MAFF) and the Ministry of Water Resource and Meteorology (MWRM) on irrigation management. Absence of institutional support for adoption GHG mitigation technologies, limited knowledge of government official/extension workers on the technologies as well as technical skill, and weak agricultural extension service system, are important factors that limit the adoptions of the mitigation technologies in Cambodia. From the discussion with the related sector, it was stated that there is a serious gaps and overlap in the mandates of the MAFF, Ministry of Rural Development (MRD) and MWRM) on irrigation activities are not very well defined. These institutional weaknesses have resulted, among other thing, in a lack of systematic assessment of the development potentials of the country's resource base and of baseline information for planning, programming and implementing agricultural development projects in general and GHG mitigation technologies in particular.
Mitigation Scenario
01020304050607080
0 10000 20000 30000 40000Cumulative CH4 abated (ton)
Incr
emen
tal o
f ben
efit
(US
$/ha
) 7 36 5
2 1
4
1-DSInt2-DSDirect3-DSManure4-DSZero5-WSDirect6-WSManure7-WSZero
Mitigation scenario
0
200
400
600
800
1000
0 10000 20000 30000 40000Cumulative CH4 abated (ton)
Incr
emen
tal o
f ben
efit
(US$
/t CH
4) 1-DSInt2-DSDirect3-DSManure4-DSZero5-WSDirect6-WSManure7-WSZero4
1
52 7 3
6

38
To remove the above barriers, there would be some national strategy requirement are suggested as the following: • Strengthen coordination among local government units and institutions concerned; • Strengthen institutional capacity in technical aspect of the mitigation technologies
through intensive training, staff capacity upgrading and redeployment at different levels;
• Develop public awareness program on Climate Change in general and climate change mitigation technologies in particular not only for agricultural extension workers but also for provincial technical staff and farmers; and
• Enhance collaboration between public, private sectors and farmers in the implementation of the mitigation technologies.
3.9.2. Policy and Regulations Barriers In general, environmental regulation and policies often play a significant role in creating condition for adopting certain technologies. There are some factors related to policy and regulation that may hinder the adoptions the mitigation technologies. These include:
• There is a lack of clear policy framework for agriculture and rural development; • Investment strategy of the development of resource and technology based production
system have not yet been developed; • The government itself does not have means to plan, finance and manage a
comprehensive agriculture research program; • There is an inadequate consideration of human motivations and goal; • There is no any incentive policy for addressing environmental externality; and • Present policies only focus on large-scale gravity irrigation systems for increasing
rice production, in particular. How water management system should be managed and controlled so that water use efficiency increases and at the same time productivity/farmers’ income also increase while CH4 emissions decreases.
Considering the above barriers, the government should develop policy and regulation that can promote rapid and sustainable increase in production through the adoption of the mitigation technologies that can increase productivity and reduce cost. 3.9.3. Technology Barriers The institutional arrangement and mechanisms for the effective delivery of agricultural support service such as extension programs are either not in place or are inadequate. Agricultural extension services are very weak. A fully functioning system for extending support services- and more importantly, of spreading technology to the rural population has not yet to be established. Farmers have very limited access to improved technologies with existing extension service. State institutions are unable to focus and effectively deliver on a timely basis essential services and functions in support of highly productive, intensive and diversified farming systems.

39
There is currently a paucity of knowledge of new farming technologies appropriate to the local farm setting. Limitations in both the availability of technology and the capability to identify, test, and adopt promising technology also exist. In term of mitigation technologies, some specific technology barriers include: • The current irrigation management system can not support the proposed intermittent
system; • Limitation in both the technology availability and the capacity to identify, test and
adopt promising technology; • Poor soil and fertilizer management technologies and most farmers use traditional
one; • Lack of demonstration projects and limited research, extension linkage; • Lack of available information about technology cost and benefit; • Low level of knowledge and access to technology are limited and farmers need
special assistance; and • Require the skill to construct, maintain small-scale biogas digester. Furthermore, Pawitan (2001) identified a number of technology barriers that may hinder the adoption of the GHG mitigation technologies. In summary the barriers are related to the limited skill and understanding of farmers’ and extension workers on the technologies, the mitigation technologies may create an unanticipated problem, and the technologies may require more labors such as intermittent irrigation (Table 3.11). Specific efforts that need to be done for removing the barriers would be: • Improvement of irrigation system and management; • Conducting capacity building activities for technical staff and farmers (i.e. knowledge
of direct seedling methodology, land preparation and soil improvement); • Encouraging manure use and manure production program; and • Promote applied research activities (e.g. demonstration plot, field days etc.) on the
mitigation technologies in farmers' fields.

40
Table 3.11. Barriers for adoption of specific agriculture technologies
Mitigation Options Barriers Irrigation efficiency Requires large investment and national
technology and assessment commitment Requires technology transfer to the farm level Requires cooperative community action
Direct seeding rice Requires intensive weed control Substitution of traditional varieties by improved varieties
Less preferred grain quality New pest problem in certain areas Change management
Minimum tillage Risk of yield reduction Different machinery needs, crop varieties, soil moisture and temperature conditions Requires intensive weed control
Ammonium of straw for animal feed Ammonium sulphate is more expensive than urea
Large scale biogas digester More investment More complex to operate and maintain
Source: Pawitan (2001). 3.9.4. Socio-economic and Equity Barriers Subsistent farming system could not provide satisfactory income to farmers. Lack of funding to implement in large-scale investment by private sector and by farmers themselves are the main barriers, especially while absent of institutional and policy incentives. Other barriers include changing price of product in the market and lack of market information. Equity is also an important factor in development context. Two decades of war and civil strife have placed extraordinary strains on status of women in the country. Women constitute 51.7% of households. Cambodia has one of the highest female labor force participation rates in the region at 73.5% of women over the age of 15. Women comprise of 54% of the skilled agriculture sector and fishery workers and also make substantial contributions in non-agricultural sectors of the economic. But at the same time women are most vulnerable in society for long period of time and government is trying to encourage women and hold up the woman equity in society. It would be successful if women participate potentially in this effort. 3.10. Strategic Recommendation To introduce new technologies to different rice ecosystem, good understanding on the baseline practices in different rice ecosystems and socio-culture of the farmers are required. Good knowledge of extension workers on the technologies is also very important. At present, most of activities related to climate change are still at the preliminary stage. Awareness of community and sectors to climate change issues impact is still limited, and very little attention has been given to this issue even though damages caused by extreme climate in agriculture sector tend to increase from year to year (MoE,

41
2002). To accelerate the process of adoption the technologies some aspect that should be incorporated into national work plan are: • Human resource development in climate field. The work plan should not focus only
on mitigation aspects but also most importantly on impact and adaptation aspects. Program such as in-depth technical training on GHG mitigation analysis and Vulnerability & Adaptation Assessment to climate Change should be included.
• Improvement of institutional capacity in the field of climate change related to agriculture and other cross-sectoral initiatives, and other stakeholders.
• Development and/or updating the incentive system to private or public investment in agriculture sector and develop good market system that ensures the stability of agricultural products prices.
• Improving better cooperation and information exchange between governmental institutions, countries and international organizations.
• Strengthening research program on genetic development and agricultural practices, • Strengthening networking with other relevant institutions in both national and
international level in order exchange knowledge, experiences and technology transfer. • Financial rising for research and development. Lack of adequate capacity for research and provision of extension services hamper the spread of technologies that suit local conditions. The declining role of Consultative Group on International Agricultural Research (CGIAAR) in assisting developing countries as their funding slows, has exacerbated this problem (Metz, 2001). Adoption of new technology is also hindered by small farm size, credit constrains, risk aversion, lack of access to information and human capital, inadequate rural infrastructure, and unreliable supply of complementary inputs. Therefore, specifically the adoption of the technologies may be accelerated by (i) the expansion of credit and saving schemes, (ii) shifting international research funding towards water use efficiency, irrigation management, and adaptation to salinity; and (iii) rationalization of input and output prices of agricultural commodities, taking Development, Equity, and Sustainable (DES) issues into considerations.

42
3.6. References ADB/GEF/UNDP, 1998. Asia Least-cost Greenhouse Gas Abatement Strategy
(ALGAS): Summary Report. Manila, Philippines. Bert Metz, Ogunlade R. Davidson, Jan-Willem Martens, Sascha N.M.van Rooijen, and
Laura Van Wie McGrory, 2000. Methodological and Technological Issues in Technology Transfer. Cambridge University Press.
Corton TM., Bajita JB., Grospe FS., Pamplona RR., Asis Jr RR., Wassmann R., Lantin
RS., Buendia LV., 2000. Methane emission from irrigated and intensively managed rice fields in Central Luzon, Philippines. Methane Emission from Major Rice Ecosystem in Asia. Kluwer Academic Publisher, pp37-53.
De Datta SK & Nantasomsaran P, 1991. Status and prospects of direct seeded flooded
rice in tropic Asia. In: Direct seeded flooded rice in the tropic, pp1-16. Didiek SB., 1998. Alternative technique of water saving through intermittent irrigation
system for rice crop. Water and Land Resource Development and Management for Sustainable Use, Vol. II-A, Indonesian National Committee on Irrigation and Drainage A-31, p 8.
Halsnæs,K., Callaway, J.M., Meyer, H.J.,1999. Economics of Greenhouse Gas
Limitations Main report: Methodological Guidelines. Indonesia ALGAS Project, 1997. Mitigation Options Assessment for Energy and Non
Energy Sectors, Technical Report Task B3. IPCC, 2000. Land Use, Land-Use Change, and Forestry, Cambridge University Press. Lindau CW., Bollich PK., DeLaune RD., MosierAR., BrosonKF., 1993. Methane
mitigation in flooded Louisiana rice fields, Bio Fert Soils15: pp174-178. Lu WF, Chen W, Duan BW, Guo WM, Lu Y, Latin RS, Wassmann R, & Neue HU.,
2000. Methane emission and mitigation in irrigated rice fields in Southeast China, Methane Emission from Major Rice Ecosystems in Asia. Kluwer Academic Publishers, pp 65-73.
Makarim AK. & Setyanto P., 1998. Alternative Technologies to Suppress Greenhouse
Gases Emission in Agricultural Practice in Indonesia, Economic assessment of greenhouse gas abatement options, Proceedings ALGAS-Final National Workshop.
Makarim AK., & Setyanto P.,1995. Methane emission from rice field at Jakenan,
Indonesia. Presentation for the annual IRI-EFA-UNDP planning meeting of methane emission from field. IRI-EFA-UNDP, Bangkok.

43
Makarim AK., Setyanto P., Fagi AM., 1996. Suppressing methane emission from rainfed lowland rice field in Jekenan, Central Java. Proceedings of the International Symposium on Maximizing Sustainable Rice Yields through Improved Soil and Environment Management, pp365-378.
MoE, 2001. Final Draft, National Greenhouse Gas Inventory for 1994, Ministry of
Environment, Phnom Penh, Cambodia. MoE, 2001a. Final Draft on Greenhouse Gas Mitigation Analysis Land Use, Land Use
Change and Forestry, and Agriculture, Ministry of Environment, Cambodia. Neue HU., Wassmann R., Lantin RS., 1995.Mitigation Options for Methane Emissions
from Rice Fields, Climate Change and Rice, IRRI, pp136-144. Pawitan, H. 2001. Development of modalities to acquire and implement less GHGs
emission technologies: Non-energy sector. In MoE. Identification of less greenhouse gases emission technologies in Indonesia, pp: 8.1- 8.25 Ministry of Environment of Indonesia.
Ranganathan R., Neue HU., & Pingali PL., 1995. Global Climate Change: Role of rice in
methane emissions and prospects for mitigation. Climate Change and Rice, IRRI, pp122-135.
RGC, 2001. Second Five Year Socio-Economic Development Plan 2001-2005, Royal
Government of Cambodia. Sass RL, Fisher FM, Wang YB, Turner FT, & Lund MF, 1992. Methane emission from
rice fields: The effect of flood water management. Global Biogeochemical Cycles 6(3): 249-262).
Schutz H, Holzapfel-Pschorn A, Conrad R, Renenberg H, Seiler W, 1989. A three year
continuous record on the influence of daytime Italian rice paddy field. Setyanto P and Hidayat A., 2001. Identification of less greenhouse gases emission
technology in agricultural sector. Identification of less greenhouse gases emission technologies, Ministry of Environment of Indonesia.
Setyanto P., Makarim AK., Fagi AM., Wassmann R., & Buendia LV., 2000. Crop
management affecting methane emission in Central Java, Indonesia, Methane Emission from Major Rice Ecosystem in Asia, Kluwer Academic Publisher, pp85-93.
Setyanto, P. 1999. Inventarisasi emisi dan mitigasi gas CH4 pada lahan sawah di
Jakenan. In Simposium Tanaman Pangan IV. Pusat Penelitian Tanaman Pangan, Bogor.

44
Setyanto, P., Mulyadi, and Zaini, Z. 1997. Emisi gas N2O dari beberapa sumber pupuk nitrogen di lahan sawah tadah hujan. Jurnal Penelitian Tanaman Pangan 16:14-18
Tuong TP, Cabangon RJ, & Wopereis MCS., 1996. Quantifying flow processes during
land soaking of cracked rice soil. Soil Sci Soc Am J 60:872-879. Wang ZY, Xu YC, Li Z, Guo YX, Wassmann R, Neue HU, Latin LV, Ding YP, & Wang
ZZ, 2000. A four year record of methane emissions from irrigated rice fields in the Beijing region of China, Methane Emission from Major Rice Ecosystems in Asia. Kluwer Academic Publishers: pp. 55-63.
Wassmann R, Lantin RS, Neue HU, Buendia LV, Conrton TM, Lu Y., 2000.
Characterization of methane emission from rice fields in Asia. III. Mitigation options and future research needs, Methane Emission from Major Rice Ecosystems in Asia. Kluwer Academic Publishers: pp. 23-36.
Wihardjaka, and Makarim, A.K. 1997. Keragaman emisi gas metan dan hasil beberapa
varietas padi. Laporan Tahunan Loka Penelitian Tanaman Pangan, Jakenan, Pati.

45
IX. WASTE 4.3. Introduction IPCC Technical Paper I (1996) stated that about 50 to 80 Mt CH4 or about 10%-20% of global CH4 emissions from came from landfills, open dumps, domestic and industrial wastewater disposal. The main sources of CH4 of the industrial wastewater are principally from food processing and pulp and paper industries. The majority of wastewater emission is mainly from developing countries. Oh the other hand, in most of non-Annex 1 countries the domestic sewage and industrial waste streams are often unmanaged or maintained under anaerobic conditions without CH4 control. The generation rate of waste in all countries is related to the population growth. As the population would increase from time to time and also the change in the life style, the waste generation will also change. Without proper waste management, the rate of emission of GHGs and also other hazardous substances from waste will increase. Therefore, waste management need to be improved not only for the purpose of combating global warming but also for human for the improvement of human health. In the Initial National Communication, Cambodia emitted approximately 273 Gg of CO2 equivalent (Table 4.1). The main sources of the GHGs emissions are solid waste and human sewage while domestic wastewater and industrial wastewater only contribute to about 7%. Considering the population growth, it was expected that in 2020, GHG emissions from this sector would increase to 523 Gg annually.
Table 4.1: The 1994 GHG Emissions from Waste (Gg)
Sub Sector CH4 Emissions N2O Emissions CO2-Eqv. Percent Share
Solid wastes 5.90 123.96 45.3 Domestic wastewater 0.66 13.80 5.1 Industrial wastewater 0.21 4.47 1.6 Human sewage 0.42 131.16 48.0 Total 273.39 100.0 Source: MoE (2001)
Considering the above fact, technologies for waste management should be improved. This section focuses on the technology options that can be used to reduce waste production and GHGs emissions. Barriers for the implementation of the options in Cambodia are also discussed.

46
4.4. Available Options to Reduce GHG Emissions From Waste
4.6.1. Types of Wastes
According to IPCC guideline 1996, the GHGs emissions from waste are mainly from the three following sources, with the last being smallest source:
• Solid waste disposal on land; • Wastewater handling (industrial and domestic wastewater); and • Waste incinerator of fossil based products such as plastics.
The main GHGs emitted from these waste is CH4 while N2O only is only emitted in small amount from human sewage and waste incinerator. The current global CH4 emission from waste was about 375 Mt (IPCC, 1997). Solid waste at landfills will emit CH4 due to the decomposition of organic waste under anaerobic condition. Contribution of the solid waste to the global CH4 emission was between 5 and 20% (USEPA, 1994; IPCC, 1992). In estimating the CH4 emission from landfill, information on the fraction of organic matter in solid waste disposed in landfills or open dumps and waste composition is important. On the other hand, the amount of methane produced depends on the management of the disposed municipal solid waste and the depth of the solid waste in the landfill, therefore, knowledge of the extent and type of active landfill site management is also important. Wastewater streams from domestic and commercial wastewater and some industrial wastewater containing high organic material can emit significant amount of methane. It was estimated that the annual global CH4 emission from industrial wastewater was between 26 and 40 Tg, while those from domestic and commercial sources were only about 2 Tg. Together, they accounted for 8-11% of global methane emission (IPCC, 1995). 4.6.2. Options to Reduce GHG Emissions from Waste Methane is generated from solid waste and wastewater through anaerobic decomposition. Rate of methane emission from waste is expected to grow in the future with largest increases coming from developing countries. Efforts to reduce the methane emission from this sector can be done in many ways, including reducing waste generation (source reduction), diverting waste away from disposal sites (i.e. through composting, recycling, or incineration; Kruger et al., 2000). Solid Waste. As mentioned above, the amount of methane emitted from solid waste depends on the amount, composition, and management. Therefore to reduce the emission from the solid waste can be done by reducing the amount of waste disposed in the landfill, changing the composition of solid waste, improving waste management system, and capturing methane emitted from the landfill for energy. Reducing the amount of waste produce can be done through avoidance of waste production (become more

47
efficiency), reduction of waste production (material substitutions), re-using of material instead of turning them into waste, and reprocessing of the materials during manufacture instead of using new materials (community recycling). Changing the waste composition can be done through composting (recycling) to minimize the unnecessary disposal of organic waste in landfills. Managing solid waste can be done by using waste incineration in particular when available land is limited. An option which has been developed in many countries to reduce the methane emission from landfill is to recapture the emission and convert it into heat, electricity generation, vehicle fuel, and purification and injection into gas system. Wastewater Treatment. Methane emission from wastewater can be done by creating aerobic conditions. However, such approach will need energy for aeration which may result in off site increases in greenhouse gas emissions. Alternatively, the wastewater is treated under anaerobic condition and methane emitted is captured to produce energy or the straight forward options is by reducing industrial waste generation. The above options have been discussed thoroughly in several references (e.g. IPCC, 1996; Thorneloe et al., 1993). Table 4.2 provide summary of the mitigation options for reducing methane emissions from solid waste and wastewater.
Table 4.2. Summary of mitigation options in the waste management sector Mitigation options Effectiveness Technical
RequirementApplicability Cost
Solid waste disposal Waste reduction High Low-High High Low-moderate Waste diversion 1. Recycling: converting solid waste into new products
High (if focus on organic waste)
Low-moderate
High Low-moderate
2. Composting: a controlled process to breakdown organic matters into compost
High (if well managed)
Low High Low. Capital cost for solid-waste composting ranged from US$1.5 to US$ 45 million for 300 to 500 ton per day plant depending on the complexity of the plant system. Associate operating cost is from US$10 to US$90 per ton, but generally between US$20 and US$40 per ton.
3. Incineration: Burning or destruction of waste by controlled burning at high temperature
High High Low-moderate (less applicable in developing countries)
High
Methane recovery: capturing methane emission to be converted into energy
Moderate-High (50-75% of methane recoverable:
Moderate High (especially in the near term)
Low-moderate (depending on site). For a landfill with 1 million tons of waste, collecting and flare capital costs was about US$630,000 and with

48
Mitigation options Effectiveness Technical Requirement
Applicability Cost
most applicable at large sites)
capacity of 10 million tons landfill, it was US$3.6 million. Annual operating costs ranged from less than US$100,000 to more than US$200,000. Energy recovery capital costs can range from US$1000 to US$1300 per net kW.
Wastewater Treatment Waste reduction High Low-High High Low Waste diversion High Low High Low Aerobic treatment High Moderate-
high Low-moderate
Moderate-High (capital cost ranged from US$0.15 to US$3.00 million for construction with the volume of 2000-40000 m3 of wastewater flows per day. Maintenance and operating cost were excluded
Methane recovery Moderate-High
Moderate High (especially in term)
Low-moderate (depending on site)
Source: Kruger et al., (2000) and IPCC (1996) 4.7. Potential Options to Reduce GHG Emissions From Wastes in Cambodia 4.7.1. Waste Generation in Cambodia
Amount of Solid Waste. Solid waste production is very high in Phnom Penh city in comparison with other city (Table 4.3). Contribution of Phnom Penh to total solid waste from urban area was about 80% (464 ton per day), while other cities were between 1 to 5%. Further study conducted by Sopha (1999) indicated that solid waste generation rate in Phnom Penh was about 0.740 kg per capita in 1997 and 0.756 kg per capita in 1998, a bit higher than average of other developing countries (0.5 kg/capita). There was an increase in solid generation rate by about 0.016 kg per capita per year during this period due to change in life style. He also found that the number of population connected to solid waste collection system in 1997 and 1998 were increased from 75% and 83% respectively. Using these values as basis for projection, the estimates of solid waste generation in Phnom Penh from 1997 up to 2021 is presented in Figure 4.1.

49
Table 4.3. Waste generation on a number of cities at Cambodia
No. City/Province Tons/day 1 Phnom Penh 464 2 Kampong Speu 30 3 Siem Reap 17 4 Sihanoukville 15 5 Svay Rieng 1 6 Prey Veng 18-30 7 Pusat 13 8 Bantey Meanchey 7 9 Kampong Chhnang 6 10 Krong Kep 4 11 Preah Vihear 3
Source: Sanitary Landfill Company (1998). Waste density was assumed to be about 0.59 t/m3 (Sopha, 1999)
Figure 4.1. Projection of solid waste generation rate (WGR) in Phnom Penh based on
population data from National Institute of Statistics, Ministry of Planning (2000) The solid waste produced by household and communities in Phnom Penh are commonly disposed in plastic bins/wood/bamboo baskets and containers before they are collected by trucks of waste management company such as MPP and PSBK. In both, communal and household storage places, waste produce a number of environmental problems, namely (Sopha, 1999):
• Garbage is scattered as the result of scavengers and animals searching for some
valuable things or food; • Rotten waste creates unwanted smell to surrounding area;
0200400600800
10001200140016001800
Sol
id W
GR
(ton
s/da
y)
1997 2001 2006 2011 2016 2021

50
• Leachate from rotten waste promotes a good source for mosquitoes breading; • Because of poor design of drainage system in the city, during heavy rainfall flood
commonly occurs and the garbage is scattered messily in the city; • The use of plastic bag, a material that takes a very long time to decompose, is
becoming popular while it is not managed properly. Based on date provided by Sopha (1999), the capacity of PSBK Company to collect solid waste in Phnom Penh was about 789 tons per day, higher than the waste generation rate (see Figure 1). However, the collection service is only done regularly in some areas of the central city, while in other areas were not regular. Therefore, in some areas, garbage or solid waste scattered around and is carried away by wind and water run-off. The flow of the solid waste in Phnom Penh is shown in Figure 4.2.
Figure 4.2. Flow of solid waste in Phnom Penh (Sopha, 1999)
Waste Generators
Storage (bins, baskets etc.)
Collection
Hauling
Dump site
Disposal (Open burn, dumping)
Salvaged by household for reuse or sale
Open burn, Bury, or
Throw away
Eaten by animals, or stay on streets, canals, vacant, or
open space
Salvaged by waste pickers
Crews
Waste pickers
Waste buyers
Waste reuse, recycling or
export

51
Composition of Solid Waste. Based on study conducted by the Working Group on “ Recycling in Phnom Penh” (1997), the solid waste in Phnom Penh come from domestic, market, industry, and hotel/restaurant. Annual production of domestic waste, market waste, industrial waste, and hotel/restaurant waste were estimated to be about 141.6, 46.3, 9.8, and 3.6 thousand tons respectively (Sanitary Landfill Company, 1998). The major composition of the solid waste is organic matter while other non-organic substances are only minor (Table 4.4). Table 4.4. Composition of solid waste from domestic waste, market and hotel/restaurant
No Type of Waste Domestic Waste Market Hotel/Restaurant
1 Organic waste (including paper, cardboard, wood and Vegetable refuse)
91.0 91.0 88.8
2 Inorganic waste (including plastic bottle, aluminum can, iron can, iron, non-iron, textiles, scrap rubber, and hazardous)
9.0 9.0 11.2
Source: Sopha (1999)
Amount of Wastewater. Wastewater is produced mainly from industrial activities and household, hospitals and restaurant. Report on Pollution Control (MoE, 2000) stated that the amount of wastewater produced in total was about 3.9 million m3 per year, i.e. about 89% from industrial processing and 11% from households. This wastewater was then disposed to rivers, municipality sewage systems, and public water areas (Table 4.5). About 60% of the wastewater has been treated before it was disposed. Furthermore, it was also reported that in dry season, the wastewater from household, hospitals, and restaurant was disposed directly into Tonle Sap through 14 sewage system, while in wet season, sewage system was closed. The treated wastewater was still not save for human. Some poisonous substances parameters were still over environmental standard. For example, the BOD value was between 70-376 mg/l while the standard is 80 mg/l, and COD was between 45-934 mg/l while the standard is 100 mg/l.
Table 4.5. Wastewater quantity disposed to different type of disposal systems in Phnom Penh, 2000
Treated Untreated Total No Wastewater Disposal
Thousand m3 per Year 1 River 536 22 558 2 Municipality sewage system 270 271 541 3 Public water areas 1,544 1,257 2,801 Total 2,350 1,550 3,900 Source: MoE Annual Report on Pollution Control (2000)
Waste Management. As the solid waste generation in Phnom Penh is quite high, while the Steung Meanchey dumping site would be closed in early 2000s, the new dumping site should be established. The Sanitary Landfill Company (1998) has identified a new site

52
located in Boeung Chheung Ek Zone, Khan Dangkor about 10 km from Phnom Penh city. A total area of about 100 ha has been allocated, where 76 ha will be used for dumping site and 24 ha for building and other construction. The dumping site will be divided into five sections, and each section will operate 5 years. It was estimated that at the end of 2020, the height of waste disposal mountain would be 31 m or equivalent to about 884,769 m3. 4.3.2. Potential Mitigation Options
Potential of the mitigation options described in Table 2 for implementation in Cambodia is quite prospectus. The implementation of the options in Cambodia will not only give environmental benefits but also economic benefits. IPCC (1996) stated that recycling and composting could reduce methane emissions up to 70% depending on technical options and scale. Producing energy from waste either from incineration or landfill gas (methane recovery) will reduce CO2 emission through fossil fuel use displacement. The waste management will also improve air quality and public health. On the other hand, some of the options provide higher economic benefits than the current technologies. Based on roundtable discussion with stakeholders, types of mitigation options and potential site for the implementation are as follows: 1. Recycling of waste. CSARO (Community Sanitation and Recycling Organization)
has used recycling technologies to produce new materials for exports such as handcrafts (e.g. handicraft made from aluminum waste, iron etc). The products have been exported to Vietnam.
2. Composting of waste. Composting technology is commonly used by farmers to make
organic fertilizer. The common raw materials used for the composting are agriculture residues, and animal waste. Currently, a pilot project for producing composts at Steoung Mean Chay dumping site is being implemented. The project was funded by Germany Government. As it is shown in Table 3, there are number of city other than Phnom Penh that may also require establishing dumping sites, and these sites might be potential for the implementation of such projects.
3. Incineration. At present there are some small-scale operation unit of incinerators
used by garment factories and Calmette hospital. The potential of these incinerators to produce energy should be evaluated. At present, no such study is implemented. In this technology, the heat generated during burning process is used to generate electricity power and to provide heat directly to homes or other building. The plant developed to produce the heat and the electricity is called as a “ Combine Head and Power” (CHP) plant. Energy produced at incinerators displaces coal-burning power and so saves on some GHG emissions at that point.
4. Methane Recovery. Decomposing matter in landfill sites generates landfill gas – a
mixture of methane and carbon dioxide, with other trace gases. Methane is a potent GHG, but it is possible to capture some of the methane and burn it to convert it into

53
carbon dioxide (called flaring), reducing its potency. The heat from flaring can be used to generate electricity or supply district-heating needs. At present, methane produced from Steoung Meanchay dumping is not used for generating energy. In addition, there are other two dumping sites, i.e. provincial dumping site at Kandal province (for domestic waste) and SAROM (for industrial waste) that may be potential for methane recovery project. The assessment of these sites for such project is required.
4.8. Barriers for the Implementation Further discussion with stakeholders indicated that implementation of the waste management technologies may have some barriers. The barriers include: (a) Policy and Regulatory Barriers
In general, waste management has a very low priority in Cambodia. Government allocates very little funds for waste management. Policies in regards to services for protection of public health and the environment are also low, therefore, no incentive system provided for such services. Law enforcement is also lacking so that public or private sectors do not treat their wastes properly. (b) Institutional Barriers
There are several agencies at the national level are normally involved or at least partially in waste management. These include Municipal of Public Works and Transportation (MPWT), Municipality of Phnom Penh (MPP), Ministry of Environment (MoE) and non-governmental organizations. However, there are no clear roles or functions of these various agencies in waste management. Lacking of coordination among the relevant agencies would also result in overlapping program. Ogawa (undated) stated that lacking of coordination among the relevant agencies would result in different agencies becoming the national counterpart to different external support agencies for different waste management collaborative programs without being realized of what other national agencies are doing. This case is commonly found in many developing countries. Because of a low priority given to this sector, the institutional capacity of local government agencies involved in waste management is also weak, especially in the cities and towns. (c) Technological Barriers
In Cambodia, technical expertise necessary for solid waste management planning and operation is still lacking. Many officers particularly at the local level, have little or very limited technical knowledge. Without adequately trained personnel, a project initiated by external consultants could not be continued. Therefore, the development of human resources in the country using external support is essential for the sustainability of the collaborative project. On the other hand, research and development activities in solid

54
waste management are often a low priority in the country. This leads to the inappropriate selection of technology and finally it will waste the resources spent and making the project unsustainable. (d) Socio-economical Barriers
As a developing country, Cambodia has weak economic bases. Therefore, insufficient funds for sustainable waste management system are encountered. Local industry, which produces relatively inexpensive solid waste equipment and vehicles, for example, will reduce, or in some cases could eliminate totally, the need for importing expensive foreign equipment/vehicles and therefore foreign exchange. Furthermore, waste recycling activities are affected by the availability of industry to receive and process recycled materials. For instance, the recycling of waste paper is possible only when there is a paper mill within a distance for which the transportation of waste paper is economical. The social status of waste management, people neither pay much attention with waste disposal nor public participation. This owes much to a negative perception of people regarding the responsibility, which involves the handling of waste or unwanted material. Such people's perception leads to the disrespect for the work and in turn produces low working ethics of laborers and poor quality of their work. Because of insufficient resources available in the government sector, collaborative projects often have attempted to mobilize community resources and develop community self-help activities. From the roundtable discussion with stakeholders, it was revealed some barriers specific to each mitigation option as shown in Table 4.6. 4.9. Strategic Recommendation To keep the urban areas free from solid waste problem and ensure better environmental condition, there is a need for integrated solid waste management policies, plans and program. Among others, some of important programmes and activities that need to be carried out are:
• Promotion of educational campaigns for environmental and societal benefits of waste reduction and recycling (especially as individual economic incentives weaken), composting options, and reducing the stigma attaching to waste work;
• Development of policies and regulation that could facilitate small enterprises and private-public partnerships for waste management. For example by reducing or eliminating harassment of itinerant buyers, pickers and waste dealers by police. Instead, assist the waste pickers to move out of manual picking through retraining programs or subsidization of sorting/redemption centers;
• Conducting research activities (i) for studying waste streams (quantity and composition analyses, by income groups), recovery/recycling systems, markets for recyclables, and problems of existing practices to decide where there may be a facilitative/regulatory role for the municipal authority, (ii) for assessing the needs of near-urban farmers for organic matter and support safe waste reuse in urban

55
agriculture, and (iii) for assessing the potential of Phnom Penh landfill site for methane recovery project.
To increase Cambodia opportunity to implement GHG mitigation technology in waste sector (such as methane recovery project), dissemination of the information to potential players such as SCARO and PSBK Company through public awareness program is necessary. It is expected that by knowing this, the company can design disposal system that meet requirement for methane recovery projects. However, as different groups may have responsible for energy generation, good coordination between related sectors or groups should be established to avoid disturbance of current economic and political balance between the sectors. As establishment of a system to control CH4 from wastes will require adequate waste management infrastructure (including legal framework), Cambodia government should give a priority to building waste management infrastructure as part of its development programmes. Support for institutional building should include both financial and technical assistance, and this is available from GEF (Global Environment Facility), or other convention funds (see Chapter 5).

56
Table 4.6. Summary of barriers for the implementation of mitigation options in waste sector in Cambodia Technology Options Barriers
Methane Recovery Recycling Composting Incineration Wastewater Treatment Policy and Regulation
• Limitation of policy/regulation and tools for implementation (incentive, voluntary programme, etc.)
• Lack of law enforcement
Limitation of policy/regulation and tools for implementation (incentive, voluntary programme, etc.)
Limitation of policy/regulation and tools for implementation (incentive, voluntary programme, etc.)
Limitation of policy/regulation and tools for implementation (incentive, voluntary programme, etc.)
Limitation of policy/regulation and tools for implementation (incentive, voluntary programme, etc.)
Institutional
• Participation among related agencies, NGOs, is still inadequate.
• Institution for managing waste disposal is limited.
• Lack of public participation • Low priority • Weak management system
• Lack of coordination among related agencies to share and perform the technology
• There is no institutional system responsible for recycling
• Weak waste management system
• There is no any local institutional system that encourage the use of composting technology
• Weak management solid waste system
Lack of coordination among related agencies to share and perform the technology
Lack of trained personal
Technological • Limitation of knowledge • Require higher level of
management techniques • Solid waste disposal method
may not meet the technology requirement
• Inadequate research and development framework,
• Inadequate trained personal
Limitation in both the availability of technology and the capacity to identify, test and adopt promising technology
Limitation in both the availability of technology and the capacity to identify, test and adopt promising technology
• Technology for wastewater treatment is available and applicable only for small-scale business activities.
• Using existing old system
• Lack of technology Socio-economic • Lack of funding
• Poor in transport system • Financial basis for public
service is limited • No industry based for
recycling activities
Lack of funding for development
• Lack of funding for research and development activities
• Lack of funding for technology development
• Lack of funding for research and development activities
• Lack of funding for technology development

57
4.6. References IPCC, 1992. Climate change 1992. The Supplementary Report to the IPCC Scientific
Assessment. In J.T. Houghton, G.J., Jenkins, and J.J. Ephraums (eds.). Published for the Intergovernmental Panel on Climate Change. Cambridge University Press, UK.
IPCC, 1995. IPCC Guideline for National Greenhouse Gas Inventories. 3 Volumes.
Intergovernmental Panel on Climate Change IPCC, 1996. Technologies, Policies, and Measures for Mitigating Climate Change,
Intergovernmental Panel on Climate Change, IPCC Technical Paper I. IPCC, 1997. Greenhouse gas inventory workbook. Volume 2. Revised 1996 IPCC Guideline
for National Greenhouse gas Inventories. Intergovernmental Panel on Climate Change. Kruger, D., Beer, T., and Pereyra, C. 2000. Solid Waste Management and Wastewater
Treatment in: Methodology and Technological Issues in Technology Transfer, A Special Report of IPCC Working Group III, Intergovernmental Panel on Climate Change, Cambridge University Press.
Ministry of Planning. 2000. General Population Census of Cambodia 1998, Analysis of Census
Results, Report 6, Population Projections 2001-2021, National Institute of Statistics, Ministry of Planning, Phnom Penh, Cambodia.
MoE. 2000. Annual Report on Pollution Control. Department of Environmental Pollution
Control, Ministry of Environment, Phnom Penh, Cambodia. MoE. 2001. Cambodia's 1994 National Greenhouse Gas Inventory. Ministry of Environment,
Phnom Penh, Cambodia. Sanitary Landfill Company. 1998. Company Project Plan, Company Strategic Plan, Company
Status and Internal Regulation, Sanitary Landfill Company (S.L.Co LTD), Cambodia. Sopha, A. 1999. Asian Institute of Technology, Bangkok, Thailand. Thesis No. EV-99-32:
Design of Municipal Solid Waste Collection System, A Case Study of Phnom Penh, Cambodia.
Thorneloe et al., 1993. Global Methane Emission from Waste Management, In Atmospheric
Methane: Sources, Sinks and Role in Global Change, NATO ASI Series I, Environmental Change, I (13).
USEPA. 1994. International anthropogenic methane emissions report to congress. EPA Office
of Policy, Planning and Evaluation, EPA 230-R-93-010.

58
X. POTENTIAL FINANCIAL SOURCES TO CO-FINANCE GHG MITIGATION PROJECTS
One of the barriers for the implementation of mitigation options is lack of financial support. However, a number of climate change related markets has emerged. These markets can be used support and fund mitigation activities in the country. The potential markets include Kyoto and non-Kyoto markets. Other sources of funding for supporting the implementation of other climate change activities are GEF (Global Environment Facility) and special climate change fund that will also be managed by the GEF.
5.5. Kyoto Market
The Kyoto market refers to market generated by a Kyoto mechanism called Clean Development Mechanism (CDM). The CDM allows emission reductions created in developing countries to be used to meet emission reduction commitments of developed countries, thereby reducing the level of domestic abatement required by the developed countries. While developing country can make used the mitigation projects investment to support sustainable development. Based on modeling studies, it was indicated that with USA participation, the size of carbon market for CDM is approximately about 260 MtC per year during the first commitment period (2008-2012) assuming no restriction on hot air1. However, as the USA withdraw from the Protocol, the CDM market size drop to about 98 MtC (PET models2). Furthermore, Blanchard et al. (2002) estimated that the size of CDM market through sink project would be about 49 MtC/yr. Total revenue generated by the CDM projects is about 9 million US$ per year. How much of this market can be absorbed by Cambodia would be depend on relative advantage of the Cambodia to other developing countries. Country with good institutional arrangements and better climate for investment may have better comparative advantage. In such country, cost for transaction may be low, and this will encourage not only foreign investment but also domestic investment. 5.6. Non-Kyoto Markets At present, there is a relatively few buyers, who have a range of motives for participation. These range from small funds managers offering a specialized carbon investment product through governments to individual companies. Two best-known buyers are two major carbon funds managers are Prototype Carbon Fund (PCF) and Certified Emission Reduction Unit Procurement Tender (CerUPT). (a) The Prototype Carbon Fund The Prototype Carbon Fund was established by the World Bank launched on July 20th, 1999 by the Executive Directors of the World Bank. The main operational objective of the PCF is to
1 Hot air is the difference between Base Year Emission and the projected actual emission during the commitment period (2008-2012), under condition where the actual emission is lower than its BYE. The price is hot-air is much lower than CDM. 2 PET is Pelangi Emission Trading developed by PELANGI for the assessment of global carbon market.

59
mitigating climate change, aspires to promote the Bank’s tenet of sustainable development, to demonstrate the possibilities of public-private partnerships, and to offer a "learning-by-doing" opportunity to its stakeholders. At present, it has been capitalised at $140 M. Investors include governments and private sector. The fund invests in carbon projects that qualify under Joint Implementation or the CDM, thus the PCF has extensive project documentation and screening process that mirrors the processes required for the CDM and JI. To date the PCF has successfully closed three projects. An additional 10 projects are currently being negotiated. Purchase prices have ranged between $3 and $5 per ton CO2. (b) CerUPT CerUPT are carbon project investment programs run by the Dutch Government. CerUPT focuses on CDM investments. A consortium of private and public businesses and the Dutch Government funds the programs. At present CerUPT only invest for energy project not C-sequestration projects (forestry), but it will consider biomass projects. Similar to the PCF, the CerUPT aims to invest in high quality carbon projects that will comply with the CDM. A detailed and comprehensive project development and assessment process is applied, designed to meet the requirements of the CDM, including public consultation. The carbon price offer through this channel is about 5 Euros per ton CO2 and size of market is about 37 Mt CO2. of permits at an average price of 5 Euros per ton CO2. (c) The Bio-Carbon Fund (BCF) and Community Development Carbon Fund (CDCF) The Carbon Finance Unit at the World Bank has recently launched two new Carbon Investment Funds. These funds aim to produce verified carbon reductions and a range of other sustainable development and environmental benefits. However, unlike the PCF, it is possible that these funds will invest in projects that are not full compliant with the Kyoto Protocol. The Bio-Carbon fund will initially seek $100 M in funding from Government and Private sector entities. It will make investments in projects that sequester carbon in forest and agro-ecosystems. Participants will receive emission reductions that have the potential to be recognised under emerging international, national and regional emissions trading programs. This includes but is not limited to the CDM. One of the Key objectives of the Bio-Carbon fund is to “learn through doing” and illustrate the potential of LULUCF projects to deliver verified emission reductions and a wide range of social and environmental benefits. The CDCF will seek to invest in projects that produce a range of sustainable development benefits, particularly or rural communities. However, it will be focused on projects that produce emission reductions rather than sequestration. The fund was officially launched at the 2002 World Conference on Sustainable Development in Johannesburg. Initial capitalisation is planned to be $100 M drawn from public and private sources. Investors will receive emission reductions that may be recognized under the emerging international, national and regional carbon markets. This may include the CDM. As the both funds will require emission reductions to be verified, suggesting that there will be costs involved with project documentation and approval and independent verification of the claimed carbon savings. As a result, it is unlikely that there will be any substantial reduction in the level of costs associated with the CDM project cycle. However, the both funds will give

60
strong attention on the capacity building for participants in the fund and host countries. The funds also seek to leverage the climate change related investment in projects, increasing the financial resources available for the implementation of clean technologies in developing countries. 5.7. Other Source of Funding Under the UNFCCC and the Kyoto Protocol There are a number of funding mechanisms under the UNFCCC and the Protocol that may be able to finance or co-finance enabling activity projects and specific project activities related to adaptation to climate change and/or greenhouse gases emission reduction projects. These include GEF (Global Environment Facility) and Special Climate Change Fund. (a) GEF Article 11 of the UNFCCC establishes a financial mechanism to assist non-Annex 1 Parties implement their responsibilities under the Protocol, i.e. GEF. The Financial Mechanism not only finances green house gas emissions reductions project but also finances projects that assist the host country in adapting to climate change and its impacts which may have an important technology transfer and capacity building element. Since 1991 approximately $1.3 bn has been provided to climate change related projects by the GEF. Of this, $94.7 M has been allocated to enabling activities. Some $8.2 bn has been raised in co-financing (GEF 2001). Currently carbon sequestration in not eligible to receive funding under the GEF climate change program, but it may be eligible under biodiversity program. (b) Special Climate Change Fund The Special Climate Change fund was established by COP-7 in 2001 to finance activities complimentary to those funded by the Financial Mechanism and from other climate change related bi-lateral and multi-lateral sources. Activities to be funded include adaptation, technology transfer and projects in the energy transport industry, agriculture, forestry and waste management. Funding is to be committed from 2005. At present about 410 million US $ have been allocated for this funding mechanism. This fund may be operated by the GEF. (c) The Least Developed Country Fund This funding was also established at the COP-7 in Marrakech. It was designed to assist the least developed countries to institute national adaptation programs. The fund will be operated by the GEF. This fund comes from the Adaptation Fund, i.e. 2% levy on the proceeds of CDM projects. This fund will finance adaptation projects, and will require the approval of the Protocol before coming into operation.

61
5.4. References Blanchard O., Criqui, P. and Kitous, A. 2002. After the Hague, Bonn and Marrakech: the future
international market for emission permits and the issue of hot air. Reference Paper 27bis, Instutut de Economie et de Politique de l.Energie, Grenoble 28p.
GEF. 2001. Report of the GEF to the Seventh Conference of Parties to the United Nations
Framework Convention on Climate Change. Global Environment Facility, Washington.

62
VI. CONCLUSION AND RECOMMENDATION
Adoption of the mitigation options in large scale does not only provide benefit to the environment but it may also create incremental benefit to the farmers and consequently for the country. To accelerate the adoption, the barriers should be removed, and one of the key factors that ensure the successful adoption and implementation of the mitigation technologies is political will. Incorporation of this aspect into the national work plan is essential. Another key factor is the level of involvement of key stakeholders in the process of developing the national work plan or mitigation programs. Participatory approach in developing the plans and programs should be encouraged. Contact with international communities should be enhanced. Progress on the climate change issues/agenda should be followed and well disseminated to the community through programmatic actions. TERI (undated) proposed a participatory approach in identifying country priorities on climate change related program (Figure 6.1). The consultative process should also take place when assessing present technological status and technology needs (Figure 6.2).
Figure 6.1. Participatory approach in identifying country priorities (TERI, undated)
Creation of a department in the concerned ministry
Cross sectoral steering committee
National issues for climate change
Development agenda of the government
International issues and agreements for
climate change
Roundtable for brainstorming
International experts
National institutions/
NGOs
Industries associations
Sectoral representation
Identification of country priorities
Advisory role

63
Figure 6.2 suggests that the presence of cross-sectoral steering committee is important. This committee is expected to remove gaps and to increase coordination among sectors. This steering committee could also become an embryo for the development Designated National Authority or National Board for Climate Change Projects such as carbon trading etc. The Board then should play an active role during the consultative process for identifying present technological status and technology needs. Figure 6.2. Consultative process for identifying present technological status and needs (TERI,
undated)
National Board
International experts
National institutions/
NGOs
Industries associations
Sectoral representation
Identification of country priorities
Sectoral Committee

64
6.1. Reference TERI. Undated. Framework for improving the diffusion and implementation of environmental
sound technologies and know-how under the UNFCCC: Perspective from the Asian Pacific Region. TATA Energy Research Institute, New Delhi.