Embed Size (px)
Citation preview

10th World Bamboo Congress, Korea 2015
Theme: Biology, Morphology and Taxonomy
Assessment of Genetic Diversity of Kauayantinik (Bambusa blumeana Schultes f.) from Five Plantations in the
Philippines through Transferability of SSR Markers [1][2]Maria Theresa A. Delos Reyes, Ph.D., [1][3]Jen Daine L. Nocum, [1][4]Joshua
Israel V. Sumague and [1][5]Aida C. Baja-Lapis, Ph. D. 1Ecosystems Research and Development Bureau, Department of Environment and Natural
Resources,College 4031, Laguna, Philippines; 2Science Research Specialist II; [email protected]; 3Biologist; [email protected]; 4Biologist;
[email protected] 5Scientist I; [email protected]
Abstract
The assessment of the genetic diversity of Kauayantinik (Bambusa blumeana Schultes f.) plantations in selected provinces such as Pangasinan (PKT), Batangas (BKT), Cebu (CKT), Iloilo (IKT) and Bukidnon (BdKT) in the Philippines using microsatellites/SSR markers that previously identified some genome sequences of other bamboo and rice species was studied. 75% of the primers screened were able to cross-amplify Kauayantinik DNA. Out of the 64 loci detected, 35.9% was found to be polymorphic. Based on Nei-Li’s similarity index, high similarity rate was observed suggesting a close relationship within populations. Pangasinan population was the most diverse source of Kauayantinik based on the expected heterozygosity within populations while Iloilo had the highest diversity rate (ca. 0.56 Nei-Li’s dissimilarity coefficient)among populations. Iloilo population was also clustered singly based on the dendrogram generated. Data gathered gave information that the endemic bamboo, Kauayantinik, has rich genetic resources that can be used for genetic improvement of the species for economic and biodiversity purposes.
INTRODUCTION
Bambusa blumeana Schultes f., known as Kauayantinik in the Philippines, is a non-timber, woody plant belonging to the family of grasses (Poaceae). It is widely distributed at low and medium altitudes, settled areas throughout the Philippines and mostly occurring in southern China to the Malay Peninsula (Roxas 1998). Bamboo nowadays is an essential non-timber forest species in the world because of its adaptability, quick physical growth and development that result to high quality finished products, giving high profit to businessmen. After three to five years of its propagation, it can be sold in a hundred peso per cutting or seedling which is faster than any other woody forest species which may need longer years to be sold. However, with the continued and increasing demand for bamboo and non-timber products, massive logging and deterioration of these forest species occur, resulting to decrease in genetic resources and biodiversity in the country. One of the solutions to the problem of continued deforestation is conducting analyses on the genetic diversity of the forest species to provide strategic and more effective implementation of tree conservation and reforestation. The data gathered from these studies could be useful for yield increase in trees, improvement of defense system and adaptation against pathogens and drastic changes in the environment. Researchers are continuously giving efforts to determine the diversity of several forest species in the Philippines. Species such as Narra (Pterocarpus indicus Willd), Limuran (Calamusornatus var. philippinensis Becc.), Dao [Draconto melondao (Blanco) Merr. & Rolfe], Mahogany (Swietenia macrophylla King), Yemane (Gmelina arboreaRoxb.) have preliminary studies on its status, diversity and survival (Delos Reyes, et.al 2013; Ambida, et.al 2012; Baja-Lapis and Santander 2003;

10th World Bamboo Congress, Korea 2015
Theme: Biology, Morphology and Taxonomy
Corpuzand Carandang 2012).These studies have involved the use of molecular markers to provide data on the polymorphism and characterization of the forest species, resulting to genetic diversity determination. Also, there are limited local literatures on the genetic diversity status of our native bamboos in the country that are currently cited. Using Simple Sequence Repeats (SSR) or Microsatellite Markers, genetic diversity within and among populations of the bamboos in the country, specifically, Kauayantinik may be determined. This study aims to currently assess the genetic diversity of Kauayantinik (Bambusa blumeana Schultes f.), using SSR molecular markers. The specified objectives are:
1) to establish a protocol to isolate high quality genomic DNA (gDNA) from young leaf tissue of Kauayantinik;
2) to compare genetic variation within and among the different populations of the species; 3) to cross –amplify Kauayantinik with rice SSR markers for further genetic analysis; and 4) to measure and analyze the genetic distance and similarity and polymorphisms detected on the
SSR bands of Kauayantinik.
REVIEW OF RELATED LITERATURE
Coming from the family of grasses, Kauayantinik (Figure 1), is a non-timber, woody, perennial species widely used in agroforestry, landscape architecture, engineering and industry. Bamboo can help in climate mitigation by its use as energy source, distillation and gasification for production of charcoal, vinegar and oil (Dube 2008).Bamboo has a high carbon fixation rate, rapid growth rate and high adaptability to extreme environmental conditions, thus, it is considered as one of the important forest resource (Bhandawat, et al. 2014). In about three to five years after macropropagation, its young shoots may be sold as grown seedlings (Bareja 2010). The finished products (e.g., furniture, tools and ornaments) of Kauayantinik provide business for entrepreneurs and can be a source of daily income to billions of people. The Philippine Forestry Statistics reported in 2013 that the prices of species of bamboo like Bayog, Boho, Bulo and Kauayantinik ranged from Php43.00 to 87.53 per piece. Currently, China is the top largest producer of bamboo in the world while the Philippines ranked as sixth. The bamboo industry worldwide is expected to exponentially increase up to 20 billion dollars in the upcoming years (Lobovikov et. al. 2005; De Vera 2012; Forest Management Bureau 2013). There are many reported abundant sources of bamboo in the world. Among the 1,000 species of bamboo in the world, 62 of its species can be found in the Philippines. Out of the 62 species, 21 are endemic in the country, 13 were classified as climbers while 8 are erect (Bareja 2010). Based on limited archeological and anthropological studies, bamboo was believed to be originated in China where it was first annotated based on recorded histories which were used for their daily use (Bamboo grove 2014). In some of its native cuisine, bamboos serve as their based ingredients in making their delicacies. The most well-known delicacy among the Filipino dishes is Labong with bamboo shoots as the main ingredient. Some of the native varieties of Labong include Ginataang Labong(with coconut milk and chilies) and Dinengdengna Labong (labong in fish anchovies with string beans, spinach, and sun-dried fish), according to Filipino Style Recipe (2012, 2013).
Currently, asexual reproduction is the mode commonly used on its propagation. The common methods included in the asexual reproduction of bamboo are: Clump Division, Basal Clump Division, Culm, Culm Cutting, Branch Cutting, Marcotting, Twig Cutting, Integrated Mass Propagation Technique, as well as offset or rhizome cutting and tissue culture (Bareja 2010; Roxas 1998).

10th World Bamboo Congress, Korea 2015
Theme: Biology, Morphology and Taxonomy
Figure 1.
Simple Sequence Repeats/ Microsatellite Markers
Molecular markers are important for plant improvement and involve the following applications: (1) determination of genetic diversity within and among populations, (2) genotype characterization and (3) marker-assisted selection (Porth and El-Kassaby 2014). In diversity screening, whole range of molecular techniques can be used to detect polymorphisms. Screening is categorized into non-PCR based (Restriction Fragment Length Polymorphism/RFLP), PCR-based (Random Amplified Polymorphic DNA/RAPD, Amplified Fragment Length Polymorphism/AFLP, Inter Simple Sequence Repeats/ISSRs, Single Sequence Repeats/SSRs and Single Nucleotide Polymorpism/SNPs) and targeted PCR and sequencing (Karp and Edwards 1997). PCR-based DNA markers such as SSRs and SNPs help in many desired characters simultaneously by back-cross populations and F2 generations (FAO/IEAE Division of Nuclear Techniques 2002; Mondini 2009).
PCR-targeted sequences involve procedures on designing primers to target specific regions of genome. Targeted amplified product can be compared to corresponding product from another individual and will detect differences in base pair lengths (Karp and Edwards 1997). Table 1 shows the comparison of markers and molecular techniques and corresponding uses.
Table 1. Comparison on the marker systems/molecular techniques (FAO/IEAE Division of Nuclear Techniques, 2002).

10th World Bamboo Congress, Korea 2015
Theme: Biology, Morphology and Taxonomy
SSRs, also known as microsatellites are short tandem repeats consisting of a repeat unit of 2-10 bp in length. These markers are used in diversity analysis, breeding, QTL mapping, genetic linkage map, gene tagging, map-based gene cloning and other biotechnology and genetic applications (Kahl 2001; FAO /IEAE Division of Nuclear Techniques 2002; Applied Biosystems, Inc. 2004).These markers are ideal for detecting differences between and within species of genes of eukaryotes (Farooq and Azam 2002). SSRs are also widely applied in studies of plant molecular genetics. They are abundant in genome, distributed codominant in nature, have high repeatability and transferability in cross-species applications. It is PCR-based and co-dominant nature make it a marker type choice in a variety of research fields (e.g., map construction and genetic variability identification).Strategies to use SSRs are time and cost-consuming, especially in development of enriched libraries and species-specific primers, thus, limiting the application of SSR in genomes with less information. One way to solve this is through cross amplification of SSR markers from genome with an abundant SSR markers in a target genome (Powell et. al 1996; Nayak and Rout, 2005; Chen, et.al. 2010; Miah, et.al 2013).
Transferability of Molecular Markers in Plant Species With less time for marker development on species and scarcity on the developed marker on the species selected for study, cross-amplification or transferability of markers from one species to another is done on several plant diversity analyses. This is also done to confirm the classification and taxonomic groupings of the species within the genus. Choosing a marker for plant molecular analyses is objective dependent. For example, RAPD, RFLP or AFLP can be used when a species with similar accessions is to be differentiated. On the other hand, neutral markers like DNA micro-array or isozyme markers can be used if few environmentally physiological characters in a species are to be distinguished (Farooq and Azam 2002).
The microsatellite markers developed in genomic libraries were used for mapping as this can be featured to the high level of polymorphism, abundance in their genomes, reproducibility and codominant nature (Gupta 2000; Squirrell 2003; Zeid et.al 2010). Transferability of molecular markers, specifically SSRs, have been used for baseline studies for the species with limited or no developed marker for genetic and molecular analyses. Examples of marker transferability for initial species studies were done in pearl millet (Yadav et. al 2008), bottlebrush and clove (Rai et. al 2013).
High percentage of marker transferability may be useful in genetic variability from different species in breeding programs. Other studies of cross-amplification were done in Allium, Hevea, Eucalyptus,

10th World Bamboo Congress, Korea 2015
Theme: Biology, Morphology and Taxonomy
Oryza, Zostera, Cucumis, Glycine, Trifolium, Brassica,Vitis, Cajanus, Festuca and Arachis. These several studies were suggest that marker transferability is useful for establishment of new markers to species with limited to no genetic analysis studies (Lee et al 2011; Mantello et al 2012; Rossetto 2001; Cui et. al 2008; Saha et. al 2006; Chen et. al 2010).
Marker transferability studies are also done in bamboo species since little information on their sequences are established.Bhandawatet. al (2014)have developed and cross-transferred microsatellite markers in Dendrocalamuslatiflorusand related bamboo species. Interspecies and intergenera cross-transferability rates resulted to 92.7% and 84.5%, respectively.Dong et.al (2012) also studied Dendrocalamussinicus using 16 novel microsatellite markers which yielded to 53.6-81.3% cross-transferability rate to other Dendrocalamusspecies. In Phyllostachysspecies, RAPD, RFLP, AFLP and complementary DNA SSR markers were used to detect genetic diversity and transferability of markers (Lin, et.al 2014; Ding 1998; Friar and Kochert 1991, 1994; Hodkinson et.al 2000). Molecular markers were also developed and cross-amplified in and across bamboo species. Nayak and Rout (2005) isolated and characterized microsatellites in Bambusaarundinaceaand cross-amplified these markers to other Bambusa species and bamboo genus (e.g., Dendrocalamus, Dinochlea, Arundinaria, Cephalostachyum). Allelic diversity ranged from 0.128-0.789.
Rice markers were also cross-amplified in different species, e.g., C4 perennial grass Miscanthus sinensis (Yu et. al. 2013), seashore paspalum, finger millet, bermudagrass (Wang et. al. 2005), and sugarcane (Banumathi, et.al. 2010). Of these studies, average to high levels of transferability (39% - 78.2%) were observed which are useful for genetic analysis and germplasm evaluation. Molecular and Genetic Studies on Bamboo The genetic studies on bamboo were started using morphological markers. Physical attributes such as floral and vegetative parts of the bamboo was used for its identification and characterization. Usage of morphological markers initiated in the early 1890s by recording the bamboos observed in the Old World British-mapped areas (Gamble 1896). After an almost half-century, a taxonomic identification key was made on the 22 reported bamboo species. Size, texture, shape of the sheath and their blades of the culm sheath was used as the primary physical characteristics for the differentiations of the current-recorded bamboo during those times (Chatterjee and Raizada 1963).The latest updated morphological marker-based for bamboo was studied based on its vegetative and floral parts. Twenty-eight key vegetative and floral characters were the recent studies tested for possible more accurate identification of bamboo (Naithani et. al 2003; Clayton et. al 2013). However, the usage of morphological based markers became unpopular in the recent years because of its huge limitations. The reproductive cycle of bamboo was reported to be too long for it takes 3 to 120 years for the flowering stage of bamboo occurs (Janzen 1976). Environmental factors such as nature disturbances, light, carbon dioxide concentrations and distribution of soil nutrients, as well as the variation on the different developmental stages, may influence the research for more accurate taxonomic studies using the morphological characters of bamboo (Kalia et. al 2011). With the invention of electrophoresis set-up and other protein-based assays, bamboo was one of the timely used plant species subjected for biochemical marker-based analysis. Using isozymes extracted from its leaves, polymorphism was detected among the five bamboo genera analyzed in the study. While a more accurate method was discovered for characterization of bamboo, annotations of the isozyme loci and slow massive development of specific protein detection using staining reagent systems gave a limitation for the biochemical marker to be used as a standard assay for taxonomic studies of bamboo. Also, influence of environmental interaction and developmental variation of proteins made isozyme marker analysis outdated for further diversity analysis (Heng et. al., 1996) With the development of DNA or molecular markers, numerous genetic diversity studies were published around the world; it also ledto the first ever bamboo genome project which could help to

10th World Bamboo Congress, Korea 2015
Theme: Biology, Morphology and Taxonomy
unify the researchers in the DNA analysis of bamboo. Changtragoon and Laphom (2009) assessed the genetic diversity of Bambusabambos using SSR markers and yielded to 66.7 to 88.89% polymorphism.
A whole genome sequence for bamboo was successfully drafted using the Phyllostachysheterocycla species of bamboo commonly called as moso. A 2.05 Gb of DNA sequences of bamboo was consolidated and organized by Zhao, Peng and Fei et. al (2014) to pioneer the first ever web-based bamboo genome database called Bamboo GDB. The full genomic sequence done covers 95% of the genomic region of bamboo where 31, 987 genes were annotated using cDNA and Deep RNA sequencing data. While the first published full genome sequence of Phyllostachysheterocycla needs further studies for possible use as a model for all bamboo species. According to the study, whole genome duplication occurred in the bamboo 7-12 millon years ago. It was also found that the majority of the genome duplication generated is involved on the shoot development of bamboo. This result suggested that whole genome duplication event may be attributed to the evolution of the rate of development of its shoots (Peng et. al. 2013). No specific type of shoot development whether it was faster or longer growth was indicated in the study. Nevertheless, this study, including the formation of a bamboo genome database made a first committed step towards a more central genomic resources and well-coordinated bioinformatics analysis of bamboo.
MATERIALS AND METHODS
Chemicals, Enzymes, Equipment and Kits Solids. Agarose, bromophenol blue (BPB), cetryl methyl ammonium bromide (CTAB), ethylenediaminetetraacetic acid (EDTA), polyvinylpyrrolidone (PVP), sodium acetate (Sigma), sodium chloride and Trizma base were used. Liquids. Chemicals Acetic acid, chloroform, ethyl acetate, ethyl alcohol, hexane, hydrochloric acid,isoamyl alcohol , isopropanol, liquid nitrogen, β-mercaptoethanol, phenol, sterile nanopure water and RNAse solution were used. Enzyme and Kits. DNA Taq polymerase (Kapa Biosystems), 10X PCR buffers + magnesium chloride (MgCl2) (Kapa Biosystems), 10 mMdeoxyribonucleotide triphosphates (dNTPs) were used. Equipment. Micropipettes, Centrifuge, water bath, gel documentation system (Bio-Rad), agarose gel electrophoresis set-up (CBS Scientific), PCR thermocycler (Bio-Rad and Veriti®, Applied Biosystems), Nanodrop 2000® spectrophotometer (Thermo Scientific) were used. Selection of Kauayantinik (BambusablumeanaSchultes f.)Samples Representing the three major geographical islands in the Philippines (Luzon, Visayas and Mindanao), five populations of Kauayantinik located from the provinces of Pangasinan (PKT), Batangas (BKT), Cebu (CKT), Iloilo (IKT) and BdKT (Bukidnon) were identified for the study. Forty plant materials from each population were selected to be used for the collection of young and healthy leaves. Healthy physical check-up of each plant material was the basis of the selection. The collected samples were used as source of the DNA samples for analysis. Figure 2 shows the locations of the five plantation sources of the bamboo leaves in the Philippine map.

10th World Bamboo Congress, Korea 2015
Theme: Biology, Morphology and Taxonomy
Figure 2
Place of Study The research was conducted at the Forest Molecular Laboratory of the Ecosystems Research and Development Bureau (ERDB), College, Laguna, Philippines from January to November 2014. Preparation of Leaf Materials Young and healthy leaf samples obtained from the different Kauayantinik populations were washed with warm water to remove possible pesticide residues, dirt and other unnecessary materials. The leaf samples, gathered from each individual of every population, were placed into sealable plastic bags and stored in the biofreezer (-80°C) before DNA extraction. Figure 2 shows the diagram of the processes done on the leaf materials in this study.
Figure 3
10th World Bamboo Congress, Korea 2015
Theme: Biology, Morphology and Taxonomy
DNA Extraction The genomic DNA (gDNA) was extracted from the young and healthy leaf samples of Kauayantinik using Doyle and Doyle (1990) CTAB (CetylTrimethyl Ammonium Bromide)extraction method with few minor modifications by (Delos Reyes, et. al 2013). CTAB DNA extraction method has been commonly used for it increases the yield of the DNA isolated by improving the separation process between the polysaccharides and gDNA (Center for Plant Molecular Biology-Osmania University, 2013). One DNA sample from each selected individual of every population was prepared. About 200 mg of leaf tissue was processed for homogenization by grinding using mortar and pestle and by adding liquid nitrogen. The homogenized leaf was transferred into 2.0 ml microcentrifuge tubes. The homogenized leaf in the microcentrifuge tubes were added with 1.2 ml pre-heated CTAB extraction buffer (Table 2) and was mixed thoroughly. The solution sample was allowed to incubate in a water bath at 65°C for one hour. The incubated solutions were cooled at room temperature and were spun at 11000 rpm for 10 mins. About 800-1000 µl of the supernatant was transferred again to 2.0 mL microcentrifuge tubes and was added with 1uL of a 40ug/mL stock solution of RNAse A to remove possible RNA contaminants. The sample was incubated again at 37°C for 30 mins. One volume of chloroform: isoamyl alcohol (24:1) was then added to the supernatant for prevention of foaming, and denaturation and precipitation of contaminating proteins. The tubes were placed in a refrigerated centrifuge (28°C) spun at 13000 rpm for 5mins and shaken for 15 mins. After centrifugation, a separation of upper aqueous and bottom layer which contains chloroform and the precipitated proteins were observed, this was discarded and the clear upper aqueous phase layer was pipetted and transferred to a clean 1.5mL tube. The chloroform extraction was then repeated and the aqueous phase layer was pipetted again. A 1/10 volume ammonium acetate and 2 volumes of cold absolute ethanol was added to the tube to lower the solubility in water and consequently precipitated the DNA of the sample. The tubes were incubated at -80°C for an hour. After incubation, the tubes were spun at 13000 rpm for 10mins at 4°C. The supernatant was discarded. The DNA pellet was washed and decanted and finally washed again with 500 mL ice cold 70% ethanol and dried for 15 minutes under the fumehood. The pellet was resuspended in 50 µl TE buffer. The DNA was stored at 4°C in freezer after centrifugation at 13000 rpm for 10 mins.
Table 2. Preparation of components and volumes of CTAB extraction buffer.
Quantification and Quality Check of gDNA Samples Absorbance method.Absorbance method was the most common technique on checking the quality, quantity and concentration of DNA. The concentration of the gDNA samples was assessed by NanoDrop 2000 Spectrophotometer (Thermo Scientific, Inc.). NanoDrop 2000 Spectrophotometer uses ulta-violet lamp to identify and measure the value of the light absorbed by the DNA at 260/280 and 260/230 nanometers. Also, only small amount of the gDNA were only needed to test its purity. Only 1 µL of the gDNA samples were pipetted and loaded to the said spectrophotometer. The absorbance, concentration and purity of the gDNA were read and recorded. A 1.8 – 2.0 ratio of gDNA samples was considered a pure gDNA.
Component [Stock] [Final] Volume needed for 14 mL buffer
Tris-HCl, pH 8.0 1M 0.122 M 17.08 mL NaCl 3M 1.707 M 79.660 mL EDTA, pH 8.0 0.5M 0.025 M 7.00 mL CTAB - 2.440 % 3.416 g PVP 40 - 1.219 % 1.7066 g β-mercaptoethanol - - 0.026 mL SNP Water - - 36.620 mL

10th World Bamboo Congress, Korea 2015
Theme: Biology, Morphology and Taxonomy
Computation of the DNA Yield.DNA yield (µg/g) = DNA concentration x total sample volume Agarose gel electrophoresis (AGE) method. Agarose gel electrophoresis (AGE) method was also done on the determination of the integrity of the DNA. AGE method visualizes the DNA. The distinct and intense bands of DNA assured its purity. Five microliters (5µL) of 1+kb DNA ladder, 0.2 µL gDNA were loaded into a 1.0% (w/v) agarose gel (added with 5 µL of SYBR Safe stain) at 100 V for 30 mins. The gDNA samples were mixed first with 0.3 µL of 1.5X Bio-Rad loading dye buffer. Molecular Marker Analysis Primer screening. Simple Sequence Repeats (SSR) markers were the primers used for amplifying some flanking regions in the genome of Kauayantinik. Microsatellites from bamboo and rice used by Nayak and Rout (2005), Chen et. al (2010) and by Samaco, et.al (2012) were the markers used in this study. The 8 bamboo markers, previously used for Bambusaarundinacea, were designed by Nayak and Rout (2005) while the remaining 72 rice markers was derived from the work of McCouch et. al (2002) which was also used by Chen et. al (2010), and Samaco, et. al (2012) in their bamboo and rice genetic study respectively. PCR Amplification. Polymerase Chain Reaction for the amplification of the DNA samples against the SSR markers were performed using the optimized PCR profile of the University of Missouri (2001) (Table 3). Dubcovsky (2011) was the formulated PCR reaction mixed used for the PCR cocktail (Table 4).
Table 3. PCR Components per reaction mixture for SSR marker amplification from Kauayantinik genomic DNA (University of Missouri 2001)
COMPONENT CONCENTRATION VOLUME (µL) Sterile nanopure water (SNPW)
- 5.896
10 X PCR Buffer + MgCl2
1x 1
10 mMdNTPs 0.01 mM 0.01 10µM Forward Primer 1.00 µM 1 10µM Reverse Primer 1.00 µM 1 Taq Polymerase (5.0
Units/ µL) 0.02 U 0.004
KauayantinikGenomic DNA
- 1
Final Volume - 10
Table 4. PCR conditions for the SSR marker amplification from Kauayantinik genomic DNA (Dubcovsky 2011)
STEP STEP NAME TEMPERATURE (°C)
TIME (min.)
1 Initial Denaturation 95.0 1 2 Denaturation 65.0 1 3 Annealing 55.0 1 4 Extension 72.0 1.5 5 Repeat 2 TO 5 (29 X) 6 Final Extension 72.0 4 7 Hold 10.0 ∞

10th World Bamboo Congress, Korea 2015
Theme: Biology, Morphology and Taxonomy
Visualization of the PCR products/SSR bands Amplified PCR products were analyzed using the agarose gel electrophoresis method with 3% agarose gel mixed with 10uL of SYBR Safe stain with the run set up at 135V for 30 minutes. The PCR product (10 uL) was run with a 5 uL 10 bp DNA ladder (Kappa Biosystems). The PCR products were mixed first with 3 µL of 6X Kappa Biosystems loading dye buffer. Data Analysis Scoring of bands/genotype. The SSR bands amplified from the KauayantinikgDNA were scored for further genetic analysis. The number of bands (alleles) in each marker were identified and marked for presence across each DNA samples of every population. Binary data format (1, 0) was applied to represent “1” for a presence of a band while “0” for its absence, “9” on the other hand was used to indicate the missing data. Measuring and displaying the genetic relationship. Biostatistics/bioinformatics called AFLPSurv 1.0 (Vekemans 2002) and Numerical Taxonomy and Multivariate Analysis System Version 2.1(NTSYSpc 2.1) (Rohlf 2004) were used. AFLPSurv 1.0 (Vekemans 2002) analyzed the number of loci, number of polymorphic loci (P or PLP), expected heterozygosity or Nei’s genetic diversity (Hj) and its variance components, and average gene diversity within populations or samples (Hw) and its variance components. The population genetic structure was also computed by AFLPSurv 1.0 (Vekemans 2002) to analyze the genetic relationship within the species and populations simultaneously. A dendrogram generated from the software NTSYSpc 2.1 (Rohlf 2004) was constructed to display the genetic relationship among all Bamboo population samples. Nei-Li’s dissimilarity index and Unweighted Pair Group Method with Arithmetic Mean (UPGMA) was the method used for measuring and clustering the genetic dissimilarity/distances, respectively.
RESULTS AND DISCUSSION Quantification and Quality Check of gDNA Samples Absorbance method and Agarose gel electrophoresis (AGE) observation method were done to check and assess the DNA quantity, purity and integrity. About 1.0 µl of the resuspended DNA was loaded in NanoDrop 2000 to read the absorbance at 260/280 nanometers. Table 4 and Figures 4-8 show the mean absorbance ratio and electrophoretic image of the extracted DNA of the different populations, respectively. Batangas population has the highest DNA Concentration reading while the Iloilo has the most approximately best quality of genomic DNA (gDNA) extracts (Table 4). Iloilo population recorded 1.90 A260:280 ratio. The universal good gDNA quality has an absorbance reading (A260:280) of 1.8. In this study, an absorbance reading (A260:280) of 1.8-2.0 was considered a good quality and indicator of pure DNA extracts. The absorbance method results were also consistent with the data gathered for gDNA visualization using AGE. Distinct bands indicating good quality of gDNA was observed among the different populations of Kauayantinik.

10th World Bamboo Congress, Korea 2015
Theme: Biology, Morphology and Taxonomy
Table 5. Mean Absorbance readings (260:280), concentration (ng/µl), absolute quantity (ng/µl) of genomic DNA from Pangasinan (PKT), Batangas (BKT), Cebu (CKT), Iloilo (IKT) and
Bukidnon (BdKT) population samples of Kauayantinik. DNA
Sample ID Total
Volume (µL)
Concentration Range
of the Samples (ng/ µL )
Mean Concentration
(ng/ µL )
Mean Absolute quantity (ng/µl)
Absorbance (260:280)
Total Weight Plant Sample
(g)
Mean Yield (µg/g)
Pangasinan 100 71.60-449.00 149.62 85.67 1.92 2 14.96 Batangas 100 72.60-546.00 167.43 76.1 1.93 2 16.74
Cebu 100 82.150-474.00 184.14 32.68 1.96 2 18.41 Iloilo 100 64.95-268.90 142.77 45.17 1.90 2 14.28
Bukidnon 100 90.55-512.80 180.318 28.53 1.91 2 18.00
Figure 4.
Figure 5.
Figure 6.
Figure 7.
Figure 8.

10th World Bamboo Congress, Korea 2015
Theme: Biology, Morphology and Taxonomy
Molecular Marker Analysis Out of the 80 primers screened, 50 SSR markers were successfully cross-amplified with the gDNA of Kauayantinik. A transferability rate of 75% was recorded suggesting that SSR primers specific for genetic analysis of rice may cross-amplify the gDNA within its relatives in the family of Poaceae. This theory may further be supported by the draft whole genome study on moso bamboo which reported that 85% of the bamboo genes were collinear when aligned to rice or sorghum homologues (Peng et. al. 2013). Further genome analysis should be done to determine the correlation of cross amplification and colinearity of gene homologues between bamboo and rice genome. Possible regional divergence occurred between rice and bamboo during evolution may be the reason on the failure of some rice SSR markers to amplify against the K. tinikgDNA(Chen et. al. 2010). The transferability rate (75%) in this study was higher than the reported cross-amplification of SSR rice markers to other bamboo species by Chen et. al. (2010) which may be possible due to lower detected loci in this study as compared to the other bamboo species. The transferability rate in this study is also higher than the study of Sharma et. al. (2008) against rice SSR markers (44.9%) but equally the same on the usage of sugarcane SSR markers (75%). Out of the 64 loci detected, 35.9% was found to be polymorphic. The 50 SSR markers, positively screened for cross amplification of KauayantinikgDNA, was used for PCR amplification of the populations (Table 6). The electrophoretic images result of the Pangasinan (PKT), Batangas (BKT), Cebu (CKT), Iloilo (IKT) and Bukidnon (BdKT) against the 50 SSR screened markers were analyzed for further genetic analysis. Figures 9a-f showed the electrophoretic images of the PCR product yielded from KauayantinikgDNA and some of the primers used in this study. The loci detected (64 alleles) in this study was a slightly lower from the 69 alleles identified by Torres et. al. (2009) on their study on Guaduaangustifolia bamboo species.
Table 6. List of SSR primers and their sequences positively screened to cross-amplify KauayantinikDNA.
Primer Sequence Reference
Forward Reverse
Ba10 GGTGGGGTCTAGCACCTAAG TACCAGCATGTAACGGTCGG Nayak and Rout (2005)
Ba14 AGAGTTAAGGAAGCCAGGTC GTCTAGTAGCTGCTCAACTC
Ba18a TATCTCGACCTCCCCTTGCT GTCTAGAAGCAGGGAGGTAG
Ba18b CCAGGTCGTTTCACTGCTC ACAACGGTAGAGTTCACTCG
Ba20 TTGATTGCCCTACTCTGTCG TCAACGGTGGATGACCTAGG
Ba25 GTGAGATGGGCTGGGCAG GCTCCGATCTGTCAGTTTAC
Ba58 TCCGAAGCACACTCATGAAG TTCTACTATGCGCTAACTGC
RM437 ACACCAACCAGATCAGGGAG TGCTCGTCAATGGTGAGTTC McCouch et. al. (2002)
RM327 CTACTCCTCTGTCCCTCCTCTC CCAGCTAGACACAATCGAGC
RM205 CTGGTTCTGTATGGGAGCAG CTGGCCCTTCACGTTTCAGTG
RM462 ACGGCCCATATAAAAGCCTC AAGATGGCGGAGTAGCTCAG
RM514 AGATTGATCTCCCATTCCCC CACGAGCATATTACTAGTGG
RM468 CCCTTCCTTGTTGTGGCTAC TGATTTCTGAGAGCCAACCC
RM36 CAACTATGCACCATTGTCGC GTACTCCACAAGACCGTACC
RM60 AGTCCCATGTTCCACTTCCG ATGGCTACTGCCTGTACTAC
RM489 ACTTGAGACGATCGGACACC TCACCCATGGATGTTGTCAG
RM249 GGCGTAAAGGTTTTGCATGT ATGATGCCATGAAGGTCAGC
RM233B CCAAATGAACCTACATGTTG GCATTGCAGACAGCTATTGA

10th World Bamboo Congress, Korea 2015
Theme: Biology, Morphology and Taxonomy
Figure 9a.
Figure 9b.
RM480 GCTCAAGCATTCTGCAGTTG GCGCTTCTGCTTATTGGAAG
RM153 GCCTCGAGCATCATCATCAG ATCAACCTGCACTTGCCTGG
RM440 CATGCAACAACGTCACCTTC ATGGTTGGTAGGCACCAAAG
RM7286 CAGAACAATTCGACCGCTTC GGCTTGAGAGCGTTTGTAGG
RM589 ATCATGGTCGGTGGCTTAAC CAGGTTCCAACCAGACACTG
RM7121 GGAGATGGCACACGTCAAAC AGGATCCCGTTTTGTAGCAG
RM531 GAAACATCCCATGTTCCCAC TCGGTTTTTCAGACTCGGTC
RM11 TCTCCTCTTCCCCCGATC ATAGCGGGCGAGGCTTAG
RM251 GAATGGCAATGGCGCTAG ATGCGGTTCAAGATTCGATC
RM214 CTGATGATAGAAACCTCTTCTC AAGAACAGCTGACTTCACAA
RM269 GAAAGCGATCGAACCAGC GCAAATGCGCCTCGTGTC
RM105 GTCGTCGACCCATCGGAGCCAC TGGTCGAGGTGGGGATCGGGTC
RM167 GATCCAGCGTGAGGAACACGT AGTCCGACCACAAGGTGCGTTGTC
RM3 ACACTGTAGCGGCCACTG CCTCCACTGCTCCACATCTT
RM151 GGCTGCTCATCAGCTGCATGCG TCGGCAGTGGTAGAGTTTGATCTGC
RM210 TCACATTCGGTGGCATTG CGAGGATGGTTGTTCACTTG
RM18 TTCCCTCTCATGAGCTCCAT GAGTGCCTGGCGCTGTAC
RM10 TTGTCAAGAGGAGGCATCG CAGAATGGGAAATGGGTCC
RM6085 GGTGAGAGATGGCTAAAGCG CATCGCCTCTAGCACCTCC
RM518 CTCTTCACTCACTCACCATGG ATCCATCTGGAGCAAGCAAC
RM270 GGCCGTTGGTTCTAAAATC TGCGCAGTATCATCGGCGAG
RM286 GGCTTCATCTTTGGCGAC CCGGATTCACGAGATAAACTC
RM332 GCGAAGGCGAAGGTGAAG CATGAGTGATCTCACTCACCC
RM138 AGCGCAACAACCAATCCATCCG AAGAAGCTGCCTTTGACGCTATGG
RM13 TCCAACATGGCAAGAGAGAG GGTGGCATTCGATTCCAG
RM417 CGGATCCAAGAAACAGCAG TTCGGTATCCTCCACACCTC
RM82 TGCTTCTTGTCAATTCGCC CGACTCGTGGAGGTACGG
RM296 CACATGGCACCAACCTCC GCCAAGTCATTCACTACTCTGG
RM219 CGTCGGATGATGTAAAGCCT CATATCGGCATTCGCCTG
RM52 CTACTCGCGCGTGGAGTT TGTCTTACTGGTGAAGCTGG
RM230 GCCAGACCGTGGATGTTC CACCGCAGTCACTTTTCAAG

10th World Bamboo Congress, Korea 2015
Theme: Biology, Morphology and Taxonomy
Figure 9c.
Figure 9d.
Figure 9e.
Figure 9f.
Data Analysis The electrophoretic image of the five populations against the 50 SSR primer pairs were subjected to data analysis using biostatistics and bioinformatics tools for genetic diversity analysis.
Table 7 shows the percent polymorphic loci and expected heterozygosity of the five populations of Kauayantinik computed using AFLPSurv 1.0 (Vekemans 2002). Percent Polymorphic Loci (PLP) was defined as the number of polymorphic loci over the total number of loci:
*P is the proportion of polymorphic loci, npj is the number of polymorphic loci and ntotal is the total number of loci.
Table 7. Intrapopulation genetic diversity of Pangasinan, Batangas, Cebu, Iloilo and Bukidnon populations.
Population N Number of loci Number of polymorphic
loci
Percent Polymorphic Loci (PLP)
Expected heterozygosity
(Hj) Pangasinan 40 64 23 35.9 % 0.13959
Batangas 40 64 17 26.6 % 0.01997 Cebu 40 64 9 14.1 % 0.01739 Iloilo 40 64 13 20.3 % 0.02152
Bukidnon 40 64 8 12.5 % 0.01837
Based on the PLP and expected heterozygosity values, all populations were observed to be diverse. In this study, PLP with a positive value was considered as an indication of diverse status. Among the five populations, Pangasinan exhibited the most diverse within each population followed by Iloilo, Batangas, Bukidnon and Cebu. The highest PLP (35.9%) generated from the Pangasinan population

10th World Bamboo Congress, Korea 2015
Theme: Biology, Morphology and Taxonomy
of this study was lower than the highest PLP (88.89%) calculated from the province of Sa Kauw&Surathtani of Thailand. Changtragoon and Laphom (2009) performed genetic diversity of Bambusabambos, a relative genus of Bambusablumeana in their country. Higher PLP may be attributed to lower SSR markers used in Bambusabambos. Statistics of population genetic structure were also computed by AFLPSurv 1.0 (Vekemans 2002). Total gene diversity (HT), average gene diversity within populations (Hw), average gene diversity among populations in excess of that observed within populations (Hb), and Wright’s Fixation Index (Fst) were also included in determining the statistics of population genetic structure. Tables 8 and 9 show the genetic diversity among and within populations, and the genetic distances and Wright’s fixation indices of paired populations, respectively.
Table 8. Genetic diversity among and within populations values (Lynch and Millligan 1994). N Ht Hw Hb Fst 5 0.3519 0.0984 0.2535 0.7196
Table 9. Genetic distance and Wright’s fixation index of paired populations (Lynch and Millligan
1994). Paired populations Genetic distance Fst
Pangasinan - Batangas 0.1711 0.4839 Pangasinan – Cebu 0.1493 0.5742 Pangasinan – Iloilo 0.6129 0.7721
Pangasinan – Bukidnon 0.3023 0.7017 Batangas – Cebu 0.1906 0.6241 Batangas – Iloilo 0.5255 0.7694
Batangas – Bukidnon 0.2939 0.7203 Cebu – Iloilo 0.5872 0.8270
Cebu – Bukidnon 0.3048 0.7881 Iloilo – Bukidnon 0.2647 0.7271
Wright’s fixation index indicates the proportion of the total gene diversity that occurs among as opposed to within populations or the degree of gene differentiation among populations in terms of allele frequencies (Lynch and Milligan 1994; IPGRI and Cornell University 2003). Results in Table 8 show that the low Hb and high Fst values suggested a high genetic variation among populations. On the other hand, results in Table 9 indicated that Pangasinan and Iloilo were the most distant while Pangasinan and Cebu were the most genetically similar populations. Cebu-Iloilo paired population had the highest Fst value which suggested a high differentiation value among paired populations. The Fst results in this study were higher than the Fst value obtained by Changtragoon and Laphom (2009), which is similar to this study. In line with this, the study focused on comparing the diversity status of five plantations geographically represented by the three major islands of the Philippines. Most of the published diversity analysis through SSR markers focused on phylogenetic relationships and clone identification (Sharma et. al. 2008; Chen et. al. 2010). So far, few literatures have been published focusing on the endemism of a bamboo species in a defined geographic location (Changtragoon and Laphom 2009; Torres et. al. 2009; Yang et. al. 2012).
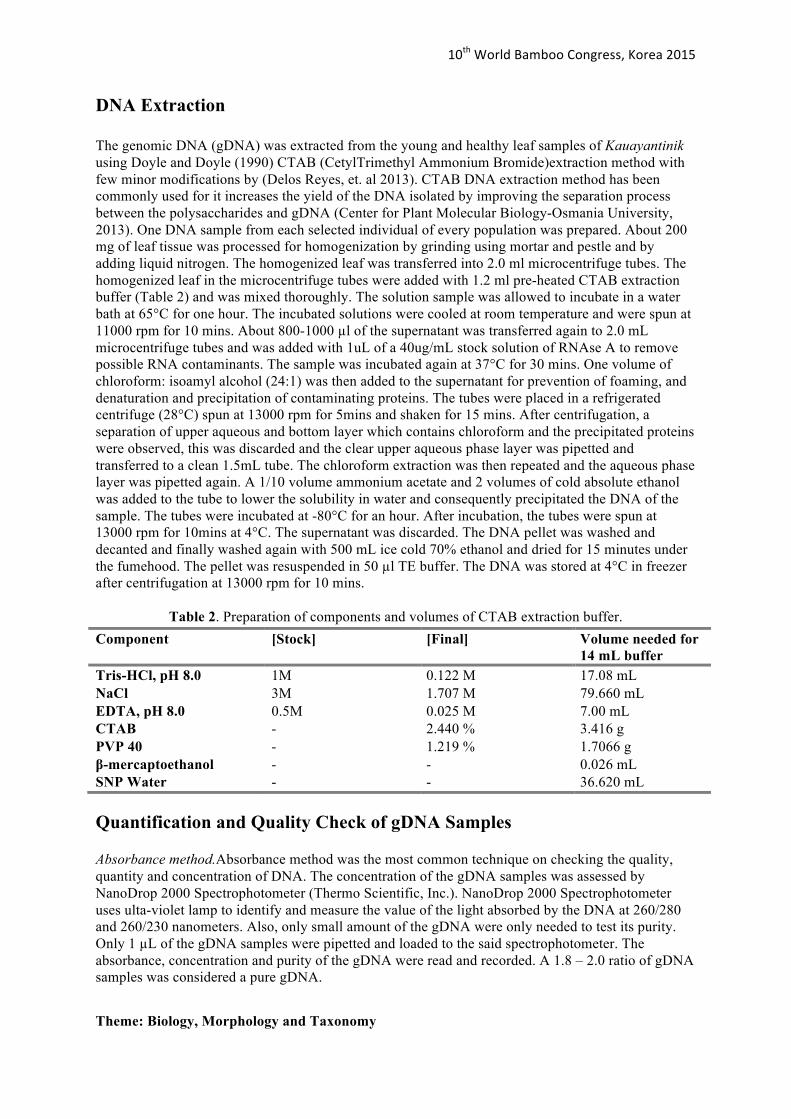
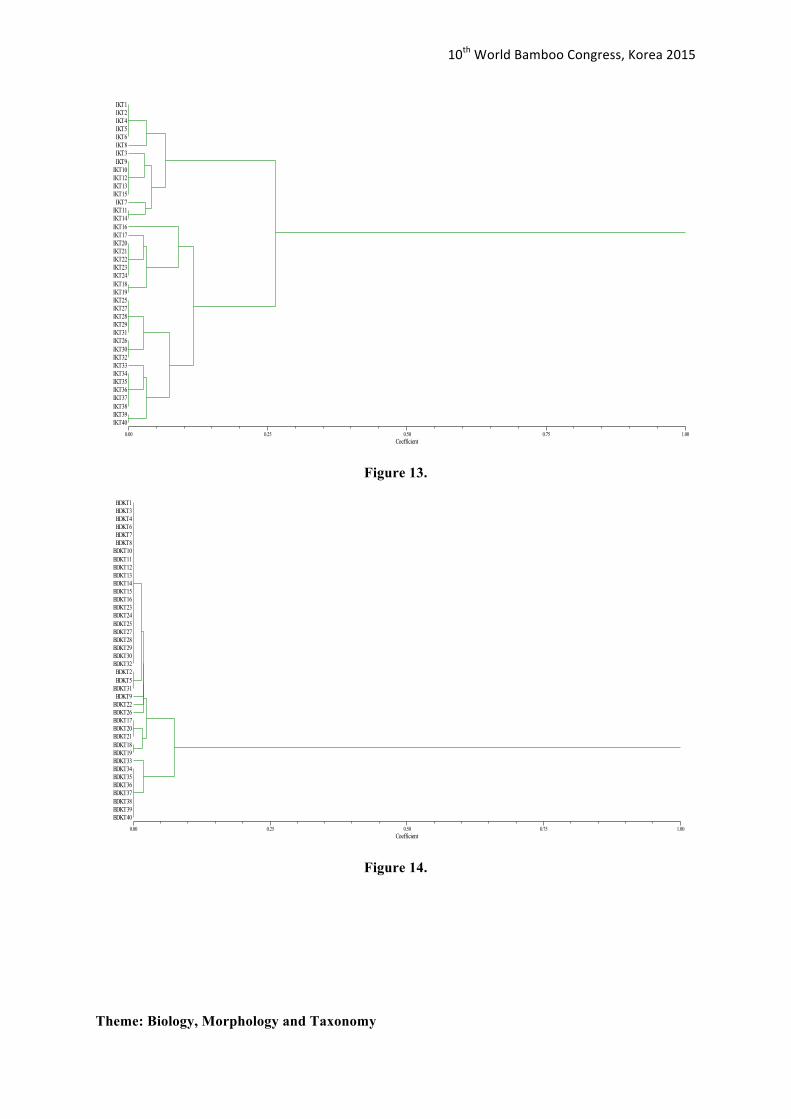
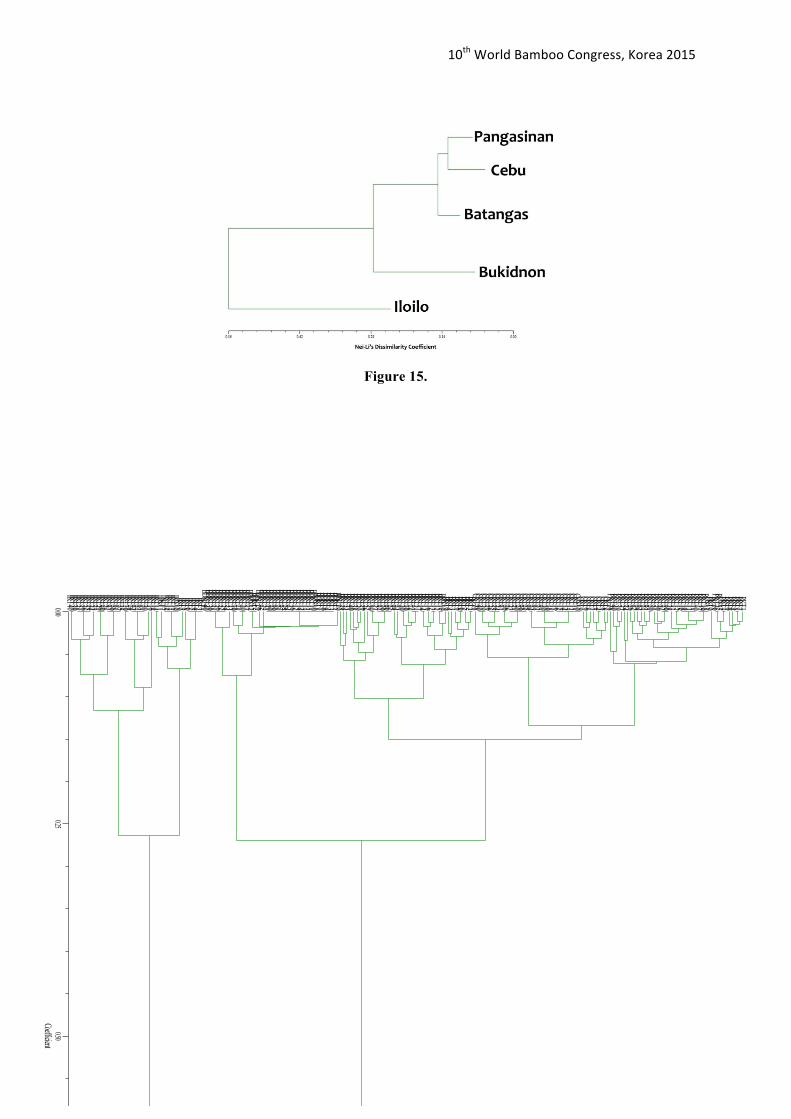
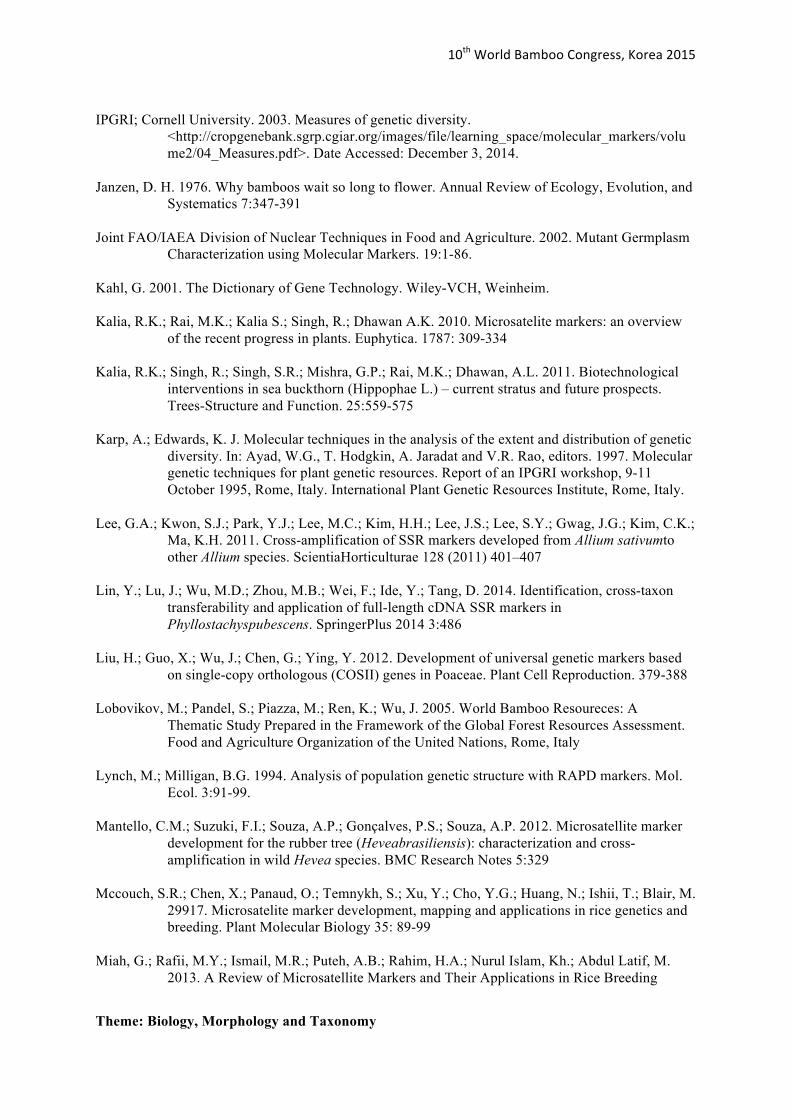
A dendrogram generated from the software NTSYSpc 2.1 (Rohlf 2004) was constructed to display the genetic relationship among all Bamboo population samples. Nei-Li’s dissimilarity coefficient and Unweighted Pair Group Method with Arithmetic Mean (UPGMA) was the method used for measuring and clustering the genetic dissimilarity/distances respectively. Results showed that 56% was the average genetic dissimilarity among the bamboo population. Low genetic dissimilarity was observed within each population (Figures 10-14). The generated genetic dissimilarity of all Bamboo populations was approximately ranged from 12% to 56% (Figure 15).

10th World Bamboo Congress, Korea 2015
Theme: Biology, Morphology and Taxonomy
Figure 16 shows that the samples within each population were very genetically similar. Therefore, close genetic relationship was exhibited within each population. At most 0.56 Nei-Li’s dissimilarity coefficient, only two distinct clusters were observed. These were Iloilo and the clustered group composed of Pangasinan, Batangas, Cebu and Bukidnon (Figure 15). The results on Figure 16 suggested that Iloilo has a 56% genetic variation among the other population, highest genetic diversity rate among the populations. The genetic variation (ca. 0.56 Nei-Li’s dissimilarity coefficient) reported in this study is higher than the UPGMA tree generated for Dendrocalumusmembranaceusin China (ca. 0.09 Nei-Li’s dissimilarity coefficient). Yang et. al. (2012) reported D. membranaceusin China is declining also in terms of the availability of genetic resources for D. membranaceusbamboo species.
Coefficient0.00 0.25 0.50 0.75 1.00
PKT10MW
PKT1 PKT7 PKT8 PKT4 PKT6 PKT2 PKT3
PKT35 PKT36 PKT5 PKT9
PKT18 PKT19 PKT27 PKT10 PKT11 PKT12 PKT14 PKT16 PKT15 PKT17 PKT13 PKT30 PKT28 PKT29 PKT32 PKT31 PKT20 PKT21 PKT22 PKT23 PKT24 PKT25 PKT26 PKT33 PKT34 PKT38 PKT37 PKT39 PKT40
Figure 10.

10th World Bamboo Congress, Korea 2015
Theme: Biology, Morphology and Taxonomy
Coefficient0.00 0.25 0.50 0.75 1.00
BKT10MW
BKT1 BKT2 BKT5 BKT6 BKT8 BKT7 BKT3 BKT4 BKT9
BKT10 BKT15 BKT11 BKT12 BKT16 BKT13 BKT14 BKT17 BKT21 BKT22 BKT18 BKT19 BKT20 BKT23 BKT24 BKT25 BKT26 BKT28 BKT29 BKT31 BKT27 BKT30 BKT32 BKT36 BKT37 BKT39 BKT38 BKT40 BKT33 BKT34 BKT35
Figure 11.
Coefficient0.00 0.25 0.50 0.75 1.00
CKT10MW
CKT1 CKT6 CKT7 CKT2 CKT8 CKT3 CKT4 CKT5 CKT9
CKT10 CKT11 CKT12 CKT13 CKT14 CKT15 CKT16 CKT17 CKT18 CKT19 CKT20 CKT21 CKT22 CKT23 CKT24 CKT38 CKT26 CKT27 CKT25 CKT28 CKT29 CKT30 CKT31 CKT32 CKT33 CKT34 CKT35 CKT36 CKT37 CKT39 CKT40
Figure 12.
10th World Bamboo Congress, Korea 2015
Theme: Biology, Morphology and Taxonomy
Coefficient0.00 0.25 0.50 0.75 1.00
IKT10MW
IKT1 IKT2 IKT4 IKT5 IKT6 IKT8 IKT3 IKT9
IKT10 IKT12 IKT13 IKT15 IKT7
IKT11 IKT14 IKT16 IKT17 IKT20 IKT21 IKT22 IKT23 IKT24 IKT18 IKT19 IKT25 IKT27 IKT28 IKT29 IKT31 IKT26 IKT30 IKT32 IKT33 IKT34 IKT35 IKT36 IKT37 IKT38 IKT39 IKT40
Figure 13.
Coefficient0.00 0.25 0.50 0.75 1.00
BDKT10MW
BDKT1 BDKT3 BDKT4 BDKT6 BDKT7 BDKT8
BDKT10 BDKT11 BDKT12 BDKT13 BDKT14 BDKT15 BDKT16 BDKT23 BDKT24 BDKT25 BDKT27 BDKT28 BDKT29 BDKT30 BDKT32 BDKT2 BDKT5
BDKT31 BDKT9
BDKT22 BDKT26 BDKT17 BDKT20 BDKT21 BDKT18 BDKT19 BDKT33 BDKT34 BDKT35 BDKT36 BDKT37 BDKT38 BDKT39 BDKT40
Figure 14.
10th World Bamboo Congress, Korea 2015
Theme: Biology, Morphology and Taxonomy
Coefficient0.00
0.250.50
0.751.00
BDKT10MW PKT1 PKT7 PKT8 PKT4 PKT6 PKT2 PKT3
PKT35 PKT36 PKT5 PKT9
PKT18 PKT19 PKT27 PKT10 PKT11 PKT12 PKT14 PKT16 PKT15 PKT17 PKT13 PKT28 PKT29 PKT32 PKT30 PKT31 PKT20 PKT21 PKT22 PKT23 PKT24 PKT25 PKT26 PKT33 PKT34 PKT37 PKT39 PKT40 PKT38 CKT2 CKT8 CKT3 CKT4 CKT5 CKT1 CKT6 CKT7 CKT9
CKT10 CKT11 CKT12 CKT13 CKT14 CKT15 CKT16 CKT17 CKT18 CKT19 CKT20 CKT21 CKT22 CKT23 CKT24 CKT25 CKT28 CKT29 CKT30 CKT31 CKT32 CKT26 CKT27 CKT33 CKT34 CKT35 CKT36 CKT37 CKT39 CKT40 CKT38 BKT1 BKT2 BKT5 BKT6 BKT8 BKT7 BKT3 BKT4 BKT9
BKT10 BKT15 BKT11 BKT12 BKT16 BKT13 BKT14 BKT17 BKT21 BKT22 BKT18 BKT19 BKT20 BKT23 BKT24 BKT25 BKT26 BKT28 BKT29 BKT31 BKT27 BKT30 BKT32 BKT36 BKT37 BKT39 BKT38 BKT40 BKT33 BKT34 BKT35 BDKT9 BDKT1 BDKT3 BDKT4 BDKT6 BDKT7 BDKT8
BDKT10 BDKT11 BDKT12 BDKT13 BDKT14 BDKT15 BDKT16 BDKT23 BDKT24 BDKT25 BDKT27 BDKT28 BDKT29 BDKT30 BDKT32 BDKT22 BDKT26 BDKT2 BDKT5
BDKT31 BDKT17 BDKT20 BDKT21 BDKT18 BDKT19 BDKT33 BDKT34 BDKT35 BDKT36 BDKT37 BDKT38 BDKT39 BDKT40
IKT1 IKT2 IKT4 IKT5 IKT6 IKT8 IKT3 IKT9
IKT10 IKT12 IKT13 IKT15 IKT7
IKT11 IKT14 IKT16 IKT17 IKT20 IKT21 IKT22 IKT23 IKT24 IKT18 IKT19 IKT25 IKT27 IKT28 IKT29 IKT31 IKT26 IKT30 IKT32 IKT33 IKT34 IKT35 IKT36 IKT37 IKT38 IKT39 IKT40
Figure 15.

10th World Bamboo Congress, Korea 2015
Theme: Biology, Morphology and Taxonomy
Figure 16.
SUMMARY AND CONCLUSION
The study aims to assess the genetic diversity status of Kauayantinikin the Philippines through SSR marker analysis. Its specific goals were to establish a protocol for the DNA isolation of Kauayantinik, to cross –amplify Kauayantinik with rice SSR markers for further genetic analysis and to measure and toanalyze the genetic distance, similarity and polymorphisms detected on the SSR bands of Kauayantinik. A total of 40 individuals of each Kauayantinik population were randomly selected to harvest its young leaves for optimizing a DNA extraction procedure. The genomic DNA isolated from the populations of Kauayantinik was quantified and checked for its quality through absorbance and agarose gel electrophoresis method. High quality DNA, with an absorbance ratio of 1.8-2.0 and had an observable distinct and intense band, has been used for the molecular marker analysis through PCR amplification of the SSR bands. The SSR bands were scored in a binary data format of which “1” represented the presence of bands and “0” indicated its absence. The binary data of SSR bands were further analyzed for genetic analysis by measuring and studying the detected polymorphisms, geometric distance and genetic similarity. NTSYSpc, bioinformatics software, was used to generate a dendrogram or phylogenetic tree for determining the genetic similarity and detected polymorphisms among and within the populations. Nei-Li’s similarity coefficient and Unweighted Pair Group Method with Arithmetic Mean (UPGMA) were the methods used for measuring and clustering the genetic similarity/distances, respectively.

10th World Bamboo Congress, Korea 2015
Theme: Biology, Morphology and Taxonomy
Based on the results of the study, it can be concluded that Kauayantinik from Pangasinan, Batangas, Cebu, Iloilo and Bukidnon populationscan yield a high quality of genomic DNA (gDNA) using the optimized modified CTAB DNA extraction method. The KauayantinikgDNA had a high transferability rate to cross amplify the SSR markers from rice, a relative from the family of Poaceae. This high cross-amplification rate further strengthened the idea that rice SSR markers may isolate fragments ofDNA that can be used for assessing its genetic diversity. The low genetic similarity generated from the Kauayantinik populations clearly states high observable polymorphisms among the geographic locations of bamboo. These polymorphisms also indicate that Kauayantinik, an endemic bamboo species in the Philippines has rich genetic resources which can further be used for genetic improvement of the species for economic purposes. Kauayantinik (Bambusablumeana) populations that exhibited high genetic diversity based on expected heterozygosity and high average genetic dissimilarity (based on Nei-Li’s index) may be suggested to be used for possible future implementations of in situ conservation efforts in the Philippines to preserve its rich genetic resources.
RECOMMENDATIONS With the many applications of bamboo in the country, it has a lot of potentials that may be discovered through biochemical or gene discovery researches, thus, the initiatives on the molecular study of native & endemic bamboos in the Philippines is established. Here are some of the recommendations that may further improve this study: Polyacrylamide gel electrophoresis (PAGE) method should also be used to counter-check the bands detected from the agarose gel electrophoresis (AGE) method. PAGE has a higher resolving power than AGE because it produces more porous beads which may further increase the separation rate between the markers with low and high molecular weight. This increased separation between the markers low and high molecular weight may also increase the bands detected which has not possible been seen from the AGE. A more dedicated SSR markers designed for flanking some fragment genome sequences for bamboo should be used to correctly represent each of the chromosome of bamboo. Representation of each bamboo chromosome augments the accuracy and precision of the genetic diversity analysis within and among the K. tinik populations. Also, exon-based SSR markers should be generated to map the important genes that have economic importance for bamboo. Through exon-based SSR markers, some gene-encoding enzymes involved in the cellulose biosynthesis of bamboo may be isolated which are responsible for the strengthening of its culm. Extracting and cloning the PCR products of the SSR bands should be done to improve the dendrogram generated by the study. The random fragments flanked out from the genome sequence of K. tinik, once undergone DNA sequencing should be compared through multi-sequences pairwise alignment.
REFERENCES
Ambida, R.C.S.; Gabor, C.R.J.; Panes, V.A. 2012 Preliminary Molecular Analysis of Philippine Rattan Germplasm Collection. Ateneo De Manila University. 1-24
Applied Biosystems, Inc. 2004. Evaluating Genetic Analysis Systems: Microsatellite Analysis. Fact
Sheet Fragment Analysis: iScience: 1-4

10th World Bamboo Congress, Korea 2015
Theme: Biology, Morphology and Taxonomy
Baja-Lapis, A.C.; Santander, M.L. Jr. 2003. The Diversity of Non-Wood Forest Species and the Significant Role of the Indigenous Communities in the Philippines. Food and Agriculture Organization World Forestry Congress.
Bamboo grove. 2008. Origin of Bamboo. <http://www.bamboogrove.com/origins-of-bamboo.html
http://www.bamboogrove.com/origins-of-bamboo.html> Date Retrieved: October 24, 2014
Banumathi, G.; Krishnasamy, V.; Maheswaran, M.; Samiyappan, R.; Govindaraj, P.; Kumaravadivel,
N. 2010. Genetic diversity analysis of sugarcane (Saccharum sp.) clones using simple sequence repeat markers of sugarcane and rice. Electronic Journal of Plant Breeding. 1(4): 517-526
Bhandawat A.; Sharma V.; Sharma H.; Sood A.; Sharma R. K. 2014. Development and
crosstransferability of functionally relevant microsatellite markers in Dendrocalamuslatiflorus and related bamboo species. J. Genet. 93:e48–e55.
Bareja, B. G. 2010. Bamboo Production and Propagation Methods. Crop Farming Review.
<http://www.cropsreview.com/support-files/bambooproduction-and-propagationmethods.pdf> Date Accessed: October 24, 2014
Center For Plant Molecular Biology. 2013. Chapter 4: Plant Genomic DNA Isolation. National
Refresher Course for Plant Biotechnology. Osmania University <http://www.osmania.ac.in/CPMB/Training1/M4.htm> Date Retrieved: December 2, 2014
Changtragoon S.; Laphom, R. 2009. Assessment of Genetic Diversity in Bambusabambos from
Thailand using Microsatellite Markers. 8th World Bamboo Congress Proceedings. 2: 87-96
Chatterjee, R. N.; Raizada, M.B. 1963. Culm sheaths as an aid to identification of Bamboo. Indian
Journal of Forestry. 89: 744-756 Chen, S.;Lin, Y.; Lin, C.; Chen, W.; Yang, C.H.; Ku, H. 2010. Transferability of rice SSR markers to
bamboo. Euphyttica. 175: 23-33 Clayton, W. D.; Vorontsova, M. S.; Harman, K. T.; Williamson, H. 2013. World grass species:
Synonymy. <http://www.kew.org/data/grasses-syn.html.> Date Retrieved: October 24, 2014.
Corpuz, O.S.; Carandang, W.M. 2012. Effect of root growth potential, planting distance, and
provenance on the growth and survival of GmelinaarboreaRoxb. Asia Life Sciences 21(1): 1-18
Cui, XM; Dong, Y.X.; Hou, X.L.; Cheng, Y.; Zhang, J.Y.; Jin, M.F. 2008. Development and
characterization of microsatellite markers in Brassica rapa ssp. chinensis and transferability among related species. AgricSci China 7:19–31
De Vera, B.A. 2012. PH aims to become world’s 2nd top bamboo exporter. <
http://www.interaksyon.com/business/44480/ph-aims-to-become-worlds-2nd-top-bamboo-exporter> Accessed Date: October 24, 2014.
Delos Reyes, M.T.A.; Magpantay, G.D.; Cagalawan, A.; Baja-Lapis, A.C.; Calinawan, N.M.; Berdos,
M.L.G. 2013. Genetic diversity of Limuran (Calamusornatus Blume var.

10th World Bamboo Congress, Korea 2015
Theme: Biology, Morphology and Taxonomy
philippinensisBecc.) populations from three sites in Luzon Island, Philippines using Random Amplified Polymorphic DNA (RAPD) markers. SYLVATROP The Technical Journal of Philippine Ecosystems and Natural Resources 23 (1&2) January -December 2013.
Ding, Y.L. 1998. The taxonomic study on Phyllostachys. Ph.D. thesis, Nanjing Forestry University,
P.R. China. Dong, Y.; Zhang, Z.; Yang, H. 2012. Sixteen novel microsatellite markers developed for
Dendrocalamaussinicus (Poaceae), the strongest woody bamboo in the world. Am. J. Bot.99(9): e347-e349
Doyle, J.J.; Doyle J.L. 1990. Isolation of plant DNA from fresh tissue. Focus. 12: 13-15. Dubcovsky, J. 2011. PCR Markers - PCR-amplification of Microsatellites from Wheat Genomic
DNA. PLB161A Laboratory XIII. Retrieved online at http://www.plantsciences.ucdavis.edu/Dubcovsky/-PLB161A/PCR_Microsatellites.PDF. pp. 43-50.
Dube, L.C. 2008. Climate Change Mitigation Opportunities in Bamboo and Bamboo Applications. International Conference on Improvement of Bamboo Productivity and Marketing for Sustainable Livelihood Proceedings. 205-213.
Farooq, S.; Azam, S. 2002. Molecular Markers and Plant Bredding-I: Concepts and Caharacterization.
Pakistan Journal of Biological Sciences 5(10): 1135-1140 Filipino Style Recipe. 2013. DenengdengnaLabong at Saluyot. <
http://filipinostylerecipe.com/2013/06/denengdeng-na-labong-at-saluyot/> Accessed Date: December 29, 2014.
Filipino Style Recipe. 2012. GinataangLabong. < http://filipinostylerecipe.com/2012/08/ginataang-
labong/> Accessed Date: December 29, 2014. Forest Management Bureau.2012. Philippine Forestry Statistics. Department of Energy and Natural
Resources. xii. Friar, E.; Kochert, G. 1991. Bamboo germplasm screening with nuclear restriction fragment length
polymorphisms. Theor. Appl. Genet. 82: 697-703 Friar, E.; Kochert, G. 1994. A study of genetic variation and evolution of
Phyllostachys(Bambusoidae: Poaceae) using nuclear restriction fragment length polymorphisms. Theor. Appl. Genet. 89: 265-270
Gamble, J.S. 1896. The Bambusae of British India. Ann R Bot Gaqrd Calcutta 7:1-133 Gupta, P.K.; Varshney, R.K., 2000. The development and use of microsatellite markers for genetic
analysis and plant breeding with emphasis on bread wheat. Euphytica 113:163–185. Heng, H. P.; Yeho, H.H.; Tan, C.K.C.; Rao, A.N. 1996. Leaf isozyme polymorphism in bamboo
species. Journal of Sinagapore National Academy of Science. 22: 10-14 Hodkinson, T.R.; Renvoize, S.A.; Chonghaile, G.N.; Stapleton, C.M.A.; Chase, M.W. 2000. A
comparison of ITS nuclear rDNA sequence data and AFLP markers for phylogenetic studies in Phyllostachys (Bambusoidae, Poaceae). J. Plant Res. 113:265-269
10th World Bamboo Congress, Korea 2015
Theme: Biology, Morphology and Taxonomy
IPGRI; Cornell University. 2003. Measures of genetic diversity.
<http://cropgenebank.sgrp.cgiar.org/images/file/learning_space/molecular_markers/volume2/04_Measures.pdf>. Date Accessed: December 3, 2014.
Janzen, D. H. 1976. Why bamboos wait so long to flower. Annual Review of Ecology, Evolution, and
Systematics 7:347-391 Joint FAO/IAEA Division of Nuclear Techniques in Food and Agriculture. 2002. Mutant Germplasm
Characterization using Molecular Markers. 19:1-86. Kahl, G. 2001. The Dictionary of Gene Technology. Wiley-VCH, Weinheim. Kalia, R.K.; Rai, M.K.; Kalia S.; Singh, R.; Dhawan A.K. 2010. Microsatelite markers: an overview
of the recent progress in plants. Euphytica. 1787: 309-334 Kalia, R.K.; Singh, R.; Singh, S.R.; Mishra, G.P.; Rai, M.K.; Dhawan, A.L. 2011. Biotechnological
interventions in sea buckthorn (Hippophae L.) – current stratus and future prospects. Trees-Structure and Function. 25:559-575
Karp, A.; Edwards, K. J. Molecular techniques in the analysis of the extent and distribution of genetic
diversity. In: Ayad, W.G., T. Hodgkin, A. Jaradat and V.R. Rao, editors. 1997. Molecular genetic techniques for plant genetic resources. Report of an IPGRI workshop, 9-11 October 1995, Rome, Italy. International Plant Genetic Resources Institute, Rome, Italy.
Lee, G.A.; Kwon, S.J.; Park, Y.J.; Lee, M.C.; Kim, H.H.; Lee, J.S.; Lee, S.Y.; Gwag, J.G.; Kim, C.K.;
Ma, K.H. 2011. Cross-amplification of SSR markers developed from Allium sativumto other Allium species. ScientiaHorticulturae 128 (2011) 401–407
Lin, Y.; Lu, J.; Wu, M.D.; Zhou, M.B.; Wei, F.; Ide, Y.; Tang, D. 2014. Identification, cross-taxon
transferability and application of full-length cDNA SSR markers in Phyllostachyspubescens. SpringerPlus 2014 3:486
Liu, H.; Guo, X.; Wu, J.; Chen, G.; Ying, Y. 2012. Development of universal genetic markers based
on single-copy orthologous (COSII) genes in Poaceae. Plant Cell Reproduction. 379-388 Lobovikov, M.; Pandel, S.; Piazza, M.; Ren, K.; Wu, J. 2005. World Bamboo Resoureces: A
Thematic Study Prepared in the Framework of the Global Forest Resources Assessment. Food and Agriculture Organization of the United Nations, Rome, Italy
Lynch, M.; Milligan, B.G. 1994. Analysis of population genetic structure with RAPD markers. Mol.
Ecol. 3:91-99. Mantello, C.M.; Suzuki, F.I.; Souza, A.P.; Gonçalves, P.S.; Souza, A.P. 2012. Microsatellite marker
development for the rubber tree (Heveabrasiliensis): characterization and cross-amplification in wild Hevea species. BMC Research Notes 5:329
Mccouch, S.R.; Chen, X.; Panaud, O.; Temnykh, S.; Xu, Y.; Cho, Y.G.; Huang, N.; Ishii, T.; Blair, M.
29917. Microsatelite marker development, mapping and applications in rice genetics and breeding. Plant Molecular Biology 35: 89-99
Miah, G.; Rafii, M.Y.; Ismail, M.R.; Puteh, A.B.; Rahim, H.A.; Nurul Islam, Kh.; Abdul Latif, M.
2013. A Review of Microsatellite Markers and Their Applications in Rice Breeding
10th World Bamboo Congress, Korea 2015
Theme: Biology, Morphology and Taxonomy
Programs to Improve Blast Disease Resistance. International Journal of Molecular Sciences 14:22499-22528
Mondini, L.; Noorami, A.; Pagnotta, M.A. 2009. Assessment of plant genetic diversity by molecular
tools. Diversity 1:19-35. Naithani H.B.; Pal, M.; Lepcha, S.T.S. 2003. Gregarious flowering of Thamnocalamusspathiflorus
and T. falconeri, bamboos from Uttaranchal, India. IndFor 129:517–526 Nayak, S.; Rout, G.R. 2005. Characterization of microsatelisted in Bambusaarundicea and cross
species amplification in other bamboos. Plant Breed 124: 605-610. Peng Z., Lu, Y. Li, L. Zhao, Q., Feng, Q., Gao, Z., Lu, H., Hu, T., Yao, N., Liu, K., Li, Y,. Fan, D.,
Guo, Y., Li, W., Lu, Y., Weng, Q., Zhou, C., Zhang, L., Huang, T., Zhao, Y., Zhu, C., Liu, X., Yang, X., Wang, T., Miao, K., Zhuang, C. Cao, X., Tang, W., Liu, G., Liu, Y., Chen, J., Liu, Z., Yuan, L., Liu, Z., huang, X., Li, T., Fei, B., Ning, Z., Han, B. & Jiang, Z. 2013. The draft genome of the fast-growing non-timber forest species moso bamboo (Phyllostachys heterocycle). Nature. 45 (4): 456-463
Powell, W.; Machray, G. C.; Provan, J. 1996. Polymorphism revealed by simple sequence repeats.
Trends in Plant Sci. 1(7): 215-222 Porth, I. and Y. A. Kassaby. 2014. Assessment of the Genetic Diversity in Forest Tree Populations
Using Molecular Markers. Diversity 6:283-295. Rai, M.K.; Phulwaria, M.; Shekhawat, N.S. 2013. Transferability of simple sequence repeat (SSR)
markers developed in guava (Psidiumguajava L.) to four Myrtaceae species. MolBiol Rep 1-5pp.
Rolf, J. F. 2004. Numerical Taxonomy and Multivariate Analysis System (NTSYSpc) Version 2.1
User Guide. Department of Ecology and Evolution. State University of New York: 1-38 Rossetto, M. 2001. Sourcing of SSR Markers from related plant species. In: HENRY, R. J. (ed), Plant
genotyping: The DNA fingerprinting of plants, 210–224. CAB International, Oxford. Roxas, C.A. 1998. Bamboo Research in the Philippines. IPGRI. Bamboo - Conservation, Diversity,
Ecogeography, Germplasm, Resource Utilization and Taxonomy. Proceedings of training course cum workshop 1998. Kunming and Xishuanbanna, Yunnan, China.
Saha M.C.; Copper J.D.; Mian M.A.R.; Chekhovskiy K.; May, G.D. 2006. Tall fescue genomic SSR
markers: development and transferability across multiple grass species. TheorAppl Genet 113:1449–1458
Samaco, M. A.; Villa, N. O.; Gregorio, G. B. 2012. Exploiting the Multiparent Advanced Generation
Intercross (MAGIC) populations of Rice (Orayza sativa L.) for seedling salinity tolerance and establishing the genetic correlations of the selected genotypes (unpublished Bachelor thesis). Institute of Biological Sciences, College of Arts and Sciences, University of the Philippines Los Baños: 1-90
Sharma, R.K.; Gupta, P.; Sharma, V.; Sood, A.; Mohapatra T.; Ahuhia, P.S. 2008. Evaluation of rice
and sugarcane SSR markers for phylogenetic and genetic diversity analyses in bamboo. Genome. 51 (2): 91-103

10th World Bamboo Congress, Korea 2015
Theme: Biology, Morphology and Taxonomy
Shalini, A.; Meena, R.K.; Tarafdar, S.; Thakur, S. 2013. Evaluation of genetic diversity in bamboo through DNA marker and study of association with morphological traits. Bulletin of Environment, Pharmacology and Life Sciences. 2(8): 78-83
Singh, S. R.; Singh, R.; Sanjay, K.; Dalal, S.; Dhawan, A.K.; Kalia, R.K. 2013. Limitations, progress
and prospects of application of biotechnology tools in improvement of bamboo- a plant with extraordinary qualities. Physiology amd Molecular Biology of Plants. 19(1): 21-41
Squirrell, J.; Hollingsworth, P.M.; Woodhead, M.; Russell, J.; Lowe, A.J.; Gibby, M.; Powell, W.
2003. How much effort is required to isolate nuclear microsatellites from plants? Mol. Ecol. 12, 1339–1348.
Sui, C. Why bamboo is booming again in Taiwan. <http://www.bbc.com/news/business-26891682>
Date Accessed: October 24, 2014 TulaynaKawayan. 2014. Local Bamboo Species. Retrieved online at
http://tulaykawayan.blogspot.com/2011/01/local-bamboo-species.html. Date Accessed: December 15, 2014
Torres, L.; Lopez, D. C.; Palacio, J.D.; Duque, M.C.; Galindo, A.P.; Vargas, I.A.G.; Henao, H.C. 2009. 8th World Bamboo Congress Proceedings. 5: 64-79
University of Missouri. 2001. SSR Protocol. Retrieved online at
http://cafnr.missouri.edu/mmp/ssr_protocol.htm.
Vekemans, X. 2002. AFLP-SURV: A program for genetic diversity analysis with AFLP (and RAPD) population data. Laboratoire de Génétiqueetd'EcologieVégétalesUniversitéLibre de Bruxelles: 1-15
Wang, M.L.; Barkley, N.A.; Yu, J.K.; Dean, R.E.; Newman, M.L.; Sorrells, M.E.; Pederson, G.A.
2004. Transfer of simple sequence repeat (SSR) markers from major cereal crops to minor grass species for germplasm characterization and evaluation. Plant Genetic Resources: Characterization and Utilization 3(1): 45-57
Yadav, O.P.; Mitchell, S.E.; Fulton, T.M.; Kresovich, S. 2008. Transferring molecular markers from
sorghum, rice and other cereals to pearl millet and identifying polymorphic markers. Journal of SAT Agricultural Research 6:1-4
Yasmin, L.; Md. N. A.; Gantait., S.; Chakraborty, S. 2014. Bamboo: an overview on its genetic
diversity and and characterization. 3 Biotech. Springer. Yang, H.; An, M.; Gu, Z.; Tian, B. 2012. Genetic diversity and differentiation of
Dendrocalamusmembranaceus (Poaceae: Bambusoidease), a declining bamboo species in Yuannan, China, as based on inter-simple sequence repeat (ISSR) analysis. International Journal of Molecular Sciences 2012, 13. pp. 4446-4457
Yu, J.; Zhao, H.; Zhu, T.; Chen, L.; Peng, J. 2013. Transferability of rice SSR markersw to
Miscanthussinensis, a potential biofuel crop. Euphytica. 191(3):455-468. Zeid, M.; Yu, J.K.; Goldowitz, I.; Dentond, M.E.; Costich, D.E.; Jayasuriya, C.T.; Saha, M.; Elshire,
R.; Benscher, D.; Breseghello, F.; Munkvold, J.; Varshney, R.K.; Belay, G.; Sorrells, M.E. 2010. Cross-amplification of EST-derived markers among 16 grass species. Field Crops Research 118:28–35

10th World Bamboo Congress, Korea 2015
Theme: Biology, Morphology and Taxonomy
Zhao, H.; Chen, D.; Peng, Z.; Wang, W.; Gao, Z. 2014. Identifiaction and Characfterization of MicroRNAs in the Leaf of Ma Bamboo (Dendrocalamuslatiflorus) by Deep Sequencing. PLosONE. 8(10)
Zhao, H.; Peng, Z.; Fei, B.; Li, L.; Hu, T.; Gao, Z.; Jiang, Z.2014. Bamboo GDB: a bamboo genome database with functional annotation and an analysis platform. Database. Oxford University Press
List of Figures
Figure 1. Image of Kauayantinik (BambusablumeanaSchultes f.) plantation taken from Tulay Na Kawayan(2014). Figure 2. The five source plantations of Kauayantinik samples as located in the Philippine map. Figure 3. Schematic diagram of procedure on the genetic diversity assesment of Kauayantinik using SSR marker analysis. Figure 4. Electrophoretic images of extracted DNA of representative samples of Pangasinan (PKT) population using the CTAB protocol. Figure 5. Electrophoretic images of extracted DNA of representative samples of Batangas (BKT) population using the CTAB protocol. Figure 6. Electrophoretic images of extracted DNA of representative samples of Cebu (CKT) population using the CTAB protocol. Figure 7. Electrophoretic images of extracted DNA of representative samples of Iloilo (IKT) population using the CTAB protocol. Figure 8. Electrophoretic images of extracted DNA of representative samples of Bukidnon (BdKT) population using the CTAB protocol. Figure 9a. Electrophoretic images of Kauayantinik PCR products (PKT population) amplified from Ba10 primer (~10 bp). Figure 9b. Electrophoretic images of Kauayantinik PCR products (BKT population) amplified from RM167 primer (~10 bp). Figure 9c. Electrophoretic images of Kauayantinik PCR products (BKT population) amplified from RM105 primer (~10 bp). Figure 9d. Electrophoretic images of Kauayantinik PCR products (CKT population) amplified from RM233B primer (~10 bp). Figure 9e. Electrophoretic images of Kauayantinik PCR products (IKT population) amplified from RM167 primer (~10 bp). Figure 9f. Electrophoretic images of Kauayantinik PCR products (BdKT population) amplified from RM249 primer (~10 bp).
10th World Bamboo Congress, Korea 2015
Theme: Biology, Morphology and Taxonomy
Figure 10. NTSYS 2.1 Dendrogram showing the genetic relationship of 40 samples of Kauayantinik PKT population using 50 primer pairs of SSR markers based on Nei-Li’s dissimilarity index. Figure 11. NTSYS 2.1 Dendrogram showing the genetic relationship of 40 samples of Kauayantinik BKT population using 50 primer pairs of SSR markers based on Nei-Li’s dissimilarity index. Figure 12. NTSYS 2.1 Dendrogram showing the genetic relationship of 40 samples of Kauayantinik CKT population using 50 primer pairs of SSR markers based on Nei-Li’s dissimilarity index. Figure 13. NTSYS 2.1 Dendrogram showing the genetic relationship of 40 samples of Kauayantinik IKT population using 50 primer pairs of SSR markers based on Nei-Li’s dissimilarity index. Figure 14. NTSYS 2.1 Dendrogram showing the genetic relationship of 40 samples of KauayantinikBdKT population using 50 primer pairs of SSR markers based on Nei-Li’s dissimilarity index. Figure 15. Combined dissimilarity indices of Pangasinan, Batangas, Cebu, Iloilo and Bukidnon populations. Figure 16. NTSYS 2.1 Dendrogram showing the dissimilarity and clustering of all populations using 50 primer pairs of SSR markers based on Nei-Li’s dissimilarity index.
Acknowledgements
Sincere gratitude is extended to the following:
• ERDB management for the continuous support of project funds, upgrading of the ERDB Forest Molecular Laboratory and acquisition of equipment needed in molecular analysis; and
• Dr. Antonio C. Laurena, Research Professor III, Biochemistry Laboratory/Crop Biotech Division, Institute of Plant Breeding, Crop Science Cluster, College of Agriculture, University of the Philippines Los Banos, College, Laguna for sharing his time and expertise in the interpretation of data for the analysis of this study.