Embed Size (px)
Citation preview
ORIGINAL PAPER
Assessment of earthquake early warning potential from KiK-Netseismograms of 2000–2011 north and east Japan events
Ramakrushna Reddy & Rajesh R. Nair
Received: 6 January 2014 /Accepted: 19 May 2014# Saudi Society for Geosciences 2014
Abstract An earthquake early warning alert system with ahigh degree of accuracy and precision and measured in sec-onds is a necessity to savemany lives in Japan, one of the mosttectonically active countries of the world. In this paper, weestimate the potential value for early warning of crustal andintraslab earthquakes recorded at the KiK-Net network. Thework reported here is similar to that of the early warninganalysis system of California and uses new comprehensivedata from northern and eastern Japan (Hokkaido and Tohoko).An attempt was alsomade to analyze whether the slopes of theregression lines obtained for Californian events (all are crustalevents) are similar to those obtained for Hokkaido and Tohokocrustal events. We also analyzed whether there was any dif-ference between the slopes obtained from Japanese crustal andintraslab earthquakes. The poor correlation of the higher mag-nitude (>5.5) with predominant period implied quite a limitedpredictability of predominant frequency. This was evidentfrom the scattered plot obtained for higher magnitudes. Theselimitations led us to use a discrete wavelet transform-automated algorithm based on the bi-orthogonal constructionwith two and four vanishing moments for the primal and dualwavelets.
Keywords Wavelets . Earthquakemagnitude determination .
P wave amplitude . Time-frequency analysis
Introduction
A warning for an earthquake can be “regional” or “on-site.”“Regional” earthquake early warning (EEW) is mainly based
on a dense sensor network covering a portion or the wholearea that is vulnerable to the earthquakes. In regional earlywarning, the source parameters are anticipated from the firstfew seconds of the recorded signals and used to predict,with a quantified confidence, the ground-motion intensitymeasure at a distant site where the target structure ofinterest is located. In an “on-site” EEWS, which consistsof a single sensor or an array of sensors deployed in theproximity of the target structure that is to be alerted, thepeak amplitude and/or predominant period on the initial Pwave motion are used to predict the ensuing peak groundmotion mainly related to the arrival of S and surface wavesat the same site. The Taiwan Strong-Motion InstrumentationProgram (TSMIP) is a network that serves as a base fordeveloping the earthquake rapid-reporting system (RRS).The RRS, developed and operated by the Central WeatherBureau (CWB) since 1995, provides useful informationsuch as earthquake location, magnitude, and ground-motion distribution 1 min after an earthquake (Wu andTeng 2002; Wu et al. 2006a). Steady progress has beenmade in Japan with EEW; following the work of Odakaet al. (2003), Kamigaichi (2004), and Horiuchi et al. (2005),JMA seismic networks and communications have made theearthquake early warning system a feasible product for theseismic monitoring community in Japan. The source param-eters shown in Tables 1 and 2 are derived based on Na-tional Research Institute for Earth Science and DisasterPrevention (NIED).
On-site early warning systems, in contrast to regionalwarning systems, provide a few seconds to several minutesof warning of incoming ground motion, allowing for short-term mitigation (by exploiting the S–P differential traveltime). In California, Allen and Kanamori (2003) used thedominant period of the first few seconds of the P wave asthe observable that scales with local magnitude. The predic-tive capability of the predominant frequency for high-
R. Reddy : R. R. Nair (*)Department of Ocean Engineering, IIT Madras,Chennai 600036, Indiae-mail: [email protected]
Arab J GeosciDOI 10.1007/s12517-014-1479-7
magnitude events in some data sets was somewhat limited.Lockman and Allen (2005) used single station earthquakecharacterization for early warning systems as individualstations are able to deliver an accurate early warning andsuggested a methodology which is suitable for regions thatlack a dense seismic network. Simons et al. (2006)
reappraised California earthquake data with discrete wavelettransform and suggested that scale 5 is ideal for low andhigh-magnitude events. A study by McGuire et al. (2008)that analyzed sea floor seismograms of the 2003 M 8.1Tokachi-Oki earthquake sequence, found that scale 9 wave-let coefficients varied by four orders of magnitude between
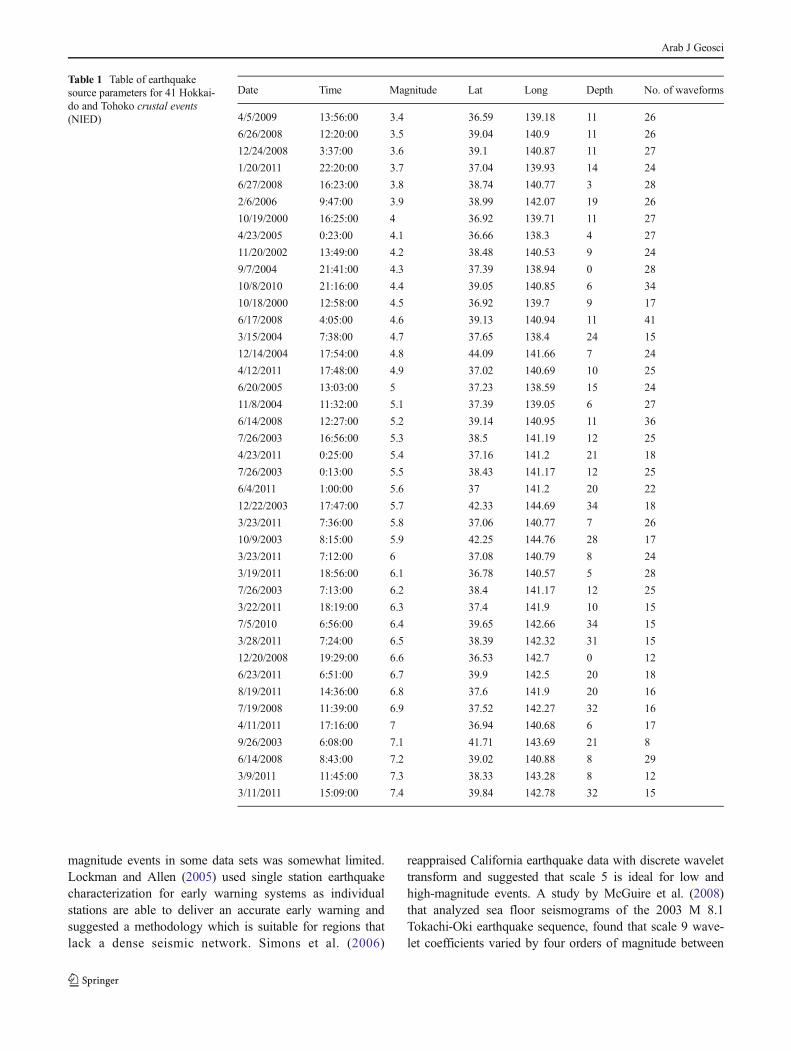
Table 1 Table of earthquakesource parameters for 41 Hokkai-do and Tohoko crustal events(NIED)
Date Time Magnitude Lat Long Depth No. of waveforms
4/5/2009 13:56:00 3.4 36.59 139.18 11 26
6/26/2008 12:20:00 3.5 39.04 140.9 11 26
12/24/2008 3:37:00 3.6 39.1 140.87 11 27
1/20/2011 22:20:00 3.7 37.04 139.93 14 24
6/27/2008 16:23:00 3.8 38.74 140.77 3 28
2/6/2006 9:47:00 3.9 38.99 142.07 19 26
10/19/2000 16:25:00 4 36.92 139.71 11 27
4/23/2005 0:23:00 4.1 36.66 138.3 4 27
11/20/2002 13:49:00 4.2 38.48 140.53 9 24
9/7/2004 21:41:00 4.3 37.39 138.94 0 28
10/8/2010 21:16:00 4.4 39.05 140.85 6 34
10/18/2000 12:58:00 4.5 36.92 139.7 9 17
6/17/2008 4:05:00 4.6 39.13 140.94 11 41
3/15/2004 7:38:00 4.7 37.65 138.4 24 15
12/14/2004 17:54:00 4.8 44.09 141.66 7 24
4/12/2011 17:48:00 4.9 37.02 140.69 10 25
6/20/2005 13:03:00 5 37.23 138.59 15 24
11/8/2004 11:32:00 5.1 37.39 139.05 6 27
6/14/2008 12:27:00 5.2 39.14 140.95 11 36
7/26/2003 16:56:00 5.3 38.5 141.19 12 25
4/23/2011 0:25:00 5.4 37.16 141.2 21 18
7/26/2003 0:13:00 5.5 38.43 141.17 12 25
6/4/2011 1:00:00 5.6 37 141.2 20 22
12/22/2003 17:47:00 5.7 42.33 144.69 34 18
3/23/2011 7:36:00 5.8 37.06 140.77 7 26
10/9/2003 8:15:00 5.9 42.25 144.76 28 17
3/23/2011 7:12:00 6 37.08 140.79 8 24
3/19/2011 18:56:00 6.1 36.78 140.57 5 28
7/26/2003 7:13:00 6.2 38.4 141.17 12 25
3/22/2011 18:19:00 6.3 37.4 141.9 10 15
7/5/2010 6:56:00 6.4 39.65 142.66 34 15
3/28/2011 7:24:00 6.5 38.39 142.32 31 15
12/20/2008 19:29:00 6.6 36.53 142.7 0 12
6/23/2011 6:51:00 6.7 39.9 142.5 20 18
8/19/2011 14:36:00 6.8 37.6 141.9 20 16
7/19/2008 11:39:00 6.9 37.52 142.27 32 16
4/11/2011 17:16:00 7 36.94 140.68 6 17
9/26/2003 6:08:00 7.1 41.71 143.69 21 8
6/14/2008 8:43:00 7.2 39.02 140.88 8 29
3/9/2011 11:45:00 7.3 38.33 143.28 8 12
3/11/2011 15:09:00 7.4 39.84 142.78 32 15
Arab J Geosci
M 4.0 and 8.1 and provided the best diagnosis for identify-ing devastating earthquakes. Several authors (Aoi et al.2000; Rydelek and Horiuchi 2005; Zollo et al. 2006;Rydelek et al. 2007) pointed out the limited data set forevents with M>6 from modern seismic networks andtherefore debate the capability of techniques based oninitial P waves for predictions of magnitudes M>5.5. Inaddition, there are critical unresolved issues as towhether the algorithms are capable of capturing theexpected scaling relationship for low and high magnitudessimultaneously.
We attempted to verify the early warning potential of KiK-Net seismograms based on the predominant period of the firstarriving P wave using “time-frequency analysis” as well as“time-scale analysis” using initial P waves and tested its pre-dictability for EEW systems. “Time-frequency analysis” hasgot its own limitations like resolution. To obtain the betterresolution, we shift from “time-frequency” to “time-scale”analysis. Our analysis with a large data set, if favored positive-ly for time-scale analysis, settled the issue of predictability withrespect to the use of the time-frequency method for large datasets with magnitudes greater than 5.5, based on initial P waves.
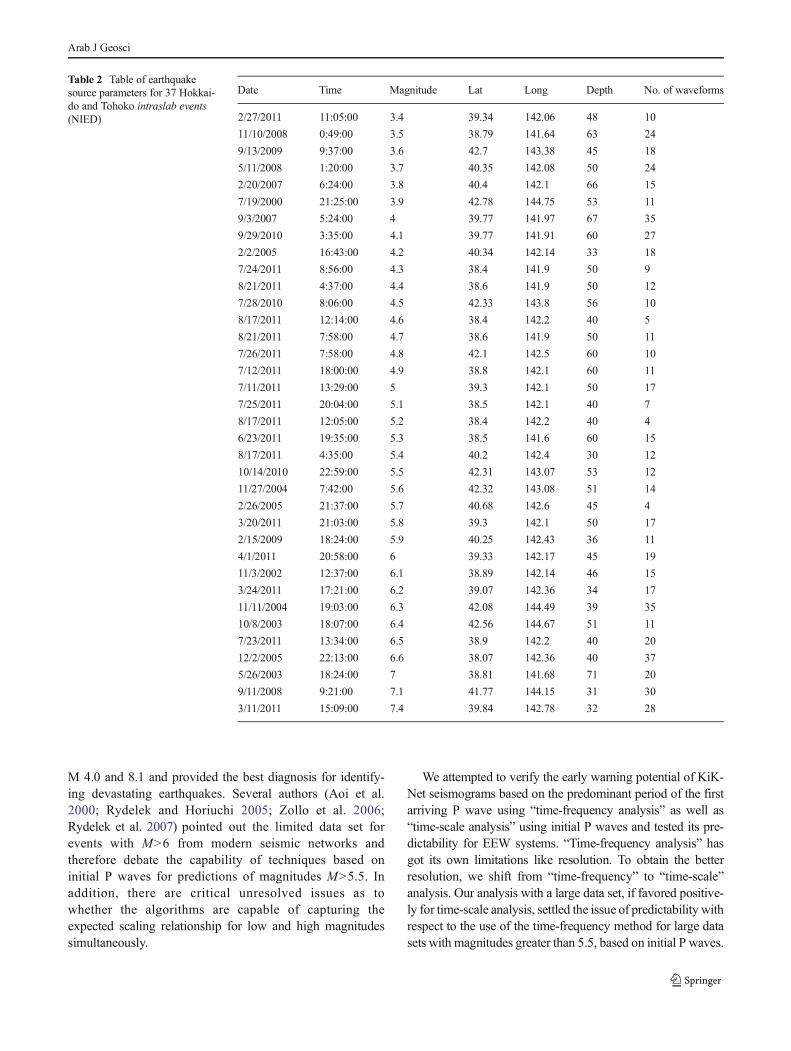
Table 2 Table of earthquakesource parameters for 37 Hokkai-do and Tohoko intraslab events(NIED)
Date Time Magnitude Lat Long Depth No. of waveforms
2/27/2011 11:05:00 3.4 39.34 142.06 48 10
11/10/2008 0:49:00 3.5 38.79 141.64 63 24
9/13/2009 9:37:00 3.6 42.7 143.38 45 18
5/11/2008 1:20:00 3.7 40.35 142.08 50 24
2/20/2007 6:24:00 3.8 40.4 142.1 66 15
7/19/2000 21:25:00 3.9 42.78 144.75 53 11
9/3/2007 5:24:00 4 39.77 141.97 67 35
9/29/2010 3:35:00 4.1 39.77 141.91 60 27
2/2/2005 16:43:00 4.2 40.34 142.14 33 18
7/24/2011 8:56:00 4.3 38.4 141.9 50 9
8/21/2011 4:37:00 4.4 38.6 141.9 50 12
7/28/2010 8:06:00 4.5 42.33 143.8 56 10
8/17/2011 12:14:00 4.6 38.4 142.2 40 5
8/21/2011 7:58:00 4.7 38.6 141.9 50 11
7/26/2011 7:58:00 4.8 42.1 142.5 60 10
7/12/2011 18:00:00 4.9 38.8 142.1 60 11
7/11/2011 13:29:00 5 39.3 142.1 50 17
7/25/2011 20:04:00 5.1 38.5 142.1 40 7
8/17/2011 12:05:00 5.2 38.4 142.2 40 4
6/23/2011 19:35:00 5.3 38.5 141.6 60 15
8/17/2011 4:35:00 5.4 40.2 142.4 30 12
10/14/2010 22:59:00 5.5 42.31 143.07 53 12
11/27/2004 7:42:00 5.6 42.32 143.08 51 14
2/26/2005 21:37:00 5.7 40.68 142.6 45 4
3/20/2011 21:03:00 5.8 39.3 142.1 50 17
2/15/2009 18:24:00 5.9 40.25 142.43 36 11
4/1/2011 20:58:00 6 39.33 142.17 45 19
11/3/2002 12:37:00 6.1 38.89 142.14 46 15
3/24/2011 17:21:00 6.2 39.07 142.36 34 17
11/11/2004 19:03:00 6.3 42.08 144.49 39 35
10/8/2003 18:07:00 6.4 42.56 144.67 51 11
7/23/2011 13:34:00 6.5 38.9 142.2 40 20
12/2/2005 22:13:00 6.6 38.07 142.36 40 37
5/26/2003 18:24:00 7 38.81 141.68 71 20
9/11/2008 9:21:00 7.1 41.77 144.15 31 30
3/11/2011 15:09:00 7.4 39.84 142.78 32 28
Arab J Geosci
Data
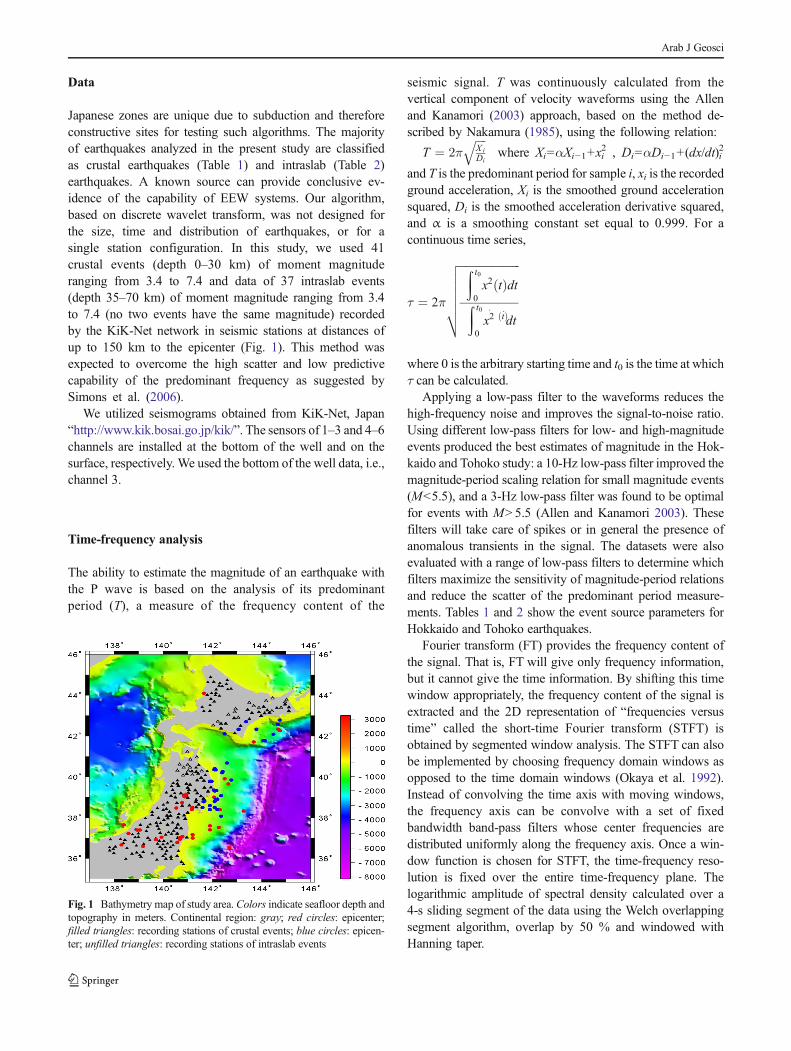
Japanese zones are unique due to subduction and thereforeconstructive sites for testing such algorithms. The majorityof earthquakes analyzed in the present study are classifiedas crustal earthquakes (Table 1) and intraslab (Table 2)earthquakes. A known source can provide conclusive ev-idence of the capability of EEW systems. Our algorithm,based on discrete wavelet transform, was not designed forthe size, time and distribution of earthquakes, or for asingle station configuration. In this study, we used 41crustal events (depth 0–30 km) of moment magnituderanging from 3.4 to 7.4 and data of 37 intraslab events(depth 35–70 km) of moment magnitude ranging from 3.4to 7.4 (no two events have the same magnitude) recordedby the KiK-Net network in seismic stations at distances ofup to 150 km to the epicenter (Fig. 1). This method wasexpected to overcome the high scatter and low predictivecapability of the predominant frequency as suggested bySimons et al. (2006).
We utilized seismograms obtained from KiK-Net, Japan“http://www.kik.bosai.go.jp/kik/”. The sensors of 1–3 and 4–6channels are installed at the bottom of the well and on thesurface, respectively. We used the bottom of the well data, i.e.,channel 3.
Time-frequency analysis
The ability to estimate the magnitude of an earthquake withthe P wave is based on the analysis of its predominantperiod (T), a measure of the frequency content of the
seismic signal. T was continuously calculated from thevertical component of velocity waveforms using the Allenand Kanamori (2003) approach, based on the method de-scribed by Nakamura (1985), using the following relation:
T ¼ 2πffiffiffiffiX iDi
q
where Xi=αXi−1+xi2 , Di=αDi−1+(dx/dt)i
2
and T is the predominant period for sample i, xi is the recordedground acceleration, Xi is the smoothed ground accelerationsquared, Di is the smoothed acceleration derivative squared,and α is a smoothing constant set equal to 0.999. For acontinuous time series,
τ ¼ 2π
ffiffiffiffiffiffiffiffiffiffiffiffiffiffiffiffiffiffiffiffiffiffiZ t0
0x2 tð Þdt
Z t0
0x2⋅
tð Þ⋅dt
vuuuuut
where 0 is the arbitrary starting time and t0 is the time at whichτ can be calculated.
Applying a low-pass filter to the waveforms reduces thehigh-frequency noise and improves the signal-to-noise ratio.Using different low-pass filters for low- and high-magnitudeevents produced the best estimates of magnitude in the Hok-kaido and Tohoko study: a 10-Hz low-pass filter improved themagnitude-period scaling relation for small magnitude events(M<5.5), and a 3-Hz low-pass filter was found to be optimalfor events with M>5.5 (Allen and Kanamori 2003). Thesefilters will take care of spikes or in general the presence ofanomalous transients in the signal. The datasets were alsoevaluated with a range of low-pass filters to determine whichfilters maximize the sensitivity of magnitude-period relationsand reduce the scatter of the predominant period measure-ments. Tables 1 and 2 show the event source parameters forHokkaido and Tohoko earthquakes.
Fourier transform (FT) provides the frequency content ofthe signal. That is, FT will give only frequency information,but it cannot give the time information. By shifting this timewindow appropriately, the frequency content of the signal isextracted and the 2D representation of “frequencies versustime” called the short-time Fourier transform (STFT) isobtained by segmented window analysis. The STFT can alsobe implemented by choosing frequency domain windows asopposed to the time domain windows (Okaya et al. 1992).Instead of convolving the time axis with moving windows,the frequency axis can be convolve with a set of fixedbandwidth band-pass filters whose center frequencies aredistributed uniformly along the frequency axis. Once a win-dow function is chosen for STFT, the time-frequency reso-lution is fixed over the entire time-frequency plane. Thelogarithmic amplitude of spectral density calculated over a4-s sliding segment of the data using the Welch overlappingsegment algorithm, overlap by 50 % and windowed withHanning taper.
Fig. 1 Bathymetry map of study area. Colors indicate seafloor depth andtopography in meters. Continental region: gray; red circles: epicenter;filled triangles: recording stations of crustal events; blue circles: epicen-ter; unfilled triangles: recording stations of intraslab events
Arab J Geosci
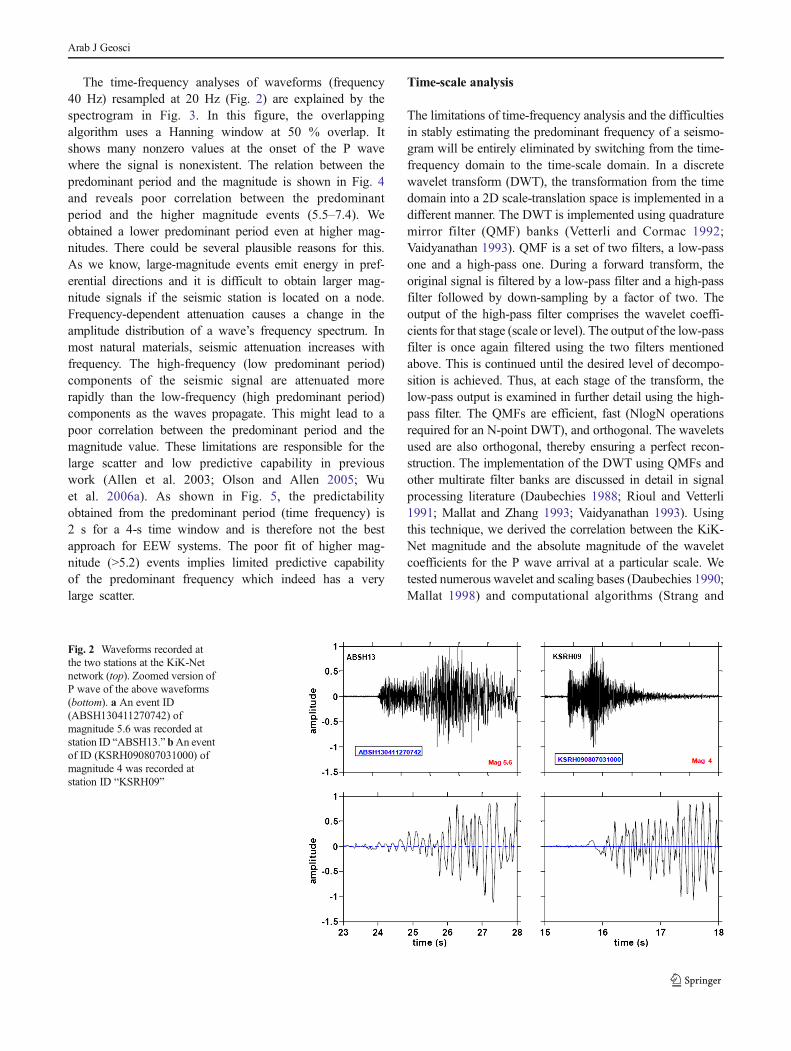
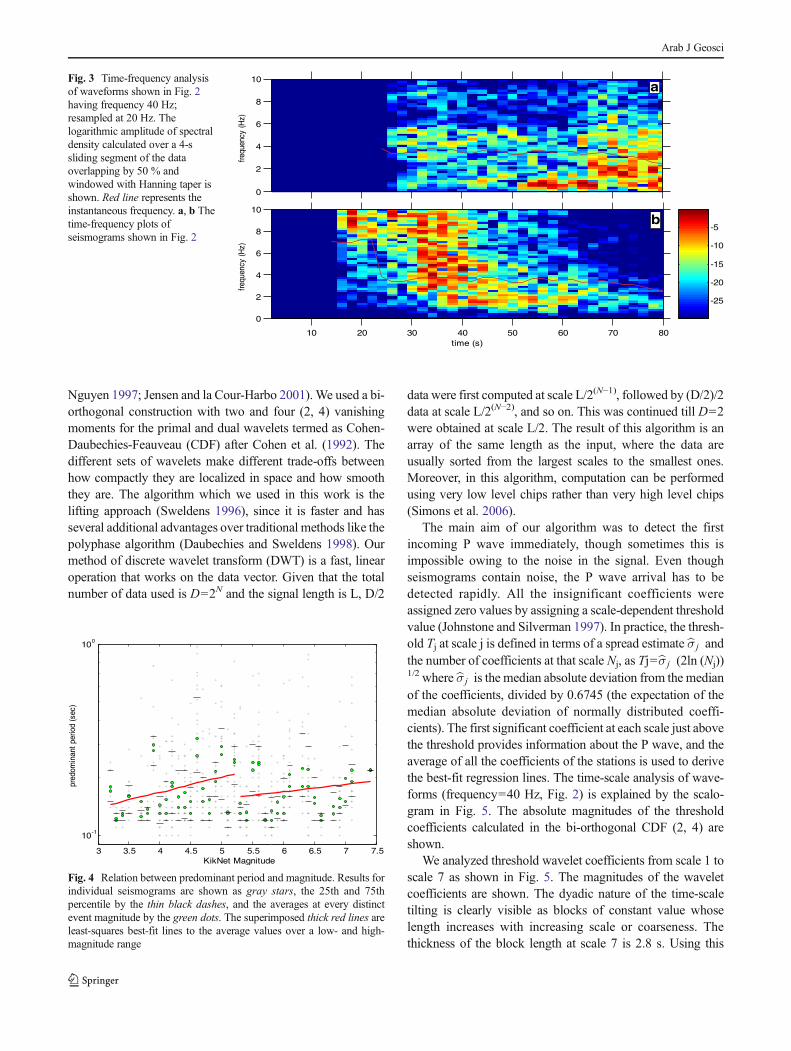
The time-frequency analyses of waveforms (frequency40 Hz) resampled at 20 Hz (Fig. 2) are explained by thespectrogram in Fig. 3. In this figure, the overlappingalgorithm uses a Hanning window at 50 % overlap. Itshows many nonzero values at the onset of the P wavewhere the signal is nonexistent. The relation between thepredominant period and the magnitude is shown in Fig. 4and reveals poor correlation between the predominantperiod and the higher magnitude events (5.5–7.4). Weobtained a lower predominant period even at higher mag-nitudes. There could be several plausible reasons for this.As we know, large-magnitude events emit energy in pref-erential directions and it is difficult to obtain larger mag-nitude signals if the seismic station is located on a node.Frequency-dependent attenuation causes a change in theamplitude distribution of a wave’s frequency spectrum. Inmost natural materials, seismic attenuation increases withfrequency. The high-frequency (low predominant period)components of the seismic signal are attenuated morerapidly than the low-frequency (high predominant period)components as the waves propagate. This might lead to apoor correlation between the predominant period and themagnitude value. These limitations are responsible for thelarge scatter and low predictive capability in previouswork (Allen et al. 2003; Olson and Allen 2005; Wuet al. 2006a). As shown in Fig. 5, the predictabilityobtained from the predominant period (time frequency) is2 s for a 4-s time window and is therefore not the bestapproach for EEW systems. The poor fit of higher mag-nitude (>5.2) events implies limited predictive capabilityof the predominant frequency which indeed has a verylarge scatter.
Time-scale analysis
The limitations of time-frequency analysis and the difficultiesin stably estimating the predominant frequency of a seismo-gram will be entirely eliminated by switching from the time-frequency domain to the time-scale domain. In a discretewavelet transform (DWT), the transformation from the timedomain into a 2D scale-translation space is implemented in adifferent manner. The DWT is implemented using quadraturemirror filter (QMF) banks (Vetterli and Cormac 1992;Vaidyanathan 1993). QMF is a set of two filters, a low-passone and a high-pass one. During a forward transform, theoriginal signal is filtered by a low-pass filter and a high-passfilter followed by down-sampling by a factor of two. Theoutput of the high-pass filter comprises the wavelet coeffi-cients for that stage (scale or level). The output of the low-passfilter is once again filtered using the two filters mentionedabove. This is continued until the desired level of decompo-sition is achieved. Thus, at each stage of the transform, thelow-pass output is examined in further detail using the high-pass filter. The QMFs are efficient, fast (NlogN operationsrequired for an N-point DWT), and orthogonal. The waveletsused are also orthogonal, thereby ensuring a perfect recon-struction. The implementation of the DWT using QMFs andother multirate filter banks are discussed in detail in signalprocessing literature (Daubechies 1988; Rioul and Vetterli1991; Mallat and Zhang 1993; Vaidyanathan 1993). Usingthis technique, we derived the correlation between the KiK-Net magnitude and the absolute magnitude of the waveletcoefficients for the P wave arrival at a particular scale. Wetested numerous wavelet and scaling bases (Daubechies 1990;Mallat 1998) and computational algorithms (Strang and
Fig. 2 Waveforms recorded atthe two stations at the KiK-Netnetwork (top). Zoomed version ofP wave of the above waveforms(bottom). a An event ID(ABSH130411270742) ofmagnitude 5.6 was recorded atstation ID “ABSH13.” bAn eventof ID (KSRH090807031000) ofmagnitude 4 was recorded atstation ID “KSRH09”
Arab J Geosci
Nguyen 1997; Jensen and la Cour-Harbo 2001). We used a bi-orthogonal construction with two and four (2, 4) vanishingmoments for the primal and dual wavelets termed as Cohen-Daubechies-Feauveau (CDF) after Cohen et al. (1992). Thedifferent sets of wavelets make different trade-offs betweenhow compactly they are localized in space and how smooththey are. The algorithm which we used in this work is thelifting approach (Sweldens 1996), since it is faster and hasseveral additional advantages over traditional methods like thepolyphase algorithm (Daubechies and Sweldens 1998). Ourmethod of discrete wavelet transform (DWT) is a fast, linearoperation that works on the data vector. Given that the totalnumber of data used is D=2N and the signal length is L, D/2
data were first computed at scale L/2(N−1), followed by (D/2)/2data at scale L/2(N−2), and so on. This was continued till D=2were obtained at scale L/2. The result of this algorithm is anarray of the same length as the input, where the data areusually sorted from the largest scales to the smallest ones.Moreover, in this algorithm, computation can be performedusing very low level chips rather than very high level chips(Simons et al. 2006).
The main aim of our algorithm was to detect the firstincoming P wave immediately, though sometimes this isimpossible owing to the noise in the signal. Even thoughseismograms contain noise, the P wave arrival has to bedetected rapidly. All the insignificant coefficients wereassigned zero values by assigning a scale-dependent thresholdvalue (Johnstone and Silverman 1997). In practice, the thresh-old Tj at scale j is defined in terms of a spread estimate bσ j andthe number of coefficients at that scale Nj, as Tj=bσ j (2ln (Nj))1/2 where bσ j is the median absolute deviation from the medianof the coefficients, divided by 0.6745 (the expectation of themedian absolute deviation of normally distributed coeffi-cients). The first significant coefficient at each scale just abovethe threshold provides information about the P wave, and theaverage of all the coefficients of the stations is used to derivethe best-fit regression lines. The time-scale analysis of wave-forms (frequency=40 Hz, Fig. 2) is explained by the scalo-gram in Fig. 5. The absolute magnitudes of the thresholdcoefficients calculated in the bi-orthogonal CDF (2, 4) areshown.
We analyzed threshold wavelet coefficients from scale 1 toscale 7 as shown in Fig. 5. The magnitudes of the waveletcoefficients are shown. The dyadic nature of the time-scaletilting is clearly visible as blocks of constant value whoselength increases with increasing scale or coarseness. Thethickness of the block length at scale 7 is 2.8 s. Using this
frequ
ency
(Hz)
a
0
2
4
6
8
10
time (s)
frequ
ency
(Hz)
b
10 20 30 40 50 60 70 80
0
2
4
6
8
10
-25
-20
-15
-10
-5
Fig. 3 Time-frequency analysisof waveforms shown in Fig. 2having frequency 40 Hz;resampled at 20 Hz. Thelogarithmic amplitude of spectraldensity calculated over a 4-ssliding segment of the dataoverlapping by 50 % andwindowed with Hanning taper isshown. Red line represents theinstantaneous frequency. a, b Thetime-frequency plots ofseismograms shown in Fig. 2
3 3.5 4 4.5 5 5.5 6 6.5 7 7.5
10-1
100
KikNet Magnitude
pred
omin
ant p
erio
d (s
ec)
Fig. 4 Relation between predominant period and magnitude. Results forindividual seismograms are shown as gray stars, the 25th and 75thpercentile by the thin black dashes, and the averages at every distinctevent magnitude by the green dots. The superimposed thick red lines areleast-squares best-fit lines to the average values over a low- and high-magnitude range
Arab J Geosci
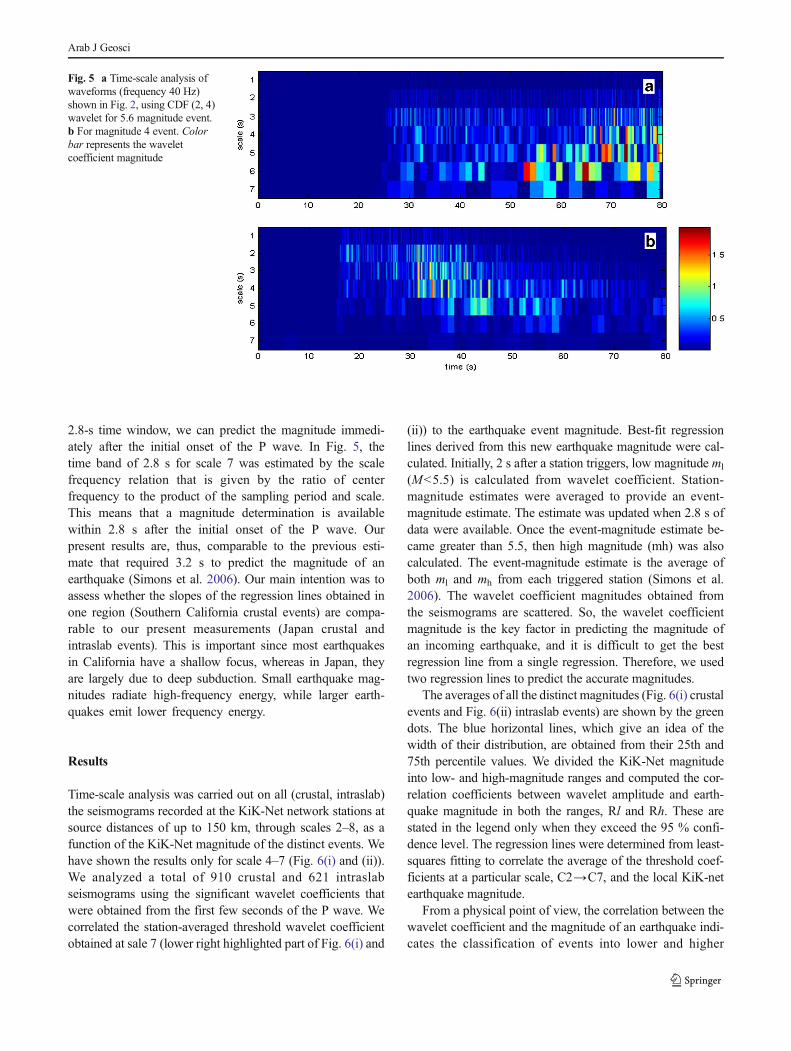
2.8-s time window, we can predict the magnitude immedi-ately after the initial onset of the P wave. In Fig. 5, thetime band of 2.8 s for scale 7 was estimated by the scalefrequency relation that is given by the ratio of centerfrequency to the product of the sampling period and scale.This means that a magnitude determination is availablewithin 2.8 s after the initial onset of the P wave. Ourpresent results are, thus, comparable to the previous esti-mate that required 3.2 s to predict the magnitude of anearthquake (Simons et al. 2006). Our main intention was toassess whether the slopes of the regression lines obtained inone region (Southern California crustal events) are compa-rable to our present measurements (Japan crustal andintraslab events). This is important since most earthquakesin California have a shallow focus, whereas in Japan, theyare largely due to deep subduction. Small earthquake mag-nitudes radiate high-frequency energy, while larger earth-quakes emit lower frequency energy.
Results
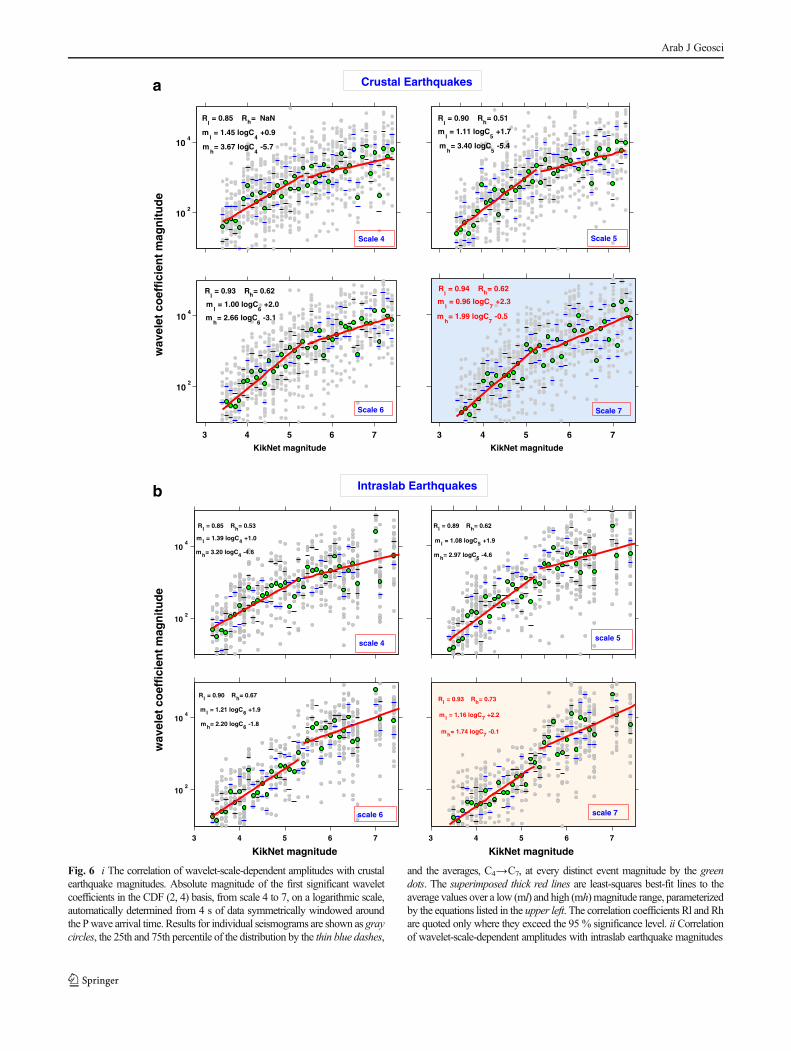
Time-scale analysis was carried out on all (crustal, intraslab)the seismograms recorded at the KiK-Net network stations atsource distances of up to 150 km, through scales 2–8, as afunction of the KiK-Net magnitude of the distinct events. Wehave shown the results only for scale 4–7 (Fig. 6(i) and (ii)).We analyzed a total of 910 crustal and 621 intraslabseismograms using the significant wavelet coefficients thatwere obtained from the first few seconds of the P wave. Wecorrelated the station-averaged threshold wavelet coefficientobtained at sale 7 (lower right highlighted part of Fig. 6(i) and
(ii)) to the earthquake event magnitude. Best-fit regressionlines derived from this new earthquake magnitude were cal-culated. Initially, 2 s after a station triggers, low magnitude ml
(M<5.5) is calculated from wavelet coefficient. Station-magnitude estimates were averaged to provide an event-magnitude estimate. The estimate was updated when 2.8 s ofdata were available. Once the event-magnitude estimate be-came greater than 5.5, then high magnitude (mh) was alsocalculated. The event-magnitude estimate is the average ofboth ml and mh from each triggered station (Simons et al.2006). The wavelet coefficient magnitudes obtained fromthe seismograms are scattered. So, the wavelet coefficientmagnitude is the key factor in predicting the magnitude ofan incoming earthquake, and it is difficult to get the bestregression line from a single regression. Therefore, we usedtwo regression lines to predict the accurate magnitudes.
The averages of all the distinct magnitudes (Fig. 6(i) crustalevents and Fig. 6(ii) intraslab events) are shown by the greendots. The blue horizontal lines, which give an idea of thewidth of their distribution, are obtained from their 25th and75th percentile values. We divided the KiK-Net magnitudeinto low- and high-magnitude ranges and computed the cor-relation coefficients between wavelet amplitude and earth-quake magnitude in both the ranges, Rl and Rh. These arestated in the legend only when they exceed the 95 % confi-dence level. The regression lines were determined from least-squares fitting to correlate the average of the threshold coef-ficients at a particular scale, C2→C7, and the local KiK-netearthquake magnitude.
From a physical point of view, the correlation between thewavelet coefficient and the magnitude of an earthquake indi-cates the classification of events into lower and higher
Fig. 5 a Time-scale analysis ofwaveforms (frequency 40 Hz)shown in Fig. 2, using CDF (2, 4)wavelet for 5.6 magnitude event.b For magnitude 4 event. Colorbar represents the waveletcoefficient magnitude
Arab J Geosci
102
104
Rl = 0.85 Rh= 0.53
ml = 1.39 logC4 +1.0
mh= 3.20 logC4 -4.6
Rl = 0.89 Rh= 0.62
ml = 1.08 logC5 +1.9
mh= 2.97 logC5 -4.6
3 4 5 6 7
102
104
KikNet magnitude
wav
elet
co
effi
cien
t m
agn
itu
de
Rl = 0.90 Rh= 0.67
ml = 1.21 logC6 +1.9
mh= 2.20 logC6 -1.8
3 4 5 6 7
KikNet magnitude
Rl = 0.93 Rh= 0.73
ml = 1.16 logC7 +2.2
mh= 1.74 logC7 -0.1
Intraslab Earthquakes
scale 4scale 5
scale 6 scale 7
102
104
ml = 1.45 logC
4 +0.9
mh= 3.67 logC
4 -5.7
Rl = 0.85 Rh= NaN
ml = 1.11 logC
5 +1.7
mh= 3.40 logC
5 -5.4
Rl = 0.90 R
h= 0.51
3 4 5 6 7
102
104
ml = 1.00 logC
6 +2.0
mh= 2.66 logC
6 -3.1
Rl = 0.93 Rh= 0.62
KikNet magnitude
wav
elet
co
effi
cien
t m
agn
itu
de
3 4 5 6 7
ml = 0.96 logC
7 +2.3
mh= 1.99 logC
7 -0.5
Rl = 0.94 Rh= 0.62
KikNet magnitude
Crustal Earthquakes
Scale 7
Scale 4 Scale 5
Scale 6
a
b
Fig. 6 i The correlation of wavelet-scale-dependent amplitudes with crustalearthquake magnitudes. Absolute magnitude of the first significant waveletcoefficients in the CDF (2, 4) basis, from scale 4 to 7, on a logarithmic scale,automatically determined from 4 s of data symmetrically windowed aroundthe Pwave arrival time. Results for individual seismograms are shown as graycircles, the 25th and 75th percentile of the distribution by the thin blue dashes,
and the averages, C4→C7, at every distinct event magnitude by the greendots. The superimposed thick red lines are least-squares best-fit lines to theaverage values over a low (ml) and high (mh)magnitude range, parameterizedby the equations listed in the upper left. The correlation coefficients Rl and Rhare quoted only where they exceed the 95 % significance level. ii Correlationof wavelet-scale-dependent amplitudes with intraslab earthquake magnitudes
Arab J Geosci
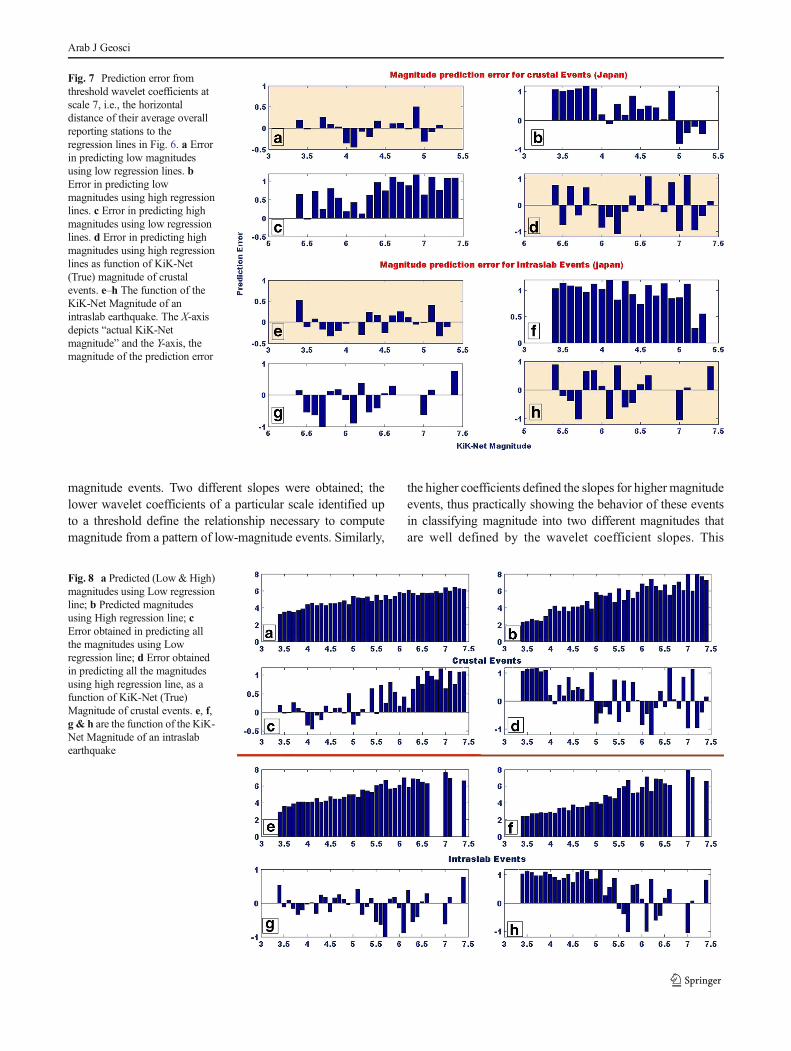
magnitude events. Two different slopes were obtained; thelower wavelet coefficients of a particular scale identified upto a threshold define the relationship necessary to computemagnitude from a pattern of low-magnitude events. Similarly,
the higher coefficients defined the slopes for higher magnitudeevents, thus practically showing the behavior of these eventsin classifying magnitude into two different magnitudes thatare well defined by the wavelet coefficient slopes. This
Fig. 8 a Predicted (Low & High)magnitudes using Low regressionline; b Predicted magnitudesusing High regression line; cError obtained in predicting allthe magnitudes using Lowregression line; d Error obtainedin predicting all the magnitudesusing high regression line, as afunction of KiK-Net (True)Magnitude of crustal events. e, f,g & h are the function of the KiK-Net Magnitude of an intraslabearthquake
Fig. 7 Prediction error fromthreshold wavelet coefficients atscale 7, i.e., the horizontaldistance of their average overallreporting stations to theregression lines in Fig. 6. a Errorin predicting low magnitudesusing low regression lines. bError in predicting lowmagnitudes using high regressionlines. c Error in predicting highmagnitudes using low regressionlines. d Error in predicting highmagnitudes using high regressionlines as function of KiK-Net(True) magnitude of crustalevents. e–h The function of theKiK-Net Magnitude of anintraslab earthquake. The X-axisdepicts “actual KiK-Netmagnitude” and the Y-axis, themagnitude of the prediction error
Arab J Geosci
procedure is always statistical at best, and researchers are nowtrying to find physical mechanisms to explain this behavior—if at all they exist.
Summary and discussion: error estimation and truemagnitude prediction
The error with which the magnitude can be predicted variesacross the scales. Figure 6(i) and (ii) shows that a significantcorrelation exists between the station-averaged thresholdwavelet coefficients and the event magnitude (low and highrange) at scale 7. This scale is most promising when makingquick event-magnitude determinations directly from the seis-mogramwithin the first 2.5 s. Since the coefficients at all scalesj≤7 are known when the computation is carried out to this
largest scale, any or all of the linear regression lines may beused to provide an estimate of the event magnitude from thestation-averaged coefficients. The excellent predictive capabil-ity of the thresholded wavelet coefficients from scale 7 only isillustrated for all the events in Fig. 6(i) and (ii). We infer that aslong as the incoming records consist only of random noise, thewavelet coefficients are unlikely to be significant and wouldexceed the defined thresholds, though if any or all of them do,an event may be considered detected. An average is formedover all detecting stations of the absolute value of the firstsignificant wavelet coefficient at the seventh scale: this quan-tity, C7 is diagnostic of the event magnitude.
After obtaining the two better fit regression line for bothlow-magnitude (ml) and high-magnitude (mh) ranges(Fig. 6(i) and (ii)), we predicted all the magnitudes (3.4–7.4)from low and as well as from high regression lines (Fig. 8a, b,
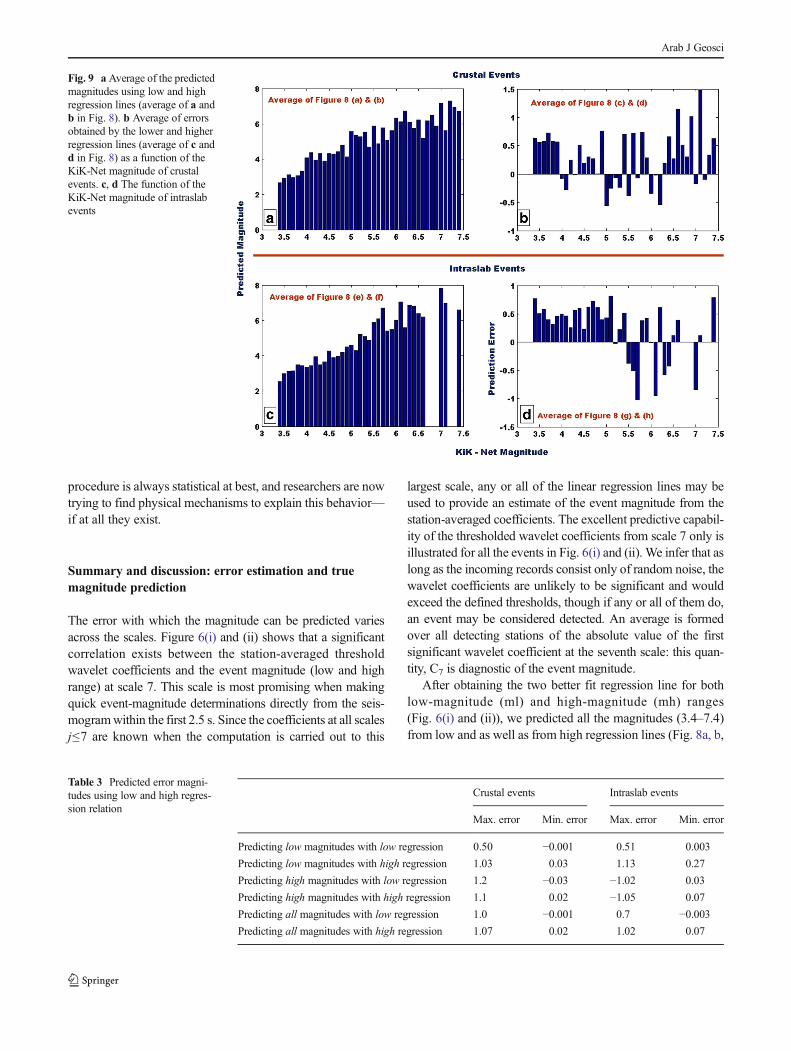
Table 3 Predicted error magni-tudes using low and high regres-sion relation
Crustal events Intraslab events
Max. error Min. error Max. error Min. error
Predicting low magnitudes with low regression 0.50 −0.001 0.51 0.003
Predicting low magnitudes with high regression 1.03 0.03 1.13 0.27
Predicting high magnitudes with low regression 1.2 −0.03 −1.02 0.03
Predicting high magnitudes with high regression 1.1 0.02 −1.05 0.07
Predicting all magnitudes with low regression 1.0 −0.001 0.7 −0.003Predicting all magnitudes with high regression 1.07 0.02 1.02 0.07
Fig. 9 aAverage of the predictedmagnitudes using low and highregression lines (average of a andb in Fig. 8). b Average of errorsobtained by the lower and higherregression lines (average of c andd in Fig. 8) as a function of theKiK-Net magnitude of crustalevents. c, d The function of theKiK-Net magnitude of intraslabevents
Arab J Geosci
e, f) subsequently subtracted the predicted magnitudes obtain-ed from both lower and higher regression lines with the actualKiK-Net magnitude to obtain the prediction error. These errorsand predicted magnitudes have been plotted as a function ofactual KiK-Net magnitude (Fig. 8). We then obtained theaverage of the magnitudes predicted from lower and higherregression and average error as a function of actual KiK-Netmagnitude (Fig. 9). From Fig. 9b, d, it can be observed that theaverage of the low and high regression lines ensures less errorand more predictive capability of the incoming magnitude. Inthis study, we also tested whether it is possible to predict highmagnitudes using lower regression lines and low magnitudesusing high regression lines (Fig. 7). We have also shown thatour method predicts the true magnitude within approximatelyone unit magnitude error (Figs. 8 and 9). The negative sign inerror magnitude (Table 3) indicates the overpredicted earth-quake events. The predictions in Table 3 lead us to understandthat we can predict the magnitude of an incoming earthquakeusing either low or high regression. However, predicting lowmagnitudes with low regression relation and high magnitudeswith high regression relation ensures more accuracy, mini-mum error, and maximum predictive capability.
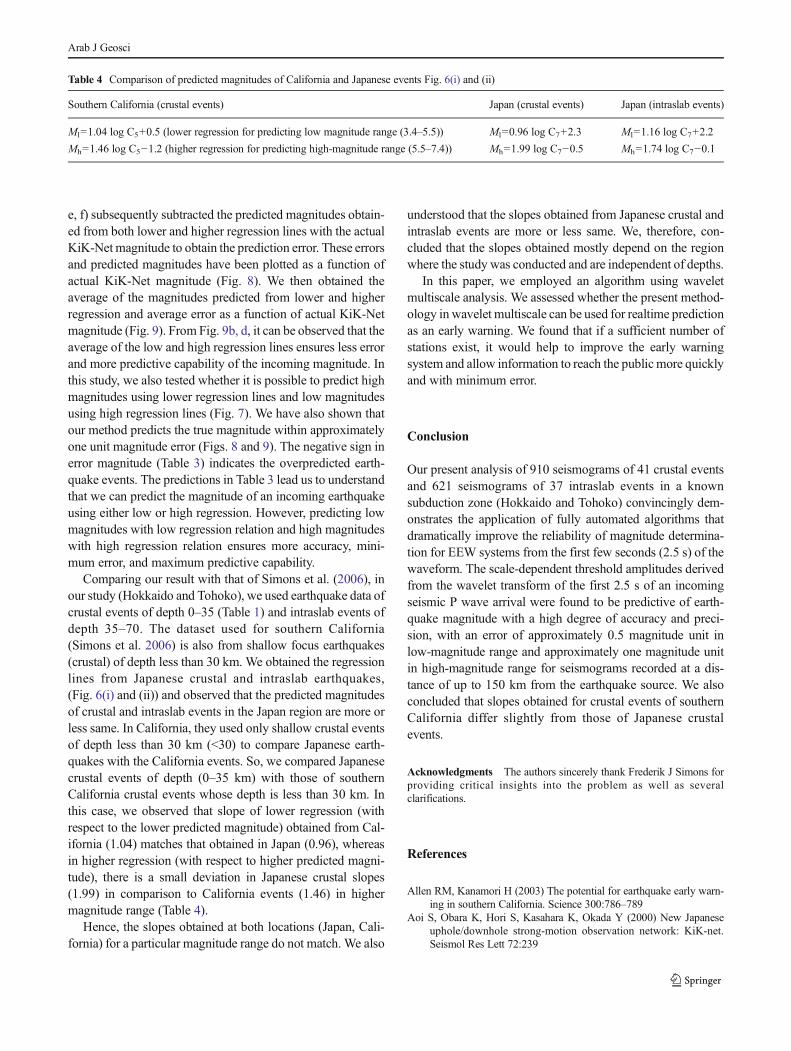
Comparing our result with that of Simons et al. (2006), inour study (Hokkaido and Tohoko), we used earthquake data ofcrustal events of depth 0–35 (Table 1) and intraslab events ofdepth 35–70. The dataset used for southern California(Simons et al. 2006) is also from shallow focus earthquakes(crustal) of depth less than 30 km. We obtained the regressionlines from Japanese crustal and intraslab earthquakes,(Fig. 6(i) and (ii)) and observed that the predicted magnitudesof crustal and intraslab events in the Japan region are more orless same. In California, they used only shallow crustal eventsof depth less than 30 km (<30) to compare Japanese earth-quakes with the California events. So, we compared Japanesecrustal events of depth (0–35 km) with those of southernCalifornia crustal events whose depth is less than 30 km. Inthis case, we observed that slope of lower regression (withrespect to the lower predicted magnitude) obtained from Cal-ifornia (1.04) matches that obtained in Japan (0.96), whereasin higher regression (with respect to higher predicted magni-tude), there is a small deviation in Japanese crustal slopes(1.99) in comparison to California events (1.46) in highermagnitude range (Table 4).
Hence, the slopes obtained at both locations (Japan, Cali-fornia) for a particular magnitude range do not match. We also
understood that the slopes obtained from Japanese crustal andintraslab events are more or less same. We, therefore, con-cluded that the slopes obtained mostly depend on the regionwhere the study was conducted and are independent of depths.
In this paper, we employed an algorithm using waveletmultiscale analysis. We assessed whether the present method-ology in wavelet multiscale can be used for realtime predictionas an early warning. We found that if a sufficient number ofstations exist, it would help to improve the early warningsystem and allow information to reach the public more quicklyand with minimum error.
Conclusion
Our present analysis of 910 seismograms of 41 crustal eventsand 621 seismograms of 37 intraslab events in a knownsubduction zone (Hokkaido and Tohoko) convincingly dem-onstrates the application of fully automated algorithms thatdramatically improve the reliability of magnitude determina-tion for EEW systems from the first few seconds (2.5 s) of thewaveform. The scale-dependent threshold amplitudes derivedfrom the wavelet transform of the first 2.5 s of an incomingseismic P wave arrival were found to be predictive of earth-quake magnitude with a high degree of accuracy and preci-sion, with an error of approximately 0.5 magnitude unit inlow-magnitude range and approximately one magnitude unitin high-magnitude range for seismograms recorded at a dis-tance of up to 150 km from the earthquake source. We alsoconcluded that slopes obtained for crustal events of southernCalifornia differ slightly from those of Japanese crustalevents.
Acknowledgments The authors sincerely thank Frederik J Simons forproviding critical insights into the problem as well as severalclarifications.
References
Allen RM, Kanamori H (2003) The potential for earthquake early warn-ing in southern California. Science 300:786–789
Aoi S, Obara K, Hori S, Kasahara K, Okada Y (2000) New Japaneseuphole/downhole strong-motion observation network: KiK-net.Seismol Res Lett 72:239
Table 4 Comparison of predicted magnitudes of California and Japanese events Fig. 6(i) and (ii)
Southern California (crustal events) Japan (crustal events) Japan (intraslab events)
Ml=1.04 log C5+0.5 (lower regression for predicting low magnitude range (3.4–5.5)) Ml=0.96 log C7+2.3 Ml=1.16 log C7+2.2
Mh=1.46 log C5−1.2 (higher regression for predicting high-magnitude range (5.5–7.4)) Mh=1.99 log C7−0.5 Mh=1.74 log C7−0.1
Arab J Geosci
Cohen A, Daubechies I, Feauveau J (1992) Bi-orthogonal bases ofcompactly supported wavelets. Comm Pure Appl Math 45:485–560
Daubechies I (1988) Orthonormal bases of compactly supported wave-lets. Comm Pure Appl Math 41:909–996
Daubechies I (1990) The wavelet transform time-frequency localizationand signal analysis. IEEE Trans Inf Theory 36(5):961–1005
Daubechies I, Sweldens W (1998) Factoring wavelet transforms intolifting steps. J Fourier Anal Appl 4(3):247–269
Horiuchi S, Negishi H, Abe K, Kamimura A, Fujinawa Y (2005) Anautomatic processing system for broadcasting earthquake alarms.Bull Seism Soc Am 95:708–718
Jensen A, la Cour-Harbo (2001) Ripples in mathematics. Springer, BerlinJohnstone IM, Silverman BW (1997) Wavelet threshold estimators for
data with correlated noise. J R Stat Soc Ser B 59(2):319–351Kamigaichi O (2004) JMA earthquake early warning. J Jpn Assoc Earthq
Eng 4:134–137Lockman AB, Allen RM (2005) Single-station earthquake character-
ization for early warning. Bull Seismol Soc Am 95(6):2029–2039
Mallat S (1998) Awavelet tour of signal processing. Academic, San DiegoMallat S, Zhang Z (1993) Matching pursuits with time-frequency dictio-
naries. IEEE Trans Signal Process 41:3397–3415McGuire JJ, Simons FJ, Collins JA (2008) Analysis of seafloor
seismograms of the 2003 Tokachi-Oki earthquake sequence forearthquake early warning. Geophys Res Lett 35, L14310
Nakamura Y (1985) Earthquake warning system of Japanese nationalrailways (in Japanese). Railw Technol 42(10):371–376
Odaka T, Ashiya K, Tsukada S, Sato S, Ohtake K, Nozaka D (2003)A new method of quickly estimating epicentral distance andmagnitude from a single seismic record. Bull Seism Soc Am93:526–532
Okaya D, Karageorgi E, McEvilly T, Malin P (1992) Removing vibrator-induced correlation artifacts by filtering in frequency-uncorrelatedtime space. Geophysics 57:916–926
Olson EL, Allen RM (2005) The deterministic nature of earthquakerupture. Nature 438:212–214
Rioul O, Vetterli M (1991) Wavelets and signal processing. IEEE SignalProc Mag 11:14–38
Rydelek P, Horiuchi S (2005) Earth science: is earthquake rupture deter-ministic? Nature 438(7065):212–215
Rydelek P, Wu C, Horiuchi S (2007) Comment on “earthquake magni-tude estimation from peak amplitudes of very early seismic signalson strongmotion records” byAldo Zollo, Maria Lancieri, and StefanNielsen. Geophys Res Lett 34:L20302
Simons FJ, Dando DE, Allen RM (2006) Automatic detection and rapiddetermination of earthquake magnitude by wavelet multiscale anal-ysis of the primary arrival. Earth Planet Sci Lett 250(1–2):214–223
Strang G, Nguyen T (1997) Wavelets and filter banks, 2nd edn.Wellesley-Cambridge, Wellesley
Sweldens W (1996) The lifting scheme: a custom-design construction ofbi-orthogonal wavelets. Appl Comput Harmon Anal 3(2):186–200
Vaidyanathan P (1993) Multirate systems and filter banks. Prentice HallVetterli M, Cormac H (1992) Wavelets and filter banks: theory and
design. IEEE Trans Signal Proc 40:2207–2231Wu YM, Teng TL (2002) A virtual sub-network approach to earthquake
early warning. Bull Seism Soc Am 92:2008–2018WuYM, Hsiao NC, LeeWHK, Teng TL, Shin TC (2006a) State of the art
and progresses of early warning system in Taiwan. In: Gasparini P,Manfredi G, Zschau J (eds) Seismic early warning, in press.Springer, Berlin
Zollo A, Lancieri M, Nielsen S (2006) Earthquake magnitude estimationfrom peak amplitudes of very early seismic signals on strong motionrecords. Geophys Res Lett 33, L23312
Arab J Geosci