Embed Size (px)
Citation preview

Report No. CDOT-2011-3
Final Report
ASSESSMENT OF COLORADO
DEPARTMENT OF TRANSPORTATION
REST AREAS FOR SUSTAINABILITY
IMPROVEMENTS AND HIGHWAY
CORRIDORS AND FACILITIES FOR
ALTERNATIVE ENERGY SOURCE USE
Rick Kreminski
Arthur Hirsch
Jane Boand
March 2011
COLORADO DEPARTMENT OF TRANSPORTATION
DTD APPLIED RESEARCH AND INNOVATION BRANCH

The contents of this report reflect the views of the
author(s), who is (are) responsible for the facts and
accuracy of the data presented herein. The contents
do not necessarily reflect the official views of the
Colorado Department of Transportation or the
Federal Highway Administration. This report does
not constitute a standard, specification or regulation.
i
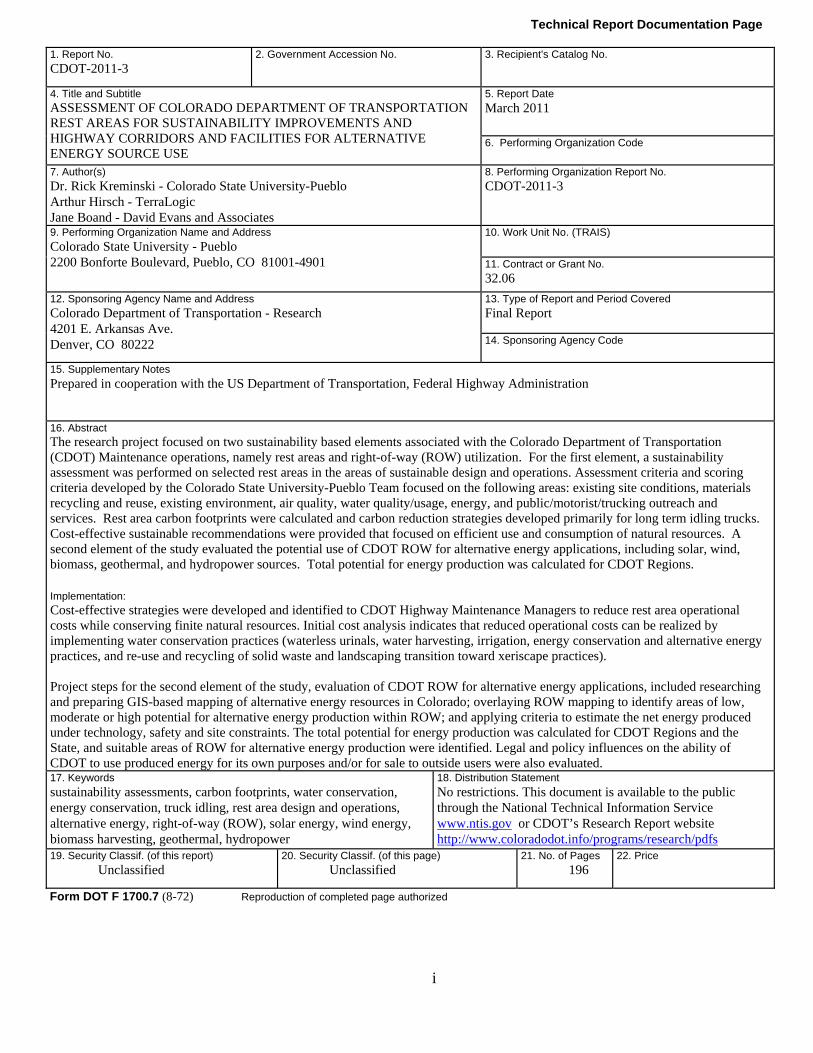
Technical Report Documentation Page
1. Report No.
CDOT-2011-3 2. Government Accession No.
3. Recipient's Catalog No.
4. Title and Subtitle ASSESSMENT OF COLORADO DEPARTMENT OF TRANSPORTATION REST AREAS FOR SUSTAINABILITY IMPROVEMENTS AND HIGHWAY CORRIDORS AND FACILITIES FOR ALTERNATIVE ENERGY SOURCE USE
5. Report Date
March 2011
6. Performing Organization Code
7. Author(s)
Dr. Rick Kreminski - Colorado State University-Pueblo Arthur Hirsch - TerraLogic Jane Boand - David Evans and Associates
8. Performing Organization Report No.
CDOT-2011-3
9. Performing Organization Name and Address
Colorado State University - Pueblo 2200 Bonforte Boulevard, Pueblo, CO 81001-4901
10. Work Unit No. (TRAIS)
11. Contract or Grant No.
32.06
12. Sponsoring Agency Name and Address
Colorado Department of Transportation - Research 4201 E. Arkansas Ave. Denver, CO 80222
13. Type of Report and Period Covered
Final Report
14. Sponsoring Agency Code
15. Supplementary Notes
Prepared in cooperation with the US Department of Transportation, Federal Highway Administration
16. Abstract The research project focused on two sustainability based elements associated with the Colorado Department of Transportation (CDOT) Maintenance operations, namely rest areas and right-of-way (ROW) utilization. For the first element, a sustainability assessment was performed on selected rest areas in the areas of sustainable design and operations. Assessment criteria and scoring criteria developed by the Colorado State University-Pueblo Team focused on the following areas: existing site conditions, materials recycling and reuse, existing environment, air quality, water quality/usage, energy, and public/motorist/trucking outreach and services. Rest area carbon footprints were calculated and carbon reduction strategies developed primarily for long term idling trucks. Cost-effective sustainable recommendations were provided that focused on efficient use and consumption of natural resources. A second element of the study evaluated the potential use of CDOT ROW for alternative energy applications, including solar, wind, biomass, geothermal, and hydropower sources. Total potential for energy production was calculated for CDOT Regions. Implementation: Cost-effective strategies were developed and identified to CDOT Highway Maintenance Managers to reduce rest area operational costs while conserving finite natural resources. Initial cost analysis indicates that reduced operational costs can be realized by implementing water conservation practices (waterless urinals, water harvesting, irrigation, energy conservation and alternative energy practices, and re-use and recycling of solid waste and landscaping transition toward xeriscape practices). Project steps for the second element of the study, evaluation of CDOT ROW for alternative energy applications, included researching and preparing GIS-based mapping of alternative energy resources in Colorado; overlaying ROW mapping to identify areas of low, moderate or high potential for alternative energy production within ROW; and applying criteria to estimate the net energy produced under technology, safety and site constraints. The total potential for energy production was calculated for CDOT Regions and the State, and suitable areas of ROW for alternative energy production were identified. Legal and policy influences on the ability of CDOT to use produced energy for its own purposes and/or for sale to outside users were also evaluated. 17. Keywords
sustainability assessments, carbon footprints, water conservation, energy conservation, truck idling, rest area design and operations, alternative energy, right-of-way (ROW), solar energy, wind energy, biomass harvesting, geothermal, hydropower
18. Distribution Statement
No restrictions. This document is available to the public through the National Technical Information Service www.ntis.gov or CDOT’s Research Report website http://www.coloradodot.info/programs/research/pdfs
19. Security Classif. (of this report)
Unclassified 20. Security Classif. (of this page)
Unclassified 21. No. of Pages
196 22. Price
Form DOT F 1700.7 (8-72) Reproduction of completed page authorized
ii
ASSESSMENT OF COLORADO DEPARTMENT OF TRANSPORTATION REST AREAS FOR
SUSTAINABILITY IMPROVEMENTS AND HIGHWAY CORRIDORS AND FACILITIES FOR ALTERNATIVE
ENERGY SOURCE USE
Report No. CDOT-2011-3
Prepared by
Colorado State University – Pueblo Dr. Rick Kreminski, Dean, College of Science and Mathematics
2200 Bonforte Boulevard Pueblo, Colorado 81001
TerraLogic, LLC
Mr. Arthur H. Hirsch, Vice President Operations 5766 Flagstaff Road
Boulder, Colorado 80302
David Evans and Associates Ms. Jane Boand, Senior Associate/Senior Planner
1331 17th Street, Suite 900 Denver, Colorado 80202
Sponsored by the
Colorado Department of Transportation
In Cooperation with the U.S. Department of Transportation Federal Highway Administration
March 15, 2011
Colorado Department of Transportation DTD Applied Research and Innovation Branch
4201 E. Arkansas Ave. Denver, CO 80222
iii
ACKNOWLEDGEMENTS
The authors would like to thank the following individuals for their help with this research study. Study Panel Members:
Vanessa Henderson, Project Manager, CDOT Research Branch Yates Oppermann, CDOT Environmental Programs Branch Jill Schlaefer, CDOT Environmental Programs Branch Jeff Sudmeier, CDOT Multimodal Planning Branch Terri Tiehan, CDOT Region 1 Planning and Environmental Dave Wieder, CDOT Maintenance and Operations
Rest Area Contacts:
April Thomas/Mike DeLong, Vail Pass Rest Area (Vail Pass-Region 1) Robert Trujillo/Jeff VanMatre, El Moro Rest Area (Trinidad-Region 2) Dave Schultz/Mike Goolsby, Hanging Lake Rest Area (Glenwood Canyon-Region 3) Tom Lujan/Ed Stieber, Poudre Rest Area (Fort Collins-Region 4) Victor Romero/Ed Stieber, Sterling Rest Area (Sterling-Region 4) Edward Olguin/Kyle Lester, Sleeping Ute Mountain Rest Area (Cortez-Region 5)
Energy Performance Contract Contacts:
Joe Mahoney, CDOT Facilities Gene Trujillo, CDOT Facilities Jamie Given, Johnson Controls D.J. Hubler, Johnson Controls Wisit Kumphai, Johnson Controls Nicole Stennes, Johnson Controls Steve Truebner, Johnson Controls
CSU-Pueblo Administrator and Students: Dr. Hector Carrasco, Dean of the College of Education, Engineering and Professional
Studies Mr. Kerwin Nance, graduate student Mr. Benjamin Schleich, graduate student Ms. Kimberly Schott, graduate student Mr. Lionel Toba, graduate student Mr. Ayman Hama, graduate student
Dr. Carrasco and Mr. Nance provided assistance early in this project; Mr. Schleich provided assistance with a portion of the rest area analysis towards the end of this project; Ms. Schott provided extensive assistance with the rest area analysis; Mr.Toba provided extensive assistance with the right-of-way analysis; and Mr. Hama provided extensive assistance with both the right-of-way and rest area analyses.

iv
EXECUTIVE SUMMARY
The functional and amenity expectations of rest areas by the public have substantially grown
over the past decade. Meeting these expectations and increased safety concerns have resulted in
the addition of features such as high intensity lighting, air conditioning, paving, and grassy areas.
Maintaining and operating these features comes at increased environmental and economic costs.
The first (rest area) purpose of the study is to assess sustainable rest area design and operations
from a representative sample of rest areas in Colorado. In addition, recent federal energy
policies have placed increased emphasis on strategies by federal agencies to reduce greenhouse
gas (GHG) emissions. The State of Colorado has also adopted GHG reduction policies, including
the Governor’s 2007 Climate Action Plan which calls for a 20 percent reduction in GHG
emissions from 2005 levels by 2020 and an 80 percent reduction by 2050. The Colorado
Department of Transportation (CDOT) maintains 9,144 linear miles of roadway right-of-way
(ROW) and numerous other properties including rest areas, maintenance yards, remnant parcels
and offices complexes. However, there is little data on the amount and locations of the ROW that
is potentially suitable for alternative energy production. Lacking such data, CDOT cannot plan
effectively to achieve federal GHG reduction goals or the Colorado Governor’s Energy
Initiative. The second (right-of-way) purpose of this study is to address that gap in information
about ROW for alternative energy production purposes.
Regarding the rest area purpose of this study, Colorado State University - Pueblo (CSU-Pueblo)
was selected by CDOT to perform the sustainability analysis at six rest areas that were selected
as representative of CDOT rest areas designs and operations:
Sterling Rest Area (Visitor Center in Region 4),
Poudre Rest Area (Visitor Center in Region 4),
Vail Pass Rest Area (Recreational Rest Area in Region 1),
Hanging Lake Rest Area (Recreational Rest Area in Region 3),
El Moro Rest Area (Basic Services in Region 2), and
Sleeping Ute Mountain Rest Area (Basic Services in Region 5).

v
Onsite evaluations were performed by the CSU-Pueblo Team in the months of July and August,
2010. The Project Rest Areas were evaluated using a sustainability evaluation checklist that
focused upon the following areas:
Site Conditions – current year round operating conditions and activities of the Project rest
areas
Materials, Recycling and Reuse – solid waste management practices at the Project rest
areas
Environment – existing environmental conditions and harmony with wildlife habitat
Air Quality – identifies activities that could affect air quality at the Project rest areas such
as chemicals used/stored, overnight truck parking, etc.
Water Quality/Usage – identifies the measures taken to protect water quality and
identifies rest area water usage such as for irrigation and restroom services
Energy – energy usage, management practices and costs at the Project rest areas
Public/Motorist/Trucking Outreach and Services – identifies the community involvement
and impacts by the operation and use of the rest area
Using the sustainability scoring method developed for this project, the Vail Pass Rest Area was
identified as the most sustainable rest area based upon existing practices.
Unique to rest area research studies is the development of rest area carbon footprints. The rest
area carbon footprint provides a unique way of reviewing and assessing overall energy
consumption and resulting emissions. The method used by the CSU-Pueblo Team was consistent
with the Greenhouse Gas Protocol (GHGP) established by the World Resource Institute. This
project will provide CDOT environmental personnel, who are responsible for greenhouse gas
management information on the amount of direct and indirect loading that occurs for specific rest
areas and an overall cumulative estimate on greenhouse gas annual loading.
The rest areas have a lot of potential for using alternative energy to power facility operations and
reduce the overall carbon footprint. Many rest areas are located in identified priority areas for
solar energy (direct and passive) and wind. Geothermal energy, using local groundwater as a heat
pump, can potentially reduce energy consumption. Wind energy has the potential of providing
vi
energy to rest areas especially in the plains regions. The use of alternative energy at rest areas
could reduce greenhouse gas emissions and could save CDOT financial resources in the long
term.
This study will provide CDOT with rest area-specific observations and recommendations for
sustainable rest area designs, and operation and maintenance. These recommendations are
provided to help improve the overall environment, conserve finite resources, enhance the visitor
experience, and reduce rest area operational costs.
Regarding the right-of-way purpose of this study, as noted, recent federal energy policies have
placed increased emphasis on strategies by federal agencies to reduce GHG emissions. Executive
Order 13514 (EO 13514) was issued on October 5, 2010 by President Obama with a goal to
“establish an integrated strategy towards sustainability in the Federal Government and to make
reduction of greenhouse gas emissions a priority for Federal agencies.” EO 13514 sets
requirements related to energy efficiency and GHG management that change the way Federal
agencies do business with federal and state partners. Compliance with EO 13514 provides a
strong motivation for agencies including state DOTs to adopt sustainability measures.
The State of Colorado has also adopted GHG reduction policies, including the Governor’s 2007
Climate Action Plan which calls for a 20 percent reduction in GHG emissions from 2005 levels
by 2020 and an 80 percent reduction by 2050. The corresponding Colorado Governor’s Energy
Initiative of 2007 (Executive Orders D011 07 and D012 07) calls for state agencies to reduce
their overall energy use by 20 percent and to reduce state vehicle petroleum consumption by 25
percent in volume by 2012.
CDOT maintains 9,144 linear miles of roadway right-of-way (ROW) and numerous other
properties including rest areas, maintenance yards, remnant parcels and offices complexes.
Colorado’s unique characteristics – more than 300 days of sunshine per year; productive wind
areas; locations of geothermal activity; areas with grasses, timber and crops; and mountainous
areas with fast-moving streams – are conducive to alternative energy production from solar,
wind, geothermal, biomass and hydropower systems. However, there is little data on the amount
vii
and locations of the ROW that are potentially suitable for alternative energy production. Lacking
such data, CDOT cannot plan effectively to achieve federal GHG reduction goals or the
Colorado Governor’s Energy Initiative. The purpose of this study is to address that gap in
information about ROW for alternative energy production purposes.
The basis for selecting the types of alternative energy to be evaluated in this study was a 2009
report by the Colorado Governor’s Task Force on Renewable Resource Generation “Connecting
Colorado’s Renewable Resources to the Markets” which mapped and evaluated Colorado’s
solar, wind, and hydroelectric power, as well as geothermal and biomass resources. Geographic
information system (GIS) data layers for each resource were obtained from the report and the
study team traced the data back to the original source(s). The study team also used the report’s
energy production categories (wind power classes, range of solar power levels, etc.) to maintain
consistency between the reports. Where necessary, area calculations were converted from square
meters to acres.
Maps were prepared for the entire State of Colorado to show the location and distribution of the
resources. For wind and solar resources, mapping was also prepared for each of the six CDOT
Regions to provide more detail on ROW locations and resource distribution. These mapping
steps produced an estimate of the theoretical maximum amount of energy from each energy type
for CDOT. The ROW maps were then overlain with GIS data layers of each alternative energy
resource type (solar, wind, geothermal, biomass, and hydropower) to calculate the total energy
potential within usable CDOT ROW, generally in gigawatt-hours per year (GWh/year).
Criteria were applied to ROW acreage to identify areas accepted for development under existing
constraints. A 50-foot buffer along the edge of pavement was assumed to provide the clear zone
for safety purposes. It was assumed that solar resources could be located beyond the 50-foot
clear zone buffer, while wind turbines would require a minimum 250-foot buffer (50-foot clear
zone plus an additional 200 feet to protect the roadway in the unlikely event of a blade drop).
Because biomass can be harvested without the need for barriers or setbacks, biomass acreage did
not include a 50 foot safety zone from edge of pavement as was assumed for solar and wind

viii
energy. No alternative energy resources would be allowed within the median area per current
CDOT policy.
Right-of-way findings
Solar – Based on the rates of solar insolation (amount of energy received from sunlight per acre
per day) in various areas within Colorado, combined with the ROW acreage in each insolation
level, Colorado ROW receives almost 554,700 giga-watt hours per year (GWh/year) of direct
solar insolation. If 100 percent of this energy was converted to electricity it would meet ten
percent of Colorado’s total electricity demand based on year 2007 consumption rates
(SWEnergy, 2010). However, only approximately ten percent of direct solar insolation is
translated into electricity by current technology, resulting in approximately 55,500 GWh/year
that could be produced from CDOT ROW. This net energy production would meet
approximately 1.0 percent of Colorado’s total 2007 electricity demand.
Wind – Although Colorado does have reliably windy areas, relatively little usable CDOT ROW
is located in those areas. If all usable ROW was devoted to wind energy generation,
approximately 380 GWh/year could be generated statewide (much less than solar). This amount
of energy would meet approximately 0.0001 percent of Colorado’s total electricity demand based
on 2007 consumption rates.
Biomass – Most of the state is capable of producing some amount of biomass from wood, some
grasses, manure and crops including corn. Statewide, an estimated 4,974 tons could be produced
annually on CDOT ROW. This amount of biomass could generate approximately 4.9 GWh/year,
meeting approximately 0.000001 percent of Colorado’s total electricity demand based on 2007
consumption rates.
Geothermal – Research indicates that geothermal resources within Colorado are concentrated in
the south central portion of the state. Statewide, approximately 8,530 acres of ROW are located
in geothermal areas. However, little site-specific data exists on the locations of reliable
geothermal resources. Unless CDOT evaluates specific ROW sites in high-potential areas, the
true potential of ROW for geothermal uses will be largely unknown.
ix
Hydropower – There are currently about 62 operating hydropower facilities in Colorado
producing about five percent of Colorado’s electric energy annually (NREL, 2005). It is unlikely
that existing CDOT roadway ROW contains any existing hydropower facilities and this study did
not attempt to quantify usable acres of ROW for hydropower production. Rather, the study
identified about twelve of the 91 potential hydropower sites that may be located within 1/2 mile
of a CDOT roadway. Such sites could provide electricity through a short transmission line to
CDOT facilities such as rest areas and maintenance buildings, or for roadway lighting and
signals.
Transmission – Although Colorado has thousands of miles of transmission lines, there are large
portions of the state with sparse coverage. Yet, these mostly rural areas can have significant
potential for renewable energy production such as wind, solar and biomass. Without access to
transmission lines, production of such energy may be cost prohibitive.
Several new major transmission lines through Colorado are proposed. The High Plains Express is
a 500 kilovolt (kV) system that is proposed to traverse eastern Colorado from north to south,
crossing large areas undeveloped rural areas. The Eastern Plains Transmission Project would
include about 1,000 miles of new high-voltage lines in eastern Colorado and western Kansas.
These and other new transmission lines would fill gaps in transmission service and allow
connection to a much larger grid from new alternative energy projects on CDOT ROW in rural
eastern and central locations.
Implementation Statement
Regarding the rest area purpose of this study, although the CDOT rest areas are well-maintained
and provide basic services to the traveling public, most rest areas inefficiently consume natural
resources, financial resources, and can have an environmental impact. The following is a
summary of the recommendations:
Truck idling restrictions could be instituted in rest areas to reduce greenhouse gas
emissions and noise. This action could reduce the consumption of fossil fuels.
x
Water conservation studies for irrigation and restroom services could be performed in
order to save in rest area operating costs. Waterless urinals could be considered in many
rest areas.
Most rest areas irrigate landscapes dominated by high water demand, non-native plants
that use routine fertilizer and herbicide applications. Landscaping changes could be taken
to transition to native plant, drought tolerant species.
Recycling efforts at rest areas could be implemented to reduce the amount of solid waste
being managed at the rest area and ultimately being transported to a landfill.
Energy conservation measures should be considered at rest areas for restroom and
parking area lighting, hot water heating, wastewater treatment, and restroom heating.
Stormwater best management practices could be instituted in sensitive environmental
areas to prevent pollutants from entering adjacent stream systems.
Rest area operational data could be made more available to CDOT Maintenance
Management to monitor and manage water, electrical and waste management costs
The recommendations of this study should be evaluated and carried forward by CDOT
Maintenance Management, and the CDOT Sustainability Council. CDOT Maintenance
Superintendents and their staffs should discuss these recommendations in efforts to save
operating costs and reduce natural resource consumption. The results of this study can be carried
forward by CDOT in the following ways:
CDOT Maintenance personnel could start obtaining and reviewing water and electrical
consumption data for rest areas. This will identify specific rest area functions that may
not be operating correctly and need to be modified or replaced.
CDOT Maintenance Management could develop site-specific or regional rest area
sustainability plans in efforts to conserve energy, water, and financial resources and
reduce environmental impacts. Initially standard operating procedures could be reviewed
and modified that will not require large capital cost expenditures.
The CDOT Sustainability Council can help facilitate the implementation of sustainable
recommendations by coordinating with Maintenance Management and funding additional
projects.
xi
The CDOT Maintenance Academy could identify key recommendations and present them
during training sessions.
Regarding the right-of-way purpose of this study, DOT currently has some authority to produce
alternative energy within ROW, but it is limited by state policy that does not recognize
alternative energy sources as ‘utilities’ and does not set guidelines for managing energy
production in ROW areas. While this study estimates potential energy production, more detailed
data would be needed to assist with decisions on changing CDOT policies. Recommendations
include:
Review other states’ policies with regard to alternative energy development, such as
Oregon, Minnesota, Texas and California, to glean information on design standards,
innovative partnerships, and funding mechanisms.
Using the statewide and regional maps, prepare more detailed maps and checklists for
each CDOT Region to confirm the best sites based on additional criteria such as slope,
aspect, tree coverage, vegetation types, etc.
Revise the CDOT Utility Accommodation Policy to recognize alternative energy as a
form of ‘utility’ and to include design requirements such as set-backs, minimum site
densities, height limits, etc. for alternative energy production. Also, revisit the prohibition
on the use of medians for longitudinal utilities.
Build partnerships with private utilities, banks, and private energy developers to act as
future partners for claiming state or federal tax credits, thereby reducing net costs to
CDOT.
Work with the Colorado Public Utility Commission (PUC) and other state agencies to
promote best practices and standards for transmission line siting and interconnections to
existing lines adjacent to CDOT ROW.
Consider one or more ‘pilot programs’ to situate alternative energy on CDOT buildings
or sites such as rest areas, or to allow harvesting of biomass by private operators, and
monitor the produced energy, net reduction in carbon footprint and cost-effectiveness to
CDOT. Involve the public by encouraging public viewing of the pilot program sites and
where possible include live monitoring data on the CDOT website.
xii
TABLE OF CONTENTS
CHAPTER 1. INTRODUCTION (REST AREAS) .................................................................. 1
CHAPTER 2. REST AREA PROJECT GOALS AND OBJECTIVES.................................. 6
CHAPTER 3. REST AREA RESEARCH METHOD .............................................................. 8
CHAPTER 4. REST AREA RESULTS AND DISCUSSION ................................................ 19
4.1 Sterling Rest Area ............................................................................................................... 19
4.2 Poudre Rest Area ................................................................................................................ 27
4.3 Hanging Lake Rest Area ..................................................................................................... 34
4.4 Vail Pass Rest Area ............................................................................................................. 43
4.5 El Moro Rest Area ............................................................................................................. 51
4.6 Sleeping Ute Mountain Rest Area ...................................................................................... 58
CHAPTER 5. REST AREA CONCLUSIONS AND RECOMMENDATIONS .................. 66
5.1 Rest Area Sustainability Scoring ........................................................................................ 66
5.2 Summary of Rest Area Carbon Footprints and Reduction Strategies................................. 69
5.3 Alternative Energy Use for CDOT Rest Areas Using CDOT ROW .................................. 73
5.4 Coordination with Johnson Controls .................................................................................. 73
5.5 Common Project Rest Area Sustainable Observations and Recommendations ................. 74
5.6 Further Rest Area Sustainability Studies and Funding ....................................................... 87
CHAPTER 6. INTRODUCTION (RIGHT-OF-WAY [ROW]) ............................................ 90
6.1 Background ......................................................................................................................... 90
6.2 Method ................................................................................................................................ 92
CHAPTER 7. SOLAR ENERGY ............................................................................................ 95
7.1 Solar Efficiency ................................................................................................................ 105
CHAPTER 8. WIND ENERGY ............................................................................................ 108
CHAPTER 9. BIOMASS ....................................................................................................... 118
CHAPTER 10. GEOTHERMAL .......................................................................................... 121
CHAPTER 11. HYDROPOWER .......................................................................................... 124
CHAPTER 12. TRANSMISSION ......................................................................................... 126
CHAPTER 13. LEGAL AND POLICY CONSIDERATIONS .......................................... 128
CHAPTER 14. POTENTIAL ENERGY PARTNERSHIPS .............................................. 130
CHAPTER 15. RIGHT-OF-WAY FINDINGS AND RECOMMENDATIONS ............... 131
15.1 Findings........................................................................................................................... 131
15.2 Recommendations .......................................................................................................... 133
REFERENCES .......................................................................................................................... 135

xiii
APPENDICES
Appendix A. Colorado Department of Transportation Rest Areas………………………..…A-1 Appendix B. Sustainable Rest Area Field Evaluation Checklist…………………………….B-1 Appendix C. Sustainable Rest Area Database Spreadsheet………………………………….C-1 Appendix D. Sustainability Rest Area Scoring Sheet………………………………………..D-1 Appendix E. Technical Memorandum (August 27, 2010); Rest Area Carbon Footprint Calculations…………………………………………………………………………………....E-1 Appendix F. Cost-Effective Sustainable Strategies………………………………………….F-1 Appendix G. Solid Waste Compaction………………………………………………………G-1 Appendix H. Colorado Rainwater Harvesting Legal Analysis…………………………..…..H-1 Appendix I. Renewable Energy Standards (RES) Background……………………………...I-1

xiv
LIST OF FIGURES
Figure 1. Sterling Rest Area Site Plan ......................................................................................... 21
Figure 2. Sterling Restroom and Visitor Center Entrance ........................................................... 22
Figure 3. Sterling Rest Area Visitor Center Entrance .................................................................. 22
Figure 4. Sterling Rest Area Stormwater Basin ........................................................................... 23
Figure 5. Sterling Rest Area Center Piece Sculpture ................................................................... 23
Figure 6. Poudre Rest Area Site Plan ........................................................................................... 28
Figure 7. Poudre Rest Area Main Entrance ................................................................................. 29
Figure 8. Poudre Rest Area Truck Parking Area ......................................................................... 30
Figure 9. Poudre Rest Area Vegetated Retention Stormwater Management Pond ..................... 33
Figure 10. Poudre Rest Area Natural Lighting in the Main Restroom Entrance Lobby ............. 33
Figure 11. Hanging Lake Rest Area Site Map ............................................................................. 36
Figure 12. Hanging Lake Rest Area Main Entrance and Walk Way near Colorado River ......... 38
Figure 13. Hanging Lake Rest Area Wastewater Treatment System .......................................... 38
Figure 14. Hanging Lake Rest Area Unprotected Stormwater and Vegetated Ditch .................. 39
Figure 15. Hanging Lake Rest Area Mixture of Native and Non-Native Vegetation ................. 39
Figure 16. Vail Pass Rest Area Site Map ..................................................................................... 44
Figure 17. Vail Pass Rest Area Parking Area (looking east) ....................................................... 45
Figure 18. Vail Pass Rest Area Restroom Structure .................................................................... 45
Figure 19. Vail Pass Rest Area Native Grass and Context Sensitive Design .............................. 47
Figure 20. Water Pump From Vail Pass Ten Mile Creek ............................................................ 47
Figure 21. El Moro Rest Area Site Map ...................................................................................... 52
Figure 22. El Moro Rest Area Entrance Area with Copper Siding and Roof .............................. 54
Figure 23. El Moro Rest Area Large Lawns of Bluegrass (looking north at rest area) ............... 55
Figure 24. El Moro Rest Area Flower Box with Drip Watering System ..................................... 55
Figure 25. El Moro Rest Area Stormwater Ponds with Wetland Vegetation .............................. 56
Figure 26. Sleeping Ute Mountain Rest Area Site Map .............................................................. 60
Figure 27. Sleeping Ute Mountain Rest Area Northern Portion of Rest Area with Hiking Trail Near BLM Property ...................................................................................................................... 61
Figure 28. Sleeping Ute Mountain Rest Area Restroom Structure .............................................. 61
Figure 29. Sleeping Ute Mountain Rest Area Example of Picnic Shelters in Rest Area ............ 62
Figure 30. Sleeping Ute Mountain Rest Area Lawn Area Surrounding Restroom Structure ...... 62
Figure 31. Colorado Solar Resource Potential .............................................................................. 98
Figure 31-a. Colorado Solar Resource Potential Region 1 ........................................................... 99
Figure 31-b. Colorado Solar Resource Potential Region 2 ......................................................... 100
Figure 31-c. Colorado Solar Resource Potential Region 3 ......................................................... 101
Figure 31-d. Colorado Solar Resource Potential Region 4 ......................................................... 102
Figure 31-e. Colorado Solar Resource Potential Region 5 ......................................................... 103
Figure 31-f. Colorado Solar Resource Potential Region 6 ......................................................... 104
Figure 31-g. Portion of CSU-Pueblo Solar Array ....................................................................... 105

xv
Figure 31-h. Aerial View of ODOT ‘Solar Highway’ Site at I-5/I-205 ..................................... 107
Figure 32. Colorado Wind Resource Potential ........................................................................... 111
Figure 32-a. Colorado Wind Resource Potential Region 1 ......................................................... 112
Figure 32-b. Colorado Wind Resource Potential Region 2 ........................................................ 113
Figure 32-c. Colorado Wind Resource Potential Region 3 ......................................................... 114
Figure 32-d. Colorado Wind Resource Potential Region 4 ........................................................ 115
Figure 32-e. Colorado Wind Resource Potential Region 5 ......................................................... 116
Figure 32-f. Colorado Wind Resource Potential Region 6 ......................................................... 117
Figure 33. Colorado Biomass Resource Potential ...................................................................... 120
Figure 34. Colorado Geothermal Potential ................................................................................. 123
Figure 35. Colorado Hydropower Potential ................................................................................ 125
Figure 36. Colorado Electrical Transmission Potential .............................................................. 127

xvi
LIST OF TABLES
Table 1. Summary of Project Rest Area Sustainability Scoring ................................................... 68
Table 2. Summary of Project Rest Area Carbon Footprints. ........................................................ 70
Table 3. Summary of Project Rest Areas Observations and Recommendations. ......................... 75
Table 4. Direct Normal Insolation Levels, Colorado .................................................................... 95
Table 5. Total Acres by CDOT Region, per DNI Category ......................................................... 96
Table 6. Maximum Energy Production by Direct Normal Insolation (DNI) Category, in GWh/acre/year .............................................................................................................................. 96
Table 7. Colorado Wind Power Classes ..................................................................................... 108
Table 8. Wind Energy Production by Acres and Wind Power Class, in GWh/year ................... 109
Table 9. Biomass Production, tons/year ..................................................................................... 119
xvii
LIST OF ACRONYMS
AASHTO American Association of State Highway and Transportation Officials
AC Alternating Current
CDOT Colorado Department of Transportation
CFR Code of Federal Regulations
CREB Clean Renewable Energy Bond
CRS Colorado Revised Statutes
CSP Concentrated Solar Power
CSU-P Colorado State University-Pueblo
DC Direct Current
DEA David Evans and Associates, Inc.
DOE U.S. Department of Energy
DNI Direct Normal Insolation
F Fahrenheit
FHWA Federal Highway Administration
GDA Renewable Resource Generation Development Areas
GHG Greenhouse gas
GIS Geographic Information System
GW Gigawatt
GWh Gigawatt-hour
HB House Bill
INEEL Idaho National Engineering and Environmental Laboratory
I-25 Interstate 25
I-70 Interstate 70
kW Kilowatt
kWh Kilowatt-hour
m Meter
MW Megawatt
MWh Megawatt-hour
NREL National Renewable Energy Laboratory
PV Photovoltaic
xviii
RES Renewable Energy Standard
ROW Right-of-Way
SH State Highway
Tri-State Tri-State Generation and Transmission
UAP Utility Accommodation Plan
US United States
USC United States Code
W Watt
WAPA Western Area Power Administration
1
CHAPTER 1. INTRODUCTION (REST AREAS)
Sustainability has been broadly defined as meeting the needs of the present without
compromising the ability of future generations to meet their own needs (Brundtland
Commission, United Nations, 1987). Within a transportation system context, a sustainable
transportation system can be defined as achieving improvements in the natural, built, and social
environments while meeting the system’s functional transportation requirements. The essence of
these definitions is the efficient consumption and use of finite resources.
CDOT has adopted a strong proactive environmental ethics statement for the development and
operation of transportation systems: “CDOT will support and enhance efforts to protect the
environment and quality of life for all Colorado’s Citizens in the pursuit of providing the best
transportation systems and services possible.” CDOT has made the commitment to go beyond
environmental compliance and strive for environmental excellence. CDOT designs, constructs,
maintains, and operates the statewide transportation system in a manner which helps preserve
and sustain Colorado’s historic and scenic heritage and fits harmoniously into communities and
the natural environment (CDOT, 2005).
The Assessment of CDOT Rest Areas for Sustainability Improvements and Highway Corridors
and Facilities for Alternative Energy Source Use Project (the Project) complements the
sustainability principles and environmental ethics statement by enhancing the local environment
within and near the CDOT rest areas and right-of-way (ROW), meeting the needs and presenting
a positive Colorado image to the traveling public and using cost-effective actions that conserve
natural resources and make efficient use of CDOT financial resources.
Colorado State University at Pueblo (CSU-Pueblo) was selected by the CDOT Division of
Transportation Development’s (DTD) Applied Research and Innovation Branch to perform a
study of selected CDOT rest areas. The essence of the study is to conduct energy and
conservation audits of selected CDOT rest areas with regard to current resource consumption,
energy costs, emissions and types of waste treatment. Findings from these assessments will be
used to identify cost-effective methods for CDOT to consider to retrofit or improve the facilities
that may reduce CDOT operating costs.

2
Rest Area History
Rest areas are to be provided on Interstate highways as a safety measure. Safety rest areas are
off-road spaces with provisions for emergency stopping and resting by motorists for short
periods. They have freeway type entrances and exit connections, parking areas, benches and
tables and may have toilets and water supply where proper maintenance and supervision are
assured. They may be designed for short-time picnic use in addition to parking of vehicles for
short periods.
~ A Policy on Safety Rest Areas for the National System of Interstate and Defense
Highways, 1958
The Federal-Aid Highway Act of 1952 authorized the first funding specifically for the nation’s
Interstate Highway System construction, at an initial cost of $50 million with subsequent funding
in 1954, which authorized an additional $325 million. Under the leadership of President
Eisenhower, the question of how to fund the entire Interstate Highway System was resolved with
enactment of the Federal-Aid Highway Act of 1956. It served as a catalyst for the Interstate
Highway System's development and, ultimately, its completion. Title I of the 1956 Act increased
the Interstate Highway System's proposed total length of 41,000 miles. It also called for
nationwide standards for design of the Interstate Highway System, authorized an accelerated
program to establish a new method for apportioning funds among the States and changed the
name to the National System of Interstate and Defense Highways, and set the Federal
Government's share of project cost at 90 percent (FHWA, 2010).
Safety rest areas (rest areas) were constructed as part of the Interstate Highway System, and were
modeled after roadside parks. Rest areas were initially intended to provide minimal comfort
amenities for the traveling public; generally consisting of toilet facilities, drinking water, picnic
grounds and information dispersal. In 1958, a Policy on Safety Rest Areas was developed by the
American Association of State Highway Officials to standardize the design and construction of
rest areas. As a result of uniform design and function requirements, design aesthetics moved
toward the tradition of roadside architecture. This roadside architecture came to dominate
American highways and rest area sites emerged as unique and colorful expressions of regional
flavor and modern architectural design. Rest areas functioned to create a context of place within
3
the Interstate Highway System, achieved through the implementation of unique design elements
and the use of regionally signifying characteristics. By the mid 1960s, rest areas lined Interstates
to provide travelers a respite from the hectic and potentially monotonous nature of high-speed
Interstate travel (Organization Road Development, 2010).
Rest Area Function and Operations
The safety function of rest areas over the past several years has remained the same since the
creation of the Interstate Highway System; however, there have been dramatic changes in design
and operation of rest areas to accommodate the expectations of modern travelers. Where rest
areas use to provide the connection of people to a local region, commercial truck stops now
provide the major service to travelers for food, petroleum fuels and area connection. Originally
rest areas were designed around a central architectural theme, which was created around the
restroom building and then reflected in the other structures in the rest area, most commonly
picnic and information shelters. Rest areas were to be functionally and aesthetically satisfying
settings that provided a relaxing atmosphere.
CDOT currently owns and operates 32 rest areas throughout Colorado (Appendix A). These
facilities are visited by thousands of travelers every year, offering temporary parking for cars,
recreational vehicles (RVs), and semi-trailer trucks. For many first-time visitors to Colorado,
highways and their rest areas create a strong first impression of the State. CDOT is concerned
about the increasing costs of maintaining rest area services and operations at high standards, in
light of tight maintenance budgets.
Meeting increasing service demands has resulted in increased maintenance and operational costs
(Rest Area History, 2010). Rest area design and function has been upgraded and modified
within the past 10 years to provide the motoring public with new amenities such as air
conditioning, flush toilets/urinals, security lighting, vending machines, pet walks, lighted truck
parking, sewage disposal, and visitor information centers. It has also resulted in increased
impervious surfaces, more storm water runoff, higher potential for pollutant discharges into local
water resources, more non-native grassed areas, and higher irrigation and lighting intensity.

4
The CDOT Maintenance Department budget has not grown fast enough to be able to effectively
finance the operation and maintenance of all state rest areas in Colorado. As a result of these
limited financial resources, rest area closures have occurred in Colorado, such as the well-used
Larkspur Rest Area on Interstate 25. Rest area closures are being implemented by state DOTs
nationwide. The New York DOT is expected to closed “several dozen” rest areas at a savings of
$2 million per year (Time Herald Record, 2010). Due to budget cuts, Minnesota is proposing the
short- and/or long-term closure of 44 of the 75 rest areas at a cost savings of over $4 million per
year (AllBusiness, 2010). The Arizona DOT announced that it is temporarily closing 13 of 18
state-owned rest stops as part of a plan to shore up a projected $100 million shortfall in highway
user funds (Pederson, 2009).
There is a need to evaluate rest areas in terms of sustainable design, and operations and
maintenance in the State of Colorado that identifies means of reducing costs associated with rest
are maintenance and operation while also reducing the environmental impacts of the rest areas. A
sustainability based assessment uses a new approach and context that incorporates cost
economics, environmental, and social elements into rest area operations. There has been an
increased awareness of climate change and efficient resource consumption by the State of
Colorado as a result of Governor Ritter’s Executive Orders D0011 07, D0012 07 and D2010 006
that require state agency achievement by 2010/2011 (Ritter, 2007) for the following actions:
20% reduction in energy consumption – energy management plans are required that
address water and energy conservation
25% reduction in petroleum consumption – a vehicle replacement plan must be
implemented to transition to low consumption or alternative fuel vehicles
10% reduction in water consumption – water and energy consumption must be tracked
and managed using EnergyCAP software
Zero goal for solid waste generation – a recycling plan must be developed and
implemented; waste diversion from landfills of 75 percent by 2020
Energy-efficient building – new buildings must be certified by United States Green
Building Council LEED as a Silver Rating
Increase purchasing and use of environmentally friendly products – green products
should be purchased according to the State of Colorado Preferable Purchase Policy

5
Reduce greenhouse gas emissions by 20 percent below 2005 – greenhouse gas emissions
will be reported annually to the Green Government Council
There have been significant environmental changes in the past five years that add to the
complexity of managing rest area operations. There is an increased awareness of managing
carbon/greenhouse gas emissions from highway operations and rest areas. State agencies are
being required to start managing greenhouse gas emissions as part of the State of Colorado
Climate Action Plan (2007) developed by Governor Ritter (Ritter, 2007). Water is a valuable
resource in Colorado that needs to be conserved especially in light of climate change projections.
Domestic waste and treatment costs continue to increase due to more stringent environmental
regulations. Rest areas have been aging and many are not efficient in terms of resource
consumption, operational costs, and services. The cost of solid waste management and
landfilling is continuing to increase for rest areas. These issues require a new way to review and
evaluate rest area operations that reflect good management practices, directives, environmental
regulations, and costs.

6
CHAPTER 2. REST AREA PROJECT GOALS AND OBJECTIVES
As part of the Project, CDOT directed the development of a Sustainable Rest Areas Task to
address the economic, environmental, and social (traveling public) impacts of rest area
operations. Onsite evaluations of six selected rest areas were performed by the CSU-Pueblo
team using a sustainability based assessment of rest area design and operation and maintenance.
The purpose of this task is to conduct energy and conservation audits of CDOT rest areas with
regard to current resource consumption, energy costs, emissions, and types of waste treatment.
The findings from the assessments are used to identify recommendations for cost-effective
methods to retrofit or improvement options for the facilities that may reduce CDOT operating
costs. The goals for this rest area sustainability evaluation study are to provide recommendations
that CDOT can consider to:
Reduce life cycle cost for energy, materials and CDOT manpower,
Conceptualize sustainable and renewable actions and features for rest areas,
Improve the visitor experience in Colorado,
Reduce long-term rest area operation and maintenance costs and avoid a large manpower-
resource commitment by CDOT Maintenance,
Develop sustainable retrofit or improvement recommendations,
Evaluate the resulting environmental footprint achieved by reducing emissions,
conserving natural resources, and protecting the local environmental conditions,
Evaluate the carbon footprint of the Project rest areas and identify reduction strategies for
rest areas to potentially reach carbon neutrality, and
Estimate the carbon footprint for all CDOT rest areas combined.
Based upon these Project goals, the following Project Objectives were established:
Develop a method that will obtain, organize, and evaluate site-specific rest area
information
Coordinate and interact with CDOT rest area representatives to obtain operational
information and understand rest area operating procedures
Establish a rest area based carbon footprint method that follows scientifically accepted
calculation protocols and is accepted by CDOT prior to use

7
Develop and implement a sustainability scoring methodology that provides a metric of
the existing sustainable actions being performed at the Project rest areas
Evaluate database information that will provide sustainable actions in the categories of
Site Conditions, Materials, Recycling and Reuse, Environment, Air Quality, Water
Quality/Usage, Energy, and Public/Motorist/Trucking Outreach
Provide information to CDOT Maintenance Management in an effort to save operational
costs, while maintaining and improving rest area functionality

8
CHAPTER 3. REST AREA RESEARCH METHOD
The CSU-Pueblo Team recognized that there were several critical actions and issues that needed
to be addressed in order to achieve the Project’s goals and objectives. A stepwise evaluation
method was developed to address the following critical project issues necessary to evaluate
sustainable rest area design and operation and maintenance activities:
Coordinating with the CDOT Point Contact and developing working relationships with
CDOT Maintenance professionals,
Understanding CDOT maintenance, environmental, and engineering structure and
operations,
Understanding and meeting the expectations of the Study Panel members,
Obtaining critical CDOT rest area operations and visitation information,
Studying and assessing a representative population of CDOT rest areas,
Complementing work and studies initiated by CDOT such as the CDOT Energy
Performance Contract study,
Gaining access to CDOT ROW for assessment studies, and
Identifying funding mechanisms to design and implement recommended actions within
CDOT statewide via public-private partnerships.
The following method was developed and implemented by the CSU-Pueblo Team in
coordination with CDOT in order to achieve the goals and objectives and critical elements of the
Project:
Selection of Project rest areas,
Perform a literature search on sustainable rest area studies,
Develop and complete Sustainable Rest Area Field Evaluation Checklists,
Coordinate with CDOT representatives,
Conduct onsite evaluations of Project rest areas,
Develop and complete the Sustainable Rest Area Evaluation Database,
Develop and apply the Sustainable Rest Area Scoring Criteria, and
Calculate Project rest area carbon footprints.
9
Rest Area Selection
CDOT currently owns and operates 32 rest areas throughout Colorado (see Appendix A). These
facilities are visited by thousands of travelers per year, offering temporary parking for cars,
recreational vehicles (RVs), and semi-trailer trucks. There are four types (Tiers) of CDOT rest
areas that were identified by the CSU-Pueblo Team based upon rest area services and function:
Tier I rest areas contain or are adjacent to visitor centers. These rest areas are larger in
size, receive the most motorist visitation, and provide numerous amenities such as air
conditioning, RV waste disposal, visitor information, and large truck parking areas. Tier I
rest areas are located along the Interstate Highway Systems in Colorado (Interstates 25, 70
and 76). There are five Tier I rest areas within Colorado.
Tier II rest areas are located in recreational areas and are more destination-oriented than
other rest area types. These types of rest areas provide services to motorists, tourists,
bicyclists, and hikers. There are usually a large number of car parking spaces and the rest
areas are located near bicycling and other recreational areas. There are limited or no areas
available for long-term freight truck parking (greater than 8 hours). These areas are
generally smaller in size and operational complexity than Tier I rest areas. There are five
Tier II rest areas located mostly along Interstate 70 throughout Colorado.
Tier III rest areas provide basic services to the traveling public and trucking industry.
They are limited in the type of public services and center mostly upon restroom facilities
and picnic tables. Pet walking and limited vending machines are usually found in these
rest areas with some long-term semi-trailer truck parking and idling. There are 17 Tier III
rest areas located along the Interstate Highways and the State of Colorado Highways in
western Colorado.
Tier IV rest areas are simple pull-out locations associated with temporary truck parking or
scenic overlooks. No restroom facilities are provided at this type of rest area. There are
five Tier IV rest areas throughout Colorado located along Interstate Highways and the
State of Colorado Highways.

10
The purpose of the Project is to assess rest area design and operations for a representative sample
of rest areas in Colorado. Six rest areas were selected as representative of Tier I, II and III rest
areas. Two rest areas for each of the Tiers were selected to comprise a group of rest areas that
collectively met the following criteria:
Rest area classified as either Tier I, II or III rest areas,
At least one rest area resides within every CDOT Region (except CDOT Region 6), and
At least one rest area resides within each type of eco-region (desert, mountains, canyon,
and plains).
Using these selection criteria, the following rest areas (Project rest areas) were selected for the
study:
• Sterling Rest Area
Tier I – Visitor Center/Region 4; plains eco-region
• Poudre Rest Area
Tier I – Adjacent to Visitor Center (newest)/Region 4; plains eco-region
• Vail Pass Rest Area
Tier II – Recreational Rest Area/Region 1; mountain eco-region
• Hanging Lake Rest Area
Tier II – Recreational Rest Area/Region 3; canyon eco-region
• El Moro Rest Area
Tier III – Basic Services/Region 2; high plains eco-region
• Sleeping Ute Mountain Rest Area
Tier III – Basic Services/Region 5; desert eco-region
The selection of these Project rest areas was coordinated with the CDOT Study Panel.
Literature Search on Sustainable Rest Area Studies
A literature search was performed by the CSU-Pueblo Team on research or studies performed on
rest areas throughout the United States and Europe. Sustainable actions found to be easiest and
most life cycle cost-effective were searched by referencing web sites and the CSU-Pueblo Team
attempted to contacting several state DOTs (Michigan, Minnesota, Florida, North Carolina,
Illinois, Wisconsin, Washington, Oregon, Texas, Virginia), Transportation Research Board

11
(TRB), and the American Association of State Highway and Transportation Officials
(AASHTO). Web searches on European sustainable rest areas were performed with limited
success. Overall there was very limited information obtained from this literature review, since
this type of sustainable rest areas assessment has not been performed or information published by
DOTs. The following summarizes the information collected from responding DOTs during the
literature review:
North Carolina DOT – One LEED certified rest area has been build and has a web site
where electrical consumption can be monitored. Most retrofits involve the use of solar
heated water. The DOT reduced water usage from irrigation and restroom areas. Material
recycling is occurring at rest areas. North Carolina came up with a list of sustainable
actions that was reviewed and some elements adopted into the assessment checklist by
the CSU-Pueblo Team. Truck electrification was thought not effective unless there is a
regulatory incentive.
Michigan DOT – Looking for alternative wind generation especially for rest areas with
air conditioning. The DOT is reducing the amount of solid waste by material recycling
and ononsite compositing of lawn waste material. Michigan is looking into truck idling
related to noise and emissions.
Florida DOT – Eliminated hot water in restroom areas to reduce energy costs. The DOT
has been recycling rest area waste materials for years with the help of local communities.
They have eliminated lawn irrigation to save money and reduce water consumption.
Stormwater best management practices for all rest areas are a Florida DOT policy
requirement.
Utah DOT – looking into alternative energy sources such as wind, solar and hydro-
power.
Wisconsin DOT – recycling solid waste materials from rest areas for years.
New York DOT – not focused on sustainable rest area operations and has been
concentrating more on sustainable design.
Minnesota DOT – pilot program that utilizing geothermal and wind turbine systems at
Camden State Park.
Pennsylvania DOT – opened the first truck stop electrification facility to comply with
state truck idling regulations.
12
The information acquired from this task was used to develop the Sustainable Rest Area Field
Evaluation Checklist (Appendix B) and Sustainable Rest Area Scoring Criteria that was
developed in coordination with CDOT (Appendix C).
As part of this information gathering activity, the CSU-Pueblo Team coordinated with Johnson
Controls, Inc. (Johnson Controls) who is the main contractor for the CDOT Energy Performance
Contract. Johnson Controls was in the process of performing energy audits on all CDOT
Maintenance facilities that include rest areas. The overall goal of these energy evaluations is to
save CDOT financial resources by using energy conservation measures, evaluating the use of
cost-effective alternative energy, and developing creative financing for energy payments to
utilities. The CSU-Pueblo Team was also concerned about energy consumption as it relates to
potential financial savings and the reduction in the overall rest areas’ carbon footprint. Johnson
Controls was in the process of identifying a rest area (potentially the El Moro Rest Area) that
would be a net zero energy consumption facility. Two meetings were held between the parties to
avoid duplication of effort, and share data, observations, and recommendations.
Sustainable Rest Area Field Evaluation Checklist Development
The Sustainable Rest Area Field Evaluation Checklist was developed to assist the CSU-Pueblo
Team in assessing the Project rest areas. The development of the sustainability criteria mainly
referenced the Leadership in Energy and Environmental Design (LEED) Checklist categories
and criteria. A list of evaluation parameters was developed within the following broad
categories:
Site Conditions – This category establishes the baseline conditions by detailing the
current year round operating conditions and activities of the Project rest areas
Materials, Recycling, and Reuse – This category is related to the conservation of natural
resources by using material reuse and recycling. Material recycling and reuse reduces that
amount of solid waste that is transported and ultimately landfilled.
Environment – This category evaluates how well the rest area is in harmony with overall
local environment such as wildlife habitat and mobility.
Air Quality – This category identifies activities that could affect air quality at the Project
rest areas such as toxic chemicals used/stored, overnight truck parking, etc. Rest area

13
actions that impact air quality are the emission of greenhouse gases and the exposure of
chemicals to rest area workers and visitors.
Water Quality/Usage – This category identifies the measures taken to protect local water
quality and identifies rest area water usage such as for irrigation and restroom services.
Water is a very finite resource within Colorado and water conservation is very important
and cost-effective.
Energy – This category relates to energy usage, management practices, and costs at the
Project rest areas. Rest area energy is expensive and is generated by finite fossil fuel
resources that add to the greenhouse gas loading in the State of Colorado.
Public/Motorist/Trucking Outreach and Services – This category represents how well the
local community is being involved with the operation of the rest area (regional
information, free coffee) and the level of services provided to the traveling public (maps,
weather forecasts).
The development of the field evaluation criteria was influenced by the State of Colorado
Environmentally Preferable Purchasing Policy developed in July 2010 (State of Colorado, 2010),
the LEED scoring criteria and the sustainable vision elements expressed by Governor Ritter
within Executive Orders D0011 07 and D0012 07 (Ritter, 2007) and D 2010-006 (Ritter, 2010).
The Sustainable Rest Area Field Evaluation Checklist contains 124 site evaluation elements that
were coordinated with the CDOT Study Panel prior to Project rest area use by the CSU-Pueblo
Team (see Appendix B).
Coordination with CDOT Representatives
The CSU-Pueblo Team gave a presentation to the CDOT Study Panel at the initiation of the
Project. The CDOT Study Panel was formed by the CDOT Environmental Research Manager to
provide feedback and direction to the CSU-Pueblo Team throughout the Project. The overall
Project approach was outlined to the CDOT Study Panel. At this meeting the CSU-Pueblo Team
provided CDOT with a list of initial data needs for the appointed CDOT rest area representatives
to help facilitate the onsite meetings with the CDOT rest area contacts and the CSU-Pueblo
Team. This list included the following requested information for each Project rest area:
14
Any energy-related studies performed by Johnson Controls or other contractors on these
and/or other rest areas
Electrical power consumption (parking lot lighting, structure lighting, heat, water pump,
air conditioning, treatment system)
Natural gas consumption (heating)
Water consumption (restrooms, landscaping/irrigation)
Water sources (public or well; well capacity)
Treatment system design and maintenance costs
Landscaping activities and costs (manpower, fuel consumption, vegetation, herbicide use)
Snow maintenance (manpower costs, deicer usage)
Site visitation records
Rest area age, acreage, and site visitation records
Solid waste and recycling information
Stormwater management and costs
Mowing frequency and manpower cost
Truck visitation data
The following CDOT rest area representatives were appointed as point contacts for the CSU-
Pueblo Team:
Vail Pass Rest Area (Vail Pass-Region 1) – April Thomas/Mike DeLong
El Moro Rest Area (Trinidad-Region 2) – Robert Trujillo/Jeff VanMatre
Hanging Lake Rest Area (Glenwood Canyon-Region 3) – Dave Schultz/Mike Goolsby
Poudre Rest Area (Fort Collins- Region 4) – Tom Lujan/Ed Stieber
Sterling Rest Area (Sterling- Region 4) – Victor Romero/Ed Stieber
Sleeping Ute Mountain Rest Area (Cortez-Region 5) – Edward Olguin/Kyle Lester
15
Onsite Rest Area Visits and Evaluations
Three rest areas were assigned to each of the two graduate students. These graduate students
were responsible for conducting onsite reviews, obtaining operational and maintenance data and
performing data analysis.
The Project rest areas were visited by the CSU-Pueblo Team during the months of July and
August, 2010. The initial portion of the site visit involved talking with and interviewing the
CDOT rest area representatives and other maintenance representative(s) directly responsible for
the operation and maintenance of the rest area to review the physical characteristics of the rest
area and the restroom structure. The site visit was attended by the rest area representative when
possible. The CSU-Pueblo Team left the area when the Rest Area Field Evaluation Checklist was
completed. Follow up communication and requests for additional information occurred between
the team members and the CDOT representatives.
Development of the Sustainable Rest Area Evaluation Database
The collected field data was placed into an Excel spreadsheet-database. The rest area information
was organized to allow the field and site-specific operations information to be viewed and
evaluated across all the Project rest areas. The development of the database allowed for the
direct comparison of information among and between Project rest areas. The database also
allowed for the identification of suspect data and rest area operations that are not sustainable.
Appendix C contains the Sustainable Rest Area Database. The database spreadsheet can provide
CDOT with a useful baseline assessment tool to help manage the Project rest areas and other
CDOT rest areas statewide.
Sustainable Rest Area Scoring Criteria
A Sustainability Rest Area Scoring approach was developed by the CSU-Pueblo Team to
achieve the comparison metric and to evaluate the current baseline sustainability status of the
Project rest areas’ design and operation and maintenance (Appendix D). The development of the
Sustainability Rest Area Scoring Criteria referenced the LEED approach and contains similar
information contained in the Rest Area Field Evaluation Checklist. The LEED approach assigns
a score to specific sustainable criteria; criteria were given points ranging from 1-3 points

16
(USGBC, 2007). If the sustainable criteria were achieved for a given rest area, then all the
maximum points were awarded.
The LEED approach that was a reference for this Sustainable Rest Area Scoring was specifically
for new construction and not for rest areas. The sustainability scoring approach and criteria was
developed by the CSU-Pueblo Team based upon the definition of sustainability, the project goals
and objectives, and their knowledge of sustainable design and operations. The development of
the criteria was influenced by the State of Colorado Environmentally Preferable Purchasing
Policy developed in July 2010 (State of Colorado, 2010), the LEED scoring criteria and the
sustainable vision elements expressed by Governor Ritter within Executive Orders D0011-07/
D0012-07 and D2010-006 (Ritter, 2007, Ritter 2010). Based upon the literature search
performed by the CSU-Pueblo Team, no existing sustainable rest area checklist exists or has
been disseminated by other DOTs. The Sustainable Rest Area Scoring criteria used for this
project are unique and represent a new way to assess the design and operations of rest areas.
The 61 sustainable scoring criteria elements were grouped into the following categories with the
maximum number of points per category. These categories are similar to those contained in the
Sustainable Rest Area Field Evaluation Checklist:
Materials and Reuse/Recycling (13 points)
Environment/Site Conditions (25 points)
Air Quality (13 points)
Water Quality/Usage (21 points)
Energy (30 points)
Public/Motorist/Trucking Outreach (11 points)
Innovation Score (4 points)
Maximum Score (117 points)
The Sustainable Rest Area Scoring Criteria spreadsheet with criteria rationale was coordinated
with the CDOT Study Panel. Appendix D provides the Sustainability Rest Area Scoring Sheet
which includes the summary results of all Project rest area scores.
17
Calculation of Project Rest Areas’ Carbon Footprints
The calculation of the Project rest areas’ carbon footprints is a unique evaluation approach to
determine rest area impact upon the environment by estimating greenhouse gas emissions. The
rest area carbon footprint provides a way of reviewing and assessing overall energy consumption
and resulting emissions. The carbon footprint provides the baseline to which carbon reduction
options can be identified and measured against in an attempt to achieve carbon neutrality for
each rest area.
The method used by the CSU-Pueblo Team is consistent with the Greenhouse Gas Protocol
(GHGP) established by the World Resource Institute (WRI, 2004). The GHGP approach is a
well-established and accepted method for carbon footprint calculations. The carbon footprint
calculations follow the method used by EPA; multiplying the volume or amount of fuel
combusted by an emission factor. The Technical Memorandum (August 27, 2010) that outlines
in detail the method and carbon footprinting calculations was coordinated with the CDOT Study
Panel (Appendix E). The overall carbon footprint estimates for all CDOT rest areas are shown in
the Sustainable Rest Area Database Spreadsheet (Appendix C) and discussed in Chapter 4.
The GHGP approach identifies three Scope Emission types to identify and estimate direct and
indirect emission sources. These Scope Emissions (Scope 1, Scope 2 and Scope 3) are used to
provide consistency in accounting for and mitigating greenhouse gas emissions (IPCC, 2007).
The following summarizes the GHGP scopes as they relate to the Project rest areas:
Scope 1 – Direct GHG Emissions: these type of emissions come from combustion
sources that are owned by the entity (CDOT) that are directly related to the operations of
the rest area such as propane and natural gas for heating, and gasoline/diesel fuel for the
transportation of materials, equipment, mowing, and personnel transportation to and
from work.
Scope 2 – Electrical Indirect GHG Emissions: accounts for GHG emissions from the
generation of purchased electricity consumed by the company (CDOT). The actual
emissions occur at the power facility where the electricity is generated. This type of

18
indirect emission will be used for rest area heating/cooling and lighting and is expected
to be the largest type of emission for rest areas.
Scope 3 – Other Indirect GHG Emissions: these types of emissions are a consequence
of activities of the company (CDOT), but occur from sources not owned or controlled by
the company (CDOT). The main rest area source for this type of indirect emission is
from truck idling.
The equations used to calculate the carbon footprint use emission factors kilogram (kg/gallon)
for carbon dioxide (CO2), nitrous oxide/oxides of nitrogen (N2O), and methane (CH4) that are
referenced from the United States Environmental Protection Agency (EPA, 2005). These
emission factors are multiplied by the amount of fossil fuel consumed by the Project rest areas
and then multiplied by the respective Global Warming Potential (GWP). GWP is defined as the
amount of impact or the degree of harm a particular gas has on the atmosphere (Jakubski, 2008).
When the GWP is multiplied by the amount emitted, it is converted to an equivalent amount of
CO2 and that is called “Equivalent CO2” or CO2e.
The estimated, cumulative carbon footprint for all CDOT rest areas was estimated by taking an
average of the carbon footprint values calculated for each rest area tier type (Tiers I-III). That
value was multiplied by the total number of corresponding tier type rest areas managed by
CDOT. The total carbon footprint for all CDOT rest areas was then determined by the
summation of all rest area tiers type carbon footprints. This value provides CDOT a gross
estimation of the total carbon equivalent loading from all rest areas. This provides a baseline for
CDOT’s efforts to manage greenhouse gas emissions. This greenhouse gas management is
consistent with the Colorado Climate Action Plan expectations of reducing greenhouse gas
emissions by 20% by 2020 (Ritter, 2007b).
19
CHAPTER 4. REST AREA RESULTS AND DISCUSSION
Onsite assessments were performed by the CSU-Pueblo Team during the months of July and
August 2010. CDOT rest area representatives and maintenance managers met the CSU-Pueblo
Team at the rest areas to provide written and verbal operational information for each rest area.
The Sustainable Rest Area Field Evaluation Checklist was sent out to the CDOT rest area
contacts prior to the meeting and was the center of the discussions and assessment activities
during the rest area visits. The information provided by the CDOT contacts was recorded and
inserted into the Sustainable Rest Area Database. The following tier level Project rest areas were
visited by the CSU-Pueblo Team:
• Tier I – Sterling Rest Area (August 25, 2010)
• Tier I – Poudre Rest Area (August 19, 2010)
• Tier II – Vail Pass Rest Area (July 15, 2010)
• Tier II – Hanging Lake Rest Area (July 16, 2010)
• Tier III – El Moro Rest Area (August 6, 2010)
• Tier III – Sleeping Ute Mountain Rest Area (July 9, 2010)
The following sections provide the detailed assessment information for each rest area:
Rest Area Setting
CDOT Rest Area Operations
Rest Area Carbon Footprint
Rest Area Sustainability Scoring
Rest Area Observations/Recommendations
4.1 Sterling Rest Area
Rest Area Setting
The Sterling Rest Area is located 1 mile west of Interstate 76 at mile marker 125. The rest area is
located within the city limits of Sterling (elevation 4,040 feet) in Logan County. The rest area is
adjacent to the Sterling Municipal Building and is 0.2 miles from the CDOT Sterling
Maintenance Facility. The Sterling Rest Area is characterized as a Tier I rest area that represents
the more complex, visitor center type rest area. A visitor center operated and maintained by

20
CDOT is contained within the main restroom building. The visitor center, supported by
volunteers, provides travelers with road maps and regional and state tourism information. The
rest area comprised of seven acres is located in a semi-arid, grassland-plains eco-region based
upon the type of native vegetation and precipitation. The rest area is visited by approximately
384,000 people every year. The rest area was constructed in 2000 and is open 24 hours a day for
seven days a week, all year. The rest area accommodates large amounts of freight trucks due to a
large parking area for commercial vehicles and available restroom services. The Sterling Rest
Area is located at the critical location where Interstate 76 is routinely shut down due to winter
storms and provides important services to cars and trucks during these storm events. The rest
area is managed by CDOT Region 4. Figure 1 shows a site plan of the Sterling Rest Area.
Sterling Rest Area Operations
The Sterling Rest Area was evaluated by the CSU-Pueblo Team on August 25, 2010 with
informational support provided by the CDOT Maintenance representatives. The following
summarizes the Sterling Rest Area operations:
The rest area contains a 3,900 square foot structure, which contains the restrooms and the
visitor center (see Figures 2 and 3).
The visitor center area is air conditioned and the main restroom and lobby areas are
naturally cooled. The rest area has picnic tables, vending machines, recycling bins, and a
fenced dog walking area.
The Sterling Rest Area uses the City of Sterling for domestic water and wastewater
treatment.
A recreational vehicle waste disposal system is located near the truck parking area and
the waste is treated off site.
Limited natural vegetation is allowed to grow on rest area property except for random
small patches near the truck parking location.
The rest area has approximately three acres of buffalo grass.
The rest area is heavily used by travelers and especially by trucks.
The stormwater best management practices include vegetated basins, which are very
protective of water quality (see Figure 4).

T
F
The design o
igure 5).
f the rest ar
F
ea fits well
Figure 1. St
21
into the con
terling Rest
ntext of Colo
t Area Site P
orado and th
Plan
he local areaa (see

Fig
F
gure 2. Ster
Figure 3. St
rling Restro
terling Rest
22
oom and Vis
t Area Visit
sitor Center
or Center E
r Entrance
Entrance
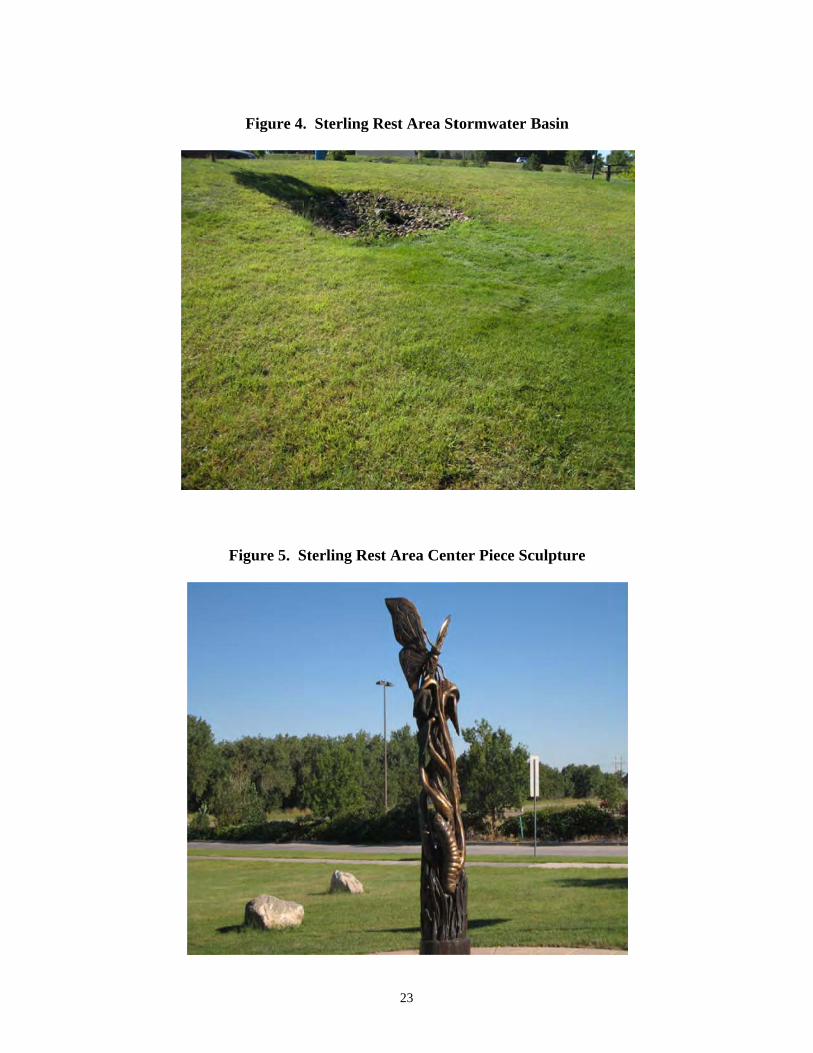
Figure 4.
Figure 5. S
. Sterling R
Sterling Res
23
Rest Area St
t Area Cent
tormwater B
ter Piece Sc
Basin
culpture

24
There are 47 parking spaces for cars and 24 parking spaces for semi-trailer trucks. It was
estimated that approximately 18 semi-trailer trucks park and idle for greater than eight
hours per day.
The rest area is maintained by two full-time maintenance employees and is cleaned four
times a day.
Electricity and natural gas are the only sources of energy in the rest area.
Sterling Rest Area Carbon Footprint
Scope 1 greenhouse gas emissions from the Sterling Rest Area include emissions produced by
gasoline and natural gas consumption. Gasoline is used by CDOT Maintenance vehicles to
transport materials and equipment to and from the maintenance facility (located less than a mile
away) and by the operation of onsite maintenance equipment such as mowers, weed eaters, snow
blowers, and snow removers. The total average gasoline consumption for the Sterling Rest Area
is low in compared to the other Project rest areas because of the closeness of the rest area to the
CDOT Maintenance facility. Consumption of gasoline in 2009 was about 92 gallons (personal
conversation, 2010). The rest area uses natural gas for water and building heating. The annual
average consumption of natural gas is 7,949 therms (Excel Energy, 2010). Since meters measure
volume and not energy content, a therm factor is used by gas companies to convert the volume of
gas used to its heat equivalent, and thus calculate the actual energy use (one therm equals
100,000 British Thermal Units (BTUs) or about 97 cubic feet of natural gas). The annual Scope
1 carbon footprint of the Sterling Rest Area is 44 metric tons CO2e /year.
Scope 2 greenhouse gas emissions are produced by electric consumption at the rest area. The
Sterling Rest Area uses electricity mainly for the building and the parking lot lighting. The
average annual consumption for the Sterling Rest Area is 126,530 kilo-watt-hours (kWh/year)
(Excel Energy, 2010). The annual scope 2 carbon footprint for the Sterling Rest Area is 108.6
metric tons CO2e/year.
Scope 3 greenhouse gas emissions are a result of the overnight idling of large freight trucks
(greater than eight hours). As a worst case emission scenario, the Sterling Rest Area has on
25
average 18 idling trucks per night. The overnight idling results in a scope 3 average annual
carbon footprint of 2,853.6 metric tons CO2e/year.
The total estimated carbon footprint for the Sterling Rest Area is 3,006 metric tons CO2e/year.
Sterling Rest Area Sustainability Scoring
The overall Sterling rest area sustainability score was 30 out of 117 points. The following
summarizes the sustainability scores (see Sterling Sustainable Scoring in Appendix D for
details). The following summarizes some of the sustainability actions and total scoring:
Materials and Reuse Score – only rest area among the Project rest areas that recycles
aluminum and plastic bottles (no glass). The rest area obtains landscaping mulch from
the local prison generated by tree cutting and trimming. (6 of 13 points)
Environment/Site Condition Score – uses drip irrigation for non-native landscaping and
irrigates lawn at night (5 of 25 points)
Air Quality Score – smoking prohibited in rest rooms (2 of 13 points)
Water Quality/Usage Score – contains excellent stormwater best management practices in
the form of a vegetated swale-detention pond (7 of 21 points)
Energy Score – only rest area that uses an electric vehicle for onsite maintenance
activities (6 of 31 points)
Public/Motorist/Trucking Outreach – area exhibits context sensitive design of community
and high community involvement (4 of 11 points)
Innovation Score – (0 of 4 points)
Sterling Rest Area Observations and Recommendations
The Sterling Rest Area contains a large area of grass buffalo grass (Bouteloua dactyloides) and
small patches of native grasses. Although the buffalo grass is less water intensive than non-
native bluegrass, it does require only occasional irrigation. Vegetation covers about 50% of the
rest area with 3 acres of buffalo grass and approximately 83 trees. CDOT could consider
minimizing the buffalo grass area in favor of native grass that requires less irrigation and
chemical treatment in combination with improved irrigation practices to conserve water. This
action will also reduce the mowing frequency and the amount of herbicides and fertilizer needed

26
to maintain the grass. The cost savings as a result of lower water usage, labor for mowing, gas
and herbicides consumption can be significant.
The Sterling Rest Area has the highest carbon footprint of all the Project Areas with 3006 metric
tons CO2e/yr. The biggest contributor to air pollution and the carbon footprint is overnight truck
idling with an average of 18 idling trucks per night emitting approximately 2,853 metric tons of
CO2e/yr. Greenhouse gas emissions could be reduced at the rest area by instituting idling
restrictions or providing alternative energy sources to trucks such as truck electrification, which
would need to be evaluated in another research study.
The Sterling Rest Area has the highest water consumption of all the Project rest areas. Municipal
water is the only water supply for the rest area with an average annual purchasing cost of
$14,814 and an average annual consumption of 10,326,400 gallons. The restroom facilities use
water-saving faucets and use low flush urinals and toilets. It is assumed that the majority of the
water usage is from spray lawn irrigation. Daytime irrigation was noted during the onsite
evaluation which is not an efficient irrigation technique in the summer. A water conservation
study could be performed in an effort to determine the exact use and volume of water at the rest
area. As previously mentioned, the landscaping of the rest area could be changed to use more
native plants and rock landscaping to reduce water demand. The water conservation study could
save CDOT significant financial resources in domestic water purchase and waste treatment costs.
The Sterling Rest Area uses two sources of energy: 1) electric energy for lighting the
restroom/visitor center building, the parking lot areas, and the visitor center air conditioning, and
2) natural gas for hot water and building heating. The average annual electrical consumption of
the rest area is 126,530 kWh (Excel, 2010) with an average annual cost of $9,201. Lights in the
rest area are on all night year round. No energy saving lighting or motion detectors were noted
during the assessment. Energy conservation methods could be considered to reduce energy
consumption in the rest area such as using motion sensors to initiate lighting in the restroom
areas. The amount of air conditioning usage may be reduced by using natural ventilation
coupled with vegetative shade and by making sure the visitor center door is closed to avoid
cooling the larger restroom and lobby areas.

27
The overall appearance of the Sterling Rest Area is very good. A fenced dog run area is provided
for the rest area visitors and local community information is available for the public though
information signage and bulletin boards. The local community is involved in helping with some
of the rest area’s activities especially the operation of the visitor center. Onsite volunteers were
seen during the rest area evaluation. The design of the rest area reflects the local area context; a
local artist designed the sculpture at main rest area. The rest area could a consider security
camera system like other rest areas to enhance visitors’ security. The cooperation between
CDOT and the local state prison for materials recycling and reuse is excellent and should
continue in the future.
4.2 Poudre Rest Area
Rest Area Setting
The Poudre Rest Area is located southwest of the Prospect Road and Interstate 25 interchange at
mile marker 268, on the southeast portion of Fort Collins (elevation 5,003 feet) in Larimer
County. The rest area is characterized as a Tier I rest area that represents the more complex
visitor center type rest area. The rest area is located in a semi-arid grassland-plains eco-region
based upon the type of native vegetation and precipitation. The rest area is open year round, 24
hours a day, seven days a week with a yearly visitation of approximately 122,000 people. The
Poudre Rest Area is adjacent and separate from a State of Colorado Visitor Center (not directly
operated by CDOT) that helps generate visitor visits to the rest area. The rest area is located next
to a sensitive wildlife corridor that is located less than one mile away from the Poudre River. The
rest area receives large amounts of semi-trailer trucks year round due to a large parking area and
restroom services. Unique to the Poudre Rest Area is a kiosk located inside the restroom building
that allows motorists and trucking professionals to check current road conditions and access
many CDOT weather cameras throughout Colorado. The Poudre Rest Area is operated and
maintained by CDOT Region 4. Figure 6 shows a site plan of the Poudre Rest Area.

CDOT R
The Pou
informati
summariz
T
It
se
T
tr
Rest Area O
udre Rest A
ional suppo
zes the Sterl
This rest area
t contains a
eparate park
The rest area
rucks a day a
Figu
Operations
Area was ev
ort provided
ling Rest Are
a is comprise
2,500 squar
ing for comm
a is along a p
and there are
ure 6. Poud
valuated by
by the CD
ea Operation
ed of 16 acre
re foot restr
mercial and
portion of In
e 23 parking
28
dre Rest Are
the CSU-Pu
DOT Mainte
ns:
es and is the
room buildin
private vehi
nterstate 25
spaces for s
ea Site Plan
ueblo Team
enance repr
largest amon
ng, picnic ta
icles (see Fig
that is trave
semi-trailer t
n
m on Augus
resentatives.
ng the Proje
ables, vendin
gure 7).
eled by appr
trucks at the
st 19, 2010
The follo
ect rest areas
ng machines
roximately 7
rest area.
with
owing
.
s, and
7,000
29
There are approximately 15 trucks a day using the rest area for a period of greater than 8
hours (see Figure 8).
The rest area is serviced by one CDOT Maintenance employee who maintains the
landscaping, buildings and overall operations.
The Poudre Rest Area is the only Project rest area where CDOT contracts with a
custodial contractor to clean the restroom building three times per day. The contactor
provides and uses their own type of cleaning chemicals.
The area uses traction sand and magnesium chloride during storms and sweeps the area
twice a year.
The CDOT Maintenance building in Loveland, Colorado serves as the base location for
the rest area maintenance crew and is located 12 miles south of the Poudre Rest Area.
Poudre Rest Area Carbon Footprint
Scope 1 greenhouse gas emissions from the rest area involve the use of CDOT vehicles that
transport equipment, operate equipment, and shuttle personnel to and from the CDOT Loveland
Maintenance Facility and the operation of equipment necessary to maintain the rest area. The
total approximate amount of gasoline used at the Poudre Rest Area is 33 gallons/year and the
amount of diesel used is 750 gallons/year. The average natural gas consumption at the rest area is
1,350 therms annually.
These emissions generate an annual scope 1 carbon footprint of 15 metric tons CO2e /year.
Scope 2 greenhouse gas emissions are from the generation of purchased electricity consumed by
CDOT. This type of indirect emission is a result of rest area heating, air ventilation, and lighting.
The average annual electrical consumption for the Poudre Rest Area is 144,000 kWhr/year (City
of Fort Collins, 2010); this electrical consumption results in a Scope 2 footprint of 123.6 metric
tons of CO2e/year.
Scope 3 greenhouse gas emissions are a consequence of activities that occur from sources not
owned or controlled by CDOT. The main rest area source for this type of indirect emission is

Figure
Figure 8.
7. Poudre
Poudre Re
30
Rest Area M
est Area Tru
Main Entra
uck Parking
ance
g Area
31
from truck idling. Based upon CDOT information it was estimated that 15 trucks idle at the rest
area for 8 hours or greater per night. As a worst case scenario, the fuel consumed from long-
term idling is responsible for a scope 3 footprint of 2,377 metric tons CO2e /year (94% of the
total carbon footprint).
The total estimated carbon footprint for the Poudre Rest Area is 2,517 metric tons CO2e /year,
the second highest footprint among the Project rest areas.
Poudre Rest Area Sustainability Scoring
The overall Poudre Rest Area sustainability score was 33 out of 117 points. Among the Tier I
rest areas, the Poudre Rest Area achieved the higher sustainability score with 33 points versus 30
points for Sterling. The following summarizes some of the sustainability actions and total scoring
(see Poudre Rest Area Scoring Sheet in Appendix D for details):
Materials and Reuse Score – uses recycle asphalt for pavement repairs (3 of 13 points)
Environmental/Site Conditions Score – open fencing and uncut native vegetation around
the perimeter of the rest area. This vegetation management approach provides consistent
habitat and mobility for the various types of wildlife in the area and along the corridor (9
of 25 points)
Air Quality Score – no smoking signs posted in restrooms (2 of 13 points)
Water Quality/Usage Score – excellent stormwater best management practices by having
two vegetated retention ponds (see Figure 9) (5 of 21 points)
Energy Score – lighting cut off fixtures used to reduce stray light and use of energy
conservation measures (double-pane windows, caulking) and use of natural lighting
(Figure 10) (7 of 30 points)
Public/Motorist/Trucking Outreach Score – a computer-based kiosk that provides rest
area users valuable road condition information, especially during winter storm conditions
(7 of 11 points)
Innovation Score – (0 of 4)
32
Poudre Rest Area Observations and Recommendations
There is no recycling available at the rest area. With the high amount of commercial and public
vehicles using the rest area, recycling containers could be provided to reduce the amount of solid
waste that eventually is placed in a landfill. Potential recycle materials (glass, aluminum cans,
and plastics bottles) can either be taken to the town of Fort Collins Recycling Center or picked
up and removed by Waste Management. Waste Management is already contracted to remove
solid waste from the adjacent State of Colorado Visitor Center and offers the option of collecting
recycle materials. This recycling option could reduce the total amount of solid waste produced
and reduce landfilling costs.
The maintenance staff mows approximately nine acres of vegetation at least once per week (both
native and non-native) and bags the grass clippings as solid waste. This increases the amount of
solid waste that is taken to the Ault Landfill by Waste Management. If the grass clippings were
mulched or composted onsite there would be a decrease in the solid waste produced, saving
landfilling costs. Also, mulched grass is beneficial to lawns because it conserves moisture,
lessens the need for pesticides, and saves money (Beck, 2004). The other option is not to mow
the buffalo grass, which would significantly reduce overall lawn maintenance.
To reduce the amount of greenhouse gases emitted from idling trucks, idling restriction signs
could be placed in the commercial vehicle parking lot. If there were restrictions on the length of
idling times or if an electrical hookup was provided (truck electrification), significant reduction
in the amount of greenhouse gas emissions could be realized.
The amount of water used for toilet flushing at the Poudre Rest Area was the highest of all of the
Project rest areas. The toilets use 2.5 gallons per flush. Relative to the other Project rest areas,
this appears to be an excessive amount of water that increases the amount of domestic water
usage and wastewater sent to the Fort Collins treatment facility, thus increasing operational
costs. The cost for domestic water is $2.27 per 100 gallons. Also, the urinals use 0.5 gallon per
flush. If the urinals were changed to waterless, there could be zero domestic water usage and
treatment cost associated with them. These changes could decrease overall operations costs

Fig
Figur
gure 9. Poud
e 10. Poudr
dre Rest Ar
re Rest Are
rea Vegetate
a Natural L
33
ed Retention
Lighting in t
n Stormwat
the Main Re
ter Manage
estroom En
ement Pond
ntrance Lobb
by
34
because CDOT pays for both the incoming water and treatment of the outgoing wastewater. In
addition, stormwater management fees imposed by the City of Fort Collins are significant and
are based upon the volume of domestic water purchased (approximately $585 per month).
The rest area has approximately two acres of landscaping that receive fertilizers, herbicides,
irrigation, and mowing. The area is irrigated three times per week during the summer. The
overall consumption of purchased water for the rest area is 1.2 million gallons ($2,460/year)
second only to the Sterling Rest Area for purchased water. It is assumed that the majority of the
water consumption is from lawn irrigation practices. Alternative landscaping in the form of
native vegetation use and xeriscape practices could be incorporated.
Alternative energy generation has potential at the Poudre Rest Area. The existing energy sources
include both electric (heated floor, air conditioning, lights, and irrigation pumps) and natural gas
(heating). The heated floor may not be a necessary feature for the rest area and its elimination
could reduce electric energy use. The Poudre Rest Area has sufficient space to contain
photovoltaic cell panels on existing roof surfaces and on the ground. This rest area has a large
amount of unused land, especially to the west of the rest area building that could be used for the
photovoltaic panels. The design and implementation of photovoltaic cells could have a dramatic
impact on the rest area’s carbon footprint and reduction in electrical consumption cost.
Photovoltaic cells could also demonstrate CDOT’s commitment to alternative energy and
reduction in greenhouse gas emissions.
4.3 Hanging Lake Rest Area
Rest Area Setting
The Hanging Lake Rest Area is located on Interstate 70 at mile marker 124. It can be accessed
only from the eastbound lane on Interstate 70 past the Grizzly Creek Rest Area, and is located on
the south side of Interstate 70. The rest area is in Garfield County and located in Glenwood
Canyon adjacent to the Colorado River (elevation 6,155 feet). The rest area is located in a
canyon eco-zone area. The Hanging Lake Rest Area, built in 1993, is a Tier II rest area that
provides parking and services for visitors interested in recreational activities. Annually, the rest

35
area is visited by more than 73,000 motorists, tourists, hikers, and bicyclists primarily to access
the Hanging Lake Trail. The rest area was closed to the public at the time of the site evaluation
(from May 1, 2010 to September 6, 2010) due to United States Forest Service (USFS)
construction on the popular Hanging Lake Trail. The rest area maintains a bike path to the east
and west of the area and a small outdoor chemical toilet to the east. The rest area is normally
open year round 24 hours a day seven days a week. The Hanging Lake Rest Area is comprised of
four acres and is operated and maintained by one CDOT Maintenance representative. The
restroom building is 2,296 square feet and the design reflects the local context of the area. The
rest area is managed by CDOT Region 3. The actual rest area property is owned by the USFS
and leased to CDOT. Any CDOT rest area improvements or changes that alter the area aesthetics
must be approved by the USFS (USDA, 2010). Figure 11 shows the site plan for the Hanging
Lake Rest Area.
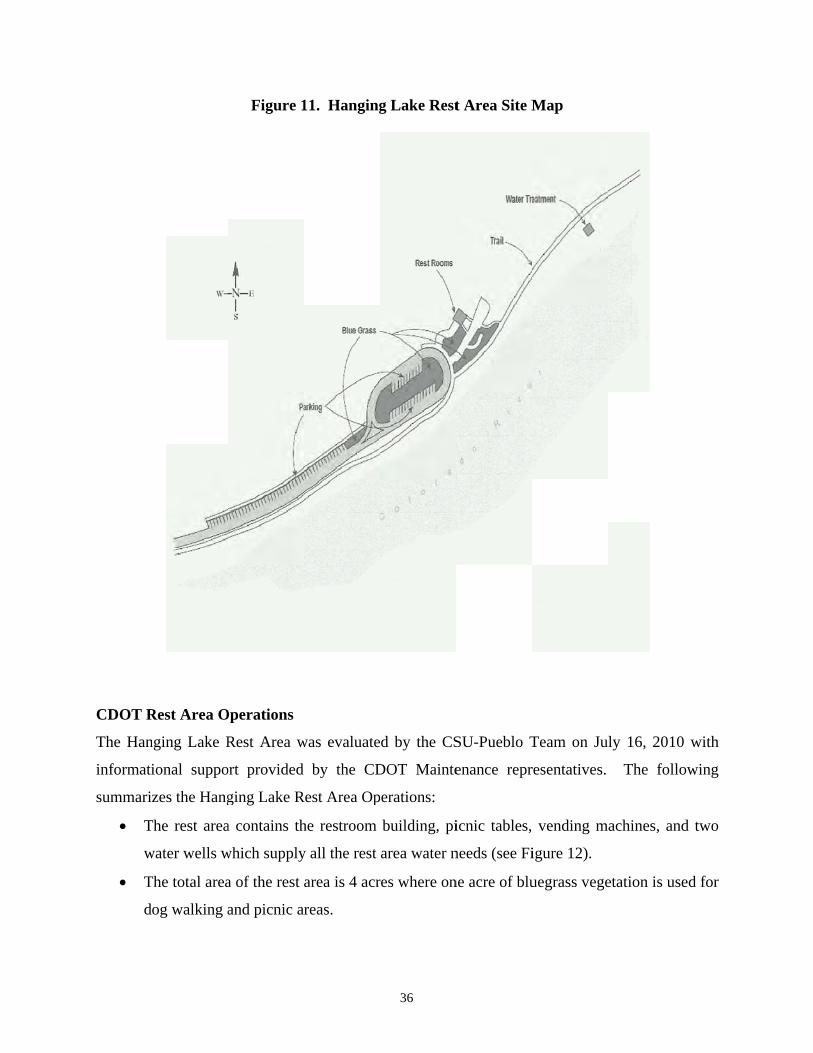
CDOT R
The Han
informati
summariz
T
w
T
d
Rest Area O
nging Lake R
ional suppo
zes the Hang
The rest area
water wells w
The total area
og walking a
Figure 1
Operations
Rest Area w
ort provided
ging Lake R
a contains th
which supply
a of the rest
and picnic ar
11. Hanging
was evaluate
by the CD
Rest Area Op
he restroom
y all the rest
area is 4 acr
reas.
36
g Lake Rest
d by the CS
DOT Mainte
erations:
building, pi
area water n
res where on
t Area Site M
SU-Pueblo T
enance repr
icnic tables,
needs (see Fi
ne acre of blu
Map
Team on Ju
resentatives.
vending m
igure 12).
uegrass vege
ly 16, 2010
The follo
achines, and
etation is use
with
owing
d two
ed for
37
Native grasses and vegetation are allowed to grow along the perimeter of the rest area
which covers approximately three acres. Native grass provides a buffer between the rest
area and sensitive environmental areas, such as wetlands and riparian vegetation along
the Colorado River.
There is an onsite wastewater treatment system that is permitted by the Colorado
Department of Public Health and Environment to discharge directly into the Colorado
River (see Figure 13). The Packed Bed Recirculation Treatment system that uses ozone
treatment wastewater is managed for CDOT by an outside contractor (Alpine
Environmental Consultant-Glenwood Springs).
Domestic and irrigation water is supplied by an onsite well.
There are 72 parking spaces mostly used by hikers and tourists using the Hanging Lake
Trail. There is no large truck parking at the rest area due to the configuration of the rest
area ingress and egress from Interstate 70.
There are no stormwater best management practices and stormwater discharges; only a
natural vegetated depression adjacent to the Colorado River (see Figure 14).
The rest area is maintained by one worker whose base of operations is the CDOT
Maintenance Facility in Glenwood Springs, which is nine miles from the rest area.
Native vegetation is used as a buffer zone between the Colorado River and the rest area
(see Figure 15).

Figuree 12. Hangin
Figure 1
ng Lake Re
13. Hangin
est Area Ma
g Lake Rest
38
ain Entrance
t Area Was
e and Walk
tewater Tre
kway near C
eatment Sys
Colorado Riv
stem
ver

Figu
Figu
ure 14. Han
ure 15. Han
nging Lake R
nging Lake
Rest Area U
Rest Area M
39
Unprotected
Mixture of N
d Stormwate
Native and N
er and Vege
Non-Native
etated Ditch
e Vegetation
h
n
40
Hanging Lake Rest Area Carbon Footprint
Scope 1 greenhouse gas emissions from the Hanging Lake Rest Area include maintenance
vehicles that transport materials, solid waste, and equipment to and from the CDOT Glenwood
Spring Maintenance Facility. Emission sources also include onsite maintenance equipment such
as mowers, weed eaters, snow blowers, and snow removal equipment. The total average
gasoline consumption for the Hanging Lake Rest Area is 1,154 gallons/year which produces an
annual scope 1 carbon footprint of 10.3 metric tons CO2e/year.
Scope 2 greenhouse gas emissions are produced by electric consumption of the rest area.
Hanging Lake Rest Area uses electricity for heating, lighting, water pumps and wastewater
treatment. The average annual consumption for the Hanging Lake Rest Area is 154,818
kWh/year (Excel Energy, 2010). The total scope 2 carbon footprint for the Hanging Lake Rest
Area is 132.9 metric tons CO2e/year.
Scope 3 greenhouse gas emissions are a result of overnight idling trucks. This does not apply to
the Hanging Lake Rest Area since it does not receive any semi-trailer truck visitations.
The total estimated carbon footprint for the Hanging Lake Rest Area is 143.2 metric tons
CO2e/year.
Hanging Lake Rest Area Sustainability Scoring Overview
The overall Hanging Lake Rest Area sustainability score was 31 out of 118 points. The following
summarizes the existing sustainability actions and total rest area scores for all of the evaluation
criteria (see Hanging Lake Scoring Sheet in Appendix C for details).
Materials and Reuse Score – signage to promote no littering or trash dumping at rest area
(1 of 13 points)
Environment/Site Condition Score – native vegetation provides an excellent buffer zone
between the rest area operations and the Colorado River that provides protection to the
Colorado River and the local wildlife (10 of 25 points)
Air Quality Score – one of the first CDOT rest areas to adopt the use of “green” cleaning
chemicals (2 of 13 points)

41
Water Quality/Usage Score – water-saving faucets are used in the restroom areas (3 of 21
points)
Energy Score – uses natural ventilation for cooling in lieu of air conditioning (10 of 31
points)
Public/Motorist/Trucking Information – rest area uses security cameras for public
security and context sensitive design that fits the canyon area (5 of 11 points)
Innovation Score – (0 of 4 points)
Hanging Lake Rest Area Observations and Recommendations
The Hanging Lake Rest Area does not have a recycling program for paper, aluminum, glass, and
plastic materials. The staff did not seem to have an interest in such a program due to safety issues
(encountering syringe needles, or meth-lab residues) and enticing wildlife to look for food in the
recycling receptacles. CDOT could consider providing visitors with bins for recyclable items
such as plastic, glass, aluminum, and paper since recycling has become an accepted practice and
is expected by the traveling public. Recycled materials can be transported to Glenwood Springs
for processing. Recycling can reduce the amount of waste being transported and landfilled and
would reduce operating costs. Animal-proof recycle bins can be used in the Hanging Lake Rest
Area due to the active local wildlife. Recycle containers can also be designed to accommodate
specific bottle types to reduce the potential for the disposal of unwanted waste. A waste
compactor could also be considered to reduce waste volume and number of trips to the disposal
area.
The Hanging Lake Rest Area has the second highest water consumption of all the Project rest
areas, with the majority of water used to irrigate non-native grass (a total average of 135,600
gallons/per month). The annual consumption for the rest area for the year 2009 was 1.6 million
gallons which may have been influenced by an irrigation system line break. CDOT Maintenance
representatives could monitor water usage records in order to identify unusually high water
consumption and signal an operational problem.
The three urinals in the men’s restroom area automatically flush 1.6 gallons every 10 minutes.
This is the only automated flushing system among the Project rest areas. This automatic flushing

42
was taking place even when the rest area was closed for 3 months (estimated discharge of 60,963
gallons), in order to maintain the optimization of the wastewater treatment system. CDOT
Maintenance could consider a third-party evaluation of the water conservation practice
performed at the rest area. The amount of water used for urinal flushing and toilet flushing (1.6
gallons per flush) may be excessive and generates approximately 243,885 gallons of discharge
per year. The wastewater treatment system could be evaluated to determine if less wastewater
flow could reduce treatment costs. While cost reduction is important, the efficient use of a finite
resource such as water is also an important environmental stewardship practice.
There are very limited alternative energy options at Hanging Lake due to the canyon topography.
Electric energy is the only source of power for the Hanging Lake Rest Area. It is used for
lighting, heating, water pumping, and wastewater treatment. The average total electrical
consumption for the Hanging Lake Rest Area is 154,818 kWh/year, which is the second most
annual consumption among the Project rest areas. The main constraint for using solar power is
the limited amount of sunlight due to the steep and narrow Glenwood Canyon. Cost-effective,
innovative energy alternatives such as geothermal energy could be considered to reduce the
electrical heating demand of the rest area, due to the presence of high yielding groundwater wells
onsite.
The restroom building does not have motion detectors to initiate nighttime lighting in order to
conserve energy. There are two levels of outdoor lighting systems at the rest area; lower lamp
lighting for pedestrian walking and higher lighting poles for vehicle parking. There seems to be a
redundancy in lighting the overall rest area near the restroom building and picnic areas. The
lighting system should be evaluated to ensure there is electrical and lighting efficiency without
compromising public safety. It is unclear how many people use the rest area facilities at night.

43
4.4 Vail Pass Rest Area Rest Area Setting
The Vail Pass Rest Area is located on Interstate 70 at mile marker 190 on top of Vail Pass
(elevation 10,666 feet). The rest area is in Eagle County and located on the southern side of
Interstate 70 adjacent to Shine Pass Road. The rest area is above tree line and is characterized as
a sub-alpine zone by Engelmann spruce, bristle cone pine, lodge pole pine and aspen (Pesman,
1967). The occurrence of Ten Mile Creek, beaver dams, wetlands, and fragile riparian vegetation
makes this a very sensitive environment adjacent to the rest area. The rest area is characterized as
a Tier II rest area that represents a recreational type rest area. The rest area was constructed in
1980 and is open year round 24 hours a day with a yearly visitation of approximately 680,000
people (Thomas, 2010); by far the most visited of the Project rest areas. It is a unique rest area
since it receives large amounts of tourist and recreational traffic in both the summer and winter;
bicyclists and tourists in the summer and skiers and snowmobilers in the winter. Based upon
conversations with CDOT representatives, the rest area is undersized relative to the number of
rest area visitors. The Vail Pass Rest Area is operated and maintained by CDOT Region 1. The
rest area property is owned by the USFS and leased to CDOT. Any CDOT rest area
improvements or changes that affect the area aesthetics must be approved by the USFS (USDA,
2010). Figure 16 shows a site map of the Vail Pass Rest Area.
Vail Pass Rest Area Operations
The Vail Pass Rest Area was evaluated by the CSU-Pueblo Team on July 15, 2010 with
informational support provided by the CDOT Maintenance representatives. The following
summarizes the Vail Pass Rest Area Operations:
The Vail Pass Rest Area is comprised of 2.6 acres and contains a restroom
building, picnic tables, vending machines, and a wastewater treatment system that
discharges into the headwaters of Ten Mile Creek (see Figures 17 and 18).
The rest area is adjacent to the Vail Pass-Ten Mile Creek Bicycle Trail that is a popular
tourist and local bicycling trail.
There are 73 spaces for car and RV parking. Very few large freight trucks use the rest
area due to the tight access road configuration and the presence of a truck parking area
near the CDOT Maintenance Patrol Shed on Interstate 70 near mile marker 189.

T
T
se
The rest area
The Eisenhow
erves as the
is serviced b
wer-Johnson
base location
Figur
by two CDO
n Memorial
n for the ma
re 16. Vail P
44
OT Maintena
Tunnels (13
aintenance cr
Pass Rest A
ance employe
3 miles east
rew.
Area Site Ma
ees
of the Vail
ap
Pass Rest AArea)

Figuure 17. Vai
Figure 18.
il Pass Rest
Vail Pass R
45
Area Parki
Rest Area R
ing Area (lo
Restroom Str
ooking east)
ructure
)

46
The rest area crew cleans the restroom area twice per day. The restroom structure is
partially buried as it was built within a sloped-hill area; this design moderates the inside
temperature from being too hot in the summer and too cold in the winter (see Figure 19).
The rest area has an onsite waste treatment system that uses a sequencing batch reactor
prior to wastewater discharge into Ten Mile Creek. The rest area has a National Pollutant
Discharge Elimination System (NPDES) Permit from the Colorado Department of Public
Health and Environment for wastewater discharge.
The domestic water usage comes directly from Ten Mile Creek via a pump house located
down gradient from a beaver pond (see Figure 20).
Vail Pass Rest Area Carbon Footprint
Scope 1 greenhouse gas emissions from the rest area involve the use of CDOT vehicles that
transport equipment, operate equipment, solid waste, and personnel to and from the Eisenhower-
Johnson Memorial Tunnels and the operation of equipment necessary to operate and maintain the
rest area. The total amount of gasoline used at the Vail Pass Rest Area is 1,204 gallons that
generates an annual scope 1 carbon footprint of 10.7 metric tons CO2e/year.
Scope 2 greenhouse gas emissions are from the generation of purchased electricity consumed.
This type of indirect emission is a result of rest area heating, air ventilation, lighting and waste
treatment. The average annual electrical consumption for the Vail Pass Rest Area is 268,290
kWhr/year (Excel Energy, 2010); this results in a Scope 2 footprint of 230.3 metric tons
CO2e/year.
Scope 3 greenhouse gas emissions are a consequence of activities that occur from sources not
owned or controlled by the CDOT. The main rest area source for this type of indirect emission is
from truck idling. The Vail Pass Rest Area has approximately four freight trucks idling for
greater that 8 hours per night; therefore, the scope 3 emissions are 645.3 metric tons CO2e/year
(73% of the total rest area carbon footprint).
The total estimated carbon footprint for the Vail Pass Rest Area is 886 metric tons CO2 e /year.

Figure 19.
Fi
Vail Pass R
igure 20. W
Rest Area N
Water Pump
47
Native Grass
From Vail
s and Conte
Pass Ten M
xt Sensitive
Mile Creek
e Design
48
Vail Pass Rest Area Sustainability Scoring Overview
The overall Vail Pass Rest Area sustainability score was 37 out of 117 points which was the
highest score among all the Project rest areas. The following summarizes some of the current
sustainability actions and the total sustainability scoring (see Vail Pass Rest Area Scoring Sheet
in Appendix C for details):
Materials and Reuse Score – signage to promote no dumping or littering at the rest area
(1 of 14 points)
Environmental/Site Conditions Score – good vegetative buffer that separates the rest area
services from Ten Mile Creek and associated wetlands. The area is dominated by native
vegetation without using lawn irrigation and no herbicide and fertilizer applications.
There is no rest area fencing that would interfere with wildlife movement (14 of 25
points)
Air Quality Score – no smoking signs in restroom areas (2 of 15 points)
Water Quality/Usage Score – no lawn or plant irrigation, water conservation studies
performed, bio-solids recycled as compost (5 of 21 points)
Energy Score – natural ventilation used instead of air conditioning, natural lighting via
sky lighting, solar powered emergency phone (6 of 30 points)
Public/Motorist/Trucking Outreach Score – context design of the restroom structure,
security cameras used on site, (5 of 11 points)
Innovation Score – the only rest area to receive innovation points for its restroom area
design. The structure is built within a hill and is partially buried, which moderates the
temperatures in the summer and winter thus saving heating energy costs (4 of 4 points)
Vail Pass Rest Area Observations and Recommendations
The volume of solid waste generated and handled at the rest area is 1,820 cubic yards per year
(35 cubic yards per week on average) at an annual cost of $17,200 (Thomas, 2010). The volume
of waste generation is by far the highest among all the Project rest areas. There are recycling
options available at the rest area at the Town of Vail Recycling Center. To reduce the volume of
solid waste, the traveling public can be provided with the opportunity to recycle their aluminum
cans, plastic bottles, and glass containers at the rest area. Much of the solid waste at the rest area
is from bottled water or carbonated beverage containers sold at the rest area. Recycle containers

49
can be designed to accommodate specific bottle types to reduce the potential for the disposal of
unwanted waste. The recycled material could be transported to the Town of Vail or Frisco
recycling centers on a routine basis. In addition, the use of a solar waste compactor could also be
considered to reduce waste volume and number of trips to the CDOT Maintenance area for
disposal that is 13 miles from the Vail Pass Rest Area (see Appendix G).
The Vail Pass Rest Area is dominated by natural vegetation and does not use irrigation
practices. It was noticed that extensive grass eating/mowing practices are used to trim or mow
the native grass species in areas near restroom entrance area. It was estimated that 15 hours a
week is spent on native grass control, which seems excessive. This type of grass control may be
needed in areas near pet walks and picnic table locations; however, reduced weed eating/mowing
of native grasses will allow for improved plant density by encouraging seed dispersal near the
restroom area and improve the overall native aesthetics.
The Vail Pass Rest Area uses standard retail type cleaning chemicals (Pine-Sol and Windex) that
are not compliant with the State of Colorado Environmentally Preferable Purchasing Policy
(2009). The policy specifies the use of cleaning chemicals that are environmentally compatible
without toxic chemicals or high VOCs that contribute to greenhouse gas emissions and those
chemicals that are biodegradable without phosphorous. Coordination between the rest areas and
with procurement office staff could be done to obtain a list of environmentally preferable
cleaning materials that are effective.
CDOT has an existing stormwater management program for construction and post-construction
projects and maintenance facilities. There is no regulatory requirement for the placement of best
management practices in rest areas, although they do have large amounts of impervious surfaces
and potentially contain pollutants (sediments, metals and oil and grease). CDOT could develop
best management practices to prevent stormwater and its associated pollutants from entering the
headwaters of Ten Mile Creek by:
Ensuring exposed areas are vegetated/mulched,
Ensuring stormwater inlet protection is in place and maintained,
Sweeping traction sand and other sediment material frequently,

50
Evaluating and modifying the existing vegetated depression area (near treatment
building) to accommodate the stormwater from the parking area as a final BMP before
stormwater discharge,
Ensuring there is a final BMP for the all stormwater discharge outlets, and
Evaluating snow storm storage management to ensure traction sand/snow is contained to
prevent discharge into the headwaters of Ten Mile Creek.
The volume of water used for urinal and toilet flushing is 1.6 gallons per flush. These volumes
are high in comparison to other Project rest areas. It is recommended that a water conservation
study be performed at the rest area to reduce water consumption and to make sure that the waste
treatment operations are in sync with incoming volumes and loading to potentially reduce waste
treatment operating costs.
There are alternative energy generation options at Vail Pass. Electric energy is the only power
source for the Vail Pass Rest Area and is used for rest area heating, lighting, water pumping, and
wastewater treatment. The rest area has sufficient space to contain photovoltaic cell panels on
existing roof surfaces and potentially as a ground array. There are several constraints in the
establishment of photovoltaic cell panels such as snow accumulation, USFS aesthetic guidelines,
and system maintenance. The design and implementation of photovoltaic cells could have an
impact on the rest area’s carbon footprint and reduction in electrical consumption cost.
Photovoltaic cells could also demonstrate to rest area visitors CDOT’s commitment to alternative
energy.
There are several energy conservation actions that can be taken by the Vail Pass Rest Area to
reduce electrical consumption, such as the use of motion detectors to initiate restroom lighting
during nighttime hours. Motion detectors can be placed in strategic places to avoid vandalism
and initiate lighting well ahead of entering the restroom for security. The intensity of the lighting
can be changed inside the restroom area to accommodate the sky lighting that can add significant
amount of lighting during the daytime. The use of an on-demand hot water heater, potentially in
combination with a solar hot water heating system, could be an important energy reduction
action.
51
4.5 El Moro Rest Area
Rest Area Setting
The El Moro Rest Area is located on Interstate 25 at mile marker 17 just north of Trinidad
(approximate elevation of 6,025 feet). The rest area is located on the western side of Interstate 25
on County Road 71 in Las Animas County. The El Moro Rest Area is a Tier III rest area that
provides only basic services to the traveling public. The rest area was built in 2000 and is open
year round 24 hours a day, seven days a week with a yearly visitation of approximately 328,500
people. The rest area resides in a semi-arid, high plains eco-region where there is a broad mixture
of wildlife such as deer, elk, raptors, snakes and coyotes. El Moro is an important rest area since
it is the first rest area encountered when entering Colorado from New Mexico on Interstate 25
and provides the traveler a first impression of Colorado. The El Moro Rest Area is operated and
maintained by CDOT Region 2. A site map of the rest area is provided in Figure 21.
El Moro Rest Area Operations
The El Moro Rest Area was evaluated by the CSU-Pueblo Team on August 6, 2010 with
informational support provided by the CDOT Maintenance representatives. The following
summarizes the El Moro Rest Area Operations:
The El Moro Rest Area is comprised of 7.1 acres of which are five acres of bluegrass is
mowed once per week.
This rest area contains a restroom building (2,400 square feet), 11 picnic tables, vending
machines, and a walking path (see Figure 22).
There are 39 parking spaces for cars and small recreational vehicles.
Large commercial trucks and large recreational vehicles have a total of 14 parking spaces
to use. In the winter, all of these commercial parking spaces are used at night.
The rest area is serviced by two CDOT Maintenance employees.
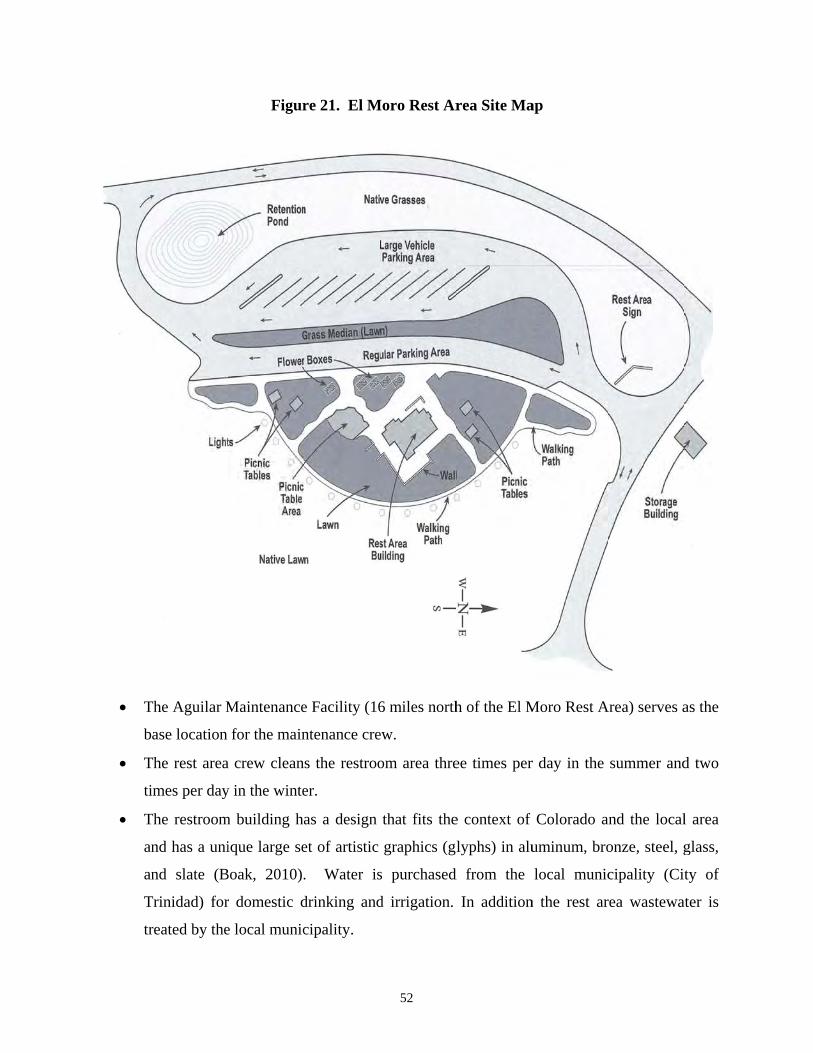
T
b
T
ti
T
an
an
T
tr
The Aguilar M
ase location
The rest area
imes per day
The restroom
nd has a uni
nd slate (B
Trinidad) for
reated by the
Figur
Maintenance
for the main
a crew clean
y in the winte
m building ha
ique large se
Boak, 2010).
r domestic d
e local munic
re 21. El M
e Facility (16
ntenance cre
s the restroo
er.
as a design
et of artistic
. Water is
drinking and
cipality.
52
Moro Rest Ar
6 miles north
ew.
om area thre
that fits the
graphics (gl
s purchased
d irrigation.
rea Site Ma
h of the El M
ee times per
e context of
lyphs) in alu
d from the
In addition
ap
Moro Rest A
r day in the
Colorado a
uminum, bro
local munic
n the rest ar
Area) serves a
summer and
and the local
onze, steel, g
cipality (Cit
rea wastewa
as the
d two
l area
glass,
ty of
ater is

53
Spray irrigation is used to irrigate the five areas of bluegrass and drip irrigation methods
are used for native plant landscaping (see Figure 23).
Stormwater is managed by a retention basin that is occupied by wetlands (see Figure 24).
El Moro Rest Area Carbon Footprint
Scope 1 greenhouse gas emissions from the rest area involve the use of CDOT vehicles that
transport equipment, operate equipment, solid waste, and personnel to and from the Aguilar
Maintenance Facility. The combustion of the fuel from equipment necessary to operate and
maintain the rest area is also part of this emission type. In addition, the use and combustion of
natural gas for heating is an important Scope 1 emission source. The total amount of gasoline
used at the El Moro Rest Area is 65 gallons per year, the total amount of diesel used is 1,154
gallons, and the annual average consumption of natural gas is 5,307 therms. Collectively, these
emissions generate an annual scope 1 carbon footprint of 59.3 metric tons CO2e/year.
Scope 2 greenhouse gas emissions are from the generation of purchased electricity consumed by
CDOT. This type of indirect emission is a result of rest area lighting and other maintenance
electrical uses. The average annual electrical consumption for the El Moro Rest Area is 2,527
kWhr/year (Johnson Controls, 2010); this results in a scope 2 footprint of 2.2 metric tons
CO2e/year. The electrical consumption seems very low in comparison to other Project rest areas;
Johnson Controls could verify this electrical consumption rate as part of their rest area
evaluations.

F
Figure 22. E
Source
El Moro Re
e: www.bookar
est Area Ent
t.com/PublicAr
54
trance Area
rt2.html
a with Coppper Siding aand Roof

Figur
re 23. El M
Figure 24
Moro Rest Ar
4. El Moro
rea Large L
Rest Area F
55
Lawns of Blu
Flower Box
uegrass (loo
with Drip W
oking north
Watering Sy
h at rest area
ystem
a)

F
Scope 3
owned or
idling. T
hours or
total carb
The total
El Moro
The over
summariz
Scoring S
M
u
Figure 25.
greenhouse
r controlled
The El Moro
greater; the
bon footprint
l estimated c
o Rest Area
rall El Moro
zes some o
Sheet in App
Materials and
ses a mulchi
El Moro Re
gas emissio
by CDOT.
o Rest Area
refore, the S
t).
carbon footpr
Sustainabil
o Rest Area
of the sustai
pendix C for
d Reuse Sco
ing mower to
est Area Sto
ons are conse
The main re
has an aver
Scope 3 emi
rint for the E
lity Scoring
a sustainabil
inability act
r details):
ore – uses re
o reduce sol
56
ormwater P
equences fro
est area sour
rage of 14 tr
issions are 2
El Moro Res
Overview
lity score w
tivities and
ecycled asph
id waste disp
onds with W
om activities
rce for this ty
rucks idling
2,219 metric
st Area is 2,2
as 32 out o
total scorin
halt material
posal (5 of 1
Wetland Ve
s that occur
ype of emiss
per night fo
tons CO2e/
281 metric to
of 117 point
ng (see El M
for surface
13 points)
getation
from source
sion is from
or a duration
/year (97% o
ons CO2e/ye
ts. The follo
Moro Rest
repairs, rest
es not
truck
n of 8
of the
ear.
owing
Area
t area

57
Environmental/Site Conditions Score – buffer zones to protect sensitive areas, drip
irrigation used for native species plants (7 of 25 points)
Air Quality Score – smoking prohibited in restroom areas (2 of 13 points)
Water Quality/Usage Score – effective stormwater best management practices using
wetlands (3 of 21 points)
Energy Score – energy conservation methods used in the rest area include efficient
lighting (compact fluorescent bulbs) and the use of natural ventilation in lieu of air
conditioning (11 of 30 points)
Public/Motorist/Trucking Outreach Score – context sensitive design with the local
community and environment, local community information provided to visitors (4 of 11
points)
Innovation Score – (0 of 4)
El Moro Rest Area Observations and Recommendations
No recycling options are available at the rest area. The large amount of commercial and public
vehicles using the rest area offers the opportunity for recycling. The rest area has a total of 18
trash cans that collect a high quantity of waste from the traveling public. Recycling containers
could be provided to reduce the three cubic yards per day of solid waste that eventually ends up
in the Trinidad Landfill. The recycled material (glass, aluminum cans, and fibers) can be taken to
the town of Trinidad for processing. In addition, trash compaction using a solar powered
compactor will reduce trash volumes and frequency of trash pickups. Appendices F and G
provide the cost savings that could be realized by CDOT using the solar compactor.
There are opportunities to improve the natural wildlife in and around the rest area. To improve
the habitat for wildlife, the mowing of the native vegetation east of the walking path could be
reduced. This may improve the plant density for wildlife habitat, consumption, and mobility
while reducing the labor and fuel needed to mow the vegetation.
There are a relatively high number of truckers (average of 14 per day) that use this rest area over
night and idle for eight hours or longer. To reduce the amount of greenhouse gases emitted from
idling trucks, idling restriction signs could be placed in the commercial vehicle parking lot. If
58
there were restrictions on the length of idling times or electrical hookup present, drivers could
plug their trucks into an outlet (electrification) and the amount of greenhouse gases could be
reduced. CDOT could consider the potential of instituting a pilot study at El Moro and other high
truck idling areas using truck electrification to reduce truck idling and emissions.
The domestic water used for restrooms and irrigation is purchased from the City of Trinidad.
Wastewater generated at the rest area is transferred and treated by the City of Trinidad. The total
amount of water consumed is approximately 39,554 gallons per year. Since the lawn is irrigated
seven days a week in the summer, it is assumed that most of the purchased water is used to
irrigate the non-native grass lawn. Approximately five acres of bluegrass within the rest area are
being irrigated. This size of lawn and type of non-native grass require a large amount of water to
survive in the dry conditions found in the Trinidad area (Lockhart, 2004).
Based upon discussions with CDOT Maintenance representatives, there is a concern about the
excessive amount of driving necessary to get to work. CDOT representatives who live in
Trinidad drive to Aguilar to get a work truck, although there is a CDOT office in the closer
Trinidad, and then drive 16 miles to the rest area. If employees could park the CDOT trucks at
the CDOT Trinidad office, the amount of diesel used for all the driving back and forth could
drastically decrease because Trinidad is only about two miles away from the rest area. This could
decrease the rest area’s fuel consumption and the carbon footprint.
4.6 Sleeping Ute Mountain Rest Area
Rest Area Setting
The Sleeping Ute Mountain Rest Area is located on US Highway 60 at mile marker 46.4 and is
about six miles east of Cortez (elevation 6,200 feet). The rest area is in Montezuma County and
located on the northern side of US Highway 60 directly north of Mesa Verde National Park. The
rest area is representative of a Tier III rest area that provides basic services. The rest area was
constructed in the 1970s and retrofitted in 1998. The 10.4 acre rest area is open year round 24
hours a day, seven day a week with annual average visitation of approximately 65,700 people.
Unique to this rest area is a long walking path through the Juniper and Pinon Pine forest that is

59
adjacent to Bureau of Land Management property. The Sleeping Ute Mountain Rest Area is
operated and maintained by CDOT Region 5. A site map is provided in Figure 26.
CDOT Rest Area Operations
The Sleeping Ute Mountain Rest Area was evaluated by the CSU-Pueblo Team on July 9, 2010
with informational support provided by the CDOT Maintenance representatives. The following
summarizes the Sleeping Ute Mountain Rest Area Operations:
The rest area is dominated by native vegetation and occupied by approximately 820
Juniper and Pinon Pine trees (see Figure 27).
The Sleeping Ute Mountain Rest Area contains a 1,245 square foot restroom building,
picnic tables, vending machines, a walking path, and housing for the onsite CDOT
employee (see Figures 28 and 29).
The restroom building is surrounded by 900 square feet of bluegrass that is irrigated three
to four times per week (see Figure 30).
There is a total of 40 parking spaces, with 37 for car and RV parking and three for large
freight trucks.
The rest area is serviced by one CDOT Maintenance employee who lives onsite. Since
there is a CDOT Maintenance representative who lives on location, there is little travel to
and from Cortez or Durango to maintain the rest area.
The CDOT Maintenance facility in Cortez (six miles east of the Sleeping Ute Mountain
Rest Area) serves as the base location.
The employee goes to the CDOT facility in Cortez only once a week for supplies. The
onsite Maintenance employee cleans the restroom area daily.
Sleeping Ute Mountain Rest Area Carbon Footprint
Scope 1 greenhouse gas emissions from the rest area involve the use of CDOT vehicles that
transport equipment and personnel to and from the Cortez Maintenance facility and the use of
equipment necessary to operate and maintain the rest area and propane (1,806 gallons per year)
(AmeriGas, 2010) for restroom heating. The annual fuel consumption used at the Sleeping Ute
Mountain Rest Area is approximately 22 gallons of gasoline and 815 gallons of diesel that
generates an annual scope 1 carbon footprint of 23 metric tons CO2e/year.
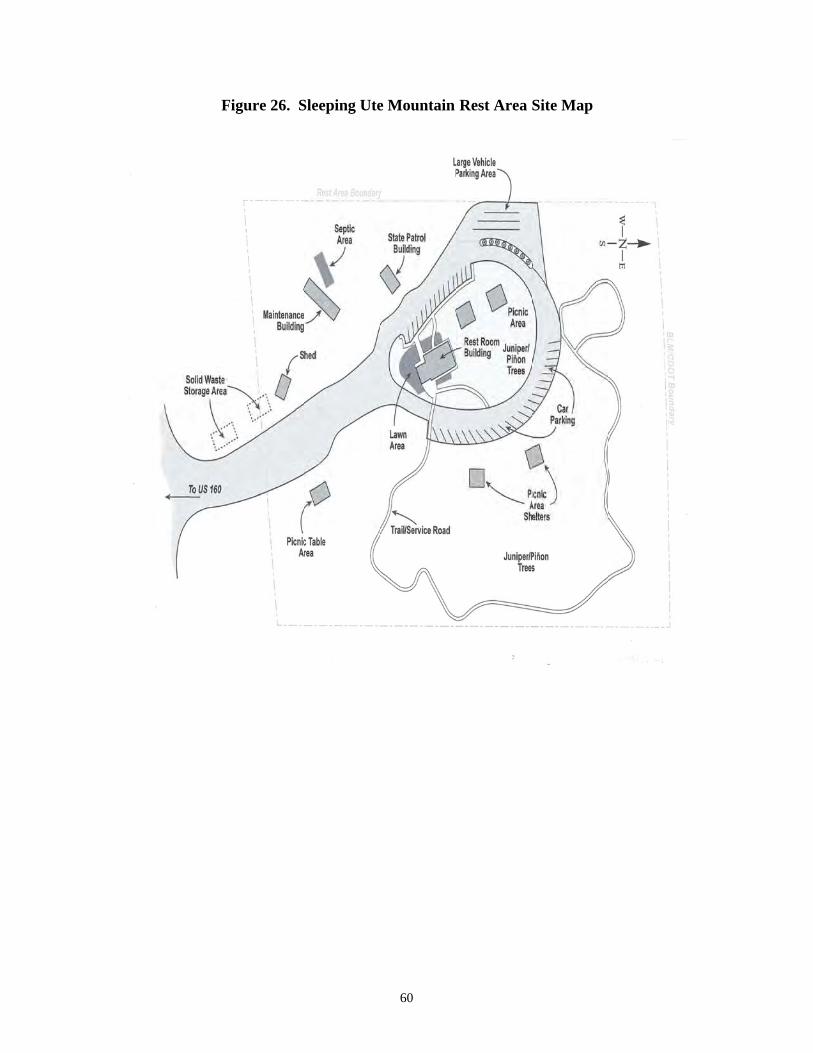
FFigure 26. SSleeping Ute
60
e Mountain
Rest Area SSite Map
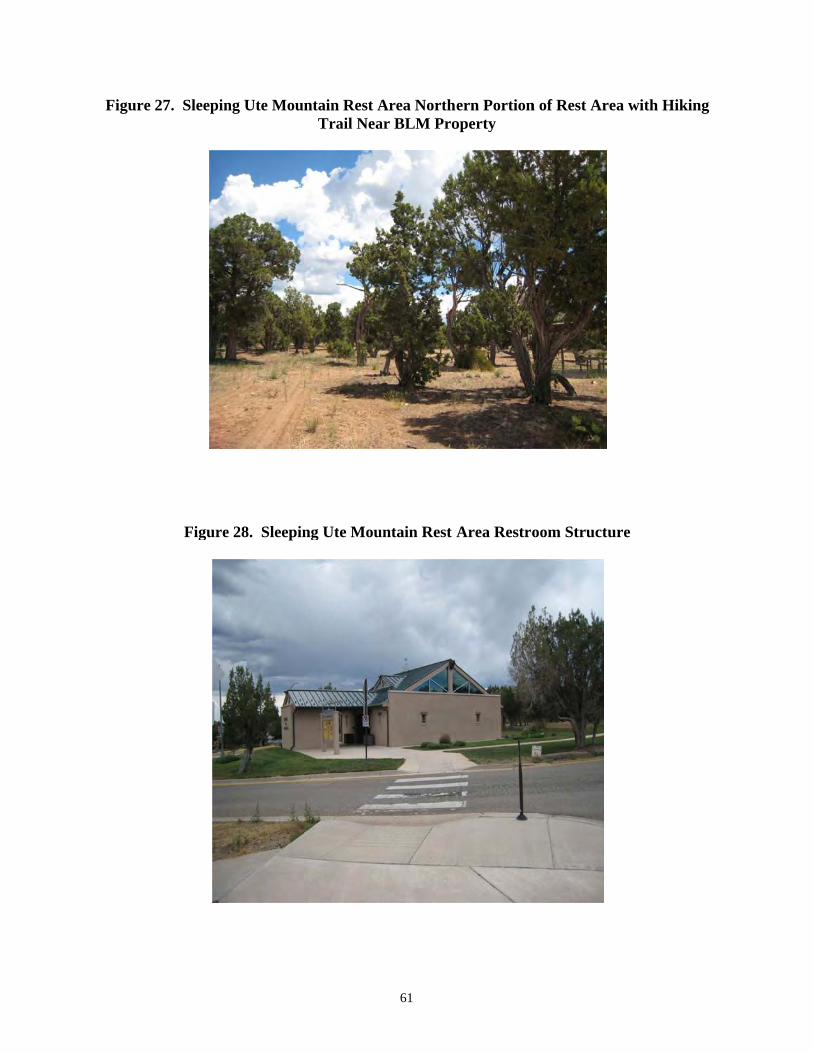
Figure
27. Sleepin
Figure
ng Ute Mou
e 28. Sleepin
ntain Rest ATrail Nea
ng Ute Mou
61
Area Northear BLM Pro
untain Rest A
ern Portionoperty
Area Restro
n of Rest Ar
oom Structu
rea with Hik
ure
king

Figur
Figure 3
re 29. Sleep
30. Sleeping
ping Ute Mo
g Ute Moun
ountain Rest
ntain Rest A
62
t Area Exam
Area Lawn A
mple of Picn
Area Surrou
nic Shelters
unding Rest
in Rest Are
troom Struc
ea
cture

63
Scope 2 greenhouse gas emissions are from the generation of purchased electricity consumed by
CDOT. This type of indirect emission is a result of rest area heating, air ventilation, and lighting.
The average annual electrical consumption for the Sleeping Ute Mountain Rest Area is 57,948
kWh/year (Empire Electric, 2010); this results in a scope 2 footprint of 50 metric tons CO2e/year.
Scope 3 greenhouse gas emissions are a consequence of activities that occur from sources not
owned or controlled by CDOT. The main rest area source for this type of indirect emission is
from truck idling. Scope 3 greenhouse gas emissions are a result of overnight idling trucks. This
does not apply to the Sleeping Ute Mountain Rest Area since it does not receive any semi-trailer
truck visitations.
The total estimated carbon footprint for the Sleeping Ute Mountain Rest Area is 73 metric tons
CO2e/year, the lowest among all the Project rest areas.
Sleeping Ute Mountain Rest Area Sustainability Scoring Overview
Overall, the Sleeping Ute Mountain Rest Area sustainability score was 35 out of 117 points. The
following summarizes the current sustainability actions and the rest area scoring (see Sleeping
Ute Mountain Rest Area Scoring Sheet in Appendix C for details):
Materials and Reuse Score – recycled/reused asphalt material was used to make pothole
repairs on the main rest area entrance (5 of 13 points)
Environmental/Site Conditions Score – wooden ranch rail fence that encloses the rest
area from BLM land and a natural Juniper and Pinon Pine forest surrounds the restroom
that provides shelter, food, and wildlife to migrate through the rest area. Less than 25%
of the rest area is routinely mowed thus allowing native vegetation to grow (10 of 25
points)
Air Quality Score – no smoking allowed in restroom areas (2 of 13 points)
Water Quality/Usage Score – reduced volume of water used for urinal flushing, water-
saving water faucets used in rest rooms (3 of 21 points)
Energy Score – motion detectors used in restroom areas to conserve electricity, natural
ventilation used in lieu of air conditioning and use of hand blowers instead of paper
towels (9 of 30 points)

64
Public/Motorist/Trucking Outreach Score – context sensitive design to local environment,
local community information provided to visitors, security camera used (6 of 11 points)
Innovation Score – (0 of 4 points)
Sleeping Ute Mountain Rest Area Observations and Recommendations
No recycling options are available to the public at the rest area. Recycling containers could be
provided to reduce the amount of solid waste that is produced from this rest area. The recycled
glass, aluminum, and paper can be taken to ECOtrez in Cortez. Recycling could reduce solid
waste amounts and decrease the solid waste disposal cost by reducing the waste pickup
frequency from 3 cubic yards per week to biweekly or monthly pickups. This recycling action
could reduce the amount of solid waste that is currently being taken to a landfill near Cortez.
The amount of water used for toilet volume flushing at this rest area was the second highest of all
the Project rest areas. The toilets use two gallons per flush. This may be an excessive amount of
water that increases that amount of water being purchased from the Mancos Rural Water
Company whose resulting wastewater is treated via an onsite septic system. Manually adjusting
the amount of water used for toilet flushing could be performed. The use of waterless urinals
could also be considered to significantly reduce the cost and amount of water used in the rest
area.
The 900 square foot bluegrass lawn that surrounds the restroom area is irrigated three to four
times per week. Water savings could be realized by replacing the lawn vegetation with native
vegetation that is adapted to the high desert climate. This vegetation could be combined with
other landscape features to form a xeriscape garden (Lockhart, 2004).
There are potential cost-effective alternative energy opportunities at Sleeping Ute Mountain Rest
Area. The existing energy sources for the Sleeping Ute Mountain Rest Area include both electric
and propane. The Sleeping Ute Mountain Rest Area has the space necessary to contain
photovoltaic cell panels on the existing roof surfaces and on the ground. There may be
constraints in the establishment of photovoltaic cell panels on the roof of the restroom building
because of the limited surface area. However, this rest area has a large amount of unused land

65
that could be used for the photovoltaic panels and arrays. The design and implementation of
photovoltaic cells could have a dramatic impact on the rest area’s carbon footprint and reduction
in electrical consumption cost. Photovoltaic cells could also demonstrate CDOT’s commitment
to alternative energy. Photovoltaic cells could be very beneficial to this rest that consumes only
57, 948 kWh of electricity per year (lowest among the Project rest areas).

66
CHAPTER 5. REST AREA CONCLUSIONS AND RECOMMENDATIONS
Specific sustainable observations for each Project rest area are provided in Sections 4.1 through
4.6. These observations were based upon site visitations and assessments that are compiled in a
Sustainable Rest Area Database (Appendix C). Existing rest area sustainable actions were rated
according to a scoring system established by the CSU-Pueblo Team. There are sustainability
based observations and recommendations that are common among all the Project rest areas and
possibly rest areas statewide. This section identifies and summarizes the following major
observations and conclusions identified for the Project rest areas:
Rest Area Sustainability Scoring
Summary of Rest Area Carbon footprints and Reduction Strategies
Alternative Energy Use for CDOT Rest Areas Using CDOT ROW
Coordination with Johnson Controls
Common Project Rest Area Sustainable Observations and Recommendations
Further Rest Area Sustainability Studies and Funding
5.1 Rest Area Sustainability Scoring
Rest Area Sustainability Scoring Criteria were developed as a tool to assess the level of
sustainability practices currently being used at the Project rest areas and provide a metric for
Project rest area comparison among scoring elements and categories. The scoring matrix is
composed of 6 categories comprising a total of 61 scoring elements with 117 being the
maximum number of points per rest area (Appendix D). The following summarizes the scoring
comparison:
Tier I rest area (visitor center type rest area) – Poudre Rest Area (33 points) higher than
the Sterling Rest Area (30 points)
Tier II rest area (recreational based rest area) – Vail Pass Rest Area (37 points) higher
than Hanging Lake (31 points)
Tier III rest area (basic rest area services) – Sleeping Ute Mountain Rest Area (35 points)
higher than the El Moro Rest Area (32 points)
Overall, the Vail Pass Rest Area obtained the most sustainability points among all the
Project rest areas with a score of 37 points
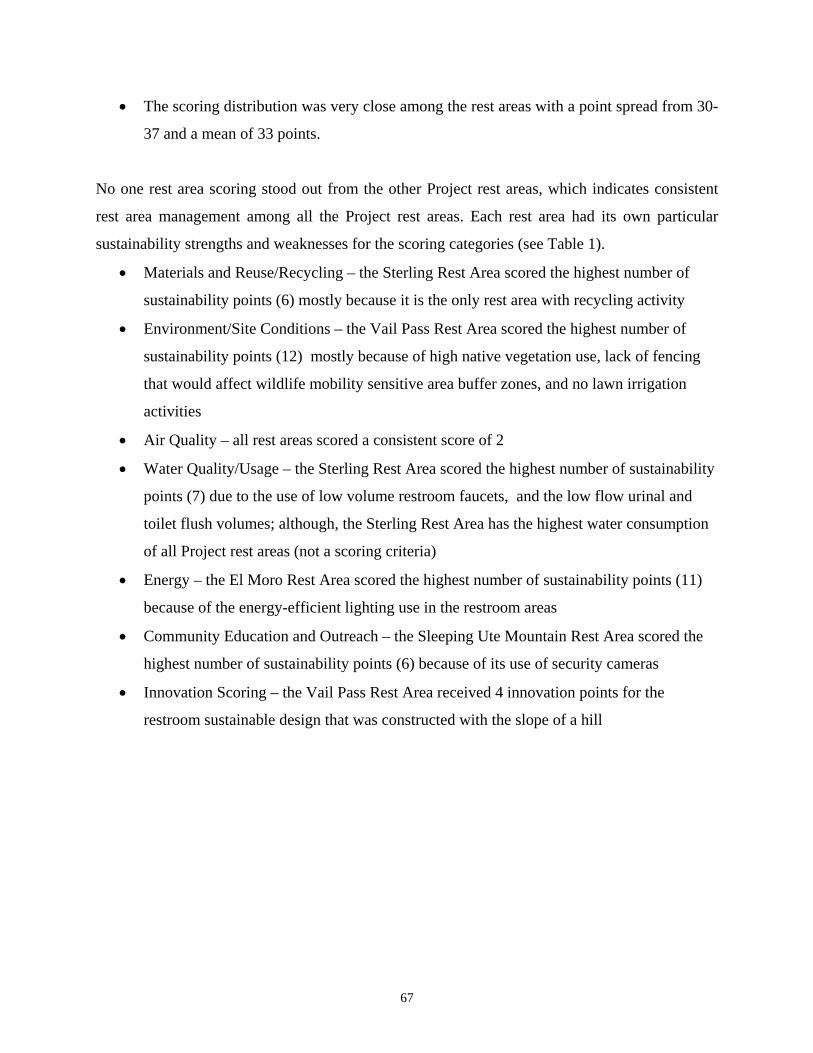
67
The scoring distribution was very close among the rest areas with a point spread from 30-
37 and a mean of 33 points.
No one rest area scoring stood out from the other Project rest areas, which indicates consistent
rest area management among all the Project rest areas. Each rest area had its own particular
sustainability strengths and weaknesses for the scoring categories (see Table 1).
Materials and Reuse/Recycling – the Sterling Rest Area scored the highest number of
sustainability points (6) mostly because it is the only rest area with recycling activity
Environment/Site Conditions – the Vail Pass Rest Area scored the highest number of
sustainability points (12) mostly because of high native vegetation use, lack of fencing
that would affect wildlife mobility sensitive area buffer zones, and no lawn irrigation
activities
Air Quality – all rest areas scored a consistent score of 2
Water Quality/Usage – the Sterling Rest Area scored the highest number of sustainability
points (7) due to the use of low volume restroom faucets, and the low flow urinal and
toilet flush volumes; although, the Sterling Rest Area has the highest water consumption
of all Project rest areas (not a scoring criteria)
Energy – the El Moro Rest Area scored the highest number of sustainability points (11)
because of the energy-efficient lighting use in the restroom areas
Community Education and Outreach – the Sleeping Ute Mountain Rest Area scored the
highest number of sustainability points (6) because of its use of security cameras
Innovation Scoring – the Vail Pass Rest Area received 4 innovation points for the
restroom sustainable design that was constructed with the slope of a hill
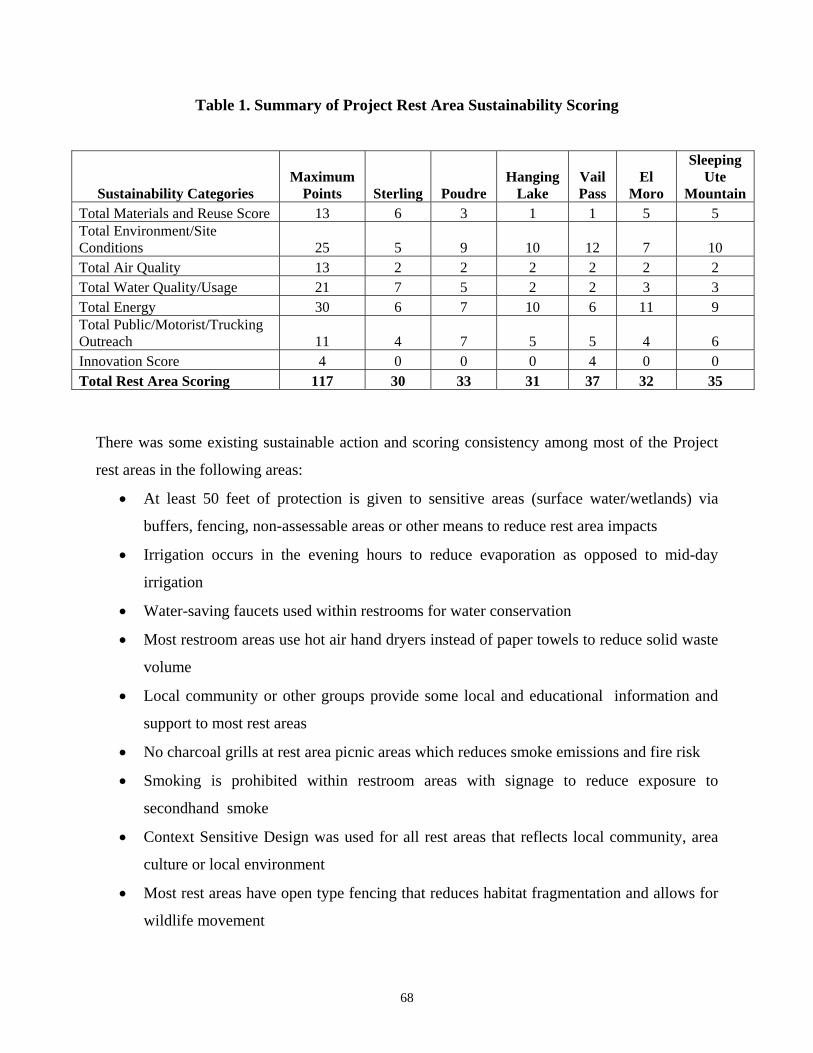
68
Table 1. Summary of Project Rest Area Sustainability Scoring
Sustainability Categories Maximum
Points Sterling PoudreHanging
LakeVail Pass
El Moro
Sleeping Ute
MountainTotal Materials and Reuse Score 13 6 3 1 1 5 5Total Environment/Site Conditions 25 5 9 10 12 7 10Total Air Quality 13 2 2 2 2 2 2Total Water Quality/Usage 21 7 5 2 2 3 3Total Energy 30 6 7 10 6 11 9Total Public/Motorist/Trucking Outreach 11 4 7 5 5 4 6Innovation Score 4 0 0 0 4 0 0Total Rest Area Scoring 117 30 33 31 37 32 35
There was some existing sustainable action and scoring consistency among most of the Project
rest areas in the following areas:
At least 50 feet of protection is given to sensitive areas (surface water/wetlands) via
buffers, fencing, non-assessable areas or other means to reduce rest area impacts
Irrigation occurs in the evening hours to reduce evaporation as opposed to mid-day
irrigation
Water-saving faucets used within restrooms for water conservation
Most restroom areas use hot air hand dryers instead of paper towels to reduce solid waste
volume
Local community or other groups provide some local and educational information and
support to most rest areas
No charcoal grills at rest area picnic areas which reduces smoke emissions and fire risk
Smoking is prohibited within restroom areas with signage to reduce exposure to
secondhand smoke
Context Sensitive Design was used for all rest areas that reflects local community, area
culture or local environment
Most rest areas have open type fencing that reduces habitat fragmentation and allows for
wildlife movement

69
Most rest areas conduct limited or no mowing practices around the rest area perimeter to
allow nesting and maintain habitat conditions
Dog run areas are available with collection bags or disposal requirement signage
5.2 Summary of Rest Area Carbon Footprints and Reduction Strategies
Carbon footprints were calculated for all the Project rest areas which incorporate scope 1
emissions (fossil fuel combustion onsite), scope 2 emissions (indirect emissions from electrical
consumption) and scope 3 emissions (uncontrolled emissions such as idling). The following
summarizes the carbon footprint results for the Project rest areas (see Table 2):
The Tier I rest areas’ (visitor centers) carbon footprints were 3,006 metric tons metric
tons CO2e/year for the Sterling Rest Area and 2,517 metric tons CO2e/year for the Poudre
Rest Area; truck idling emissions account for 94-95% of total carbon footprint emissions.
The average carbon footprint for the Tier I rest areas was 2,762 metric tons CO2e/year.
The Tier II rest areas’ (recreational areas) carbon footprints were 886 metric tons
CO2e/year for the Vail Pass Rest Area and 143 metric tons CO2e/year for the Hanging
Lake Rest Area. Higher electrical usage for heating, lighting and waste treatment
operations resulted in a higher overall carbon footprint for the Vail Pass Rest Area. The
average carbon footprint for the Tier II rest areas was 515 metric tons CO2e/year.
The Tier III rest areas’ (basic services) carbon footprints were 2,281 metric tons
CO2e/year for the El Moro Rest Area and 73 metric tons CO2e/year for the Sleeping Ute
Mountain Rest Area; higher natural gas usage, and truck idling were the main reasons for
the higher footprint value at the El Moro Rest Area. The average carbon footprint for the
Tier III rest areas was 1,177 metric tons CO2e/year.
The Sterling Rest Area had the highest carbon footprint among all the Project rest areas
with a carbon emission value of 3,006 metric tons CO2e/year; whereas the Sleeping Ute
Mountain Rest Area had the lowest carbon footprint value of 73 metric tons CO2e /year.
The metric tons CO2e/year per restroom square foot are the highest at the Poudre Rest
Area (1 metric ton/square foot) followed by the El Moro Rest Area (0.95 metric
ton/square foot).

70
Table 2. Summary of Project Rest Area Carbon Footprints.
Sterling PoudreHanging
Lake Vail Pass El Moro Sleeping Ute
Mtn.
Scope 1 Carbon Footprint (operations - metric tons CO2e/year) 44.000 15.154 10.27 10.72 59.351 22.945Scope 2 Carbon Footprint (electrical consumption - metric tons CO2e/year) 108.615 123.61 132.897 230.303 2.169 49.74Scope 3 Carbon Footprint (idling -metric tons CO2e/year ) 2853.6 2377.82 0 645.35 2219.3 0
Total Carbon Footprint (metric tons CO2e/year) 3006 2517 143 886 2281 73Tons/square foot restroom area 0.7708 1.0066 0.0624 0.1641 0.9503 0.0584Tons/Acre 429.4593 157.2865 35.7918 124.8413 321.2423 6.9889
Scope 3 Emission - % of Total 95% 94%
0% 73% 97% 0%
The metric tons of CO2e/year per acre is the highest for the Sterling Rest Area (429
metric tons CO2e/year metric tons/acre) followed by the El Moro Rest Area (321 metric
tons CO2e/year).
It is possible that the Sleeping Ute Mountain Rest Area is the only Project rest area that is
close to being carbon neutral. The total carbon footprint is 73 metric tons CO2e/year and
the total amount of trees for carbon sequestration within the 10.4 acre rest area is 820
Juniper and Pinon Pine trees (82 trees/acre).
Truck idling dominates the carbon footprint emissions for most of the Project rest areas followed
by electrical consumption. The number of trucks parking and idling for 8 hours or more at the
Project rest areas (El Moro, Vail Pass, Poudre and Sterling) range from 4-18 truck per night and
emit greenhouse gases such as carbon dioxide, nitrous oxides, and methane. Truck idling also
releases fine particulates, fumes, and generates noise at the rest areas. Electrical consumption is

71
dominated by lighting and heating. Lighting is primarily used by the rest areas for restrooms,
parking areas, and pedestrian walkways.
The carbon footprint values calculated for the Tier I, II and III rest areas provide initial emission
information such that a gross estimate can be made for the combined total carbon footprint for all
the rest areas managed by CDOT. The following average carbon footprint for each Tier rest
area (Tier I-2,762 metric tons CO2e /year, Tier II- 515 metric tons CO2e /year and Tier III-1177
metric tons CO2e /year) is multiplied by the number of rest areas within each Tier (Tier I-5 rest
areas, Tier II-5 rest areas and Tier III-17 rest areas) to estimate the total combined carbon
footprint for all CDOT rest areas.
Tier I - 13,810 metric tons CO2e/year
Tier II - 2,575 metric tons CO2e/year
Tier III - 20,009 metric tons CO2e/year
Total estimated carbon footprint for all CDOT rest areas is 36,394 metric tons CO2e/year
There is an increasing emphasis on a federal and state level for CDOT and other DOTs to reduce
and manage carbon footprint emissions. There are numerous carbon footprint reduction
strategies that can be instituted at CDOT rest areas. The acceptance and implementation of these
strategies will require a shift in how CDOT views the purpose and operation of rest areas. It will
require a shift in looking at the type of rest area services provided to the traveling public and
trucking professionals and how economics, the environment, and the community/traveling public
are integrated into the overall rest area operations. The following are options to reduce rest area
carbon footprints:
Limit long-term truck idling from CDOT rest areas unless in emergency situations such
as harsh weather events and road closures
Provide rest areas with truck electrification capabilities that could limit idling by using
auxiliary power units
Develop strategies to reduce the amount of fuel consumption used for mowing and to
transport personnel, equipment, and materials to and from the main CDOT Maintenance
facilities. These strategies may include increased storage and compaction of solid waste
at the rest area to reduce the number of trips and reduce the frequency of mowing
activities in the summer by reducing irrigation and fertilizer applications

72
Develop strategies to reduce the amount of electricity used for lighting the restroom areas
by using energy-efficient lighting bulbs, shutting off lights during day time hours,
installing solar tubes or skylights, and using motion detectors that will turn on lights in
restrooms during nighttime hours
Perform energy audits on all rest areas to reduce natural gas, propane and electrical,
consumption. Johnson Controls is currently performing energy audits on many CDOT
Maintenance facilities and rest areas to identify specific actions to reduce rest area
energy consumption
Limit the use of air conditioning by using natural ventilation and tree shading
Investigate the use of individually solar powered lights with daylight savers for walkway,
parking, and safety lighting.
Place vending machines inside the restroom area rather than outside where they are
exposed to extreme outdoor summer temperatures and direct exposure to the sun
Ensure onsite waste treatment systems are optimized to reduce electrical consumption
from pumps
Limit the use of hot water at rest areas. Supplying hot water may not be a necessary
function of a rest area and it requires natural gas or electrical consumption. As an
alternative, solar heated water systems and/or Energy Star Rated on-demand heating
systems could provide hot water to the rest areas
Investigate the feasibility and cost-effectives of using photovoltaic, wind, and geothermal
(heat pump) technologies to provide onsite alternative energy production to the rest area.
CDOT could work with the USFS on solar panel and wind turbine system aesthetic
impacts for those rest areas located on USFS property
Upgrade hot air hand dryers to Energy Star Rated hand dryers for restrooms
Explore ways to reduce the amount of fossil fuel consumption by using biodiesel and
electric power for rest area maintenance vehicles
Plant trees and native grasses to sequester carbon from the atmosphere and provide rest
area and visitor center building shade
73
5.3 Alternative Energy Use for CDOT Rest Areas Using CDOT ROW
Alternative energy generated within the CDOT Right-of-Way (ROW) can be a source of power
for CDOT rest areas. The CSU-Pueblo Team has developed GIS-based mapping that identifies
priority areas for solar, wind, biomass, geothermal, and hydropower power sources. Rest areas in
these priority locations could consider performing feasibility studies to assess the installation of
these alternative energy sources. Johnson Controls is contracted by CDOT to review energy
consumption at all CDOT facilities including rest areas. Their analysis will help identify
economically viable alternative energy options for rest areas. The Project rest areas that fall
within the solar, wind, biomass, geothermal, and hydropower priority areas (see Figures 31-36)
are:
Sleeping Ute Mountain Rest Area – high solar, low wind, potential of geothermal, no
hydropower, low biomass
Hanging Lake Rest Area – low solar, low wind, geothermal potential, hydropower
potential, no biomass
Vail Pass Rest Areas – low solar, low wind, no geothermal, hydropower potential, no
biomass
Sterling Rest Area – moderate solar, good-moderate wind, no geothermal, no
hydropower, high biomass
Poudre Rest Area – moderate solar, low wind, no geothermal, no hydropower, high
biomass
El Moro Rest Area – high solar, marginal wind, no geothermal, no hydropower, low
biomass
5.4 Coordination with Johnson Controls
The CSU-Pueblo Team and Johnson Controls Team worked together by sharing data and
discussing rest area observations and recommendations. Although the two projects’ goals,
objectives and scopes are different, there was common interest in rest area operations, energy
and water consumption. Two working sessions were conducted between the CSU-Pueblo Team
and Johnson Controls Team to share energy data sources, observations and opinions on energy
use and alternative energy potentials. From an energy conservation and cost perspective, the first
action that could be performed at CDOT is to improve energy efficiency. The initial emphasis

74
could be placed on efficient heating/cooling, lighting and winterizing. After energy conservation
practices are in place, alternative energy options such as solar, wind and geothermal energies
could be considered at the rest areas. The CSU-Pueblo Team recommends that the energy
conservation analysis also consider the reduction of the carbon footprint by the implementation
of alternative energy generation.
5.5 Common Project Rest Area Sustainable Observations and
Recommendations
The following summarizes the sustainable actions as identified in this study, which could be
considered for implementation by CDOT for the Project rest areas and other CDOT statewide
rest areas. It is recognized that some of these sustainable action recommendations will require
some initial capital costs and that some recommendations can only be accomplished as part of
retrofitting or constructing a new rest area. Table 3 provides a summary of the main project
recommendations based upon the sustainable observations made at all the Project rest areas.
Rest Area Operations Information
Operational information, such as electricity and water consumption, was difficult to obtain from
CDOT. It was not possible to separate out specific rest area operations (waste treatment, parking
lighting, heating, etc.) for electric consumption data; therefore it was hard to track specific
electrical consumption for an operation over time. Water consumption data (restroom, irrigation)
was also difficult to identify. Much of the CDOT electrical and water consumption data was
based upon the amount paid by CDOT Accounts Payable and did not reflect actual consumption;
therefore, data was obtained by the CSU-Pueblo Team from the actual service vendor or Johnson
Controls. Most of the CDOT Maintenance Managers or rest area representatives do not regularly
obtain or review resource consumption data. Water and electrical consumption data could be
reviewed routinely to identify operational problems that are not readily observed by rest area
personnel. Maintenance Mangers could be reviewing consumption information to identify
problem areas and areas for improved conservation. Electrical and water data can also be
monitored and logged routinely by rest area personnel.
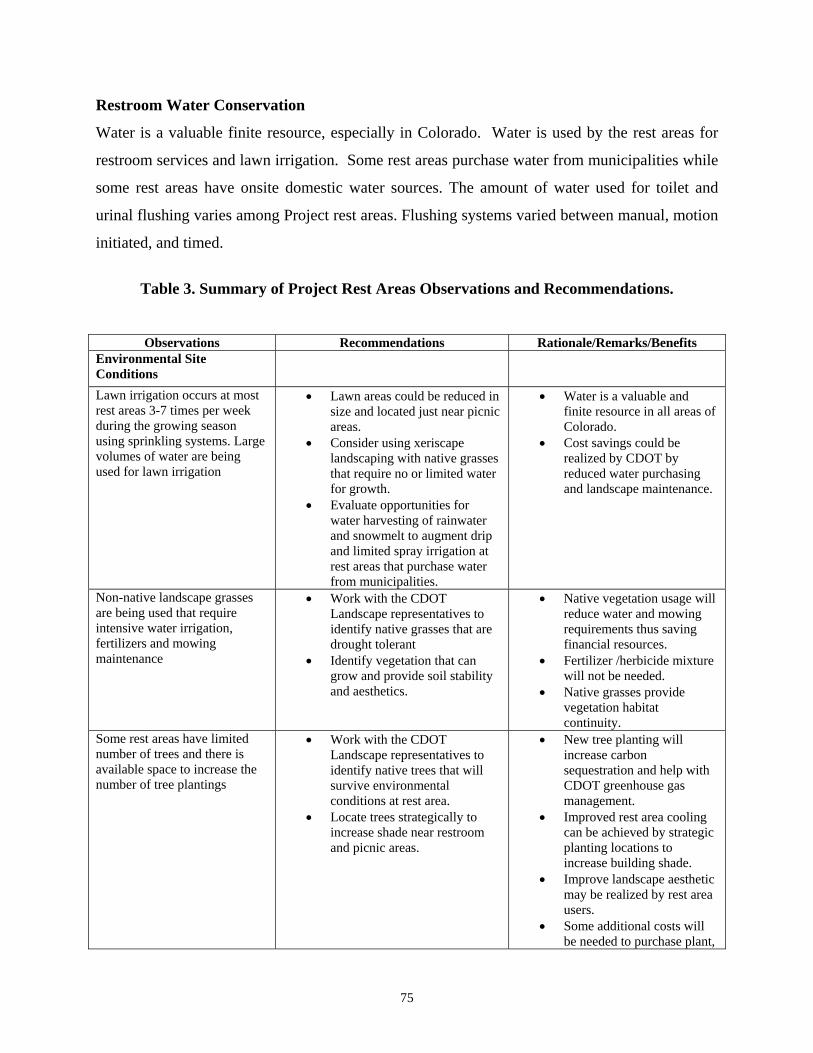
75
Restroom Water Conservation
Water is a valuable finite resource, especially in Colorado. Water is used by the rest areas for
restroom services and lawn irrigation. Some rest areas purchase water from municipalities while
some rest areas have onsite domestic water sources. The amount of water used for toilet and
urinal flushing varies among Project rest areas. Flushing systems varied between manual, motion
initiated, and timed.
Table 3. Summary of Project Rest Areas Observations and Recommendations.
Observations Recommendations Rationale/Remarks/Benefits Environmental Site Conditions
Lawn irrigation occurs at most rest areas 3-7 times per week during the growing season using sprinkling systems. Large volumes of water are being used for lawn irrigation
Lawn areas could be reduced in size and located just near picnic areas.
Consider using xeriscape landscaping with native grasses that require no or limited water for growth.
Evaluate opportunities for water harvesting of rainwater and snowmelt to augment drip and limited spray irrigation at rest areas that purchase water from municipalities.
Water is a valuable and finite resource in all areas of Colorado.
Cost savings could be realized by CDOT by reduced water purchasing and landscape maintenance.
Non-native landscape grasses are being used that require intensive water irrigation, fertilizers and mowing maintenance
Work with the CDOT Landscape representatives to identify native grasses that are drought tolerant
Identify vegetation that can grow and provide soil stability and aesthetics.
Native vegetation usage will reduce water and mowing requirements thus saving financial resources.
Fertilizer /herbicide mixture will not be needed.
Native grasses provide vegetation habitat continuity.
Some rest areas have limited number of trees and there is available space to increase the number of tree plantings
Work with the CDOT Landscape representatives to identify native trees that will survive environmental conditions at rest area.
Locate trees strategically to increase shade near restroom and picnic areas.
New tree planting will increase carbon sequestration and help with CDOT greenhouse gas management.
Improved rest area cooling can be achieved by strategic planting locations to increase building shade.
Improve landscape aesthetic may be realized by rest area users.
Some additional costs will be needed to purchase plant,
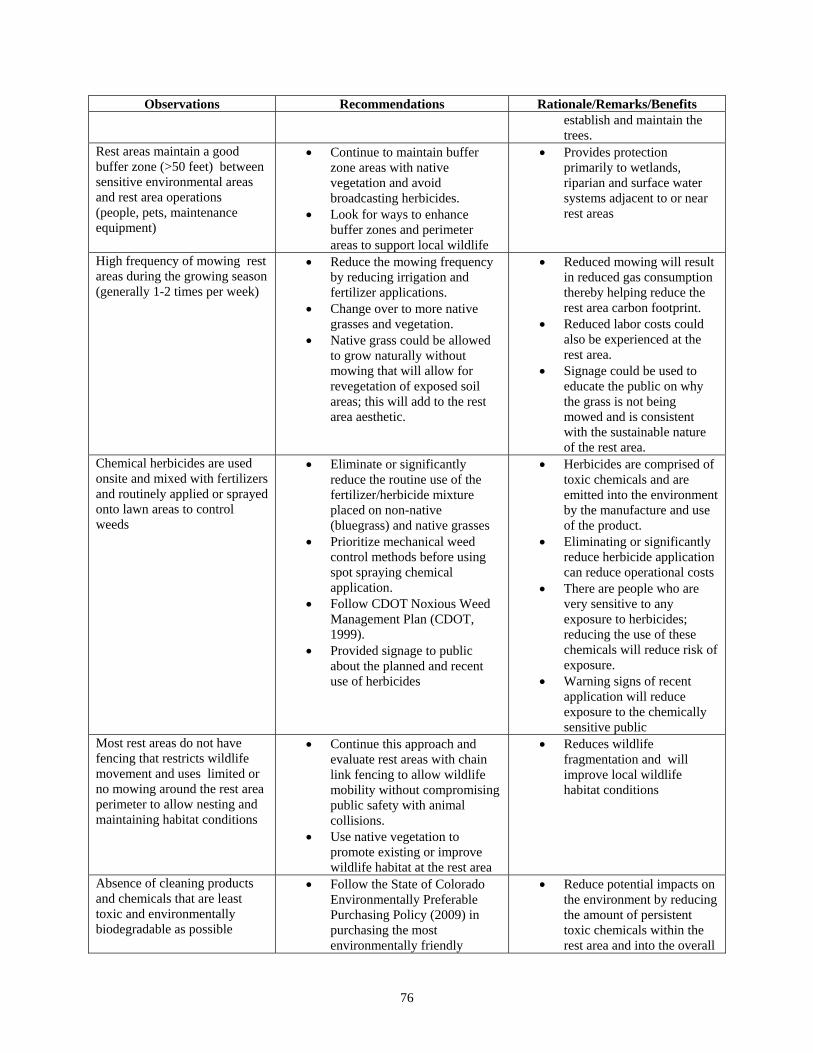
76
Observations Recommendations Rationale/Remarks/Benefits establish and maintain the trees.
Rest areas maintain a good buffer zone (>50 feet) between sensitive environmental areas and rest area operations (people, pets, maintenance equipment)
Continue to maintain buffer zone areas with native vegetation and avoid broadcasting herbicides.
Look for ways to enhance buffer zones and perimeter areas to support local wildlife
Provides protection primarily to wetlands, riparian and surface water systems adjacent to or near rest areas
High frequency of mowing rest areas during the growing season (generally 1-2 times per week)
Reduce the mowing frequency by reducing irrigation and fertilizer applications.
Change over to more native grasses and vegetation.
Native grass could be allowed to grow naturally without mowing that will allow for revegetation of exposed soil areas; this will add to the rest area aesthetic.
Reduced mowing will result in reduced gas consumption thereby helping reduce the rest area carbon footprint.
Reduced labor costs could also be experienced at the rest area.
Signage could be used to educate the public on why the grass is not being mowed and is consistent with the sustainable nature of the rest area.
Chemical herbicides are used onsite and mixed with fertilizers and routinely applied or sprayed onto lawn areas to control weeds
Eliminate or significantly reduce the routine use of the fertilizer/herbicide mixture placed on non-native (bluegrass) and native grasses
Prioritize mechanical weed control methods before using spot spraying chemical application.
Follow CDOT Noxious Weed Management Plan (CDOT, 1999).
Provided signage to public about the planned and recent use of herbicides
Herbicides are comprised of toxic chemicals and are emitted into the environment by the manufacture and use of the product.
Eliminating or significantly reduce herbicide application can reduce operational costs
There are people who are very sensitive to any exposure to herbicides; reducing the use of these chemicals will reduce risk of exposure.
Warning signs of recent application will reduce exposure to the chemically sensitive public
Most rest areas do not have fencing that restricts wildlife movement and uses limited or no mowing around the rest area perimeter to allow nesting and maintaining habitat conditions
Continue this approach and evaluate rest areas with chain link fencing to allow wildlife mobility without compromising public safety with animal collisions.
Use native vegetation to promote existing or improve wildlife habitat at the rest area
Reduces wildlife fragmentation and will improve local wildlife habitat conditions
Absence of cleaning products and chemicals that are least toxic and environmentally biodegradable as possible
Follow the State of Colorado Environmentally Preferable Purchasing Policy (2009) in purchasing the most environmentally friendly
Reduce potential impacts on the environment by reducing the amount of persistent toxic chemicals within the rest area and into the overall
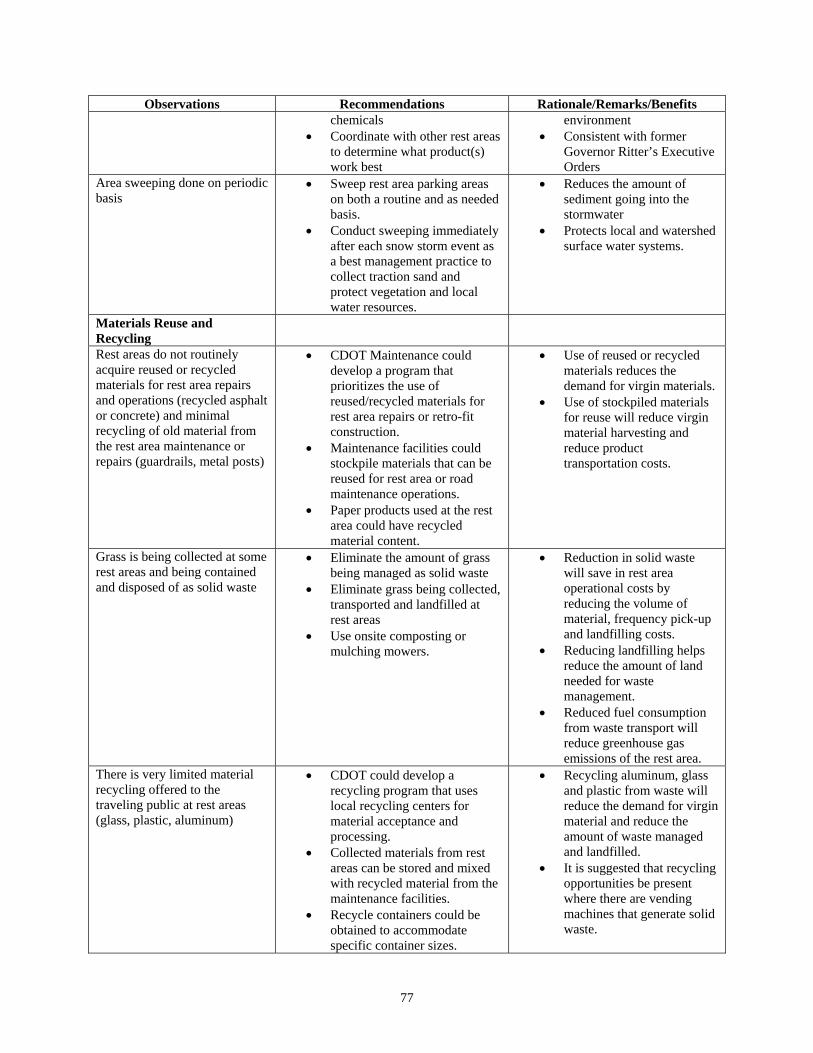
77
Observations Recommendations Rationale/Remarks/Benefits chemicals
Coordinate with other rest areas to determine what product(s) work best
environment Consistent with former
Governor Ritter’s Executive Orders
Area sweeping done on periodic basis
Sweep rest area parking areas on both a routine and as needed basis.
Conduct sweeping immediately after each snow storm event as a best management practice to collect traction sand and protect vegetation and local water resources.
Reduces the amount of sediment going into the stormwater
Protects local and watershed surface water systems.
Materials Reuse and Recycling
Rest areas do not routinely acquire reused or recycled materials for rest area repairs and operations (recycled asphalt or concrete) and minimal recycling of old material from the rest area maintenance or repairs (guardrails, metal posts)
CDOT Maintenance could develop a program that prioritizes the use of reused/recycled materials for rest area repairs or retro-fit construction.
Maintenance facilities could stockpile materials that can be reused for rest area or road maintenance operations.
Paper products used at the rest area could have recycled material content.
Use of reused or recycled materials reduces the demand for virgin materials.
Use of stockpiled materials for reuse will reduce virgin material harvesting and reduce product transportation costs.
Grass is being collected at some rest areas and being contained and disposed of as solid waste
Eliminate the amount of grass being managed as solid waste
Eliminate grass being collected, transported and landfilled at rest areas
Use onsite composting or mulching mowers.
Reduction in solid waste will save in rest area operational costs by reducing the volume of material, frequency pick-up and landfilling costs.
Reducing landfilling helps reduce the amount of land needed for waste management.
Reduced fuel consumption from waste transport will reduce greenhouse gas emissions of the rest area.
There is very limited material recycling offered to the traveling public at rest areas (glass, plastic, aluminum)
CDOT could develop a recycling program that uses local recycling centers for material acceptance and processing.
Collected materials from rest areas can be stored and mixed with recycled material from the maintenance facilities.
Recycle containers could be obtained to accommodate specific container sizes.
Recycling aluminum, glass and plastic from waste will reduce the demand for virgin material and reduce the amount of waste managed and landfilled.
It is suggested that recycling opportunities be present where there are vending machines that generate solid waste.

78
Observations Recommendations Rationale/Remarks/Benefits Local community groups
interested in recycling could be contacted for support; recycling profits from aluminum recycling could be an incentive.
Use signage to explain and promote public recycling efforts.
Minimal solid waste minimization/ reduction practices observed at rest areas
The use of a compactor may be cost-effective for rest areas generating high amounts of solid waste. The compactor would reduce the volume of waste stored onsite, reduce waste pick up frequencies and reduce the volume landfilled (see Appendices F and G).
Look at opportunities to recycle cardboard and paper board materials.
Some CDOT rest areas could consider the elimination of soda vending machines that generate solid waste.
Signage could be provided to educate the public about CDOT’s efforts to reduce solid waste
Consider eliminating paper towels for hand washing
Cost savings can be realized by using a trash compactor by reducing waste volumes for transporting/landfilling.
The elimination of vending machines and promotion of water consumption will reduce solid waste and electrical costs
Eliminating paper towels will help reduce the amount of solid waste generated and disposed of in a landfill
Lack of a CDOT Maintenance policy or practice to use new source materials that come from certified sustainable practices
CDOT could develop a policy that wood materials used for rest area maintenance or retrofits could be certified as being from sustainable sources.
Using certified wood materials promotes the use of sustainably based silviculture practices thus promoting sustainable land uses
Air Quality CDOT Rest Area personnel has limited knowledge of using low volatile organic chemicals (VOCs) incorporated in paints , equipment cleaning materials and adhesives
CDOT could consider following the State of Colorado Environmentally Preferable Purchasing Policy (2009) that promotes the use of low VOC materials.
Rest area representatives could be educated on how to purchase low VOC paints and adhesives at local retail centers or through CDOT procurement.
The use of low VOCs will reduce toxic emissions from the manufacture and use of paints, cleaning materials and adhesives.
Reduced employee and traveling public’s expose to toxic materials
Consistent with former Governor Ritter’s Executive Orders
No truck idling restrictions and at rest areas for large commercial trucks;
Consider the elimination or significant reduction of long term truck parking and idling at CDOT rest areas unless in emergency situations such as harsh weather events and road
Restricting truck idling is a management approach for CDOT to reduce greenhouse gas emissions that is consistent with the State of Colorado’s Climate Change
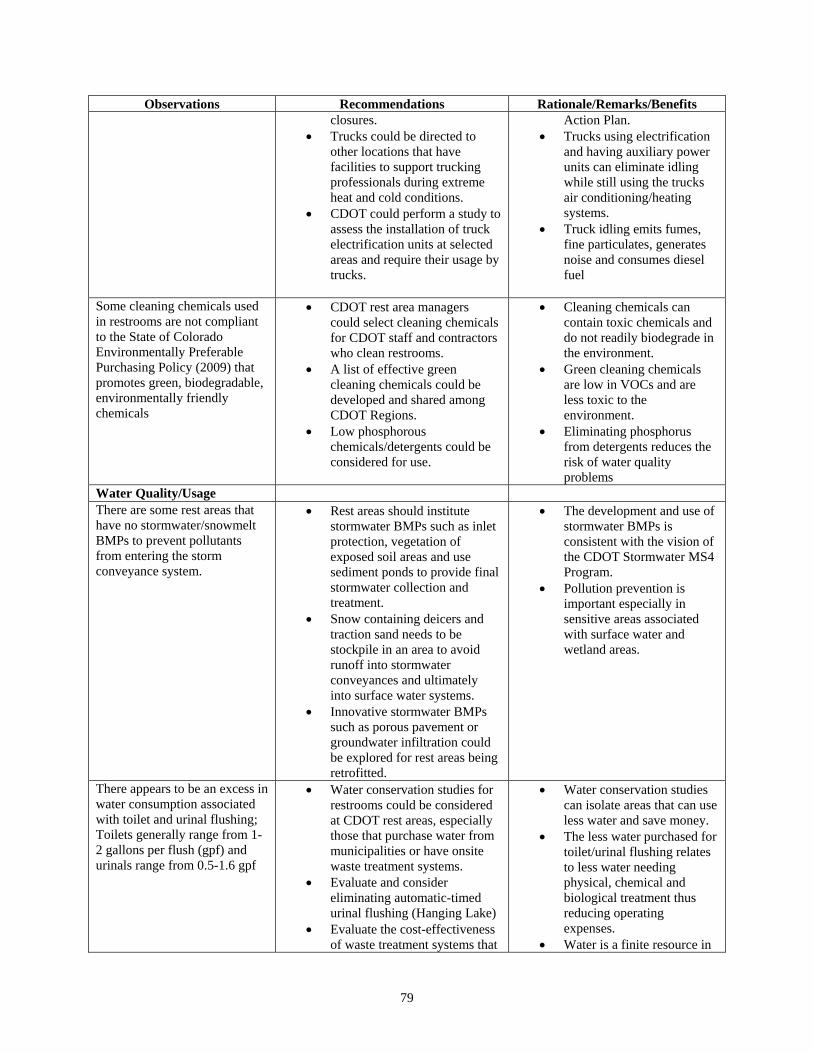
79
Observations Recommendations Rationale/Remarks/Benefits closures.
Trucks could be directed to other locations that have facilities to support trucking professionals during extreme heat and cold conditions.
CDOT could perform a study to assess the installation of truck electrification units at selected areas and require their usage by trucks.
Action Plan. Trucks using electrification
and having auxiliary power units can eliminate idling while still using the trucks air conditioning/heating systems.
Truck idling emits fumes, fine particulates, generates noise and consumes diesel fuel
Some cleaning chemicals used in restrooms are not compliant to the State of Colorado Environmentally Preferable Purchasing Policy (2009) that promotes green, biodegradable, environmentally friendly chemicals
CDOT rest area managers could select cleaning chemicals for CDOT staff and contractors who clean restrooms.
A list of effective green cleaning chemicals could be developed and shared among CDOT Regions.
Low phosphorous chemicals/detergents could be considered for use.
Cleaning chemicals can contain toxic chemicals and do not readily biodegrade in the environment.
Green cleaning chemicals are low in VOCs and are less toxic to the environment.
Eliminating phosphorus from detergents reduces the risk of water quality problems
Water Quality/Usage There are some rest areas that have no stormwater/snowmelt BMPs to prevent pollutants from entering the storm conveyance system.
Rest areas should institute stormwater BMPs such as inlet protection, vegetation of exposed soil areas and use sediment ponds to provide final stormwater collection and treatment.
Snow containing deicers and traction sand needs to be stockpile in an area to avoid runoff into stormwater conveyances and ultimately into surface water systems.
Innovative stormwater BMPs such as porous pavement or groundwater infiltration could be explored for rest areas being retrofitted.
The development and use of stormwater BMPs is consistent with the vision of the CDOT Stormwater MS4 Program.
Pollution prevention is important especially in sensitive areas associated with surface water and wetland areas.
There appears to be an excess in water consumption associated with toilet and urinal flushing; Toilets generally range from 1-2 gallons per flush (gpf) and urinals range from 0.5-1.6 gpf
Water conservation studies for restrooms could be considered at CDOT rest areas, especially those that purchase water from municipalities or have onsite waste treatment systems.
Evaluate and consider eliminating automatic-timed urinal flushing (Hanging Lake)
Evaluate the cost-effectiveness of waste treatment systems that
Water conservation studies can isolate areas that can use less water and save money.
The less water purchased for toilet/urinal flushing relates to less water needing physical, chemical and biological treatment thus reducing operating expenses.
Water is a finite resource in

80
Observations Recommendations Rationale/Remarks/Benefits require automatic flush systems to maintain optimum treatment.
Consider waterless urinals to conserve water and reduce long term water costs (See Appendix F).
Colorado and should be conserved.
There appears to be an excessive use of irrigation water to maintain non-native vegetation. Lawn irrigation frequencies range from 3-7 days per week.
CDOT could evaluate irrigation volumes used at rest areas
Lawn landscaping could be re-evaluated towards using native, low water demand plants.
Water consumption could be monitored to identify potential irrigation piping leaks.
Irrigation of lawns could be kept at a minimum or eliminated, especially for those rest areas that purchase water from municipalities.
Water harvesting of rain water and snow melt could be considered as a pilot study to evaluate potential area irrigation (See Appendices F and H)
The Sterling Rest Area purchases domestic water at an annual cost of over $14,000 (over 10 million gallons per year).
Significant cost savings could be realized by reducing and in some areas eliminating lawn irrigation.
No Signage to conserve water in restroom areas
Place signage in the restroom area to sensitize the public on the importance of water conservation in Colorado
Good public relations and public outreach
Water is a finite resource in Colorado and should be conserved
Traction sand is used during the winter for parking lot maintenance and snow is plowed and piled/stockpiled onsite
Consider using limited amount of traction sand to maintain parking lots in winter to reduce sediment loading into the nearby stream.
Stockpile snow at strategic locations to reduce potential of entering stream
Traction sand and deicers will be kept from being introduced into nearby surface water systems.
Potential water storage area may exist for the collection and reuse of gray water or water harvesting
Evaluate retrofit costs for gray water reuse for toilet/urinal flushing
Consider pilot study for water harvesting potential
Water conservation measures would reduce amount of water purchased from municipalities or nearby stream/groundwater systems.
Water harvesting is estimated to be cost- effective at select rest areas (see Appendices F and H).
Energy Vending machines are located outside exposed to direct sunlight and extreme weather conditions
Beverage vending machines could be located inside the rest area building to reduce weather extremes thus reducing consumption of electricity.
Reducing or eliminating energy consumption from vending machines will help reduce operating costs
Reduction in solid waste
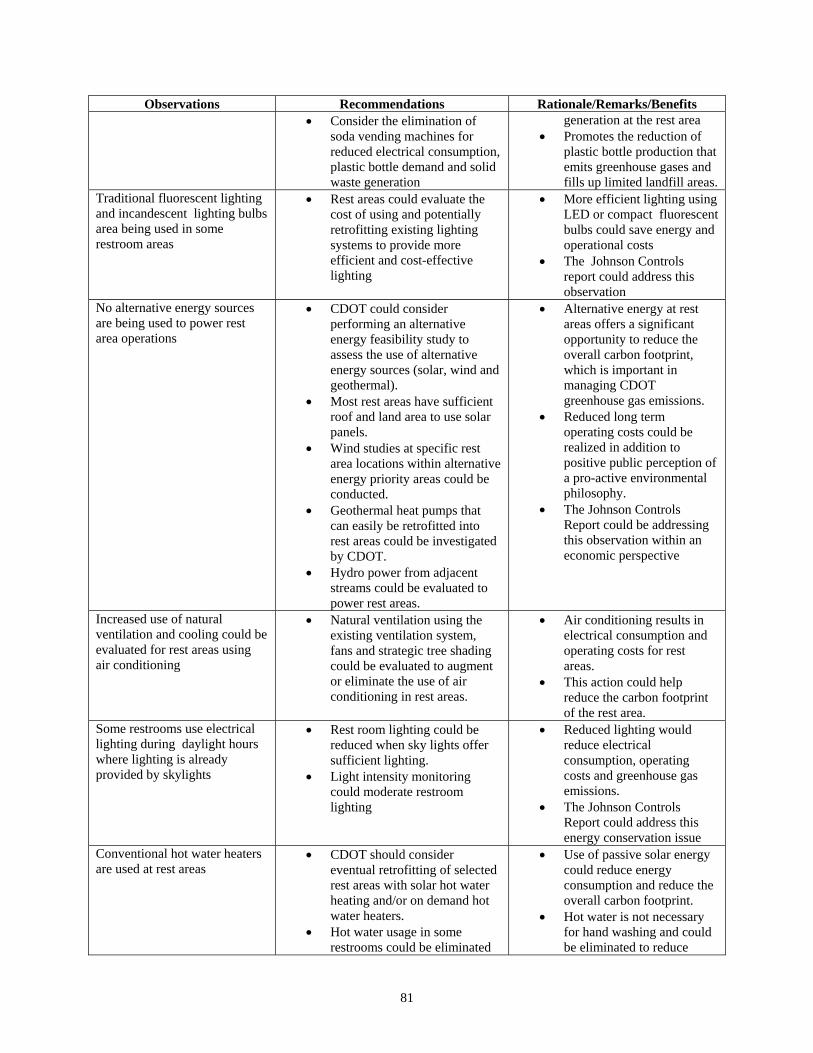
81
Observations Recommendations Rationale/Remarks/Benefits Consider the elimination of
soda vending machines for reduced electrical consumption, plastic bottle demand and solid waste generation
generation at the rest area Promotes the reduction of
plastic bottle production that emits greenhouse gases and fills up limited landfill areas.
Traditional fluorescent lighting and incandescent lighting bulbs area being used in some restroom areas
Rest areas could evaluate the cost of using and potentially retrofitting existing lighting systems to provide more efficient and cost-effective lighting
More efficient lighting using LED or compact fluorescent bulbs could save energy and operational costs
The Johnson Controls report could address this observation
No alternative energy sources are being used to power rest area operations
CDOT could consider performing an alternative energy feasibility study to assess the use of alternative energy sources (solar, wind and geothermal).
Most rest areas have sufficient roof and land area to use solar panels.
Wind studies at specific rest area locations within alternative energy priority areas could be conducted.
Geothermal heat pumps that can easily be retrofitted into rest areas could be investigated by CDOT.
Hydro power from adjacent streams could be evaluated to power rest areas.
Alternative energy at rest areas offers a significant opportunity to reduce the overall carbon footprint, which is important in managing CDOT greenhouse gas emissions.
Reduced long term operating costs could be realized in addition to positive public perception of a pro-active environmental philosophy.
The Johnson Controls Report could be addressing this observation within an economic perspective
Increased use of natural ventilation and cooling could be evaluated for rest areas using air conditioning
Natural ventilation using the existing ventilation system, fans and strategic tree shading could be evaluated to augment or eliminate the use of air conditioning in rest areas.
Air conditioning results in electrical consumption and operating costs for rest areas.
This action could help reduce the carbon footprint of the rest area.
Some restrooms use electrical lighting during daylight hours where lighting is already provided by skylights
Rest room lighting could be reduced when sky lights offer sufficient lighting.
Light intensity monitoring could moderate restroom lighting
Reduced lighting would reduce electrical consumption, operating costs and greenhouse gas emissions.
The Johnson Controls Report could address this energy conservation issue
Conventional hot water heaters are used at rest areas
CDOT should consider eventual retrofitting of selected rest areas with solar hot water heating and/or on demand hot water heaters.
Hot water usage in some restrooms could be eliminated
Use of passive solar energy could reduce energy consumption and reduce the overall carbon footprint.
Hot water is not necessary for hand washing and could be eliminated to reduce
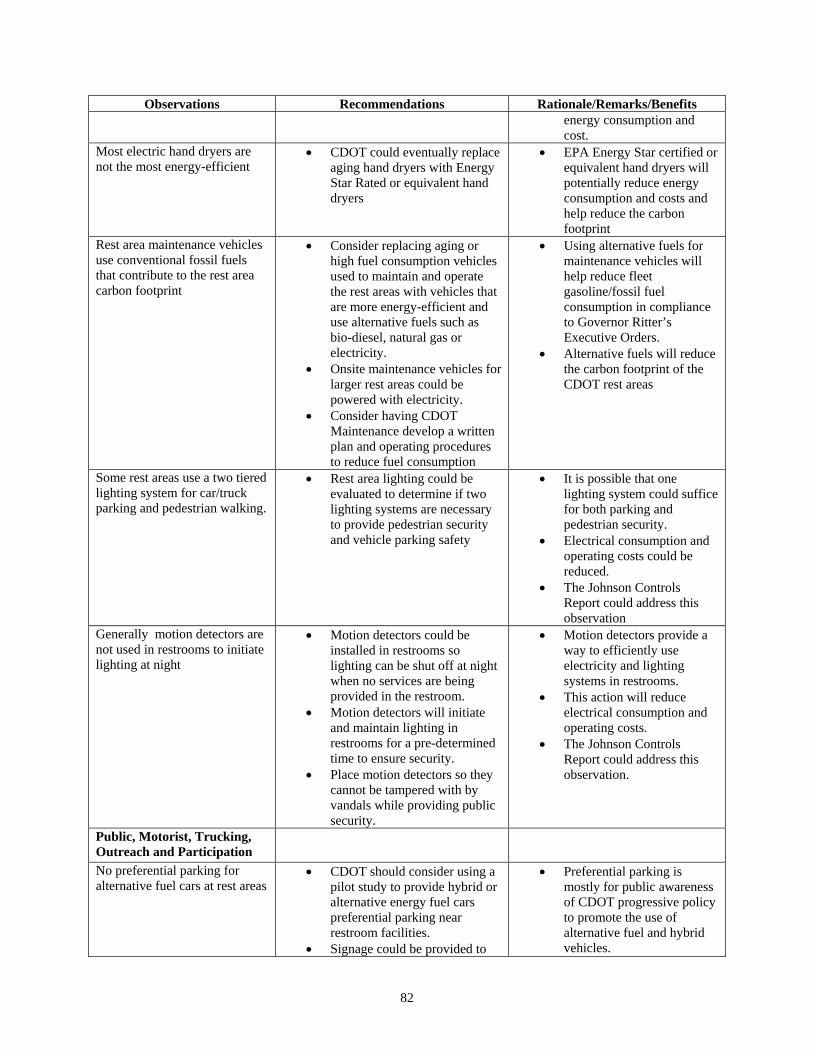
82
Observations Recommendations Rationale/Remarks/Benefits energy consumption and cost.
Most electric hand dryers are not the most energy-efficient
CDOT could eventually replace aging hand dryers with Energy Star Rated or equivalent hand dryers
EPA Energy Star certified or equivalent hand dryers will potentially reduce energy consumption and costs and help reduce the carbon footprint
Rest area maintenance vehicles use conventional fossil fuels that contribute to the rest area carbon footprint
Consider replacing aging or high fuel consumption vehicles used to maintain and operate the rest areas with vehicles that are more energy-efficient and use alternative fuels such as bio-diesel, natural gas or electricity.
Onsite maintenance vehicles for larger rest areas could be powered with electricity.
Consider having CDOT Maintenance develop a written plan and operating procedures to reduce fuel consumption
Using alternative fuels for maintenance vehicles will help reduce fleet gasoline/fossil fuel consumption in compliance to Governor Ritter’s Executive Orders.
Alternative fuels will reduce the carbon footprint of the CDOT rest areas
Some rest areas use a two tiered lighting system for car/truck parking and pedestrian walking.
Rest area lighting could be evaluated to determine if two lighting systems are necessary to provide pedestrian security and vehicle parking safety
It is possible that one lighting system could suffice for both parking and pedestrian security.
Electrical consumption and operating costs could be reduced.
The Johnson Controls Report could address this observation
Generally motion detectors are not used in restrooms to initiate lighting at night
Motion detectors could be installed in restrooms so lighting can be shut off at night when no services are being provided in the restroom.
Motion detectors will initiate and maintain lighting in restrooms for a pre-determined time to ensure security.
Place motion detectors so they cannot be tampered with by vandals while providing public security.
Motion detectors provide a way to efficiently use electricity and lighting systems in restrooms.
This action will reduce electrical consumption and operating costs.
The Johnson Controls Report could address this observation.
Public, Motorist, Trucking, Outreach and Participation
No preferential parking for alternative fuel cars at rest areas
CDOT should consider using a pilot study to provide hybrid or alternative energy fuel cars preferential parking near restroom facilities.
Signage could be provided to
Preferential parking is mostly for public awareness of CDOT progressive policy to promote the use of alternative fuel and hybrid vehicles.
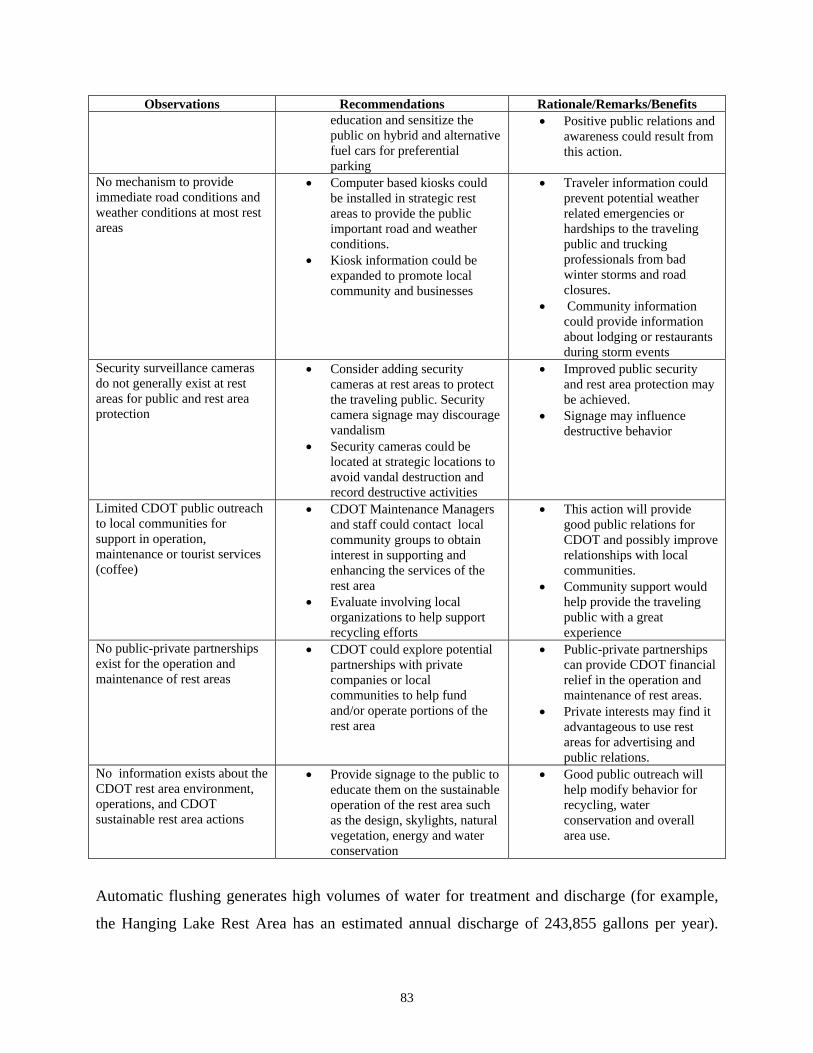
83
Observations Recommendations Rationale/Remarks/Benefits education and sensitize the public on hybrid and alternative fuel cars for preferential parking
Positive public relations and awareness could result from this action.
No mechanism to provide immediate road conditions and weather conditions at most rest areas
Computer based kiosks could be installed in strategic rest areas to provide the public important road and weather conditions.
Kiosk information could be expanded to promote local community and businesses
Traveler information could prevent potential weather related emergencies or hardships to the traveling public and trucking professionals from bad winter storms and road closures.
Community information could provide information about lodging or restaurants during storm events
Security surveillance cameras do not generally exist at rest areas for public and rest area protection
Consider adding security cameras at rest areas to protect the traveling public. Security camera signage may discourage vandalism
Security cameras could be located at strategic locations to avoid vandal destruction and record destructive activities
Improved public security and rest area protection may be achieved.
Signage may influence destructive behavior
Limited CDOT public outreach to local communities for support in operation, maintenance or tourist services (coffee)
CDOT Maintenance Managers and staff could contact local community groups to obtain interest in supporting and enhancing the services of the rest area
Evaluate involving local organizations to help support recycling efforts
This action will provide good public relations for CDOT and possibly improve relationships with local communities.
Community support would help provide the traveling public with a great experience
No public-private partnerships exist for the operation and maintenance of rest areas
CDOT could explore potential partnerships with private companies or local communities to help fund and/or operate portions of the rest area
Public-private partnerships can provide CDOT financial relief in the operation and maintenance of rest areas.
Private interests may find it advantageous to use rest areas for advertising and public relations.
No information exists about the CDOT rest area environment, operations, and CDOT sustainable rest area actions
Provide signage to the public to educate them on the sustainable operation of the rest area such as the design, skylights, natural vegetation, energy and water conservation
Good public outreach will help modify behavior for recycling, water conservation and overall area use.
Automatic flushing generates high volumes of water for treatment and discharge (for example,
the Hanging Lake Rest Area has an estimated annual discharge of 243,855 gallons per year).

84
Wastewater is treated at a municipality for a cost per gallon or is treated and discharged from
onsite treatment systems. The amount of wastewater discharged is dependent upon the amount
of domestic water used at the rest area. Cost savings could be achieved and less water used if
rest areas performed restroom conservation studies and routinely monitored water usage.
Waterless urinals are estimated to be cost-effective for the Sterling, El Moro, and Vail Pass rest
areas (Appendix F). It is possible that CDOT could reduce operational costs by: 1) reduced
domestic water purchasing, 2) reduced cost for municipal waste treatment, 3) reduced onsite
consumption of waste treatment chemicals, and 4) reduced electrical usage from pumps. Rest
areas that purchase water from municipalities could be prioritized for water conservation studies
due to the high cost of water and wastewater treatment.
Lawn Irrigation and Landscaping
Some rest areas have large areas of open space that are occupied by non-native and native
vegetation. Large amounts of water are used by most rest areas to irrigate high demand non-
native vegetation such as bluegrass. Fertilizers are applied to most of these areas to promote an
aesthetic green color that requires frequent mowing, labor, and lawn irrigation. There could be a
transition away from high water demand, non-native vegetation and toward xeriscape
landscaping using low water demand, drought tolerant plant species. The evapotranspiration rate
(evaporation from soil plus transpiration from plant tissue) is twice as high for bluegrass as for
buffalo grass (CSU, 2010). It requires six times the amount of water to maintain a bluegrass
lawn than a buffalo grass lawn (CSU, 2010b). Drip irrigation could be used or expanded in rest
areas and spray irrigation could be limited to conserve water. This transition could save CDOT
financial resources by not having to purchase domestic water from municipalities, reducing
electrical cost for irrigation pumping, limiting contractor costs who apply a fertilizer/herbicide
mixture to lawns, and reducing labor and equipment costs from reduced mowing operations. This
transition could also conserve local water resources. Water harvesting from roof runoff has been
estimated to be cost-effective at the Poudre, El Moro and Sterling Rest Areas (Appendix F and
H). It is recognized that water harvesting is constrained by water right laws. Based upon
discussions with legislative representatives and Councils (Kurtis Morrison-Legislative Council-
Colorado General Assembly and Jeff Lyng-Governor’s Energy Office), it could be possible that
a pilot study can be conducted by CDOT in cooperation with the State of Colorado Water
85
Conservation Board and State Legislature to evaluate the feasibility of this water collection and
distribution system.
Solid Waste Management
Solid waste is generated at rest areas by site operation and maintenance activities and by the
traveling public and trucking professionals. Rest area operations generate waste in the form of
paper, cardboard, grass, cleaning materials, and miscellaneous trash. A significant amount of
solid waste from the traveling public and trucking professionals is in the form of paper waste,
trash, and beverage containers made of plastic, glass and aluminum. CDOT currently has no rest
area program or directive to recycle solid waste from rest areas. It is recommended that CDOT
institute a rest area recycling program to collect and transfer recyclables (metal, glass, aluminum,
plastic, cardboard, office paper and paperboard) to local recycling centers. With the high amount
of commercial and public vehicles using the rest area, recycling containers could be provided to
reduce the amount of solid waste that eventually is placed in a landfill. Recycling could reduce
the total amount of solid waste produced and reduce landfilling costs. Recycling containers that
are designed to accommodate beverage containers can be used at rest areas. Signage can be
posted to educate and gain support from the public in recycling efforts. Solid waste compaction
units that are solar powered have been estimated to be cost-effective and could be considered for
specific rest areas that generate large amounts of solid waste (see Appendix G).
Waste minimization procedures such as the elimination of grass in solid waste containers could
be instituted at rest areas. Rest areas should consider using mulching mowers that would
eliminate the need for grass collection and landfilling. It is recognized that there may be
additional labor involved in the management of recyclables; however, it is an important
sustainable action that can decrease operational costs by reducing the amount of solid waste
contained, transported and landfilled.
Rest Area Energy Conservation
Rest areas consume electric, propane and natural gas energy for lighting, heating, air
conditioning and waste treatment operations. Energy is also consumed by CDOT vehicles and
equipment (diesel and gasoline) for the movement of equipment, personnel, mowing, and
86
snowplowing. It is recommended that an energy conservation study be performed for CDOT rest
areas to reduce operating costs, avoid inefficient use of energy, and reduce the overall carbon
footprint. It was not within the scope of the CSU-Pueblo Team to perform energy audits at the
Project rest areas and it is recognized that Johnson Controls is performing these site-specific
energy audits. Energy conservation actions could be investigated and performed at rest areas
such as motion detectors to initiate nighttime lighting, turning off lights during daytime hours,
energy-efficient lighting systems, and use of alternative energy (solar, wind and geothermal).
Hydroelectric power for rest areas immediately adjacent to stream systems could be considered
for rest area power generation, similar to the effort being explored by the Utah Department of
Transportation (UDOT, 2010). Limiting or eliminating the use of hot water use could be
considered for selected rest areas to reduce energy; this is similar to the approach taken by the
Florida Department of Transportation (FDOT, 2010).
Truck Idling Emissions
Truck idling emissions constitute the major source of greenhouse gas emissions at the Project
rest areas (over 90% at Tier I rest areas). In addition to greenhouse gases, truck idling emits fine
particulates and fumes and generates noise at the rest areas. A significant amount of diesel fuel
is inefficiently used by truck idling. Truck idling provides trucking professionals with cab
heating, air conditioning, and power for computers and appliances. Auxiliary power units can be
purchased by trucking companies or by independent truckers to avoid the need for idling by
plugging into provided electrical outlets (truck electrification). CDOT could develop truck
idling restrictions to or significantly limit long-term idling within rest areas. CDOT could
conduct feasibility studies to identify priority locations and operational procedures for truck
electrification facilities.
Public-Private Partnerships
Public-private partnerships are a potential financial strategy that could be explored by CDOT.
There are regulatory constraints imposed upon DOTs who want to use the Interstate ROW as a
means to supplement their tight budgets. DOTs such as Arizona are looking to close down many
rest areas due to state budget limitations and are looking for flexibility in managing rest areas.

87
Arizona Governor Jan Brewer and the Arizona Department of Transportation (ADOT) are trying
to change federal laws that govern rest area commercialization, appealing to states nationwide to
change the way rest areas operate without relying on budgets allocated for public safety services,
(TruckingInfo.com reports, 2010). Arizona officials maintain that the existing federal policies
penalize states with newer infrastructure by prohibiting privatization or partnerships to operate
rest areas (NACS, 2010).
CDOT could explore partnerships with private businesses and/or local communities to share the
expenses associated with rest area maintenance and operations. For example, ski companies or
ski towns could financially support CDOT rest areas for recreational and local services
advertising. CDOT could evaluate using public-private partnerships in rest area operations that
could help finance rest area services, maintenance actions, improved amenities and support rest
area security. The concept of using public-private partnerships for private truck stops adjacent to
rest areas is discussed in the report entitled Truck Parking Issues at State Facilities in Colorado
(FHU, 2007).
5.6 Further Rest Area Sustainability Studies and Funding
It is recommended that CDOT implement many of the opportunities identified by the CSU-
Pueblo Team at the Project rest areas and other CDOT rest areas. It is also recommended that
CDOT isolate one rest area that can be a showcase of a sustainable rest area. It is possible that a
CDOT rest area could be retrofitted to accommodate this study’s recommendations and achieve
carbon neutrality. It is also possible that one of these Project rest areas can be a candidate rest
area for retrofitting and improvement. The following are potential funding mechanisms that
would support the implementation of this report’s sustainable recommendations and towards the
development of an innovative, retrofitted, carbon neutral rest area:
Colorado Governor’s Office
Under the “Commercial & Public” tab at the Colorado Governor’s Office webpage
(www.rechargecolorado.com), there are lists of rebates and grants that public facilities
can apply for to conserve energy. One of them is the energy performance contracting
program. It assists Colorado state agencies to purchase new energy-efficient equipment
88
and pay for them later through the energy money savings. This website also lists many
other rebates that may be applicable.
Denver Regional Council of Governments (DRCOG)
The DRCOG website lists available grants at www.drcog.org. This list is located under
“Regional Sustainability” and then under “Grant Opportunities”. The list includes the
grant name, application due date, description, and eligible entities. Also, the website
states that if there are suggestions for additional grant opportunities to contact Jill
Locantore at 303-480-6752.
United States Department of Energy (DOE)
Within the DOE, the Office of Science has a program known as the Office of Science
Financial Assistance Program. All available government grants are posted at
www.grants.gov.
United States Department of Transportation
There are grant programs available from the Federal Transit Administration (FTA). They
can be found at www.fta.dot.gov/funding/grants_financing)263.html. These programs
are FTA sponsored and have an overview page that describes the programs and other
relevant information. The only program that may apply to the recommended
sustainability work is the Flexible Funding for Highway and Transit.
United States Environmental Protection Agency (EPA)
The EPA posts synopses of competitive grants opportunities from www.grants.gov. on
the EPA website (www.epa.gov/ogd/grants/funding_opportunities.htm). Also located on
the EPA website is the Catalog of Federal Domestic Assistance (CFDA) for potential
funding. The CFDA gives access to a database of all Federal programs available to state
and local governments.
American Recovery and Reinvestment Act (ARRA)
Under ARRA, the Obama Administration has committed to investing $3.2 billion in
energy efficiency and conservation projects in U.S. cities, counties, States, territories, and
Native American tribes. The Energy Efficiency and Conservation Block Grant Program
(EECBG), funded by ARRA, will provide formula grants for projects that reduce total
energy use and fossil fuel emissions, and improve energy efficiency nationwide. A

89
detailed breakdown of the EECBG funding by State, county, city and tribal government
can be found at www.energy.gov/recovery.
Regional Air Quality Council (RAQC)
The mission of the RAQC is to develop and propose effective and cost-efficient air
quality planning initiatives with input from government agencies, the private sector,
stakeholder groups, and citizens for the Denver Area and North Front Range 8-hour
Ozone Nonattainment Area. The RAQC provides up-to-date information on diesel-related
issues and technologies; Clean Air Fleets also educates fleet operators through
conference and workshops. Funding opportunities available through Clean Air Fleets for
retrofit and alternative fuel projects can be found at www.cleanairfleets.org.
Energy for Sustainability - The National Science Foundation requests proposals for
Energy for Sustainability. This program supports fundamental research and education in
energy production, conversion, and storage and is focused on energy sources that are
environmentally friendly and renewable. Sources of sustainable energy include:
Sunlight, Wind/Wave, Biomass, and Geothermal. Responses due 3/3/11. For more info,
contact Gregory Rorrer at [email protected] or go to:
http://www.grants.gov/search/search.do?mode=VIEW&oppId=58929. Refer to Sol# PD-
11-7644. (Grants.gov 11/30/10)
Environmental Sustainability - The National Science Foundation requests proposals for
Environmental Sustainability. This program supports engineering research with the goal
of promoting sustainable engineered systems that support human well-being and that are
also compatible with sustaining natural systems. Research in Environmental
Sustainability typically considers long time horizons and may incorporate contributions
from the social sciences and ethics. Responses due 3/3/11. For more info, contact Bruce
Hamilton at [email protected] or go to:
http://www.grants.gov/search/search.do?mode=VIEW&oppId=59009. Refer to Sol# PD
11-7643. (Grants.gov 12/3/10)

90
CHAPTER 6. INTRODUCTION (RIGHT-OF-WAY [ROW])
6.1 Background
Recent federal energy policies have placed increased emphasis on strategies by federal agencies
to reduce greenhouse gas (GHG) emissions. Executive Order 13514 (EO 13514) was issued on
October 5, 2010 by President Obama with a goal to “establish an integrated strategy towards
sustainability in the Federal Government and to make reduction of greenhouse gas emissions a
priority for Federal agencies.” EO 13514 sets requirements related to energy efficiency and
GHG management that affect FHWA policy regarding business with federal and state partners.
Compliance with EO 13514 provides a motivation for agencies including state DOTs to adopt
sustainability measures.
The State of Colorado has also introduced clean air policy through measures such the Governor’s
2007 Climate Action Plan, which calls for a 20 percent reduction in greenhouse gas (GHG)
emissions from 2005 levels by 2020 and an 80 percent reduction by 2050. The corresponding
Colorado Governor’s Energy Initiative of 2007 (Executive Orders D011 07 and D012 07) calls
for state agencies to reduce their overall energy use by 20 percent and to reduce state vehicle
petroleum consumption by 25 percent in volume by 2012.
In 2004, Colorado voters passed a Renewable Energy Standard (RES) requiring the state’s
largest utilities to supply at least 10 percent of the electricity from renewable sources by 2015.
This mandate has now been raised to providing 30 percent renewable energy by 2020. As a
result, there is increased emphasis on CDOT to develop strategies to reduce GHG emissions.
One strategy may be to use existing ROW to produce energy, either through use of existing
biomass, geothermal or hydropower resources, or to use the land area for energy ‘capture’
through solar or wind applications. However, there is little comprehensive data on the amount of
ROW within Colorado that is potentially suitable for alternative energy production. The purpose
of this study is to address that gap.
CDOT maintains 9,144 linear miles of roadway ROW, which includes roadway surfaces,
medians, shoulders, clear zones and interchange areas. CDOT is also responsible for
approximately 400 facilities and 40 other ‘remnant’ land parcels. Because of Colorado’s unique

91
characteristics – more than 300 days of sunshine per year; productive wind areas; locations of
geothermal activity; vegetated areas with grasses, timber and crops; and mountainous areas with
fast-moving streams, CDOT ROW may be well-suited to produce alternative energy from solar,
wind, geothermal, biomass, and hydropower systems.
CDOT conducted this study to evaluate the ROW acreage in Colorado for its energy-producing
capacity and to estimate the amount of electricity in kilowatt-hours (kWh) or biomass in tons for
electricity that could be generated from available ROW. CDOT also wished to better understand
the federal and state legal and policy framework relating to CDOT’s ability to use produced
energy internally and/or providing an external revenue source to fund CDOT operations. The
benefits of the study to CDOT include providing a clearer picture of the quantity and quality of
alternative energy resources under its management and the potential cost savings for
illumination, signals, ramp metering, facilities and maintenance. Such knowledge will allow
CDOT to expand its partnership with the Governor’s Energy Office to meet both state and
federal requirements for alternative energy generation, and to offer a potential funding source for
CDOT operations.
The basis for selecting the types of alternative energy to be evaluated in this study was a 2009
report by the Colorado Governor’s Task Force on Renewable Resource Generation “Connecting
Colorado’s Renewable Resources to the Markets” which mapped and evaluated Colorado’s
solar, wind, hydroelectric power, geothermal, biomass and ethanol and biodiesel fuels resources.
The report identified ‘Renewable Resource Generation Development Areas’ (GDAs), which are
defined as compact geographic areas capable of producing a minimum of 1000 megawatts (MW)
of developable electric-generating capacity that could connect to an existing or new high voltage
transmission line.
Although the report contained useful information on the locations and types of alternative energy
within Colorado, it was not intended to serve the same purpose as this research effort and does
not specifically address ROW as a contributor to alternative energy production. However, the
geographic information system (GIS) data layers for each resource were obtained from the
Governor’s Task Force and the study team traced the data back to the original source(s) as

92
described below. The study team also used the report’s energy production categories and units
(wind power classes, range of solar power levels, etc.) to maintain consistency between the
reports. By comparing findings of both studies, the percentage of total statewide energy that
could be produced within CDOT ROW can also be estimated.
6.2 Method
The study was conducted by CSU-Pueblo and involved preparing mapping of CDOT ROW and
overlaying mapping of alternative energy information in order to identify the production
capability for each resource in CDOT ROW. Maps were prepared for the entire State of
Colorado to show the location and distribution of each resource. Mapping was also prepared for
each of the six CDOT Regions for wind and solar to provide more detail on resources and ROW
locations. The mapping and resource evaluation included several steps:
Obtain GIS data layers and prepare mapping of existing CDOT ROW and facilities statewide
and for each of the six CDOT Regions;
Develop and apply criteria on the usability of CDOT ROW (to exclude areas where safety
could be compromised by construction of structures, fencing, ingress-egress, for
example);
Prepare mapping overlays of alternative energy by type (solar, wind, geothermal, biomass
and small hydropower) and usable CDOT ROW;
Calculate the total energy potential within usable CDOT ROW (generally in gigawatt-hours
per year [GWh/year]).
For Step 1, alternative energy GIS data were obtained from sources including the National
Renewable Energy Laboratory (NREL), which also supplied much of the data for the Governor’s
Energy Report. Other sources included the Idaho National Engineering and Environmental
Laboratory (INEEL), the Colorado Governor’s Energy Office, Western Area Power
Administration (WAPA), and utility companies including Xcel Energy and Black Hills Energy.

93
For Step 2, State Highway Geometrics linear GIS data was obtained from CDOT1 and sorted
into categories to indicate those areas that would safely and legally allow alternative energy
production and transmission under current restrictions. The State of Colorado has adopted a
nationwide recommended policy that does not allow utilities within the median area of freeways,
except for some direct crossings (A Policy on the Accommodation of Utilities within Freeway
Right-of-Way, AASHTO, 2005). Although medians could provide substantial acreage for the
production of alternative energy, for purposes of this study medians were excluded from
potential energy production calculations. However, this policy could be amended in the future,
particularly for the harvesting of biomass for energy production. Therefore, the electronic ROW
files included with this report include a data field that could be applied to total ROW in the
future.
ROW types that were analyzed included:
a) ROW on either side of the roadway extending up to 50 feet from the edge of pavement. It
was assumed that no alternative energy infrastructure or production would be allowed by
the FHWA within this area, which includes the shoulders and clear zones2 that are
maintained for safety purposes.
b) ROW on either side of the roadway extending 50 to 200 feet from the edge of pavement.
Those areas are typically outside of the clear zone and could more safely accommodate
infrastructure and provide access to energy production sites.
c) ROW on either side of the roadway extending 200 feet or more from the edge of
pavement. Such wide areas may provide sufficient setback from the roadway to allow
construction of large structures and facilities such as wind towers with long turbine
blades. Less buffering from the roadway (barriers, fencing, etc.) would also be required.
d) Additional ‘remnant’ parcels of land adjacent to the ROW that are managed by CDOT
but do not contain buildings or other infrastructure. Approximately 260 acres in 42
parcels of one or more acres were identified from mapping obtained from CDOT
1 GIS ROW data received from Gary Aucott, CDOT, August 2010. 2 Clear zones are defined as the total roadside border area, starting at the edge of the traveled way, available for safe use by errant vehicles. This area may consist of a shoulder, a recoverable slope, a non-recoverable slope and/or a clear run-out area. The desired width is dependent upon the traffic volumes and speeds, and on the roadside geometry (AASHTO, 2005)

94
Regions. It was assumed that parcels of less than one acre could not safely or efficiently
accommodate structures such as solar installations and the required ingress/egress.
e) CDOT facilities including rest areas, maintenance yards, and offices. CDOT is currently
conducting a separate study by Johnson Controls to identify and characterize these
facilities, and detailed information was not available at the time of this report. However,
the six rest areas that were evaluated in the Rest Area Sustainability portion of this
research project were mapped and are identified on the base maps (Sleeping Ute
Mountain [Cortez]; El Moro [Trinidad]; Poudre [Fort Collins/Loveland]; Hanging Lake
[Glenwood Springs]; Vail Pass [Vail]; and Sterling [Sterling]).
These steps produced an estimate of the theoretical maximum amount of energy from each
energy type for all CDOT ROW except facilities (see e, above). Additional criteria were then
applied to more realistically estimate energy production such as the degree of technology
efficiency, the percentage of surface area that could be feasibly devoted to energy production,
and inherent challenges in accurately estimating energy production. For example, tons of
biomass per acre can vary widely depending on the type of vegetation and the growing
conditions.
Findings of this analysis process are described below for each alternative energy resource type.
Chapter 8 discusses the existing legal and policy issues surrounding the use of alternative energy.
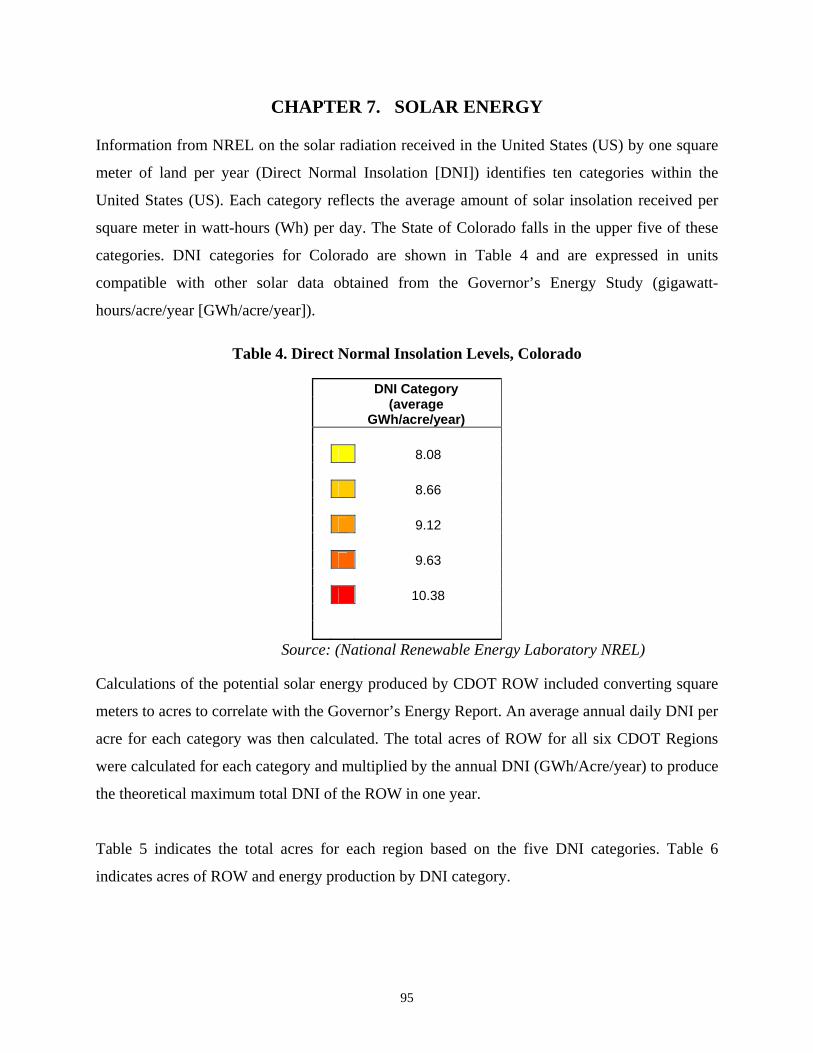
95
CHAPTER 7. SOLAR ENERGY
Information from NREL on the solar radiation received in the United States (US) by one square
meter of land per year (Direct Normal Insolation [DNI]) identifies ten categories within the
United States (US). Each category reflects the average amount of solar insolation received per
square meter in watt-hours (Wh) per day. The State of Colorado falls in the upper five of these
categories. DNI categories for Colorado are shown in Table 4 and are expressed in units
compatible with other solar data obtained from the Governor’s Energy Study (gigawatt-
hours/acre/year [GWh/acre/year]).
Table 4. Direct Normal Insolation Levels, Colorado
DNI Category
(average
GWh/acre/year) 8.08 8.66 9.12 9.63 10.38
Source: (National Renewable Energy Laboratory NREL) Calculations of the potential solar energy produced by CDOT ROW included converting square
meters to acres to correlate with the Governor’s Energy Report. An average annual daily DNI per
acre for each category was then calculated. The total acres of ROW for all six CDOT Regions
were calculated for each category and multiplied by the annual DNI (GWh/Acre/year) to produce
the theoretical maximum total DNI of the ROW in one year.
Table 5 indicates the total acres for each region based on the five DNI categories. Table 6
indicates acres of ROW and energy production by DNI category.

96
Table 5. Total Acres by CDOT Region, per DNI Category DNI
Category (Average
GWh/year) Acres of ROW
Region
1 Region
2 Region
3 Region
4 Region
5 Region
6 State Total
8.08 1,385 0 3,432 7,181 0 584 12,582
8.66 6,276 310 7,872 5,288 494 3,093 23,333
9.12 3,411 4,112 4,666 0 1,938 0 14,127
9.63 62 3,173 166 0 3,963 0 7,364
10.38 0 347 0 0 4,581 0 4,928
Total 62,334
Table 6. Maximum Energy Production by Direct Normal Insolation (DNI) Category, in GWh/acre/year
DNI Category Acres GWh/year
(average
GWh/acre/year) 8.08 12,581 101,668 8.66 23,333 202,145 9.12 14,126 128,838 9.63 7,363 70,893 10.38 4,927 51,163 Total 62,330 554,707
Colorado receives fairly intense rates of solar insolation, with the highest rates in the far southern
and southwestern locations from the San Luis valley west to Cortez within CDOT Regions 2 and
5 (NREL, 2009). Figure 31 indicates insolation levels for the entire state, and Figures 1-a

97
through 1-f indicate the levels for each of the six CDOT Regions. The northern areas in CDOT
Regions 3, 4, and 6 receive lesser amounts of solar insolation, but at considerably higher rates
than the nationwide average.

Figgure 31. Colora
98
do Solar Resouurce Potential

Figure 311-a. Colorado S
99
Solar Resource Potential Regiion 1

Figure 311-b. Colorado S
100
Solar Resourcee Potential Regiion 2

Figure 31-c. CColorado So
101
olar Resourrce Potentiall Region 3
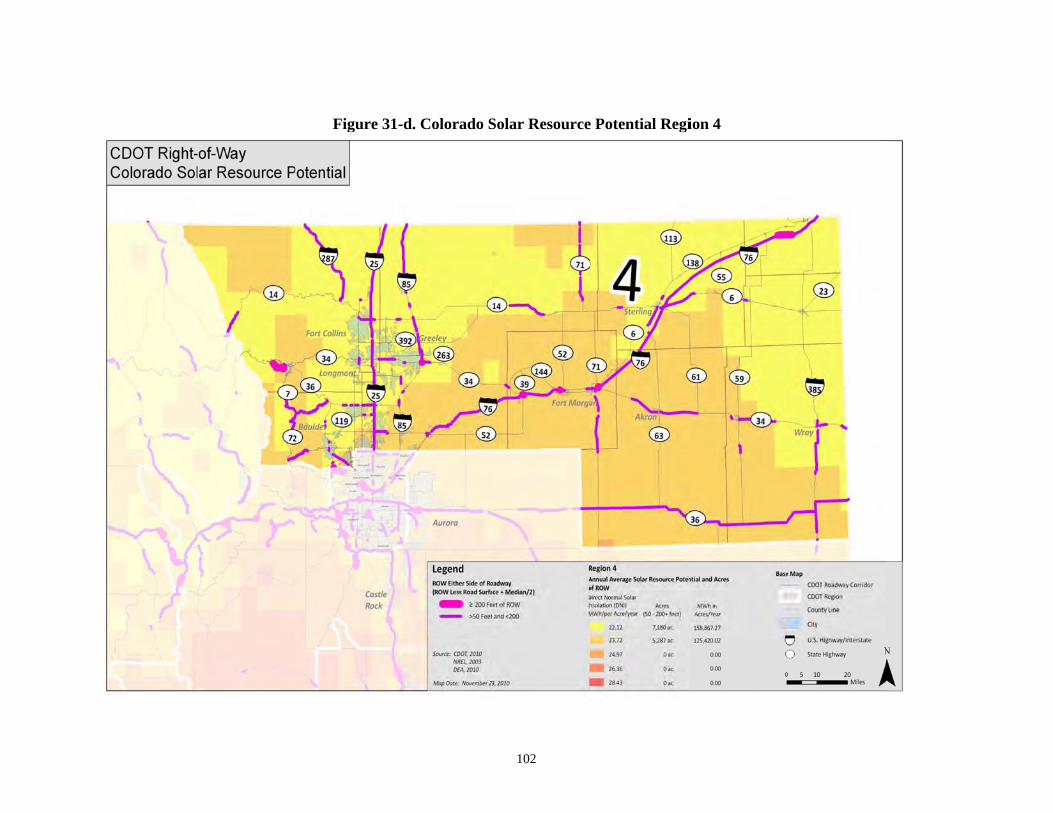
Figure 311-d. Colorado S
102
Solar Resourcee Potential Regiion 4

Figure 311-e. Colorado S
103
Solar Resource Potential Regiion 5
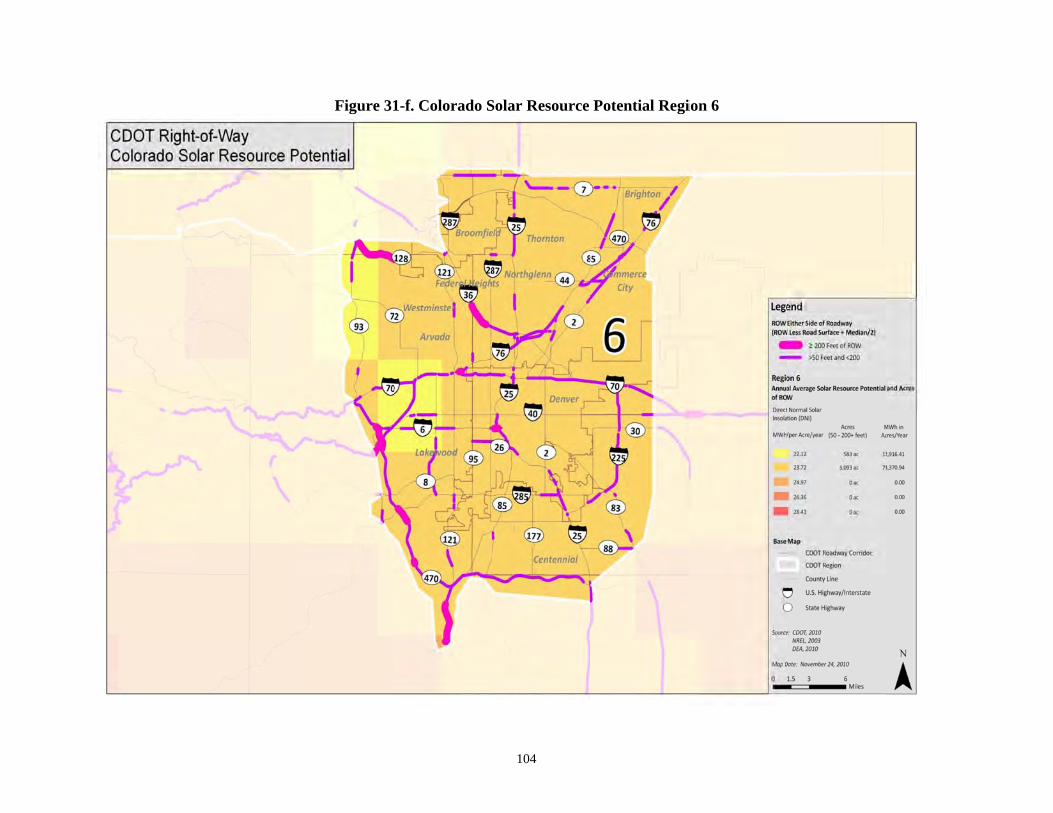
Figure 311-f. Colorado S
104
Solar Resource Potential Regiion 6
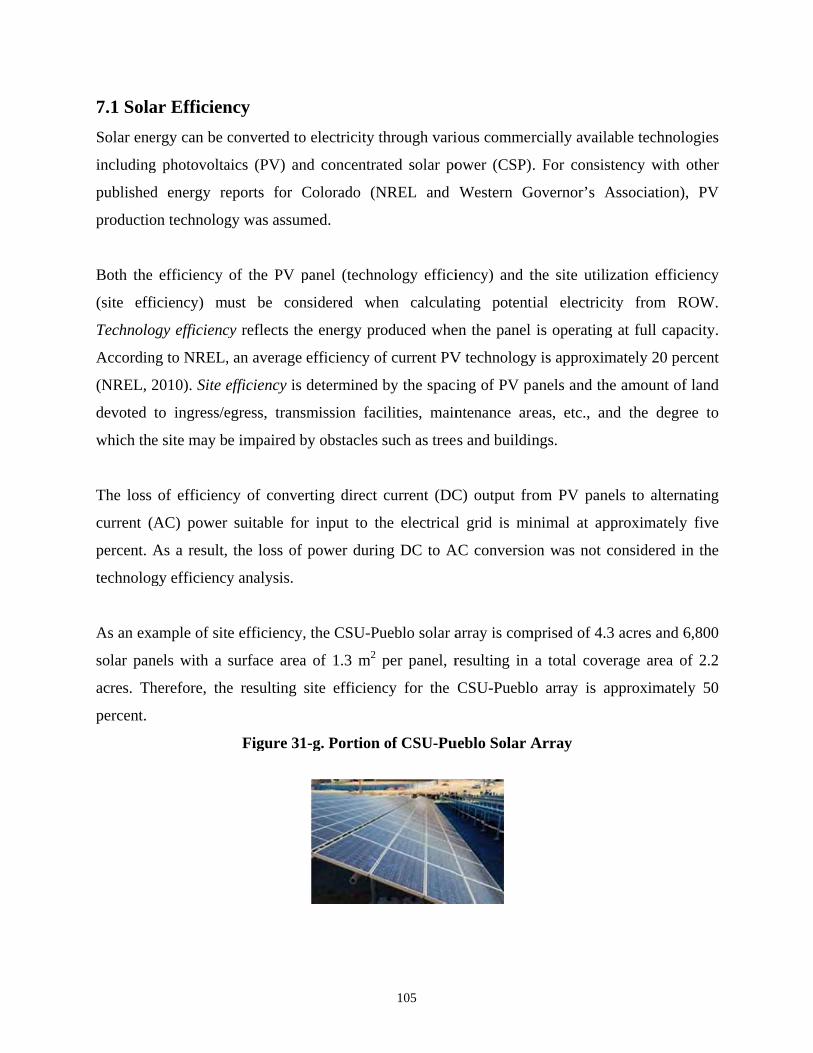
7.1 Sola
Solar ene
including
published
productio
Both the
(site eff
Technolo
Accordin
(NREL, 2
devoted
which the
The loss
current (
percent.
technolog
As an ex
solar pan
acres. Th
percent.
ar Efficien
ergy can be c
g photovolta
d energy re
on technolog
e efficiency
ficiency) mu
ogy efficienc
ng to NREL,
2010). Site e
to ingress/e
e site may b
of efficienc
(AC) power
As a result,
gy efficiency
ample of sit
nels with a
herefore, the
ncy
converted to
aics (PV) an
eports for C
gy was assum
of the PV p
ust be con
cy reflects th
, an average
efficiency is
egress, trans
e impaired b
cy of conve
suitable for
the loss of
y analysis.
e efficiency,
surface area
e resulting
Figure 31
o electricity t
nd concentra
Colorado (N
med.
panel (techn
nsidered wh
he energy pr
efficiency o
determined
smission fac
by obstacles
rting direct
r input to th
power durin
, the CSU-Pu
a of 1.3 m2
site efficien
1-g. Portion
105
through vari
ated solar po
NREL and
nology effici
hen calculat
oduced whe
of current PV
by the spaci
cilities, main
such as tree
current (DC
he electrical
ng DC to A
ueblo solar a
per panel, r
ncy for the
of CSU-Pu
ious commer
ower (CSP)
Western G
iency) and t
ting potent
en the panel
V technology
ing of PV pa
ntenance are
s and buildin
C) output fro
l grid is mi
AC conversio
array is com
resulting in
CSU-Pueblo
ueblo Solar A
rcially availa
. For consis
Governor’s A
the site utili
tial electrici
is operating
y is approxim
anels and th
eas, etc., an
ngs.
om PV pan
inimal at ap
on was not c
mprised of 4.3
a total cove
o array is a
Array
able technol
stency with
Association)
ization effic
ity from R
g at full capa
mately 20 pe
he amount of
nd the degr
els to altern
pproximately
considered i
3 acres and 6
erage area o
approximatel
logies
other
, PV
iency
ROW.
acity.
ercent
f land
ree to
nating
y five
in the
6,800
of 2.2
ly 50
106
When considered together, these factors represent the capacity factor3 of a particular site and
technology. The capacity factor was applied to ROW energy production calculations. An overall
capacity factor of ten percent was calculated based on 50 percent (site) and 20 percent
(technology) efficiency. Thus, only 10 percent of the total amount of solar energy received by
ROW in Colorado is available for electricity production.
Comprehensive data on the total amount of electricity used by CDOT annually was not available,
but records on recent electricity use for various locations in Region 2 were obtained and
analyzed to compare existing usage to the potential energy generated by a PV facility. For
example, the total electricity usage at an interchange complex in Walsenburg in 2009 was 38.6
MWh/year. This interchange includes approximately 18.6 acres of land, which is estimated to
include 25 percent undeveloped land (4.65 acres) that is outside of the clear zone. A solar PV
installation on this 4.65 acre site could generate 4.5 GWh/year based on a DNI of 9.63
GWh/year, 20 percent solar panel efficiency and assuming 50 percent land coverage by the solar
panel array. The existing interchange lighting would require only 1.5 percent of the solar array
power, and the remaining electrical supply would be available for other purposes.
In another example, records indicate that the CDOT Region 2 Colorado Springs office used 2.3
GWh of electricity in 2009. A section of Interstate 25 that meets the criteria for potential solar
applications (ROW wider than 50 feet from edge of pavement) is located within one mile of the
office. If this 10.8 acre site was fully developed with solar PV, approximately 9.8 GWh could be
produced annually. This amount would meet 100 percent of the office’s yearly electricity needs
and provide a surplus.
As a current transportation example, the Oregon Department of Transportation (ODOT) recently
installed a relatively small PV system (0.2 acres) within the ROW of the major interchange area
at I-5/I-205 to generate electricity for the interchange’s lighting needs (Oregon Department of
Transportation, Solar Highway, 2009). This system generates approximately 130 MWh/year (at
3 Capacity factor is the ratio of the actual output of a power producer such as a solar PV system over a period of time compared to output if it had operated at full capacity the entire time. Capacity factors vary greatly depending on the type of fuel. Solar energy, for example, is not produced during nighttime or cloudy conditions, and efficiency is decreased with factors such as the degree of slope and obstacles such as trees. Current technology is also not 100 percent efficiency in converting solar energy to electricity.
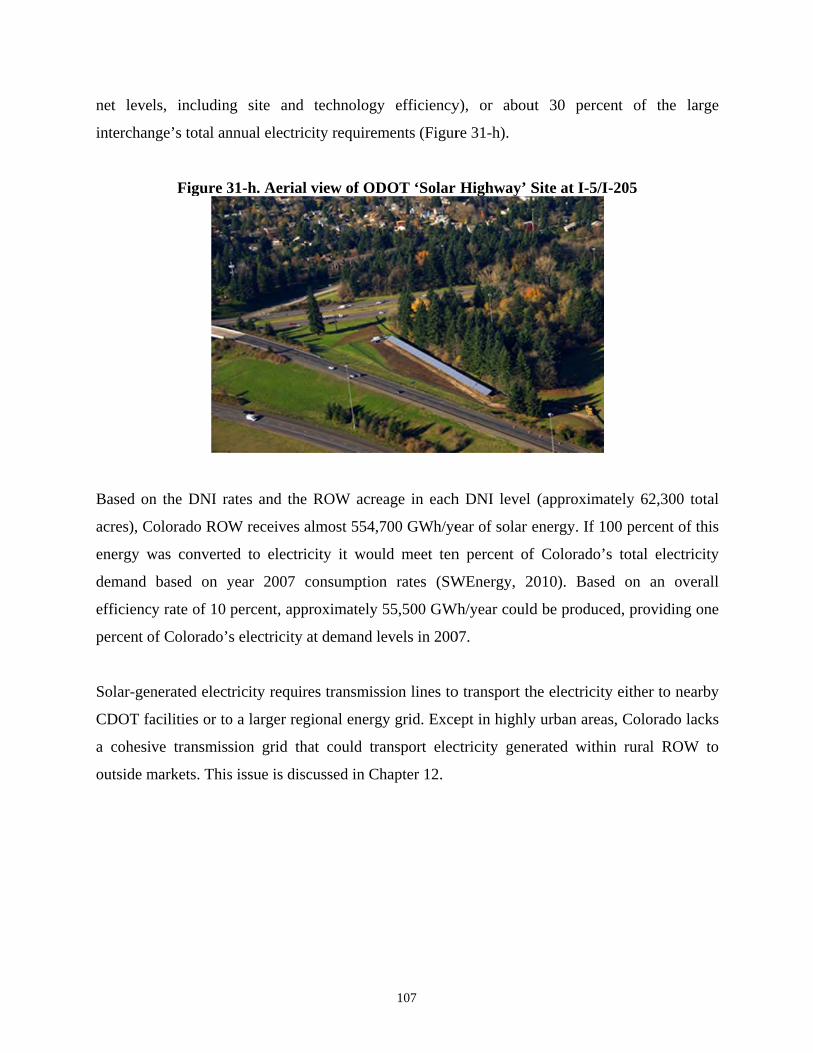
net leve
interchan
Based on
acres), C
energy w
demand
efficiency
percent o
Solar-gen
CDOT fa
a cohesiv
outside m
ls, includin
nge’s total an
Figure 3
n the DNI r
Colorado RO
was converte
based on y
y rate of 10
of Colorado’
nerated elect
acilities or to
ve transmis
markets. This
ng site and
nnual electri
31-h. Aerial
ates and the
W receives
ed to electri
year 2007
percent, app
s electricity
tricity requir
o a larger reg
sion grid th
s issue is dis
technology
city requirem
l view of OD
e ROW acre
almost 554,7
icity it wou
consumption
proximately
at demand l
res transmis
gional energ
hat could tra
scussed in Ch
107
y efficiency
ments (Figur
DOT ‘Solar
eage in each
700 GWh/ye
uld meet ten
n rates (SW
55,500 GW
levels in 200
sion lines to
gy grid. Exce
ansport elec
hapter 12.
y), or abou
re 31-h).
Highway’ S
h DNI level
ear of solar e
n percent of
WEnergy, 2
Wh/year could
07.
o transport th
ept in highly
ctricity gene
ut 30 perce
Site at I-5/I-
(approxima
energy. If 10
f Colorado’s
2010). Based
d be produce
he electricity
y urban areas
erated withi
ent of the
-205
ately 62,300
00 percent o
s total elect
d on an ov
ed, providing
y either to ne
s, Colorado
n rural ROW
large
total
of this
tricity
verall
g one
earby
lacks
W to

108
CHAPTER 8. WIND ENERGY
NREL research established seven categories for wind power density ranging from 0 watts per
square meter (W/m2), described as ‘poor’, to 800 or greater W/m2 described as ‘superb.’
Categories for wind resource in Colorado are shown in Table 7. The total wind power potential
in the ROW was calculated by converting meters to acres and multiplying the annual wind
energy per acre (mWh/acre) in each category by the total number of acres in the ROW in that
category. Table 8 indicates the total wind power generated in GWh per year.
Table 7. Colorado Wind Power Classes
Power Class Resource PotentialWind Power Density at
50m height, (W/m2) Poor 0 - 199 Marginal 200 - 299 Fair 300 - 399 Good 400 - 499 Excellent 500 - 599 Outstanding 600 - 800 Superb >800
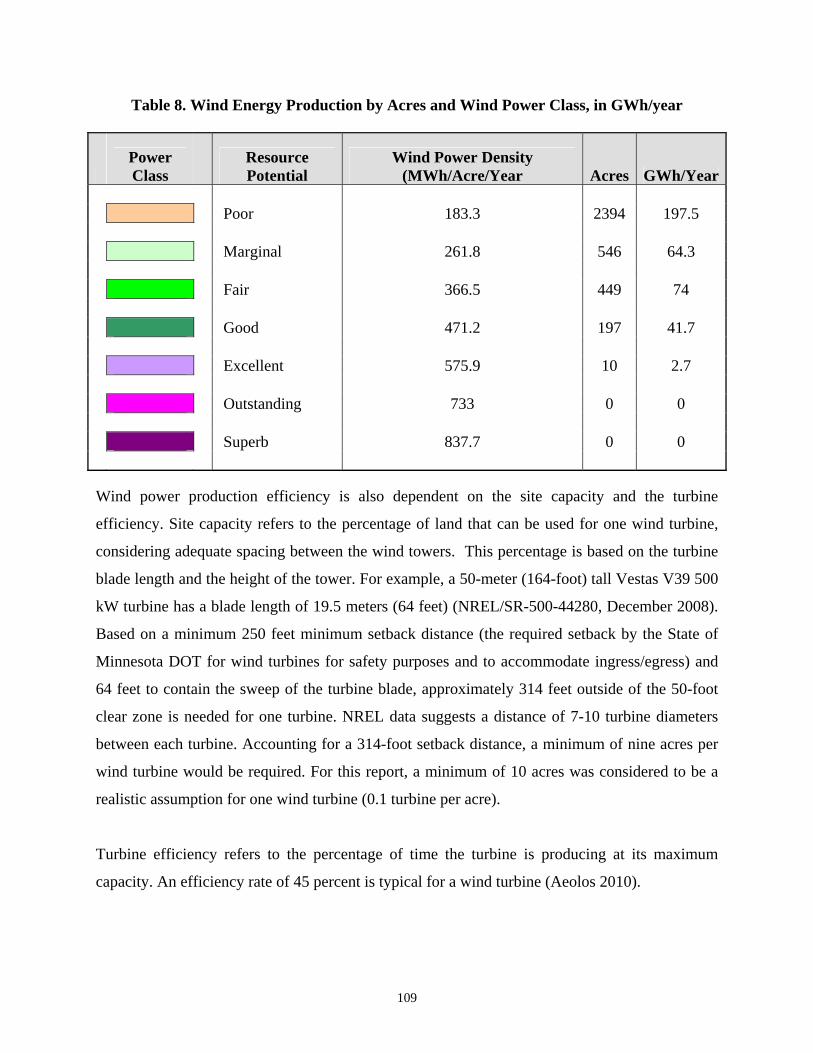
109
Table 8. Wind Energy Production by Acres and Wind Power Class, in GWh/year
Power Class
Resource Potential
Wind Power Density (MWh/Acre/Year Acres GWh/Year
Poor 183.3 2394 197.5 Marginal 261.8 546 64.3 Fair 366.5 449 74 Good 471.2 197 41.7 Excellent 575.9 10 2.7 Outstanding 733 0 0 Superb 837.7 0 0 Wind power production efficiency is also dependent on the site capacity and the turbine
efficiency. Site capacity refers to the percentage of land that can be used for one wind turbine,
considering adequate spacing between the wind towers. This percentage is based on the turbine
blade length and the height of the tower. For example, a 50-meter (164-foot) tall Vestas V39 500
kW turbine has a blade length of 19.5 meters (64 feet) (NREL/SR-500-44280, December 2008).
Based on a minimum 250 feet minimum setback distance (the required setback by the State of
Minnesota DOT for wind turbines for safety purposes and to accommodate ingress/egress) and
64 feet to contain the sweep of the turbine blade, approximately 314 feet outside of the 50-foot
clear zone is needed for one turbine. NREL data suggests a distance of 7-10 turbine diameters
between each turbine. Accounting for a 314-foot setback distance, a minimum of nine acres per
wind turbine would be required. For this report, a minimum of 10 acres was considered to be a
realistic assumption for one wind turbine (0.1 turbine per acre).
Turbine efficiency refers to the percentage of time the turbine is producing at its maximum
capacity. An efficiency rate of 45 percent is typical for a wind turbine (Aeolos 2010).

110
Areas of highest wind production in Colorado include the Eastern Pwesterlains from Sterling
south to La Junta, including CDOT Regions 1, 2, and 4. Figure 32 indicates the wind power
classes in Colorado, and Figures 32-a through 32-f show wind power classes for each of the six
CDOT Regions. These areas are mostly rated as Wind Power Classes “Fair” to “Good” (NREL,
2009), with a few localized areas of “Excellent” classification north of Sterling and southeast of
La Junta. There are numerous other sites within Colorado that are also rated as “Excellent” and
“Superb,” but these tend to be on mountain ridge areas and are not within CDOT ROW.
Accounting for efficiency factors relating to a minimum 250-foot safety setback, the need for
adequate site spacing (density) and turbine efficiency levels, approximately 380 GWh/year could
be produced on Colorado ROW. This is far less energy than could be produced by solar
applications on ROW, but the availability of wind in some locations in Colorado, particularly in
Regions 1, 2, and 4 could still provide good local sources of electrical power.
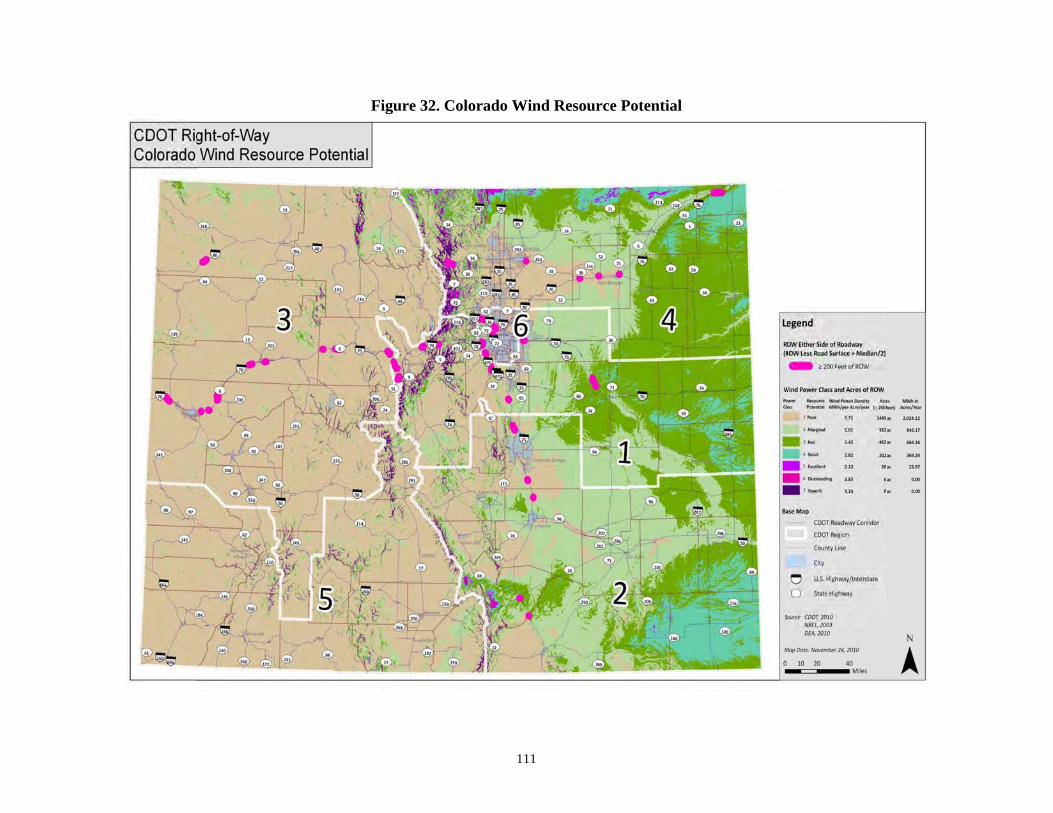
Figure 32. Colorad
111
do Wind Resou
urce Potential
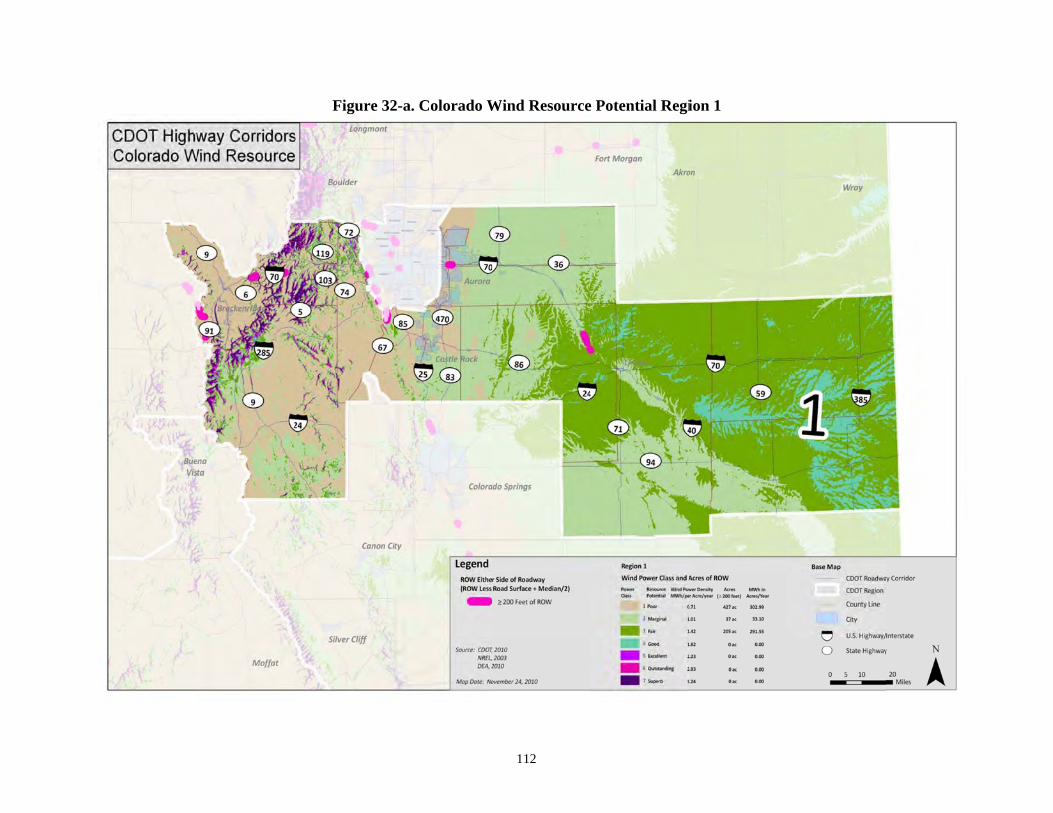
Figure 322-a. Colorado W
112
Wind Resourcee Potential Regiion 1

Figure 322-b. Colorado W
113
Wind Resourcee Potential Regiion 2
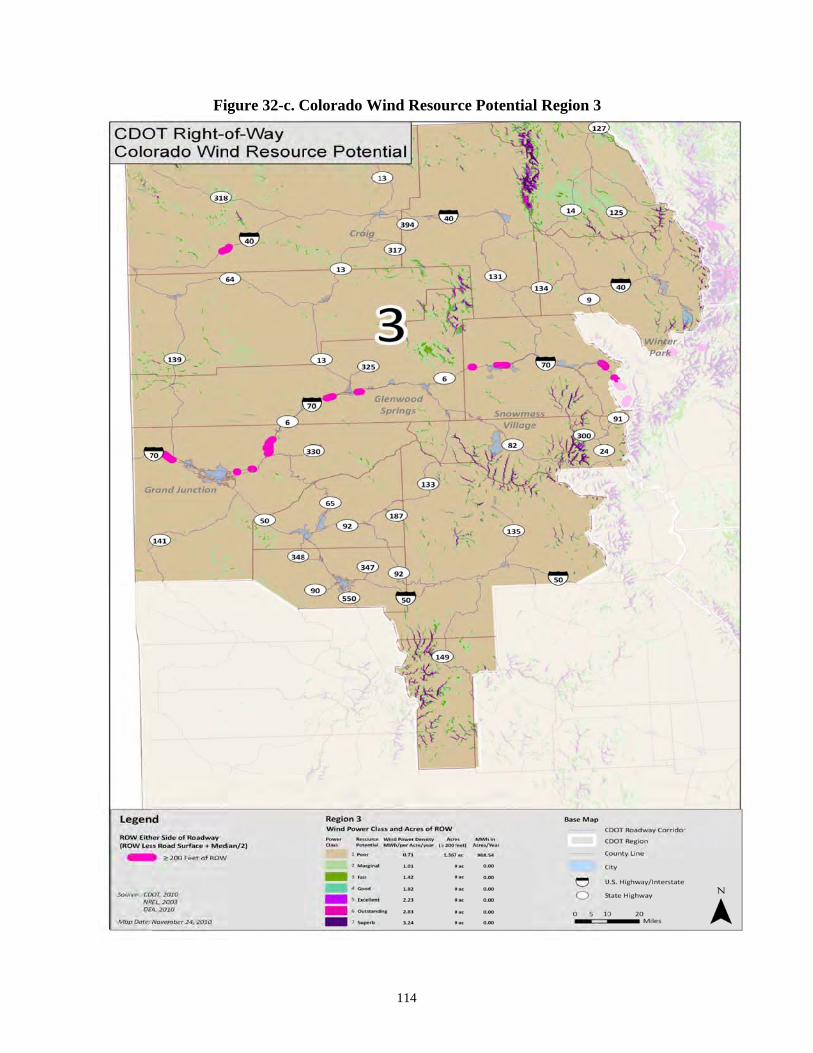
Figgure 32-c. CColorado W
114
Wind Resourrce Potentiaal Region 3
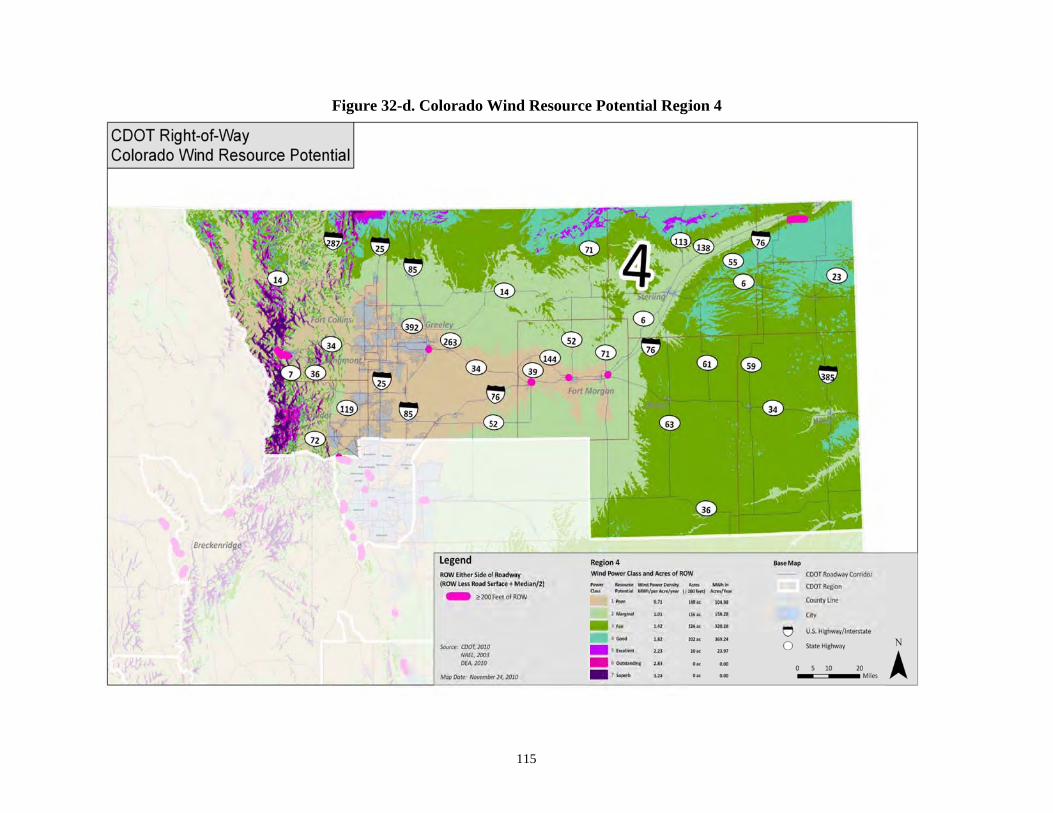
Figure 322-d. Colorado W
115
Wind Resourcee Potential Regiion 4
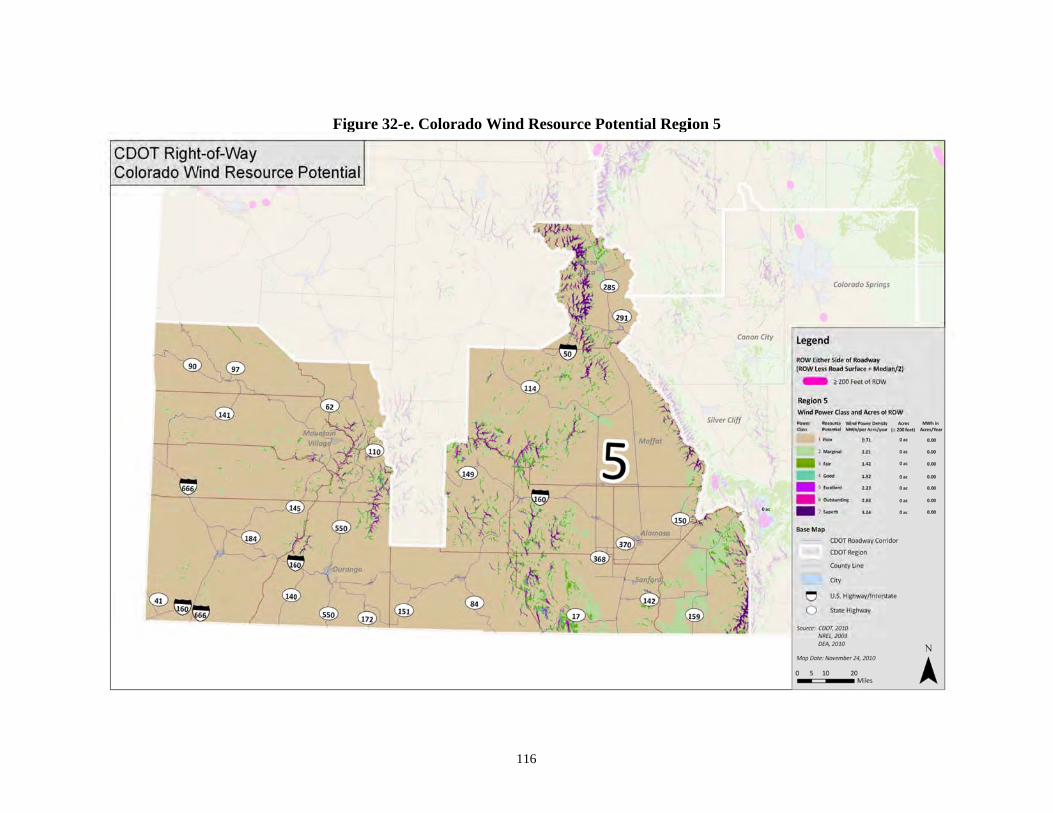
Figure 322-e. Colorado W
116
Wind Resourcee Potential Regiion 5

Figure 322-f. Colorado W
117
Wind Resource Potential Regiion 6

118
CHAPTER 9. BIOMASS
In the State of Colorado, biomass with potential as biofuel includes forest material, landfill,
wastewater, manure, and some crops such as corn and soybeans. Biofuels are already produced
in Colorado, and several ethanol and biodiesel refineries are located in the Front Range and
Eastern Plains. Several landfill methane production facilities are also operating in Colorado as
shown in Figure 33.
Five biomass production categories were established by NREL for the State of Colorado (Table
9). These categories range from very low production (an average of 0.0053 tons/acre/year) to a
high production level (an average of 0.23 tons/acre/year). Each county in Colorado falls in only
one of these five categories depending on how many tons could be produced based on land uses
and vegetation types. Because biomass can be harvested without the need for barriers or setbacks
to separate traveling vehicles from structures, usable ROW (excluding medians) was calculated
from edge of pavement to the outside edge of the ROW. Therefore, biomass acreage did not
include a 50 foot safety zone from edge of pavement as was assumed for solar and wind energy.
Biomass categories were converted to tons per acre per year to determine the tonnage that can be
produced in CDOT ROW for that category. Table 9 indicates the number of tons that can be
produced by each biomass category in CDOT ROW statewide.
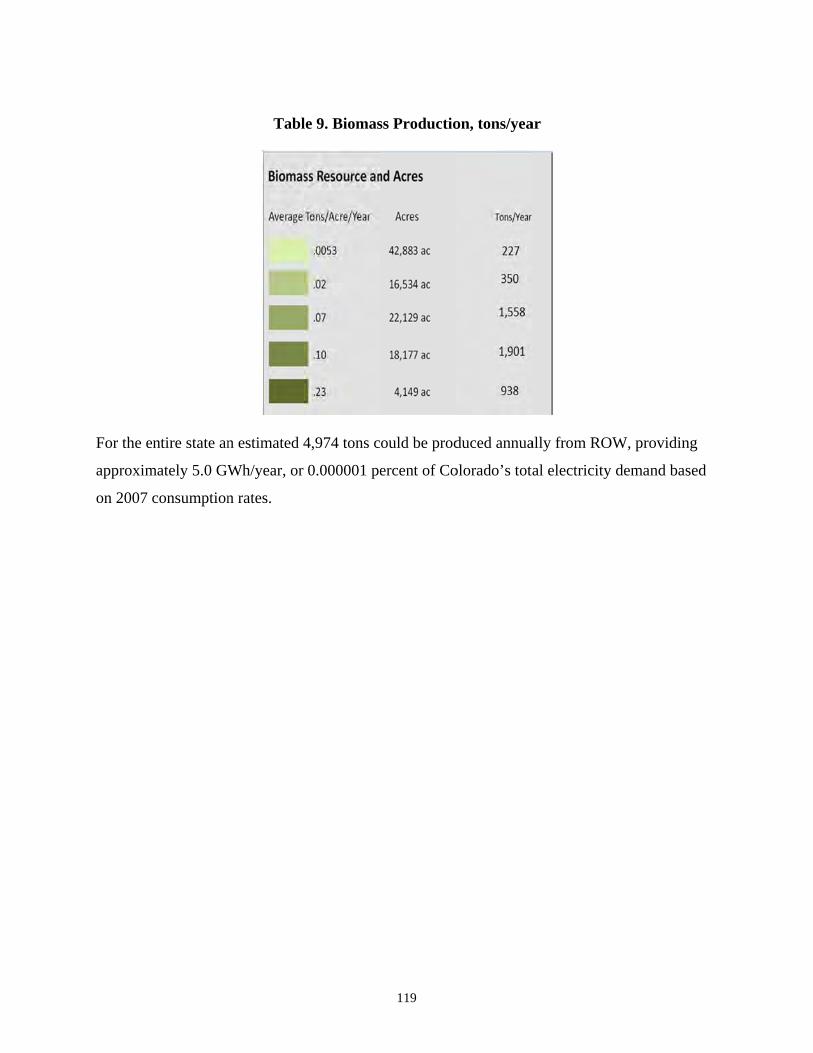
For the e
approxim
on 2007
ntire state an
mately 5.0 GW
consumption
Tabl
n estimated 4
Wh/year, or
n rates.
le 9. Biomas
4,974 tons c
0.000001 pe
119
ss Productio
ould be prod
ercent of Co
on, tons/yea
duced annua
olorado’s tota
ar
ally from RO
al electricity
OW, providin
y demand ba
ng
ased
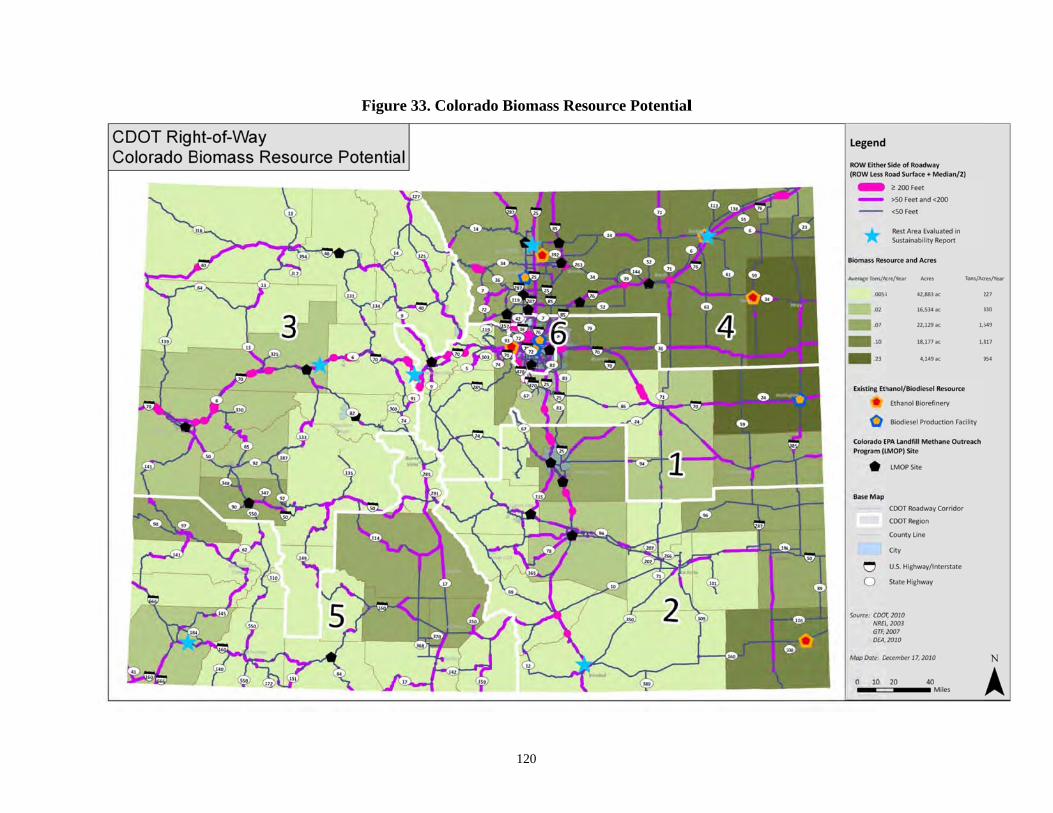
Figurre 33. Colorado
120
o Biomass Resoource Potentiall

121
CHAPTER 10. GEOTHERMAL
Colorado has numerous areas of known geothermal activity including well-known hot springs
such as those in Idaho Springs, Glenwood Springs, Buena Vista, Pagosa Springs, and Steamboat
Springs, and a total of 59 hot springs and 34 geothermal well sites statewide (Colorado
Geothermal Development Strategic Plan, 2007, GeoPowering the West - Colorado State
Working Group). These sites produce geothermal heat through geoexchange (heat pumps), direct
use (pools, greenhouses, etc.), and electrical power generation. Electrical power production
requires higher temperatures than geoexchange or direct uses, and until recently steam
geothermal power plants have required water temperatures above 300 degrees Fahrenheit (°F).
However, recent technologies are now using water at temperatures as low as 165 degrees °F.
States producing commercial-scale geothermal and electrical power include California, Nevada,
Utah, Hawaii, and Alaska. Colorado does not currently have any geothermal electricity
generation.
Colorado does have characteristics that indicate geothermal resources with electrical power
generation potential, including high heat flows in the mountains of central and western Colorado;
activity in the Dotsero volcano about 4,000 years ago; recent fault activity and the extension of
the Rio Grande rift zone through Colorado from the San Luis Valley north to central Colorado
(Colorado Geothermal Development Strategic Plan, 2007). Also, Colorado’s high altitude
results in a lower boiling point for water that also lowers the ‘flash point’ for steam production
that can be used to produce electricity (at 8,000 feet in elevation water boils at almost 15 degrees
°F lower than at sea-level) (Snyder, undated).
Ongoing research into Colorado’s geothermal resources is being conducted by the Colorado
Geological Survey, the Massachusetts Institute of Technology, and others to better identify the
potential for energy production. Recent maps indicate that resources within Colorado are
concentrated in the south-central portion of the state from Buena Vista through Alamosa and to
the state line, along Interstate 70 in and near Glenwood Springs, near Canon City and along State
Highway (SH) 145 near Telluride (Figure 34). An overlay of this mapping with CDOT ROW
areas wider than 50 feet on either side of the highway indicate that CDOT Regions 2, 3 and 5
have ROW within documented geothermal areas. Region 5 has the most acres of potential
122
geothermal-producing ROW (7,131 acres). Regions 1, 4 and 6 do not have ROW located in
known geothermal areas. Statewide, approximately 8,530 acres of ROW are located in
geothermal areas.
Opportunities for CDOT to use geothermal resources may include heating and cooling of nearby
CDOT facilities with heat pumps and the minor production of electricity through small-scale
steam production to power facilities such as roadway lighting, rest areas, workshops, and offices.
If transmission capacity is available, electrical power could be transported much further, but
transmission lines outside of Colorado’s urban areas are generally quite disperse and may not be
available. Until more reliable data are available, or unless CDOT evaluates specific ROW sites in
high-potential areas, the true potential of ROW for geothermal uses will remain largely
unknown.

Fiigure 34. Color
123
rado Geothermmal Potential

124
CHAPTER 11. HYDROPOWER
Hydropower has played a major role in electricity production in Colorado for over one hundred
years due in large part to Colorado’s rugged terrain, which provides numerous sites where
energy from streams and rivers flowing from higher to lower elevations can be captured. There
are currently about 62 operating hydropower facilities in Colorado, producing about five percent
of Colorado’s electric energy annually (NREL, 2005). Most hydropower plants are located in
CDOT Regions 3, 4, 5, and 6. Many of these facilities could operate at higher capacities with the
installation of efficiency improvements, and the U. S. Department of Energy (DOE) Idaho
National Engineering and Environmental Laboratory (INEEL) has identified 91 additional sites
in Colorado for potential new hydropower development. These sites are shown in Figure 35.
Detailed mapping of the locations of existing and potential new hydropower sites was not
available, and it is unlikely that CDOT ROW contains any existing hydropower facilities.
Therefore, this study did not attempt to quantify acres of ROW that would be suitable for
hydropower development. Rather, as Figure 35 illustrates, this study mapping identifies about a
dozen potential sites that appear to be located within 1/2 mile of a CDOT roadway. Such sites
could provide electricity through a short transmission line to CDOT facilities such as rest areas
and maintenance buildings, or for roadway lighting and signals.
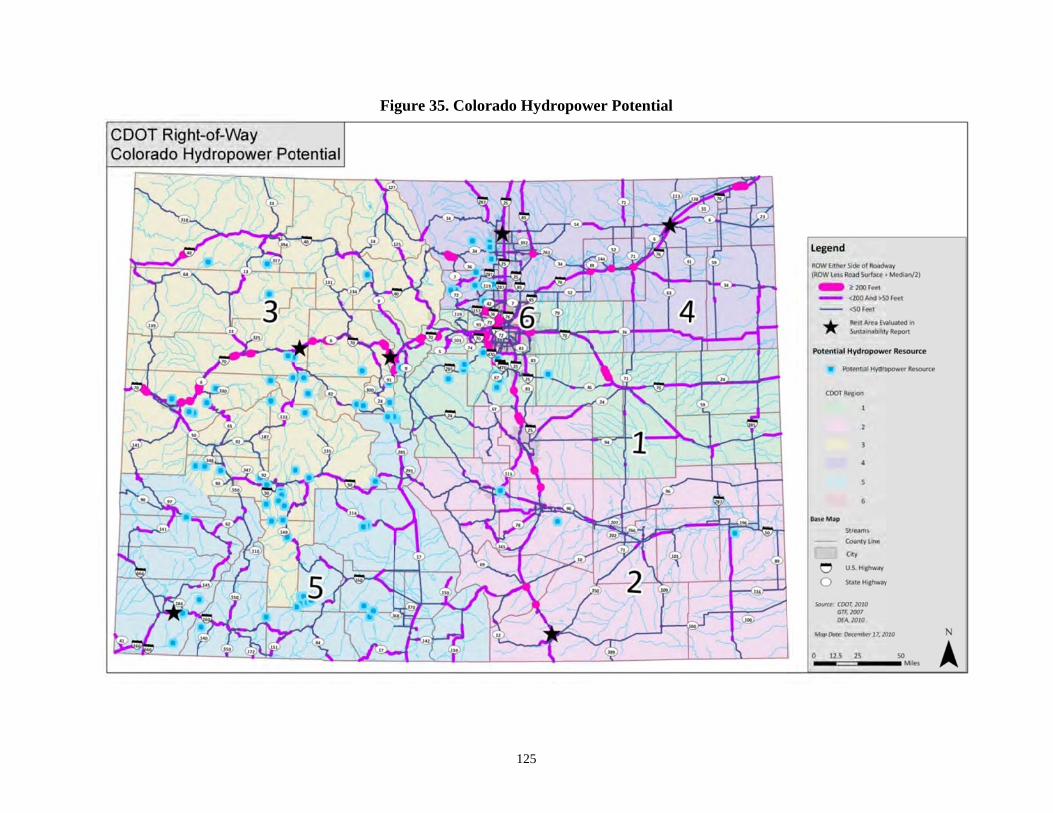
Fiigure 35. Color
125
ado Hydropowwer Potential

126
CHAPTER 12. TRANSMISSION
After electricity is generated it must travel on transmission lines to the end consumers, unless it
is consumed onsite. Although Colorado has thousands of miles of transmission lines, there are
large portions of the state with sparse coverage. Yet, these mostly rural areas can have significant
potential for renewable energy production such as wind, solar and biomass. Without access to
transmission lines, production of such energy may be infeasible or cost-prohibitive.
As shown in Figure 36, both Xcel Energy and the Western Area Power Administration (WAPA)
maintain major transmission lines in Colorado. Tri-State Generation and Transmission (Tri-
State) also has a substantial network of transmission lines, but mapping of those lines was not
available and is not shown in Figure 36.
Also indicated in Figure 36 are the conceptual routes for two proposed major transmission lines.
The High Plains Express is a 500 kV system that is proposed to traverse eastern Colorado from
north to south, crossing large areas undeveloped rural areas. Project sponsors are Xcel, Tri-State,
WAPA, Colorado Springs Utilities and utilities in New Mexico, Wyoming and Arizona. The
Eastern Plains Transmission Project is sponsored by Tri-State, WAPA and the Public Service
Company of Colorado, and would include about 1,000 miles of new high-voltage lines in eastern
Colorado and western Kansas. The lines could be expanded west to Alamosa and south to New
Mexico, tapping into new alternative energy projects in those locations.
The availability of existing and proposed transmission was not used to evaluate the potential for
alternative energy because of the lack of complete data and the conceptual level of mapping
detail obtained from Xcel and WAPA. It does appear, however, that substantial investments in
new major transmission lines will take place over the next decade, and that the ability to connect
alternative energy production sources on CDOT ROW to a much larger grid will improve in the
future.

Figure 336. Colorado E
127
Electrical Trans
smission Potenttial

128
CHAPTER 13. LEGAL AND POLICY CONSIDERATIONS
Prior to 1988, the FHWA prohibited the installation of most new utilities within interstate ROW,
and many states including Colorado adopted the same policy for state highways. In 1988, that
policy was changed to allow each state to decide whether to permit new utilities within interstate
ROW and to specify the conditions for approval. Each state is required to prepare a Utility
Accommodation Policy (UAP) that describes the state’s plan for allowing public and/or private
utilities within ROW. The state’s Utility Accommodation Policy must be approved by FHWA.
The 1988 FHWA policy also redefined public utilities as those ‘in the public interest’ and allows
such utilities in interstate ROW if accommodated in a way that is safe for the traveling public. A
Special Use Permit, or similar permit, must be issued by the state for public utilities. Private
utilities can also be allowed within ROW, but must be permitted under an ‘airspace lease’ (23
Code of Federal Regulations (CFR) 710.405) that has different and more stringent requirements.
For example, states must charge fair market prices for private utility leases with some exceptions
for leases that ‘provide an overall public benefit.’ The net income from such leases may only be
used for transportation purposes.
Emerging technologies for solar, wind and other alternative energy systems have caused FHWA
and the states to reexamine existing definitions of ‘utilities.’ In 2005, AASHTO published the
‘Policy on Accommodation of Utilities within ROW’ that proposes a uniform policy under which
public and private utilities should be accommodated. FHWA policy now indicates that most
technologies relating to alternative energy do meet the definition of a utility. In March 2009, the
FHWA issued new guidance on utilization of interstate system ROW, and recommended that
each state reevaluate its current Utility Accommodation Policy and make modifications or
updates based on renewable energy considerations. FHWA has also adopted Interstate Standards
(USC Title 23 Section 109) that must be adhered to for utility installations in the ROW to
maintain safety. However, these standards do not prescribe details such as setbacks or minimum
parcel sizes for utilities.
CDOT’s most recent UAP was adopted in 2009. However, the definition of ‘utility or utility
facility’ does not specifically describe alternative energy sources such as wind, solar, geothermal

129
or biomass, nor does it provide guidelines or standards for permitting alternative energy in ROW
such as setbacks or other safety buffers. A recommendation of this study is that CDOT revise the
UAP to include design standards for alternative energy within ROW.

130
CHAPTER 14. POTENTIAL ENERGY PARTNERSHIPS
Although CDOT could appropriate its own funds for developing alternative energy resources on
ROW, the availability of federal tax credits through public-private partnerships could help to
minimize CDOT’s capital and operating costs. In such partnerships, the private party (typically a
private utility or bank) can use the current 30 percent federal tax credit and utility incentives
(available from Xcel and several other utilities) to assist in financing projects. As a public
agency, CDOT has no tax liability and cannot take advantage of such credits on its own. The
history of the mandates and incentives for Colorado’s Renewable Energy Standards (RES) that
include the opportunity for utility tax incentives is contained in Appendix A to this report.
Recent federal energy legislation includes the Business Investment Tax Credit, which allows for
a 30 percent tax credit for photovoltaic systems and some other renewable energy including fuel
cells and small wind systems through the year 2016 (USC Title 26, Section 48(a)). Alternatively,
rural electric cooperatives can now issue Clean Renewable Energy Bonds (CREBs) as a
substitute for tax credits (cooperatives are considered public utilities and are not eligible for
renewable energy tax credit incentives). Potentially, CDOT could partner with a rural electric
cooperative that could issue bonds for the project at an attractive interest rate.
In the future, Colorado legislation may also be passed to allow CDOT to develop alternative
energy on property owned or controlled by CDOT. A similar program was established for
Colorado State Parks through House Bill (HB) 10-1349 (June 8, 2010), which created the
Reenergize Colorado program with the goal of generating, or off-setting, all of the division of
parks and outdoor recreation's electrical energy consumption by using renewable energy sources
on land owned, leased, or controlled by the division, by the year 2020. This law raises the cap
on the allowable amount of renewable energy generated onsite (which includes all contiguous
property owned or leased by the customer) from no more than 120 percent of the user’s average
annual electricity consumption at that site. Unless a similar provision is included in any
legislation pertaining to CDOT, an undeveloped site currently consuming no electrical energy
(such as most of CDOT ROW) would not be allowed to produce energy.

131
CHAPTER 15. RIGHT-OF-WAY FINDINGS AND
RECOMMENDATIONS
Although CDOT maintains thousands of acres of ROW throughout the state, virtually none are
currently used for the production of alternative energy. Yet, demand for electricity is rising at a
rate of 2.5 percent per year in Colorado (SWEnergy, 2010), and recent national and state
mandates are calling for increased use of renewable energy sources in the place of
nonrenewables such as coal and natural gas. Findings of this analysis are as follows.
15.1 Findings
Solar – Based on the rates of solar insolation in various areas within Colorado and the existing
ROW acreage in each insolation level, Colorado ROW receives almost 554,700 giga-watt hours
per year (GWh/year. If 100 percent of this energy was converted to electricity it would meet ten
percent of Colorado’s total electricity demand based on year 2007 consumption rates
(SWEnergy, 2010). However, based on an estimated net efficiency rate of ten percent,
approximately 55,500 GWh/year could be produced from CDOT ROW. This energy production
would meet approximately one percent of Colorado’s 2007 electricity demand.
Wind – Although Colorado does have windy areas, relatively little usable CDOT ROW is located
in those locations. Wind energy is still limited by technology, and large turbines require wide
spacing and safety set-backs from the highway for safe and efficient operation. Total potential
wind energy generation is highest in CDOT Region 1, 2 and 4, and all usable ROW would
generate approximately 380 GWh/year statewide. This small amount of energy would meet
approximately 0.0001 percent of Colorado’s total electricity demand based on 2007 consumption
rates.
Biomass – Most of the state is capable of producing some amount of biomass from wood, certain
grasses, landfill methane, manure and crops including corn. One ton of dry biomass can produce
approximately 1 MWh of electricity, and for the entire state an estimated 4,974 tons could be
produced annually on CDOT ROW, generating approximately 5.0 GWh/year. This amount of
energy would meet approximately 0.000001 percent of Colorado’s total electricity demand based
on 2007 consumption rates.
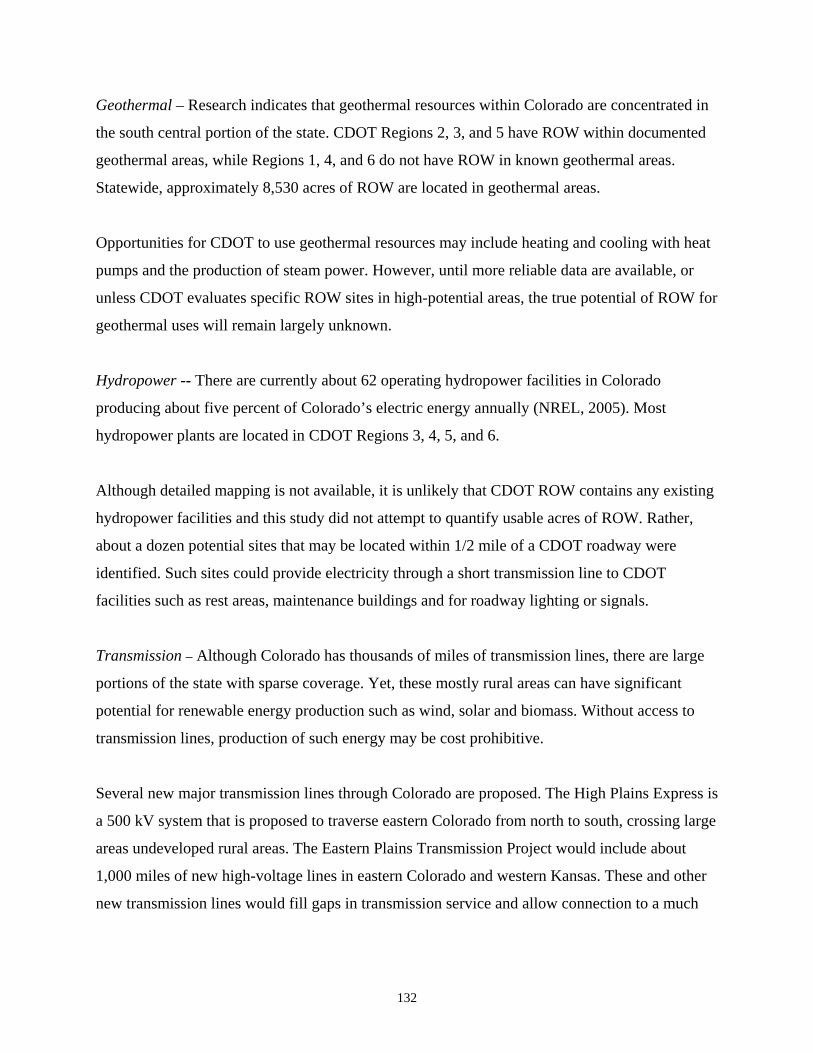
132
Geothermal – Research indicates that geothermal resources within Colorado are concentrated in
the south central portion of the state. CDOT Regions 2, 3, and 5 have ROW within documented
geothermal areas, while Regions 1, 4, and 6 do not have ROW in known geothermal areas.
Statewide, approximately 8,530 acres of ROW are located in geothermal areas.
Opportunities for CDOT to use geothermal resources may include heating and cooling with heat
pumps and the production of steam power. However, until more reliable data are available, or
unless CDOT evaluates specific ROW sites in high-potential areas, the true potential of ROW for
geothermal uses will remain largely unknown.
Hydropower -- There are currently about 62 operating hydropower facilities in Colorado
producing about five percent of Colorado’s electric energy annually (NREL, 2005). Most
hydropower plants are located in CDOT Regions 3, 4, 5, and 6.
Although detailed mapping is not available, it is unlikely that CDOT ROW contains any existing
hydropower facilities and this study did not attempt to quantify usable acres of ROW. Rather,
about a dozen potential sites that may be located within 1/2 mile of a CDOT roadway were
identified. Such sites could provide electricity through a short transmission line to CDOT
facilities such as rest areas, maintenance buildings and for roadway lighting or signals.
Transmission – Although Colorado has thousands of miles of transmission lines, there are large
portions of the state with sparse coverage. Yet, these mostly rural areas can have significant
potential for renewable energy production such as wind, solar and biomass. Without access to
transmission lines, production of such energy may be cost prohibitive.
Several new major transmission lines through Colorado are proposed. The High Plains Express is
a 500 kV system that is proposed to traverse eastern Colorado from north to south, crossing large
areas undeveloped rural areas. The Eastern Plains Transmission Project would include about
1,000 miles of new high-voltage lines in eastern Colorado and western Kansas. These and other
new transmission lines would fill gaps in transmission service and allow connection to a much
133
larger grid from new alternative energy projects on CDOT ROW in rural eastern and central
locations.
15.2 Recommendations
CDOT currently has some authority to produce alternative energy within ROW, but it is limited
by state policy that does not recognize alternative energy sources as ‘utilities’ and does not set
guidelines for managing energy production in ROW areas. And, as a not-for-profit agency,
CDOT may not be able to sell surplus energy to a private market. While this study does estimate
and quantify potential energy production, more detailed data would be needed to assist with
decisions on changing CDOT policies. Recommendations include:
Review other states’ policies with regard to alternative energy development, such as
Oregon, Minnesota, Texas and California, to glean information on design standards,
innovative partnerships, and funding mechanisms.
Using the statewide and regional maps, CDOT Regions should develop their own maps
and checklists to confirm the best sites based on additional criteria such as slope, aspect,
tree coverage, vegetation types, etc.
Revise the CDOT Utility Accommodation Policy to recognize alternative energy
production as a form of ‘utility’ and to include design requirements such as set-backs,
minimum site densities, height limits, etc. for alternative energy production. Also, revisit
the prohibition on the use of medians for longitudinal utilities, particularly on wide
medians in rural areas.
Continue to build partnerships with private entities such as private utilities, banks and
private energy developers to act as future partners for claiming state or federal tax credits,
thereby reducing net costs to CDOT.
Work with the Colorado Public Utility Commission (PUC) and other state agencies to
promote best practices and standards for transmission line siting and interconnections to
existing lines adjacent to CDOT ROW.
Consider one or more ‘pilot programs’ to situate alternative energy on CDOT buildings
or sites such as rest areas and monitor the produced energy and net reduction in carbon

134
footprint. Involve the public by encouraging public viewing of the pilot program sites and
include live monitoring data on the CDOT website.

135
REFERENCES
References for rest areas AllBusiness, 2010. Allbusiness.com. “Transportation chief unveils plan to close 44 Minnesota rest Areas”. <http://www.allbusiness.com/transportation/road-transportation-trucking-trucking/11432660-1.html> (Sep. 2010). AmeriGas Propane, Inc. Propane Consumption Data. (Bayfield, Colorado), Oct. 2010. Beck, 2004. Beck, Malcolm. “The Many Benefits of Mulching.” Home Page of Malcolm Beck. 6 Mar. 2004. < http://www.malcolmbeck.com/books/gv_method/TheManyBenefitsofMulching.html> (11 Nov. 2010). Boak, 2010. “Public Art, El Moro Rest Area”, 2008. <www.boakart.com/PublicArt2.html> (7 Nov. 2010). CDOT, 2005. “Colorado Department of Transportation. Environmental Stewardship Guide”. May 2005. CDOT, 1999. “Colorado Department of Transportation Integrated Noxious Weed Management Plan”. 1999. City of Fort Collins, 2010. Electrical Consumption Data. Customer: CDOT; Meter 35383. Obtained from call to company by Kimberly Schott (Oct. 2010). CSU, 2010. Colorado State University Extension. “Evaporation rate of Cool-Season Turfgrass in the Grand Valley, Mesa County, Colorado”. <http://www.coopext.colostate.edu/TRA/PLANTS/Historical_ETo_Mesa.pdf> (Nov. 2010). CSU, 2010b. Walskhom R. and Neibauer, M. Colorado State University Extension. “Water Conservation In and Around the Home”, No. 9.052, <http://www.ext.colostate.edu/pubs/consumer/099952.html> (June 2010). Empire Electric, 2010. Electrical Consumption Data. Meter 19233 (Oct. 2010). EPA, 2005. United States Environmental Protection Agency. “Emission Facts; Average Carbon Dioxide Emissions Resulting from Gasoline and Diesel Fuel”. Office of Transportation and Air Quality. EPA420-F-05-001. Feb. 2005. FDOT, 2010. Personal conversation with Dean Perkins, Rest Area Coordinator, Florida Department of Transportation. Sep. 2010.

136
FHU, 2007. Felsburg, Holt & Ullevig, “Truck Parking Issues at State Facilities in Colorado, Prepared for the Colorado Department of Transportation”. Division of Transportation Development, Dec. 2007 FHWA, 2010. “Dwight D. Eisenhower National System of Interstate and Defense Highways”. <http://www.fhwa.dot.gov/programadmin/interstate.cfm> (Nov. 2010). IPCC, 2007. Forster, P., V. Ramaswamy, P. Artaxo, T. Berntsen, R. Betts, D.W. Fahey, J. Haywood, J. Lean, D.C. Lowe, G. Myhre, J. Nganga, R. Prinn, G. Raga, M. Schulz and R. Van Dorland, 2007: “Changes in Atmospheric Constituents and in Radiative Forcing. In: Climate Change 2007: The Physical Science Basis. Contribution of Working Group I to the Fourth Assessment Report of the Intergovernmental Panel on Climate Change”. Cambridge University Press, Cambridge, United Kingdom and New York, NY, USA. <http://www.ipcc.ch/pdf/assessment-report/ar4/wg1/ar4-wg1-chapter2.pdf> (Aug. 2010). Jakubski, 2008. Jakubski, Paul. “Calculating and Reducing Your Carbon Footprint.” GATF World 20.3(2008):40-43. <http://www.pneac.org/publicationoftheyear/Calculating-and-Reducing-Your-Carbon-Footprint.pdf> (Aug. 2010). Lockhart, 2004. Lockhart Ellefson, Connie and David Winger. “Xeriscape Colorado”. Englewood: Westcliffe Publishers Inc. 2004. Organization Road Development, 2010. “Rest Area History- Road Development and Rest Area History Timeline”; <http://www.restareahistory.org/History.html> (Aug. 2010). NACS, 2010. National Association of Convenience Stores,. “Arizona Pushes for Rest Area Reform, The push for rest area commercialization reform continues, with Arizona officials leading the way”. <http://www.nacsonline.com/NACS/News/Daily/Pages/ND0603103.aspx> (Sep. 2010). Pederson, 2009. Pedersen, Brian. “13 of 18 State-Run Rest Stops to be Shut”. The Arizona Daily Star, Tucson Publication: The Arizona Daily Star (Tucson). 9 Oct. 2009. Pesman, 1967. Pesman, M. Walter. “Meet the Natives; An Easy Way to Recognize Rocky Mountain Wildflowers, Trees and Shrubs”. Seventh Edition, 1967. Preston, 2004. Preston, Sullivan. “Field Bindweed Control Alternatives.” ATTRA - National Sustainable Agriculture Information Service. National Center for Appropriate Technology. August. 2004. <http://attra.ncat.org/attra-pub/bindweed.html> (Nov. 2010). Rest Area History, 2010. “Rest Area History”. < http://www.restareahistory.org/History.html> (Sep. 2010). Ritter, 2007. Ritter, Bill. “Greening Government; Goals and Objectives”. Executive Order D0011 07. 16 Apr. 2007.

137
Ritter, 2007b. Governor Bill Ritter. “Colorado Climate Action Plan; A Strategy to Address Global Warming”. Nov. 2007. Ritter, 2010. Ritter, Bill. “Greening of State Government; Earth Day 2010”. Executive Order D2010-006. 22 Apr. 2010 State of Colorado, 2010. Department of Personnel and Administration-State Purchasing Office. “State of Colorado Environmentally Preferable Purchasing Policy-State of Colorado”. 2010. Thomas, 2010. Thomas, April, McOllough, Susan. “CDOT-Sustainability Report for Vail Rest Area 2010”. July 1, 2009-June 30, 2010. Times Herald Record, 2010. “Many Drivers Rue Rest Area Closures”. Times Herald-Record. Middletown, NY. < http://www.recordonline.com/apps/pbcs.dll/article?AID=/20100830/NEWS/8300316> (Sep. 2010). UDOT, 2010.Personal conversation with Rich Clarke, Maintenance Engineer. Utah Department of Transportation. Sep. 2010. USDA, 2010. United States Department of Agriculture. “Memorandum of Understanding Between Bureau of Land Management, Colorado Department of Transportation, and the Federal Highway Administration and the USDA, Forest Service Rocky Mountain Region”. 1 July 2010. USGBC, 2007. United States Green Building Council. “Leadership in Energy and Environmental Design- New Construction”. 2007. WRI, 2004. World Resource Institute; Bhata, Pankaj; Janet Ranganathan. “The Greenhouse Gas Protocol: A Corporate Accounting and Reporting Standard”. March 2004. Xcel Energy, 2010. Excel Energy. Electrical Consumption Data 9/6/2007-8/30/2010. Customer: HAA CDOT E101; Meter 000044949121. Obtained from April Thomas (CDOT) (Oct. 2010). References for right-of-way Aeolos Wind Turbines. “Wind Turbine Efficiencies”, undated. <www.windturbinestar.com/wind-turbine-efficiency.html> (12 Dec. 2010). American Association of State Highway and Transportation Officials (AASHTO). “A Guide for Accommodating Utilities within Highway Right-of-Way.” Oct. 2005. Aucott, Gary. “State Highway Geometrics Linear Geodatabase for ROW”. Colorado Department of Transportation, Aug. 2010.

138
Colorado Department of Transportation. “Rules and Regulations of the Colorado Department of Transportation Pertaining to Accommodating Utilities in the State Highway Rights of Way.” 2 C.C.R. 601-18, 30 Oct. 2009. Colorado Governor’s Energy Office. “Connecting Colorado’s Renewable Resources to the Markets”. Apr. 2009. GeoPowering the West Colorado State Working Group. “Colorado Geothermal Development Strategic Plan.”. 2007. Colorado Governor’s Energy Office.”2010 Colorado Utilities Report”. Aug. 2010. Federal Highway Administration Realty-HEP. “Guidance on Utilization of Highway Right-of-Way; Longitudinal Accommodation of Utilities in the Interstate System Right-of-Way”, undated. <www.fhwa.dot.gov/realestate/guiutil_a.html> (13 Dec. 2010). Federal Highway Administration (FHWA). “Utility Relocation and Accommodation on Federal-Aid Highway Projects Chapter 2: Utility Accommodation”. Jan. 2003. <www.fhwa.dot.gov/realestate/guidutil_a.htm> (9 Sep. 2010). Minnesota Department of Commerce. “Establishment of General Permit Standards for the Siting of Wind Generation Projects less than 25 Megawatts”. Sep. 2007. National Renewable Energy Laboratory. “An Analysis of the Technical and Economic Potential for Mid-Scale Distributed Wind”. NREL/SR-500-44280, Dec. 2008. National Renewable Energy Laboratory. “Land-Use Requirements of Modern Wind Power Plants in the United States”. Aug. 2009. National Renewable Energy Laboratory. “Solar Research”, undated. <www.nrel.gov/solar/> (13 June 2010). National Renewable Energy Laboratory. “Wind Research”, undated. <www.nrel.gov/wind/> (23 June 2010). National Renewable Energy Laboratory. “Geothermal Technologies”, undated. <www.nrel.gov/geothermal/> (15 Aug. 2010). National Renewable Energy Laboratory. “Biomass Research”, undated. <www.nrel.gov/biomass/> (12 Sept. 2010). National Renewable Energy Laboratory. “Wind Farm Area Calculator”. <nrel.gov.analysis/power_databook/calc_wind.php> (15 Nov. 2010). Oregon Department of Transportation. “Oregon Solar Highway” undated. <http://www.oregonsolarhighway.com> (15 Aug. 2010).

139
Right-of-Way Magazine. “Fulfilling the Vision: The Nation’s First Solar Highway”. May/June, 2010. Snyder, O.P. ”Calibrating Thermometers in Boiling Water”. Hospitality Institute of Technology and Management, St. Paul, Minnesota. <http://www.hi-tm.com/Documents/Calib-boil.html> (15 Nov. 2010). Southwest Energy Efficiency Project. “Colorado Fact Sheet: Energy Efficiency and Energy Consumption”. Updated July 2009. <http://www.swenergy.org> (15 Nov. 2010). U.S. Department of Agriculture. “Effects of Increased Biofuels on the U.S. Economy in 2022”. Oct. 2010.
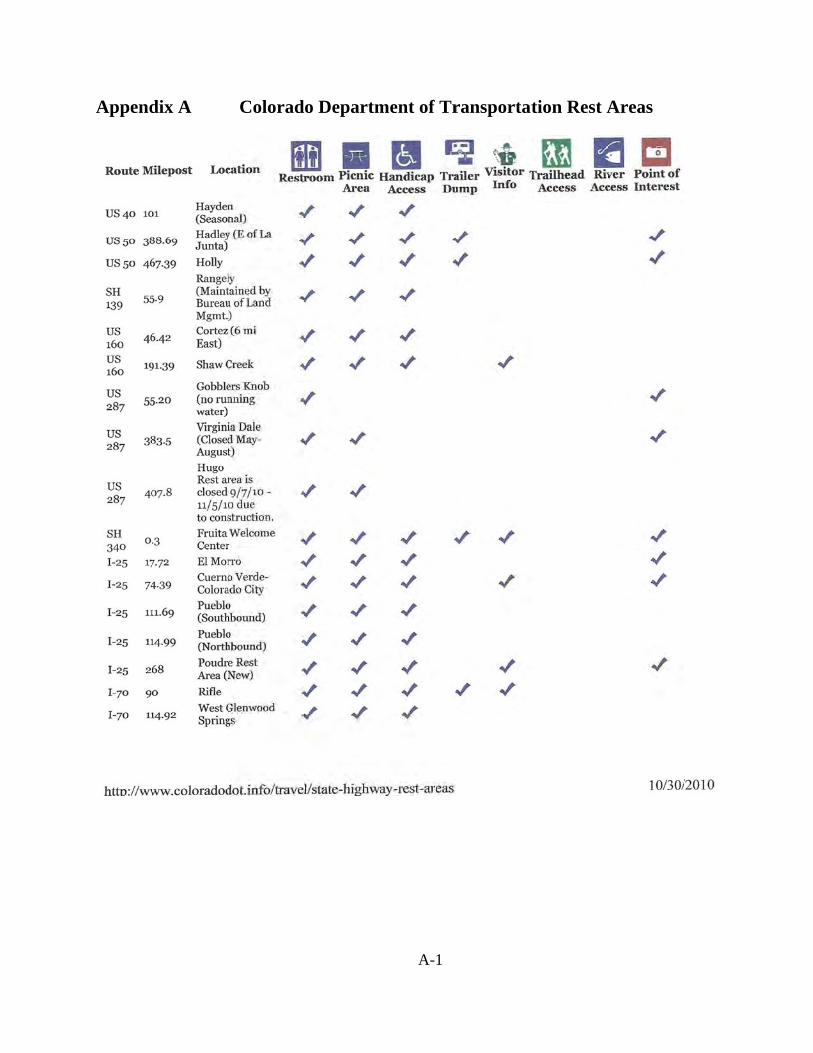
Append
dix A Colorado Departm
A-1
ment of Trransportattion Rest AAreas

Route Mil
Colorado http://ww
lepost Locatio
Rest Areas &ww.coloradod
on Restroom
& Welcome Cdot.info/trave
Append
Picnic Area
HanAc
Centers. Stateel/state-highw
A-2
ix A conti
ndicap ccess
TraiDum
e Highway Reway-rest-are
inued
iler mp
Visitor Info
est Areas. eas
Trailhead
Access River Access
PIPoint of Interest
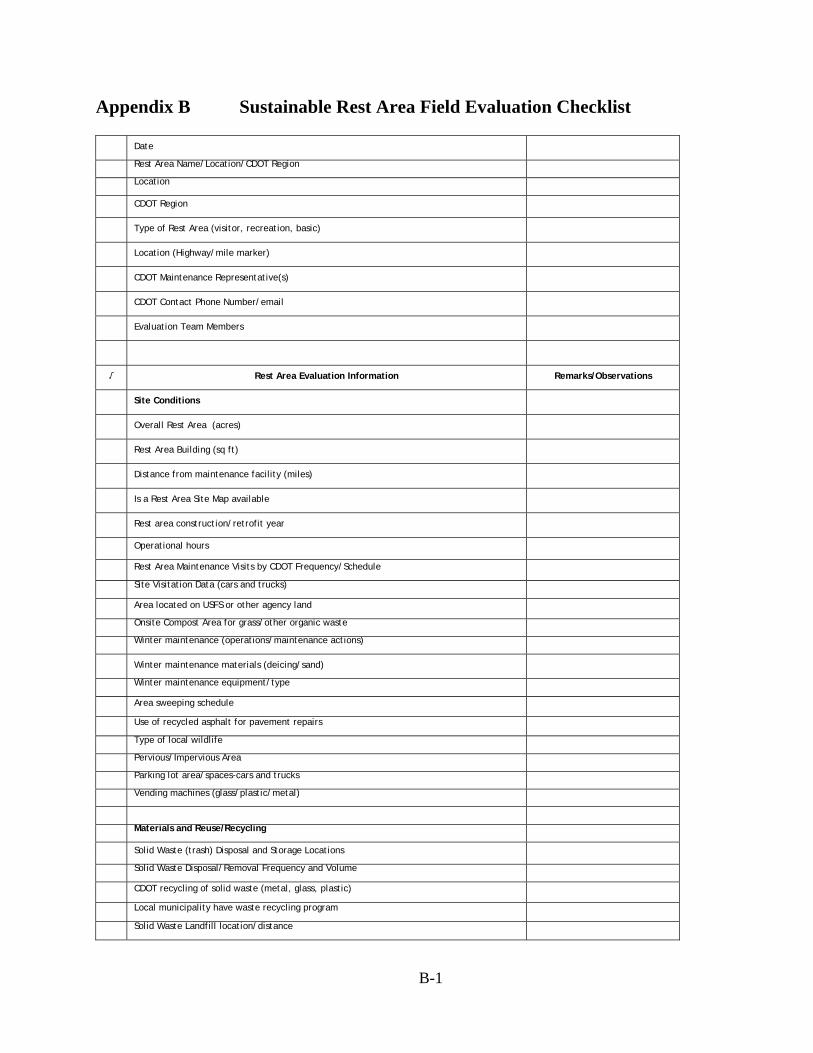
B-1
Appendix B Sustainable Rest Area Field Evaluation Checklist
Date
Rest Area Name/Location/CDOT Region
Location
CDOT Region
Type of Rest Area (visitor, recreation, basic)
Location (Highway/mile marker)
CDOT Maintenance Representative(s)
CDOT Contact Phone Number/email
Evaluation Team Members
√ Rest Area Evaluation Information Remarks/Observations
Site Conditions
Overall Rest Area (acres)
Rest Area Building (sq ft)
Distance from maintenance facility (miles)
Is a Rest Area Site Map available
Rest area construction/retrofit year
Operational hours
Rest Area Maintenance Visits by CDOT Frequency/Schedule
Site Visitation Data (cars and trucks)
Area located on USFS or other agency land
Onsite Compost Area for grass/other organic waste
Winter maintenance (operations/maintenance actions)
Winter maintenance materials (deicing/sand)
Winter maintenance equipment/type
Area sweeping schedule
Use of recycled asphalt for pavement repairs
Type of local wildlife
Pervious/Impervious Area
Parking lot area/spaces-cars and trucks
Vending machines (glass/plastic/metal)
Materials and Reuse/Recycling
Solid Waste (trash) Disposal and Storage Locations
Solid Waste Disposal/Removal Frequency and Volume
CDOT recycling of solid waste (metal, glass, plastic)
Local municipality have waste recycling program
Solid Waste Landfill location/distance

B-2
Recycled or reused materials used at rest area
Restroom cleaning frequency
Onsite waste separation recycling for motorists/truckers (metal, glass, plastic)
Roofing material (metal, shingle)
Hand paper towels or hot air blower
Environment
Mowing procedures (special mowing height, locations)
Mowing Area and Frequency
Noxious Weed Management
Fertilizer Applications
Depth to groundwater
Wildlife Structures or habitat improvements (bird houses, etc.)
Natural grass/vegetation and area
Bluegrass (non-natural) vegetation and area
Disturbed areas without vegetation
Proximity to sensitive areas (surface water/wetlands)
Biome type (montane, grassland, desert, etc.)
Open area for potential tree planting
Open area for solar potential
Estimated Percent vegetative cover
Number of trees at rest area
Open area for potential wind system
Air Quality
Low VOC and biodegradable-green chemicals used onsite
Low VOC paints used at rest area
Number/average of idling trucks at night
Chemicals used onsite; see MSDS sheets
Charcoal grills
Smoking not allowed in rest area
Cigarette butt disposal in rest area
Water Quality/Usage
Water Source (onsite or offsite)
If off site source is water treated
Well water tested for drinking? When?
Location and depth of well (if present)
Water used for irrigation (gallons)
Irrigation type (drip/spray)
Irrigation frequency
Gallons per flush settings
Water-saving faucets/toilets
Gallons per urinal flush
Waste treatment system type (lagoon/septic field/septic tanks)
Energy for waste treatment system (gravity/electrical pumps)

B-3
Motorist waste disposal system (RVs)
Motorist Waste Disposal maintenance frequency (solids pump out)
Bio-solids disposal frequency, location and distance
# water spigots for motorists use
# drinking fountains
# urinals/toilets/sinks-men
# toilets/sinks-women
Landscaping type (xeriscape, lawn, natural)
Stormwater best management practices
Water harvesting potential
Energy
Lighting system in parking lot (LED/sodium vapor)
Natural lighting/skylights in restroom structure
Natural gas/propane usage and cost
Electrical usage and cost
Heating system type (gas/electric/propane)
Gasoline consumption mowing (gallons per month)
Gasoline consumption for maintenance transportation to site for maintenance activities
Heat pump (groundwater) used for heating/cooling
Window type(s)-single or double pane
Total energy usage information obtained
Lighting system in restroom and building area (compact fluorescent, fluorescent, other)
Motion detectors in restrooms for lighting
Number of light poles
Air conditioning in restroom area
Passive or direct solar panels (electrical, hot water)
Natural ventilation and fans
Public/Motorist/Trucking
Local community involvement
Overall appearance of rest area
Pet waste management
Security Cameras
Dog run area and waste management signage/bags
No solid waste dumping signs
Colorado Promotional/Informational signage
Site Aesthetics to local context
Local community information
Emergency phone
Computer-kiosk Information to traveling public
General Notes

Appenndix C
Sustainable RRest Area Daatabase Spre
C-1
adsheet

C-2

C-3
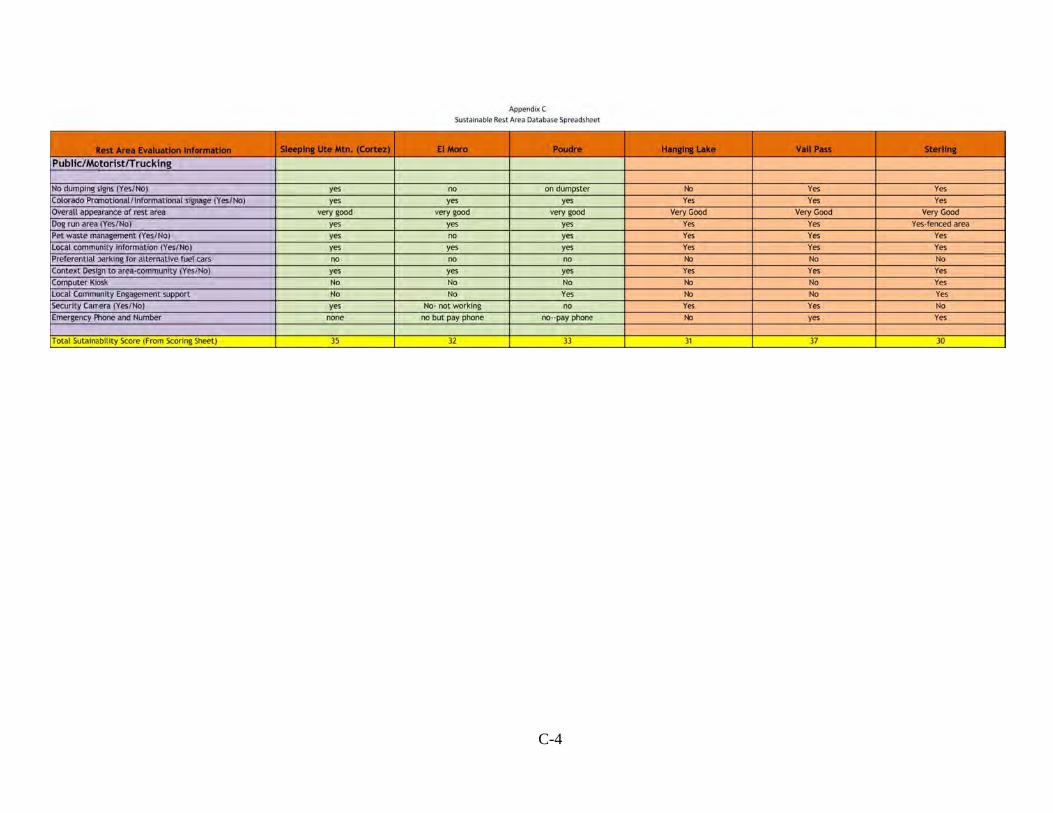
C-4
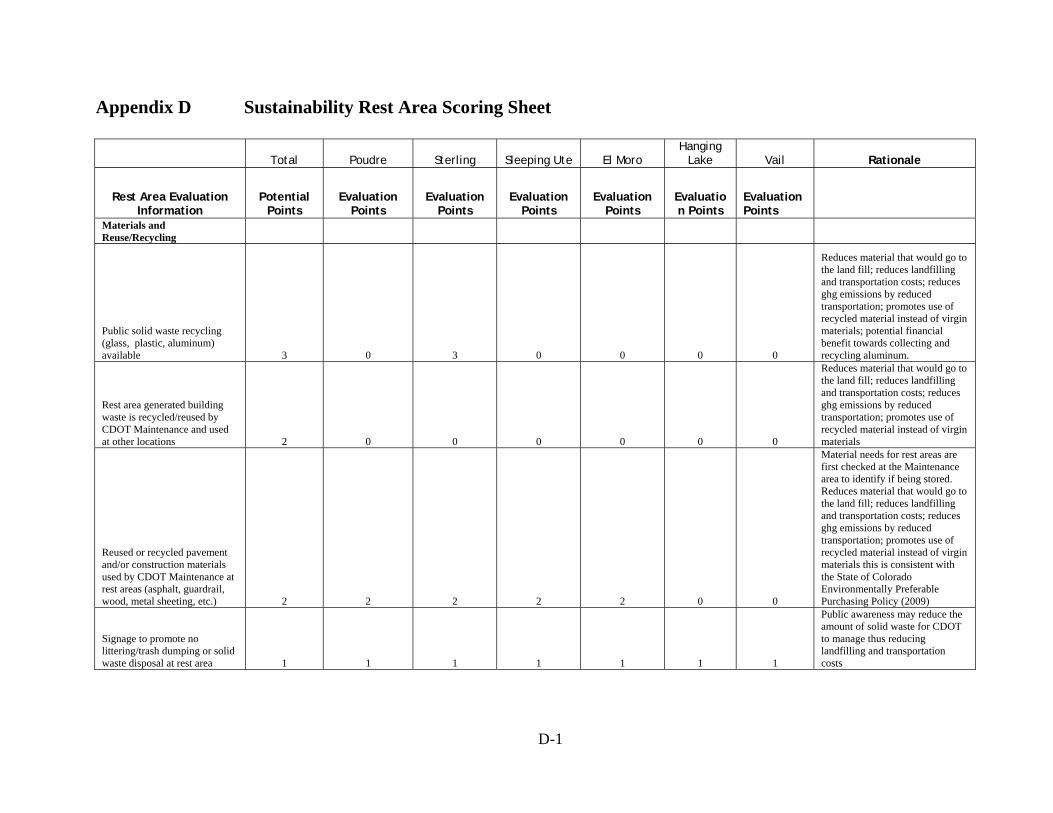
D-1
Appendix D Sustainability Rest Area Scoring Sheet
Total Poudre Sterling Sleeping Ute El Moro Hanging
Lake Vail Rationale
Rest Area Evaluation Information
Potential Points
Evaluation Points
Evaluation Points
Evaluation Points
Evaluation Points
Evaluation Points
Evaluation Points
Materials and Reuse/Recycling
Public solid waste recycling (glass, plastic, aluminum) available 3 0 3 0 0 0 0
Reduces material that would go to the land fill; reduces landfilling and transportation costs; reduces ghg emissions by reduced transportation; promotes use of recycled material instead of virgin materials; potential financial benefit towards collecting and recycling aluminum.
Rest area generated building waste is recycled/reused by CDOT Maintenance and used at other locations 2 0 0 0 0 0 0
Reduces material that would go to the land fill; reduces landfilling and transportation costs; reduces ghg emissions by reduced transportation; promotes use of recycled material instead of virgin materials
Reused or recycled pavement and/or construction materials used by CDOT Maintenance at rest areas (asphalt, guardrail, wood, metal sheeting, etc.) 2 2 2 2 2 0 0
Material needs for rest areas are first checked at the Maintenance area to identify if being stored. Reduces material that would go to the land fill; reduces landfilling and transportation costs; reduces ghg emissions by reduced transportation; promotes use of recycled material instead of virgin materials this is consistent with the State of Colorado Environmentally Preferable Purchasing Policy (2009)
Signage to promote no littering/trash dumping or solid waste disposal at rest area 1 1 1 1 1 1 1
Public awareness may reduce the amount of solid waste for CDOT to manage thus reducing landfilling and transportation costs
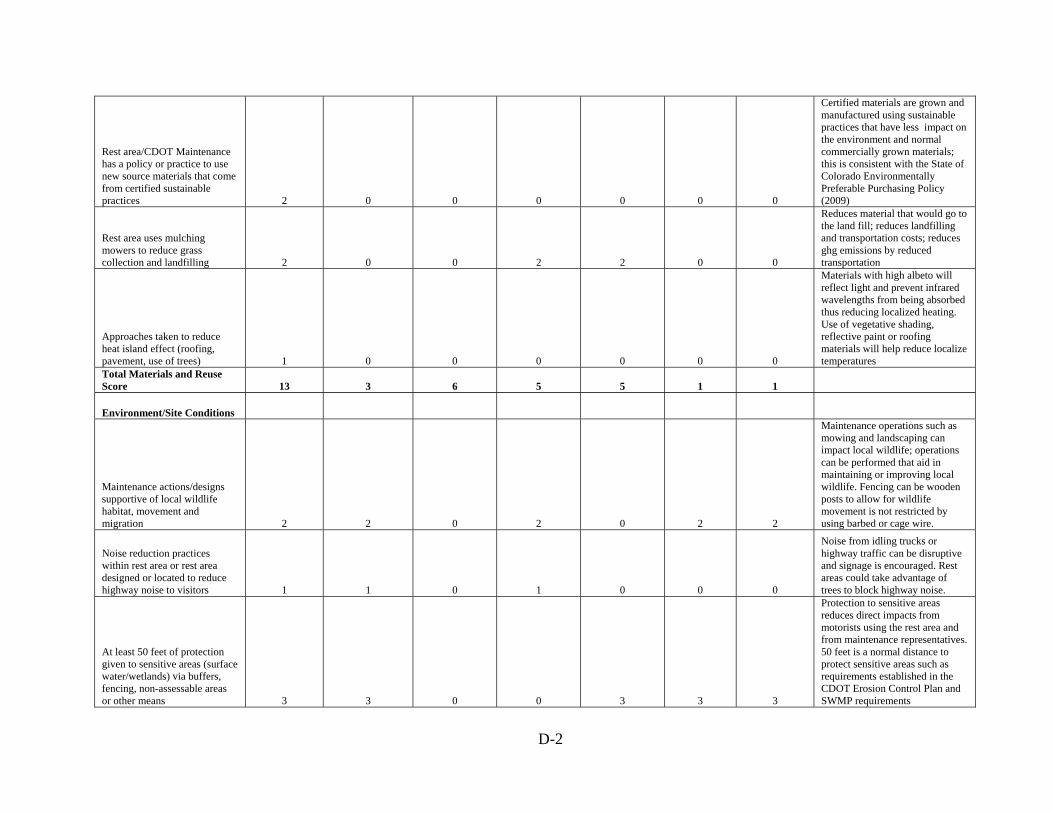
D-2
Rest area/CDOT Maintenance has a policy or practice to use new source materials that come from certified sustainable practices 2 0 0 0 0 0 0
Certified materials are grown and manufactured using sustainable practices that have less impact on the environment and normal commercially grown materials; this is consistent with the State of Colorado Environmentally Preferable Purchasing Policy (2009)
Rest area uses mulching mowers to reduce grass collection and landfilling 2 0 0 2 2 0 0
Reduces material that would go to the land fill; reduces landfilling and transportation costs; reduces ghg emissions by reduced transportation
Approaches taken to reduce heat island effect (roofing, pavement, use of trees) 1 0 0 0 0 0 0
Materials with high albeto will reflect light and prevent infrared wavelengths from being absorbed thus reducing localized heating. Use of vegetative shading, reflective paint or roofing materials will help reduce localize temperatures
Total Materials and Reuse Score 13 3 6 5 5 1 1
Environment/Site Conditions
Maintenance actions/designs supportive of local wildlife habitat, movement and migration 2 2 0 2 0 2 2
Maintenance operations such as mowing and landscaping can impact local wildlife; operations can be performed that aid in maintaining or improving local wildlife. Fencing can be wooden posts to allow for wildlife movement is not restricted by using barbed or cage wire.
Noise reduction practices within rest area or rest area designed or located to reduce highway noise to visitors 1 1 0 1 0 0 0
Noise from idling trucks or highway traffic can be disruptive and signage is encouraged. Rest areas could take advantage of trees to block highway noise.
At least 50 feet of protection given to sensitive areas (surface water/wetlands) via buffers, fencing, non-assessable areas or other means 3 3 0 0 3 3 3
Protection to sensitive areas reduces direct impacts from motorists using the rest area and from maintenance representatives. 50 feet is a normal distance to protect sensitive areas such as requirements established in the CDOT Erosion Control Plan and SWMP requirements
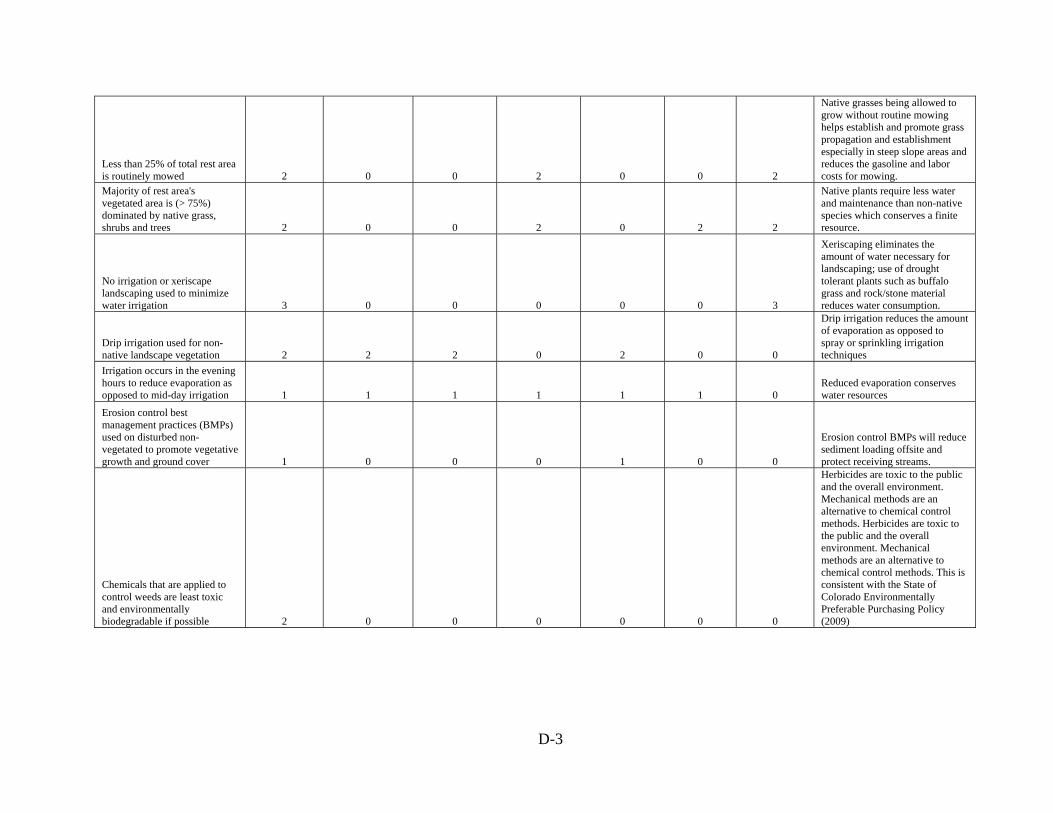
D-3
Less than 25% of total rest area is routinely mowed 2 0 0 2 0 0 2
Native grasses being allowed to grow without routine mowing helps establish and promote grass propagation and establishment especially in steep slope areas and reduces the gasoline and labor costs for mowing.
Majority of rest area's vegetated area is (> 75%) dominated by native grass, shrubs and trees 2 0 0 2 0 2 2
Native plants require less water and maintenance than non-native species which conserves a finite resource.
No irrigation or xeriscape landscaping used to minimize water irrigation 3 0 0 0 0 0 3
Xeriscaping eliminates the amount of water necessary for landscaping; use of drought tolerant plants such as buffalo grass and rock/stone material reduces water consumption.
Drip irrigation used for non-native landscape vegetation 2 2 2 0 2 0 0
Drip irrigation reduces the amount of evaporation as opposed to spray or sprinkling irrigation techniques
Irrigation occurs in the evening hours to reduce evaporation as opposed to mid-day irrigation 1 1 1 1 1 1 0
Reduced evaporation conserves water resources
Erosion control best management practices (BMPs) used on disturbed non-vegetated to promote vegetative growth and ground cover 1 0 0 0 1 0 0
Erosion control BMPs will reduce sediment loading offsite and protect receiving streams.
Chemicals that are applied to control weeds are least toxic and environmentally biodegradable if possible 2 0 0 0 0 0 0
Herbicides are toxic to the public and the overall environment. Mechanical methods are an alternative to chemical control methods. Herbicides are toxic to the public and the overall environment. Mechanical methods are an alternative to chemical control methods. This is consistent with the State of Colorado Environmentally Preferable Purchasing Policy (2009)

D-4
Noxious weeds are controlled through prevention and physical, mechanical and biological controls; if chemicals are used they applied by using spot spraying 2 0 2 2 0 0 0
Herbicides are toxic to the public and the overall environment. Mechanical methods are an alternative to chemical control methods; this is consistent with the State of Colorado Environmentally Preferable Purchasing Policy (2009)
No fertilizer applications to promote grass growth 2 0 0 0 0 0 2
Fertilizers promote vegetation growth that requires additional mowing and water usage. Fertilizers are manufactured from fossil fuels that contribute to greenhouse gas emissions. Fertilizers should only be used on areas trying to establish vegetation and not to make the lawn green.
All surfactants or detergents do not contain phosphates or other agents known to result in water quality degradation 2 0 0 0 0 2 0
Nutrients such as phosphates is a major pollutant that affects water quality nationwide. Phosphates can cause acceleration of algae growth and result in oxygen depletion in streams and lakes/reservoirs; this is consistent with the State of Colorado Environmentally Preferable Purchasing Policy (2009)
Total Environment/Site Conditions 25 9 5 10 7 10 14
Air Quality
Low Volatile Organic Carbon (VOC) materials are used for paints, adhesives and other chemicals used onsite 3 0 0 0 0 0 0
Green products should be used for cleaning and painting activities that do not release toxic chemicals into the air.; this is consistent with the State of Colorado Environmentally Preferable Purchasing Policy (2009)

D-5
Idling Restriction Signage at rest areas for trucks 2 0 0 0 0 0 0
Idling trucks emit unnecessary greenhouse gases into the atmosphere for long periods of time by trucking professionals. Idling trucks can discharge particulates in the air and can be noisy to the motoring public. Diesel engines must idle down after being worked at highway speeds.
No charcoal grills at rest area and/or alternatives to charcoals grills provided to public 1 1 1 1 1 1 1
Charcoal grills contribute to greenhouse gas emissions using charcoal and lighting fluids
Electrification provided for trucks 3 0 0 0 0 0 0
Electrification for trucks eliminate long idling times and reduce greenhouse gas emissions and noise
Smoking prohibited in restroom area with signage 1 1 1 1 1 1 1
Secondhand smoke is a health and odor problem that can be eliminate by signage and butt disposal
CDOT Maintenance plan or written operating procedures identifies rest area practices to minimize fuel consumption 3 0 0 0 0 0 0
Fuel conservation reduces the amount of greenhouse gas emissions by CDOT vehicles used to maintain rest area. Standard operating procedures or written guidance provides employees a basis for to develop and/or adhere to a fuel conservation plan. This approach is consistent with Governor Ritter's Executive Order to reduce fuel consumption by 20%.
Total Air Quality 13 2 2 2 2 2 2
Water Quality/Usage
Potable water from onsite well or surface water 1 0 0 0 0 1 1
Reduces electrical costs for pumping on distances and is cheaper to obtain for onsite use
Stormwater BMPs being implemented and maintained at rest area 2 2 2 0 2 0 0
Rest areas contain impervious surface that can transport trash and sediment to receiving streams. Sediment loading into surface water is the number one water pollution problem in Colorado and the US
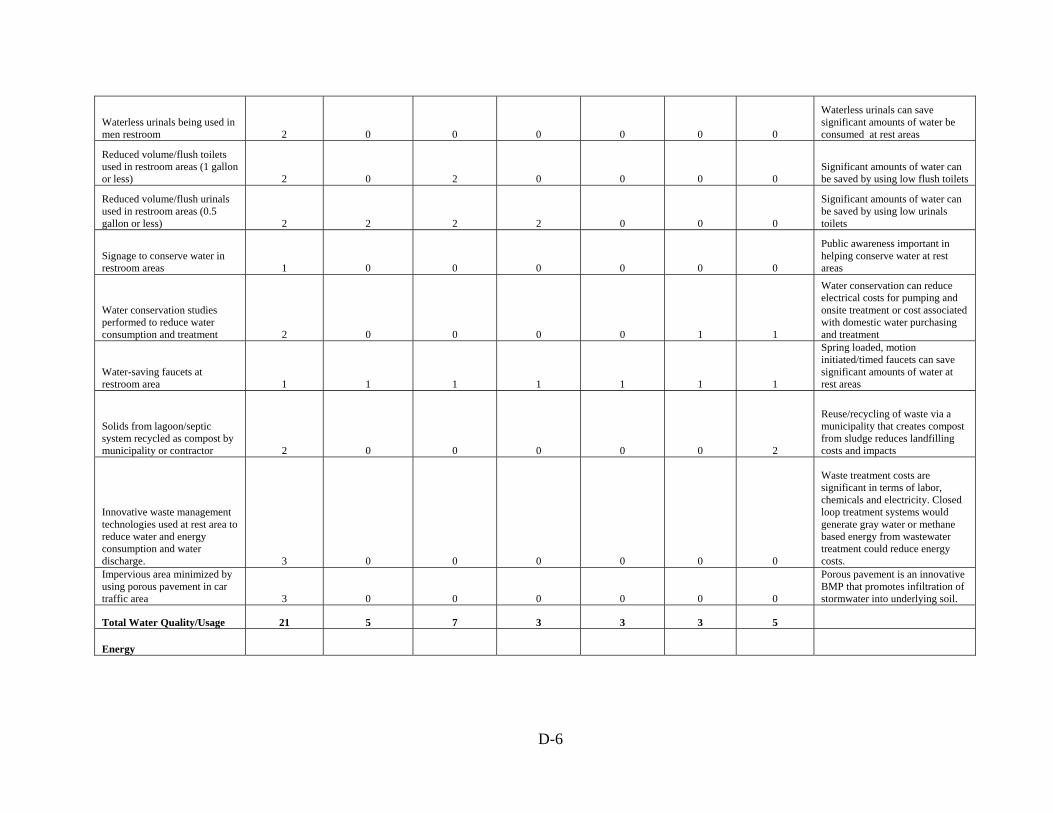
D-6
Waterless urinals being used in men restroom 2 0 0 0 0 0 0
Waterless urinals can save significant amounts of water be consumed at rest areas
Reduced volume/flush toilets used in restroom areas (1 gallon or less) 2 0 2 0 0 0 0
Significant amounts of water can be saved by using low flush toilets
Reduced volume/flush urinals used in restroom areas (0.5 gallon or less) 2 2 2 2 0 0 0
Significant amounts of water can be saved by using low urinals toilets
Signage to conserve water in restroom areas 1 0 0 0 0 0 0
Public awareness important in helping conserve water at rest areas
Water conservation studies performed to reduce water consumption and treatment 2 0 0 0 0 1 1
Water conservation can reduce electrical costs for pumping and onsite treatment or cost associated with domestic water purchasing and treatment
Water-saving faucets at restroom area 1 1 1 1 1 1 1
Spring loaded, motion initiated/timed faucets can save significant amounts of water at rest areas
Solids from lagoon/septic system recycled as compost by municipality or contractor 2 0 0 0 0 0 2
Reuse/recycling of waste via a municipality that creates compost from sludge reduces landfilling costs and impacts
Innovative waste management technologies used at rest area to reduce water and energy consumption and water discharge. 3 0 0 0 0 0 0
Waste treatment costs are significant in terms of labor, chemicals and electricity. Closed loop treatment systems would generate gray water or methane based energy from wastewater treatment could reduce energy costs.
Impervious area minimized by using porous pavement in car traffic area 3 0 0 0 0 0 0
Porous pavement is an innovative BMP that promotes infiltration of stormwater into underlying soil.
Total Water Quality/Usage 21 5 7 3 3 3 5
Energy
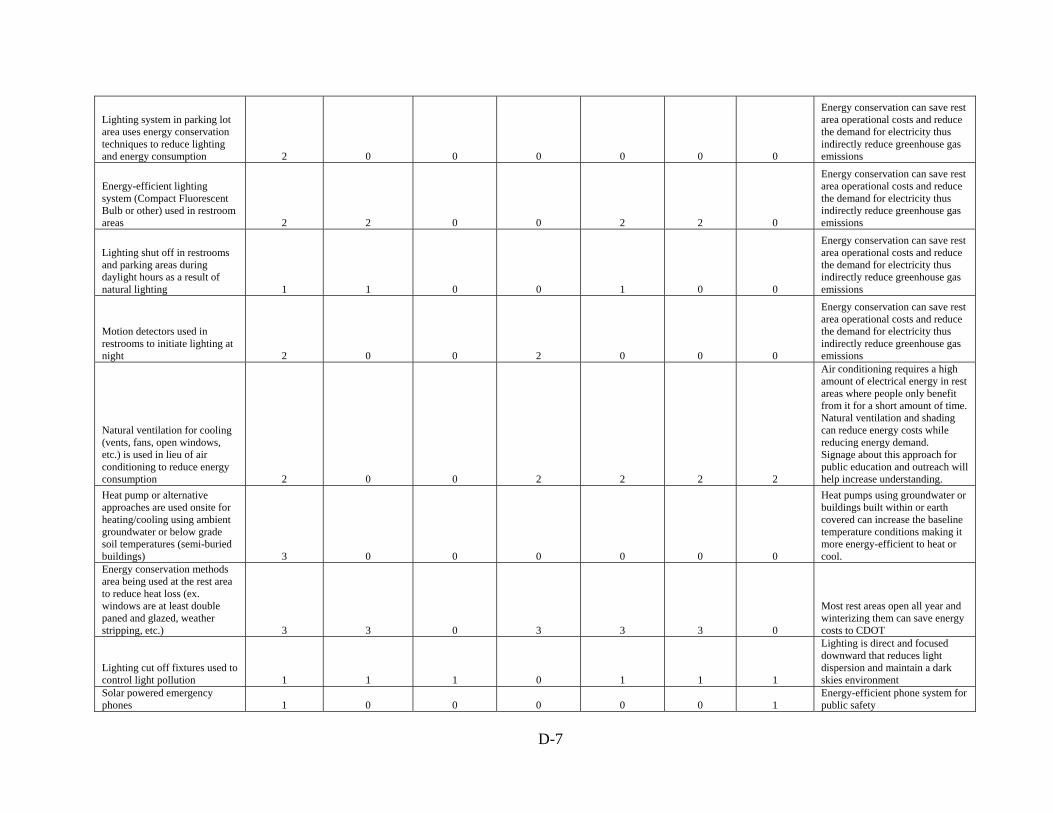
D-7
Lighting system in parking lot area uses energy conservation techniques to reduce lighting and energy consumption 2 0 0 0 0 0 0
Energy conservation can save rest area operational costs and reduce the demand for electricity thus indirectly reduce greenhouse gas emissions
Energy-efficient lighting system (Compact Fluorescent Bulb or other) used in restroom areas 2 2 0 0 2 2 0
Energy conservation can save rest area operational costs and reduce the demand for electricity thus indirectly reduce greenhouse gas emissions
Lighting shut off in restrooms and parking areas during daylight hours as a result of natural lighting 1 1 0 0 1 0 0
Energy conservation can save rest area operational costs and reduce the demand for electricity thus indirectly reduce greenhouse gas emissions
Motion detectors used in restrooms to initiate lighting at night 2 0 0 2 0 0 0
Energy conservation can save rest area operational costs and reduce the demand for electricity thus indirectly reduce greenhouse gas emissions
Natural ventilation for cooling (vents, fans, open windows, etc.) is used in lieu of air conditioning to reduce energy consumption 2 0 0 2 2 2 2
Air conditioning requires a high amount of electrical energy in rest areas where people only benefit from it for a short amount of time. Natural ventilation and shading can reduce energy costs while reducing energy demand. Signage about this approach for public education and outreach will help increase understanding.
Heat pump or alternative approaches are used onsite for heating/cooling using ambient groundwater or below grade soil temperatures (semi-buried buildings) 3 0 0 0 0 0 0
Heat pumps using groundwater or buildings built within or earth covered can increase the baseline temperature conditions making it more energy-efficient to heat or cool.
Energy conservation methods area being used at the rest area to reduce heat loss (ex. windows are at least double paned and glazed, weather stripping, etc.) 3 3 0 3 3 3 0
Most rest areas open all year and winterizing them can save energy costs to CDOT
Lighting cut off fixtures used to control light pollution 1 1 1 0 1 1 1
Lighting is direct and focused downward that reduces light dispersion and maintain a dark skies environment
Solar powered emergency phones 1 0 0 0 0 0 1
Energy-efficient phone system for public safety

D-8
Solar based hot water system onsite 2 0 0 0 0 0 0
Cost-effective way to heat hot water at rest area for restrooms
EPA Energy Star certification or equivalent hand dryer blowers are used at rest area to reduce energy consumption 3 0 0 0 0 0 0
Certified energy-efficient hand driers are available to reduce energy cost for rest areas. Hand driers are a commonly used electrical device use by most visitors; this is consistent with the State of Colorado Environmentally Preferred Purchasing Policy
Solar or wind based alternative energy used onsite to power rest area 3 0 0 0 0 0 0
Alternative energy will reduce long term energy costs and promote positive environmental image of Colorado; consistent with Governor Ritter's vision for Colorado
Vehicles used to maintain the rest area use alternative fuels such as bio-diesel, natural gas or electricity 3 0 3 0 0 0 0
Use of alternative fuels reduce the use of greenhouse gas emissions from fossil fuels and is consistent with Governor Ritter Executive Order and the State of Colorado Environmentally Preferable Purchasing Policy (2009)
Rest area uses hand blowers instead of paper towels to reduce solid waste volume and promote energy efficiency 2 0 2 2 2 2 2
Energy-efficient hand dryers reduce energy costs and reduce the amount of paper needing to be managed and ultimately landfilled.
Beverage vending machines located inside rest area building 1 0 0 0 0 0 1
Keeping the vending machine inside will reduce the electrical consumption as oppose to keeping it outside exposed to the high summertime temperatures
Total Energy 30 7 6 9 11 10 6
Public/Motorist/Trucking Outreach
Community and social impact and benefit is part of sustainability definition (environment, economic and society)
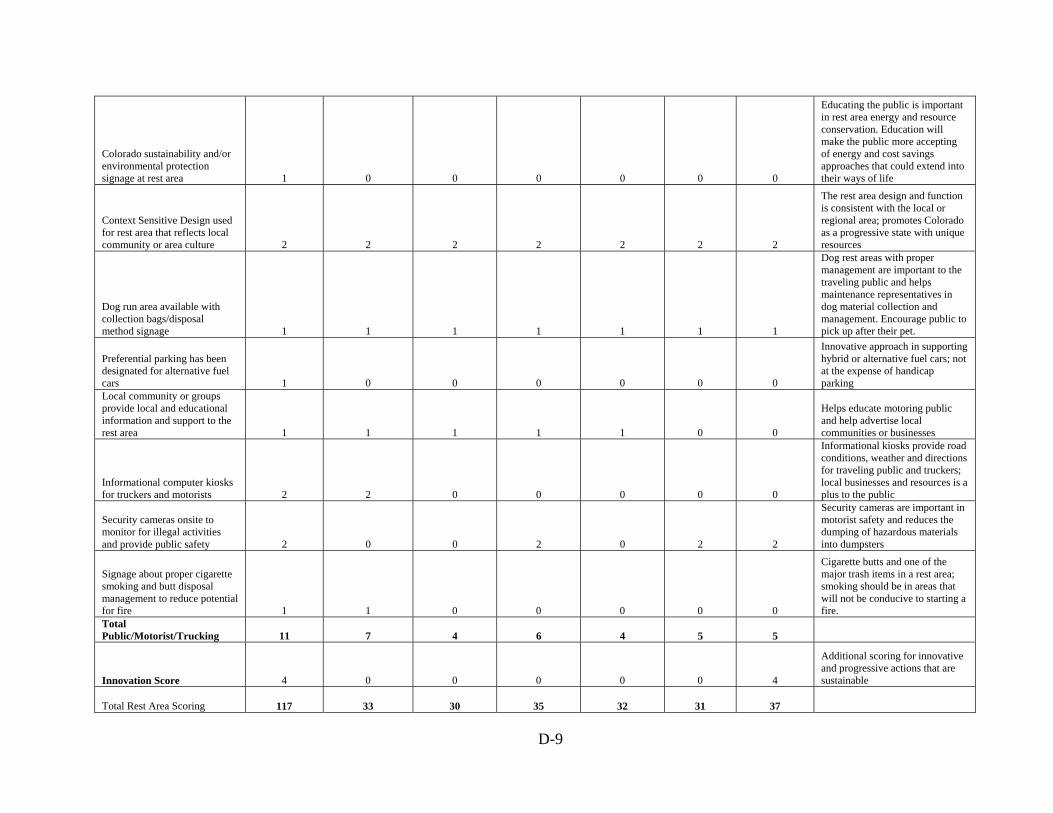
D-9
Colorado sustainability and/or environmental protection signage at rest area 1 0 0 0 0 0 0
Educating the public is important in rest area energy and resource conservation. Education will make the public more accepting of energy and cost savings approaches that could extend into their ways of life
Context Sensitive Design used for rest area that reflects local community or area culture 2 2 2 2 2 2 2
The rest area design and function is consistent with the local or regional area; promotes Colorado as a progressive state with unique resources
Dog run area available with collection bags/disposal method signage 1 1 1 1 1 1 1
Dog rest areas with proper management are important to the traveling public and helps maintenance representatives in dog material collection and management. Encourage public to pick up after their pet.
Preferential parking has been designated for alternative fuel cars 1 0 0 0 0 0 0
Innovative approach in supporting hybrid or alternative fuel cars; not at the expense of handicap parking
Local community or groups provide local and educational information and support to the rest area 1 1 1 1 1 0 0
Helps educate motoring public and help advertise local communities or businesses
Informational computer kiosks for truckers and motorists 2 2 0 0 0 0 0
Informational kiosks provide road conditions, weather and directions for traveling public and truckers; local businesses and resources is a plus to the public
Security cameras onsite to monitor for illegal activities and provide public safety 2 0 0 2 0 2 2
Security cameras are important in motorist safety and reduces the dumping of hazardous materials into dumpsters
Signage about proper cigarette smoking and butt disposal management to reduce potential for fire 1 1 0 0 0 0 0
Cigarette butts and one of the major trash items in a rest area; smoking should be in areas that will not be conducive to starting a fire.
Total Public/Motorist/Trucking 11 7 4 6 4 5 5
Innovation Score 4 0 0 0 0 0 4
Additional scoring for innovative and progressive actions that are sustainable
Total Rest Area Scoring 117 33 30 35 32 31 37
E-1
Appendix E Technical Memorandum (August 27, 2010); Rest Area Carbon Footprint Calculations
Technical Memorandum
Date: August 27, 2010 To: Vanessa Henderson Jill Schlaefer From: Ayman Hama Art Hirsch Subject: Rest Area Carbon Footprint Calculations One of the several goals identified for the CDOT Alternative Energy and Sustainable Rest Area Project is to evaluate sustainable rest area designs and maintenance practices. The development and mitigation of the study areas’ carbon footprint is the unique approach that will be taken by the Colorado State University-Pueblo Team (CSU-Pueblo Team). There has been very limited if any research performed on carbon footprinting of rest areas so there limited opportunity to compare actual or estimated carbon loadings from other State Department of Transportation rest areas. The purpose of this technical memorandum is to provide the CDOT Project Oversight Committee the proposed method on how the carbon footprint will be calculated for the Project. The carbon footprint will address the associated carbon dioxide-equivalent emissions from direct and indirect sources associated with the operation and maintenance of the Project rest areas. The carbon footprint will also address indirect emissions from idling trucks that park at the rest areas for 8 hours. General Carbon Footprint Overview The major greenhouse gases identified for reduction in the Kyoto Protocol, to mitigate global climate change, are carbon dioxide (CO2), methane (CH4), nitrous oxide (N2O), and sulfur hexafluoride (SF6), and two classes of gases, hydrofluorocarbons (HFCs), perfluorocarbons (PFCs) (Jakubski, 2008). An international standard has been established to calculate the emission of these greenhouse gases known as the Greenhouse Gas Protocol (GHGP). This standard was initiated when two major organizations, the World Resource Institute (WRI) and the World Business Council for Sustainable Development (WBCSD), recognized the need for an international standard to account for greenhouse gas emissions to meet rapidly evolving climate change policies. Working together with General Motors, British Petroleum, Monsanto and other industries, WRI introduced the Safe Climate, Sound Business Report that identified an action agenda which included a standardized measurement for GHG emissions. In 1998, an agreement was achieved between WRI and WBCSD, which led to launching a non-governmental
E-2
organization business partnership to establish standardized methods to account for GHG emissions. WRI and WBCSD were able to convince many environmental groups and major corporations such as the WWF, the Pew Center on Global Climate Change, the Energy Research Institute, and Shell to become involved and lead the multi-stakeholder standards development Process. In 2001, the first edition of the GHGP was published. Since then, the GHGP has built many tools to aid businesses in calculating their GHG emissions. Carbon Footprint Calculation Method The GHGP identifies three main Scope Emissions to identify and delineate direct and indirect emission sources. These Scope Emissions (Scope 1, Scope 2 and Scope 3) are used to provide consistency in accounting for and mitigating greenhouse gas emissions. The following summarizes the GHGP Scopes as they relate to CDOT rest areas (WRI, 2004):
Scope 1- Direct GHG Emissions- these type of emissions come from combustion sources that are owned by the entity (CDOT) that are directly related to the operations of the rest area such as propane and natural gas for heating, and gasoline/diesel fuel for the transportation of materials, equipment, mowing and personnel transportation to and from work. Scope 2- Electrical Indirect GHG Emissions- accounts for GHG emissions from the generation of purchased electricity consumed by the company (CDOT). The actual emissions occur that the power facility where the electricity is generated. This type of indirect emission will be used for rest area heating/cooling and lighting and is expected to be the largest type of emission for rest areas. Scope 3- Other Indirect GHG Emissions- these types of emissions are a consequence of activities of the company (CDOT) but occurs from sources not owned or controlled by the company (CDOT). The main rest area source for this type of indirect emission is from truck idling.
The following sections discuss the equations that will be used to calculate the total carbon footprint for Scope 1, 2 and 3 emissions for the Project rest areas. Example calculations based upon draft rest area data are provided. Scope 1 Direct Emission Equation Equation 1 will be used for the direct emissions associated with the operation and maintenance of the rest areas. The equation basically uses emission factors (kg/gallon) for CO2, N2O, and CH4
that are referenced from the United States Environmental Protection Agency (EPA, 2005). These emission factors are multiplied by the amount of fossil fuel consumed and by the respective Global Warming Potential (GWP) (Jakubski, 2008). GWP is defined as the amount of impact or the degree of harm a particular gas has on the atmosphere; more details are available in Chapter 2 of the IPCC’s Fourth Assessment Report (IPCC, 2007). When the GWP is multiplied by the

E-3
amount emitted, it is converted to an equivalent amount of CO2 and that is called “Equivalent CO2” or CO2e (See Figure 1). Equation
310
21 1
Equation 1 is applicable to any type of fossil fuel, such as diesel fuel; however, emission factors will change whenever the type of fuel changes since emission factors are specific to the type of fuel being used in the carbon footprint calculations. The emission factors that will be used for rest area used diesel fuel; propane and natural gas are as follows (DOE, 2005):
Diesel fuel (10.15 Kg CO2 per gallon) Natural gas (53.06 Kg CO2 /MMBtu or 5.306 Kg CO2 /therm) Propane (63.10 Kg CO2 /MMBtu or 5.75 Kg CO2 /therm
Example Scope 1 Calculation (Vail Pass Rest Area) The Vail Pass Rest Area is a high altitude rest area that is open all year and located on I-70. The largest consumption of fossils fuel is associated with the transportation of personnel, equipment and solid waste for disposal. The rest area is 13 miles one way (26 miles round trip) from the main CDOT Maintenance Facility located at the Eisenhower Tunnel. The annual total miles traveled by CDOT Maintenance crew for 365 days per year are 9,490 miles/yr. The total gasoline consumption by CDOT trucks based on an average of 9 miles/gal is 1,054 gallons/yr. By applying equation (1), the Scope 1 direct emission carbon footprint for the Vail Pass Rest Area is estimated to be 9.384 metric tons per year of CO2 e. The following shows the Scope 1 direct emission calculation for carbon dioxide; methane and nitrous oxide (see Table 1 for emission factors): Gasoline consumption per year= 1,054 gallons Emissionfactor CO 8.8Kg/gallon Emissionfactor N O = 0.000199Kg/gallon Emissionfactor CH 0.00182Kg/gallon GWP CO 1 GWP N O 310 GWP CH 21

E-4
1054 8.8 1054
0.000199 310 1054
0.00182 21 .
Scope 2- Electrical Indirect GHG Emission Equation Equation 2 will be used to calculate the Scope 2 Electrical Indirect GHG Emissions for the Project rest areas. The equation involves the amount of electricity consumed in KWh. This electrical consumption information will be obtained directly from the electrical provider and will be based upon a 5 year average, whenever possible. Equation 2 is based upon the consumption of electricity (KWh) multiplied by the emission factor and GWP, similar to Equation 1. The emission factors used in Equation 2 are based upon eGRID data developed by EPA (EPA, 2008), and since the EPA data are given in pounds rather than kilograms, an extra conversion factor is included in Equation 2. These factors are regional based within the United States and are dependent upon varying methods for generating electricity (coal, natural gas, nuclear or renewable). Equation Usage (KWh) X CO2 emission factor (lbs CO2/KWh) / 2204.62 1bs/metric ton + Usage (KWh) X CH4 emission factor (lbs CH4/KWh) / 2204.62 1bs/metric ton X 21 GWP + Usage (KWh) X N2O emission factor (lbs N2O/KWh) / 2204.62 1bs/metric ton X 310 GWP = CO2e Metric Ton Eq.(2) Example Scope 2 Calculation (Hanging Lake Rest Area) Hanging Lake Rest Area is located on I-70 within Glenwood Canyon. The Hanging Lake Rest Area consumes electricity for rest area heating, lighting and wastewater treatment operations. Based upon the average five year annual electrical consumption of 154,816 KWh/yr (JCI, 2010) the carbon footprint emission is estimated to be 132.866 metric tons CO2e/yr. Emission factors are taken from EPA eGRID presented in Table 2. The following is the calculation used for the Hanging Lake Scope 2 -Electrical Indirect GHG Emissions calculation: Electrical consumption-154, 816 KWh 1 metric ton=2,204.63 pounds GWP CO 1 GWP N O 310 GWP CH 21 Emission Factor-CO2=1.883 (lbs CO2/KWh) Emission Factor- CH4=0.00002288 (lbs CH4/KWh) Emission Factor-N2)=0.00002875 (lbs N2O/KWh)

E-5
154,816 (KWh) X 1.883 (lbs CO2/KWh) / 2204.62 1bs/metric ton + 154,816 (KWh) X 0.00002288 (lbs CH4/KWh) / 2204.62 1bs/metric ton X 21 GWP + 154,816 (KWh) X 0.00002875 (lbs N2O/KWh) / 2204.62 1bs/metric ton X 310 GWP = 132.866 Metric ton/yr CO2 e Scope 3- Other Indirect GHG Emissions Trucks idling in rest areas represent a significant greenhouse gas emission source that is associated with the operation and service of the rest area. It is estimated that greater than 500,000 heavy duty trucks (>26,000 lbs) travel more than 500 miles as an average daily trip within the United States. Long haul truck drivers are required by the Department of Transportation to rest 8 hours after a maximum of 10 hours driving (EPA, 2002). During this time most long haul truckers continue to idle their engines. Assuming that these 500,000 truck idle for 8 hours a day for 300 days per year at fuel consumption rate of 0.8 gallons/hr, trucks can generate and emit over 10.9 million tons of CO2 per year (21.7 tons /year per truck) and 190,476 tons of NOX per year (0.38 tons per year per truck). Under this trucking scenario, heavy duty trucks would consume 960 million gallons of diesel fuel while idling (EPA, 2009). The EPA was tasked by President Bush in 2001 to work closely with the U.S. Department of Transportation (DOT) to reduce truck idling. As part of that initiative the EPA initiated a study that quantified long duration idling emissions and fuel consumption. The tests were performed on nine class-8 trucks (model years ranging from 1980-2001). Based upon this study it was determined that on average an idling Class 8 truck would (EPA, 2002):
Consume 0.82 gallons/hour of diesel fuel Emit 8.224 kg/hour of CO2 (Emission factor = 10 Kg/gallon) Emit .144kg/hour of N2O (Emission factor = 0.18 Kg/gallon)
Example Scope 3 Calculation (Vail Pass Rest Area) As a hypothetical example, it is assumed that the average heavy duty truck consumes 0.82 gallons/hr of diesel fuel while idling and there is an average of three trucks that individually idle 8 hours/per day at the rest area; therefore, 6.6 gallons of diesel would be consumed per truck with an overall consumption value of 19.7 gallons of diesel fuel for three trucks per day. It is assumed that the 3 trucks idle for 8 hours for 365 days per year, in which 7,183 gallons of diesel is consumed annually from idling at the Vail Pass Rest Area. The following is an example calculation for the truck idling carbon footprint. Equation 1 is again used to estimate the Scope 3 Indirect GHG Emissions for Vail Pass rest area. Diesel fuel consumption per year (idling) = 7,183 gallons Emissionfactor CO 10. Kg/gallon Emissionfactor CH = 0.000199Kg/gallon Emissionfactor N O 0.18Kg/gallon GWP CO 1

E-6
GWP N O 310 GWP CH 21
7183 / 10 11000
7183 / 0.18
11000
310 . CO2
There is very little information available for a methane emission factor for diesel truck idling. One emission factor found in the literature showed a value 12 g/hr (EPA, 2002). Based upon the relatively small emission factor in comparison to CO2 and NO2, methane will be ignored due to its insignificant effect on final carbon footprint calculations. Carbon Footprint Analysis The development of a rest area’s carbon footprint will provide a unique way of analyzing the Project rest areas’ energy consumption. The Sustainable Rest Area Report will identify the greenhouse gas emissions from Scope 1, 2 and 3 emissions at all Project study rest area sites and will develop potential mitigation schemes and recommendations toward making the rest area carbon neutral. Potential mitigation techniques may include but not limited to changes in rest area operating procedures, reducing gas consumption, heating/energy conservation, vegetation/tree sequestration, truck electrification (auxiliary power units) and alternative energy photovoltaic cells.

E-7

Taken fr
Table
rom (Jakub
1- CH4 and
ski, 2008)
d N2O Emis
E-8
ssion Facto
ors for Highhway Vehicles
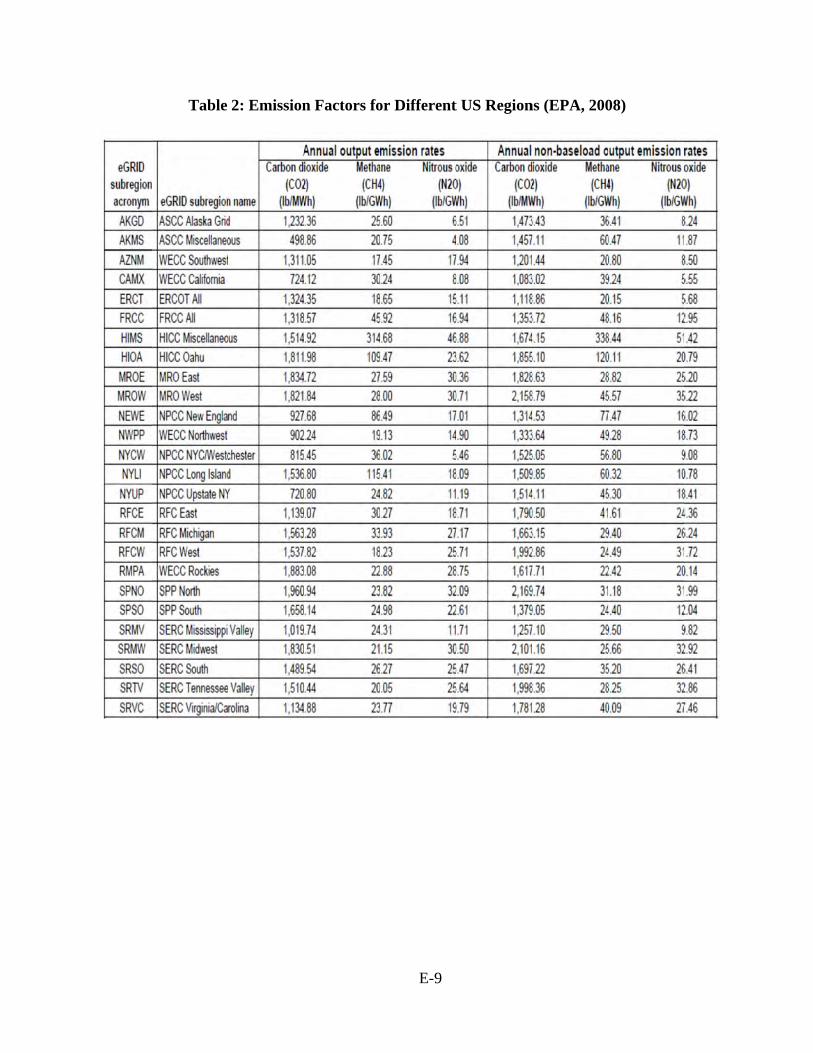
Table 2: Emissionn Factors fo
E-9
or Differentt US Regionns (EPA, 20008)
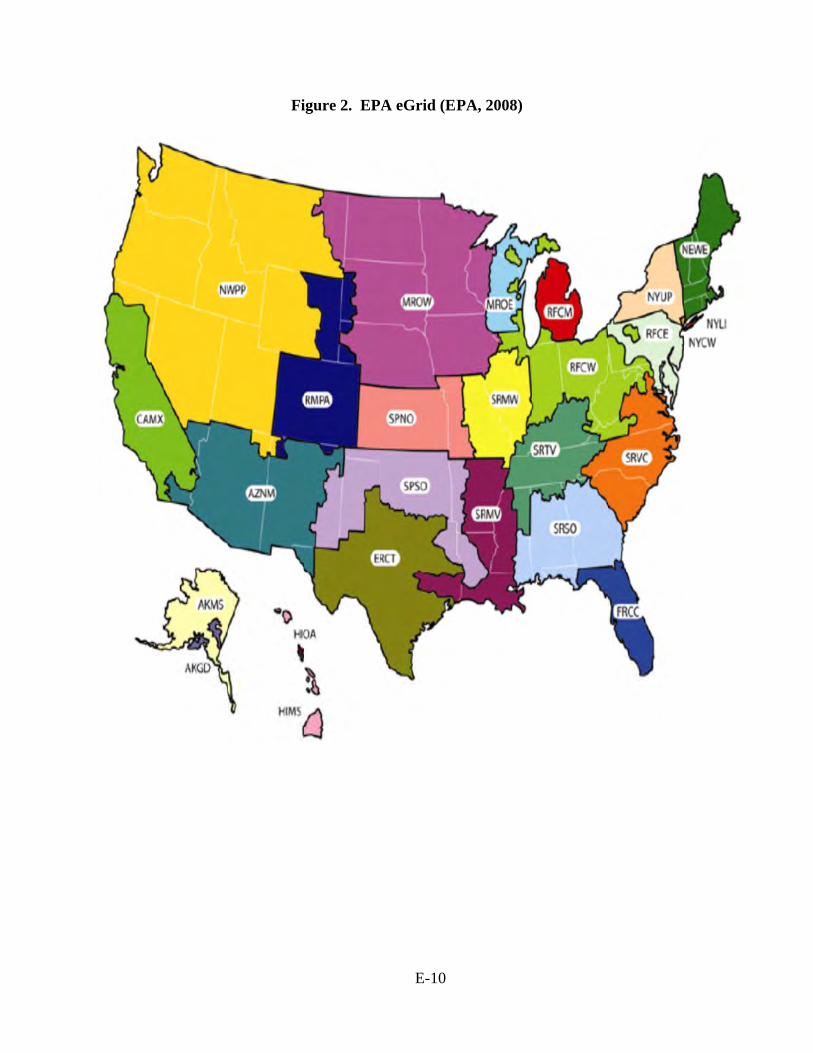
Fiigure 2. EP
E-10
A eGrid (EPPA, 2008)

E-11
References (EPA 2002) U.S. Environmental Protection Agency, Study of Exhaust Emissions from Idling Heavy-duty Diesel Trucks and Commercially Available Idle Reducing Devices, EPA420-R-02-025, October, 2002. (EPA 2008) U.S. Environmental Protection Agency, Direct Emissions from Mobile Combustion Sources, EPA430-K-08-004, May, 2002. <http://www.epa.gov/climateleaders/documents/resources/mobilesource_guidance.pdf> (Jakubski, 2008) Jakubski, Paul. “Calculating and Reducing Your Carbon Footprint.” GATF World 20.3(2008):40-43 <http://www.pneac.org/publicationoftheyear/Calculating-and-Reducing-Your-Carbon-Footprint.pdf> (EPA 2008) U.S. Environmental Protection Agency, eGRID2007 Version 1.1 Year 2005 GHG Annual Output Emission Rates, December 2008 <http://www.epa.gov/cleanenergy/documents/egridzips/eGRID2007V1_1_year05_GHGOutputRates.pdf> (EPA 2009) U.S. Environmental Protection Agency, Appendix A: Carbon Footprint/Greenhouse Gas Inventory Analysis for Sediment, Floodplain, and Treatment/Disposition Alternatives, March 2009 <http://www.epa.gov/region1/ge/thesite/restofriver/reports/cms/447141_Appendix_A.pdf> (EPA, 2005) Office of Transportation and Air Quality, Emission Facts; Average Carbon Dioxide Emissions Resulting from Gasoline and Diesel Fuel; EPA420-F-05-001, February 2005 (WRI, 2004) Bhata, Pankaj; Janet Ranganathan, The Greenhouse Gas Protocol: A Corporate Accounting and Reporting Standard, March 2004 (DOE, 2005) Energy Information Administration, Documentation for Emissions of Greenhouse Gases in the United States, 2005, DOE/EIA 0638 (2005) (JCI, 2010) Spreadsheets of electrical consumptions sent to Art Hirsch from Johnson Controls (Nichole Stennes), September, 2010 (IPCC, 2007) Forster, P., V. Ramaswamy, P. Artaxo, T. Berntsen, R. Betts, D.W. Fahey, J. Haywood, J. Lean, D.C. Lowe, G. Myhre, J. Nganga, R. Prinn, G. Raga, M. Schulz and R. Van Dorland, 2007: Changes in Atmospheric Constituents and in Radiative Forcing. In: Climate Change 2007: The Physical Science Basis. Contribution of Working Group I to the Fourth Assessment Report of the Intergovernmental Panel on Climate Change [Solomon, S., D. Qin, M. Manning, Z. Chen, M. Marquis, K.B. Avery, M. Tignor and H.L. Miller (eds.)]. Cambridge University Press, Cambridge, United Kingdom and New York, NY, USA. http://www.ipcc.ch/pdf/assessment-report/ar4/wg1/ar4-wg1-chapter2.pdf
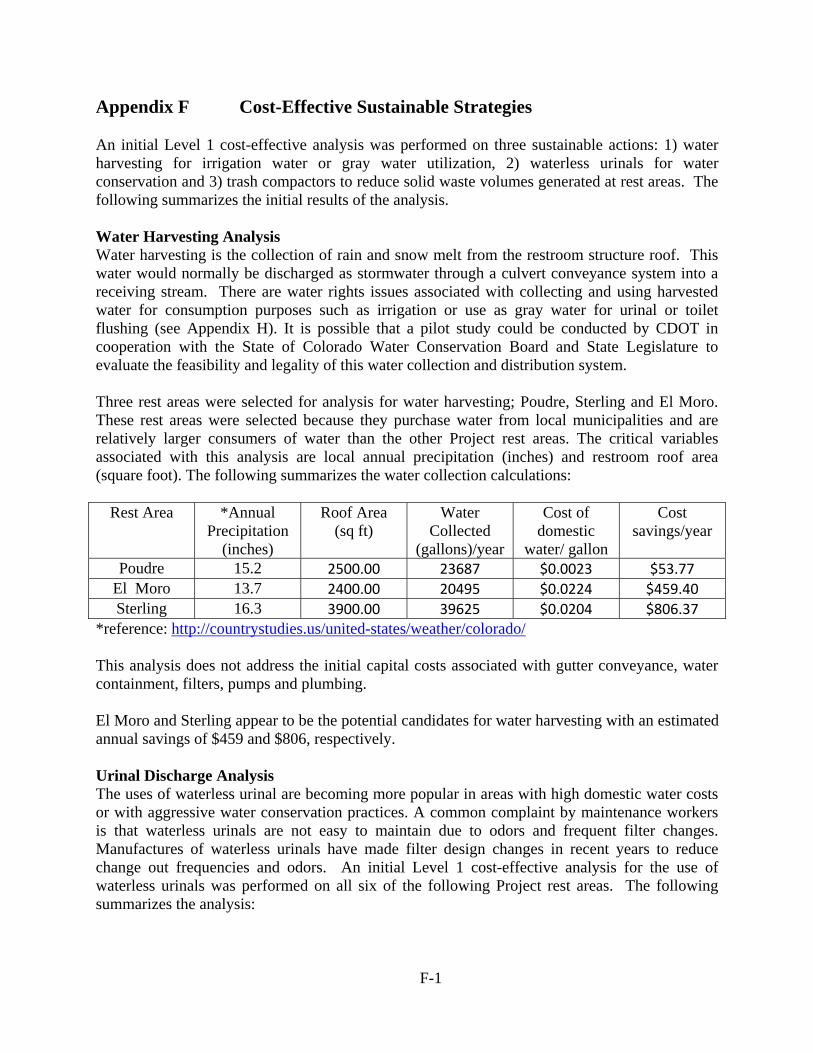
F-1
Appendix F Cost-Effective Sustainable Strategies An initial Level 1 cost-effective analysis was performed on three sustainable actions: 1) water harvesting for irrigation water or gray water utilization, 2) waterless urinals for water conservation and 3) trash compactors to reduce solid waste volumes generated at rest areas. The following summarizes the initial results of the analysis. Water Harvesting Analysis Water harvesting is the collection of rain and snow melt from the restroom structure roof. This water would normally be discharged as stormwater through a culvert conveyance system into a receiving stream. There are water rights issues associated with collecting and using harvested water for consumption purposes such as irrigation or use as gray water for urinal or toilet flushing (see Appendix H). It is possible that a pilot study could be conducted by CDOT in cooperation with the State of Colorado Water Conservation Board and State Legislature to evaluate the feasibility and legality of this water collection and distribution system. Three rest areas were selected for analysis for water harvesting; Poudre, Sterling and El Moro. These rest areas were selected because they purchase water from local municipalities and are relatively larger consumers of water than the other Project rest areas. The critical variables associated with this analysis are local annual precipitation (inches) and restroom roof area (square foot). The following summarizes the water collection calculations:
Rest Area *Annual Precipitation
(inches)
Roof Area (sq ft)
Water Collected
(gallons)/year
Cost of domestic
water/ gallon
Cost savings/year
Poudre 15.2 2500.00 23687 $0.0023 $53.77 El Moro 13.7 2400.00 20495 $0.0224 $459.40 Sterling 16.3 3900.00 39625 $0.0204 $806.37
*reference: http://countrystudies.us/united-states/weather/colorado/ This analysis does not address the initial capital costs associated with gutter conveyance, water containment, filters, pumps and plumbing. El Moro and Sterling appear to be the potential candidates for water harvesting with an estimated annual savings of $459 and $806, respectively. Urinal Discharge Analysis The uses of waterless urinal are becoming more popular in areas with high domestic water costs or with aggressive water conservation practices. A common complaint by maintenance workers is that waterless urinals are not easy to maintain due to odors and frequent filter changes. Manufactures of waterless urinals have made filter design changes in recent years to reduce change out frequencies and odors. An initial Level 1 cost-effective analysis for the use of waterless urinals was performed on all six of the following Project rest areas. The following summarizes the analysis:

F-2
Rest Area Visitation per year
# males using urinals/day
Gallons per flush
Total gallons per day from urinals
Total Gallons per year for urinals
Sterling 383,597 420 0.5 168 61,376 El Moro 328,500 360 1 288 105,120 Poudre 121,711 133 0.5 53 19,474 Hanging Lake 72,049 79 2.9 184 67,277 Vail Pass 680,000 745 1.6 954 348,160 Sleeping Ute Mtn. 65,700 72 0.5 29 10,512
Rest Area Domestic water cost per 1000 gallons
Cost per gallon
Total Cost of urinal
water/year Number
of urinals Urinal/Installation
Cost ROI/years
Sterling $20.35 $0.02035 $1,248.99 7
$3,500.00 2.8
El Moro $22.41 $ 0.02241 $2,356.26 3
$1,500.00 0.6
Poudre $2.27 $0.00227 $44.21 3
$1,500.00 33.9 Hanging Lake *$1.00 $0.00100 $67.28 3
$1,500.00 22.3
Vail Pass *$1.00 $0.00100 $348.16 3
$1,500.00 4.3 Sleeping Ute Mtn. *$1.00 $0.00100 $10.51 2
$1,000.00 95.1
*Rough assumption estimate The cost assessment assumes that the cost of the waterless urinal is $300 plus $200 for installation. The estimate does not factor in the cost of filters or the labor costs with filter change outs. The initial analysis indicates that the Sterling, El Moro and Vail Pass rest areas are candidate areas for waterless urinals. The cost of onsite wastewater treatment savings is not factored into this assessment and would potentially make the Hanging Lake Rest Area a candidate area and provide Vail Pass Rest Area with a shorter return on investment. Reference: ZeroFlush (personal conversation/http://www.zeroflush.com/, December 1, 2010)
F-3
Trash Compactor Trash compaction is an effective way to reduce solid waste management costs by reducing volume that could reduce frequency of waste collection trips by a vendor or transport from the rest area to the maintenance facility for ultimate landfilling disposal. For the initial Level 1 cost- effectiveness analysis the BigBelly Solar Compactors were used as the model due to their solar energy capabilities and flexibility for installation. Appendix G provides the cost breakdown and return on investment calculations. The El Moro Rest Area was selected as a model for this cost assessment. The assessment is based upon replacing 18 existing containers with 14 BigBelly 2-unit Kiosks. The existing containers are collected 14 times per week; with the BigBelly System, that frequency can be reduced to 3 times per week. This reduction could save CDOT approximately 286 staff/vehicle hours annual which amounts to approximately $15,730 per year in savings. The return on investment is 4.44 years with an approximate savings of $87,510 over the life of the equipment. Reference: BigBelly Solar (personal conversation/http://bigbellysolar.com/, December 3, 2010)

Append
dix G Solid WWaste Com
G-1
mpaction
H-1
Appendix H Colorado Rainwater Harvesting Legal Analysis
Statutory matters regarding precipitation harvesting pilot projects, including rainwater
harvesting, include the following:
SB09-080 (signed by the governor April 22, 2009; effective June 2 and July 1, 2009) allows
limited use of collection and use of precipitation for private landowners that are not served by
municipal water, have a well or would be approved for a well, and limit the use to household
water. This aspect of SB09-080 is codified in C.R.S. 37-90-105, which in part states that the state
engineer can approve permits for allowing certain rooftop precipitation collection systems for
buildings that are primarily residences and that are not served by a domestic water system
serving more than 3 single-family dwellings, so long as the water is used for ordinary household
use, fire protection, watering for domestic animals, poultry or livestock, or irrigation of not more
than one acre of gardens and lawns. The option exists for those using or legally entitled to use a
well, and the water can be used only for the same buildings, and subject to the same limitations,
that exist or would exist in a legal well permit.
In addition, part of SB09-080 is codified in C.R.S. 37-60-115, which allows for certain pilot
projects regarding precipitation harvesting. The goal of these pilot projects is to gain field-
verified information about the feasibility of rainwater harvesting as a water conservation
measure. 37-60-115 tasks the Colorado Water Conservation Board (CWCB), in consultation with
the state engineer, with selecting the sponsors of up to ten new residential or mixed-use
developments that will conduct individual pilot projects to collect precipitation from rooftops
and impermeable surfaces, for nonpotable uses.
C.R.S. 37-60-115 emphasizes that the pilot projects will measure precipitation capture
efficiencies, and compile and analyze data collected; and provide data to allow their sponsors to
develop permanent augmentation plans.
The statute further states that until the pilot project sponsor applies to the water court for a
permanent augmentation plan, the pilot project is required to replace an amount of water equal to

H-2
the amount of precipitation captured and measured from rooftops and impermeable surfaces for
nonpotable uses.
A recent CWCB document (at
http://cwcb.state.co.us/legal/Documents/Guidelines/FINALRainwaterPilotCG.pdf, last examined
December 17, 2010) provides criteria and guidelines for pilot project applications.
An application fee and annual review fee ($4000 and $7000 respectively) are required.
I-1
Appendix I Renewable Energy Standards (RES) Background Numerous mandates and incentives for utilities to develop partnerships with energy customers
are contained in Colorado statute, as follows.
Colorado's renewable portfolio standards were created by ballot initiative; Amendment 37 was
passed with approximately 54% of the votes cast on the measure in November 2004, and was
codified in Colorado Revised Statutes (C.R.S.) 40-2-124. It includes the following as part of the
legislative intent:
“...Colorado's renewable energy resources are currently underutilized. Therefore, ...it is in the
best interests of the citizens of Colorado to develop and utilize renewable energy resources to
the maximum practicable extent.”
It set renewable energy standards that have since been altered and amended by HB 10-1001
(signed by the Governor March 22, 2010; effective August 11, 2010), HB 1418 (signed by the
Governor June 10, 2010; effective August 11, 2010), and SB 10-177 (signed by the Governor
June 9, 2010; effective August 11, 2010), with alterations and amendments also residing in
C.R.S. 40-2-124.
In summary, Colorado's renewable portfolio standard requires retail utilities (excluding
municipally-owned utilities serving 40,000 or fewer customers) to generate, or purchase,
electricity from renewable sources meeting 12% of retail electricity sales in Colorado for 2011-
2014, with “distributed generation” (partially defined below) comprising at least 1% of retail
electricity in 2011 and 2012 and 1.25% in 2013 and 2014; 20% of retail electricity for 2015-
2019; and 30% of retail electricity for 2020 and beyond (and increasing distributed generation).
At least half of the distributed generation must be retail distributed generation, meaning that it is
from renewable energy located on the customer's site, interconnected on the customer's side of
the meter, primarily for the customer's load, and supplying no more than 120% of the average
annual consumption of the customer at that site, including contiguous property.
Renewable energy is solar, wind, geothermal, biomass (urban wood waste, brush, animal wastes,
methane as a byproduct of wastewater residuals), hydropower, and fuel cells (so long as the
I-2
hydrogen is derived from renewables). The statute gives a weight of 1.25 for power generated
within Colorado, except for retail distributed generation; a weight of 2.0 is given for renewable
energy interconnecting to transmission or distribution owned by a cooperative electrical
association or municipally owned utility, up to a certain size and interconnection voltage; a
weight of 1.5 is given for community-based projects (including those by a local government).
Solar electric generation receives a weight of 3 through 2015, for cooperative electric
associations and municipally owned utilities.
C.R.S. 40-2-124 codifies that contiguous property owned or lease by the customer is without
regard to interruptions in contiguity by easements, public thoroughfares, transportation right-of-
way, or utility right-of-way.
Qualifying retail utilities not meeting the standards above are allowed to acquire renewable
energy credits. Also, a rebate program is set up, requiring retail customers a standard rebate offer
of some amount per watt of installation of solar electric on customer's premises, up to 100kW
installation. The standard rebate offer is $2/Watt in the statute, although the amount can be
lowered if the Colorado Public Utilities Commission so determines. Excess electricity for any
one month can be carried forward as credit for the following month, and the customer can be
reimbursed for excess production at the average hourly incremental cost (unless the excess is
requested to be carried forward as a month-to-month credit indefinitely).
The owner or operator of the solar electricity generation facility can sell the electricity to the
consumer on whose property the generation facility lies, up to 120% of the average annual
consumption of electricity (again, the notion of property includes contiguous property).
Utilities may establish offers to purchase renewable energy credits. The typical investor-owned
utility incentives now (2010) are $2/Watt for the standard rebate offer. (For commercial systems,
an additional renewable energy credit incentive of $80-$115 for each annual megawatt hour of
production is typical. For residential systems, an additional incentive of $.45/Watt for the
purchase of solar renewable energy credits, i.e. a total incentive of $2.45/Watt of solar
installation, is now typical. It is important to note that the amount of these incentives can
I-3
change; the purchase of renewable energy credits for residential users alone had been $2.50/Watt
a few years ago.)
The Colorado Public Utilities Commission has issued rules, in 4 Code of Colorado Regulations
(CCR) 723-3 (effective September 14, 2010), regarding rules regulating electric utilities. These
rules explicitly state in part what C.R.S. 40-2-124 codifies; specifically, under the heading "Net
metering", it states that all investor-owned qualified retail utilities will allow electrical
consumption to be offset by renewable energy, provided in part that the system is sized to supply
no more than 120% of the customer's average annual electricity consumption at that site (where,
as noted above, the term 'site' includes all contiguous property owned or leased by the customer,
without regard to interruptions in contiguity by easements, public thoroughfares, and
transportation or utility rights of way).
The document includes details such as who provides the meter and how many meters are to be
used (since there are different needs based on use of solar renewable energy).
HB 10-1349 (signed into law by the Governor June 8, 2010; effective June 8, 2010) also has
some implications for what is possible regarding renewable energy for certain components of
state government. It created the Reenergize Colorado program codified in C.R.S. 24-33-115,
with the goal of generating, or off-setting, all of the division of parks and outdoor recreation's
electrical energy consumption using renewable energy sources on land owned, leased, or
controlled by the division, by the year 2020. A key exception in this law is that the renewable
energy generating equipment on site is allowed to exceed the 120% threshold noted above;
specifically, the utility has the right of first refusal in purchasing the excess power, and if it does
purchase the power it can claim renewable energy credits.
A corporate tax benefit applying to businesses, i.e. the Business Investment Tax Credit, allows
for a 30% tax credit for photovoltaic systems and some other renewable energy including fuel
cells and small wind systems [and is outlined in the United States Code, Title 26, Section 48(a)].
This tax benefit, through December 2016, is different from the stimulus-funded federal grant
program for businesses. Such a tax credit is crucial as a benefit for a private-sector partner in
developing renewable energy opportunities.

I-4
Patent issues may arise, based in part on the experiences of the Oregon Department of
Transportation. If activity is considered to infringe on a patent claim, licensing may be an option;
however, questions of patent validity may also arise. Parties often consider filing a declaratory
judgment (DJ) action. Standards for filing DJ actions in patent cases have been shifting in recent
years, and the general trend is that a party may file a DJ action even if the patent holder is not
threatening direct litigation. For instance, the US Supreme Court case MedImmune v. Genentech
(2007) eliminated the prior reasonable apprehension of litigation requirement for filing a DJ
action. Roughly, the newer standard is whether there is a substantial controversy and sufficient
immediacy and reality to warrant the issuance of a declaratory judgment. Issued patents are
presumed valid, and a patent holder must show infringement only by a preponderance of the
evidence standard, while one contesting a patent must use the higher standard that there is clear
and convincing evidence of invalidity. Nevertheless, a patent can be ruled invalid particularly if
it is challenged on grounds not originally considered by the Patent Office. Grounds for
invalidating a patent include a finding that the invention was not novel. This may include a
finding that it was known or used by others in this country, or patented or described in a printed
publication (which might include materials presented at a conference) in this or a foreign
country, before the invention by the patent holder. So-called statutory bars to patentability
include a finding that the invention to be patented was in public use or on sale in this country
more than one year prior to the date of application in the US. Obviousness is another valid
ground for invalidating a patent. Once again, the general trend is to find an increasing number of
inventions to be obvious; the perspective used remains that of a person having ordinary skill in
the art, at the time of the invention. Obviousness can be based on numerous prior references.
Various scenarios for taking advantage of the above tax credits and incentives from utilities
include a private-sector partnership with an energy producer and utility, e.g. in the form of a
solar power purchase agreement or solar lease. In a purchase power agreement scenario, CDOT
would not own the electrical generation system, but rather would pay for electricity only, often at
a fixed negotiated rate. Another entity would develop and maintain the system, and the utility
could acquire renewable energy credits. (In a solar lease, the customer is paying for the
equipment, and costs could presumably vary with time.)