Embed Size (px)
Citation preview
Assessment of Cognitive Functionusing P3 Components of Eye fixationRelated Potentials
Kengo Asahi 1, Mieko Ohsuga 2, 1 Graduate School of Engineering of Industrial Engineering,
Osaka Institute of Technology2 Faculty of Robotics & Design, Osaka Institute of Technology

ACED2017 2017.06.04
IntroductionThe ultimate goal of our work is to provide elderly
drivers with training methods or driver assistant systems appropriate for their individual levels of cognitive ability.
The assessment method is necessary to access the three phases of the cognitive process; recognition, judgment, and operation.
In this study, we propose that the response latency between stimulus presentation and eye fixation—with specific focus on the P3 component of eye-fixation related potentials (EFRP)—can be used to develop one such method of assessment.

ACED2017 2017.06.04
Response
Eye Fixation (EF)Stim. onset
EOG(Electro
Oculogram)
EFRP(Eye Fixation
Related Potential)
Perception and comprehension
Activation of response
P3Updating context
Response
Eye movement
P3 latencyEF latency
Reaction time from EFReaction timefrom Stim. onset
Cognitive Process
EFRP: Eye-Fixation Related Potentials

ACED2017 2017.06.04
Method
Participants˗ 33 elderly aged 66 – 81 (28 males and 5 females) ˗ 6 young male adults aged 21- 23
The experiments were executed with permission of the president of Osaka Institute of Technology in accordance with the report of the Ethics Committee on Life Sciences of Osaka Institute of Technology (approval number 2015-4-1).

ACED2017 2017.06.04
Method
Experimental settings˗ A simulated driving environment consisted of
three 42-inch LCDs, a car seat, a steering wheel, an accelerator pedal and a brake pedal
135° 1.3m

ACED2017 2017.06.04
Target Non-Target
MethodOdd ball Task
˗ Target : Non-Target = 2 : 8˗ 200 stimuli for a session˗ duration 0.5 s, intervals 1.8s

ACED2017 2017.06.04
MethodOdd ball Task
˗ Target : Non-Target = 2 : 8˗ 200 stimuli for a session˗ duration 0.5 s, intervals 1.8s
Target Non-Target

ACED2017 2017.06.04
Method2 levels of response load based on “Simon effect”Hypothesis:
response loads and reaction times; “cross” > “straight”cognitive loads and EFRP latencies; “cross” = “straight”
Straight Cross

ACED2017 2017.06.04

ACED2017 2017.06.04
Method
Measurement˗ 19 ch electroencephalogram (EEG) data based on
the international 10-20 systemusing an electrode cap (Electro-cap Co.) and a multi-purpose biological amplifier (Polymate)
˗ Vertical and horizontal electrooculography (EOG)using small Ag-AgCl electrodes and the same amplifier

ACED2017 2017.06.04
MethodAnalysis for obtaining EFRP
˗ EEG data were analyzed with respect to linked-ear reference data˗ Eye movement-related artifacts were removed using ICA˗ Eye fixation points were determined by the norm of both EOG
waveforms and used as triggers˗ EEG data between 300 ms before and 1000 ms after the trigger
were extracted and baseline correction was executed˗ EFRP were obtained by averaging the extracted EEG data from
trials with correct responses ˗ A low-pass filter with a cut-off frequency of 8 Hz was applied for
smoothing

ACED2017 2017.06.04
**<0.01Straight Cross Straight Cross
**N
umbe
r of c
orre
ct a
nsw
ers
Young Elderly
ResultsNumber of correct answers Aging effect

ACED2017 2017.06.04
**<0.01Straight Cross Straight Cross
**Ti
me
[s]
**
ResultsReaction time
Young Elderly
Simon effect
Aging effect

ACED2017 2017.06.04**<0.01
**Ti
me
[s]
Straight Cross Straight CrossNonTarget
NonTarget
Results
Young Elderly
Aging effectEye fixation latencies
ACED2017 2017.06.04
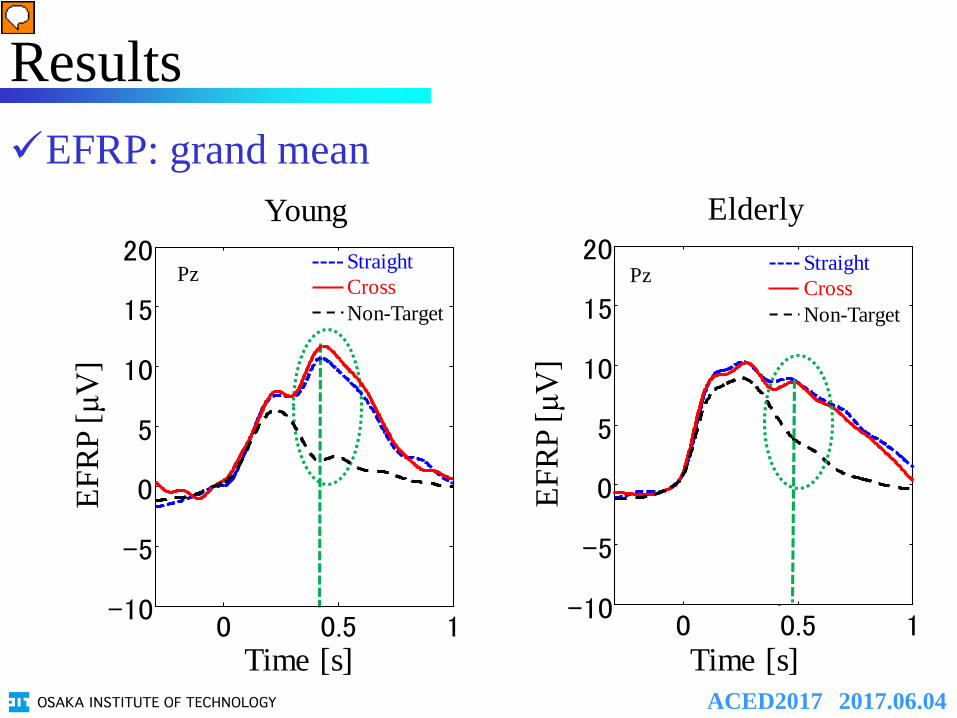
Results
Time [s] Time [s]
EFRP
[μV
]
EFRP
[μV
]
Young Elderly
0 0.5 1-10
-5
0
5
10
15
20Pz Straight
CrossNon-Target
0 0.5 1-10
-5
0
5
10
15
20Pz Straight
CrossNon-Target
EFRP: grand mean

ACED2017 2017.06.04
Results
0.42 S 0.44 S 0.45 S 0.48 S
EFRP: scarp distribution
ACED2017 2017.06.04
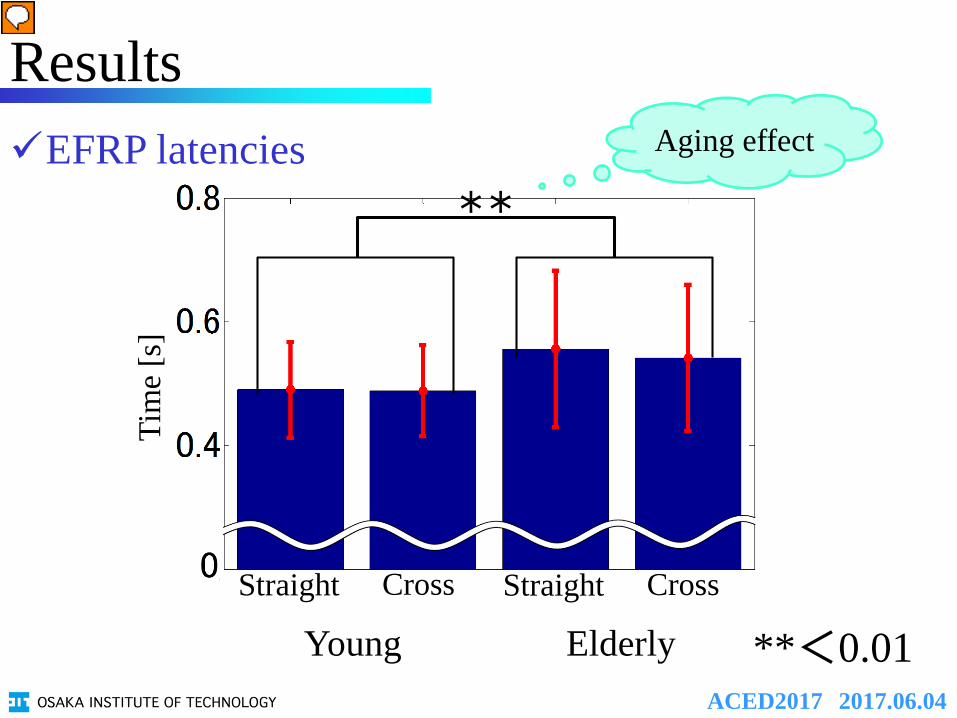
Straight Cross Straight Cross
**<0.01
**Ti
me
[s]
Results
Young Elderly
EFRP latencies Aging effect

ACED2017 2017.06.04
ConclusionsAging effects were confirmed in ˗ eye fixation latencies˗ P3 latencies of EFRP ˗ reaction times
Large individual differenced were found in these indicesCognitive process may be assessed divided
into three phases; ˗ detection˗ judgement˗ operation
The assessment method for individual person should be studied in the future work

ACED2017 2017.06.04
Acknowledgements
This work was supported by the International Association of Traffic and Safety Sciences (Research Project No.H2757).