Embed Size (px)
Citation preview

Assessment of clean vehicle performance in relation to
each market-driven freight terminal business model |
D4.2
Author: Maciej R.Tumasz | NEWRAIL
Quality control: | Malcolm Lundgren | Trafikverket
Version: Final version Date of version: 27.01.2016
Project: SMARTSET | www.smartset-project.eu Contract number: IEE/12/714/SI2.644747
Duration of the project: 01.05.2013-30.04.2016 | 36 months
Project coordination and contact on behalf of SMARTSET: City of Gothenburg | SWEDEN | www.goteborg.com
Urban Transport Administration
Box 2403 | 403 16 Gothenburg | SWEDEN
E-mail: [email protected] The sole responsibility for the content of this document lies with the authors. It does not necessarily reflect the opinion of
the European Union. Neither the EACI nor the European Commission are responsible for any use that may be made of the
information contained therein.

www.smartset-project.eu page 2 of 49
TABLE OF CONTENTS
1. ABOUT SMARTSET ................................................................................................................ 4
2. PROJECT STRUCTURE ............................................................................................................ 6
3. OBJECTIVE OF WP4 ............................................................................................................... 9
4. CLEANER VEHICLE DEMONSTRATORS ACROSS THE DIFFERENT SMARTSET SITES ................... 11
4.1. VEHICLE TESTS IN A NUTSHELL ............................................................................................................ 11
4.2. BERLIN (from D3.2 and PADUA meeting presentation) ....................................................................... 12
4.3. GOTHENBURG (from D2.1) .................................................................................................................. 15
4.4. GRAZ (from D3.2) ................................................................................................................................. 17
4.5. NEWCASTLE (from D3.2) ...................................................................................................................... 23
4.6. PADUA (from D3.2) .............................................................................................................................. 27
4.7. ROME (from D3.2) ............................................................................................................................... 33
5. ASSESMENT OF CLEANER VEHICLES TESTS / DEMONSTRATORS ............................................ 36
5.1. PARAMETERS RELATING TO THE VEHICLE’S OVERALL PERFORMANCE ............................................... 36
5.2. PARAMETERS RELATING TO THE VEHICLE’S TRANSPORT WORK AND ENVIRONMENTAL
PERFORMANCE ................................................................................................................................................. 37
5.3. PARAMETERS RELATING TO THE VEHICLE’S MAINTENANCE ............................................................... 37
5.4. PARAMETERS RELATING TO THE TEST’S FIT WITH INCENTIVES, SOURCES OF EXTERNAL REVENUES
AND POLICIES .................................................................................................................................................... 38
5.5. PARAMETERS RELATING TO THE TESTS’ SUSTAINABILITY & IMPACT .................................................. 39
6. DESCRIPTIVE ASSESMENT OF THE DEMONSTRATION OPERATIONS ....................................... 41

www.smartset-project.eu page 3 of 49
6.1. ASSESSMENT OF KEY SUCCESS FACTORS ............................................................................................. 41
6.2. ASSESSMENT OF MAJOR OBSTACLES IN IMPLEMENTATION ............................................................... 42
6.3. DESCRIPTION OF THE BUSINESS MODEL IN A NUTSHELL .................................................................... 44
6.4. ASSESSMENT OF THE BUSINESS MODEL’S POTENTIAL FOR IMPROVEMENT ...................................... 45
6.5. ASSESSMENT OF THE DEMONSTRATORS’ TRANSFERABILITY POTENTIAL ........................................... 46
6.6. DESCRIPTION OF THE FUTURE PLANS FOR THE DEMONSTARTORS .................................................... 46
7. CONCLUSIONS .................................................................................................................... 48

www.smartset-project.eu page 4 of 49
1. ABOUT SMARTSET
Transport of goods, both on long distances and within cities contributes to a substantial part
of the total emissions generated from the transport sector, as well as congestion. Up to 20%
of traffic, 30% of street occupation and 50% of greenhouse-gas emissions are generated by
freight.
The SMARTSET project will develop and show how freight transport in European cities and
regions can be made more energy-efficient and sustainable by a better use of freight
terminals. To reach this overall goal, the project will provide examples of good practice that
can support cities, regions and countries to contribute to the European Union „20-20-20“
targets1 for reduction in carbon dioxide emissions and improvement in energy-efficiency.
SMARTSET targets Reduction by 2016 Reduction by 2020
Reduction of CO2 emissions in tonnes 9,051 tonnes per year 23,418 tonnes per year
Reduction of energy consumption in tonnes 3,104 tonnes per year 8,056 tonnes per year
Reduction of energy consumption in GWh 34 GWh per year 449 GWh per year
Table 1: SMARTSET targets during project duration (by 2016) and beyond (by 2020)
SMARTSET is structured around three core aspects for creating successful and attractive
terminals:
Market based business models provide an outline for various strategies and distribution
solutions to be implemented through organizational structures, processes and systems.
In order to make city centres more attractive, the introduction of clean and energy-
efficient vehicles for last mile distribution and the use of intermodal transports is
facilitated as well.
Incentives and regulations improve the possibility to make the business models
profitable and financially sustainable
1 The climate and energy package is a set of binding legislation which aims to ensure the European Union meets its
ambitious climate and energy targets for 2020. These targets, known as the "20-20-20" targets, set three key objectives for
2020:
A 20% reduction in EU greenhouse gas emissions from 1990 levels
Raising the share of EU energy consumption produced from renewable resources to 20%
A 20% improvement in the EU's energy efficiency

www.smartset-project.eu page 5 of 49
SMARTSET is a project, co-funded by the Intelligent Energy – Europe programme of the
European Union (IEE) and is composed of 14 partners, coming from Austria, Germany, Italy,
Sweden and the United Kingdom. It runs from 01.05.2013 until 30.04.2016.

www.smartset-project.eu page 6 of 49
2. PROJECT STRUCTURE
SMARTSET is divided into 8 work packages, all integrated into each other, in which the
leadership will be spread among the project partners:
WP 1 Project Management
WP 2 Cooperative market-driven business solutions
WP 3 Incentives and regulations
WP 4 Clean vehicles in transport
WP 5 Networking & Exchange of Experiences
WP 6 Evaluation
WP 7 Dissemination & Target Group Communication
WP 8 IEE Dissemination
FIGURE 1: WP STRUCTURE

www.smartset-project.eu page 7 of 49
In SMARTSET, WPs 2, 3 and 4 focus on measures to be undertaken by cities, encompassing
business solutions, incentives and regulations as well as clean vehicles. In SMARTSET all
cities start from different local situations and to develop sustainable business models for
freight distribution and increase the use of clean vehicles, the transfer of knowledge is an
absolute key issue, which will be taken care of in WP 5. This is where the actions and
knowledge in “leader cities” can be transferred to “follower cities”, and experience
regarding these issues can be exchanged. WP5 is a key work package for SMARTSET, to
ensure that information and knowledge is spread throughout the consortium to create the
best prerequisites for successful implementation of sustainable freight systems. The
conclusions drawn from the project will be shared through target group communication and
dissemination, covered in WP7 & 8
WP 1 encompasses the project management and the tasks on technical and administrative coordination of the SMARTSET project. It will be led by the city of Gothenburg with the participation of all partners.
In WP2 the objective is to develop business and market based solutions for last mile distribution and to make project viable and self-sustaining after the duration of this project. Market based business models are a crucial part of the development in energy efficient distribution solutions. The SMARTSET project contains a number of different sites with different conditions, from smaller towns to medium and big size cities, from different parts of Europe, with different types of challenges and different potential solutions. All these sites have one thing in common: the need for a sustainable business model that is comprehensive and enables overcoming of existing market barriers
The objective of WP 3 is to develop and make clear what incentives are needed and necessary to steer towards increased use of micro terminals for last mile distribution for energy efficient freight transport.
The objective of the WP4 is to make possible the introduction of clean vehicles in last mile distribution. By distributing with e.g. small electric vehicles, local environment will be drastically improved in terms of greenhouse gas and particle emissions, road safety and congestion
WP5 strives to ensure that the advancements stirred by the project activities feed the discussion as well as knowledge exchange and development with different sectors and on regional, national and international level in order to break the current impasse and mobilise action toward a fully-fledged up-take of optimised city logistics.
WP 6 and will provide means to compare experiences and impacts among the project partners and on the city level.

www.smartset-project.eu page 8 of 49
WP7 Dissemination & Target Group Communication and WP8 EACI Dissemination Activities disseminate the findings of the project with the goal of reaching the main target groups, key actors and potential multipliers. The two work packages will mobilise activities at the EU level but will also support the participating regions in dissemination and communication efforts at the national and local level. In doing so, a variety of target group-tailored tools will be employed (e.g. folder, website, e-updates, press-releases, etc.).
WP 8 will secure the IEE Dissemination activities and make sure that, upon request by the EACI, contribution to common dissemination activities will increase synergy

www.smartset-project.eu page 9 of 49
3. OBJECTIVE OF WP4
The objective of this WP is to facilitate the introduction of cleaner vehicles for last mile
distribution and the use of intermodal transports. By distributing with e.g. small electric
vehicles, local environment will be drastically improved in terms of greenhouse gas and
particle emissions, road safety and congestion. We are interested in any cleaner alternative
to diesel and petrol powered vehicles – apart from electric vehicles it includes hybrids, cargo
bikes and other forms of modal shift.
Investment in the vehicles is NOT included in this project.
FIGURE 2: WP RELATIONSHIPS

www.smartset-project.eu page 10 of 49
This Deliverable D4.2 measures a set of detailed parameters which have been developed on
the basis of D4.1 and later used by stakeholders to evaluate the testing of cleaner vehicles.
These parameters reflect the priorities of stakeholders and tie in with the environment they
operate in. This document provides a common assessment to the degree possible, taking
into account discrepancies in the nature, size, timing and funding of the tests.

www.smartset-project.eu page 11 of 49
4. CLEANER VEHICLE DEMONSTRATORS ACROSS THE
DIFFERENT SMARTSET SITES
This section describes the nature and content of the cleaner vehicle demonstrators
operating at the various SMARTSET sites. Longer descriptions already included in previous
deliverables of the project are copied here, for easy reference.
4.1. VEHICLE TESTS IN A NUTSHELL TABLE 2: VEHICLE TESTS IN A NUTSHELL
BERLIN GOTHENBURG GRAZ NEWCASTLE PADUA ROME
Reporting partner
Technische Hochschule Wildau City of Gothenburg City of Graz
Newcastle University
Interporto Padova
Rome Mobility Agency
Name of test KW-E-CHAIN
STADSLEVERANSEN & FISKELEVERANSEN Bring ME
Coherent Campus Delivery Service Plan
Cityporto Padova
Electric vansharing for urban freight distribution
Cleaner vehicle(s) tested
Fully electric 40t truck TERBERG YT202EV
Fully electric small urban distribution vehicles: Melex 390; Alké XT280E; Alké XT320E, with wagons (1-3t payload)
e-Cargo bike – Christiania P-BOX
Fully electric truck Smith Newton 7.5t
CNG powered IVECO DAILY (5t for express deliveries; 6.5t in the spa area; New service of perishable goods: 5t ; 6.5 T)
3 bimodal electric and diesel: 1 Renault Master + 2 IVECO (675kg payload)
Traditional vehicles being replaced
2 VEHICLES: 40t diesel trucks
Various diesel powered vans
Many customer private cars
Dozens of diesel vehicles - from vans to articulated lorries
Diesel powered vans and trucks
Diesel powered vans and trucks
Source of funding
German Federal funding
Combined: fees; advertising; city funds Private FP7
Mixed: Province; Municipal; Chamber of Commerce
Mixed Environment Ministry and Municipality
Start of test June 2014 November 2012 August 2014 September 2014 April 2004
November 2014
End of test June 2016 None planned None planned None planned None planned July 2015
Overall perception VERY GOOD
SUCCESS - positive perception of the concept, widely copied
MIXED - the volumes are still too low to call it success
POSITIVE – deemed innovative, unique, efficient. Awards won. A BIG SUCCESS
Positive results: reduction in distance and of emissions
Comment
well publicised trial; already resulted in next orders for the vehicle
electricity from renewable resources; clear goal to make it fully self-sustainable
no public support for the operation other than marketing
consolidation effect: 146 EV trips replaced 859 diesel trips
operation ongoing without subsidy, start in 2004 was subsidised
Operation involving UFT Prenestina going on

www.smartset-project.eu page 12 of 49
4.2. BERLIN (FROM D3.2 AND PADUA MEETING PRESENTATION)
KV-E-Chain demonstrates a fully electric, long-haul delivery transport chain of containers and swap
bodies, from a warehouse in North Rhine-
Westphalia via the inner-city Freight Village
“Westhafen” in Berlin, to the final recipients. The
technical requirements of the transported
containers and swap bodies require a full-electric
truck for the “last mile” transportation, with a
permitted gross mass of up to 40 tonnes. In the
frame of KV-E-Chain, the world’s first electric
tractor for container trucking was modified for road
transport and was granted an official road licence.
KV-E-Chain will also show how such large e-trucks
can be integrated into existing urban delivery fleets.
This can result also in adapted business models.
KV-E-Chain deals especially with extra-large e-trucks carrying containers and has therefore a unique
knowledge and experience status, at least in Europe. Also, new know-how regarding the change of
business models can be expected from the project. The Berlin Smartset consortium is part of the KV-
E-CHAIN project, which ensures a knowledge transfer into SMARTSET.
FIGURE 3: THE NEW KV-E CHAIN TRUCK IN OPERATION AT
WESTHAFEN

www.smartset-project.eu page 13 of 49
FIGURE 4: BERLIN ELECTRIC VEHICLE TEST TIMINGS
FIGURE 5: BERLIN ELECTRIC VEHICLE TESTS

www.smartset-project.eu page 14 of 49

www.smartset-project.eu page 15 of 49
4.3. GOTHENBURG (FROM D2.1)
In Gothenburg (Sweden), an urban freight terminal has been active since November 2012, as one of
the measures adopted by the Municipality to improve the efficiency of freight distribution in the city.
The bundle of city logistics solutions included the implementation of restrictive regulation for the city
centre and the shopping area, the development of new infrastructure, the promotion of clean
vehicles, the demonstration/trial of innovative technologies, and monitoring and data collection
from new vehicles.
FIGURE 6: THE STADSLEVERANSEN DELIVERY TRAIN
The “Stadsleveransen” experience started in 2012, with a pilot test, which involved the
establishment of a consolidation centre, located underground beside a loading and parking area in
the city centre, and the use of small electric vehicles to deliver the goods from the UCC to the
retailers (a small group of 8-10 shops). The manager and “owner” of this UCC was a long established,
joint company owned by the retailers, the real estate owners, and the city, which works with
development of the inner city area. The operator was a security company. The financing of the pilot
was provided by EC-projects, the PA, the trade association, six property owners, a municipal energy
company, and the regional municipal administration. In one year, the network of retailers using the
solution expanded to some 200; an additional haulier using electric cargo bikes has been added. An
additional revenue stream of significance was found in the sale of advertising space on the vehicle.
One barrier has been to overcome the long term “routines” established between the retailers and
transport operators involved, but the main challenge is to cover the higher cost of transport entailed
by the facility requirements and the extra handling of goods and equipment.

www.smartset-project.eu page 16 of 49
The main effort by the PA was to establish a durable concertation network, with a lot of different
stakeholders from both the private and public sectors (transport companies, forwarders, retailers,
real estate owners, associations, municipal functions, academy etc.). In order to achieve this, by
exploiting the opportunity given by the EC project START, a freight network was set up which has
been continuously developed, and managed according to strict rules that require the invited
representatives to be engaged in the forum and to attend at least a proportion of meetings in order
to keep their place in the network. The promoters have striven to keep the agenda “interesting”, by
finding different themes, issues and angles of approach to keep members engaged.
Discussions in the network have centred on a solution oriented, quite operative level (hence strategic
issues have been dealt with in a more informed manner). It emerges that the concertation process
between the involved stakeholders requires positive action to keep it alive and that an even level is
needed for discussions, possibly with different networks being established for different scopes, e.g.
operative, operative/strategic or strategic level.
The network in Gothenburg has been well established for several years and is currently considered to
serve its purpose quite well. This may, among other things mentioned above, be a result of a long
process of engaging the “right” people, but is also due to a huge effort to create a “living” forum and
maintain the network to address relevant present and future issues. A relevant challenge for the
future is the capability to drive the enlargement of the network: a need for a more strategic oriented
network has been assessed.
The preparation of the UCC has been enriched by means of a number of activities, such as:
Mapping of businesses in the area (types of businesses, size, goods volumes,
prerequisites for goods handling etc.)
Measuring of traffic volumes and goods flows
Evaluation of different concepts, competitive to the consolidation centre, with
potential to reach similar goals
Stakeholder analysis (how the logistics improvements may be valued, participation in
the process etc.)
Analysis of practical (e.g. vehicle, storage space, equipment) and economic
prerequisites.
All the above-mentioned activities proved to be helpful; however, a deeper analysis of distribution
organisation and planning from the transport companies’ perspective could possibly have helped to
adjust the initial approach.
The Gothenburg experience demonstrates that operational issues are difficult to foresee from the
start; this means that the business model should be planned in a way that allows a smooth resolution
of them, as they emerge.

www.smartset-project.eu page 17 of 49
4.4. GRAZ (FROM D3.2)
The b2c-delivery service ‘bring mE’ is the pilot project in Graz. The preparation works for starting this
service were carried out in spring 2014. Negotiations with the shop-owners showed that further
discussions concerning internal organisation and public relations were necessary. The project
partners (core group) - presented in Deliverable 3.1 (page 87) - therefore decided to postpone the
start of the delivery service to end of August 2014. The start was a press conference on 20nd August
and the service is still running after the second evaluation.
Organisation of the service
The target groups for this service are the clients of city centre shops who do not wish to carry home
their purchases.
The service from the customer’s point of view:
At the shop:
Select goods
Pay for goods
Register for the service (become a ‘client’ of the system; request the delivery)
Obtain a bring mE receipt
Leave the shop
At home:
Wait for the delivery of the parcel at the designated time
Accept and pay for delivery
FIGURE 7: REGISTRATION FORM FOR BOOKING DELIVERIES (MAINLY REPLACED BY ONLINE REGISTRATION)

www.smartset-project.eu page 18 of 49
Figure 8 + 9: POSTER IN PUBLIC TRANSPORT VEHICLES
This poster was published in more than 250 buses and trams, which run through Graz in autumn
2014 and November/December 2015.
The service from the bring mE point of view:
At the time of purchase:
Register the client
Register the delivery
Information of the carrier (Fuhrwerk) via internet
Deposit of goods
Delivery service:
Collect goods from shops
Organise the sequence of deliveries according to the plan (optimised tour)
Deliver to the customer’s address
Collect payment
Involved Stakeholders
The core group has met regularly once per month (depending on the progress of the project) to
decide the next steps.

www.smartset-project.eu page 19 of 49
The shop-owners are seen as the most important group, as without them bring mE could not exist.
Good contact between these shops and the core group is very important. In addition, Holding Graz
Lines, carrier of public transport in Graz, has supported the system by allowing posters to be placed
in its vehicles.
Public relations activities
In order to promote the new b2c-delivery service, a bundle of measures was proposed and
implemented:
Press conference with the Mayor of Graz
Production and distribution of posters in the shops and in public transport vehicles
(September/October 2014 and December 2015)
Production and distribution of flyers
Give-aways for bring mE customers
Website: www.bring-me.at
Information for customers, from the participating shops
Involved shops
Before starting this service the core group contacted many
shops. Some were willing to participate in the service and
welcomed the idea. In the beginning, 20 shops
participated.
The company Kastner & Öhler is the biggest shop in the
city centre. Unfortunately it was not possible to involve
them into the service. They tested bring mE for 4 days and
were happy about the quality of the service. Nevertheless
they found another solution for their deliveries.
Further on shops founded the initiative “ARGE Innenstadt”
to promote shopping in the city centre. Bring mE was
presented at the big presentation of this initiative and will
try to find a possibility to promote its service.
Presently the negotiations started with a big Shopping
Centre with more than 100 shops situated near the city centre.
Public relations - BIG
BIG is the official newspaper of the City of Graz and is
FIGURE 9: BIG PUBLICITY

www.smartset-project.eu page 20 of 49
distributed to all households (nearly 144.000). In May 2014 the service was promoted on the cover
sheet. In July 2014 a special 4-page article informed people about bring mE.
Press conference
On 20nd August, the Mayor of Graz held a press conference about the new delivery service bring mE.
FIGURE 10: NEW SERVICE PRESS CONFERENCE WITH MAYOR OF GRAZ

www.smartset-project.eu page 21 of 49
FIGURE 11: HOME PAGE OF THE BRING ME WEBSITE
Evaluation of the delivery service
In co-operation with the Technical University of Graz, Institute for Technical Logistics (TUG), a
procedure for the evaluation was worked out and executed. In December 2014, the TU held personal
interviews with the shop-owners and also enquired of passers-by, in the pedestrian zone.
The topics of the interviews and the enquiries:
Are you content with the organisation of bring mE?
Do you promote this service?
Do your clients use this service?
Have you heard about bring mE?
The results had been implemented into the system and the service was made simpler for the clients
and the shops, but the price rose from € 6,- to € 7,90 (for an average shipment).
In the meantime the second evaluation took place and the results are:
Involvement of more shops to reach the critical mass for an economic success
PR-activities to spread the service among people / target groups

www.smartset-project.eu page 22 of 49
Working on a “mobile hub”
Besides the b2c delivery service bring mE the feasibility of a logistics hub near the city centre was
one of the objectives of the project. Apart from the discussions of the requirements of such a hub, it
was a possibility to test a “mobile hub”. An operator of city logistics bought an E-van to deliver goods
in the city centre. In a test phase this van was used as a mobile hub, as loaded parcels were
transferred from the van to the E-cargo bike to deliver it to the destinations directly in the
centre/pedestrian zone. The van itself continued its tour to deliver the remaining parcels to the other
addresses. This cooperation is still existing and proved the pros of a E-Cargo bike in the pedestrian
zone/city centre.
FIGURE 12: BIKE ON TOUR DELIVERING GOODS FIGURE 13: PRESENTATION OF THE E-VAN AND E-CARGO BIKE
At the present situation Graz intends to continue the delivery service after April 2016, the end of
smartset project as it is a good way to promote further measures in the field of city logistics.

www.smartset-project.eu page 23 of 49
4.5. NEWCASTLE (FROM D3.2)
The Coherent Campus Delivery and Servicing Plan process in Newcastle University invited the major
retailers and the large institutions: Universities, City Council, NHS (National Health Service), to
understand demand for urban logistics within the context of the city. Following the initial workshop
it was clear that large institutions such as these - in particular Newcastle University - are large freight
generators through attraction. It was decided that this could be a profitable avenue to explore.
Clipper Logistics held a series of discussions with major retail stores within the Newcastle area,
hoping to generate interest for an Urban Consolidation Centre to the West of the city centre (as seen
in the map below of the Scotswood Road site and the City centre).
FIGURE 13: NEWCASTLE COHERENT CAMPUS DELIVERY SERVICE PLAN ZONE
It was widely accepted that this location was not ideal; however the preferred location, further
south, was constrained by political boundaries, since it was located within a different local authority.
For the pilot operation Clipper’s existing Wynyard warehouse was therefore used. Running the
operation from an existing site allowed the project to benefit from only marginal costs, rather than
the full cost of setting up a new UCC located closer to Newcastle. Gary Walker, of Clipper Logistics,
tells us his experience shows “you often need elastic walls” to run consolidation effectively as part of

www.smartset-project.eu page 24 of 49
an existing warehousing operation. An electric truck was purchased – a Smith Electric Newton with
gross weight of 7.5t.
FIGURE 14: THE ELECTRIC LORRY DURING TEST OPERATIONS
FIGURE 15: ROUTE TO NEWCASTLE FROM CLIPPER

www.smartset-project.eu page 25 of 49
FIGURE 16: NEWCASTLE COHERENT CAMPUS TIMINGS
Newcastle University is located within the City, in more than 60 different buildings. In order to make
the delivery operation as efficient as possible, the 227 unique addresses within those buildings were
clustered together into 9 drop-zones (numbered 1 – 9 on the map below). The Clipper despatch
system associates each individual recipient’s name with one of these drop-zones, allowing the driver
manifest to show the items for a drop zone and to complete his round by visiting only those drop-
zones for which there ware parcels on a given day. A vehicle charging point was located at drop zone
7, next to the internal mailroom and located centrally on the main Campus, should the driver need to
charge the vehicle for period of time whilst completing his deliveries on foot. One hour of charging
equates to around 15% of the battery.
Vehicle Delivery
-
19th August 2014
EV Specific Driver Training
-
11th – 13th September
2014
Delivery Route Knowledge
-
15th – 20th September
2014
First delivery made
-
23rd September 2014
500 Parcel's Delivered
-
12th February 2015
Over 1000 Parcel's
Delivered as of today!

www.smartset-project.eu page 26 of 49
FIGURE 1714: NEWCASTLE COHERENT CAMPUS DROP ZONES
The operation of Coherent Campus Delivery Service Plan is currently extended until middle of 2016.
Then, it will be decided how to extend and expand it, incorporating other receivers alongside the
University. It is currently expected that the operation will grow in the city centre of Newcastle but the
location of the consolidation centre will be changed to a one that is closer to the receivers.

www.smartset-project.eu page 27 of 49
4.6. PADUA (FROM D3.2)
A premise had to be established for the Cityporto service implementation, as one of its main
supporter’s is the Municipality of Padua, which is also partially financing the service for the first 4
years of the pilot phase. Another public stakeholder and co-founder is the Chamber of Commerce,
Province of Padua and Veneto Region. In 2003 the City of Padua promoted a feasibility study for the
creation of an urban freight distribution centre and the implementation of a model of city logistics
aiming at reducing the pollutant emissions. Interporto Padova, the Public-Private Company that
manages the local freight village where most of the transport operators are located, was chosen to
manage the service of city logistics, for the neutrality of its relationship with the transport operators
who joined the Cityporto service. The service of freight distribution in the LOW Emission Zone started
in 2004, with two vehicles of 3.5 tonnes powered by CGN; the fleet now comprises 11 means of
transport and almost 55 transport operators who deliver their goods daily to the UDC, where the
freight is consolidated by final destination and loaded into one of the eco-friendly vehicles –
maximising loading capacity and reducing travel km - for last mile distribution.
The Municipality of Padua approved the official traffic regulations in 2003, amended them in 2006,
and again in 2008 (Official regulation 83/2008 is currently in force). These regulate the access of
vehicles to the Limited Traffic Zone. The entry of freight vehicles to the city centre, up to 3.5 tonnes
and up to 6 tonnes if transporting perishable foods (including frozen), is allowed upon payment of a
permission and only during time-windows: on working days, from 08.30 to 09.30, from 13.00 to
16.00, and from 19.00 to 20.00.
For vehicles between these weights transporting other types of goods, a special permission must be
purchased and temporary access to a further limited traffic zone is then allowed.
Access to the LTZ and the pedestrian zone for the 11 vehicles of Cityporto is permitted 24H/day and
they are furthermore allowed use of the reserved lanes for buses and taxis. The use of reserved
parking spaces for loading/unloading operations has been studied but, at the moment, the parking of
Cityporto vehicles inside the LTZ operations is temporarily permitted close to the shops where the
parcels are to be delivered.
The closing of the city centre to everyday traffic, by providing 10 monitored electronic gates at the
strategic city access points, as well as specifically targeting freight traffic by means of 2003, 2006 and
2008 regulations, has been undoubtedly one of the keys to Cityporto’s success. It has also led to a
higher awareness of its utility among city policy makers, because of the reduction of traffic
congestion and pollution in the city centre (emissions of pollutants are constantly monitored). The
result is a smarter, more friendly and usable city centre, as felt by its citizens.
Regarding restrictions/barriers: in the beginning 10 transport operators shared the service and
mostly used the time window allowing the access to the city centre and paid the fee. As time went

www.smartset-project.eu page 28 of 49
on, awareness of the high performance of the service and the benefits resulting from it, has grown
their number to almost 55.
No incentives are given to transport operators for their involvement in the service. The revenues of
the service are the tariffs paid, charged in weight brackets and on the total quantity of freight
delivered to the Urban Delivery Centre (lower tariff for higher quantities).
The UDC is managed as a hub, so goods delivered by the transport operator are stored only for the
time needed to arrange the optimum delivery trip to their final destination, that same day. Two
rounds of travels are organised per single vehicle per day: one in the morning and one in the
afternoon. There are no additional services inside the UDC.
The location of the UDC is in the freight village where most of the transport operators who joined the
service are located, so no additional costs of transport for delivery to Cityporto are incurred.
Furthermore, the UDC is close to the city centre (5 km) and in a strategic position for access from the
city highway and local motorway. A new UDC was inaugurated in February 2015, within an effort to
rationalise the spaces dedicated to the logistics division in the asset management of Interport
Padova SpA. The logistics platform of Cityporto moved from its historical site in Via Nuova Zelanda 8
(since 2004) to a new warehouse owned by Interporto Padova. The new platform of urban
distribution has a surface area equal to the previous one - about 1000 square meters - but it is better
equipped with 12 loading docks (8 specifically dedicated to Cityporto operations), versus four at the
old premises, and is equipped with hydraulic platforms that allow more optimised loading/unloading
operations from customers’ trucks to the UDC and from UDC to e-vehicles. The new location of the
warehouse will also allow the rationalisation of the handling costs of the cooperative into the
activities of Cityporto, which performs logistics operations on behalf of Interporto in a warehouse
alongside the Cityporto UDC. Finally, from February 2015, the vehicle dedicated to the express
deliveries is loaded with goods directly at the courier’s premises, so reducing waiting time and
facilitating a faster departure of the van to the city centre.

www.smartset-project.eu page 29 of 49
FIGURE 15: URBAN FREIGHT TERMINAL OF PADUA
FIGURE 16: LOCATION OF THE TERMINAL
Our UDC distributes mostly parcels and packages. A decision was taken at the beginning of the
service, in 2004, to handle only “easy” goods, to avoid the risks involved in the transport of
perishable goods. Since that time we have become sufficiently experienced in this field of delivery to

www.smartset-project.eu page 30 of 49
take further steps with the service, within the SMARTSET project, including the delivery of a wide
variety of goods, such as express parcels, drinks, and non-perishable foods such as biscuits and
chocolates. Finally, May 2015 sees the start of a test delivery of perishable goods (fresh foods, fruit
and vegetables) from the cold store of a mass-market customer to one of its shops located in the
pedestrian area of Padua city centre.
Cityporto’s fleet of eco-friendly vehicles is composed of 11 vehicles, all CNG powered. Model of vans:
Iveco Daily CGN (nr. 4 gross weight 3,5 Tons + nr. 4 GW 5.0 Tons +; nr. 2 GW 6.5 Tons + nr. 1 GW 6.0
Tons). No electric vehicle is currently part of the fleet due to higher acquisition and maintenance
costs, compared to CNG vans.
FIGURE 17: GOODS BEING DELIVERED IN PADUA
Return transportation is organised and performed by Cityporto, on behalf of a single customer - a
trader and distributor of drinks - using a dedicated curtainsider. When the vehicle delivers drinks to
restaurants and bars, empty bottles are recovered and returned directly to the customer’s
warehouse, without affecting the UDC’s concept of only consolidation and temporary parcel storage
(when a consignee cannot be found or a shop is closed). Increasing return transportation would
require more space and personnel at the UDC, increasing the cost of management. As things stand,
the service is economically balanced; any expansion would require a new business model.
With reference to the overall quantity of goods transported on third party account to the city centre,
Cityporto Padova makes 25 % of the express and 75% of the parcel deliveries.

www.smartset-project.eu page 31 of 49
The City Action plan involves many actors and processes as follows:
Interporto Padova SpA: manager of the freight village and of Cityporto Padova, a brand of the
company’s logistics activities being considered not as a mere business source of profit but as a
service to the city. The service is managed in order to meet the transport operators’ needs and the
key performance indicators are satisfied. Interporto Padova is directly involved with its internal
employees, at different levels:
The Logistics Manager studies the best tariffs to be applied to the different contracts and coordinates
the relationship between the customers (transport operators) and the UDC, together with the
Logistics Operations Associate (LOA).
The LOA coordinates the relationship between the customers and the employees of a cooperative
that manages the handling and the transport of the goods. The cooperative staff is composed of one
Head of Operations - managing consolidation and loading tasks, following criteria of trip optimisation
and maximised vehicle capacities; one clerical person - registering goods inward to the dedicated
Cityporto (tracking & tracing of goods) IT system; and 11 drivers.
All invoices for the services provided to the transport operators are billed by the administrative office
of Interporto Padova SpA.
The IT System used to manage the delivery operation of Cityporto has been directly developed by the
staff of Interporto Padova SpA.
Local administrators: control the respecting of freight traffic regulations and make the necessary
amendments to the regulations in force.
Cityporto customers (transport and logistics operators) are the fuel of the service and make it
possible by delivering their goods to the UDC.
The revenue stream is assured by the contracts signed with the customers for the transport and
logistics (goods consolidation) services.
The income is used to cover the cooperative’s costs for logistics operations (goods consolidation) and
transport operations (including fuel and inurance costs) and for IT equipment (software and
hardware)..
No equipment or warehousing is rented; all are owned by Interporto Padova SpA and included as
part of its direct involvement as quoted in the Framework agreement signed with the Public
Stakeholder, in 2004.
The 11 vehicles are the property of Interporto Padova and were adquired partly by public financing
and partly by our direct financial sources.

www.smartset-project.eu page 32 of 49
The UDC is a 1000 sq m box in a warehouse property of Interporto Padova; rent does not therefore
represent a direct cost to the service. The hypothetical rental has been considered in the business
model built for Cityporto and calculated to get to a truly balanced management of the service.
The plan is to keep on providing the highest quality services to the transport operators; this is
fundamental to maintaining customers. The current fleet is large enough for the calculated quantity
of goods, but we would be interested to test an electric vehicle (if funding can be found) with enough
capacity to substitute the older CNG powered vehicle bought in 2004.

www.smartset-project.eu page 33 of 49
4.7. ROME (FROM D3.2)
The testing of transit points in the city centre, even though only a pilot project, follows the right path
traced by the first phase action lines of the City OR, such as the new regulations about goods delivery
in restricted zones along with interventions to rationalise goods distribution.
The core area of the city centre, named Tridente, represents a more interesting study area for
implementing pilot testing of UFTs. Tridente is an extended zone of absolute priority and
environmental interest that the CA would like to preserve; it is full of commercial points, of different
kinds, requiring a freight service with adequate consistency and frequency.
The new methods of goods distribution in this area will make possible the implementation of a new
Urban Freight Plan in the rest of the city and may be a useful guide for other Italian cities. The
challenge today is to understand the feasibility and real competitiveness and convenience of a UFT,
for all goods sectors.
On this basis, the active presence of the Ministry of Environment, already supporting sustainable
mobility projects in urban areas, made available incentives for funding a pilot project for the
feasibility check of implementing an Urban Freight Terminal (UFT) serving the Rome City Centre. This
activity was also planned in Item B) of the approved city OR 245/11.
This project, named Van-Sharing LOGECO, was already launched in May 2012 and completed its 1st
pilot phase just at the beginning of the SMARTSET project, already described in D3.1.
The pilots aim to serve the Tridente Mediceo of Rome and to finalise the planning of a future logistics
centre to be located near the historic centre, with the following goals:
To store goods from a single courier to be delivered by another courier with e-vehicles
To distribute goods through e-vehicles by the same courier
To allow an operator collect his own goods by e-vehicles provided by the van sharing service
It is monitored by a working committee formed with the involvement of a Logistics Research Centre,
the Union of Entrepreneurs, the Ministry of Environment and Roma Capitale - which is following
developments in terms of UFT feasibility plans including a possible business model to implement it
permanently, according to the SMARTSET objectives.
There are periodic meetings to discuss the incentive system and evaluation schemes for the
implementation of the UFT.
Activities so far have involved the creation of the first pilot of the system for distribution of goods by
electric vehicle and, from the end of 2014, the start of the Pilot 2 phase, with new activities
concerning urban freight distribution.

www.smartset-project.eu page 34 of 49
This second pilot phase presents three testing scenarios (with only the 1st relevant for WP4):
First scenario – storage point
Delivery of goods from production depots in the surrounding industrial context
collected into UFT before delivering to the city centre
Using 3 bimodal vehicles (electric and diesel engines used alternately): 1 Renault
Master + 2 IVECO
UFT composed of 500 sq m storage located in via Prenestina, via Longoni (Rome
outskirts - 7 km from the centre) with 2 shared operators.
An IT company involved in the development of the sharing service
In the first two months since the start of this pilot scenario, 766 deliveries (about 80.600 kg) were
carried out, with an initial daily delivery of 30/40 kg, to be increased during the pilot.
FIGURE 18: URBAN FREIGHT TERMINAL IN VIA PRENESTINA

www.smartset-project.eu page 35 of 49
FIGURE 19: CITYLOG VEHICLES IN ROME
The vehicles involved in the first scenario in the Old Town were hybrid diesel-electric, 3,5 tonnes capacity, used
for large loads, using diesel engine outside the Tridente Area (where they are used in the electric mode)
In the early months of 2015, some areas
located within the park of Villa Borghese and
the Terminal Gianicolo were used as transit
points, with the project’s full-electric vehicles.
FIGURE 20: INSIDE THE UFT ROME

www.smartset-project.eu page 36 of 49
5. ASSESMENT OF CLEANER VEHICLES TESTS /
DEMONSTRATORS
This section describes the results of self-assessment of performance of cleaner vehicles used
in the live demonstrators across the different SMARTSET sites and the tests themselves,
using different parameters selected by stakeholders in the course of the project (for
elaboration of parameters see D4.1 Development of common assessment parameters and
methodology for test of clean vehicles). The Partners were asked to select a period under
scrutiny so that their answers are based on events, figures and experiences from a specific
period of time. Every effort was made to make this fully representative of the test in its
entirety, and even though it is possible that for a different period, results could be different
but the differences are deemed negligible.
For each of the parameters, partners were asked to assess the failure or success of the
vehicle/test in a given aspect by selecting a digit ranging from 0 (absolute failure/ lowest
level of satisfaction) to 5 (spectacular success/full satisfaction), with an option of selecting
“not applicable” (which will be explained on a case to case basis). The simplified
interpretation of the scores is that 0-2 are negative and 3-5 are positive with 2&3 being
considered “in the middle”.
5.1. PARAMETERS RELATING TO THE VEHICLE’S OVERALL PERFORMANCE
Parameter: BERLIN GOTHENBURG GRAZ NEWCASTLE PADUA ROME reliability (time out of service)
5 4 5 4 4 4 operational range (real-life)
4 5 5 5 5 4 procurement/depreciation cost
2 3 4 4 5 4
The tests use quite different vehicles, ranging from a 40t electric truck in Berlin, through a
7.5t electric truck in Newcastle, methane-powered vans in Padua, small urban distribution
vehicles in Gothenburg and e-cargo bikes in Graz. With the exception of Padua – which uses
an established technology – all other vehicles are relatively new models, or even a prototype
(Berlin). It is therefore quite remarkable that all these vehicles showed good-to-excellent
reliability, on par with the established CNG technology. That is a promising sign for the
cleaner vehicle technologies.
www.smartset-project.eu page 37 of 49
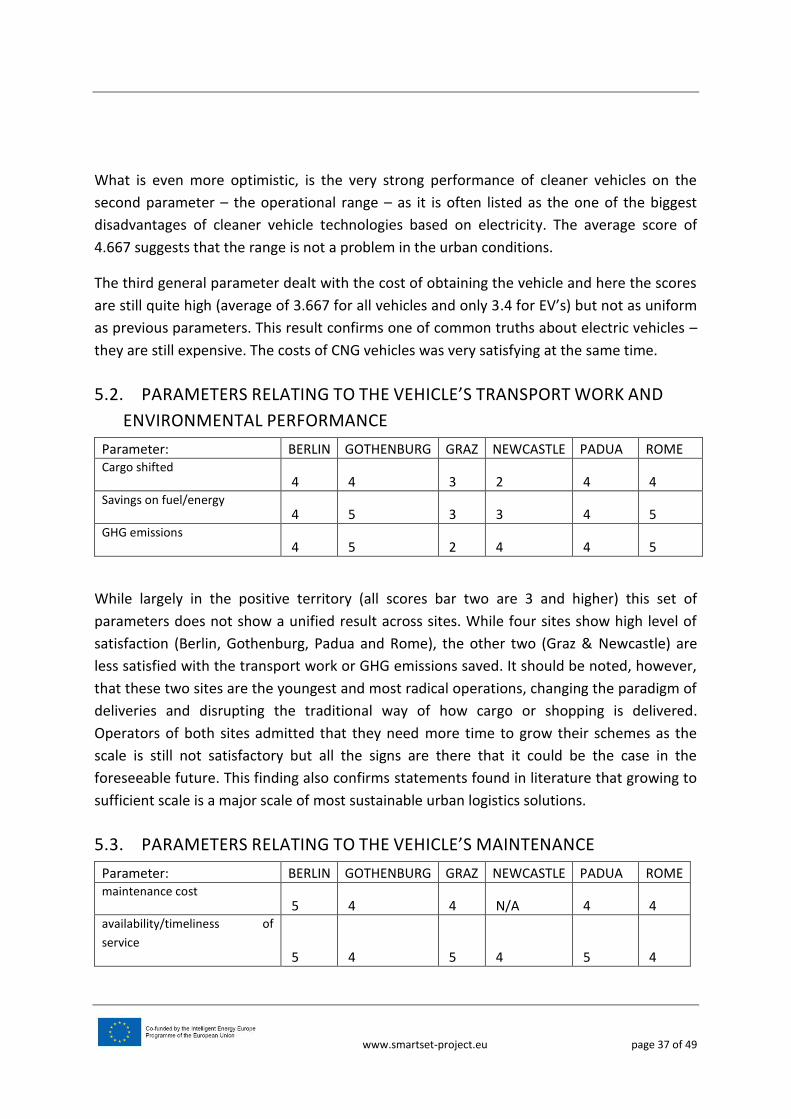
What is even more optimistic, is the very strong performance of cleaner vehicles on the
second parameter – the operational range – as it is often listed as the one of the biggest
disadvantages of cleaner vehicle technologies based on electricity. The average score of
4.667 suggests that the range is not a problem in the urban conditions.
The third general parameter dealt with the cost of obtaining the vehicle and here the scores
are still quite high (average of 3.667 for all vehicles and only 3.4 for EV’s) but not as uniform
as previous parameters. This result confirms one of common truths about electric vehicles –
they are still expensive. The costs of CNG vehicles was very satisfying at the same time.
5.2. PARAMETERS RELATING TO THE VEHICLE’S TRANSPORT WORK AND
ENVIRONMENTAL PERFORMANCE
Parameter: BERLIN GOTHENBURG GRAZ NEWCASTLE PADUA ROME Cargo shifted
4 4 3 2 4 4 Savings on fuel/energy
4 5 3 3 4 5 GHG emissions
4 5 2 4 4 5
While largely in the positive territory (all scores bar two are 3 and higher) this set of
parameters does not show a unified result across sites. While four sites show high level of
satisfaction (Berlin, Gothenburg, Padua and Rome), the other two (Graz & Newcastle) are
less satisfied with the transport work or GHG emissions saved. It should be noted, however,
that these two sites are the youngest and most radical operations, changing the paradigm of
deliveries and disrupting the traditional way of how cargo or shopping is delivered.
Operators of both sites admitted that they need more time to grow their schemes as the
scale is still not satisfactory but all the signs are there that it could be the case in the
foreseeable future. This finding also confirms statements found in literature that growing to
sufficient scale is a major scale of most sustainable urban logistics solutions.
5.3. PARAMETERS RELATING TO THE VEHICLE’S MAINTENANCE
Parameter: BERLIN GOTHENBURG GRAZ NEWCASTLE PADUA ROME maintenance cost
5 4 4 N/A 4 4 availability/timeliness of
service 5 4 5 4 5 4

www.smartset-project.eu page 38 of 49
availability of spare parts 5 3 N/A 4 5 4
The cost and availability of maintenance are crucial factors for any logistics operation, as any
problems in this department can result in delays, penalties or necessity to resort to
contingency measures that are costly, complicated or less sustainable. This is particularly
pronounced in the case of cleaner vehicle trials, as typically there is no replacement vehicle
available at short notice or at all. SMARTSET operators have reported that in case of a
cleaner vehicle breakdown they had to deploy a traditionally powered (diesel) vehicle to do
the work. In the case of cleaner vehicle demonstrators this is more than detrimental. Luckily,
the reports are mostly optimistic with many 4s and 5s, just one 3, no negative scores and
two N/A (not applicable) answers where an external partner was in charge of this aspect and
data was not available. The average score for the whole segment is 4.31, with the average of
4.5 reported for timeliness of service which means that although the vehicles are often
irreplaceable, they are repaired quickly enough for the operation to be resumed. Given that
many early studies of EV trials reported this area as a major point of concern this finding is
very welcome indeed.
5.4. PARAMETERS RELATING TO THE TEST’S FIT WITH INCENTIVES, SOURCES
OF EXTERNAL REVENUES AND POLICIES
Parameter: BERLIN GOTHENBURG GRAZ NEWCASTLE PADUA ROME Taking advantage of public support measures 3 5 0 3 4 5 Additional sources of revenue N/A 3 N/A N/A N/A 4 Fit with wider policy 4 5 5 5 4 4
This group of parameters evaluates relation of the tests to external environments (economic
and policy-related) and as such is an evaluation of these externalities as much as it is of the
tests themselves. The picture is quite heterogeneous.
The first parameter evaluated if the trial was able to take advantage of public support
measures, such as purchase incentives, company car taxation, CO2 taxation, green public
procurement, access to bus (or no car) lanes, privileged entry to access restriction schemes,
reduced (or free) parking, or support to fuelling infrastructure. Rome and Gothenburg were
very positive, followed by Padua – these scores result from the existence in these cities of
Limited Environmental Zones, where demonstrator vehicles had privileged access due to
www.smartset-project.eu page 39 of 49
their environmental profile. This is not the case in Berlin and Newcastle but the answers are
still cautiously positive. The opposite holds true for Graz, where some form of intervention
seems necessary as currently polluting diesel-powered delivery vehicles can enter the city
centre (in specified time windows) but all bikes (including cargo bikes deployed in the
demonstrator) are prohibited from certain pedestrianised shopping streets.
The second parameter measured availability of additional revenue from advertising on the
vehicles themselves. While this seems like a logical goal to pursue, given the fact that
vehicles are clearly visible to the public and their “greener” credentials are fairly evident, the
reality of the demonstrators is such that vehicles were often purchased with subsidies which
determined the livery on the vehicles making advertising impossible at this stage. Operators
of all 4 sites which had this issue admit that they will seek advertising revenue if the
conditions change. The remaining two remain (cautiously) optimistic as the revenue streams
are there but their values could be further improved.
The last parameter in this segment measured if the demonstrators found a fit with existing
policies aiming at increasing sustainability of transport operations in cities (such as
Sustainable Urban Mobility Plan). The answers are clearly very positive with a strong 4.5 as
average.
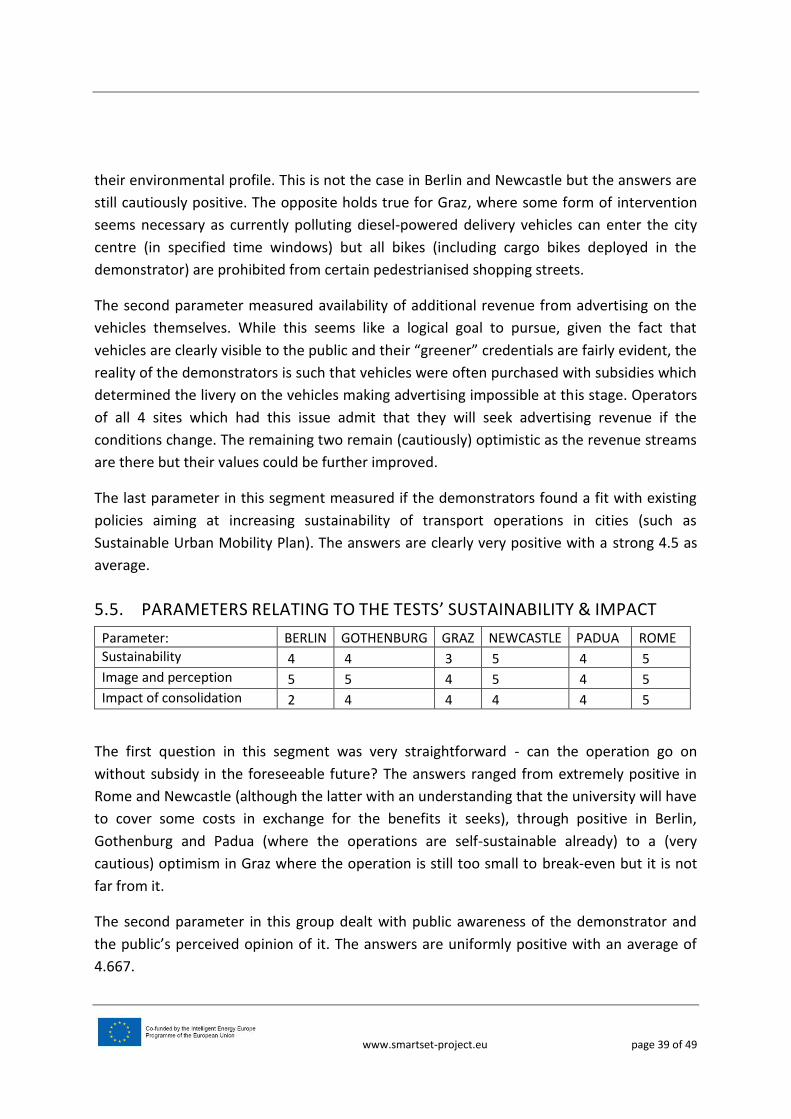
5.5. PARAMETERS RELATING TO THE TESTS’ SUSTAINABILITY & IMPACT
Parameter: BERLIN GOTHENBURG GRAZ NEWCASTLE PADUA ROME
Sustainability 4 4 3 5 4 5
Image and perception 5 5 4 5 4 5
Impact of consolidation 2 4 4 4 4 5
The first question in this segment was very straightforward - can the operation go on
without subsidy in the foreseeable future? The answers ranged from extremely positive in
Rome and Newcastle (although the latter with an understanding that the university will have
to cover some costs in exchange for the benefits it seeks), through positive in Berlin,
Gothenburg and Padua (where the operations are self-sustainable already) to a (very
cautious) optimism in Graz where the operation is still too small to break-even but it is not
far from it.
The second parameter in this group dealt with public awareness of the demonstrator and
the public’s perceived opinion of it. The answers are uniformly positive with an average of
4.667.

www.smartset-project.eu page 40 of 49
The last parameter in this section measured the impact of consolidation, understood as
reduced number of vehicles in the street. The answers were positive (average of 3.83) but
weighed down by the negative answer from Berlin, where consolidation effect was never
expected as the test involved replacing one polluting vehicle with one non-polluting one. If
you disregard Berlin, the average rises to 4.2 which is a good result, and shows that the
number of vehicles in the streets is being reduced on top of reducing emissions. This is very
important as it is imaginable that reduced payload of cleaner vehicles could lead to the
opposite effect, creating a trade-off between lowered emissions and congestion.

www.smartset-project.eu page 41 of 49
6. DESCRIPTIVE ASSESMENT OF THE DEMONSTRATION
OPERATIONS
This section provides an opportunity for the stakeholders to evaluate the success of their live
demonstrators at different SMARTSET sites with free text rather than numeric values. The
Partners were asked to give their views on a number of aspects which are crucial for
evaluating the demonstrators in relation to the business models developed.
6.1. ASSESSMENT OF KEY SUCCESS FACTORS
The quantitative assessment in section 5 of this document has clearly shown that all
SMARTSET vehicle tests / demonstrators were successful. We have asked their operators
which factors contributed to their success the most.
BERLIN Open minded operator, not afraid to experiment with innovative ideas.
Federal funding for the acquisition of the vehicle.
Close cooperation with the vehicle manufacturer Terberg.
GOTHENBURG The scheme works directly with transport operators;
The vehicles are small enough to blend in a pedestrian zone – appreciated by the community;
True Zero emission vehicles (electricity from renewable sources)
GRAZ The scheme offers clear benefits for end users (shopping without having to carry the goods); benefits for shops (value added on top of the purchase); benefit for the city - promoting gentle mobility (walking, public transport)
NEWCASTLE The use of Logical Framework Analysis workshop at the beginning of the process, which identified the stakeholders who not only had interest but also mandate and access to resources. This process at the beginning insured that only these stakeholders collectively will be able to design and monitor interventions to support clean urban logistics. This process identified not just stakeholders who could collectively deliver but also identified those who could play no effective role either due to lack of interest or appropriate mandate or resources (for example transport operators in the Tyne and Wear region have no mandate to change the pattern of logistics activity since their core business activity is meeting the needs of their customers, their interest in clean urban logistics has to be secondary);
The project that was developed using the LFA workshop was based on the added value for the institution of Newcastle

www.smartset-project.eu page 42 of 49
University of reducing vehicle movement on site. This institutional need constituted value. This value could then be generated and paid for in a business model where the institution controls inbound logistics;
Involvement of an entrepreneurial logistics company willing to invest a lot of money;
NU’s Estates and Procurement managers willing to change organisational policy;
Coherent methodology for implementation based on an over a decade of EU funded research in the field.
PADUA The kind of clean fuel chosen and capacity of vehicles that are suited to geographical area and urban characteristics of the city of Padua and satisfy the performance required by the customers of the services supplied by Cityporto
ROME The consolidation through UFT has determined the reduction of mileage of the distribution system, reducing the number of vehicles and the last mile distances. Traffic reduction results in decrease in fuel consumption and therefore, for vehicles with internal combustion engine, CO2, and NOx reduction. For electric vehicles, the saved emission have been calculated for micrologistic service.
While the schemes themselves differ from one another substantially, a common picture of
the main success factors emerges, which includes:
having a good value proposition to the users,
good planning of both implementation and operation,
the sheer fact that vehicles are cleaner,
involvement of the right stakeholders, with courage, will, mandate and resources,
selecting the right vehicles in terms of propulsion, size, capacity and cost.
6.2. ASSESSMENT OF MAJOR OBSTACLES IN IMPLEMENTATION
BERLIN No vehicle of the necessary size existed, when the project started. Also the registration of the vehicle as a street legal truck, took some development effort and testing (mainly of the break-systems). But altogether, close cooperation with Terberg, and discussions with the authorities in Berlin, helped overcome all of these obstacles.
GOTHENBURG Major difficulties turned out to be:
to involve missing stakeholders in the project (real estate owners, transport companies),

www.smartset-project.eu page 43 of 49
to reach financial sustainability
to get paid. GRAZ Major difficulties turned out to be:
reaching critical mass;
the local regulation stating that bikes (including cargo ones) are
not allowed in the pedestrian zone
NEWCASTLE Major difficulties turned out to be:
market failure to deliver clean urban logistics vehicles of 7.5t and greater;
location of the appropriate logistics space was a potential problem; the city council wished to develop consolidation services but due to administrative boundaries insisted that such a facility would be in Newcastle (wrong side of the river) - this shows the need for large regional initiatives rather than smaller city based ones – ironically, you need the very local to solve the problem but you need to fit it into a bigger network
PADUA The testing of the vehicles has not had any technical obstacles. The obstacles can be referred to a wider implementation of the service due higher costs of acquisition of the vehicles and global managing of the Cityporto scheme compared to tariffs which have not been increased in recent years (due to a continuing economic crisis).
ROME Despite the reduction of the category vehicles emission (Euro 5), some emissions exceed the standard, due to the frequent stop and go and low commercial speed.
High cost of vehicles (hybrid and electric).
For specific logistic chains, the load capacity in volume and weight of the van is not sufficient. It is necessary to involve the builders to design higher load capacity vehicles, in order to optimize loads and deliveries.
The obstacles observed (and overcome) by the proponents of the demonstration schemes
are quite specific to their local situations as it is evidenced in the table above. However they
can be categorised into two major groups:
regulatory limitations
market issues which can be further divided into two distinct subgroups:
o vehicle availability
o business model/financial sustainability
www.smartset-project.eu page 44 of 49
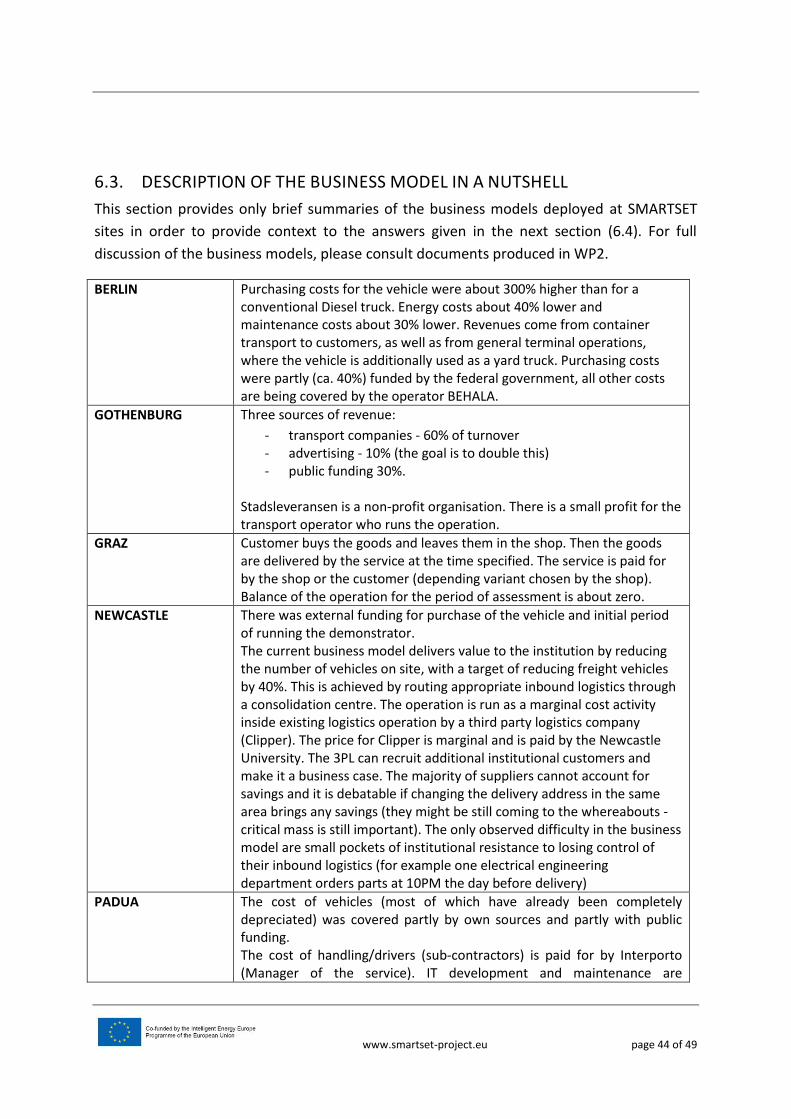
6.3. DESCRIPTION OF THE BUSINESS MODEL IN A NUTSHELL
This section provides only brief summaries of the business models deployed at SMARTSET
sites in order to provide context to the answers given in the next section (6.4). For full
discussion of the business models, please consult documents produced in WP2.
BERLIN Purchasing costs for the vehicle were about 300% higher than for a conventional Diesel truck. Energy costs about 40% lower and maintenance costs about 30% lower. Revenues come from container transport to customers, as well as from general terminal operations, where the vehicle is additionally used as a yard truck. Purchasing costs were partly (ca. 40%) funded by the federal government, all other costs are being covered by the operator BEHALA.
GOTHENBURG Three sources of revenue:
- transport companies - 60% of turnover - advertising - 10% (the goal is to double this) - public funding 30%.
Stadsleveransen is a non-profit organisation. There is a small profit for the transport operator who runs the operation.
GRAZ Customer buys the goods and leaves them in the shop. Then the goods are delivered by the service at the time specified. The service is paid for by the shop or the customer (depending variant chosen by the shop). Balance of the operation for the period of assessment is about zero.
NEWCASTLE There was external funding for purchase of the vehicle and initial period of running the demonstrator. The current business model delivers value to the institution by reducing the number of vehicles on site, with a target of reducing freight vehicles by 40%. This is achieved by routing appropriate inbound logistics through a consolidation centre. The operation is run as a marginal cost activity inside existing logistics operation by a third party logistics company (Clipper). The price for Clipper is marginal and is paid by the Newcastle University. The 3PL can recruit additional institutional customers and make it a business case. The majority of suppliers cannot account for savings and it is debatable if changing the delivery address in the same area brings any savings (they might be still coming to the whereabouts - critical mass is still important). The only observed difficulty in the business model are small pockets of institutional resistance to losing control of their inbound logistics (for example one electrical engineering department orders parts at 10PM the day before delivery)
PADUA The cost of vehicles (most of which have already been completely depreciated) was covered partly by own sources and partly with public funding. The cost of handling/drivers (sub-contractors) is paid for by Interporto (Manager of the service). IT development and maintenance are

www.smartset-project.eu page 45 of 49
performed by Interporto’s internal staff. The Urban Distribution Centre is a property of Interporto. Revenues: Customers pay the tariffs for the services provided. Balance: yes, in profit
ROME The introduction of the service resulted in the reduction of management costs, despite the breakage of loads. This was observed because of the increase in utilisation time and the volume of the vehicles This scheme is very useful for just in time deliveries.
6.4. ASSESSMENT OF THE BUSINESS MODEL’S POTENTIAL FOR
IMPROVEMENT
This section describes the modifications the SMARTSET partners would like to introduce to
the business models of the demonstrators, described briefly in 6.3 above.
BERLIN The business model has already been sound and well working with conventional diesel trucks, so there is no real need for improvement. As a general rule: operators are not willing to use electric vehicles differently than conventional vehicles, so that specialised business models are usually not successful.
GOTHENBURG Considering increasing price as they are low. This will make the operation self-sustainable.
GRAZ More volume, more shops.
NEWCASTLE The business model seems optimal.
PADUA Saving of costs (lower costs of subcontractors or part of the services provided by internal staff, such as support in the UDC); Increasing of number of deliveries performed; Implementing new services;
ROME Integrating the testing scenarios in the freight strategy plan as recommended by Mobility Master Plan
The modifications to business models proposed above are none, marginal or incremental,
with the exception of Padua, which is the demonstrator with the longest history and would
like to see a certain shift in responsibilities. Other partners are happy with the set-up – who
pays for what – and in some cases only wish the volume, the tariffs or geographic scope of
the operation to be extended. However it has to be stressed that their operations have been
running for a relatively short time and with a longer history of operations, more necessary
improvements to the business models may become apparent.

www.smartset-project.eu page 46 of 49
6.5. ASSESSMENT OF THE DEMONSTRATORS’ TRANSFERABILITY POTENTIAL
In this section, partners expressed their opinions on what basic conditions would have to be
met in order to implement their scheme elsewhere.
BERLIN Lower purchasing costs for the vehicle, either through funding or through a long-term price decrease. The biggest factor is the cost of batteries so any progress in this area would be most welcome.
GOTHENBURG Limited Environmental Zone of some kind is necessary.
GRAZ All that is needed is a pedestrianised shopping district with good access by gentle mobility.
NEWCASTLE Strong institutional need for added value that is not necessarily to do with the delivery cost on the final invoice and the willingness to use procurement policy to achieve that value; since the public sector (universities hospitals schools etc.) often have corporate values that are not wholly driven by the bottom line and generate significant volumes of inbound logistics in city centres, this is then a more productive route to achieve clean urban logistics than those that focus on transport operators city government and shippers.
PADUA Support of Municipality and other public stakeholders; Neutrality of operator with respect to other players in the market.
ROME Identify the role of administration, logistics operators and stakeholders involved and the strategy toward a sustainable urban freight distribution.
Most SMARTSET sites reported above that in order to replicate their solution in a another
location, there is a clear need for the regulatory framework that makes such schemes
possible and/or attractive in terms of value to the market oriented players. An access
restriction scheme was overtly mentioned by 1/3 of respondents. Half of the demonstrator
operators listed the involvement of the right stakeholders, including the public ones and
receivers. Only Berlin (with the most expensive vehicle) mentioned the prohibitive cost of
the tuck to be a factor hindering transferability.
6.6. DESCRIPTION OF THE FUTURE PLANS FOR THE DEMONSTARTORS
Since the project is drawing to a close it is vital to understand what is happening with cleaner vehicle
trials/demonstrators in the future, after the project is finished. Apart from the scientific work, the incentives
and regulations, the extended life of the demos could be the true legacy of this project. Below are partner’s
plans regarding the cleaner vehicle trials.

www.smartset-project.eu page 47 of 49
BERLIN The truck will be operating well beyond the end of the project. BEHALA has purchased the vehicle and is planning on using it within its fleet.
GOTHENBURG Adding volume – new vehicle is coming – a new street to be included. Also to include transport operators with smaller volumes than the ones already involved.
GRAZ There are plans to extend it, include more shops, and intensify the promotion.
NEWCASTLE There are plans to bring more customers. The consolidation centre should move to a closer location. The number of suppliers involved is to be ramped up. The operating costs should go down and the university expects to sign a longer contract (3-5 years) with the operator. Due to its originality and paradigm-shifting nature, it is very likely that this scheme will be copied throughout Europe or even become a policy standard for achieving cleaner urban logistics.
PADUA Implementing new services (i.e. management of city point of collection of the goods for the e-commerce products) and widening of the distribution of perishables goods to new customers
ROME There is a plan to create a network of urban freight terminals not only close to LTZ, but also in semi-central areas, with EV charging points.
It is clearly a big success of the project that none of the vehicle demonstrators has ended
prematurely or is finishing with the end of the project. They all remain operational and have
plans to expand further.

www.smartset-project.eu page 48 of 49
7. CONCLUSIONS
This document reflects self-assessment of 6 SMARTSET demonstrations of cleaner vehicles
for freight.
The first part of the assessment had a quantitative character. The partners evaluated their
tests on 15 parameters (resulting from D4.1), using a scale from 0 (failure) to 5 (spectacular
success). If one disregards the 6 N?A (not applicable scores) the average across all 6 sites and
all 15 parameters is 4.1 – which is a very positive result.
The parameters relating to cleaner vehicles’ reliability and range showed very strong positive
results but the costs of purchasing them yielded mixed results, confirming the overall
perception that freight vehicles propelled by electricity (at 200-300% the price of equivalent
diesel vehicle) are still too expensive.
The parameter reflecting the degree to which the amount of cargo moved during the tests
matched the expectations delivered mixed results, with none of the tests scoring 5. Slightly
better was the energy&environmental performance with some 5s and only one 2 as the
lowest – this set of parameters confirms that the scale of cleaner vehicles operations is
somewhat disappointing while the energy and Emissions profiles are appreciated.
Cost, availability and timeliness of service and maintenance for the vehicles scored rather
high, doing away with a myth that low production volume cleaner vehicles are a technical
and operational risk – combined with high reliability scores this is a very good prognostics
for the future.
Taking advantage of public support schemes for cleaner vehicles was evaluated rather low in
most sites – this is a result of more schemes being focused on passenger vehicles than
freight ones, clearly there is room for improvement in Europe. And it is worth noting that
this negative sentiment appeared despite the fact that all tests were in line with strategic
policy document for the sector.
Evaluating financial sustainability potential brought about mostly very positive results and
the publicity effects of demonstrators were even better. The results of measuring the
consolidation effect were slightly worse but still positive.
The second part of the document provided qualitative self-assessment of the present and
the future of the 6 demonstrators. The most striking findings are:

www.smartset-project.eu page 49 of 49
- it is crucial to plan the test well, select the best vehicle(s) for the situation and
involve relevant stakeholders
- there are still regulatory limitations hindering such tests and the market for cleaner
vehicles and services provided with their assistance is still volatile
- the business models developed in SMARTSET are evaluated positively and need to be
extended rather than substantially modified
- the tests could be easily replicated elsewhere in Europe, providing there is support of
public stakeholders and/or an access restriction scheme in place
- all cleaner vehicle tests are to be extended beyond the life of SMARTSET.


![[Whitepaper] From Media Relation to Influencer Relation](https://img.pdfslide.us/doc/110x75/55c829e3bb61eb924d8b46ef/whitepaper-from-media-relation-to-influencer-relation.jpg)