Embed Size (px)
Citation preview
Serpil Guran, Ph.D., Director
Dave Specca, Assistant Director
Rutgers EcoComplex
NJBPU Biopower Working Group Meeting , 9/28/2015, EcoComplex
Assessment of Biomass Energy Potential
in
New Jersey

Outline
• Need for an Assessment
• Findings– Biomass Feedstocks
– Technology Assessment
– GHG Emissions Reduction Potential
– Policy recommendations
2
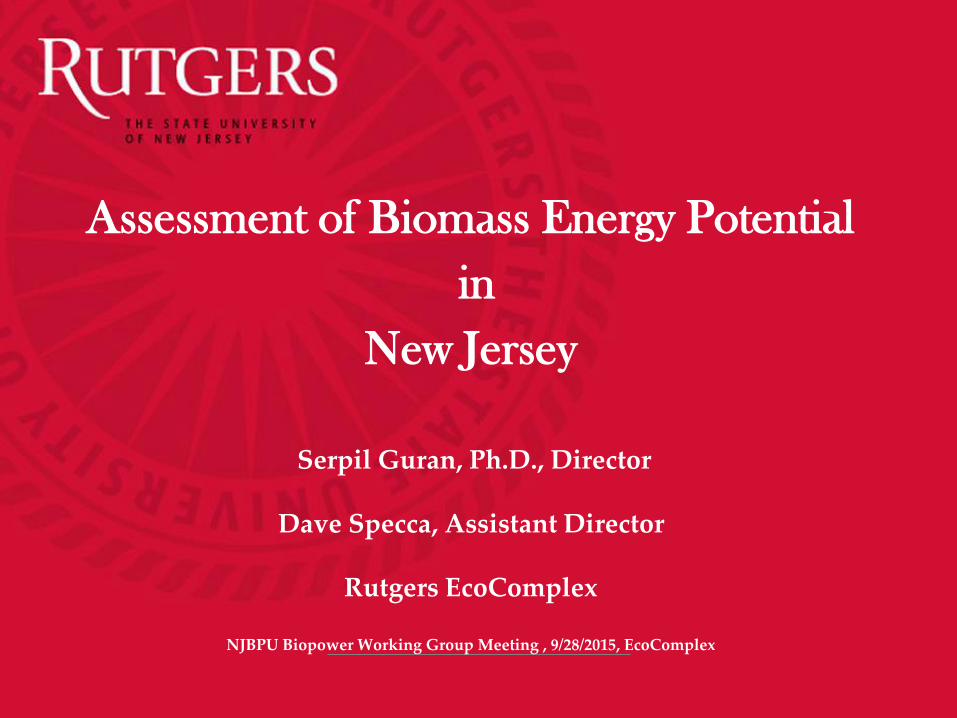
Biomass-to-Bioenergy Supply Chain
Feedstock Supply: Produce large, sustainable supplies of regionally available biomass and implement cost-effective biomass feedstock infrastructure, equipment, and systems for biomass harvesting, collection, storage, preprocessing, and transportation Bioenergy Production: Develop and deploy cost-effective, integrated biomass conversion technologies for the production of biofuels and bioproducts Bioenergy Distribution: Implement biofuels distribution infrastructure (storage, blending, transportation—both before and after blending and dispensing) Bioenergy End Use: Assess impact of fuel blends on end-user vehicles.
https://www1.eere.energy.gov/bioenergy/pdfs/mypp_may_2013.pdf. 3

4
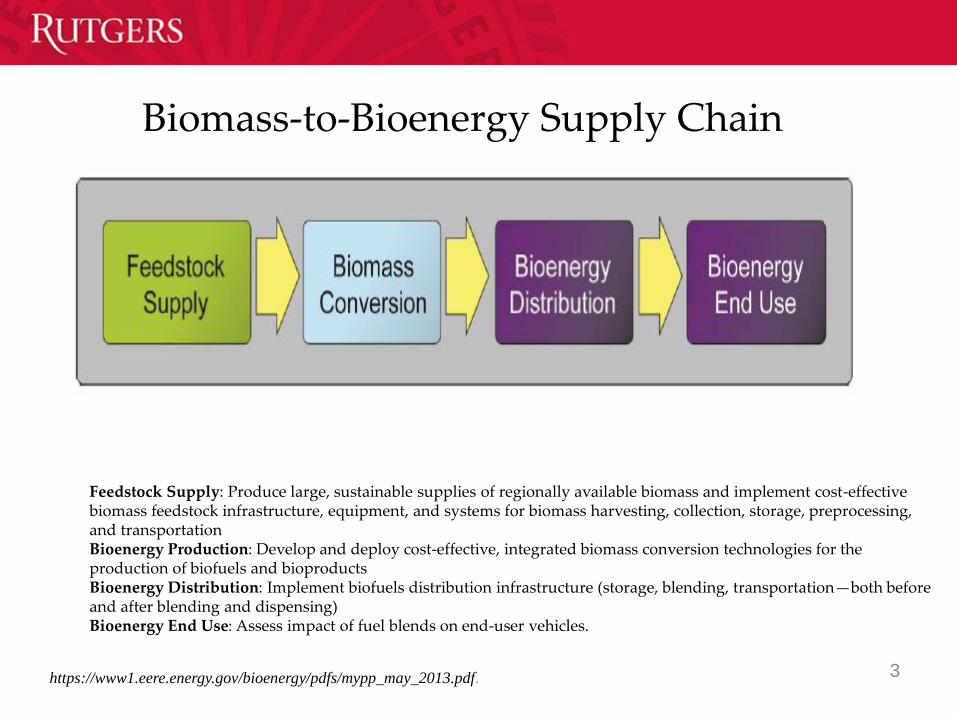
2.0 Project Team• Margaret Brennan, Ph.D. Associate Director, NJAES
• Serpil Guran, Ph.D. Director, Rutgers EcoComplex
• David Specca Assistant Director, Rutgers EcoComplex
• Jacqueline Melillo Senior Program Manager, OVPED
• Brett Cowan Intern, Rutgers EcoComplex
• Chris Sipos Intern, Rutgers EcoComplex
Version 2.0 is an updated and enhanced version of the 2007 NJAES study.1
1Brennan, Margaret, David Specca, Brian Schilling, David Tulloch, Steven Paul, Kevin Sullivan, Zane Helsel, Priscilla Hayes, Jacqueline Melillo, Bob Simkins, Caroline Phillipuk, A.J. Both, Donna Fennell, Stacy Bonos, Mike Westendorf and Rhea Brekke. 2007. “Assessment of Biomass Energy Potential in New Jersey.” New Jersey Agricultural Experiment Station Publication No. 2007-1. Rutgers, The State University of New Jersey, New Brunswick, NJ.
©2015 New Jersey Agricultural Experiment Station 5
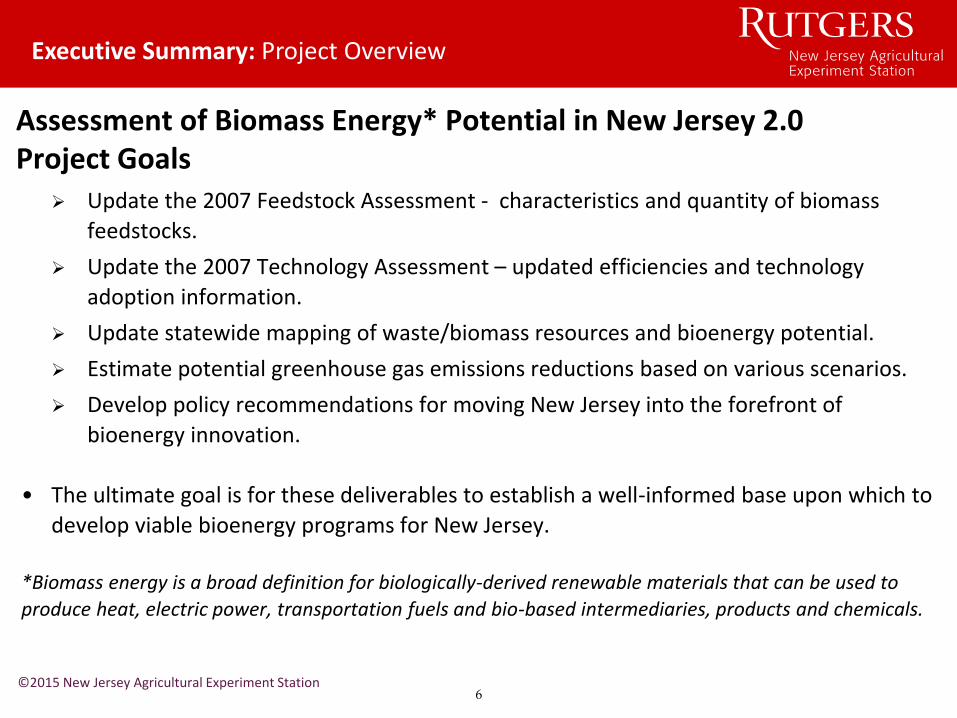
Assessment of Biomass Energy* Potential in New Jersey 2.0Project Goals
Update the 2007 Feedstock Assessment - characteristics and quantity of biomass
feedstocks.
Update the 2007 Technology Assessment – updated efficiencies and technology
adoption information.
Update statewide mapping of waste/biomass resources and bioenergy potential.
Estimate potential greenhouse gas emissions reductions based on various scenarios.
Develop policy recommendations for moving New Jersey into the forefront of
bioenergy innovation.
• The ultimate goal is for these deliverables to establish a well-informed base upon which to
develop viable bioenergy programs for New Jersey.
*Biomass energy is a broad definition for biologically-derived renewable materials that can be used to
produce heat, electric power, transportation fuels and bio-based intermediaries, products and chemicals.
Executive Summary: Project Overview
©2015 New Jersey Agricultural Experiment Station6
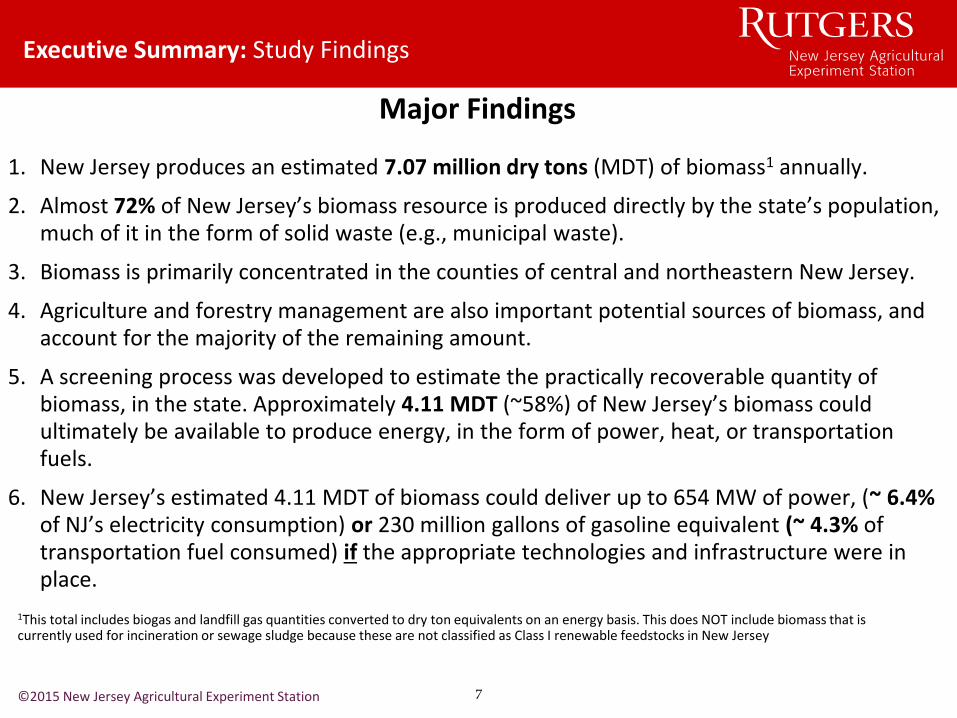
Major Findings
1. New Jersey produces an estimated 7.07 million dry tons (MDT) of biomass1 annually.
2. Almost 72% of New Jersey’s biomass resource is produced directly by the state’s population, much of it in the form of solid waste (e.g., municipal waste).
3. Biomass is primarily concentrated in the counties of central and northeastern New Jersey.
4. Agriculture and forestry management are also important potential sources of biomass, and account for the majority of the remaining amount.
5. A screening process was developed to estimate the practically recoverable quantity of biomass, in the state. Approximately 4.11 MDT (~58%) of New Jersey’s biomass could ultimately be available to produce energy, in the form of power, heat, or transportation fuels.
6. New Jersey’s estimated 4.11 MDT of biomass could deliver up to 654 MW of power, (~ 6.4%of NJ’s electricity consumption) or 230 million gallons of gasoline equivalent (~ 4.3% of transportation fuel consumed) if the appropriate technologies and infrastructure were in place.
Executive Summary: Study Findings
©2015 New Jersey Agricultural Experiment Station
1This total includes biogas and landfill gas quantities converted to dry ton equivalents on an energy basis. This does NOT include biomass that is currently used for incineration or sewage sludge because these are not classified as Class I renewable feedstocks in New Jersey
7

Executive Summary: Practically Recoverable Biomass
The results of this process indicate that approximately 4.11 MDT (~58%) of New Jersey’s biomass could ultimately be available to produce energy in the form of power, heat, or transportation fuels.
Total Theoretical
Biomass Potential =7.07 MDT
Practically Recoverable
Biomass Potential = 4.11MDT
Co
llec
tio
n
So
rtin
g
Alt
ern
ativ
e U
se
2,139,786 DT230,143 DT592,513 DT
Note: This screening process is preliminary and would require considerably more analysis to reach any final conclusions. The screening analysis has been incorporated into the database, and provides flexible “scenario analysis” capabilities for the user.
Is/Can the Biomass Be Collected?
Is the Biomass Sortable (or is Sorting Needed)?
Does the Biomass Have a Valuable Alternative Use?
©2015 New Jersey Agricultural Experiment Station8

©2015 New Jersey Agricultural Experiment Station
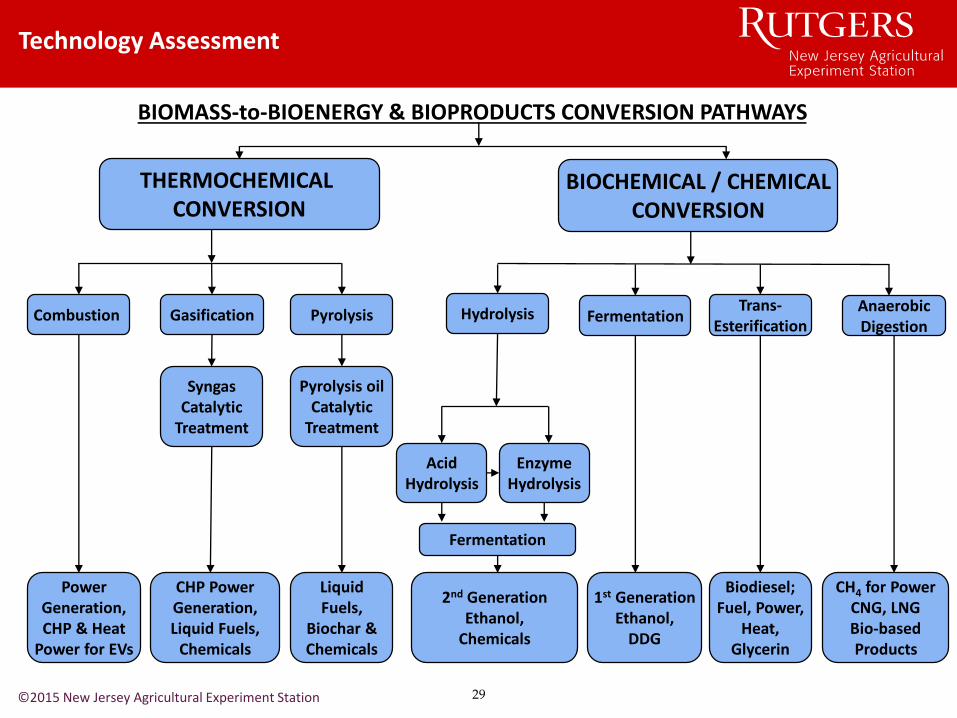
Technology Assessment
THERMOCHEMICAL CONVERSION
BIOCHEMICAL / CHEMICALCONVERSION
BIOMASS-to-BIOENERGY & BIOPRODUCTS CONVERSION PATHWAYS
Combustion Gasification Pyrolysis Hydrolysis FermentationTrans-
EsterificationAnaerobicDigestion
SyngasCatalytic
Treatment
Fermentation
Pyrolysis oilCatalytic
Treatment
AcidHydrolysis
EnzymeHydrolysis
PowerGeneration,CHP & Heat
Power for EVs
CHP PowerGeneration,Liquid Fuels,
Chemicals
LiquidFuels,
Biochar &Chemicals
2nd GenerationEthanol,
Chemicals
1st GenerationEthanol,
DDG
Biodiesel;Fuel, Power,
Heat,Glycerin
CH4 for PowerCNG, LNGBio-basedProducts
9

New Jersey has waste and biomass resources that would result in potential GHGemissions reductions if more efficient technologies are utilized.
• In Section IV, several scenarios provide GHG reduction potentials based on available waste and biomass feedstocks and conversion technologies.
• This section also compares GHG emissions with fossil fuel emissions which waste and biomass energy may displace.
• The example scenarios for potential GHG reductions in New Jersey are:
— Flared portion of landfill gas (LFG) utilization for power generation and transportation fuels production.
— Potential biogas production from food waste and yard waste AD (Anaerobic Digestion) for power generation and transportation fuels production.
— Biodiesel, produced from yellow grease, utilized for transportation fuel.
— Second generation ethanol from forestry biomass through gasification with mixed alcohol synthesis, utilized as gasoline blendstock (E10).
Executive Summary: Greenhouse Gas Reduction Potential
©2015 New Jersey Agricultural Experiment Station10
©2015 New Jersey Agricultural Experiment Station
II. Biomass Supply Analysis
11
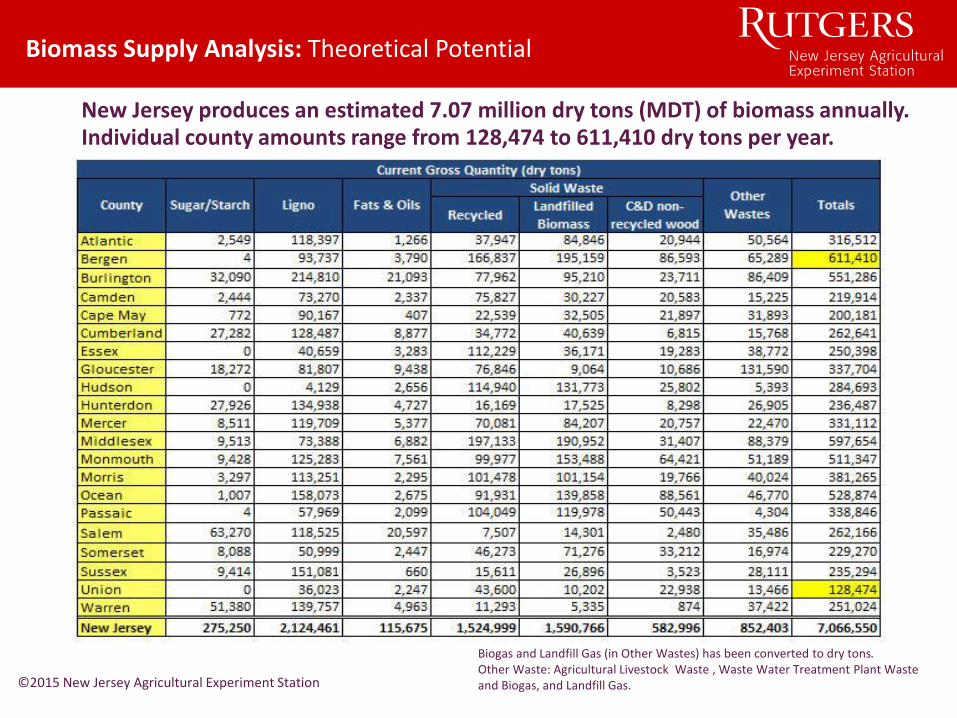
Biomass Supply Analysis: Theoretical Potential
New Jersey produces an estimated 7.07 million dry tons (MDT) of biomass annually. Individual county amounts range from 128,474 to 611,410 dry tons per year.
Biogas and Landfill Gas (in Other Wastes) has been converted to dry tons.Other Waste: Agricultural Livestock Waste , Waste Water Treatment Plant Waste and Biogas, and Landfill Gas.©2015 New Jersey Agricultural Experiment Station
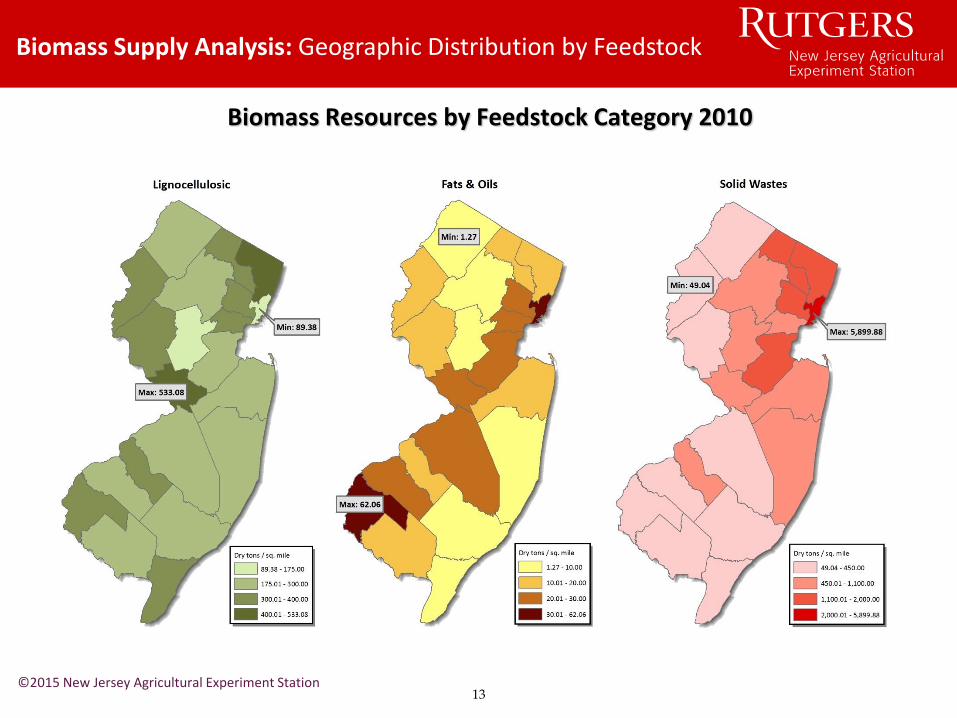
Biomass Supply Analysis: Geographic Distribution by Feedstock
Biomass Resources by Feedstock Category 2010
©2015 New Jersey Agricultural Experiment Station13
Total Available Biomass Resources by Type (dry tons/y)1
Biomass Resources Associated with Population (dry tons/y)1
1. Note that these are gross quantities, not taking into account differences in heat content per ton.2 This total includes biogas and landfill gas quantities converted to dry tons.
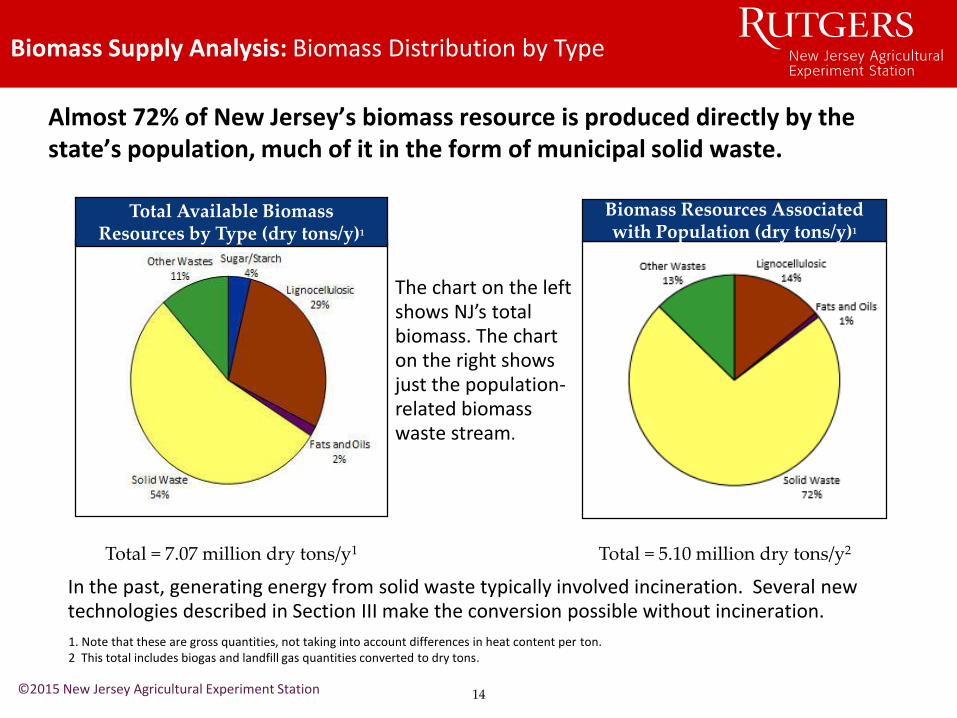
Almost 72% of New Jersey’s biomass resource is produced directly by the state’s population, much of it in the form of municipal solid waste.
In the past, generating energy from solid waste typically involved incineration. Several new technologies described in Section III make the conversion possible without incineration.
The chart on the left shows NJ’s total biomass. The chart on the right shows just the population-related biomass waste stream.
Total = 7.07 million dry tons/y1 Total = 5.10 million dry tons/y2
Biomass Supply Analysis: Biomass Distribution by Type
©2015 New Jersey Agricultural Experiment Station 14

Biomass Supply Analysis: Landfill Gas Generation and Use»2012
©2015 New Jersey Agricultural Experiment Station15
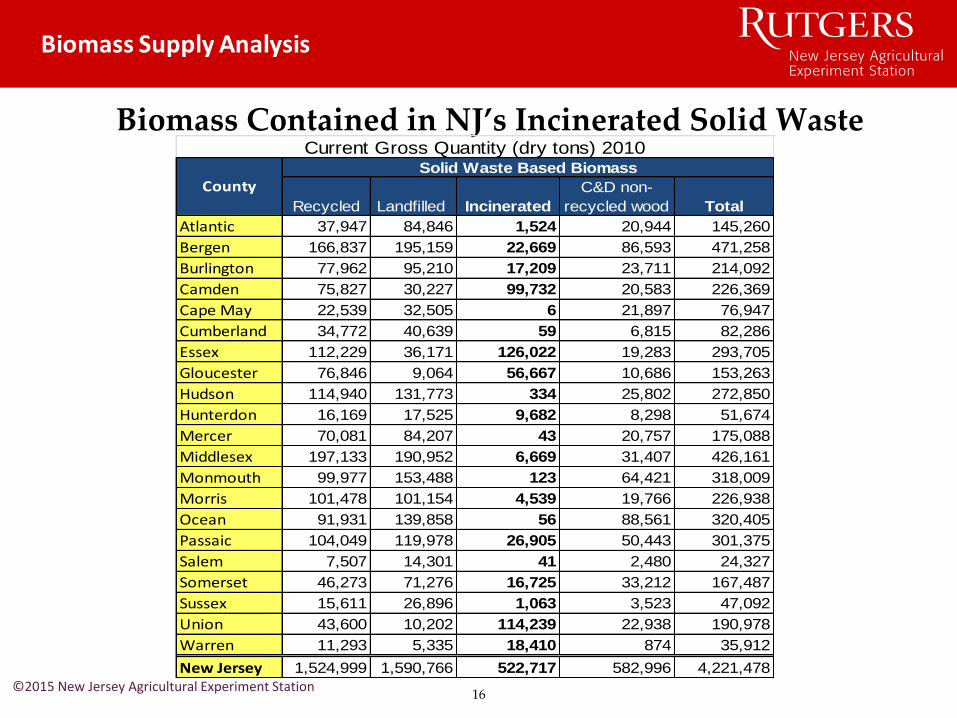
Biomass Contained in NJ’s Incinerated Solid Waste
Recycled Landfilled Incinerated
C&D non-
recycled wood Total
Atlantic 37,947 84,846 1,524 20,944 145,260
Bergen 166,837 195,159 22,669 86,593 471,258
Burlington 77,962 95,210 17,209 23,711 214,092
Camden 75,827 30,227 99,732 20,583 226,369
Cape May 22,539 32,505 6 21,897 76,947
Cumberland 34,772 40,639 59 6,815 82,286
Essex 112,229 36,171 126,022 19,283 293,705
Gloucester 76,846 9,064 56,667 10,686 153,263
Hudson 114,940 131,773 334 25,802 272,850
Hunterdon 16,169 17,525 9,682 8,298 51,674
Mercer 70,081 84,207 43 20,757 175,088
Middlesex 197,133 190,952 6,669 31,407 426,161
Monmouth 99,977 153,488 123 64,421 318,009
Morris 101,478 101,154 4,539 19,766 226,938
Ocean 91,931 139,858 56 88,561 320,405
Passaic 104,049 119,978 26,905 50,443 301,375
Salem 7,507 14,301 41 2,480 24,327
Somerset 46,273 71,276 16,725 33,212 167,487
Sussex 15,611 26,896 1,063 3,523 47,092
Union 43,600 10,202 114,239 22,938 190,978
Warren 11,293 5,335 18,410 874 35,912
New Jersey 1,524,999 1,590,766 522,717 582,996 4,221,478
CountySolid Waste Based Biomass
Current Gross Quantity (dry tons) 2010
16©2015 New Jersey Agricultural Experiment Station
Biomass Supply Analysis: Agricultural Potential
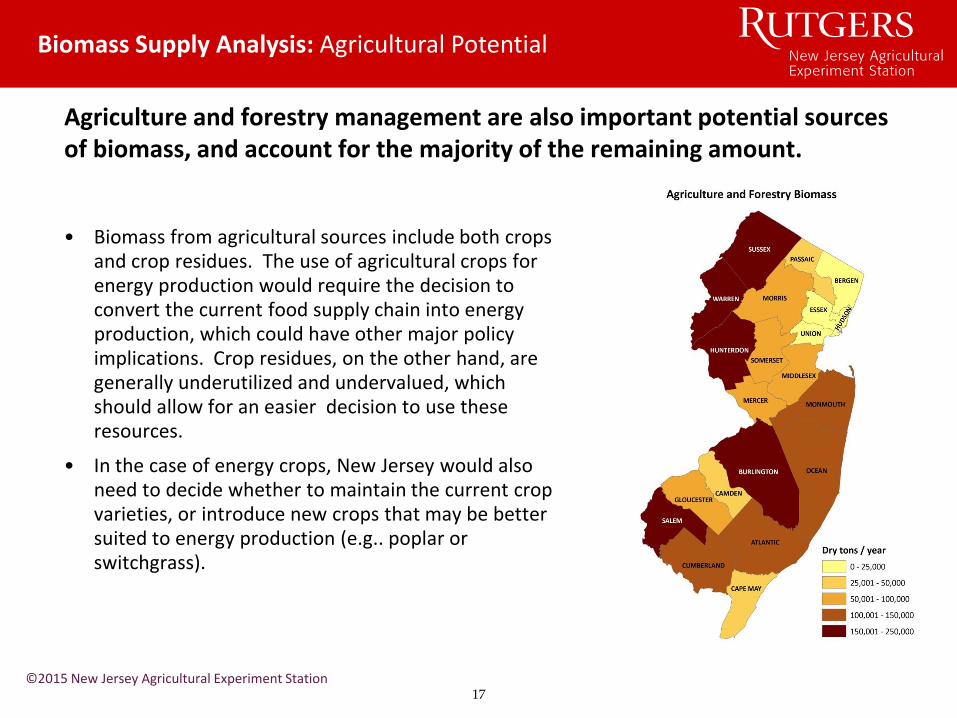
Agriculture and forestry management are also important potential sources of biomass, and account for the majority of the remaining amount.
• Biomass from agricultural sources include both crops and crop residues. The use of agricultural crops for energy production would require the decision to convert the current food supply chain into energy production, which could have other major policy implications. Crop residues, on the other hand, are generally underutilized and undervalued, which should allow for an easier decision to use these resources.
• In the case of energy crops, New Jersey would also need to decide whether to maintain the current crop varieties, or introduce new crops that may be better suited to energy production (e.g.. poplar or switchgrass).
©2015 New Jersey Agricultural Experiment Station17
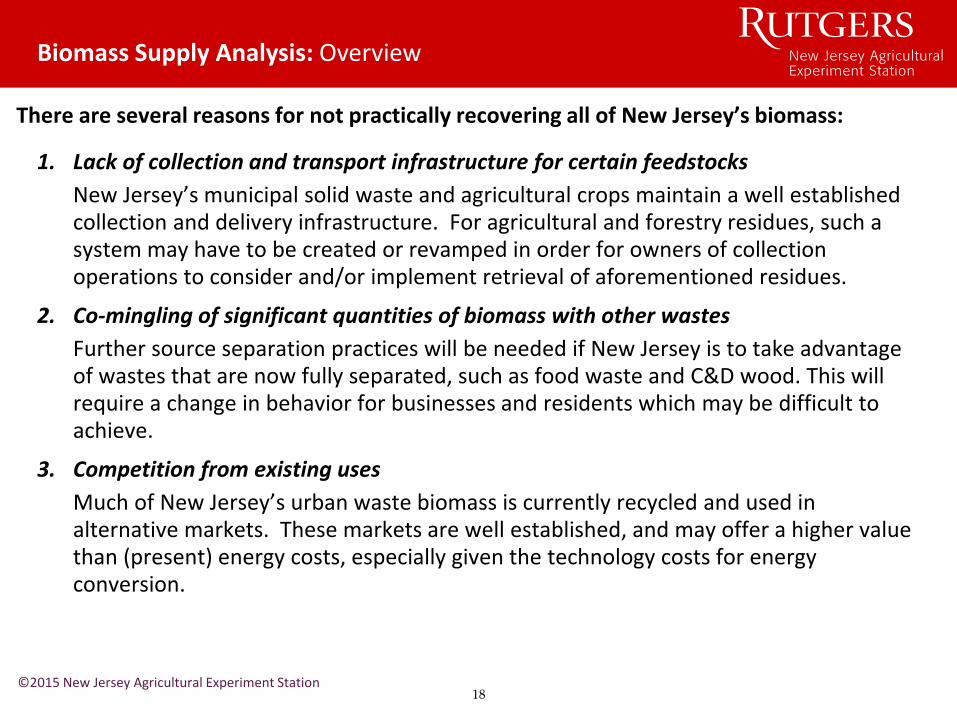
There are several reasons for not practically recovering all of New Jersey’s biomass:
1. Lack of collection and transport infrastructure for certain feedstocks
New Jersey’s municipal solid waste and agricultural crops maintain a well established collection and delivery infrastructure. For agricultural and forestry residues, such a system may have to be created or revamped in order for owners of collection operations to consider and/or implement retrieval of aforementioned residues.
2. Co-mingling of significant quantities of biomass with other wastes
Further source separation practices will be needed if New Jersey is to take advantage of wastes that are now fully separated, such as food waste and C&D wood. This will require a change in behavior for businesses and residents which may be difficult to achieve.
3. Competition from existing uses
Much of New Jersey’s urban waste biomass is currently recycled and used in alternative markets. These markets are well established, and may offer a higher value than (present) energy costs, especially given the technology costs for energy conversion.
Biomass Supply Analysis: Overview
©2015 New Jersey Agricultural Experiment Station18

Biomass Supply Analysis: Practically Recoverable Biomass
The results of this process indicate that approximately 4.11 MDT (~58%) of New Jersey’s biomass could ultimately be available to produce energy in the form of power, heat, or transportation fuels.
Total Theoretical
Biomass Potential =7.07 MDT
Practically Recoverable
Biomass Potential = 4.11 MDT
Co
llec
tio
n
So
rtin
g
Alt
ern
ativ
e U
se
2,139,786 DT230,143 DT592,513 DT
Note: This screening process is preliminary and would require considerably more analysis to reach any final conclusions. The screening analysis has been incorporated into the database, and provides flexible “scenario analysis” capabilities for the user.
Is/Can the Biomass Be Collected?
Is the Biomass Sortable (or is Sorting Needed)?
Does the Biomass Have a Valuable Alternative Use?
©2015 New Jersey Agricultural Experiment Station19
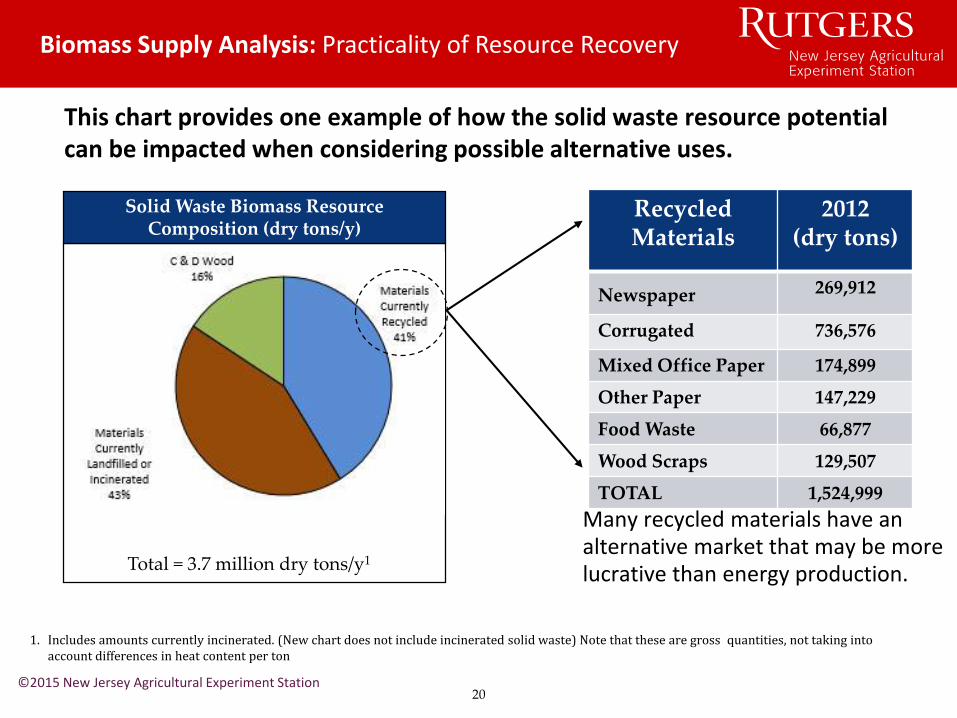
This chart provides one example of how the solid waste resource potential can be impacted when considering possible alternative uses.
1. Includes amounts currently incinerated. (New chart does not include incinerated solid waste) Note that these are gross quantities, not taking into account differences in heat content per ton
Biomass Supply Analysis: Practicality of Resource Recovery
Solid Waste Biomass Resource Composition (dry tons/y)
Total = 3.7 million dry tons/y1
Many recycled materials have an alternative market that may be more lucrative than energy production.
©2015 New Jersey Agricultural Experiment Station
Recycled Materials
2012(dry tons)
Newspaper 269,912
Corrugated 736,576
Mixed Office Paper 174,899
Other Paper 147,229
Food Waste 66,877
Wood Scraps 129,507
TOTAL 1,524,999
20

Biomass Supply Analysis: Potential Pathway
Mapping out a strategy for effective biomass resource utilization is a valuable next step for New Jersey in understanding the actual potential.
Use GIS mapping to determine location of resources, including central nodes that might make good plant locations
Compile quality characteristics of proximal resources to determine compatibility with prospective facility
Evaluate collection, delivery, and handling infrastructure needed to process resources at each facility or node
For those resources that have an alternative use, decide whether the alternative use is preferred to energy production
For resources not currently collected, develop a viable collection plan
For resources not currently separated from the waste stream, develop separation plan
Biomass Resource Utilization Strategy
Develop Separation
Plan
Develop Collection
Plan
Biomass Locational Mapping
Understand Quality
Characteristics
Determine Infrastructure Requirements
Determine Most
Appropriate Use
©2015 New Jersey Agricultural Experiment Station21
Bioenergy Calculator
• A unique Bioenergy Calculator and interactive biomass resource database were developed to aggregate all biomass and technology information.
• This database contains a number of important features: Detailed biomass resource data, by county, for more than 40 biomass resources.
• Summary of energy generation data for 7 major bioenergy technologies that takes into consideration advances in energy output and efficiency over time.
• The database was designed to analyze the biomass resource data and technology assessment data in an interactive fashion. The database is: — Structured by county and resource type.— Contains technology performance estimates to convert biomass quantities
into energy (electricity and fuel) potential.
Bioenergy Calculator & Biomass Resource Database
©2015 New Jersey Agricultural Experiment Station22
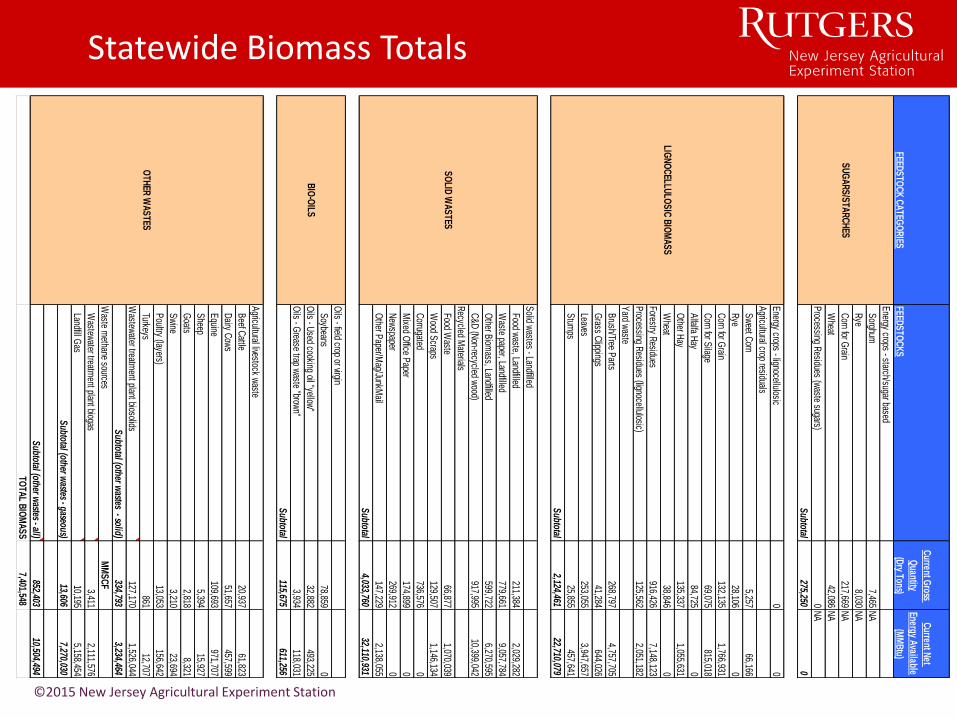
Energy crops - starch/sugar based
Sorghum
7,465N
A
Rye
8,030N
A
Corn for G
rain217,669
NA
Wheat
42,086N
A
Processing R
esidues (waste sugars)
0N
A
Subtotal
275,2500
Energy crops - lignocellulosic
00
Agricultural crop residuals
Sw
eet Corn
5,25766,166
Rye
28,1060
Corn for G
rain132,135
1,766,931
Corn for S
ilage69,075
815,018
Alfalfa H
ay84,725
0
Other H
ay135,337
1,055,631
Wheat
38,8460
Forestry Residues
916,4267,148,123
Processing R
esidues (lignocellulosic)125,562
2,051,182
Yard w
aste
Brush/Tree P
arts268,797
4,757,705
Grass C
lippings41,284
644,026
Leaves253,055
3,947,657
Stum
ps25,855
457,641
Subtotal
2,124,46122,710,079
Solid w
astes - Landfilled
Food waste, Landfilled
211,3842,029,282
Waste paper, Landfilled
779,6619,057,784
Other B
iomass, Landfilled
599,7226,270,595
C&
D (N
on-recycled wood)
917,99510,399,042
Recycled M
aterials
Food Waste
66,8771,070,039
Wood S
craps129,507
1,146,134
Corrugated
736,5760
Mixed O
ffice Paper
174,8990
New
spaper269,912
0
Other P
aper/Mag/JunkM
ail147,229
2,138,055
Subtotal
4,033,76032,110,931
Oils - field crop or virgin
Soybeans
78,8590
Oils - U
sed cooking oil "yellow"
32,882493,225
Oils - G
rease trap waste "brow
n"3,934
118,031
Subtotal
115,675611,256
Agricultural livestock w
aste
Beef C
attle20,937
61,823
Dairy C
ows
51,657457,599
Equine
109,693971,707
Sheep
5,39415,927
Goats
2,8188,321
Sw
ine3,210
23,694
Poultry (layers)
13,053156,642
Turkeys861
12,707
Wastew
ater treatment plant biosolids
127,1701,526,044
Subtotal (other w
astes - solid)334,793
3,234,464
Waste m
ethane sourcesM
MS
CF
Wastew
ater treatment plant biogas
3,4112,111,576
Landfill Gas
10,1955,158,454
Subtotal (other w
astes - gaseous)13,606
7,270,030
Subtotal (other w
astes - all)852,403
10,504,494
TOTA
L BIO
MA
SS
7,401,548
FEEDS
TOC
KS
Current G
ross
Quantity
(Dry Tons)
OTH
ER W
AS
TES
SU
GA
RS
/STA
RC
HES
LIGN
OC
ELLULO
SIC
BIO
MA
SS
SO
LID W
AS
TES
BIO
-OILS
FEEDS
TOC
K C
ATEG
OR
IES
Current N
et
Energy Available
(MM
Btu)
Statewide Biomass Totals
©2015 New Jersey Agricultural Experiment Station
©2007 New Jersey Agricultural Experiment Station 24
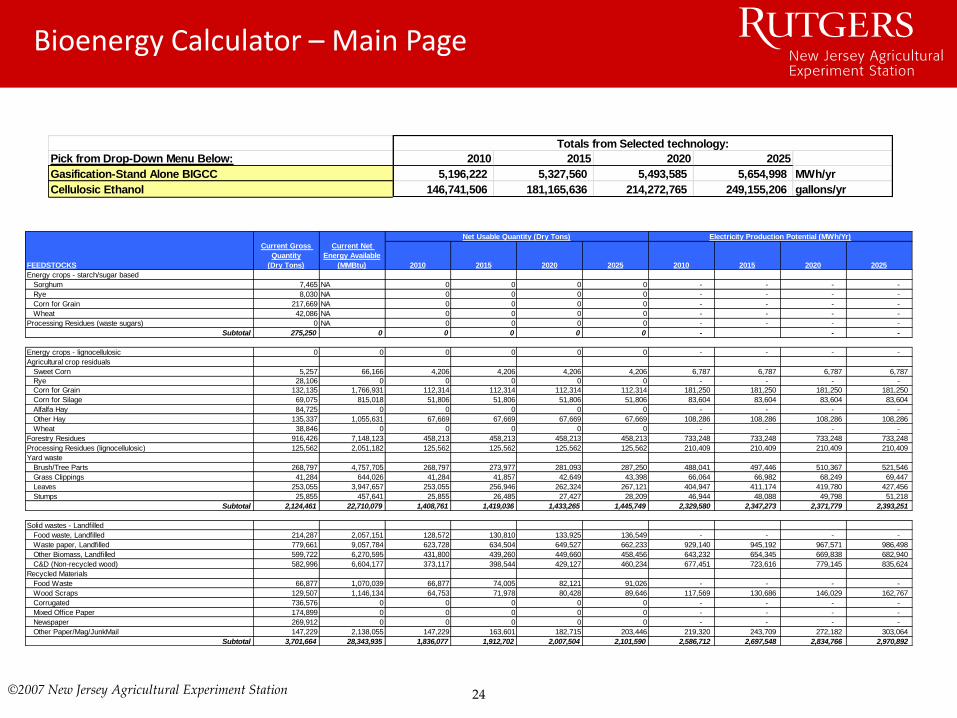
Pick from Drop-Down Menu Below: 2010 2015 2020 2025
Gasification-Stand Alone BIGCC 5,196,222 5,327,560 5,493,585 5,654,998 MWh/yr
Cellulosic Ethanol 146,741,506 181,165,636 214,272,765 249,155,206 gallons/yr
Totals from Selected technology:
Bioenergy Calculator – Main Page
2010 2015 2020 2025 2010 2015 2020 2025
Energy crops - starch/sugar based
Sorghum 7,465 NA 0 0 0 0 - - - -
Rye 8,030 NA 0 0 0 0 - - - -
Corn for Grain 217,669 NA 0 0 0 0 - - - -
Wheat 42,086 NA 0 0 0 0 - - - -
Processing Residues (waste sugars) 0 NA 0 0 0 0 - - - -
Subtotal 275,250 0 0 0 0 0 - - -
Energy crops - lignocellulosic 0 0 0 0 0 0 - - - -
Agricultural crop residuals
Sweet Corn 5,257 66,166 4,206 4,206 4,206 4,206 6,787 6,787 6,787 6,787
Rye 28,106 0 0 0 0 0 - - - -
Corn for Grain 132,135 1,766,931 112,314 112,314 112,314 112,314 181,250 181,250 181,250 181,250
Corn for Silage 69,075 815,018 51,806 51,806 51,806 51,806 83,604 83,604 83,604 83,604
Alfalfa Hay 84,725 0 0 0 0 0 - - - -
Other Hay 135,337 1,055,631 67,669 67,669 67,669 67,669 108,286 108,286 108,286 108,286
Wheat 38,846 0 0 0 0 0 - - - -
Forestry Residues 916,426 7,148,123 458,213 458,213 458,213 458,213 733,248 733,248 733,248 733,248
Processing Residues (lignocellulosic) 125,562 2,051,182 125,562 125,562 125,562 125,562 210,409 210,409 210,409 210,409
Yard waste
Brush/Tree Parts 268,797 4,757,705 268,797 273,977 281,093 287,250 488,041 497,446 510,367 521,546
Grass Clippings 41,284 644,026 41,284 41,857 42,649 43,398 66,064 66,982 68,249 69,447
Leaves 253,055 3,947,657 253,055 256,946 262,324 267,121 404,947 411,174 419,780 427,456
Stumps 25,855 457,641 25,855 26,485 27,427 28,209 46,944 48,088 49,798 51,218
Subtotal 2,124,461 22,710,079 1,408,761 1,419,036 1,433,265 1,445,749 2,329,580 2,347,273 2,371,779 2,393,251
Solid wastes - Landfilled
Food waste, Landfilled 214,287 2,057,151 128,572 130,810 133,925 136,549 - - - -
Waste paper, Landfilled 779,661 9,057,784 623,728 634,504 649,527 662,233 929,140 945,192 967,571 986,498
Other Biomass, Landfilled 599,722 6,270,595 431,800 439,260 449,660 458,456 643,232 654,345 669,838 682,940
C&D (Non-recycled wood) 582,996 6,604,177 373,117 398,544 429,127 460,234 677,451 723,616 779,145 835,624
Recycled Materials
Food Waste 66,877 1,070,039 66,877 74,005 82,121 91,026 - - - -
Wood Scraps 129,507 1,146,134 64,753 71,978 80,428 89,646 117,569 130,686 146,029 162,767
Corrugated 736,576 0 0 0 0 0 - - - -
Mixed Office Paper 174,899 0 0 0 0 0 - - - -
Newspaper 269,912 0 0 0 0 0 - - - -
Other Paper/Mag/JunkMail 147,229 2,138,055 147,229 163,601 182,715 203,446 219,320 243,709 272,182 303,064
Subtotal 3,701,664 28,343,935 1,836,077 1,912,702 2,007,504 2,101,590 2,586,712 2,697,548 2,834,766 2,970,892
FEEDSTOCKS
Current Gross
Quantity
(Dry Tons)
Current Net
Energy Available
(MMBtu)
Electricity Production Potential (MWh/Yr)Net Usable Quantity (Dry Tons)
25©2015 New Jersey Agricultural Experiment Station
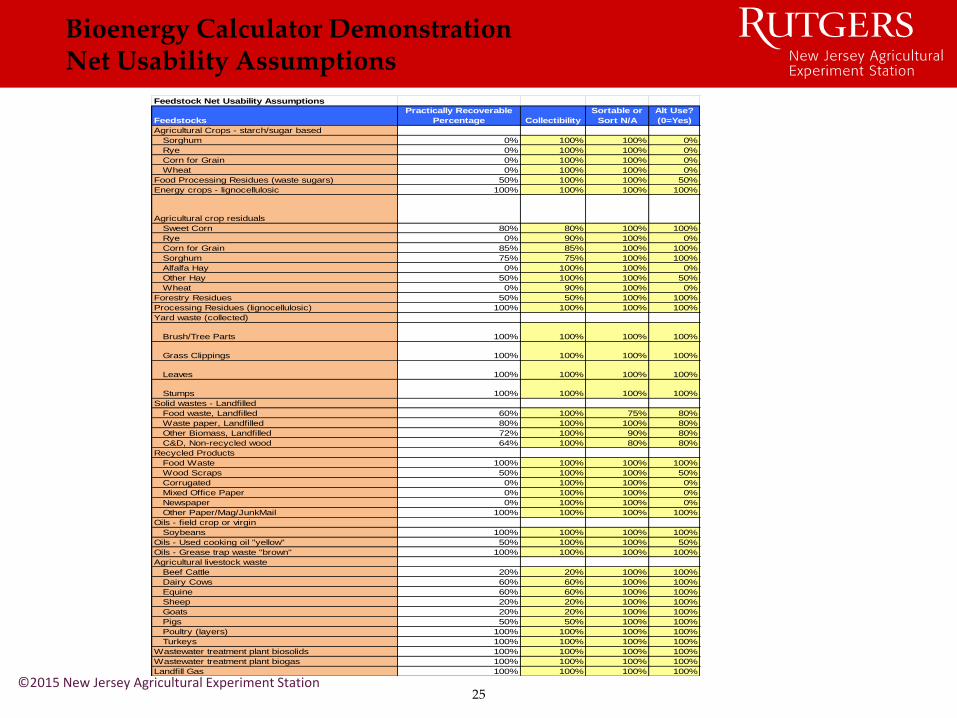
Feedstock Net Usability Assumptions
Feedstocks
Practically Recoverable
Percentage Collectibility
Sortable or
Sort N/A
Alt Use?
(0=Yes)
Agricultural Crops - starch/sugar based
Sorghum 0% 100% 100% 0%
Rye 0% 100% 100% 0%
Corn for Grain 0% 100% 100% 0%
Wheat 0% 100% 100% 0%
Food Processing Residues (waste sugars) 50% 100% 100% 50%
Energy crops - lignocellulosic 100% 100% 100% 100%
Agricultural crop residuals
Sweet Corn 80% 80% 100% 100%
Rye 0% 90% 100% 0%
Corn for Grain 85% 85% 100% 100%
Sorghum 75% 75% 100% 100%
Alfalfa Hay 0% 100% 100% 0%
Other Hay 50% 100% 100% 50%
Wheat 0% 90% 100% 0%
Forestry Residues 50% 50% 100% 100%
Processing Residues (lignocellulosic) 100% 100% 100% 100%
Yard waste (collected)
Brush/Tree Parts 100% 100% 100% 100%
Grass Clippings 100% 100% 100% 100%
Leaves 100% 100% 100% 100%
Stumps 100% 100% 100% 100%
Solid wastes - Landfilled
Food waste, Landfilled 60% 100% 75% 80%
Waste paper, Landfilled 80% 100% 100% 80%
Other Biomass, Landfilled 72% 100% 90% 80%
C&D, Non-recycled wood 64% 100% 80% 80%
Recycled Products
Food Waste 100% 100% 100% 100%
Wood Scraps 50% 100% 100% 50%
Corrugated 0% 100% 100% 0%
Mixed Office Paper 0% 100% 100% 0%
Newspaper 0% 100% 100% 0%
Other Paper/Mag/JunkMail 100% 100% 100% 100%
Oils - field crop or virgin
Soybeans 100% 100% 100% 100%
Oils - Used cooking oil "yellow" 50% 100% 100% 50%
Oils - Grease trap waste "brown" 100% 100% 100% 100%
Agricultural livestock waste
Beef Cattle 20% 20% 100% 100%
Dairy Cows 60% 60% 100% 100%
Equine 60% 60% 100% 100%
Sheep 20% 20% 100% 100%
Goats 20% 20% 100% 100%
Pigs 50% 50% 100% 100%
Poultry (layers) 100% 100% 100% 100%
Turkeys 100% 100% 100% 100%
Wastewater treatment plant biosolids 100% 100% 100% 100%
Wastewater treatment plant biogas 100% 100% 100% 100%
Landfill Gas 100% 100% 100% 100%
Bioenergy Calculator DemonstrationNet Usability Assumptions
©2015 New Jersey Agricultural Experiment Station
III. Technology Assessment
26
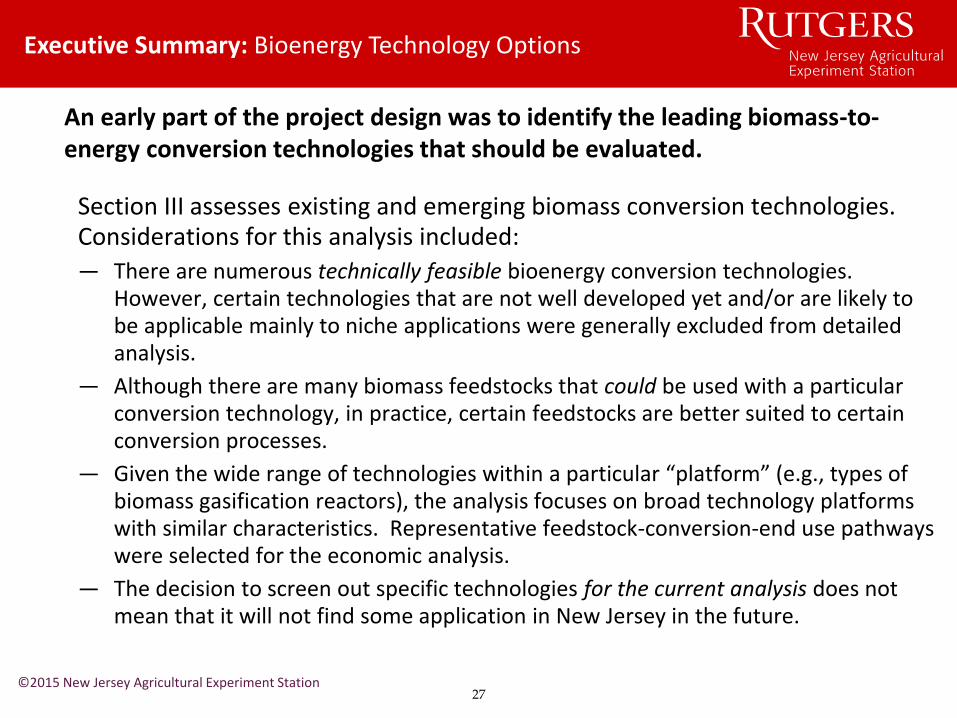
An early part of the project design was to identify the leading biomass-to-energy conversion technologies that should be evaluated.
Section III assesses existing and emerging biomass conversion technologies. Considerations for this analysis included:
— There are numerous technically feasible bioenergy conversion technologies. However, certain technologies that are not well developed yet and/or are likely to be applicable mainly to niche applications were generally excluded from detailed analysis.
— Although there are many biomass feedstocks that could be used with a particular conversion technology, in practice, certain feedstocks are better suited to certain conversion processes.
— Given the wide range of technologies within a particular “platform” (e.g., types of biomass gasification reactors), the analysis focuses on broad technology platforms with similar characteristics. Representative feedstock-conversion-end use pathways were selected for the economic analysis.
— The decision to screen out specific technologies for the current analysis does not mean that it will not find some application in New Jersey in the future.
Executive Summary: Bioenergy Technology Options
©2015 New Jersey Agricultural Experiment Station27

Technology Development and Commercialization Pathway
Technology Assessment: Commercialization Timeline
R&D
DemonstrationMarket Entry
Market Penetration
Market MaturityCommercial
PrototypesRefined
PrototypesInitial System
Prototypes
• Research on component technologies
• General assessment of market needs
• Assess general magnitude of economics
• Integrating component technologies
• Initial system prototype for debugging
• Monitoring Policy & Market developments
• Ongoing development to reduce costs or for other needed improvements
• Technology (systems) demonstrations
• Some small-scale “commercial” demonstrations
• Commercial demonstration
• Full size system in commercial operating environment
• Communicate program results to early adopters/ selected niches
• Commercial orders
• Early movers or niche segments
• Product reputation is initially established
• Business concept implemented
• Market support usually needed to address high cost production
• Follow-up orders based on need and product reputation
• Broad(er) market penetration
• Infrastructure developed
• Full-scale manufacturing
• Roll-out of new models, upgrades
• Increased scale drives down costs and results in learning
10+ years 4 - 8 years 1 - 3 years 5-10 years Ongoing
The time required to pass through any given stage can vary considerably. The values shown are representative of a technology that passes successfully from one stage to the next without setbacks.
©2015 New Jersey Agricultural Experiment Station 28
©2015 New Jersey Agricultural Experiment Station
Technology Assessment
THERMOCHEMICAL CONVERSION
BIOCHEMICAL / CHEMICALCONVERSION
BIOMASS-to-BIOENERGY & BIOPRODUCTS CONVERSION PATHWAYS
Combustion Gasification Pyrolysis Hydrolysis FermentationTrans-
EsterificationAnaerobicDigestion
SyngasCatalytic
Treatment
Fermentation
Pyrolysis oilCatalytic
Treatment
AcidHydrolysis
EnzymeHydrolysis
PowerGeneration,CHP & Heat
Power for EVs
CHP PowerGeneration,Liquid Fuels,
Chemicals
LiquidFuels,
Biochar &Chemicals
2nd GenerationEthanol,
Chemicals
1st GenerationEthanol,
DDG
Biodiesel;Fuel, Power,
Heat,Glycerin
CH4 for PowerCNG, LNGBio-basedProducts
29
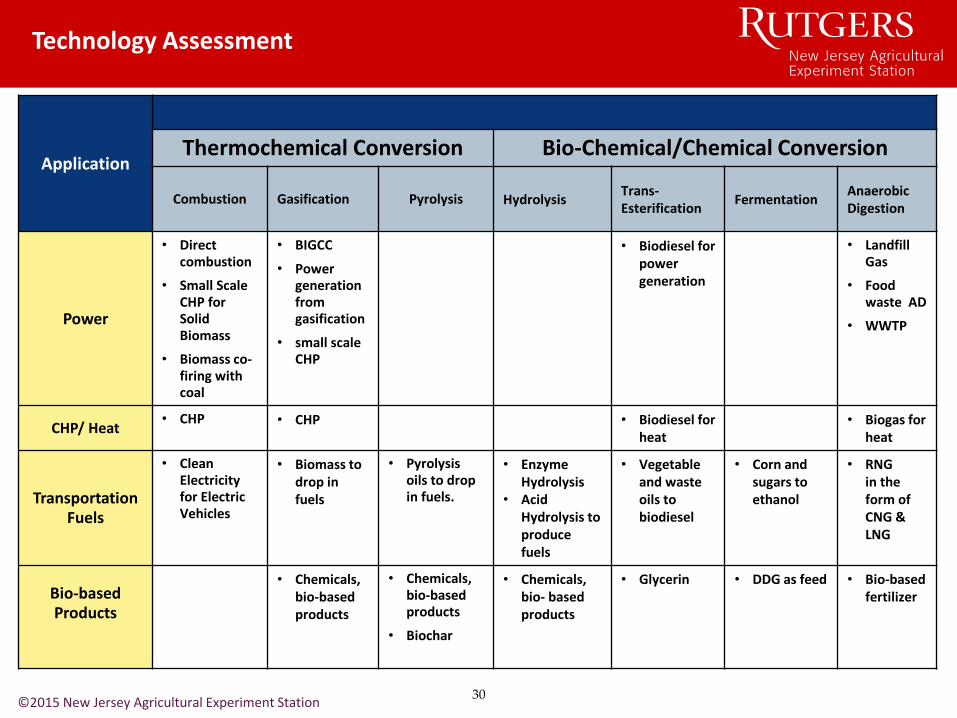
ApplicationThermochemical Conversion Bio-Chemical/Chemical Conversion
Combustion Gasification Pyrolysis HydrolysisTrans-Esterification
FermentationAnaerobic Digestion
Power
• Direct combustion
• Small Scale CHP for Solid Biomass
• Biomass co-firing with coal
• BIGCC
• Power generation from gasification
• small scale CHP
• Biodiesel for power generation
• Landfill Gas
• Food waste AD
• WWTP
CHP/ Heat• CHP • CHP • Biodiesel for
heat• Biogas for
heat
Transportation Fuels
• Clean Electricity for Electric Vehicles
• Biomass to drop in fuels
• Pyrolysis oils to drop in fuels.
• Enzyme Hydrolysis
• Acid Hydrolysis to produce fuels
• Vegetable and waste oils to biodiesel
• Corn and sugars to ethanol
• RNG in the form of CNG & LNG
Bio-based Products
• Chemicals, bio-based products
• Chemicals, bio-based products
• Biochar
• Chemicals, bio- based products
• Glycerin • DDG as feed • Bio-based fertilizer
Technology Assessment
©2015 New Jersey Agricultural Experiment Station30

BIOPOWER & BIOHEAT PATHWAYS
©2015 New Jersey Agricultural Experiment Station
* State Bioenergy Primer
31

BIOFUELS PATHWAYS
©2015 New Jersey Agricultural Experiment Station
Technology Assessment
32
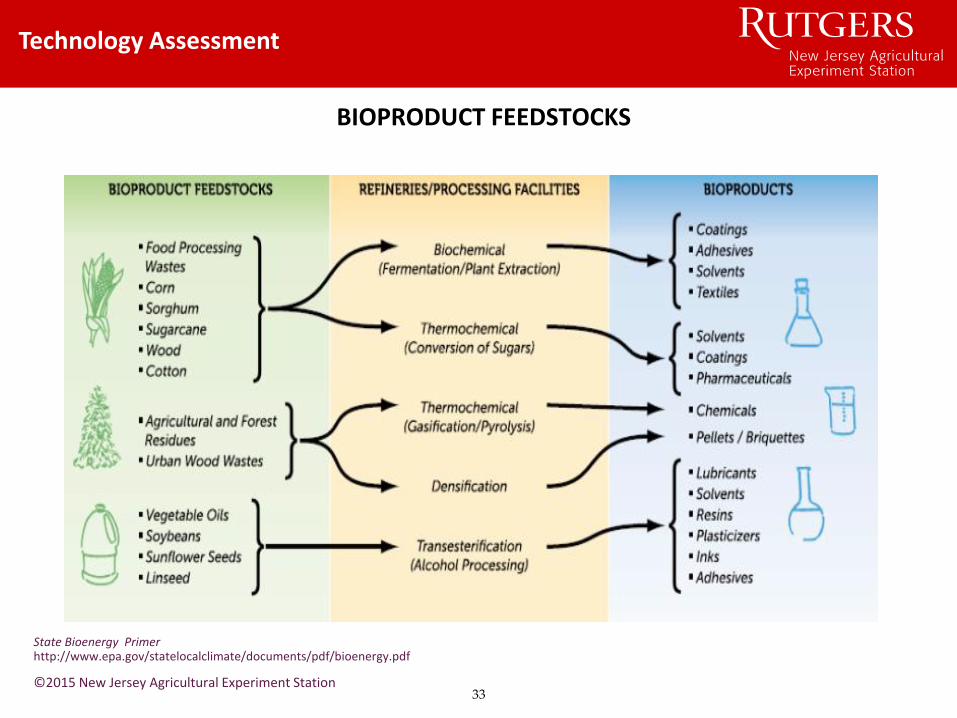
BIOPRODUCT FEEDSTOCKS
State Bioenergy Primer http://www.epa.gov/statelocalclimate/documents/pdf/bioenergy.pdf
©2015 New Jersey Agricultural Experiment Station
Technology Assessment
33

©2015 New Jersey Agricultural Experiment Station
IV. GHG Reduction Scenarios
34
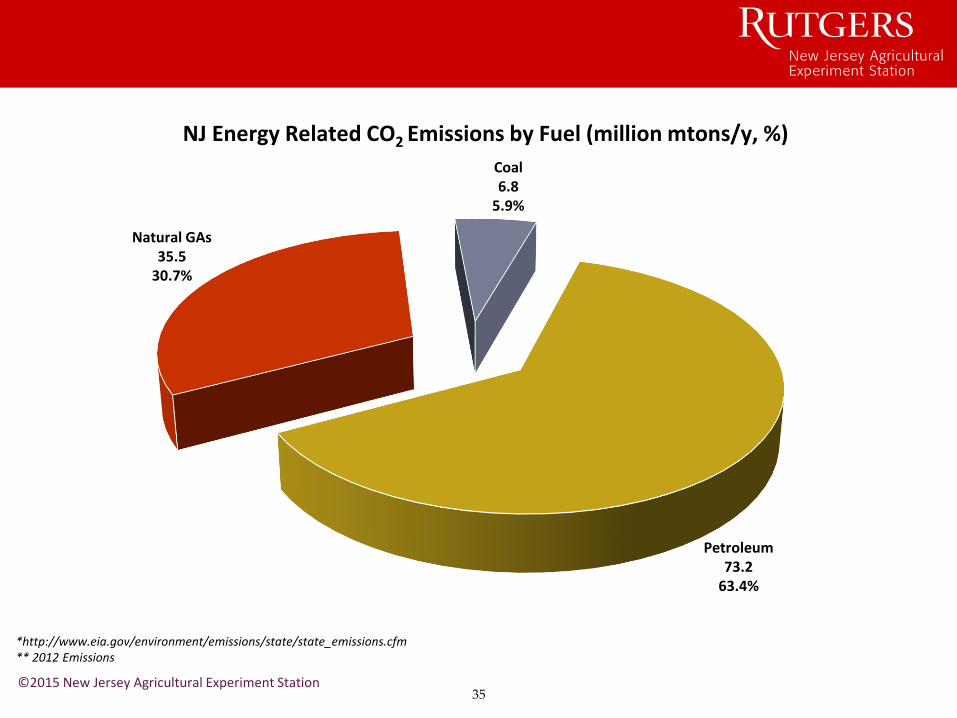
*http://www.eia.gov/environment/emissions/state/state_emissions.cfm** 2012 Emissions
©2015 New Jersey Agricultural Experiment Station
Natural GAs35.5
30.7%
Coal6.8
5.9%
Petroleum73.2
63.4%
NJ Energy Related CO2 Emissions by Fuel (million mtons/y, %)
35

*http://www.eia.gov/environment/emissions/state/state_emissions.cfm** 2012 Emissions
©2015 New Jersey Agricultural Experiment Station
Transportation65.7
56.8%
Industrial6.5
5.6%
Commercial10.89.5%
Residential14.7
12.7%
Electric Power17.8
15.4%
NJ Energy Related CO2 Emissions by Sector (million mtons/y, %)
36
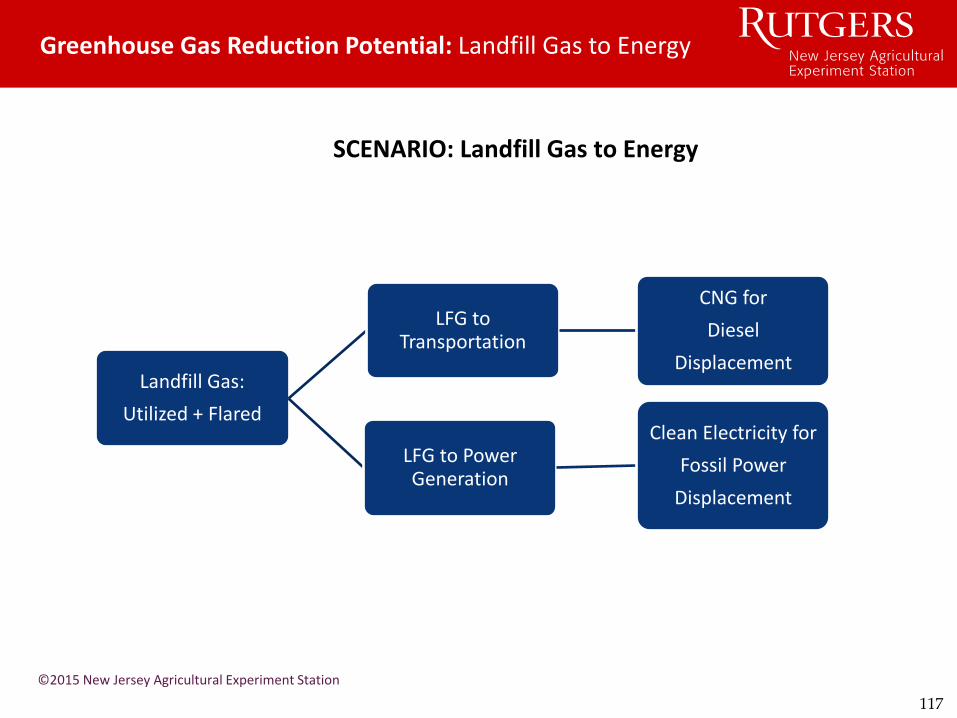
Greenhouse Gas Reduction Potential: Landfill Gas to Energy
SCENARIO: Landfill Gas to Energy
Landfill Gas:
Utilized + Flared
LFG to Transportation
CNG for
Diesel
Displacement
LFG to Power Generation
Clean Electricity for
Fossil Power
Displacement
©2015 New Jersey Agricultural Experiment Station
117
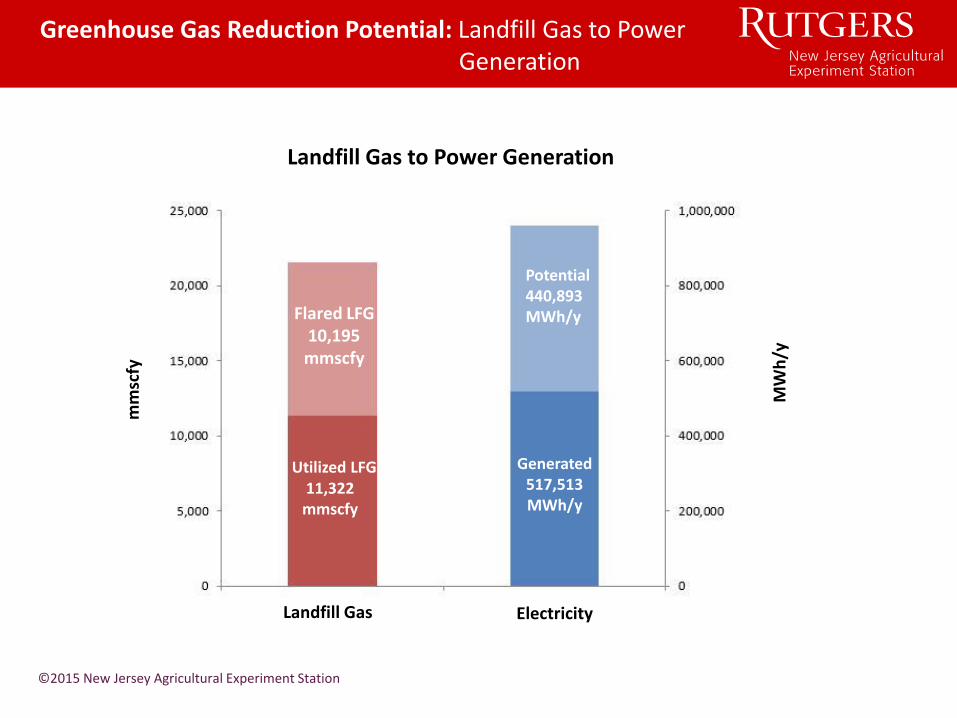
Greenhouse Gas Reduction Potential: Landfill Gas to Power Generation
©2015 New Jersey Agricultural Experiment Station
Potential440,893MWh/yFlared LFG
10,195mmscfy
MW
h/y
Generated517,513MWh/y
Utilized LFG11,322mmscfy
Landfill Gas to Power Generation
Landfill Gas Electricity
mm
scfy
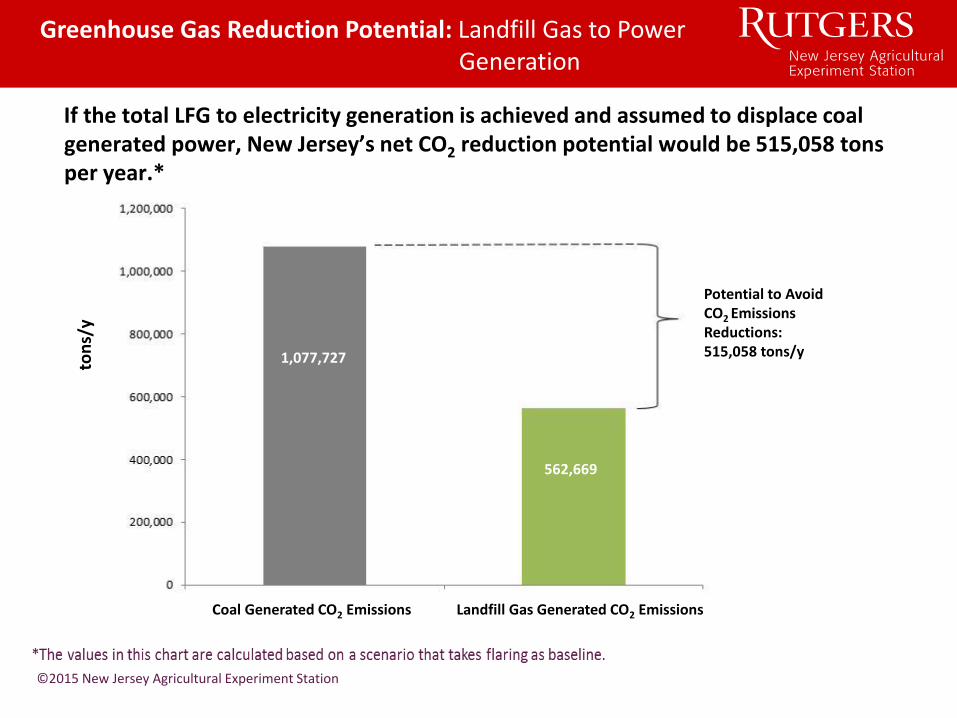
If the total LFG to electricity generation is achieved and assumed to displace coal generated power, New Jersey’s net CO2 reduction potential would be 515,058 tons per year.*
Greenhouse Gas Reduction Potential: Landfill Gas to Power Generation
©2015 New Jersey Agricultural Experiment Station
Potential to AvoidCO2 Emissions Reductions:515,058 tons/y1,077,727
562,669
Coal Generated CO2 Emissions Landfill Gas Generated CO2 Emissions
ton
s/y

©2015 New Jersey Agricultural Experiment Station
*The values in this chart are calculated based on a scenario that takes flaring as the baseline and does not include process emissions and byproduct credits.
Greenhouse Gas Reduction Potential: Landfill Gas to CNG/LNG as Transportation Fuel
LFG to CNG for Fossil Diesel Displacement
32,694,427 DGE
266,595
366,881
100,285
CO
2e
ton
s/y
mm
scfy
©2015 New Jersey Agricultural Experiment Station
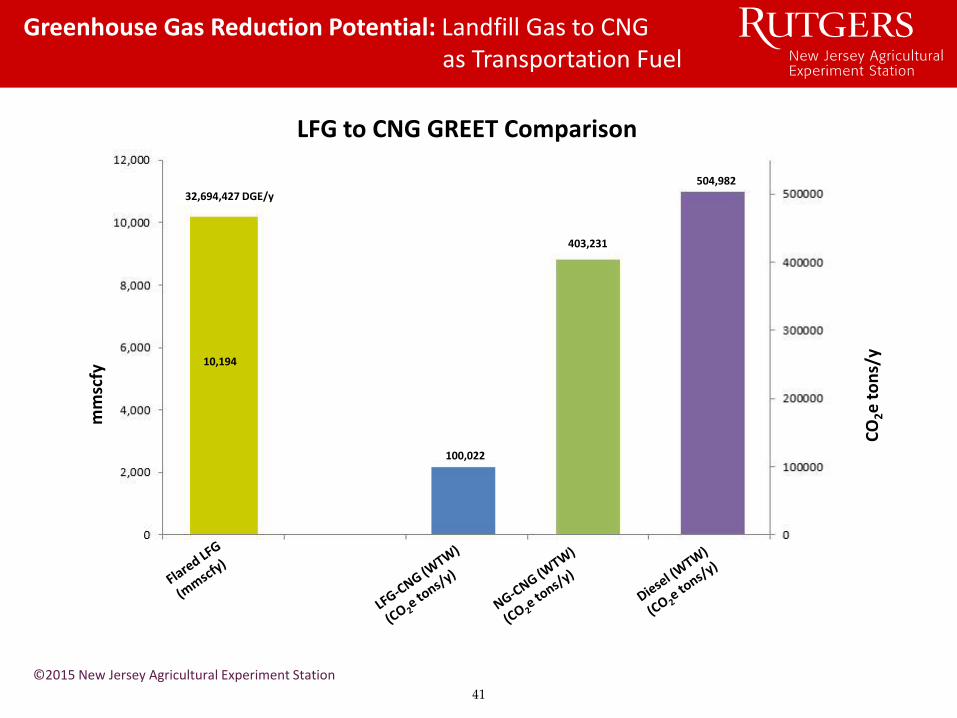
Greenhouse Gas Reduction Potential: Landfill Gas to CNG as Transportation Fuel
LFG to CNG GREET Comparison
CO
2e
to
ns/
y
mm
scfy
32,694,427 DGE/y
10,194
100,022
403,231
504,982
41

Greenhouse Gas Reduction Potential: Food Waste AD to Energy
SCENARIO: Food Waste AD to Energy
Food Waste AD
Biogas
Biogas for Transportation
Biogas CNG for
Diesel
Displacement
Biogas to Power Generation
Clean Electricity for
Fossil Power
Displacement
©2015 New Jersey Agricultural Experiment Station

©2015 New Jersey Agricultural Experiment Station
Greenhouse Gas Reduction Potential: Food Waste AD to Power Generation
Food Waste AD Biogas for Power GenerationPotential CO2 Reductions Comparison
PotentialAvoided CO2
Emissions:368,262tons/y
PotentialAvoided CO2
Emissions:175,453tons/y
351,084
175,631
Coal Generated CO2
Emissions
CO2 Emissions from Food Waste AD Power
Generation
GREET LCAFood Waste AD CO2 Emissions
ton
s/y
43

©2015 New Jersey Agricultural Experiment Station
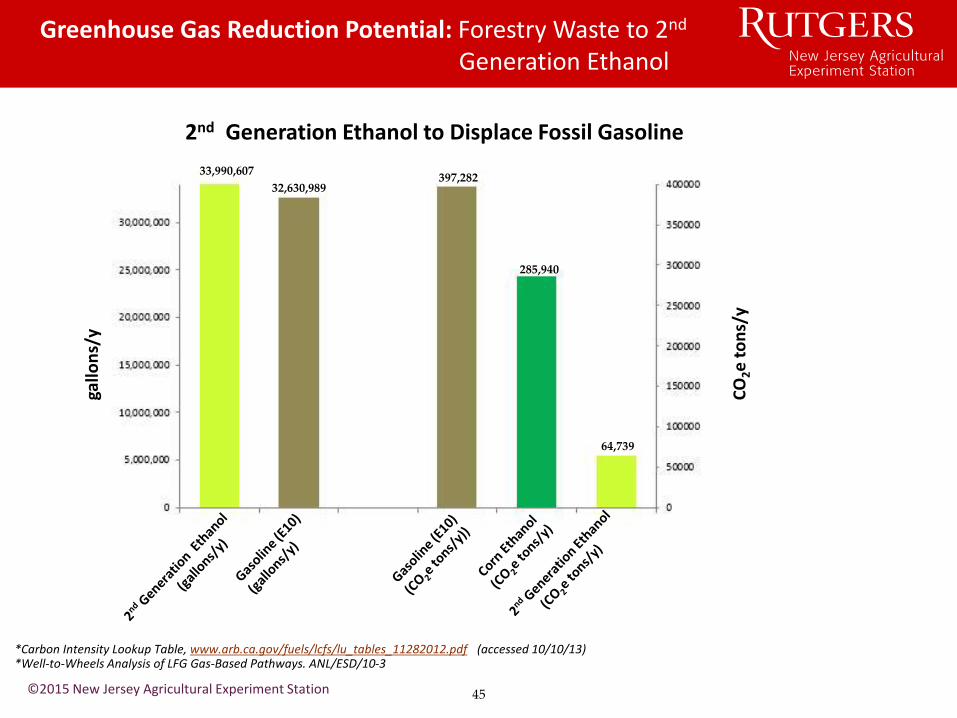
*Carbon Intensity Lookup Table, www.arb.ca.gov/fuels/lcfs/lu_tables_11282012.pdf (accessed 10/10/13) Well-to-Wheels Analysis of LFG Gas-Based Pathways. ANL/ESD/10-3
Greenhouse Gas Reduction Potential: Yellow Grease Biodiesel as Transportation Fuel
CO
2e
ton
s/y
gallo
ns/
y
9,690,411
8,721,370
125,478
109,031
20,745
Yellow Grease Biodiesel to Displace Fossil Diesel
44
©2015 New Jersey Agricultural Experiment Station
*Carbon Intensity Lookup Table, www.arb.ca.gov/fuels/lcfs/lu_tables_11282012.pdf (accessed 10/10/13)*Well-to-Wheels Analysis of LFG Gas-Based Pathways. ANL/ESD/10-3
Greenhouse Gas Reduction Potential: Forestry Waste to 2nd
Generation Ethanol
2nd Generation Ethanol to Displace Fossil Gasoline
33,990,607
32,630,989397,282
285,940
64,739
CO
2e
to
ns/
y
gallo
ns/
y
45
ELECTRICITY
• New Jersey averaged the sixth highest electricity prices in the Nation in 2011.*
• New Jersey's Renewable Portfolio Standard requires that 22.5 percent of electricity sold in the state come from renewable energy sources by 2021, with 17.88 percent coming from Class I and 2.5 percent coming from Class II renewable energy**.
• Class I Renewable Energy definitions include sustainable biomass, biogas, landfill gas, biogas from food waste anaerobic digestion and waste water treatment facilities.
• Average site energy consumption (127 million Btu per year) in New Jersey homes and average household energy expenditures ($3,065 per year) are among the highest in the country, according to EIA's Residential Energy Consumption Survey.
• New Jersey’s 2011 State Energy Master Plan*** identified “Biomass and Waste-to-Energy” as one of the energy generation resources.
• This section highlights possible capital costs if an emerging technology is going to be developed.
* http://www.eia.gov/state/?sid=NJ** N.J.A.C. 14:8-2.5 and 2.6 ***New Jersey State Energy Master Plan, 2011
Economic Assessment: Price of Energy
©2015 New Jersey Agricultural Experiment Station46

TRANSPORTATION
* Waste to Biofuels Market Analysis 2013, Renewable Waste Intelligence, December 2012.
Economic Assessment: Price of Energy
• Biofuels industry has two critical milestones in its development:
— Consumers and vehicle manufacturers must adopt new environmentally friendly fuels. Biofuels consumption has to displace the fossil fuels.
— Advanced biofuel manufacturers must demonstrate technical and commercial capability to meet Renewable Fuel Standard II requirements.
• Approximately 99% of all biofuel consumption in the US is in the form of 1st generation ethanol and biodiesel.
• For the past few years the conventional ethanol demand leveled due to saturation of the gasoline market with fuel containing 10% ethanol.
• In 2011 the USEPA approved the use of E15 (15 % ethanol blend) gasoline in all cars and light trucks made since 2011. However, concerns from consumers and vehicle manufacturers limit uptake. The use of E85 gasoline faces similar challenges since very few vehicles can handle the blend.
• There is a potential of advanced ethanol from energy crops, agricultural waste, MSW and algae. Progress has been slow but 15bn gallons cap for 2015 is encouraging.
• The market price of advanced ethanol is difficult to predict. Coupling fuel production with bio-products will provide wider opportunities to advanced biofuels.
• MSW, food waste, used oil and fats prove that they are becoming attractive feedstocks.
• Animal fats are attractive feedstocks for biodiesel because their cost is lower than vegetable oil.
©2015 New Jersey Agricultural Experiment Station47
BIO-BASED PRODUCTS & BIO-CHEMICALS
• Global demand is growing rapidly.
• Interest levels for low-carbon products are promising.
• Flexibility to produce bio-chemicals and bio-products secures operational continuity if market conditions become unattractive for advanced biofuels production.
• USDA Bio Preferred program and new voluntary labels of “USDA Certified BioBased Product” encourage demand for eco-friendly products.
• The availability and cost of feedstocks play an important role in development.
Economic Assessment: Price of Energy
* Waste to Biofuels Market Analysis 2013, Renewable Waste Intelligence, December 2012.
©2015 New Jersey Agricultural Experiment Station
48
©2015 New Jersey Agricultural Experiment Station
VI. Policy Recommendations/Next Steps
49

HOW CAN ADVANCED BIOFUELS GOALS (RFS) BE ACHIEVED?
• Improve Immature Technology - Most applications are not ready for commercialization, inadequate scale-up, w/o piloting
• Secure Feedstock - Energy crops, waste biomass
• Avoid Overpromising!
• Set Realistic Targets!
• Encourage Investment
• Assure Impatient Venture Capital Firms (Bioenergy vs. IT)
• Provide RDD&D Funding ($$$$)
• Help Biofuels to coexist with Low Natural Gas Prices
• Provide Long Term Policy (at several levels)
©2015 New Jersey Agricultural Experiment Station
Policy Recommendations/Next Steps: Biofuels Development
50

Policy Recommendations/Next Steps: Summary
Capturing New Jersey’s Biomass Energy Potential – Possible Policy Considerations:
Develop Policies to Provide Better Access to Biomass Resources
Make NJ a Leader in Support of New
Technologies
Integrate with Existing NJ
Petrochemical/ Refining
Infrastructure
Capitalize on Existing Policies and Practices
Address Regulatory Roadblocks and Inconsistencies
• Create incentives to develop biomass “nodes” as possible plant sites, and to increase waste diversion practices
• Establish Bioenergy Enterprise Zones
• Create incentives to support development of feedstock infrastructure
• Create educational programming to encourage more rigorous recycling efforts
• Establish/appoint a state agency with primary responsibility for developing bioenergy industry
• Create Bioenergy Innovation Fund to support ongoing R&D
• Promote NJ as premier location for biomass technology companies
• Leverage expertise in academia & pharma/ biotech industries
• Further evaluate technologies (e.g., FT, biodiesel) that may benefit from proximity to petrochemical infrastructure
• Engage industry experts in efforts to develop workable solutions
• Integrate new efforts (i.e. biofuels) with existing policies (e.g. RPS, Clean Energy Program, & MSW recycling reqs.)
• Should not undermine the viability of RPS projects such as waste incineration
• Analyze highest and best use of feedstocks by measuring the value of tradeoffs of alternative uses
• Biomass feedstocks and end products may be subject to different regulatory oversight; need to identify and address incongruous policies and regulations
• Streamline regulatory process
©2015 New Jersey Agricultural Experiment Station51
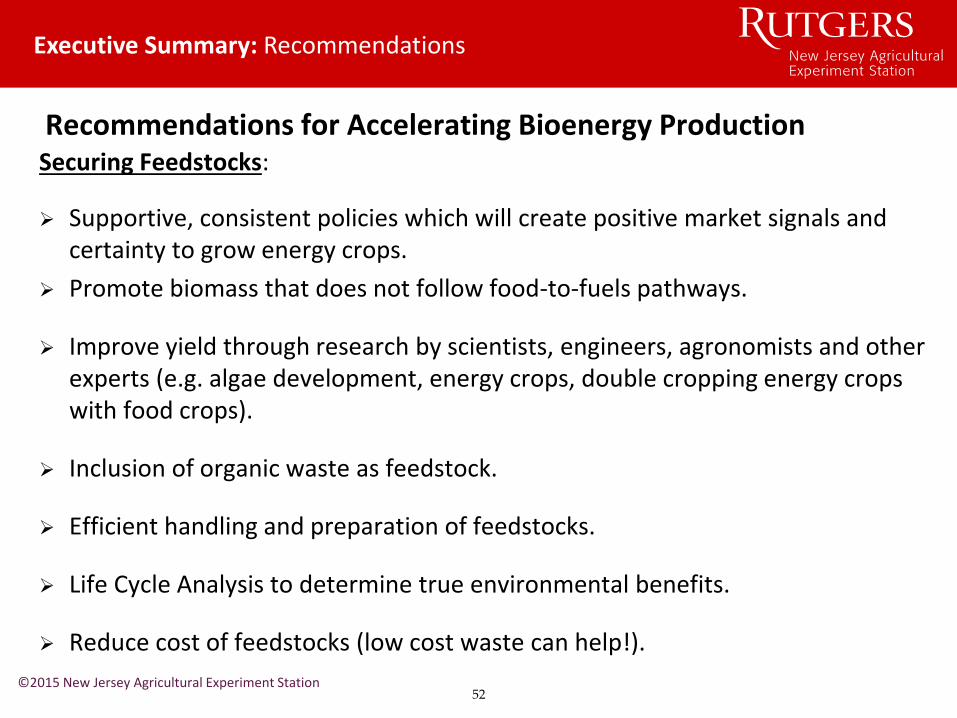
Recommendations for Accelerating Bioenergy ProductionSecuring Feedstocks:
Supportive, consistent policies which will create positive market signals and certainty to grow energy crops.
Promote biomass that does not follow food-to-fuels pathways.
Improve yield through research by scientists, engineers, agronomists and other experts (e.g. algae development, energy crops, double cropping energy crops with food crops).
Inclusion of organic waste as feedstock.
Efficient handling and preparation of feedstocks.
Life Cycle Analysis to determine true environmental benefits.
Reduce cost of feedstocks (low cost waste can help!).
©2015 New Jersey Agricultural Experiment Station
Executive Summary: Recommendations
52

Recommendations for Accelerating Bioenergy Production
Technology Development:
Supportive, consistent policies to create positive market signals and certainty
Secure feedstock supply - long term contracts eliminate/reduce risk
Scientists, engineers and other experts - integrate science & engineering teams with demonstration plant and industrial partners at an early stage
Test-beds for scale-up, pilot testing and verification
Life Cycle Analysis to determine true environmental benefits
Funding for RD&D and investment for commercialization
Process flexibility to accommodate varying inbound biomass composition and maximize revenue potential
Provide process, economic and dynamic modeling from plant operating data
Transparency (at some level)
©2015 New Jersey Agricultural Experiment Station
Executive Summary: Recommendations
53
Contact Information
Project Co-Directors
Margaret Brennan-Tonetta, Ph.D., Associate Director New Jersey Agricultural Experiment Station Rutgers, the State University of New Jersey
88 Lipman Drive, Rm. 113 New Brunswick, NJ 08901
Serpil Guran, Ph.D., DirectorThe Rutgers EcoComplex
1200 Florence-Columbus RoadBordentown, NJ 08505609-499-3600 x 4225
[email protected]©2015 New Jersey Agricultural Experiment Station
54
For more information, a detailed report and the bioenergy calculator can be found at:
http://ecocomplex.rutgers.edu/BiomassEnergyPotential.html