Embed Size (px)
Citation preview
Scholars' Mine Scholars' Mine
Masters Theses Student Theses and Dissertations
Spring 2013
Assessment of an enterprise employee portal using dashboard Assessment of an enterprise employee portal using dashboard
monitoring system: a case study monitoring system: a case study
Aditi Mishra
Follow this and additional works at: https://scholarsmine.mst.edu/masters_theses
Part of the Computer Sciences Commons
Department: Department:
Recommended Citation Recommended Citation Mishra, Aditi, "Assessment of an enterprise employee portal using dashboard monitoring system: a case study" (2013). Masters Theses. 5373. https://scholarsmine.mst.edu/masters_theses/5373
This thesis is brought to you by Scholars' Mine, a service of the Missouri S&T Library and Learning Resources. This work is protected by U. S. Copyright Law. Unauthorized use including reproduction for redistribution requires the permission of the copyright holder. For more information, please contact [email protected].

0
0
0
ASSESSMENT OF AN ENTERPRISE EMPLOYEE PORTAL USING DASHBOARD MONITORING SYSTEM: A CASE STUDY
by
ADITI MISHRA
A THESIS
Presented to the Graduate Faculty of the
THE MISSOURI UNIVERSITY OF SCIENCE AND TECHNOLOGY
In Partial Fulfillment of the Requirements for the Degree
MASTER OF SCIENCE IN INFORMATION SCIENCE AND
TECHNOLOGY
2013
Approved by
Dr. Bih-Ru Lea, Advisor
Dr. Barry Flachsbart
Dr. Wen-Bin Yu

0
0
iii
iii
ABSTRACT
A portal is a browser-based application that provides a web platform for
users to improve inter-department collaboration and customer service. Portals
are classified either as internal facing portals or external public facing portals.
This study addresses the problems facing an internal portal related to its
contents, functions and usability and provides a list of essential contents and
functions that it should include through integrating theories and industry best
practices. The theory framework is based on literature review and the industry
best practices are based on the analysis of a number of internal portals of
companies used as case studies. These two were compared to develop an
information mapping grid to identify gaps between theories and practices.
A case company was used to uncover additional insights on employee
portal content and functionalities through the analysis of actual and perceived
user portal usage. The results were then compared using an information
mapping grid to derive a set of content and functionalities to improve usability
of an internal employee portal.
Results of this study indicate that customization and personalization is
an important feature of an employee portal, however, features pertaining to
communication and collaboration support, search support, help system and
employee self-services appear to be more important in practice.
The information mapping grid derived, the data warehouse architecture
developed and the Dashboard Monitoring systems created to assess usability of
an employee portal are applicable to similar enterprises.

iv
ACKNOWLEDGEMENTS
It would not have been possible for me to write this thesis without the
help and support of the kind, helpful and supportive people around me.
Above all I extend my heartfelt gratitude to Dr. Bih-Ru Lea, my advisor
and the Director of the Center for ERP at Missouri University of Science and
Technology for trusting in me, giving me chance to be a part of this research
and for all the guidance and motivation she has provided to me throughout this
process.
I am grateful to Dr. Wen-Bin Yu and Yuh-Puu Han, who have helped me
whenever I needed them. I would thank Dr. Flachsbart for his continuous
guidance to improve this thesis and bring it to this shape.
I would like to thank Jody Socha, Daniel Sequeira, Kathleen Bartlett and
Stephanie Schejbal and their portal team at Peabody Energy for providing
insightful comments to improve my research.
I would like to thank the Department of Business and Information
Technology and the Office of Graduate Studies of the Missouri University of
Science and Technology for giving me this opportunity.
Finally, I would thank my family and friends for their love and support. I
would like to recognize Saket and Karthik for their unceasing help in compiling
this paper.
v
TABLE OF CONTENTS
Page
ABSTRACT .................................................................................. iii
ACKNOWLEDGEMENTS .................................................................... iii
LIST OF ILLUSTRATIONS .................................................................. ix
LIST OF TABLES........................................................................... xii
SECTION 1. INTRODUCTION ..................................................................... 1
2. LITERATURE REVIEW ............................................................... 6
2.1. ENTERPRISE EMPLOYEE PORTAL .............................................. 6
2.1.1. Definition. ............................................................... 6
2.1.2. History and Evolution. ................................................. 7
2.1.3. Architecture. .......................................................... 10
2.1.4. Contents and Functions. ............................................. 12
2.1.4.1. Information items associated with customization and personalization function. ........................... 12
2.1.4.2. Information items associated with communication and collaboration function. .............................. 13
2.1.4.3. Information items associated with the security and safety function. ............................................ 15
2.1.4.4. Information items associated with the proactive search function. ........................................... 15
2.1.4.5. Information items associated with Employee Self-Service. ..................................................... 16
2.1.5. Design. ................................................................. 16
2.1.5.1. Canonical structure in portals. .......................... 17
2.1.5.2. Structuring the homepage for an enterprise portal. . 18
2.1.5.3. Grouping of pages in a portal. .......................... 19
2.1.5.4. Information Architecture in a portal system. ......... 22
2.1.5.5. Classifying content with taxonomy. .................... 23
2.1.6. Implementation. ...................................................... 24
2.1.6.1. Content management. ................................... 24
2.1.6.2. People and processes. .................................... 25
2.1.6.3. Consulting users. .......................................... 26
vi
2.2. PERFORMANCE DASHBOARD ................................................ 29
2.2.1. Definition. ............................................................. 29
2.2.2. History and Evolution. ............................................... 30
2.2.3. Functionalities. ....................................................... 31
2.2.4. Advantages of Using a Performance Dashboard. ................. 32
2.2.5. Classification of Different Types of Dashboards. ................ 32
2.3. USABILITY AND EFFECTIVENESS ............................................ 33
2.3.1. Definition. ............................................................. 33
2.3.2. History and Evolution of Usability. ................................. 34
2.4. CHALLENGES FACING ENTERPRISE PORTAL ............................... 37
2.4.1. Integration of Business Processes or Components. .............. 37
2.4.2. Usefulness. ............................................................ 37
2.4.3. Cost. .................................................................... 38
2.4.4. Compatibility. ......................................................... 39
2.4.4.1. Ease of integration. ....................................... 39
2.4.4.2. Platform independence. ................................. 39
2.4.4.3. Reliability. ................................................. 40
2.4.4.4. Scalability. ................................................. 40
2.4.4.5. Usability. ................................................... 41
2.5. PORTAL EVALUATION MODEL ............................................... 41
2.6. BALANCED SCORECARD ...................................................... 45
3. METHODOLOGY ................................................................... 47
3.1 INDUSTRY STANDARDS AND BEST PRACTICES.............................. 48
3.1.1. Literature Review. ................................................... 48
3.1.2 Case Studies. ........................................................... 49
3.2 USER PERCEIVED PORTAL USAGE ........................................... 50
3.2.1. Company Visit. ........................................................ 50
3.2.2. Third – Party Evaluation. ............................................ 51
3.3. ACTUAL PORTAL USAGE ..................................................... 51
3.3.1. Knowledge Management Data. ..................................... 52
3.3.2. ClickStream Data from Sweetlets. ................................. 52
vii
3.3.3 Technical Implementation. .......................................... 53
3.3.3.1. Data warehouse creation. ............................... 53
3.3.3.2. Dashboard implementation. ............................. 54
3.4. COMPARISION AND ANALYSIS ............................................... 56
4. RESULTS AND DISCUSSIONS ...................................................... 58
4.1. INDUSTRY STANDARDS AND BEST PRACTICES............................. 58
4.1.1. Literature Review. ................................................... 58
4.1.2. Case Studies. .......................................................... 59
4.1.2.1. Customization and Personalization. .................... 60
4.1.2.2. Communication and Collaboration. .................... 65
4.1.2.3. Search Function. .......................................... 81
4.1.2.4. Help and FAQ. ............................................. 83
4.1.2.5. Self Services. .............................................. 85
4.1.3. Information Mapping Grid. .......................................... 91
4.2. USER PERCEIVED PORTAL USAGE .......................................... 94
4.2.1. Company Visits. ....................................................... 94
4.2.1.1. Financial Perspective. .................................... 95
4.2.1.2. Customer Perspective. ................................... 95
4.2.1.3. Learning and Growth Perspective of KM data. ....... 96
4.2.1.4. Learning and growth perspective. ...................... 98
4.2.1.5. Internal Process Perspective. ........................... 98
4.2.2. Third–Party Evaluation. ............................................. 102
4.2.2.1. Methods of study. ........................................ 102
4.2.2.2. Inference. ................................................. 103
4.3. ACTUAL PORTAL USAGE .................................................... 107
4.3.1. Knowledge Management Data. .................................... 107
4.3.2. ClickStream Data. ................................................... 107
4.3.3. Technical Implementation. ........................................ 108
4.3.3.1. Data warehouse creation. .............................. 108
4.3.3.2. Dashboard implementation. ............................ 109
4.4. COMPARISION AND ANALYSIS .............................................. 121
viii
4.4.1. Industry Standards and Best Practices. .......................... 121
4.4.2. Actual Portal Usage. ................................................ 126
4.4.3. User Perceived Portal Usage. ...................................... 130
4.4.4. Recommendations ................................................... 132
5. SUMMARY, CONCLUSION, CONTRIBUTIONS AND FUTURE DIRECTIONS ... 139
5.1. RESEARCH SUMMARY AND CONCLUSION .................................. 139
5.2 RESEARCH CONTRIBUTIONS ................................................. 147
5.3 RESEARCH LIMITATIONS ..................................................... 148
5.4 FUTURE DIRECTIONS ......................................................... 149
APPENDICES A. TECHNICAL DETAILS OF THE DATA WAREHOUSE IN SAP ..................... 151
B. TECHNICAL DETAILS OF THE DASHBOARD MONITORING SYSTEM ........... 159
REFERENCES ............................................................................. 172
VITA ....................................................................................... 178
ix
LIST OF ILLUSTRATIONS
Page
Figure 1.1. Research Framework ........................................................ 5
Figure 2.1. Corporate Portal Framework ............................................. 11
Figure 2.2. Composite Image of 10 Portal Homepages. ............................ 18
Figure 2.3. Simple Hyperlinking Scheme. ............................................ 20
Figure 2.4. Hierarchical Patterns. ..................................................... 21
Figure 2.5. Navigation Sets Grouping Highly Linked Pages. ....................... 22
Figure 2.6. Intranet Effectiveness and Efficiency Model for Portal Evaluation . 42
Figure 2.7. Basis of Evaluation of a Portal ........................................... 43
Figure 3.1. Solution Approach Overview ............................................. 48
Figure 4.1. Social Networking .......................................................... 61
Figure 4.2. Customized for Specific Users ........................................... 62
Figure 4.3. Personalized Homepage .................................................. 63
Figure 4.4. Change layout Functionality ............................................. 64
Figure 4.5. Change Layout Functionality ............................................. 64
Figure 4.6. E-room/Digital Workspace ............................................... 65
Figure 4.7. Blogging ..................................................................... 67
Figure 4.8. Policies and Guidelines ................................................... 68
Figure 4.9. My Links, News and Events ............................................... 69
Figure 4.10. Portal Feedback .......................................................... 70
Figure 4.11. Suggestion Box ............................................................ 70
x
Figure 4.12 Communities ............................................................... 71
Figure 4.13. Employee Information Organizational Chart ......................... 72
Figure 4.14. Interactive Organizational Chart ....................................... 73
Figure 4.15. Calendar ................................................................... 74
Figure 4.16. E-mail ZotMail ............................................................ 75
Figure 4.17. Tools and Applications ................................................... 76
Figure 4.18. Live Video ................................................................. 77
Figure 4.19. Web Communication ..................................................... 78
Figure 4.20. Collaboration.............................................................. 79
Figure 4.21. 85-85 Rule ................................................................. 80
Figure 4.22. Threaded Discussion ..................................................... 81
Figure 4.23. Drop-down search ........................................................ 82
Figure 4.24. Advanced Search ......................................................... 83
Figure 4.25. Help ........................................................................ 84
Figure 4.26. FAQ ......................................................................... 85
Figure 4.27. HR Self Service............................................................ 87
Figure 4.28. Leaves Balance ........................................................... 88
Figure 4.29. Travel Services ........................................................... 89
Figure 4.30. Training .................................................................... 90
Figure 4.31. Dashboard ................................................................. 91
Figure 4.37. First Tab of the KM dashboard ........................................ 111
Figure 4.38. Second Tab of KM dashboard .......................................... 111
Figure 4.39. Tab 1 of First Iteration ................................................. 115
xi
Figure 4.40. Second Tab of First Iteration .......................................... 116
Figure 4.41. Third Tab of First Iteration ............................................ 117
Figure 4.42. Tab 1 of Second Iteration .............................................. 119
Figure 4.43. Second Tab of Second Iteration ....................................... 120
Figure 5.1. Solution Approach ........................................................ 142
xii
LIST OF TABLES
Page
Table 2.1. Evolution of Computing ...................................................... 8
Table 2.2. Contents and Function of the Enterprise Employee Portal ........... 27
Table 2.3. Example of ranking of key metrics for portal evaluation ............. 44
Table 2.4. Examples of one metric breakdown for unique users using IEEM .... 44
Table 4.1. Information Mapping Grid ................................................. 92
Table 4.2: KPI table (Knowledge Management data) ............................... 97
Table 4.3. KPI table (ClickStream Data) – Learning and Growth Perspective .. 100
Table 4.4. KPI table (ClickStream Data) – Internal Process Perspective ........ 101
Table 4.5. Third – Party Evaluation Results ......................................... 106
Table 4.6. Overall design of the dashboard – Tactical to Strategic ............. 113
Table 4.7. Industry Standards and Best Practices – Comparison and Analysis . 124
Table 4.8. Actual Portal Usage – Knowledge Management Perspective ........ 126
Table 4.9. Actual Portal Usage – ClickStream data perspective ................. 127
Table 4.10. Actual Portal Usage ...................................................... 129
Table 4.11. Combined 3 Pronged Approach ........................................ 135
Table 4.12 Summary of Recommendations. ........................................ 138
Table 5.1 Research Summary ......................................................... 146
1
1
1. INTRODUCTION
An enterprise portal can be defined as a single point of access (SPOA) for
pooling, organizing, interacting, and distributing organizational knowledge
(Bock, 2001; Kendler, 2000). Portals may be internal or external. This research
is focused on an internal portal. An internal portal helps to establish a common
platform for all employees in a company for internal purposes such as search,
communication and collaboration, document sharing, and information
dissemination. This brings all the users in the company closer regardless of
global diversity of location or culture.
There are many problems facing internal enterprise portals, mostly
related to the integration of business processes and components, realizing the
utility and usefulness of the portal, cost of implementation, and maintaining
compatibility. Usability, scalability, reliability and platform independence of
the portal are also very important factors to be kept in mind while
implementing an internal portal (Urbach et al.,2010; Tojib et al. 2008; Hussein
et. al, 2008; Bin Masrek, 2007). In order to address these issues, the right set of
contents and functions must be identified and incorporated into the portal to
improve its structure, navigation and usability. Furthermore, analyzing the raw
data from portal logs and transforming it into meaningful information can help
identify the true usage of the portal and help identify strengths and
weaknesses in the portal.
2
The main objective of this research was to provide recommendations for
the improvement of efficiency and effectiveness of an internal employee
portal. An information mapping grid was developed by combining theory from
the literature review and industry standards from the case study of various
companies that currently use internal employee portals.
Literature was reviewed to develop different information categories
under which the Contents and Functions of an internal employee portal were
then categorized. The different information categories included
“Personalization and Customization,” “Communication and Collaboration
tools,” “Employee Self-Service,” “Search functionality,” “Help,” and “FAQ.”
Furthermore, other information items were added under each information
category. For example, “Blogs,” “Threaded Discussion,” “News,” “Policies and
Guidelines,” “Document Sharing,” “Employee Directory,” were a few of the
information items under the information category of “Communication and
Collaboration tools.” The literature review was analyzed to determine what
percentage of the documents supported each information item and each
information category.
A number of company portals were used as case studies and the
different information items and information categories in each case study was
analyzed and documented. The portal contents and functions referenced in the
literature and the contents and functions referenced in case studies were
combined and summarized within an Information mapping grid to create a
comprehensive list of Industry Standards and Best Practices.
3
The Industry Standards and Best Practices mentioned in the Information
Mapping Grid were compared and contrasted with the Actual Portal usage and
user-perceived portal usage of a case company in a three-pronged research
methodology.
To determine the actual portal usage, the usage logs of the case
company’s portal were taken into consideration. The portal usage logs were
difficult to interpret in their initial raw form, so the data was cleaned and a
data warehouse was created and used to develop dashboard monitoring
systems that were in turn used to monitor the actual usage of the portal of the
case company. The dashboards identified which webpages, sections and
subsections of the portal were visited most frequently, and which webpages,
sections and subsections which were visited the least. These metrics were
determined based on the number of page-views, the number of user logins and
the number of unique users, which provided insight into the contents and
functions of the company’s portal and their usage.
The user-perceived portal usage was determined by on-site visits to the
case company as well as the results from a third party evaluation of multiple
target user groups. The goal was to gather user expectations of the employee
portal in terms of how they perceived its contents and functions.
The contents and functions of the portal from the actual portal usage
and user-perceived portal usage data were compared and analyzed with the
Information mapping Grid and analyzed to derive a set of contents and
4
functions recommendations for the internal portal, which was presented to the
case company.
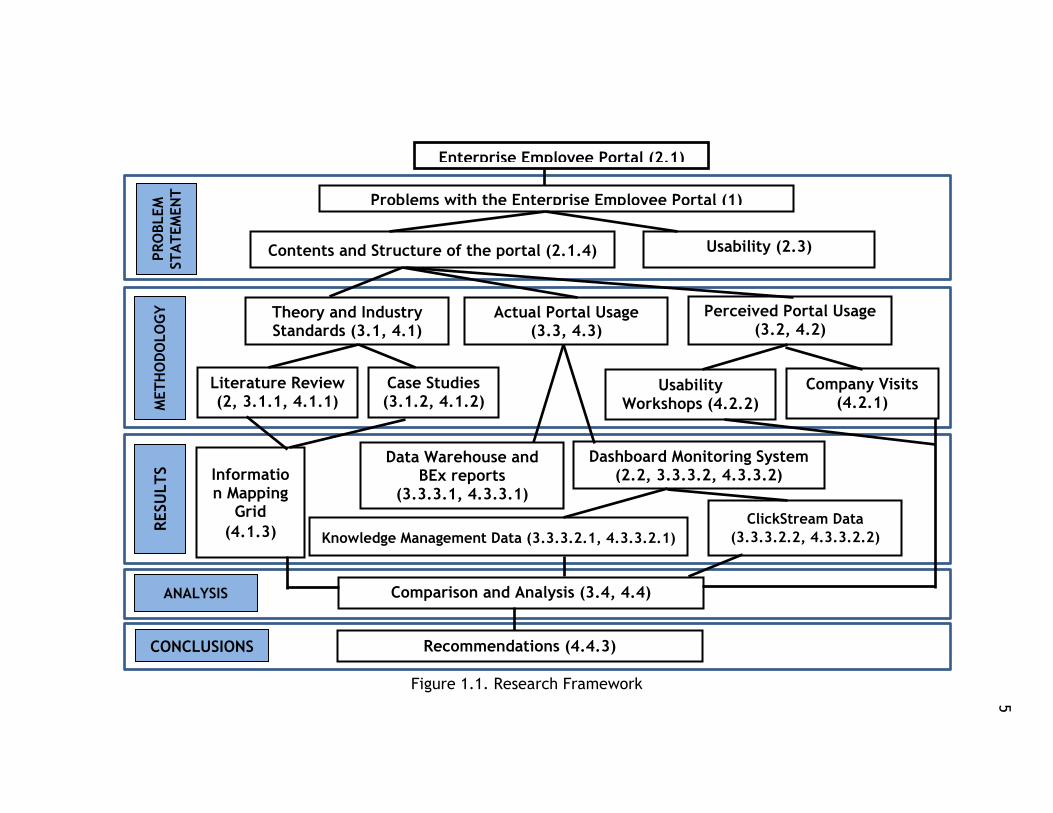
The overall research framework has been schematically represented in
Figure 1.1. The numbers in parenthesis located in each block indicate the
corresponding section of this thesis.
This study provides a brief literature review, an overview of
methodologies used, the results derived from the study, conclusions,
contributions, and future research directions.
5
5
Figure 1.1. Research Framework
Enterprise Employee Portal (2.1)
Problems with the Enterprise Employee Portal (1)
Contents and Structure of the portal (2.1.4) Usability (2.3)
Theory and Industry Standards (3.1, 4.1)
Actual Portal Usage (3.3, 4.3)
Perceived Portal Usage (3.2, 4.2)
Literature Review (2, 3.1.1, 4.1.1)
Case Studies (3.1.2, 4.1.2)
Data Warehouse and BEx reports
(3.3.3.1, 4.3.3.1)
Dashboard Monitoring System (2.2, 3.3.3.2, 4.3.3.2)
Usability Workshops (4.2.2)
Company Visits (4.2.1)
Knowledge Management Data (3.3.3.2.1, 4.3.3.2.1)
ClickStream Data
(3.3.3.2.2, 4.3.3.2.2)
Comparison and Analysis (3.4, 4.4)
Recommendations (4.4.3)
Information Mapping
Grid
(4.1.3) RESU
LT
S
ANALYSIS
MET
HO
DO
LO
GY
CONCLUSIONS
PR
OBLEM
ST
AT
EM
EN
T
5
6
6
2. LITERATURE REVIEW
Literature review has been carried out on an Enterprise Employee portal
with special focus on its contents and functions. This helps in establishing
Industry Standards and Best Practices as suggested in the research framework
(Figure 1.1). Literature has also been reviewed about Performance Dashboards
because dashboards were selected as an effective way to develop a Portal
monitoring system that transforms unstructured log data file into useful
information to assess actual portal usage. Literature review on Usability was
carried out to understand how it is very important to the portals to make them
efficient and effective.
2.1. ENTERPRISE EMPLOYEE PORTAL
The following section provides a brief Literature review of a portal in
terms of definition, history and evolution, architecture, contents, design and
content-management. This is the first level in the research framework shown in
Figure 1.1.
2.1.1. Definition. A portal is a browser-based application that allows
knowledge workers to gain access to, collaborate with, make decisions, and
take action on a wide variety of business-related information, regardless of the
employee’s virtual location or department affiliations, the location of the
information, or the format in which the information is stored (Collins, 2002).
5
7
While it is true that enterprise portals are useful because this technology can
bring about cost reduction, organized and structured information, and reduced
access time, their competitive advantage is inherent in their abilities to filter,
target, and categorize information so that users will get only what is needed
(Eckel, 2000).
2.1.2. History and Evolution. Corporate and enterprise portals have
grown exponentially in recent years. The corporate portal is customarily
structured around roles found inside an organization; the enterprise portal
expands to include customers, vendors, and other roles outside the
organization. (Collins, 2001)
By delivering solutions and services over the Web, portal technology
enables businesses to blur boundaries and “reach out to, and interact with its
clients, partners, vendors, and employees.” The portal becomes “a single point
of entry, a single point of access, and a single point of information
interchange.” (Hazra, 2002)
Employees throughout an organization are responsible for making
strategic and operational decisions every day. Many data sources, systems and
applications need to be combined. Using the employee portal, employees are
able to access corporate information using a web browser. It provides an
interface to a multitude of applications and an exponentially growing number
of documents [as well as] a central location to access specific screens or
reports from applications or documents relative to work process at hand, and
seamless integration to several enterprise systems. (Collins, 2002)
8
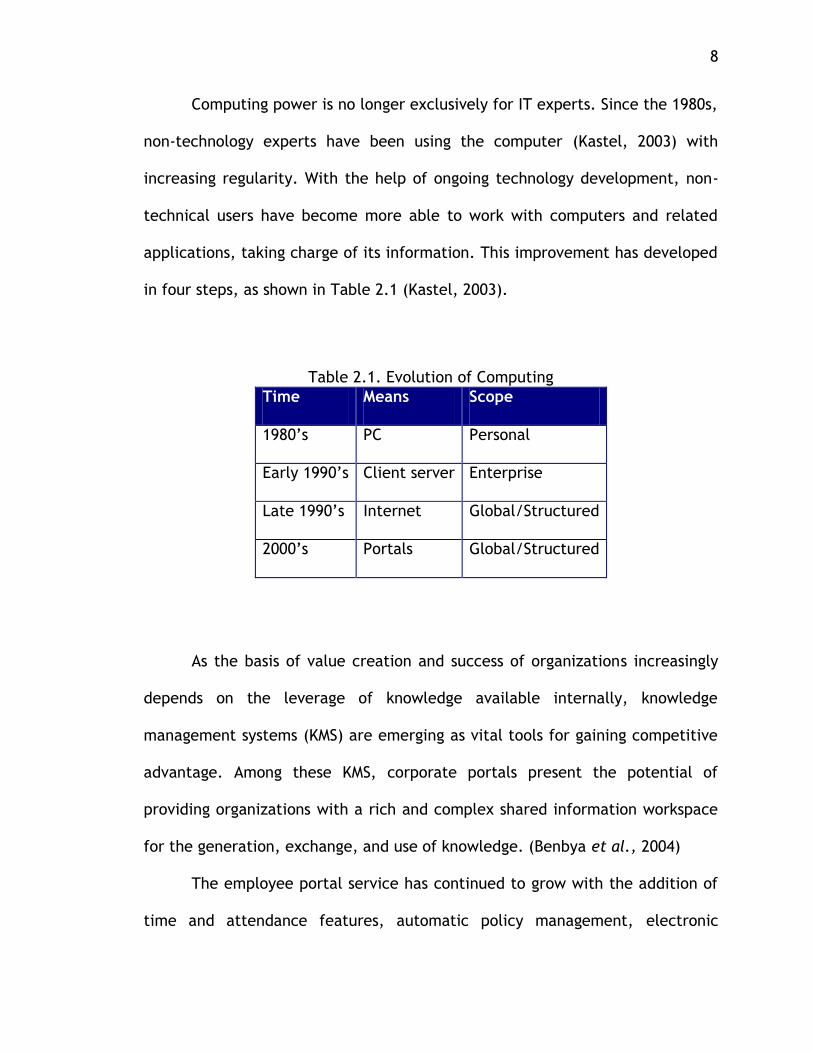
Computing power is no longer exclusively for IT experts. Since the 1980s,
non-technology experts have been using the computer (Kastel, 2003) with
increasing regularity. With the help of ongoing technology development, non-
technical users have become more able to work with computers and related
applications, taking charge of its information. This improvement has developed
in four steps, as shown in Table 2.1 (Kastel, 2003).
Table 2.1. Evolution of Computing
Time Means Scope
1980’s PC Personal
Early 1990’s Client server Enterprise
Late 1990’s Internet Global/Structured
2000’s Portals Global/Structured
As the basis of value creation and success of organizations increasingly
depends on the leverage of knowledge available internally, knowledge
management systems (KMS) are emerging as vital tools for gaining competitive
advantage. Among these KMS, corporate portals present the potential of
providing organizations with a rich and complex shared information workspace
for the generation, exchange, and use of knowledge. (Benbya et al., 2004)
The employee portal service has continued to grow with the addition of
time and attendance features, automatic policy management, electronic
9
forms, task management and most recently a custom database creation
capability. (Business Wire, 2010)
The employee homepage should aggregate all content relevant to an
employee in one place, like schedules, messages, polls, an avatar feature
and/or other customizable widgets. It could also include weather forecasts
from places like AccuWeather and also other optional features to give it a
personalized touch. The design of the employee portal should aim at improving
communication and recognition among employees. It could have a task feature
with User specified permissions to Digital-Logbook which would allow managers
to assign tasks to individuals and track them to completion. (Business Wire,
2010)
Portal technology is evolving rapidly to meet current requirements and
anticipate the next wave of demands. New ideas, along with new vendors and
business and deployment models, are entering the market. Companies want
portals to provide richer, more-intuitive and engaging user experiences
appropriate to their employees, customers and partners. They want social
capabilities built in.
The next generation of the portal, and the technologies and vendors that
will enable it, will cover the portal’s role and relationship with the UXP (User
Experience Platform), Emerging portal offerings in the cloud, Portal-less portal
alternatives and open-source offerings that are beginning to exhibit success.
(Phifer, 2011)
10
2.1.3. Architecture. Enterprise portals have fairly complex structures
and features. However, their basic functions and elements are relatively easy
to define. First, from an operational perspective, the strength of corporate
portals lies in their ability to provide Web based access to enterprise
information, applications and processes. Second, from a functional
perspective, they leverage existing information systems, data stores, networks,
workstations, servers and applications as well as other knowledge bases to give
each employee in every corporate site immediate access to an invaluable set of
corporate data anytime, anywhere (Kendler, 2000; White, 2000). These
capabilities are made possible because the generic framework is essentially
focused on delivering information to the users from disparate databases.
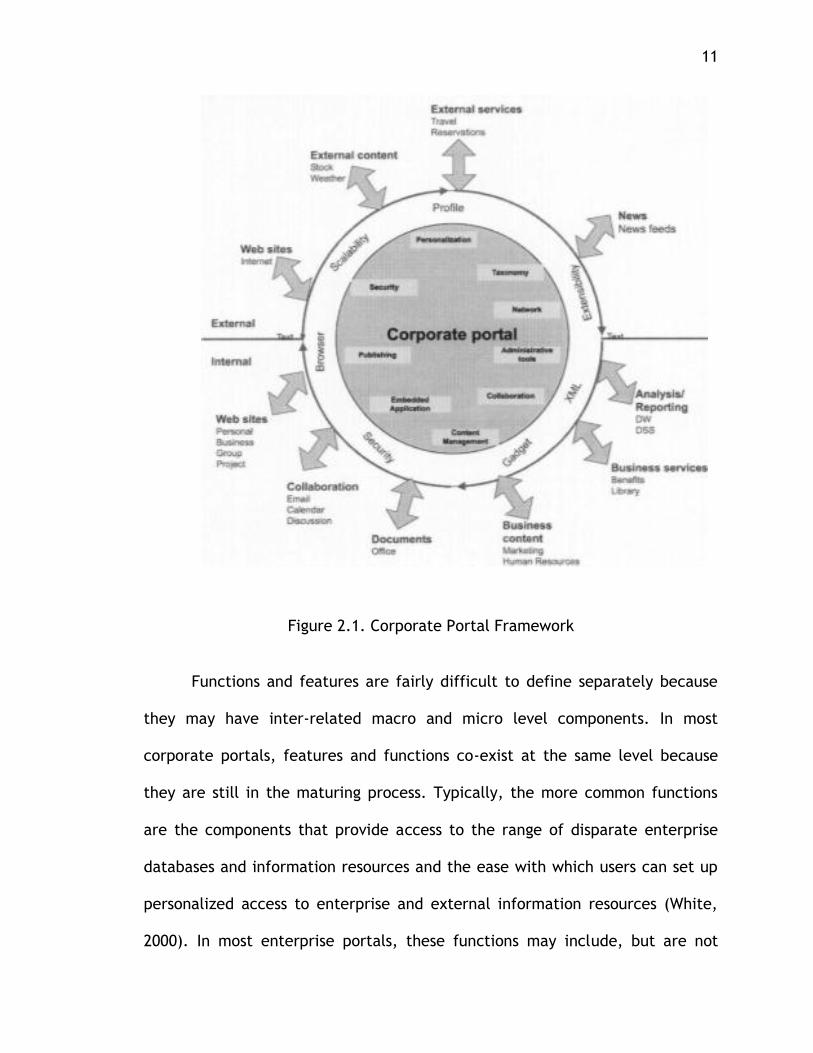
As seen in Figure 2.1, below, the enterprise portal framework essentially
consists of two primary layers. At the core of any portal framework are the
applications it supports. These applications can be quite diverse. They can
range from unit specific to organizational wide capabilities, staff to
administrative support functions, and individual to system-wide inquiries. Both
internal and external stakeholders can access all of these applications. These
stakeholders or users are located outside the second layer consisting of various
Web-based drivers. These drivers are the means for the openness and easy
access capabilities to the disparate databases and reports generated. (Raol et
al., 2003)
11
Figure 2.1. Corporate Portal Framework
Functions and features are fairly difficult to define separately because
they may have inter-related macro and micro level components. In most
corporate portals, features and functions co-exist at the same level because
they are still in the maturing process. Typically, the more common functions
are the components that provide access to the range of disparate enterprise
databases and information resources and the ease with which users can set up
personalized access to enterprise and external information resources (White,
2000). In most enterprise portals, these functions may include, but are not
12
limited to security, network, administrative tools, search, content
management, collaboration personalization, extensibility, [ease of] use, and
scalability (Eckerson, 2000; Gates, 2001; Rapoza, 2000).
An employee portal can be assessed from three broad perspectives;
namely, “contents and functions,” “design,” and “implementation.”
2.1.4. Contents and Functions. Employee portals have been put to
many uses. They are utilized by many companies to improve their information
exchange, communication, employee collaboration, and to better support their
business processes. Owing to limited IT budgets and the need to justify
investments in employee portals, assessing the benefits of these is an
important field in research and practice. (Urbach et al, 2010)
The contents and functions of an enterprise portal have many
information categories. The most important ones include: “Customization and
Personalization,” “Collaboration and Communication,” “Security,” “Search
Function,” and “Employee Self-Service.” Each information category has
information items associated with it.
The case company had major problems with determining the right set of
contents and functions for their internal employee portal. This falls under the
“Problem Statement" block of the research framework shown in Figure 1.1.
2.1.4.1. Information items associated with customization and
personalization function. Customization and Personalization play a crucial
role in the design of a portal functionality and content. It helps the users relate
to the portal, allowing them to Personalize their work space, giving it their
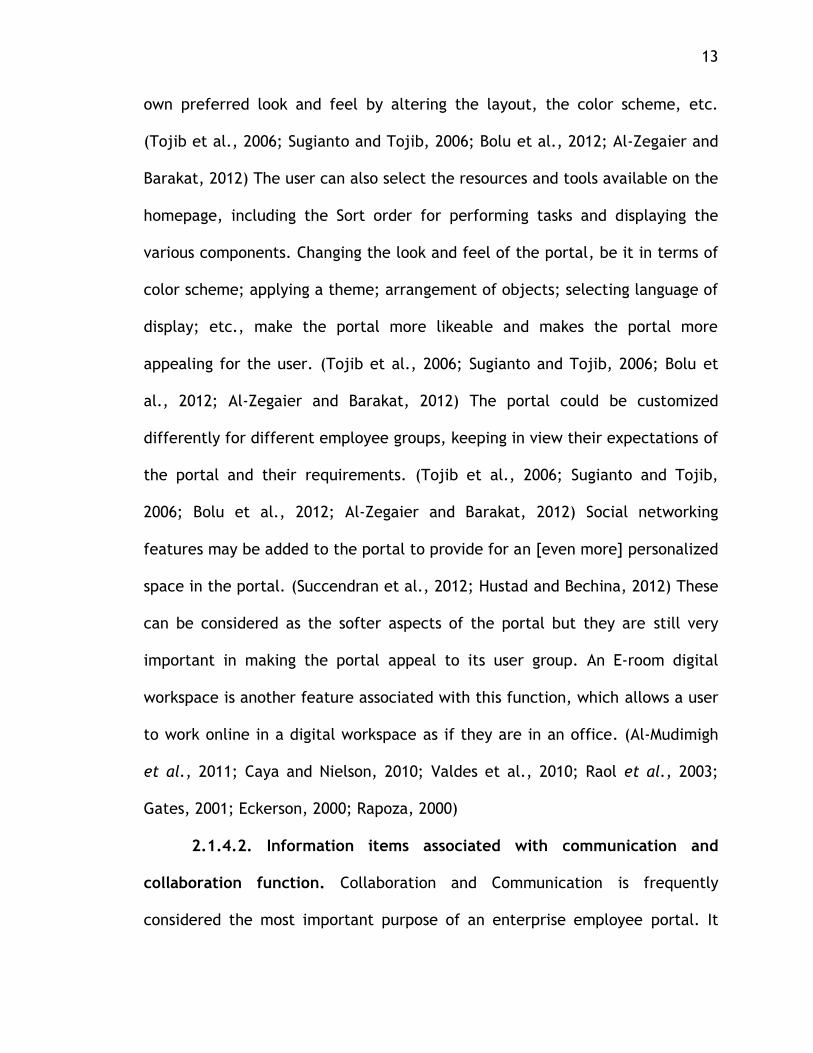
13
own preferred look and feel by altering the layout, the color scheme, etc.
(Tojib et al., 2006; Sugianto and Tojib, 2006; Bolu et al., 2012; Al-Zegaier and
Barakat, 2012) The user can also select the resources and tools available on the
homepage, including the Sort order for performing tasks and displaying the
various components. Changing the look and feel of the portal, be it in terms of
color scheme; applying a theme; arrangement of objects; selecting language of
display; etc., make the portal more likeable and makes the portal more
appealing for the user. (Tojib et al., 2006; Sugianto and Tojib, 2006; Bolu et
al., 2012; Al-Zegaier and Barakat, 2012) The portal could be customized
differently for different employee groups, keeping in view their expectations of
the portal and their requirements. (Tojib et al., 2006; Sugianto and Tojib,
2006; Bolu et al., 2012; Al-Zegaier and Barakat, 2012) Social networking
features may be added to the portal to provide for an [even more] personalized
space in the portal. (Succendran et al., 2012; Hustad and Bechina, 2012) These
can be considered as the softer aspects of the portal but they are still very
important in making the portal appeal to its user group. An E-room digital
workspace is another feature associated with this function, which allows a user
to work online in a digital workspace as if they are in an office. (Al-Mudimigh
et al., 2011; Caya and Nielson, 2010; Valdes et al., 2010; Raol et al., 2003;
Gates, 2001; Eckerson, 2000; Rapoza, 2000)
2.1.4.2. Information items associated with communication and
collaboration function. Collaboration and Communication is frequently
considered the most important purpose of an enterprise employee portal. It
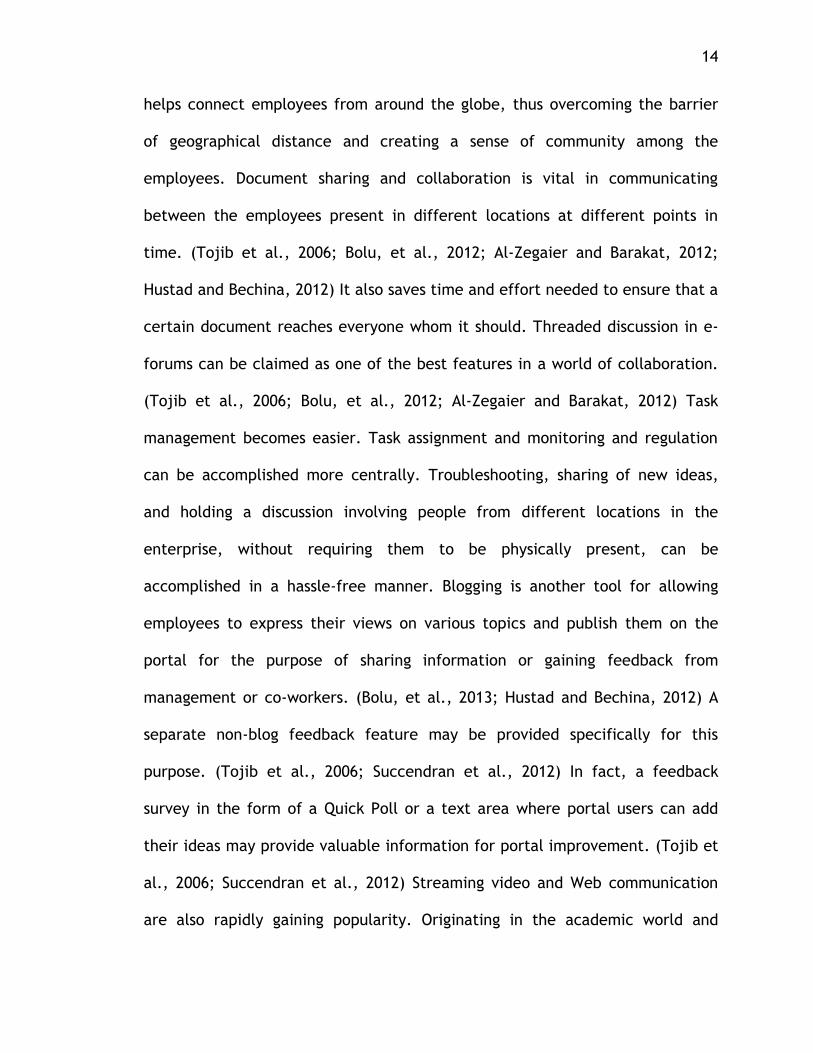
14
helps connect employees from around the globe, thus overcoming the barrier
of geographical distance and creating a sense of community among the
employees. Document sharing and collaboration is vital in communicating
between the employees present in different locations at different points in
time. (Tojib et al., 2006; Bolu, et al., 2012; Al-Zegaier and Barakat, 2012;
Hustad and Bechina, 2012) It also saves time and effort needed to ensure that a
certain document reaches everyone whom it should. Threaded discussion in e-
forums can be claimed as one of the best features in a world of collaboration.
(Tojib et al., 2006; Bolu, et al., 2012; Al-Zegaier and Barakat, 2012) Task
management becomes easier. Task assignment and monitoring and regulation
can be accomplished more centrally. Troubleshooting, sharing of new ideas,
and holding a discussion involving people from different locations in the
enterprise, without requiring them to be physically present, can be
accomplished in a hassle-free manner. Blogging is another tool for allowing
employees to express their views on various topics and publish them on the
portal for the purpose of sharing information or gaining feedback from
management or co-workers. (Bolu, et al., 2013; Hustad and Bechina, 2012) A
separate non-blog feedback feature may be provided specifically for this
purpose. (Tojib et al., 2006; Succendran et al., 2012) In fact, a feedback
survey in the form of a Quick Poll or a text area where portal users can add
their ideas may provide valuable information for portal improvement. (Tojib et
al., 2006; Succendran et al., 2012) Streaming video and Web communication
are also rapidly gaining popularity. Originating in the academic world and
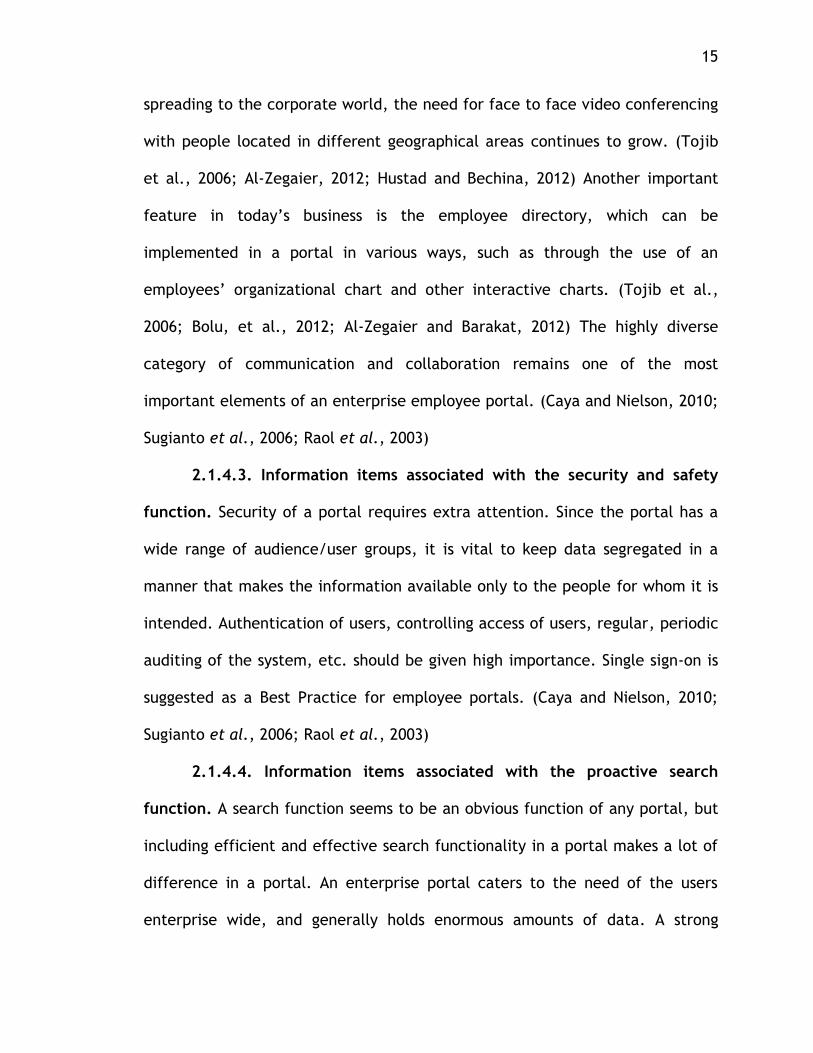
15
spreading to the corporate world, the need for face to face video conferencing
with people located in different geographical areas continues to grow. (Tojib
et al., 2006; Al-Zegaier, 2012; Hustad and Bechina, 2012) Another important
feature in today’s business is the employee directory, which can be
implemented in a portal in various ways, such as through the use of an
employees’ organizational chart and other interactive charts. (Tojib et al.,
2006; Bolu, et al., 2012; Al-Zegaier and Barakat, 2012) The highly diverse
category of communication and collaboration remains one of the most
important elements of an enterprise employee portal. (Caya and Nielson, 2010;
Sugianto et al., 2006; Raol et al., 2003)
2.1.4.3. Information items associated with the security and safety
function. Security of a portal requires extra attention. Since the portal has a
wide range of audience/user groups, it is vital to keep data segregated in a
manner that makes the information available only to the people for whom it is
intended. Authentication of users, controlling access of users, regular, periodic
auditing of the system, etc. should be given high importance. Single sign-on is
suggested as a Best Practice for employee portals. (Caya and Nielson, 2010;
Sugianto et al., 2006; Raol et al., 2003)
2.1.4.4. Information items associated with the proactive search
function. A search function seems to be an obvious function of any portal, but
including efficient and effective search functionality in a portal makes a lot of
difference in a portal. An enterprise portal caters to the need of the users
enterprise wide, and generally holds enormous amounts of data. A strong
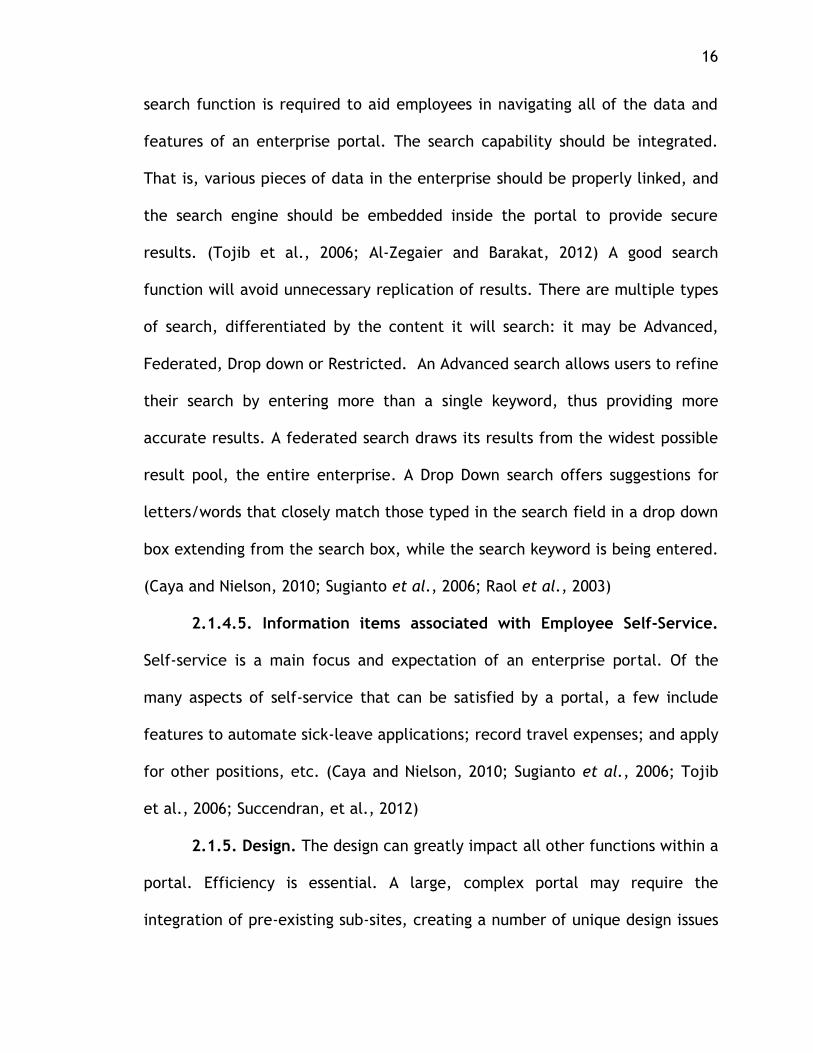
16
search function is required to aid employees in navigating all of the data and
features of an enterprise portal. The search capability should be integrated.
That is, various pieces of data in the enterprise should be properly linked, and
the search engine should be embedded inside the portal to provide secure
results. (Tojib et al., 2006; Al-Zegaier and Barakat, 2012) A good search
function will avoid unnecessary replication of results. There are multiple types
of search, differentiated by the content it will search: it may be Advanced,
Federated, Drop down or Restricted. An Advanced search allows users to refine
their search by entering more than a single keyword, thus providing more
accurate results. A federated search draws its results from the widest possible
result pool, the entire enterprise. A Drop Down search offers suggestions for
letters/words that closely match those typed in the search field in a drop down
box extending from the search box, while the search keyword is being entered.
(Caya and Nielson, 2010; Sugianto et al., 2006; Raol et al., 2003)
2.1.4.5. Information items associated with Employee Self-Service.
Self-service is a main focus and expectation of an enterprise portal. Of the
many aspects of self-service that can be satisfied by a portal, a few include
features to automate sick-leave applications; record travel expenses; and apply
for other positions, etc. (Caya and Nielson, 2010; Sugianto et al., 2006; Tojib
et al., 2006; Succendran, et al., 2012)
2.1.5. Design. The design can greatly impact all other functions within a
portal. Efficiency is essential. A large, complex portal may require the
integration of pre-existing sub-sites, creating a number of unique design issues
17
for the portal design team. These issues may be addressed by grouping them
under the various information categories. Concepts such as canonical structure,
the structure of the homepage, and the architecture used for grouping pages
and information, etc., are an integral part of the design of an enterprise
portal.
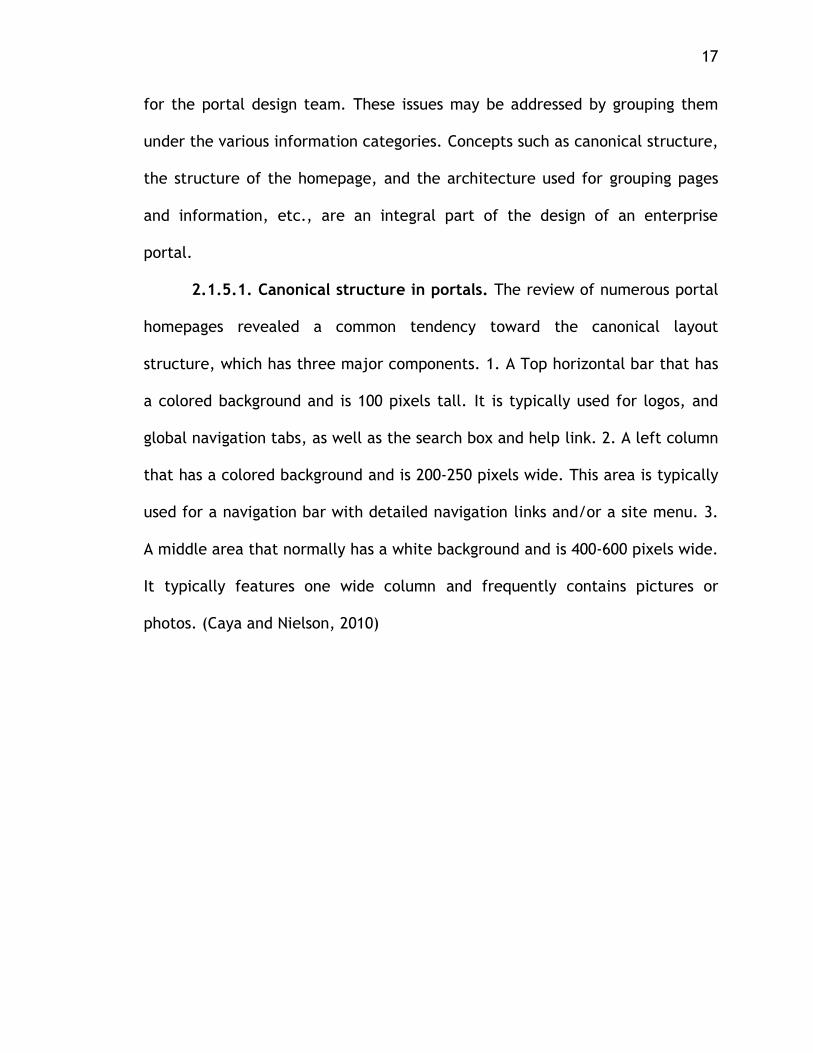
2.1.5.1. Canonical structure in portals. The review of numerous portal
homepages revealed a common tendency toward the canonical layout
structure, which has three major components. 1. A Top horizontal bar that has
a colored background and is 100 pixels tall. It is typically used for logos, and
global navigation tabs, as well as the search box and help link. 2. A left column
that has a colored background and is 200-250 pixels wide. This area is typically
used for a navigation bar with detailed navigation links and/or a site menu. 3.
A middle area that normally has a white background and is 400-600 pixels wide.
It typically features one wide column and frequently contains pictures or
photos. (Caya and Nielson, 2010)
18
Top Horizontal bar
Left
Column Middle Area
Figure 2.2. Composite Image of 10 Portal Homepages.
2.1.5.2. Structuring the homepage for an enterprise portal. The
homepage is the page that appears when a user logs into the portal. All
employees across the enterprise may share one homepage, or the company
might choose to have different homepages for different user groups. Either
way, most homepages use one or more of the following variations: Simple and
highly functional – A homepage should be structured so that the users can find
most items and functionality on the homepage itself without having to drill
down through the hierarchies of portal navigation. The functionality of a portal
should also be covered on the homepage to the maximum extent possible. New
users find less complex portals easier to learn, and it has been observed that
the simpler a portal homepage is, the more users it draws.
No Homepage – At times, companies may not have a homepage at all, but
instead every user has a custom page which they use to log on. In this case,
19
there is no need for uniformity among the homepages. This option usually
works well in a company with geographically dispersed and diverse workgroups.
Different Languages – The homepages may be provided in different languages.
This helps bridge any language gap that may exist in companies with employees
who speak different languages and/or operate in different parts of the world,
and prevent different languages from becoming a hindrance to performance.
(Caya and Nielson, 2010)
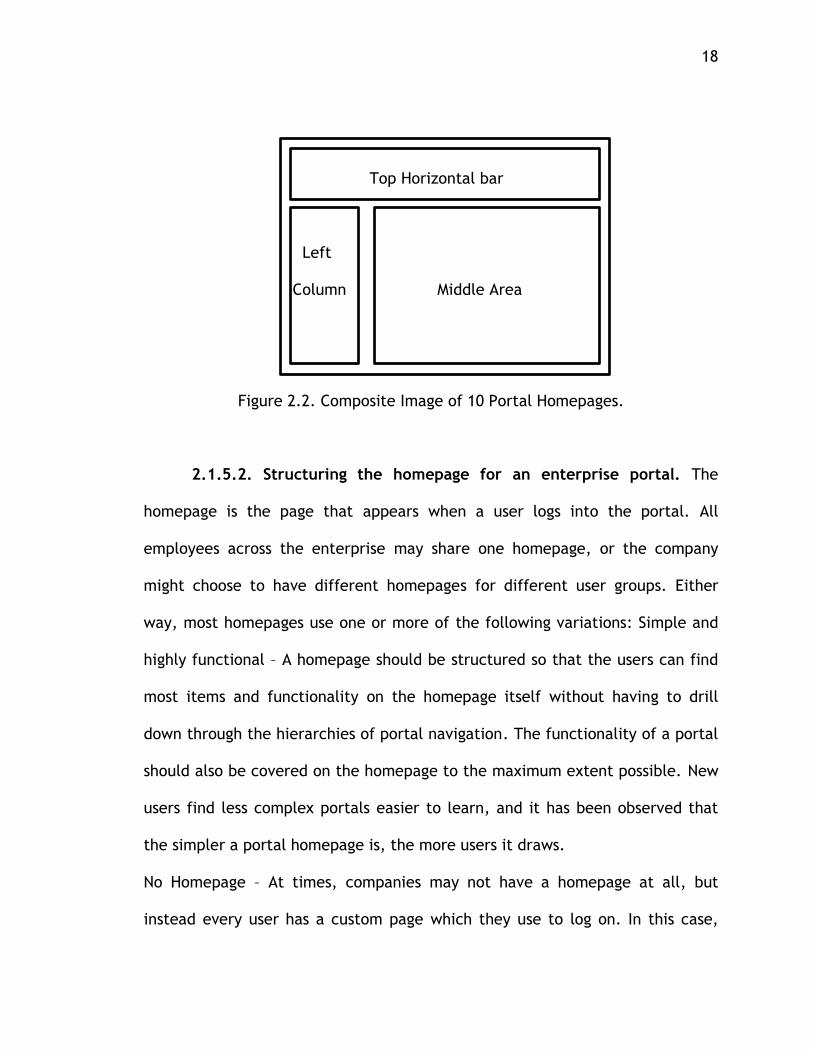
2.1.5.3. Grouping of pages in a portal. There are various methods for
grouping pages within a portal. No one way is the one “right way,” instead, a
company’s requirements and structure determines the best method for
organizing the portal content, applications, and other resources accessible to
users. However, a few types of grouping are commonly used. Simple
Hyperlinking: This model does not restrict the location or source referenced by
the hyperlink. That is, any page or resource can provide links to any other
within the structure of the portal. The advantage of this model lies in the fact
that content can be added to any part of the intranet at any time, because the
arrangement of links is completely decentralized. The disadvantage of this
model is that there are no reference points, so all pages are equally important
with respect to navigation.
20
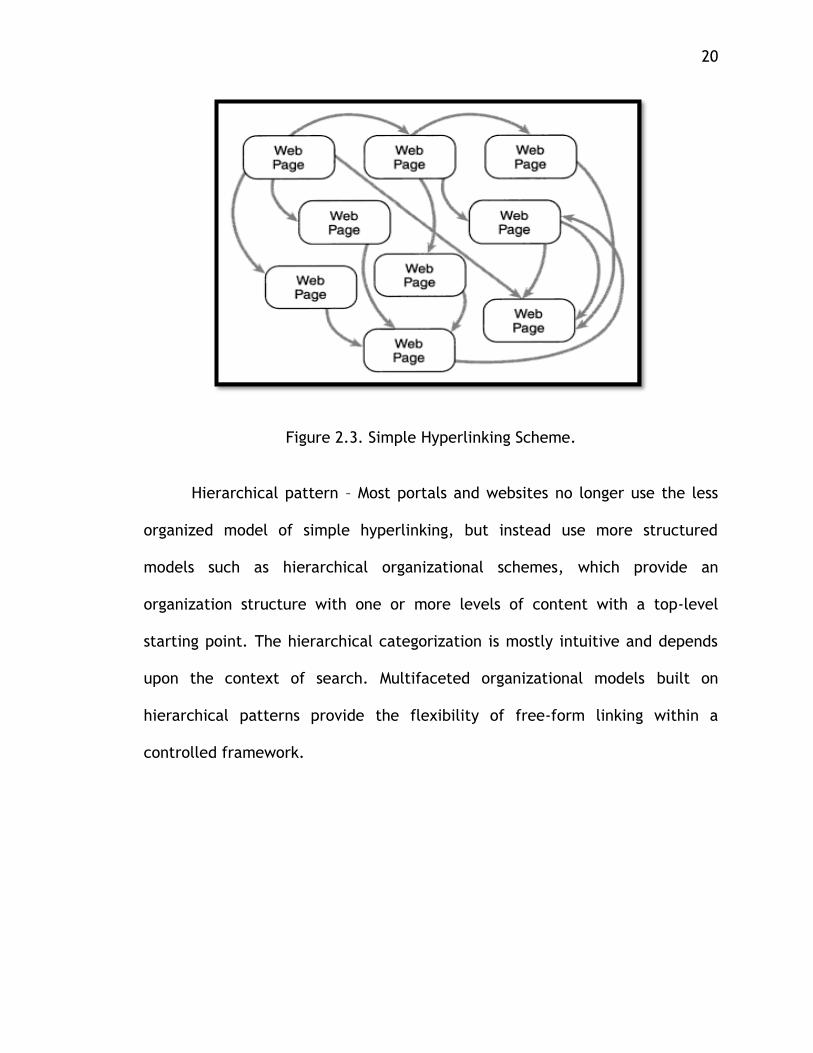
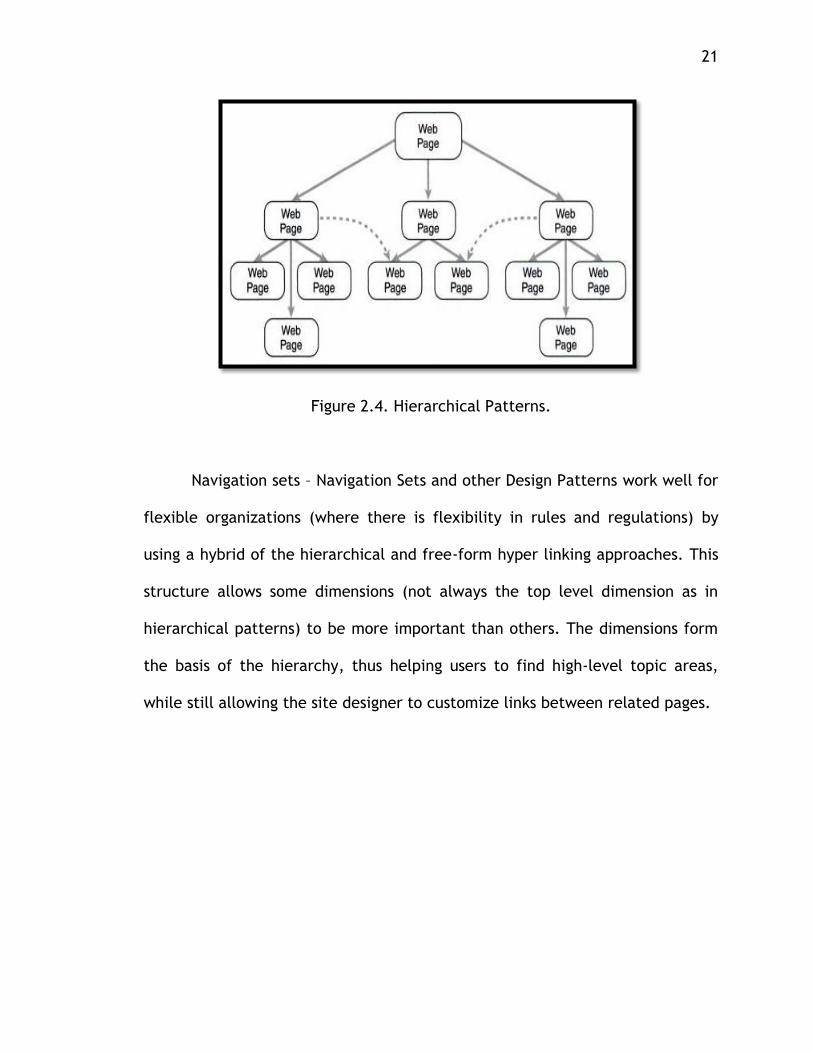
Figure 2.3. Simple Hyperlinking Scheme. Hierarchical pattern – Most portals and websites no longer use the less
organized model of simple hyperlinking, but instead use more structured
models such as hierarchical organizational schemes, which provide an
organization structure with one or more levels of content with a top-level
starting point. The hierarchical categorization is mostly intuitive and depends
upon the context of search. Multifaceted organizational models built on
hierarchical patterns provide the flexibility of free-form linking within a
controlled framework.
21
Figure 2.4. Hierarchical Patterns.
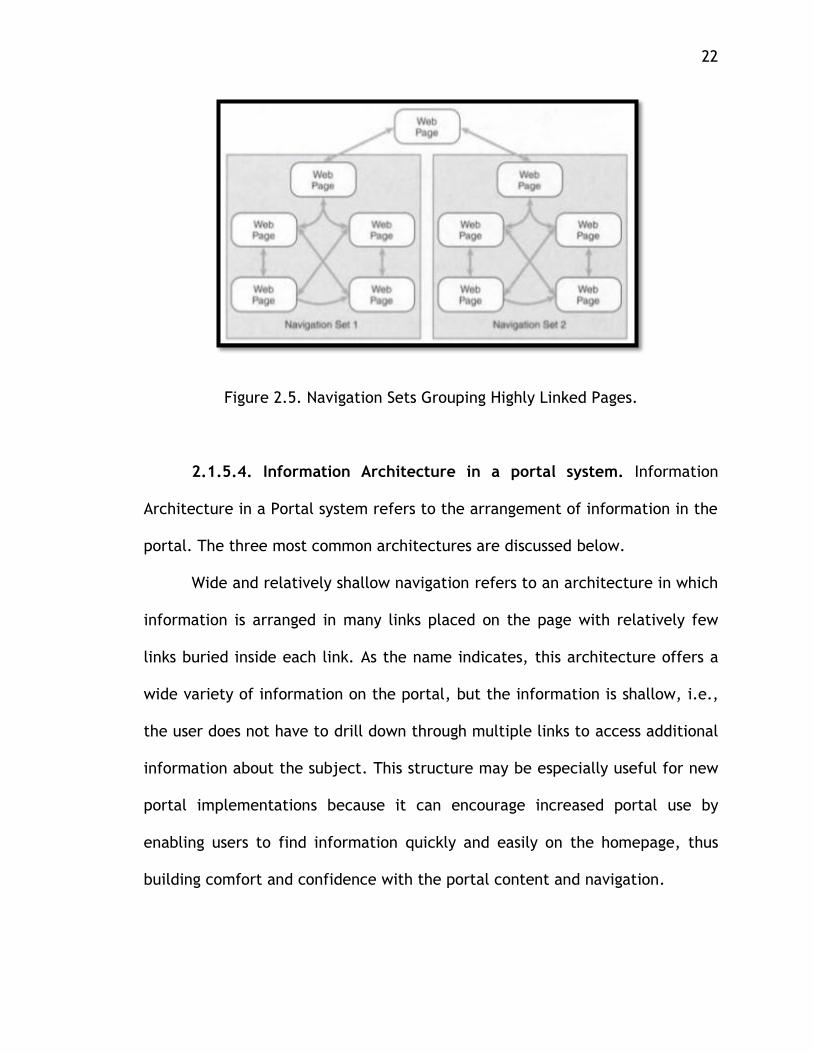
Navigation sets – Navigation Sets and other Design Patterns work well for
flexible organizations (where there is flexibility in rules and regulations) by
using a hybrid of the hierarchical and free-form hyper linking approaches. This
structure allows some dimensions (not always the top level dimension as in
hierarchical patterns) to be more important than others. The dimensions form
the basis of the hierarchy, thus helping users to find high-level topic areas,
while still allowing the site designer to customize links between related pages.
22
Figure 2.5. Navigation Sets Grouping Highly Linked Pages.
2.1.5.4. Information Architecture in a portal system. Information
Architecture in a Portal system refers to the arrangement of information in the
portal. The three most common architectures are discussed below.
Wide and relatively shallow navigation refers to an architecture in which
information is arranged in many links placed on the page with relatively few
links buried inside each link. As the name indicates, this architecture offers a
wide variety of information on the portal, but the information is shallow, i.e.,
the user does not have to drill down through multiple links to access additional
information about the subject. This structure may be especially useful for new
portal implementations because it can encourage increased portal use by
enabling users to find information quickly and easily on the homepage, thus
building comfort and confidence with the portal content and navigation.
23
Narrow and Deep Navigation describes an architecture that displays
relatively few links or sections on a page, but each link or section leads to
more sections and links within it. This architecture is particularly useful for an
organization that uses “information silos” to segregate its information so that
people interested in a certain section could drill down for more details. It is a
better option for more for technically-adept users. As its name implies, the
upper level offers a narrow range of sections, but it is supported by a deep
(large) selection of hierarchical navigation options.
Deep in some aspects describes a hybrid architecture that provides deep
hierarchical navigation options for some sections or links, but shallow
navigation options for others. The depth depends on factors such as the target
user group, interests of the user group, needs of the audience, and the portal
content of that section. (Caya and Nielson, 2010; Sugianto et al., 2006;
Sullivan, D.; 2003)
2.1.5.5. Classifying content with taxonomy. Taxonomy of a portal can
play a crucial place in the efficiency of a portal. Indeed, a portal can be
rendered ineffective and inefficient if the users cannot relate to the taxonomy
used. Taxonomy refers to the terminology used in the portal, and it should
reflect the terminology and jargon of its users so that it is easy to understand.
A variety of techniques are used to classify taxonomy:
Starting with existing third-party taxonomy is generally considered the
fastest way to classify content. There are numerous publicly available
taxonomy schemes, such as the “Library of Congress Subject Headings,” which
24
offers a myriad of topics. It is important to consider the company’s business
needs as well as discipline and industry when choosing taxonomy.
Use of enterprise structures refers to using a directory structure, in
which large shared directories are organized around business process,
organizational structures and/or ad hoc practices. This method generally links
pre-existing directory structures, which follow the business processes within
the organization’s structure.
Use of automated clustering is used when the designer lacks familiarity
with the content being grouped. Here, patterns are analyzed within documents
and documents with similar patterns are grouped. This provides a logical
grouping of documents. Generally, automated clustering should not be the only
technique used to define taxonomies. (Sullivan, 2004)
2.1.6. Implementation. How a portal is implemented can directly
impact any organization. Portal implementation requires addressing Critical
Success Factors (CSF), which are four perspectives to consider: strategic,
tactical, organizational, and technological. (Remus, 2006)
2.1.6.1. Content management. Generally, a portal should offer high-
quality, reliable, and user-friendly content. More recently, timely availability
of ontological data and the ability to facilitate web repository management
have been added to these expectations. (Chung, 2012) The latter categories
fall under the heading of Content Management System (CMS), and include
flexibility of content, integration of contents, and the assumption that features
would be included to address the factors which hinder efficient Content
25
management. (Raol et al., 2003; Sugianto and Tojib, 2006; White, 2003; Caya
and Neilson, 2010)
2.1.6.2. People and processes. Enterprise portal ownership is an
important element in providing users with the most meaningful and relevant
information. Frequently, people who were involved in the project design,
development, and implementation may have moved to new positions or may
have left the organization entirely, and therefore are not available to help
manage the portal, and the new portal managers may not be as familiar with
the portal or feel the same sense of ownership. This shift in ownerships may
contribute to less than optimal portal implementations, or even
implementation failure.
The authorship of an enterprise portal can be centralized or
decentralized depending on the company structure and environment. In a
situation containing large amounts of specialized information from different
divisions, which must be handled separately to maintain the integrity of the
information and limit access, a decentralized approach may be the best
solution. However, this option limits the content providers to their own “silo,”
thus preventing a more comprehensive understanding of the organization as a
whole. Futijsu Siemens uses a decentralized authorship structure within their
portal. (Sullivan, 2003; Caya and Neilson, 2010)
Centralized authorship helps the company maintain a more accurate and
comprehensive view of the corporate data. A centralized Corporate Portal
Management group sits on top of the ownership hierarchy, and groups of
26
departmental content providers report to it. The Corporate Management group
is in charge of administration of the portal, development of guidelines and
policies, management of the Content Management System (CMS), and creation
and implementation of Web-readable pages. HP Europe follows this pattern of
ownership. (Sullivan, 2003; Cay and Neilson, 2010)
The size of the organization must be considered when determining the
ownership of a portal. A decentralized structure is frequently used in smaller
organizations where each unit or division is ultimately responsible for their own
content. Centralized authorship is encouraged in larger organizations to ensure
the correct enforcement of policies, guidelines, and integrity of information.
The greater the diversity of information requirements across an enterprise, the
greater is the challenge to content-management. An Enterprise portal strives to
provide a customized and personalized content gateway to each user in any
size organization. (Scheepers, 2006; Caya and Neilson, 2010)
2.1.6.3. Consulting users. Users should be consulted and involved
throughout the implementation of an enterprise portal, from the inception of
the idea all the way to the final go-live date and beyond. User feedback should
be gathered periodically throughout the project via multiple sources, such as
user trials, testing, and prototyping; and users should always be consulted
while deciding on adding or removing functionalities and features. Involving
users instills feelings of ownership in the new system in addition to building
familiarity, which in turn leads to easier acceptance and ultimately contributes
27
to a successful portal implementation with reduced learning curve and less
resistance from users. (Caya and Nielson, 2010; Al-Mudimigh et al., 2011)
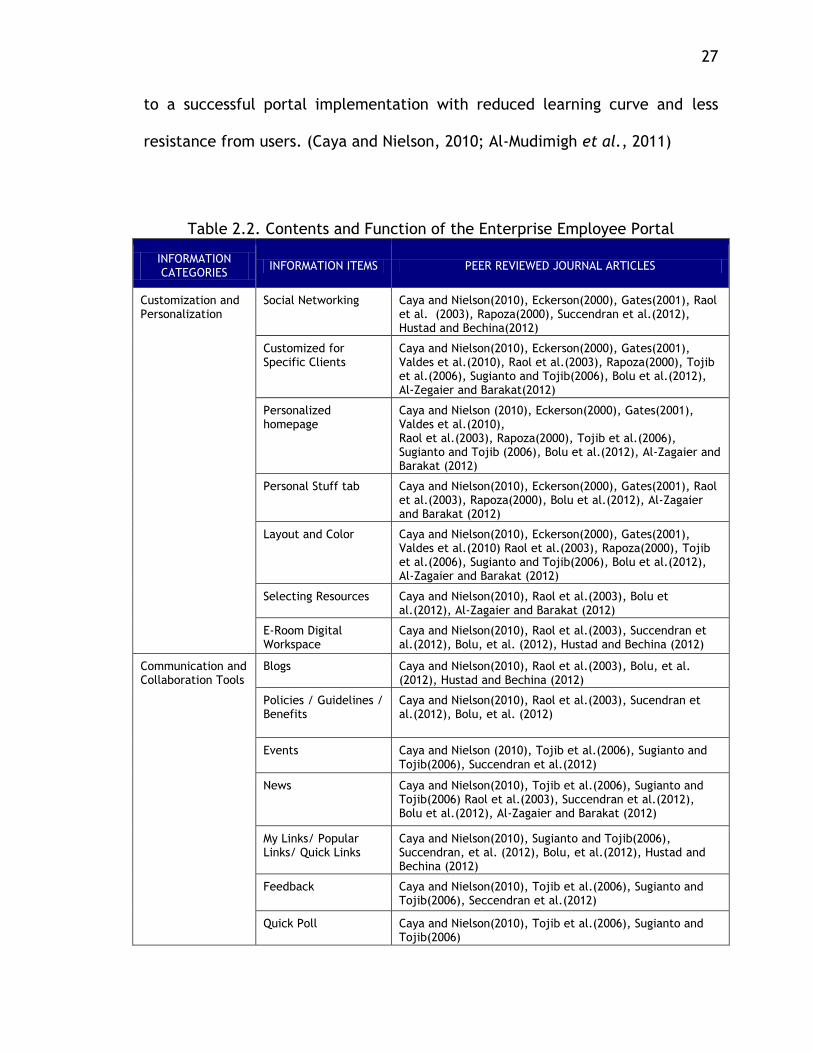
Table 2.2. Contents and Function of the Enterprise Employee Portal
INFORMATION CATEGORIES
INFORMATION ITEMS PEER REVIEWED JOURNAL ARTICLES
Customization and Personalization
Social Networking Caya and Nielson(2010), Eckerson(2000), Gates(2001), Raol et al. (2003), Rapoza(2000), Succendran et al.(2012), Hustad and Bechina(2012)
Customized for Specific Clients
Caya and Nielson(2010), Eckerson(2000), Gates(2001), Valdes et al.(2010), Raol et al.(2003), Rapoza(2000), Tojib et al.(2006), Sugianto and Tojib(2006), Bolu et al.(2012), Al-Zegaier and Barakat(2012)
Personalized homepage
Caya and Nielson (2010), Eckerson(2000), Gates(2001), Valdes et al.(2010), Raol et al.(2003), Rapoza(2000), Tojib et al.(2006), Sugianto and Tojib (2006), Bolu et al.(2012), Al-Zagaier and Barakat (2012)
Personal Stuff tab Caya and Nielson(2010), Eckerson(2000), Gates(2001), Raol et al.(2003), Rapoza(2000), Bolu et al.(2012), Al-Zagaier and Barakat (2012)
Layout and Color Caya and Nielson(2010), Eckerson(2000), Gates(2001), Valdes et al.(2010) Raol et al.(2003), Rapoza(2000), Tojib et al.(2006), Sugianto and Tojib(2006), Bolu et al.(2012), Al-Zagaier and Barakat (2012)
Selecting Resources Caya and Nielson(2010), Raol et al.(2003), Bolu et al.(2012), Al-Zagaier and Barakat (2012)
E-Room Digital Workspace
Caya and Nielson(2010), Raol et al.(2003), Succendran et al.(2012), Bolu, et al. (2012), Hustad and Bechina (2012)
Communication and Collaboration Tools
Blogs Caya and Nielson(2010), Raol et al.(2003), Bolu, et al. (2012), Hustad and Bechina (2012)
Policies / Guidelines / Benefits
Caya and Nielson(2010), Raol et al.(2003), Sucendran et al.(2012), Bolu, et al. (2012)
Events Caya and Nielson (2010), Tojib et al.(2006), Sugianto and Tojib(2006), Succendran et al.(2012)
News Caya and Nielson(2010), Tojib et al.(2006), Sugianto and Tojib(2006) Raol et al.(2003), Succendran et al.(2012), Bolu et al.(2012), Al-Zagaier and Barakat (2012)
My Links/ Popular Links/ Quick Links
Caya and Nielson(2010), Sugianto and Tojib(2006), Succendran, et al. (2012), Bolu, et al.(2012), Hustad and Bechina (2012)
Feedback Caya and Nielson(2010), Tojib et al.(2006), Sugianto and Tojib(2006), Seccendran et al.(2012)
Quick Poll Caya and Nielson(2010), Tojib et al.(2006), Sugianto and Tojib(2006)
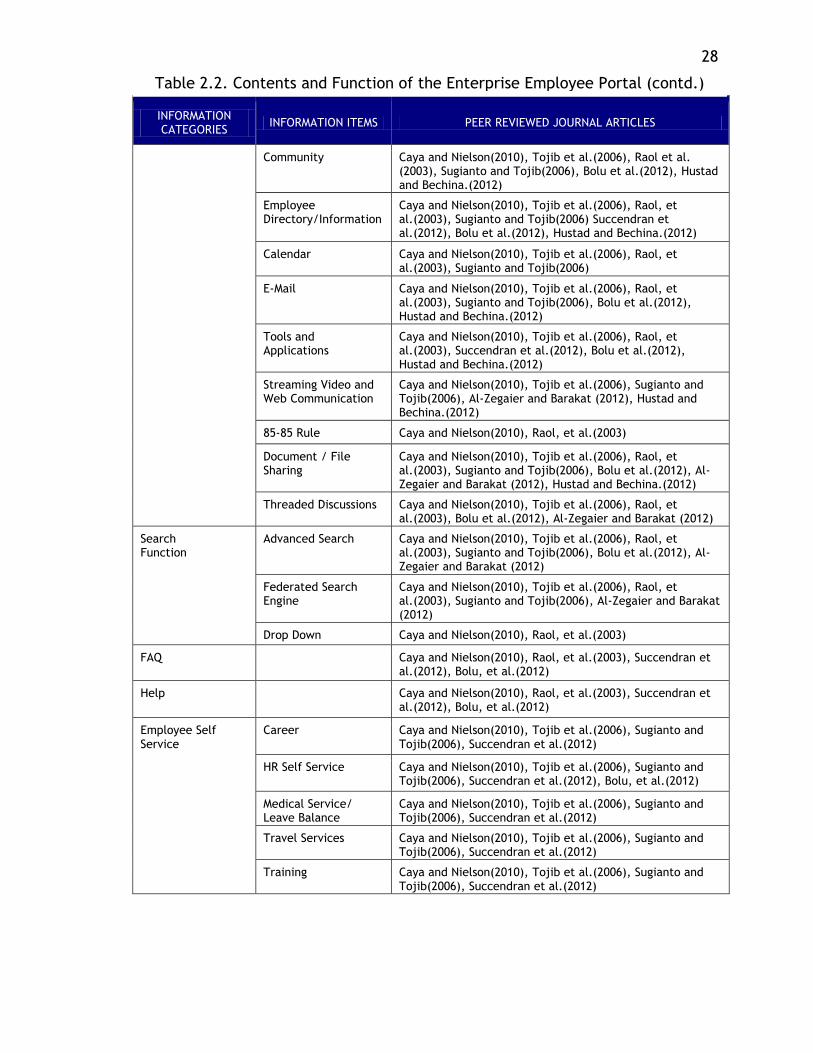
28
INFORMATION CATEGORIES
INFORMATION ITEMS PEER REVIEWED JOURNAL ARTICLES
Community Caya and Nielson(2010), Tojib et al.(2006), Raol et al. (2003), Sugianto and Tojib(2006), Bolu et al.(2012), Hustad and Bechina.(2012)
Employee Directory/Information
Caya and Nielson(2010), Tojib et al.(2006), Raol, et al.(2003), Sugianto and Tojib(2006) Succendran et al.(2012), Bolu et al.(2012), Hustad and Bechina.(2012)
Calendar Caya and Nielson(2010), Tojib et al.(2006), Raol, et al.(2003), Sugianto and Tojib(2006)
E-Mail Caya and Nielson(2010), Tojib et al.(2006), Raol, et al.(2003), Sugianto and Tojib(2006), Bolu et al.(2012), Hustad and Bechina.(2012)
Tools and Applications
Caya and Nielson(2010), Tojib et al.(2006), Raol, et al.(2003), Succendran et al.(2012), Bolu et al.(2012), Hustad and Bechina.(2012)
Streaming Video and Web Communication
Caya and Nielson(2010), Tojib et al.(2006), Sugianto and Tojib(2006), Al-Zegaier and Barakat (2012), Hustad and Bechina.(2012)
85-85 Rule Caya and Nielson(2010), Raol, et al.(2003)
Document / File Sharing
Caya and Nielson(2010), Tojib et al.(2006), Raol, et al.(2003), Sugianto and Tojib(2006), Bolu et al.(2012), Al-Zegaier and Barakat (2012), Hustad and Bechina.(2012)
Threaded Discussions Caya and Nielson(2010), Tojib et al.(2006), Raol, et al.(2003), Bolu et al.(2012), Al-Zegaier and Barakat (2012)
Search Function
Advanced Search Caya and Nielson(2010), Tojib et al.(2006), Raol, et al.(2003), Sugianto and Tojib(2006), Bolu et al.(2012), Al-Zegaier and Barakat (2012)
Federated Search Engine
Caya and Nielson(2010), Tojib et al.(2006), Raol, et al.(2003), Sugianto and Tojib(2006), Al-Zegaier and Barakat (2012)
Drop Down Caya and Nielson(2010), Raol, et al.(2003)
FAQ Caya and Nielson(2010), Raol, et al.(2003), Succendran et al.(2012), Bolu, et al.(2012)
Help Caya and Nielson(2010), Raol, et al.(2003), Succendran et al.(2012), Bolu, et al.(2012)
Employee Self Service
Career Caya and Nielson(2010), Tojib et al.(2006), Sugianto and Tojib(2006), Succendran et al.(2012)
HR Self Service Caya and Nielson(2010), Tojib et al.(2006), Sugianto and Tojib(2006), Succendran et al.(2012), Bolu, et al.(2012)
Medical Service/ Leave Balance
Caya and Nielson(2010), Tojib et al.(2006), Sugianto and Tojib(2006), Succendran et al.(2012)
Travel Services Caya and Nielson(2010), Tojib et al.(2006), Sugianto and Tojib(2006), Succendran et al.(2012)
Training Caya and Nielson(2010), Tojib et al.(2006), Sugianto and Tojib(2006), Succendran et al.(2012)
Table 2.2. Contents and Function of the Enterprise Employee Portal (contd.)
29
2.2. PERFORMANCE DASHBOARD
Performance dashboard is a performance management system that
translates the organization’s strategy into objectives, metrics, initiatives and
tasks customized to each group and individual in the organization. It
communicates strategic objectives and enables businesspeople to measure,
monitor and manage the key activities and processes needed to achieve their
goals. (Eckerson, 2010) Performance dashboards have been adopted as the
major tool for determining and analyzing actual portal usage in this research.
The large amounts of unstructured data obtained from the portal usage logs are
unreadable and not comprehensible; as shown in figure 1.1. In this section
literature review of the Performance dashboards has been done in terms of its
definition, history and evolution, functionalities, advantages and classification.
2.2.1. Definition. A dashboard can be described as a visual display of
the most important information required to achieve certain objectives,
consolidated and arranged on a single screen so that the information may be
monitored at a glance. (Few, 2006)
Managers are often overwhelmed with reports and information churned
out from a multitude of organizational information systems such as Enterprise
Resource Planning (ERP), performance scorecards, and business intelligence
(BI) software. This phenomenon is generally known as information overload.
The problem is further exacerbated when reports are poorly designed with
30
respect to how information is presented, often confusing rather than guiding
the decision making process. (Yigitbasioglu and Velcu, 2012)
It must be noted that a dashboard's value is inextricably linked to which
features are chosen and how they are used within the organization. There are
no limits on how a dashboard should look or what capabilities it should address
because those aspects should be tailored to an organization’s unique
requirements. In general, a dashboard is expected to collect, summarize, and
present information from multiple sources such as legacy-ERP and BI software
so the user can easily see how various performance indicators such as order-fill
rates and sales returns are performing. Data represented on a single dashboard
page represents a very small portion (the most important portion) of the data
available. If desired, a user can drill down view more specific information and
more details about the broad trends that were displayed on the first screen.
There are many dashboard variations available in the software vendor market.
Some solutions come with “full” features, i.e. interactive drill down
capabilities, scenario (what-if) analysis, built-in automated alerts,
customization options, etc., while others are more simple and static by nature.
(Yigitbasioglu and Velcu, 2012)
2.2.2. History and Evolution. Dashboards have generally been accepted
and interest continues to grow. Numerous success stories have been attributed
to performance dashboards’ implementation. To cite two: IBM's Business
Objects Dashboard Manager at Edward Hospital helped in improving cash flow
through the better management of account receivables (Schulte 2006) and
31
Unisys' marketing dashboard led to improved budget allocation, accountability,
and performance management (Miller and Cioffi, 2004). No matter the purpose
of the dashboard; whether it is to improve internal control or to monitor
performance management in the midst of an economic downturn, it is essential
that the dashboard have the ability to assess and quickly evaluate different
aspects of a company's performance. (Hanoa, 2009)
2.2.3. Functionalities. Dashboards convey information through
visualization. Information visualization refers to the “use of interactive visual
representations of abstract, non-physically based data to amplify cognition”
(Card et al., 1999). The process of visualization involves two distinct phases:
encoding and decoding, which are facilitated by the use of visual attributes
such as shape, position and color, and textual attributes such as text and
symbols, which themselves are represented with simple visual attributes
(Wunsche, 2004).
The primary function of a performance dashboard is to monitor, analyze
and manage. Dashboards can help in monitoring critical business processes and
activities using metrics that trigger alerts when performance falls below
predefined targets. They can help in analyzing the root cause of problems by
allowing users to explore relevant and timely information from multiple
perspectives at various levels of detail. Dashboards can also help in managing
people and processes to improve decisions, optimize performance and steer the
organization in the right direction. (Eckerson, 2010)
32
2.2.4. Advantages of Using a Performance Dashboard. Dashboards help
in communicating strategies by translating corporate strategy into measures,
targets, and initiatives that are customized to each group in an organization
and sometimes to every individual. They help in refining strategies. They
highlight performance measures and results. (Eckerson, 2010)
2.2.5. Classification of Different Types of Dashboards. Because we
planned to use dashboards to assist in the evaluation of the portal of our case
study, we reviewed different types of dashboards and their uses. Performance
dashboards can be classified into three types based on how they emphasize the
three layers of the dashboard framework and which applications they support.
The three types of dashboards are described below.
Operational Dashboards enable frontline workers to manage and control
operational processes using detailed data that are refreshed frequently.
Operational dashboards emphasize monitoring more than analysis or
management.
Tactical Dashboards monitor and manage departmental processes and
projects. Executives use tactical dashboards to review and benchmark the
performance of peer groups across the company, while managers use them to
monitor and optimize processes. Tactical dashboards tend to emphasize
analysis more than monitoring or management.
Strategic Dashboards monitor and manage departmental processes and
projects. Executives use tactical dashboards to review and benchmark the
performance of peer groups across the company, while managers use them to
33
monitor and optimize processes. Tactical dashboards tend to emphasize
analysis more than monitoring or management. (Eckerson, 2010)
The dashboards that are used in this thesis can be classified as Strategic
to Tactical and will be discussed in the Methodology section.
2.3. USABILITY AND EFFECTIVENESS
Usability and Effectiveness refers to the user-friendliness of a program
or application. It is closely related to user satisfaction. The study of Usability
and Effectiveness is a new science formed as an amalgamation of behavioral,
psychological, and social sciences, and it is expanding into all fields. Recently,
statistical and biometric evaluation tools have been added as well. (Abran et
al., 2003; Hertzum and Clemmenson, 2011) The study of usability is important
here in this research as it is a problem to be dealt with in the assessment of an
internal employee portal as suggested in Figure 1.1. Therefore a brief review of
usability in terms of its definition, history and evolution has been discussed in
this section.
2.3.1. Definition. The term “usability” refers to a set of multiple
concepts, such as execution time, performance, user satisfaction and ease of
learning (“Learnability”), taken together. But “usability” has yet to be clearly
defined, by either researchers or by standardization bodies. (Abran et al.,
2003) Evaluation can be defined as a judgment of worth to ascertain a level of
performance or value. (Chowdhury and Chowdhury, 2002)
34
Six different perspectives of usability have been brought into purview by
Hertzum (2010), including Hedonic usability, Perceived usability, Situational
usability, Cultural usability, Organizational usability, and Universal usability.
Performance evaluation can be further broken down into “Effectiveness” – how
well does a system perform the task for which it is designed; and “Efficiency” –
at what cost (financial or time/effort). (Saracevic, 2000)
Usability was one of the major problem areas facing the case company’s
enterprise employee portal. This falls under the “Problem Statement” block of
the figure 1.1 depicting the research framework.
2.3.2. History and Evolution of Usability. The concept of Usability is
embedded in the field of Human – Computer Interaction and can be dated back
as far as the 1960’s when three threads of human factors, business computing,
and personal computing were recognized as a unique segment of research in
Computer Science. When ENIAC, the first electronic computer, came into being
in 1946, computer projects employed people in roles of operation,
management and programming, but they overlooked the design, development
and usability aspect of the systems. (Grudin, 2005)
The emergence of National Usability Communities in various countries
highlights the increasing demand and need for usability studies in the different
parts of the world. Hertzum and Clemmenson (2011) have studied the trends in
China, Denmark, and India. In China the usability field has been developing
quickly. The usability groups in China can be placed into the three broad
categories of: Industrial/Graphic designers who are employed by international
35
mobile-phone providers, Engineering Psychologists who are primarily involved
in testing but not designing, and Usability Professionals educated in usability
outside of China who work as leaders or department managers. (Chauhan,
2006) In Denmark, too, the usability profession has been growing very fast and
it is comprised mostly of young people who have less than five years of work
experience. Two thirds of the professionals are educated in social sciences or
humanities rather than any technical field. Statistics indicate that India needs
60,000 usability professionals, but they currently only have 500-600, most of
whom have been trained in the user experience and usability field at various
technical universities in India that emphasize a user-centric design approach.
(Yammiyavar, 2010) Similarly every country in the world is experiencing a
shortage of usability professionals even as they recognize the importance of
Usability studies.
In 2012; Hertzum et al. identified the following six components of user
experience: sensorial, cognitive, pragmatic, lifestyle, and relational. The user
experience can be further classified under four different categories.
Utilitarian vs. Experiential – The user experience can be classified as
Utilitarian when it is related to the user’s need of achieving behavioral goals
which requires utility and usability. It can be classified as Experiential when
the user experience is primarily related to user’s self and consists of
identification and stimulation.
ISO usability – Efficiency, Effectiveness and Satisfaction are the three
facets of this category. Effectiveness refers to the accuracy and completeness
36
with which users achieve specified goals. Efficiency deals with the spending of
resources in relation to the accuracy and completeness with which users
achieve goals. Satisfaction is freedom from discomfort, and a positive attitude
towards the use of the product.
Organizational Usability – This category addresses the dimensions of:
User-system fit, Organization-system fit, and Environment-system fit. User-
system fit refers to the fit between the user’s psychological characteristics,
including cognitive processes and training and the system. The Organization-
system fit deals with the fit between the social attributes and the structural
characteristics of an organization, including its norms, task allocation, and
communication channels. The Environmental-system fit refers to the fit
between system attributes and the environment of the organization in which it
is used; including the home-work ecology.
User Experience – This is the fourth category and it addresses the
Sensorial experience (which involves the senses, helps address sight, hearing,
touch, taste and smell to arouse aesthetic pleasure, excitement, satisfaction,
or appeal to a sense of beauty), Emotional experience (which involves the
affective system through the generation of moods, feelings, emotions to
generate an emotional experience and thereby create an affective reaction
with the product, brand, or company), Cognitive experience (which involves
stimulating thinking or conscious mental processes to engage customers to use
creativity to solve problems, or to motivate consumers to revise their usual
ideas or mental assumptions), Lifestyle experience (which involves the
37
affirmation of the user’s beliefs and values system so that a product becomes
the means of adhesion to certain values or of affirmation of a social identity or
lifestyle), Relational experience (which involves the user’s social context and
relationship with other people and either encourages people to use a certain
product together with other people, or causes the product to become the core
of a common passion that may lead to the creation of a “community”).
2.4. CHALLENGES FACING ENTERPRISE PORTAL
Enterprise portals currently face myriad problems. Most of the problems
are related to integration of business process and components with the utility
and usefulness of a portal, and its cost of implementation while maintaining
compatibility.
2.4.1. Integration of Business Processes or Components. Ideally,
business needs should be met by aligning the IT capabilities of the organization
correctly. For this to happen, business automation, business processes and re-
engineering must be clearly defined.
2.4.2. Usefulness. The utility of an Enterprise Portal is manifold. The
full potential of the usefulness of an Enterprise portal can only be realized if it
addresses the need of the organization which is implementing it, and the
features that are useful for one company’s portal may not be suitable for
another company. The primary obstacle of realizing the maximum benefit from
an Enterprise Portal lies in lack of understanding the true potential of the
38
platform and mapping the company’s needs to it. Each implementation is
unique and adopting the design of a pre-existing portal may not be the best
solution.
2.4.3. Cost. The implementation of an enterprise is a complex and time-
consuming endeavor for any company. The company has to balance their
limited IT budget against the growing need for an enterprise portal. (Urbach et
al., 2010) Of the budget portal implementation budget, a very small proportion
is spent on licensing and initial set-up, while a larger portion of the budget is
used later on support, maintenance and upgrades, etc. Hidden costs, such as
loss of productivity as employees become used to the new portal, are more
difficult to estimate, but account for another major portion of the
implementation budget and must be calculated as accurately as possible.
(Jafari, 2003) Portal benefit evaluations may be based on monetary indicators
like return on investment (ROI), total cost of ownership (TCO), and other cost-
benefit analysis methods (White, 2003), but as with many IT projects, benefits
can be difficult to quantify. Apart from the financial benefits; there are a large
number of intangible benefits that can be derived from an enterprise portal,
such as user satisfaction, which cannot be easily measured but is a good
indicator of an enterprise portal’s success. There are several methods available
for measuring a portal’s benefits (Doll and Torzadeh, 1988), including the End-
User Computing Satisfaction measure (EUCS), Sugianto et al. (2007) and Tojib
et al. (2008) which is based on a formula called B2E (Business to Enterprise)
Portal User Satisfaction (B2EPUS). Another approach to assess user satisfaction
39
proposed by Bin Masrek (2007) was based on an extract of the updated D&M IS
(DeLone and McLean Information Systems) Success Model proposed by DeLone
and McLean, 2003. Yang et al. (2005) developed an instrument based on several
different conceptual models in the area of IS and technology that focused on
the user-perceived service quality of web portals. De Carvalho et al. (2008)
analyzed the effects of technological and organizational features on intranet
and portal usage based on the Technology Acceptance Model (TAM) proposed by
Davis (1989)
2.4.4. Compatibility. The compatibility of an enterprise portal refers to
its ease of integration, platform independence, reliability, scalability and
usability.
2.4.4.1. Ease of integration. This refers to how easily the new system
can be integrated with the existing system. Portal installation should never
interfere with some previously-existing functionality. The portal must be
compatible with existing databases and Web Application services to allow for
easy interfacing and integration between the two. Both Application
Programming Interfaces (APIs) and Open Software Development Standards
should be available to facilitate integration to the enterprise portal. (Jafari,
2003) To help ease the transition, integration may be conducted in phases.
2.4.4.2. Platform independence. Requiring that all products, operating
systems, and hardware products come from a particular manufacturer can
reduce the opportunity for compatibility between the portal and other vendors’
products, and can ultimately limit the portal’s full potential. A good portal
40
should be compatible across multiple vendors. Nevertheless, many companies
still continue to purchase products only from one or two vendors despite the
limitations inherent to this practice. This is frequently the case when a certain
vendor’s technology has been used by the company in the past and has gained
loyalty from company management. Unfortunately, this greatly limits the
company’s ability to respond to changing market conditions. (Jafari, 2003)
2.4.4.3. Reliability. Portal performance is another area critical to the
implementation’s success. The portal must have the capacity to be able to
support user traffic without slowing response times and reducing the quality of
the user experience. With this in mind, portal performance should be tested
during peak hours and levels of usage before the portal goes live. The system
should be tested across three major points of contention, namely: the
performance benchmarks of the hardware being used, the network capacity,
and the system administrator’s expertise in tuning the performance of the
operating system on which the portal application will run. (Jafari, 2003)
2.4.4.4. Scalability. Otherwise known as expandability, scalability
should be seriously considered before an investment is made toward the
implementation of an enterprise portal in an organization. Over time, the users
will come to rely more on the portal, and the scalability will become a major
determinant of a portal’s success. If the portal is incapable of scaling to meet
user requirements, then the portal can easily become a “victim of its own
success.” Initially it might not have as much acceptance and traffic but with
the advance of time and the dependence of more and more users it becomes
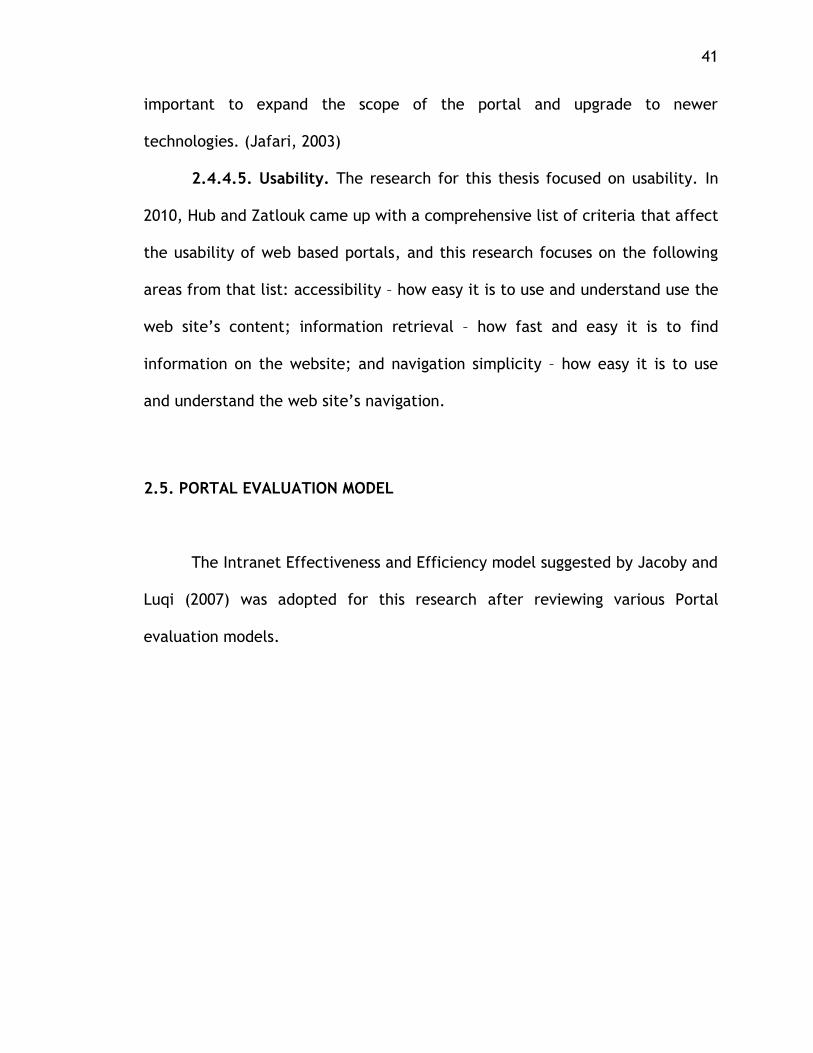
41
important to expand the scope of the portal and upgrade to newer
technologies. (Jafari, 2003)
2.4.4.5. Usability. The research for this thesis focused on usability. In
2010, Hub and Zatlouk came up with a comprehensive list of criteria that affect
the usability of web based portals, and this research focuses on the following
areas from that list: accessibility – how easy it is to use and understand use the
web site’s content; information retrieval – how fast and easy it is to find
information on the website; and navigation simplicity – how easy it is to use
and understand the web site’s navigation.
2.5. PORTAL EVALUATION MODEL
The Intranet Effectiveness and Efficiency model suggested by Jacoby and
Luqi (2007) was adopted for this research after reviewing various Portal
evaluation models.
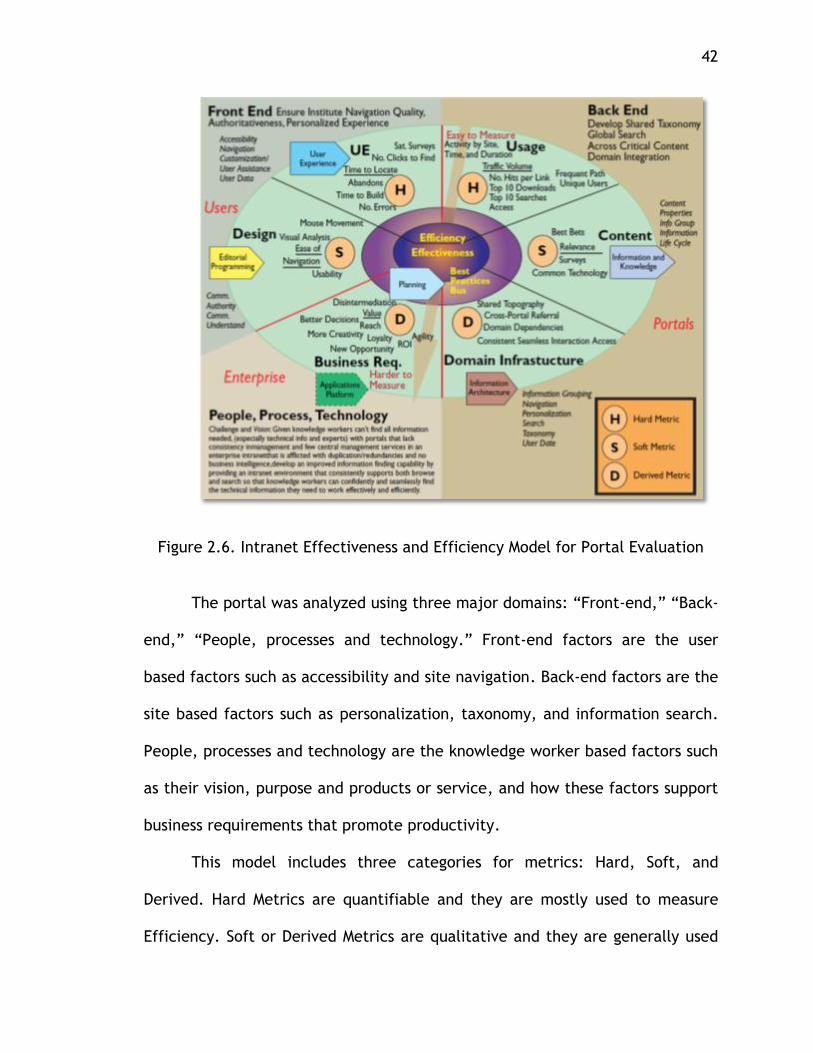
42
Figure 2.6. Intranet Effectiveness and Efficiency Model for Portal Evaluation
The portal was analyzed using three major domains: “Front-end,” “Back-
end,” “People, processes and technology.” Front-end factors are the user
based factors such as accessibility and site navigation. Back-end factors are the
site based factors such as personalization, taxonomy, and information search.
People, processes and technology are the knowledge worker based factors such
as their vision, purpose and products or service, and how these factors support
business requirements that promote productivity.
This model includes three categories for metrics: Hard, Soft, and
Derived. Hard Metrics are quantifiable and they are mostly used to measure
Efficiency. Soft or Derived Metrics are qualitative and they are generally used
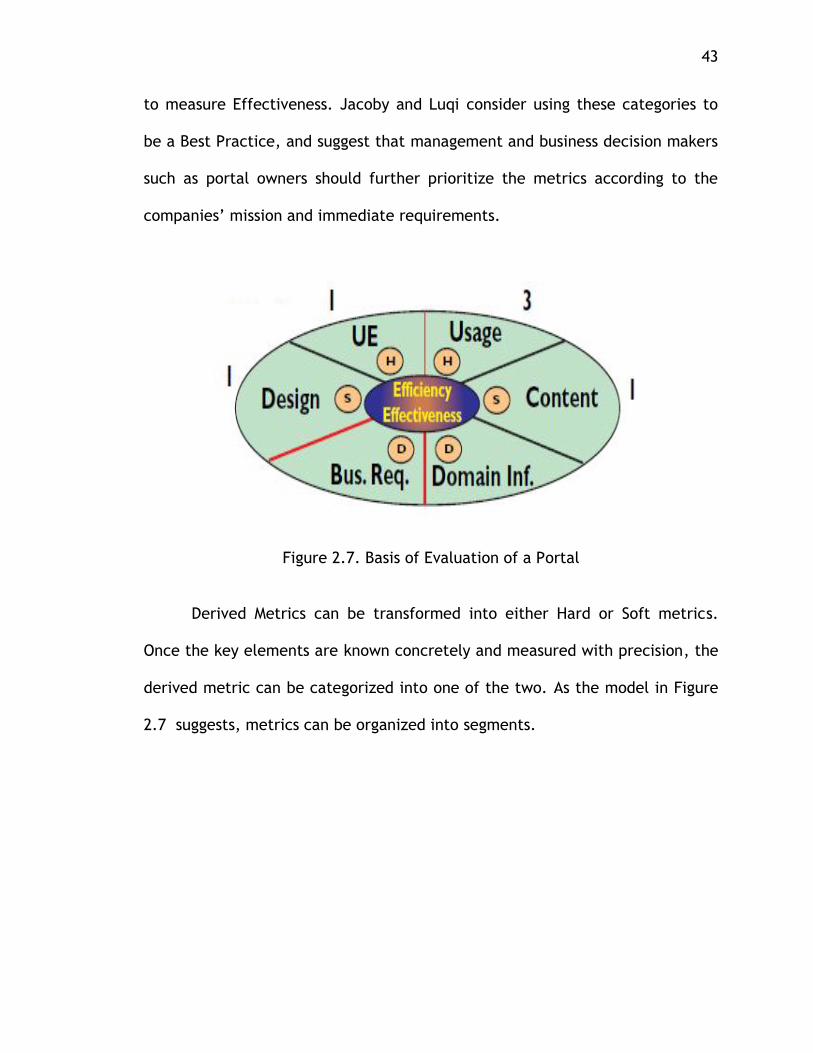
43
to measure Effectiveness. Jacoby and Luqi consider using these categories to
be a Best Practice, and suggest that management and business decision makers
such as portal owners should further prioritize the metrics according to the
companies’ mission and immediate requirements.
Figure 2.7. Basis of Evaluation of a Portal
Derived Metrics can be transformed into either Hard or Soft metrics.
Once the key elements are known concretely and measured with precision, the
derived metric can be categorized into one of the two. As the model in Figure
2.7 suggests, metrics can be organized into segments.
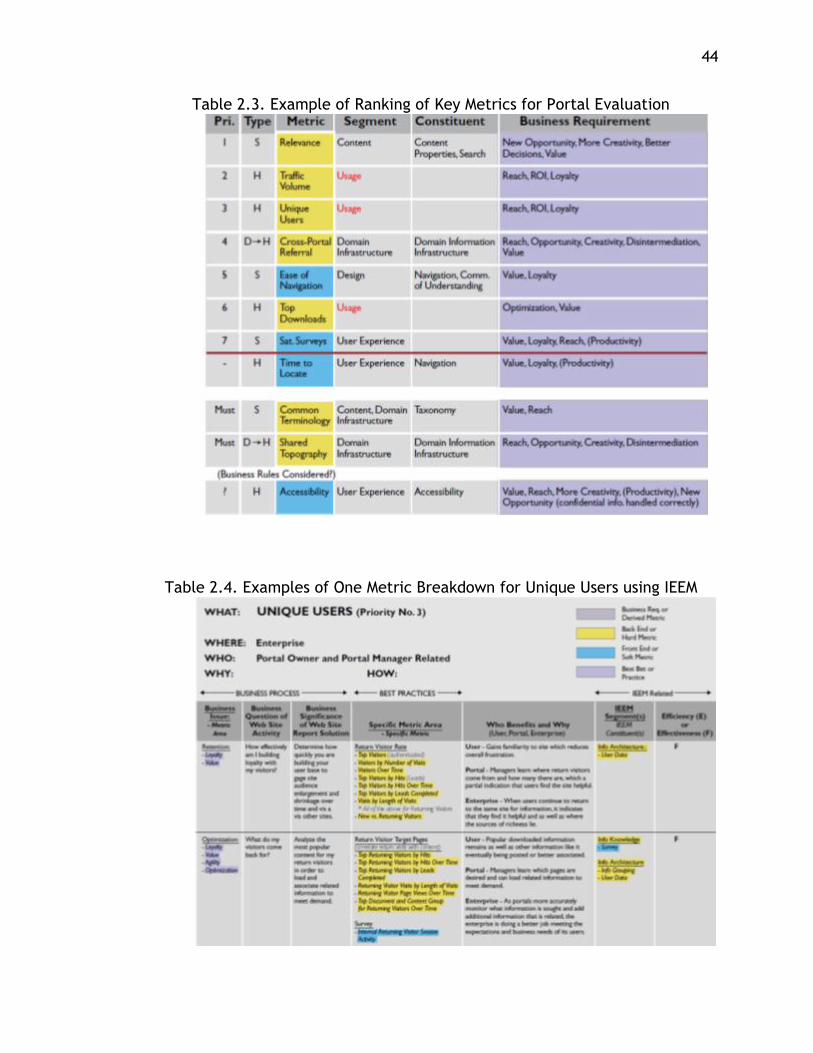
44
Table 2.3. Example of Ranking of Key Metrics for Portal Evaluation
Table 2.4. Examples of One Metric Breakdown for Unique Users using IEEM
45
2.6. BALANCED SCORECARD
A balanced scorecard is a strategic performance measurement system
created by Kaplan and Norton in 1992. It came into being as a performance
measurement system but evolved into a Strategy-Focused-Organization (SFO)
framework. The Balanced Scorecard is aimed at translating strategy into
operational terms, helping align strategy and organizational units,
communicating strategy to employees and providing learning and feedback.
(Kaplan and Norton 2008) It was created to harness the multiple benefits of
performance measurement and help companies to implement their strategies.
The Balanced Scorecard can be a very reliable tool for identifying perceived
benefits to an organization. (Shutibhinyo, 2013)
Balanced scorecards are widely used as a Performance Measurement
System (PMS) today to evaluate performance levels within an organization and
analyze their impact, and also helps the organization compare itself with its
competitors, thus planning its future course of action to gain and maintain
competitive advantage.
The balanced scorecard framework is composed of four different
perspectives which can be described as the impact areas within an
organization. Each perspective is broken down into a set of Objectives, and
each objective is associated with Key Performance Indicators (KPIs), which can
be used to assess how well the objectives are being met. This can greatly help
46
a company to assess and adjust its progress toward its goals. (Franceschini,
et.al, 2013)
The four different perspectives of the balanced scorecard are the
“Financial perspective,” “Customer perspective,” “Internal business
perspective” and the “Learning and growth perspective.” (Shutibhinyo, 2013;
Amiry and Kumaraswamy, 2013; Franceschini, et al., 2013)
47
3. METHODOLOGY
The methodology adopted in this research is to establish the Industry
Standards and Best Practices of an internal employee portal based on theories
derived from literature review and industry standards derived from case
studies. An information mapping grid is established by bringing together
Industry Standards and Best Practices as suggested by literature and uses in
case studies.
This research uses a case company to validate the Information Mapping
Grid derived from literature review and industry best practices. This is done by
determining actual portal usage of the case company and user-perceived portal
usage of the case company. Actual portal usage was determined by using data
warehouse and dashboard monitoring systems. User-perceived portal usage was
determined by the results of a third-party evaluation and occasional company
site visits.
Finally, comparison and analysis was done on the actual and user-
perceived portal usage with the Information mapping grid to derive meaningful
results and formulate useful recommendations. The figure below shows a Venn
diagram which graphically depicts the methodology used for this research. It
shows how the three universes of “Industry Standards and Best Practices,”
“Actual Portal Usage” and “User-Perceived Portal Usage” were all considered
when developing the “Recommendations.”
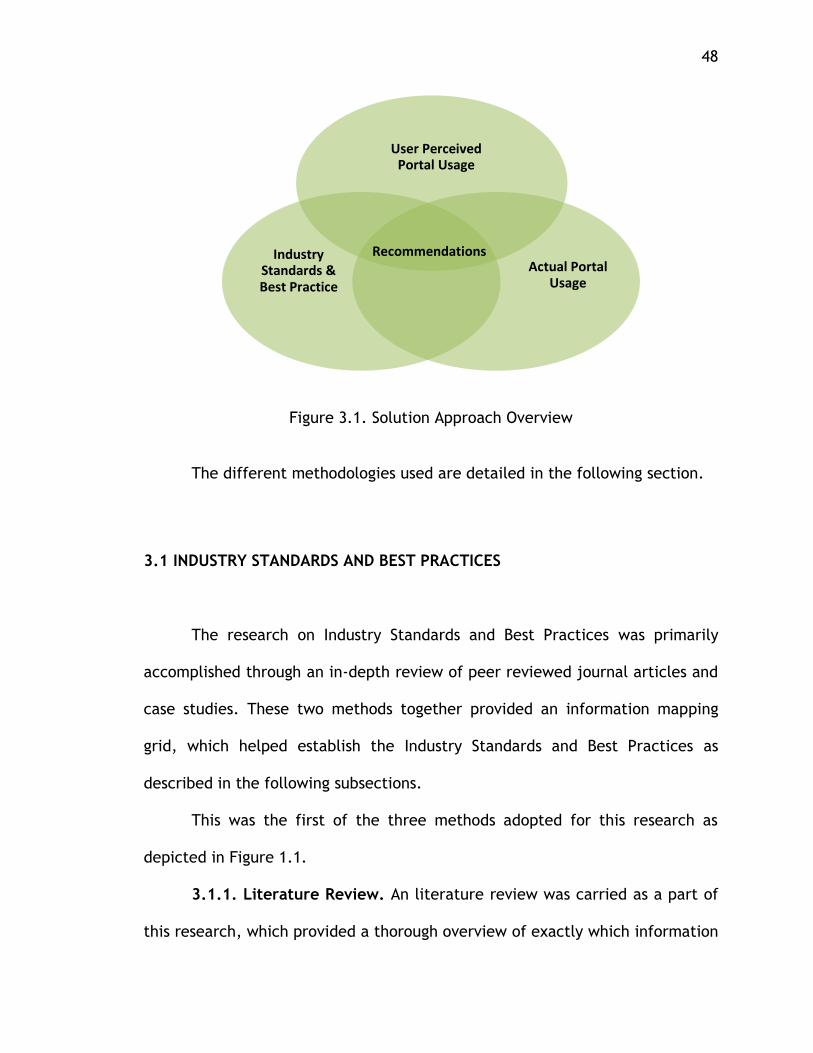
48
Figure 3.1. Solution Approach Overview
The different methodologies used are detailed in the following section.
3.1 INDUSTRY STANDARDS AND BEST PRACTICES
The research on Industry Standards and Best Practices was primarily
accomplished through an in-depth review of peer reviewed journal articles and
case studies. These two methods together provided an information mapping
grid, which helped establish the Industry Standards and Best Practices as
described in the following subsections.
This was the first of the three methods adopted for this research as
depicted in Figure 1.1.
3.1.1. Literature Review. An literature review was carried as a part of
this research, which provided a thorough overview of exactly which information
Actual Portal Usage
User Perceived Portal Usage
Industry Standards & Best Practice
Recommendations
49
items were most vital to the structure of an effective employee enterprise
portal, and which features were required for each information item; all of
these were combined into a comprehensive list of the key contents and
functions required for a successful enterprise employee portal. The literature
review mentioned in section 2 helps to establish the Industry Standards and
Best Practices as shown in the research framework of Figure 1.1.
3.1.2 Case Studies. A number of real companies’ employee portals were
studied as a part of this research. Company portals are very confidential and
are not readily available to study and analyze, therefore, licensed reports
about various companies’ portals were purchased and the researcher and
advisor’s personal experiences were used along with information from the
Literature Review to construct this section. The contents and functions of the
companies’ portals were used as case studies, which were then compared with
the comprehensive list of the contents and functions of an employee portal
that was developed in the Literature Review. The findings from the case
studies generally supported those found in the Literature Review and were
used to form the information mapping grid created to document “Industry
Standards and Best Practices” used for an Employee Enterprise Portal. The case
studies explained at length in section 4.1.2 are a method used to establish
Industry Standards and Best Practices as suggested by the research framework
of Figure 1.1.
50
3.2 USER PERCEIVED PORTAL USAGE
The second method used in this research measured the users’ perception
of the utility and usage of an employee portal through feedback from users in
the Case Company. This is one of the three solution approaches used in this
research as suggested in the research framework (Figure 1.1). Two methods
were used to assess the user-perceived Portal Usage:
3.2.1. Company Visit. Intermittent visits to the company headquarters
provided an opportunity to interact with the IT/Portal team and gather their
feedback on user-perceived Portal Usage. The portal team experts were able to
provide insight into the current stage of portal implementation within the
company. They provided valuable information about the goals the company
wanted to achieve by implementing the portal, and this helped identify the
areas in which research was needed most, which in turn helped in drive the
design of the monitoring system. Their requirements and expectations for their
portal helped establish the Key Performance Indicators used in the dashboard
monitoring system, which was used to monitor the actual portal usage. Most of
this information was gleaned via the exchange of e-mails and online meetings,
in addition to periodic on-site visits to the company headquarters. The face-to-
face conversations, discussions, brainstorming sessions and interviews with the
IT portal have proved to be the most helpful and productive. This is one of the
methods used in this research to establish user-perceived portal usage as
suggested by the research framework in figure 1.1.
51
3.2.2. Third – Party Evaluation. Since this research was conducted off-
site from the Case Company, direct interaction with the users was extremely
limited, and company policy prevented the research team from conducting
research-specific surveys and interviews. However, the company employs a
third–party consulting agency that was able to conduct this research on our
behalf, to include five usability workshops on-site and one remote usability
workshop via video conference in order to include members of multiple target
user groups. Their evaluation reports were provided to the research team for
reference and were used in this study. This is one of the methods used in this
research to establish user-perceived portal usage as suggested by the research
framework in figure 1.1.
3.3. ACTUAL PORTAL USAGE
The third approach sought to gain an understanding of the current actual
usage of the portal in the company, which was accomplished by monitoring the
portal using two dashboard monitoring systems built specifically for this
purpose. The dashboard helped visualize the utilization of the portal, thereby
giving the executives of the company easy to read and understand metrics to
aid in analyzing portal usage in terms of number of views, number of user
logins, number of file downloads, etc. The results from the dashboards were
matched against the goals and objectives that the company wanted to achieve
through this research. The usage data was then compared to the list of Industry
52
Standards and Best Practices that had been developed via literature review,
and the results were used to formulate recommendations for improvement.
The two dashboard monitoring systems are described in the following sections.
This is one of the three solution approaches used in this research as suggested
in the research framework (Figure 1.1).
3.3.1. Knowledge Management Data. This data includes the Web
Content management data that forms the backbone of the portal and was
obtained from the portal usage log. It addressed the usage of the files and
folders stored in the portal. Knowledge of the subject areas of the files
accessed helped identify areas of interest within the portal, and provided
valuable insight into how the portal is used and what files are used most. It
also highlighted which areas or files were not being accessed. Once the data
was cleansed and structured, it was fed into a dashboard monitoring system
that operated on a data warehouse, which helped analyze and support
conclusions about the portal usage from the Knowledge Management
perspective.
3.3.2. ClickStream Data from Sweetlets. Sweetlets is an SAP
application that captures ClickStream data. That is, it gathers details about
what users click on in the portal as well as tracking the sequence of clicks
required to access a certain page on the portal. The tabs on the portal home
are considered ‘sections’ at the highest level and they contain subsections,
which in turn contain other subsections, etc., until a user reaches a webpage
at the lowest level of the organizational hierarchy. Tracking the ClickStream
53
can highlight which sections, subsections, web pages, tabs, etc., are accessed
most and least frequently by portal users, thereby providing valuable insights
into portal usage from a user’s perspective. Once it is displayed in a graphical
format, it can be especially useful in helping company executives to
understand if the users are using the portal as they had intended. This data was
also very helpful to the research team to compare against the Industry
Standards and Best Practices before drafting recommendations for the
improvement of the Case Company’s portal. Like the Knowledge Management
Data, this data was processed with the use of a dashboard monitoring system
and Data warehouse.
3.3.3 Technical Implementation. The technical implementation of this
research included the creation of Data Warehouses (SAP InfoCubes) using SAP
BW 7.0 and creation of Dashboard Monitoring systems using Xcelsius 2008,
which are addressed in the following subsections.
3.3.3.1. Data warehouse creation. Data Warehouses (SAP InfoCubes)
created using SAP BW 7.0 was one of the technical methods used to analyze the
data for this research. The two sets of data used to assess portal usage,
Knowledge Management Data and ClickStream Data, were fed into data
warehouses (called InfoCubes) and then queries were built and run against the
InfoCubes using Business Explorer - Query Designer to derive meaningful
information from the large data set. The query results organized the numbers
into a tabular format, which could be displayed in graphical format on the
dashboard monitoring systems for quick and easy interpretation by company
54
executives. Data Warehouse is one of the tools used to study the actual portal
usage and brought meaningful information as suggested in the research
framework shown in Figure 1.1.
The technical details of the Data warehouse and its creation can be seen
in Appendix A.
3.3.3.2. Dashboard implementation. This section addresses the actual
portal usage monitoring by the dashboard monitoring system. The dashboard
helped in deriving meaningful information out of the raw, unstructured portal
usage logs obtained from Knowledge Management and ClickStream.
The dashboards were created using Xcelsius 2008, which is a product of
SAP Business Objects Suite, and they were designed to monitor areas of
interest to the Case Company.
The dashboards dealt with departmental as well as enterprise-wide data
which was presented in a summarized format. The dashboards were built on
top of one or more Data Warehouses, and they were designed to help the
portal team and top management (managers and executives) make informed
decisions about the structure and content of the employee portal. The main
purpose of these performance dashboards was to optimize process and manage
strategy by allowing the portal team and top management of the Case Company
to analyze trends and study the changes and behavior of the users accessing
the portal before taking appropriate action, to help the company gain strategic
and competitive advantage over other companies in their sector. So based on
the lessons learnt from literature review in section 2.2; the dashboard created
55
in this research can be classified as strategic-to-tactical dashboard. The trends
obtained from the dashboard were compared to the Industry Standards and
Best Practices so that various areas of improvement could be identified before
changes were discussed and implemented.
3.3.3.2.1. Knowledge management monitoring dashboard. This was
the first dashboard that was created for this research and it monitored the
Content management data of the portal. The resulting data showed which files
were accessed most by portal users as well as where the files resided in the
folder structure of the Content management system. The location of the files
provided insight about which folders contained the most frequently accessed
files as well as identifying which files were not being used. Less ‘popular’ files
could be deleted or moved to a more strategic location where the users are
more likely to use them. This dashboard also provided a record of which types
of files were downloaded (eg, .doc or .pdf). The information obtained by this
dashboard is especially meaningful because it reflects the actual usage of the
portal by users. This gave us meaningful results as suggested by the research
framework in Figure 1.1. This is not discussed at length here in this study as
this was a part of different research whose results are used here.
3.3.3.2.2. ClickStream data monitoring dashboard. This second
dashboard was built to analyze the ClickStream data captured by Sweetlets and
help identify the most used and least used pages, sections, and sub-sections
within the portal. The dashboard measured how long each page, section and
subsection of the portal was viewed. Assuming that users spend more time
56
viewing the items which they consider important and less time on pages they
either don’t find useful or happen to come across unintentionally, this can help
rate the usefulness of portal content. Once this data was placed in a graphical
format and compared to the Industry Standards and Best Practices and
Perceived portal usage, it aided in the development of a set of
recommendations for making the portal more user-friendly, efficient and
effective.
The data used gathered by this dashboard was built on a data warehouse
created using SAP BW 7.0, which was filled with the ClickStream data obtained
from Sweetlets. The warehouse was then queried to obtain relevant sets of
data that were then displayed in meaningful visualized form to highlight the
trends of data usage. This gave us meaningful results as suggested by the
research framework in Figure 1.1. The technical details of this dashboard and
its creation can be seen in Appendix B.
3.4. COMPARISION AND ANALYSIS
After the results were gathered as described above (shown under the
analysis section in figure 1.1), they were then compared. This analysis brought
together Industry Standards and Best Practices – Literature Review and Case
Studies, the Perceived Portal Usage – Company Visit and Third Party Evaluation;
and Actual Portal Usage – Knowledge Management data and ClickStream data
analysis. By comparing the different sets of data in different combinations,

57
meaningful information was obtained to help establish recommendations for
improvements to the Case Company’s enterprise employee portal.
58
4. RESULTS AND DISCUSSIONS
The multiple methodologies adopted in this research provided a rich set
of results. All the results were then combined and analyzed to derive a set of
recommendations for the Case Company to aid in its portal usability
improvement decisions.
4.1. INDUSTRY STANDARDS AND BEST PRACTICES
The Industry standards and Best practices were established through
literature review of peer reviewed journals and case studies, addressing the
three aspects of: “Contents and Function,” “Design,” and “Implementation,”
but focusing most on the “Contents and Function” aspect. The resulting
information was used to create a comprehensive list of Industry Standards and
Best Practices which can be used as a yardstick to measure an enterprise
portal’s efficiency and effectiveness in terms of the functionality it provides,
and its contents and functions.
An information mapping grid was developed as a complement to the
standards list, which addressed on all the information collected from literature
review and the case studies of real companies.
4.1.1. Literature Review. Numerous peer reviewed journal articles
were included in the literature review to compile information regarding the
contents and functions of an enterprise employee portal. Based on this
59
research, a comprehensive list of information items was created relating to the
“Contents and Functions” of the employee portal and features of each
information item as shown in table 2.1, which matches the features of every
information item with the source journals.
4.1.2. Case Studies. To bolster the information collected from
Literature Review, several actual companies’ employee portals were studied
and their contents and functions were analyzed to establish a connection
between literature and practice. The real companies’ portals studied included
Dell, NAVSEA, Fijutsu Siemens, Sprint, Verizon, Eversheds, Point Loma, ABB,
Idaho Lab and Piper Jaffray.
Company portal layout and structure is very confidential so licensed
copies of high-standard reports were purchased for this research. No
confidentiality has been breached or boundaries crossed in the creation of this
document.
The commonalities of structure, layout, and navigation were analyzed
across multiple companies. The literature and the case studies tied in well and
similar themes were discovered in most sources, as shown in Table 4.2, which
combines the findings of the case studies with the findings from the literature
review to provide an even more comprehensive picture.
Contents and Functions of an Enterprise portal are the most visible
portion of the portal, and they determine how useful the portal is to its users.
With this in mind, contents and functions should cater to the needs of the
company and its users as discussed in the following subsections.
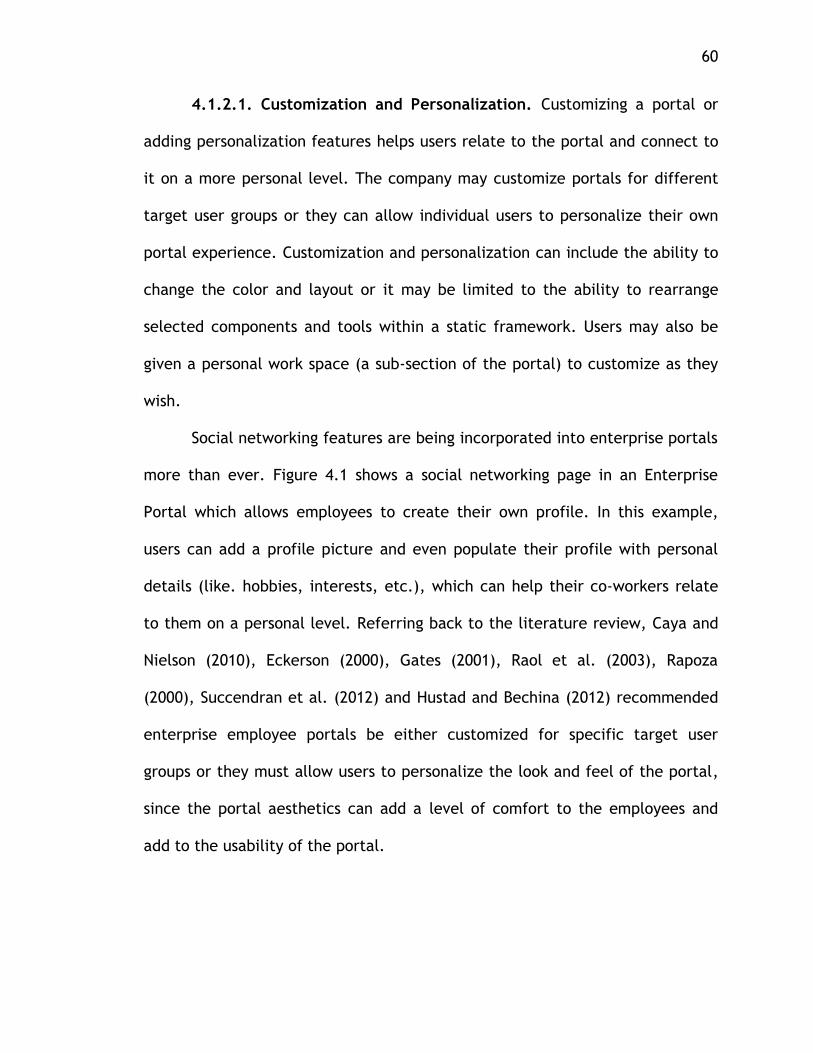
60
4.1.2.1. Customization and Personalization. Customizing a portal or
adding personalization features helps users relate to the portal and connect to
it on a more personal level. The company may customize portals for different
target user groups or they can allow individual users to personalize their own
portal experience. Customization and personalization can include the ability to
change the color and layout or it may be limited to the ability to rearrange
selected components and tools within a static framework. Users may also be
given a personal work space (a sub-section of the portal) to customize as they
wish.
Social networking features are being incorporated into enterprise portals
more than ever. Figure 4.1 shows a social networking page in an Enterprise
Portal which allows employees to create their own profile. In this example,
users can add a profile picture and even populate their profile with personal
details (like. hobbies, interests, etc.), which can help their co-workers relate
to them on a personal level. Referring back to the literature review, Caya and
Nielson (2010), Eckerson (2000), Gates (2001), Raol et al. (2003), Rapoza
(2000), Succendran et al. (2012) and Hustad and Bechina (2012) recommended
enterprise employee portals be either customized for specific target user
groups or they must allow users to personalize the look and feel of the portal,
since the portal aesthetics can add a level of comfort to the employees and
add to the usability of the portal.
61
Figure 4.1. Social Networking
Figure 4.2 shows a customized page for the clients of Eversheds,
which provides every client that logs in to the portal a customized view of the
data as it pertains to their unique legal activity with Eversheds such as the
latest versions of their very own the latest ECA (Early case Assessment)
Documents. Referring back to the literature review, Caya and Nielson (2010),
Eckerson (2000), Gates (2001), Valdes et al. (2010), Raol et al. (2003), Rapoza
(2000), Tojib et al. (2006), Sugianto and Tojib (2006), Bolu et al.(2012) and Al-
Zagaier (2012) all have suggested that Social Networking could be used to
enhance an enterprise employee portal.
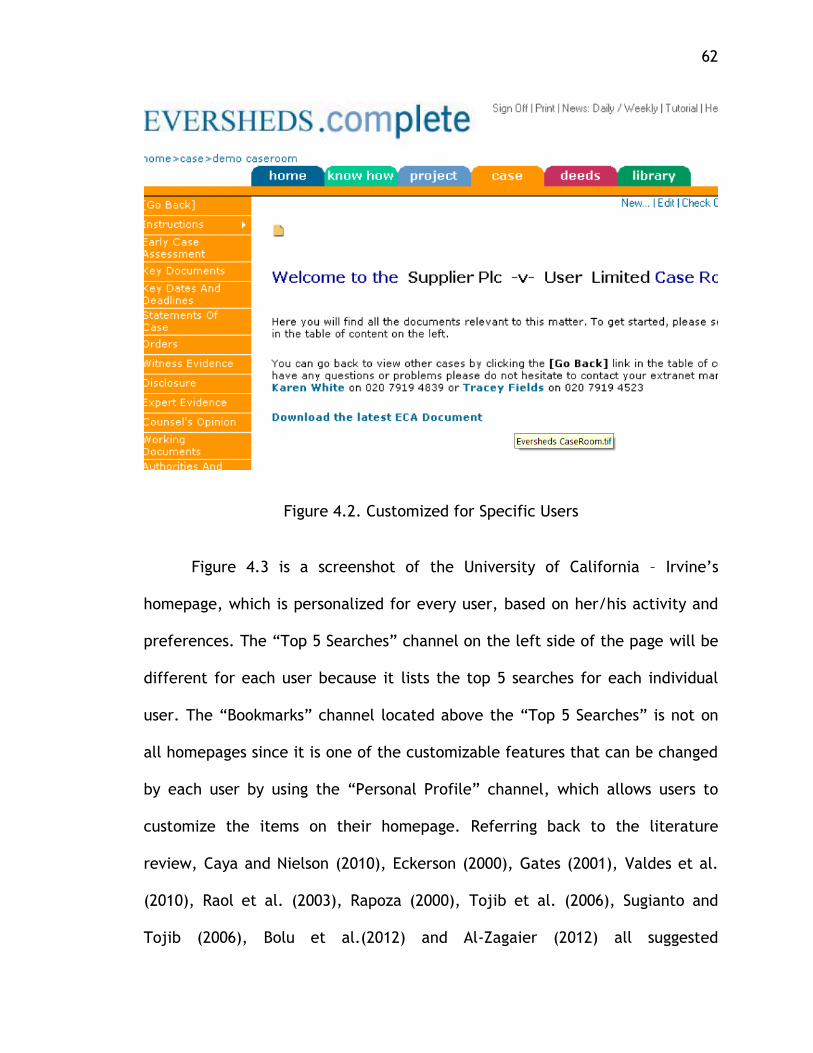
62
Figure 4.2. Customized for Specific Users
Figure 4.3 is a screenshot of the University of California – Irvine’s
homepage, which is personalized for every user, based on her/his activity and
preferences. The “Top 5 Searches” channel on the left side of the page will be
different for each user because it lists the top 5 searches for each individual
user. The “Bookmarks” channel located above the “Top 5 Searches” is not on
all homepages since it is one of the customizable features that can be changed
by each user by using the “Personal Profile” channel, which allows users to
customize the items on their homepage. Referring back to the literature
review, Caya and Nielson (2010), Eckerson (2000), Gates (2001), Valdes et al.
(2010), Raol et al. (2003), Rapoza (2000), Tojib et al. (2006), Sugianto and
Tojib (2006), Bolu et al.(2012) and Al-Zagaier (2012) all suggested
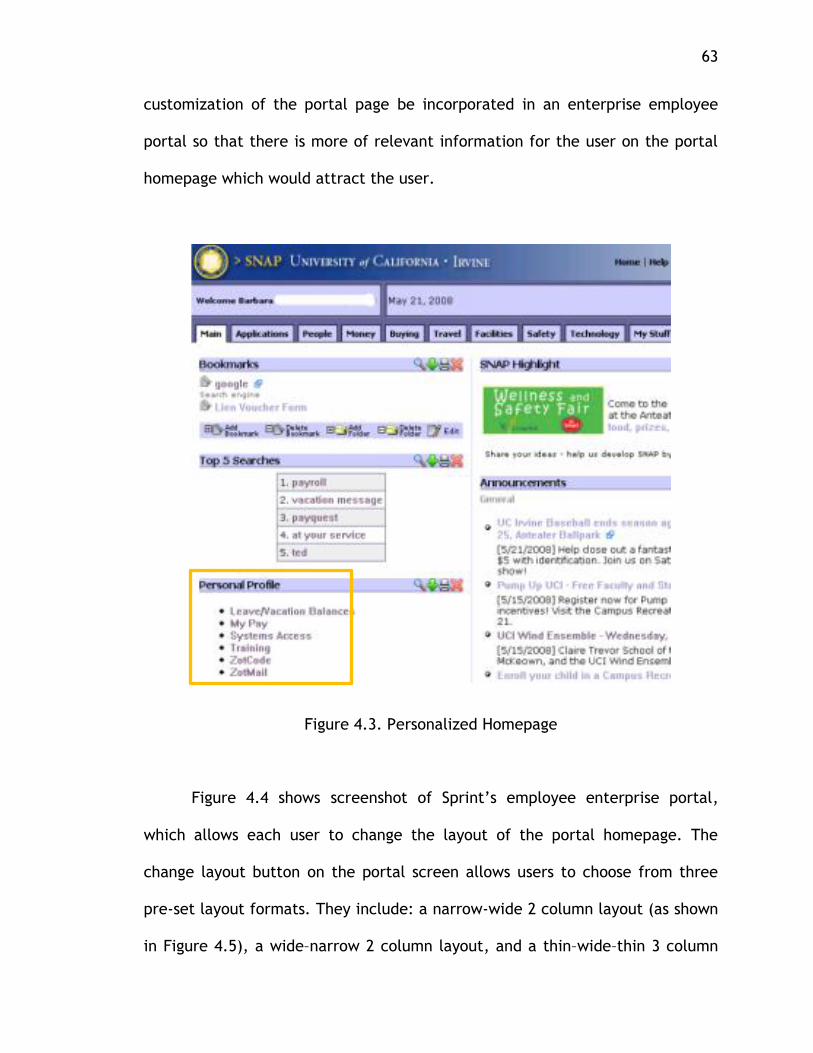
63
customization of the portal page be incorporated in an enterprise employee
portal so that there is more of relevant information for the user on the portal
homepage which would attract the user.
Figure 4.3. Personalized Homepage
Figure 4.4 shows screenshot of Sprint’s employee enterprise portal,
which allows each user to change the layout of the portal homepage. The
change layout button on the portal screen allows users to choose from three
pre-set layout formats. They include: a narrow-wide 2 column layout (as shown
in Figure 4.5), a wide–narrow 2 column layout, and a thin–wide–thin 3 column
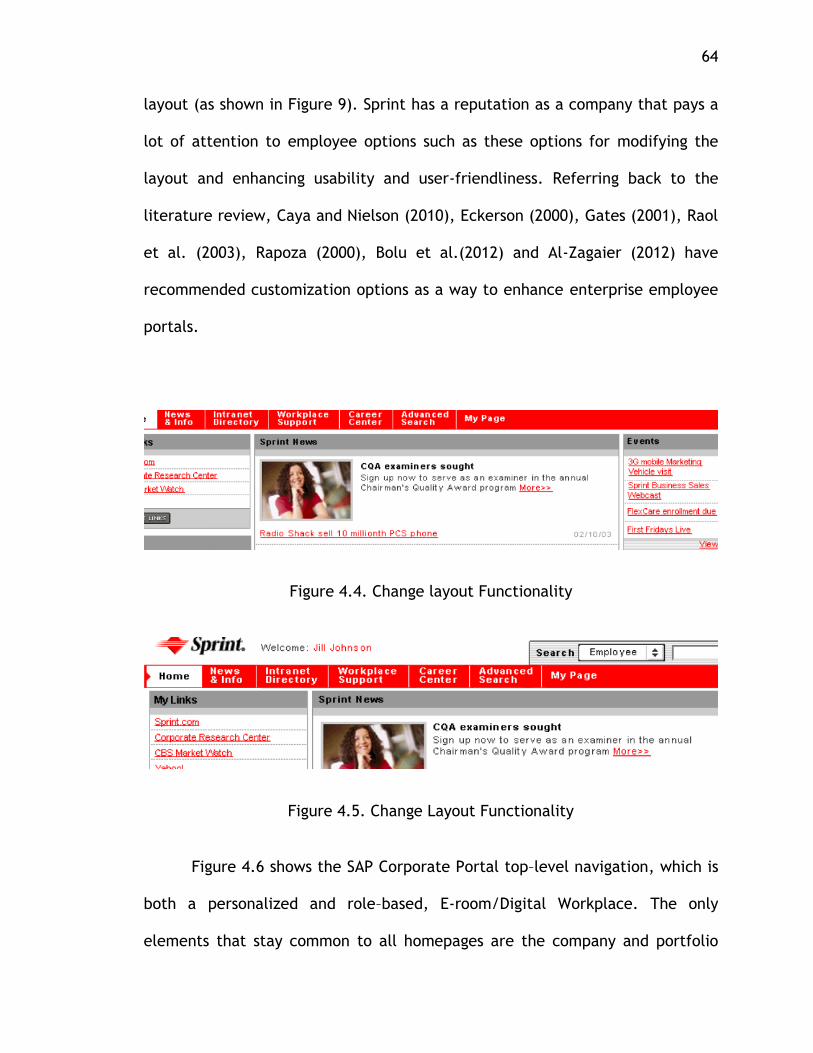
64
layout (as shown in Figure 9). Sprint has a reputation as a company that pays a
lot of attention to employee options such as these options for modifying the
layout and enhancing usability and user-friendliness. Referring back to the
literature review, Caya and Nielson (2010), Eckerson (2000), Gates (2001), Raol
et al. (2003), Rapoza (2000), Bolu et al.(2012) and Al-Zagaier (2012) have
recommended customization options as a way to enhance enterprise employee
portals.
Figure 4.4. Change layout Functionality
Figure 4.5. Change Layout Functionality
Figure 4.6 shows the SAP Corporate Portal top–level navigation, which is
both a personalized and role–based, E-room/Digital Workplace. The only
elements that stay common to all homepages are the company and portfolio
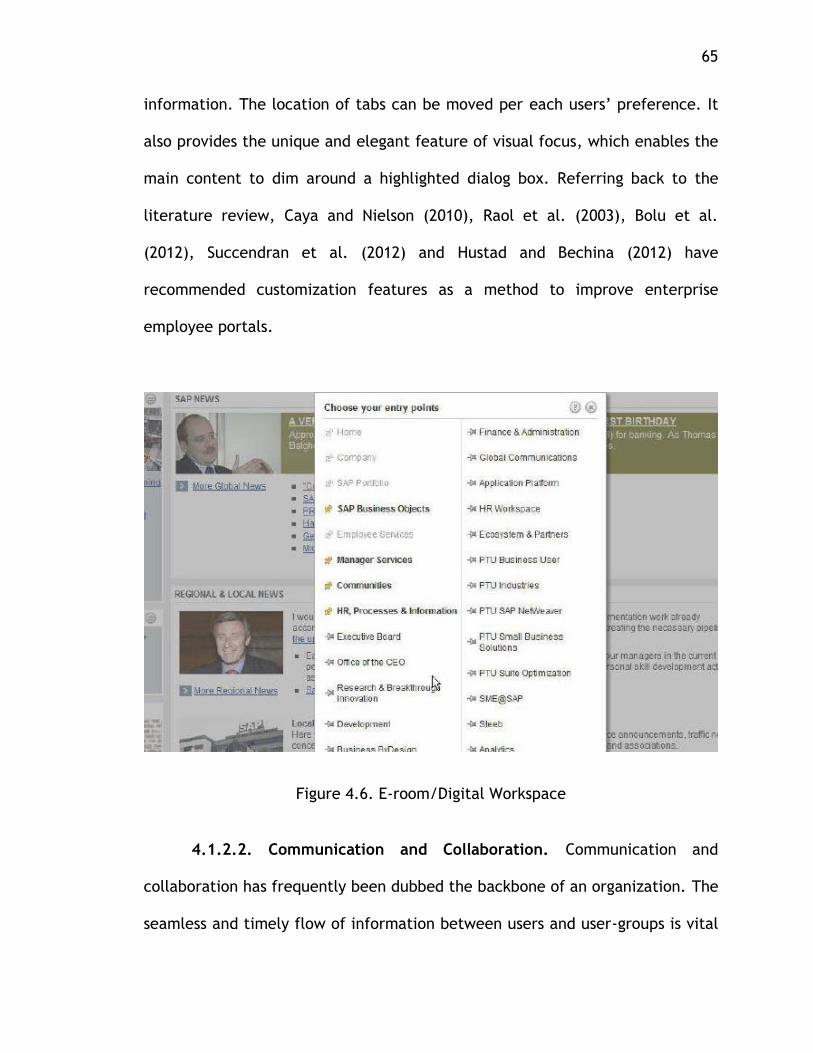
65
information. The location of tabs can be moved per each users’ preference. It
also provides the unique and elegant feature of visual focus, which enables the
main content to dim around a highlighted dialog box. Referring back to the
literature review, Caya and Nielson (2010), Raol et al. (2003), Bolu et al.
(2012), Succendran et al. (2012) and Hustad and Bechina (2012) have
recommended customization features as a method to improve enterprise
employee portals.
Figure 4.6. E-room/Digital Workspace
4.1.2.2. Communication and Collaboration. Communication and
collaboration has frequently been dubbed the backbone of an organization. The
seamless and timely flow of information between users and user-groups is vital
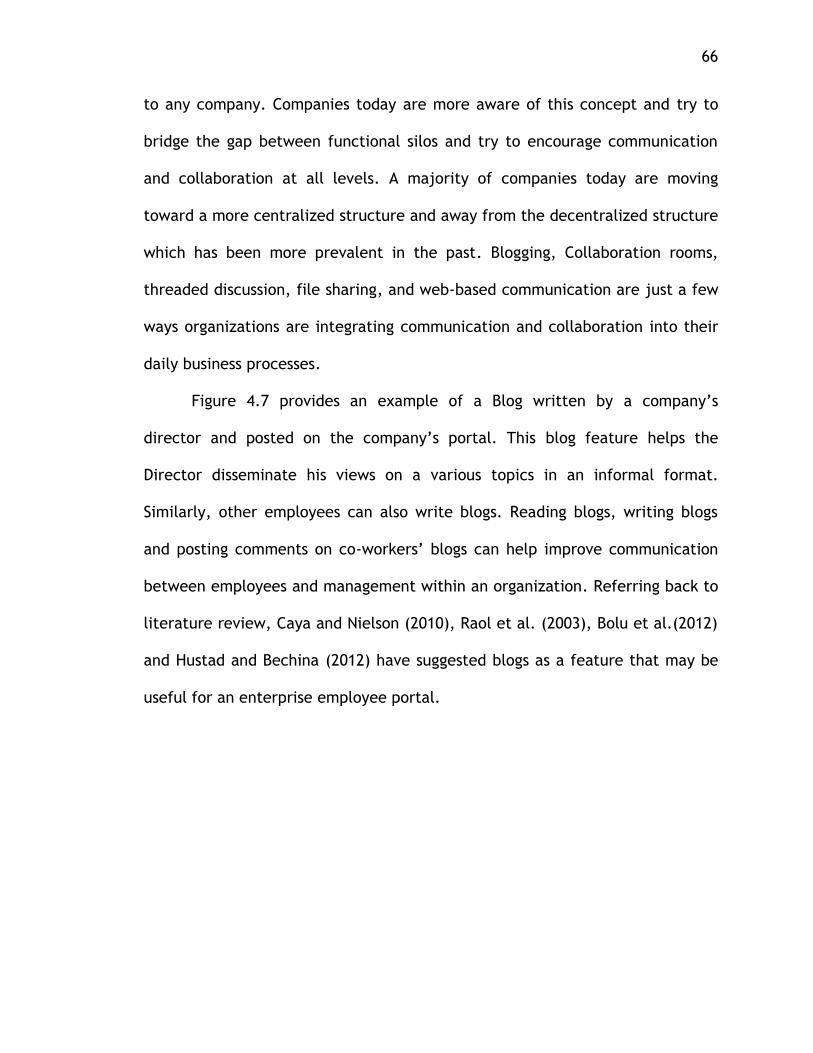
66
to any company. Companies today are more aware of this concept and try to
bridge the gap between functional silos and try to encourage communication
and collaboration at all levels. A majority of companies today are moving
toward a more centralized structure and away from the decentralized structure
which has been more prevalent in the past. Blogging, Collaboration rooms,
threaded discussion, file sharing, and web-based communication are just a few
ways organizations are integrating communication and collaboration into their
daily business processes.
Figure 4.7 provides an example of a Blog written by a company’s
director and posted on the company’s portal. This blog feature helps the
Director disseminate his views on a various topics in an informal format.
Similarly, other employees can also write blogs. Reading blogs, writing blogs
and posting comments on co-workers’ blogs can help improve communication
between employees and management within an organization. Referring back to
literature review, Caya and Nielson (2010), Raol et al. (2003), Bolu et al.(2012)
and Hustad and Bechina (2012) have suggested blogs as a feature that may be
useful for an enterprise employee portal.
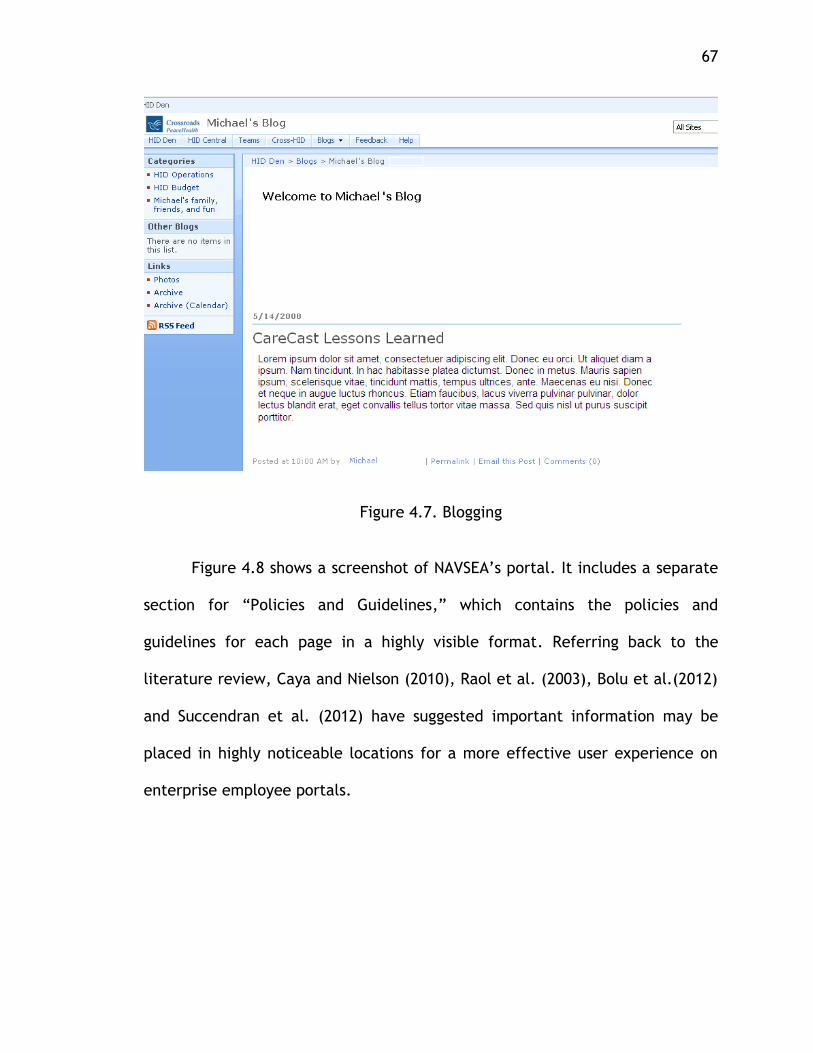
67
Figure 4.7. Blogging
Figure 4.8 shows a screenshot of NAVSEA’s portal. It includes a separate
section for “Policies and Guidelines,” which contains the policies and
guidelines for each page in a highly visible format. Referring back to the
literature review, Caya and Nielson (2010), Raol et al. (2003), Bolu et al.(2012)
and Succendran et al. (2012) have suggested important information may be
placed in highly noticeable locations for a more effective user experience on
enterprise employee portals.
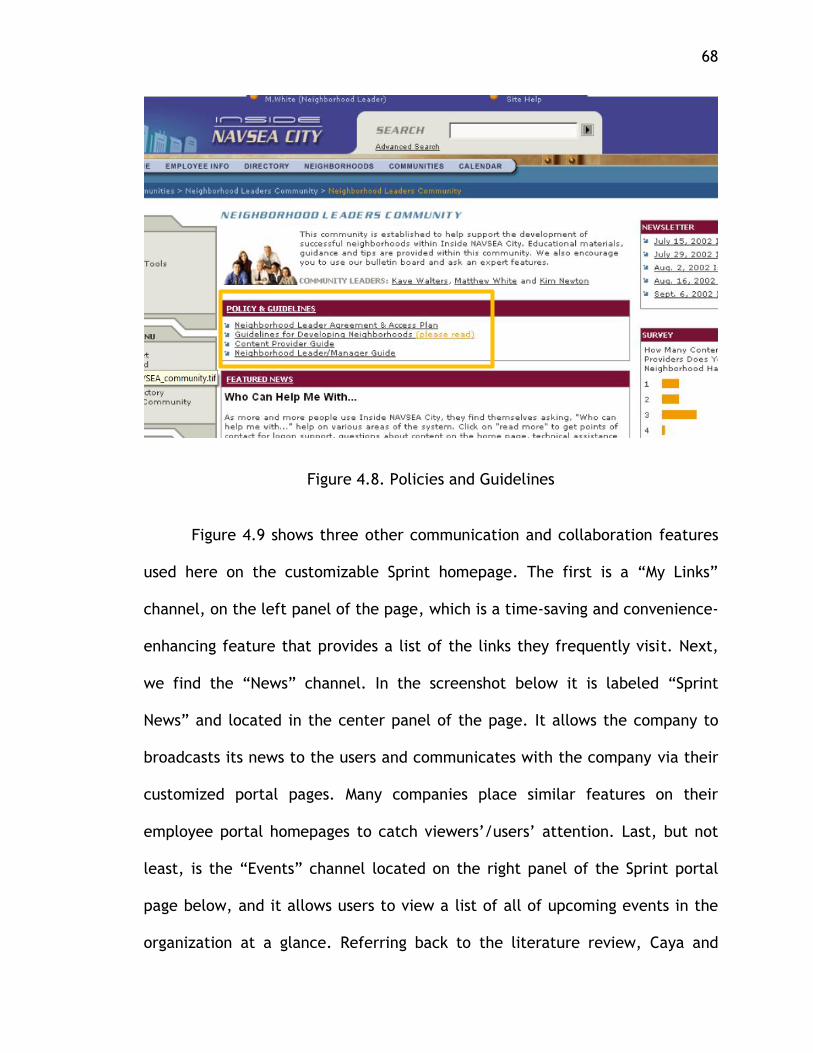
68
Figure 4.8. Policies and Guidelines
Figure 4.9 shows three other communication and collaboration features
used here on the customizable Sprint homepage. The first is a “My Links”
channel, on the left panel of the page, which is a time-saving and convenience-
enhancing feature that provides a list of the links they frequently visit. Next,
we find the “News” channel. In the screenshot below it is labeled “Sprint
News” and located in the center panel of the page. It allows the company to
broadcasts its news to the users and communicates with the company via their
customized portal pages. Many companies place similar features on their
employee portal homepages to catch viewers’/users’ attention. Last, but not
least, is the “Events” channel located on the right panel of the Sprint portal
page below, and it allows users to view a list of all of upcoming events in the
organization at a glance. Referring back to the literature review, Caya and
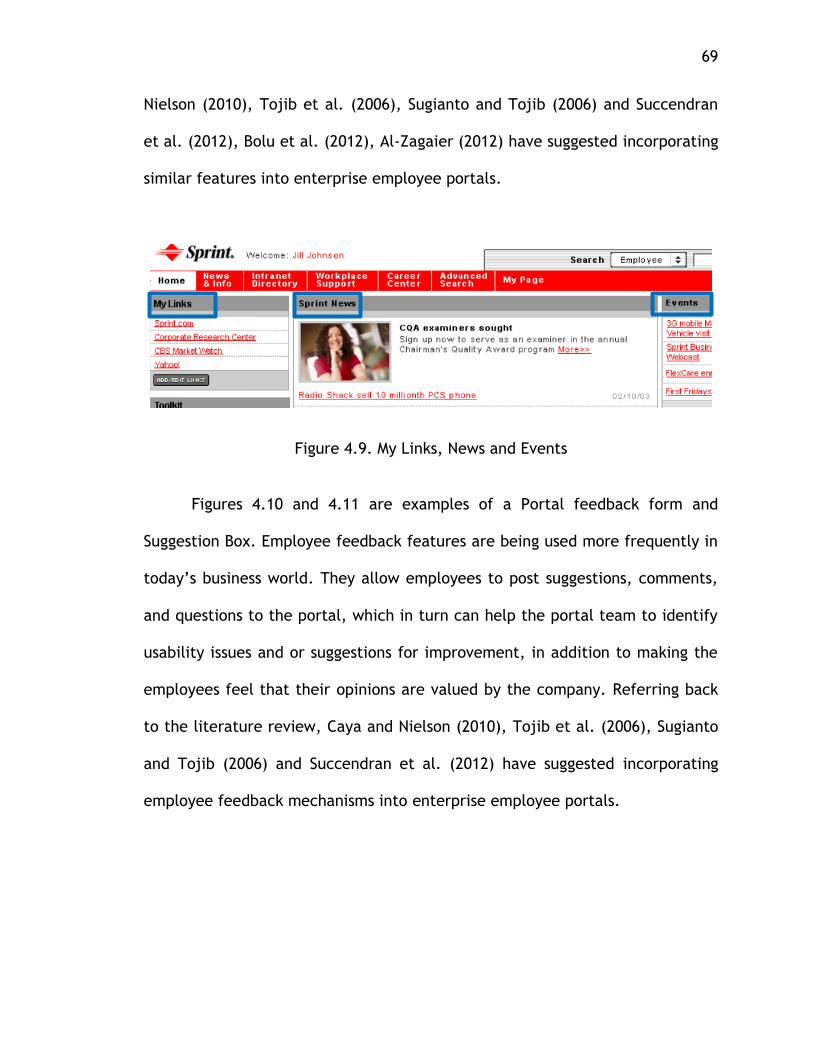
69
Nielson (2010), Tojib et al. (2006), Sugianto and Tojib (2006) and Succendran
et al. (2012), Bolu et al. (2012), Al-Zagaier (2012) have suggested incorporating
similar features into enterprise employee portals.
Figure 4.9. My Links, News and Events
Figures 4.10 and 4.11 are examples of a Portal feedback form and
Suggestion Box. Employee feedback features are being used more frequently in
today’s business world. They allow employees to post suggestions, comments,
and questions to the portal, which in turn can help the portal team to identify
usability issues and or suggestions for improvement, in addition to making the
employees feel that their opinions are valued by the company. Referring back
to the literature review, Caya and Nielson (2010), Tojib et al. (2006), Sugianto
and Tojib (2006) and Succendran et al. (2012) have suggested incorporating
employee feedback mechanisms into enterprise employee portals.
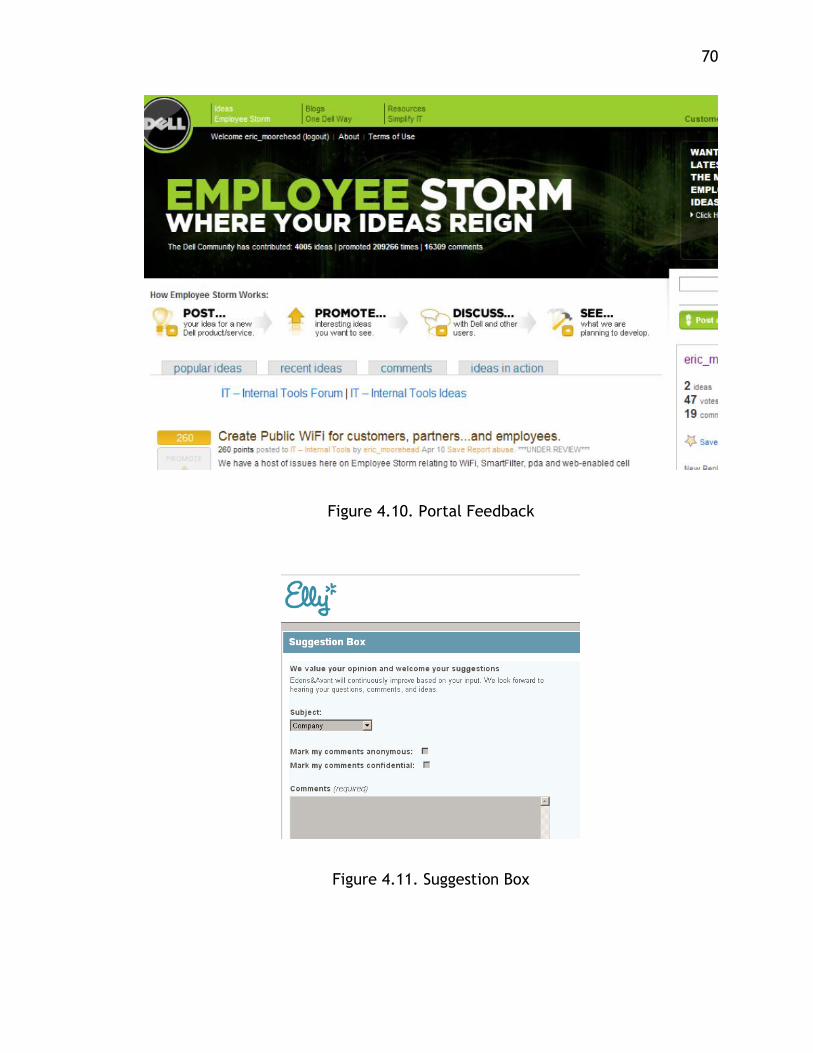
70
Figure 4.10. Portal Feedback
Figure 4.11. Suggestion Box
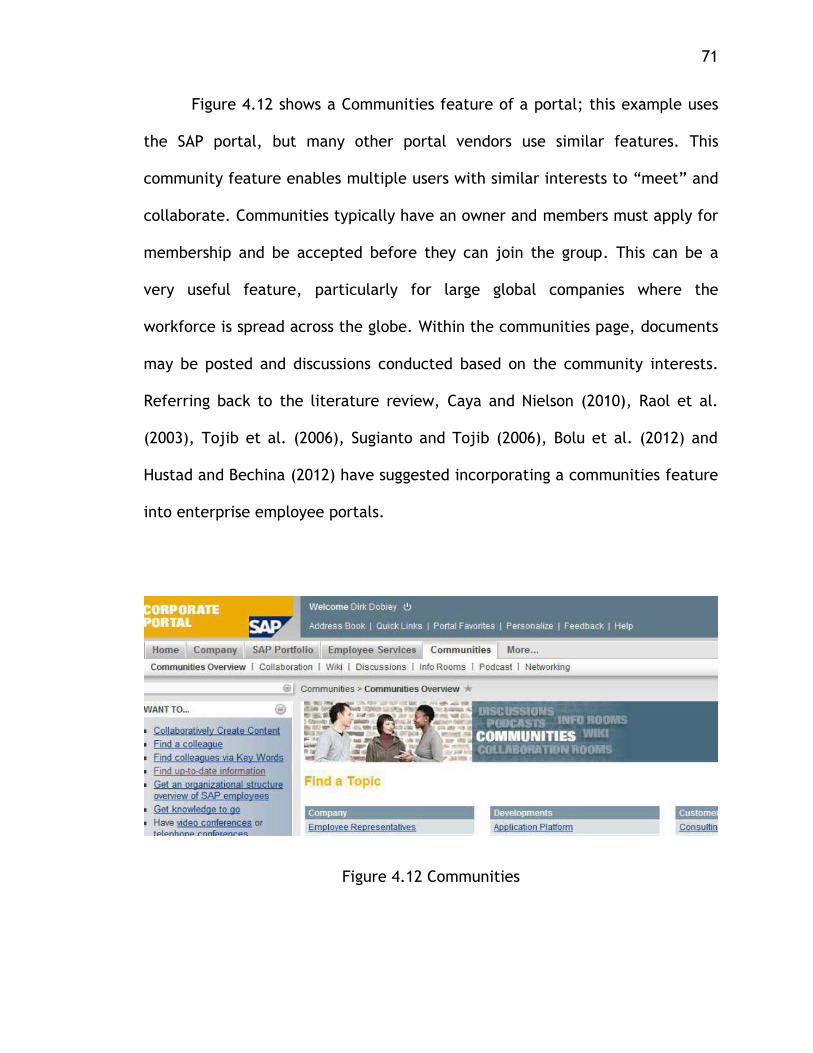
71
Figure 4.12 shows a Communities feature of a portal; this example uses
the SAP portal, but many other portal vendors use similar features. This
community feature enables multiple users with similar interests to “meet” and
collaborate. Communities typically have an owner and members must apply for
membership and be accepted before they can join the group. This can be a
very useful feature, particularly for large global companies where the
workforce is spread across the globe. Within the communities page, documents
may be posted and discussions conducted based on the community interests.
Referring back to the literature review, Caya and Nielson (2010), Raol et al.
(2003), Tojib et al. (2006), Sugianto and Tojib (2006), Bolu et al. (2012) and
Hustad and Bechina (2012) have suggested incorporating a communities feature
into enterprise employee portals.
Figure 4.12 Communities
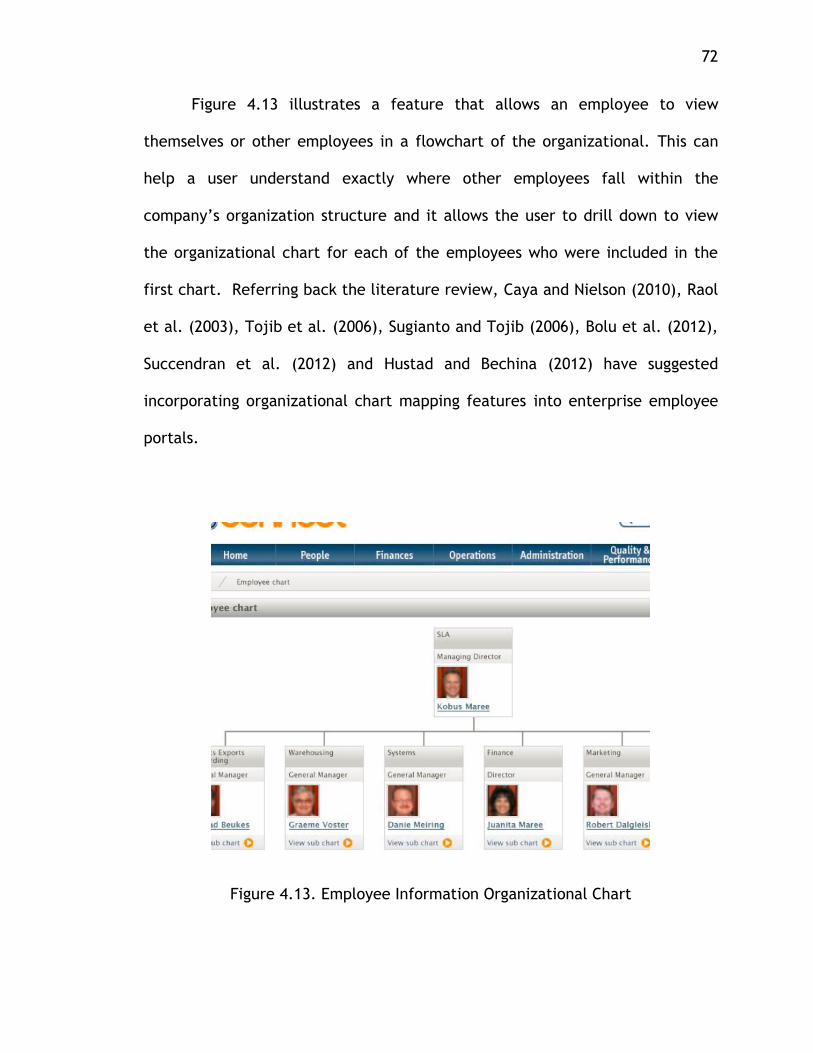
72
Figure 4.13 illustrates a feature that allows an employee to view
themselves or other employees in a flowchart of the organizational. This can
help a user understand exactly where other employees fall within the
company’s organization structure and it allows the user to drill down to view
the organizational chart for each of the employees who were included in the
first chart. Referring back the literature review, Caya and Nielson (2010), Raol
et al. (2003), Tojib et al. (2006), Sugianto and Tojib (2006), Bolu et al. (2012),
Succendran et al. (2012) and Hustad and Bechina (2012) have suggested
incorporating organizational chart mapping features into enterprise employee
portals.
Figure 4.13. Employee Information Organizational Chart
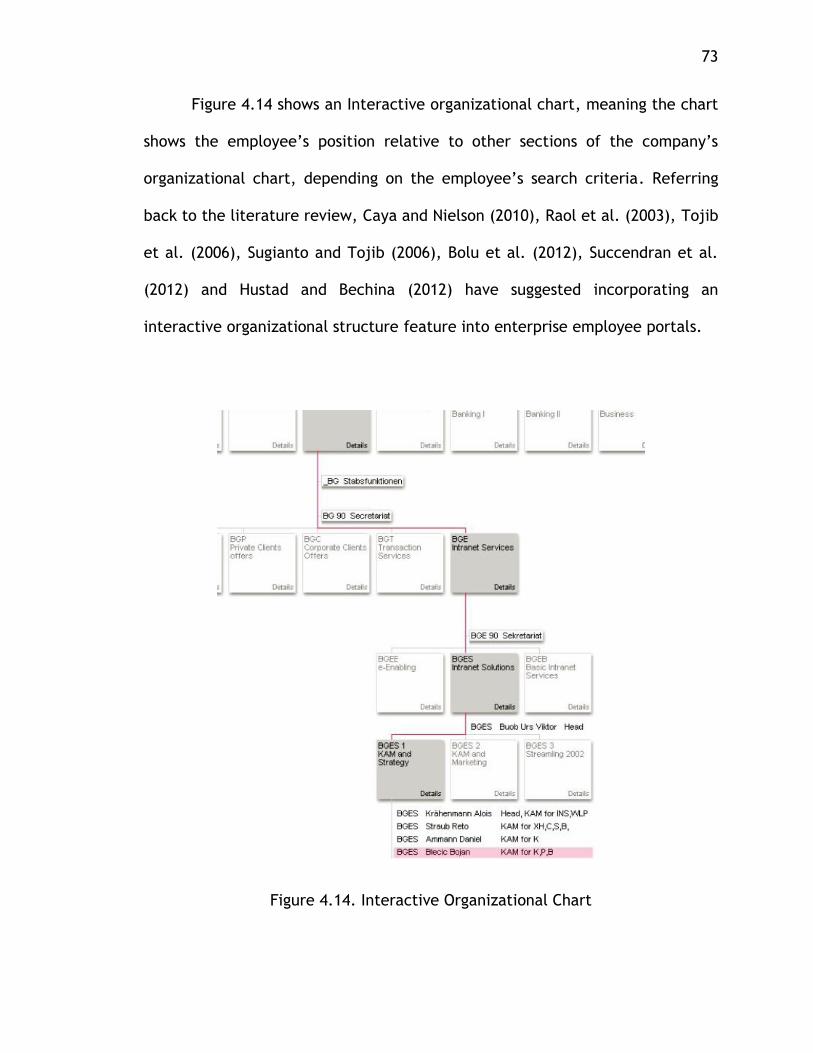
73
Figure 4.14 shows an Interactive organizational chart, meaning the chart
shows the employee’s position relative to other sections of the company’s
organizational chart, depending on the employee’s search criteria. Referring
back to the literature review, Caya and Nielson (2010), Raol et al. (2003), Tojib
et al. (2006), Sugianto and Tojib (2006), Bolu et al. (2012), Succendran et al.
(2012) and Hustad and Bechina (2012) have suggested incorporating an
interactive organizational structure feature into enterprise employee portals.
Figure 4.14. Interactive Organizational Chart
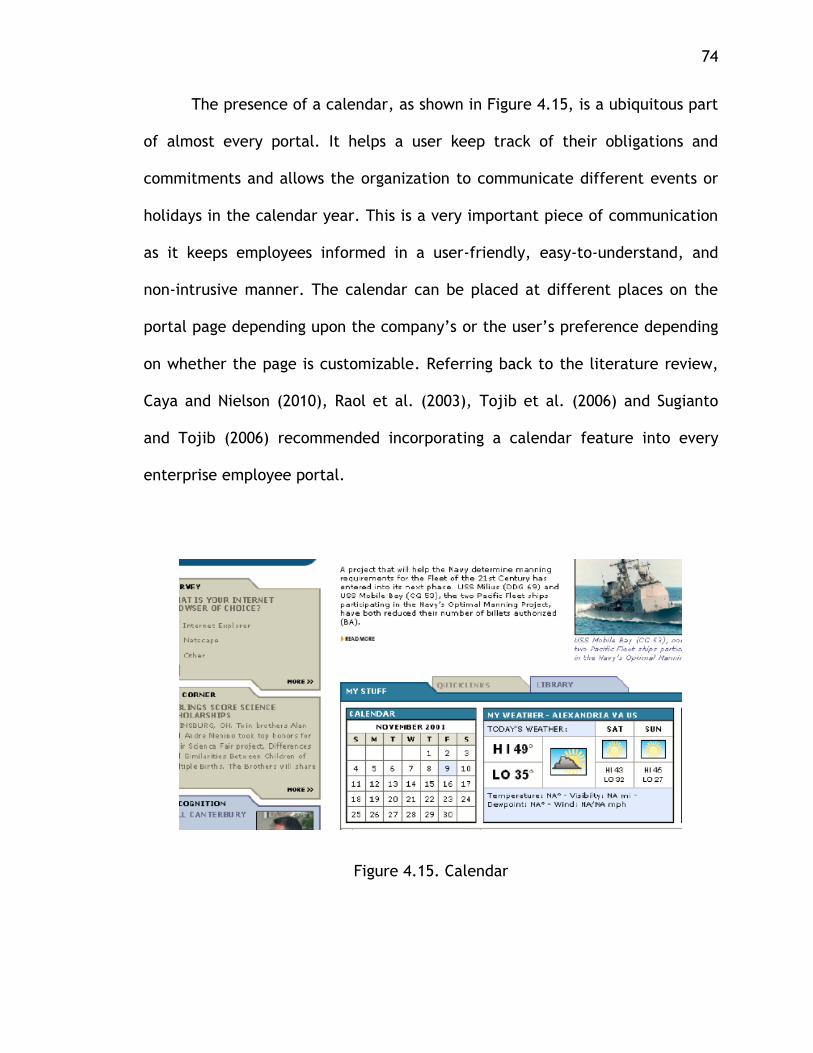
74
The presence of a calendar, as shown in Figure 4.15, is a ubiquitous part
of almost every portal. It helps a user keep track of their obligations and
commitments and allows the organization to communicate different events or
holidays in the calendar year. This is a very important piece of communication
as it keeps employees informed in a user-friendly, easy-to-understand, and
non-intrusive manner. The calendar can be placed at different places on the
portal page depending upon the company’s or the user’s preference depending
on whether the page is customizable. Referring back to the literature review,
Caya and Nielson (2010), Raol et al. (2003), Tojib et al. (2006) and Sugianto
and Tojib (2006) recommended incorporating a calendar feature into every
enterprise employee portal.
Figure 4.15. Calendar
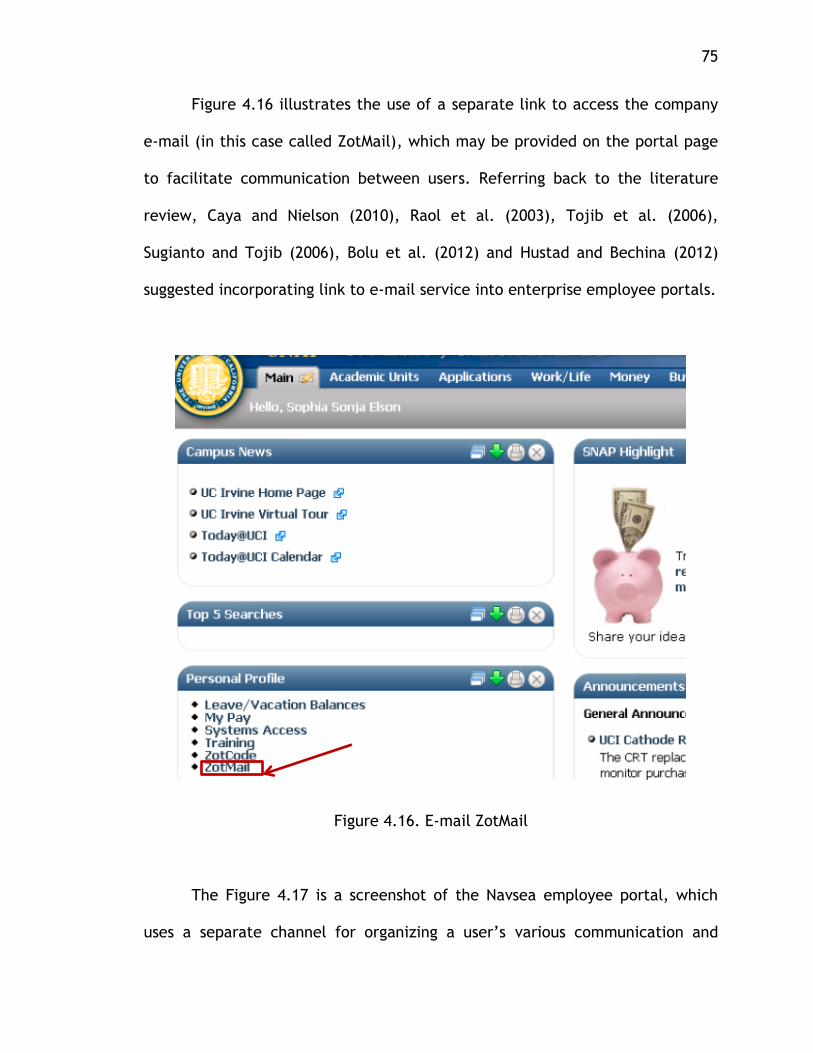
75
Figure 4.16 illustrates the use of a separate link to access the company
e-mail (in this case called ZotMail), which may be provided on the portal page
to facilitate communication between users. Referring back to the literature
review, Caya and Nielson (2010), Raol et al. (2003), Tojib et al. (2006),
Sugianto and Tojib (2006), Bolu et al. (2012) and Hustad and Bechina (2012)
suggested incorporating link to e-mail service into enterprise employee portals.
Figure 4.16. E-mail ZotMail
The Figure 4.17 is a screenshot of the Navsea employee portal, which
uses a separate channel for organizing a user’s various communication and
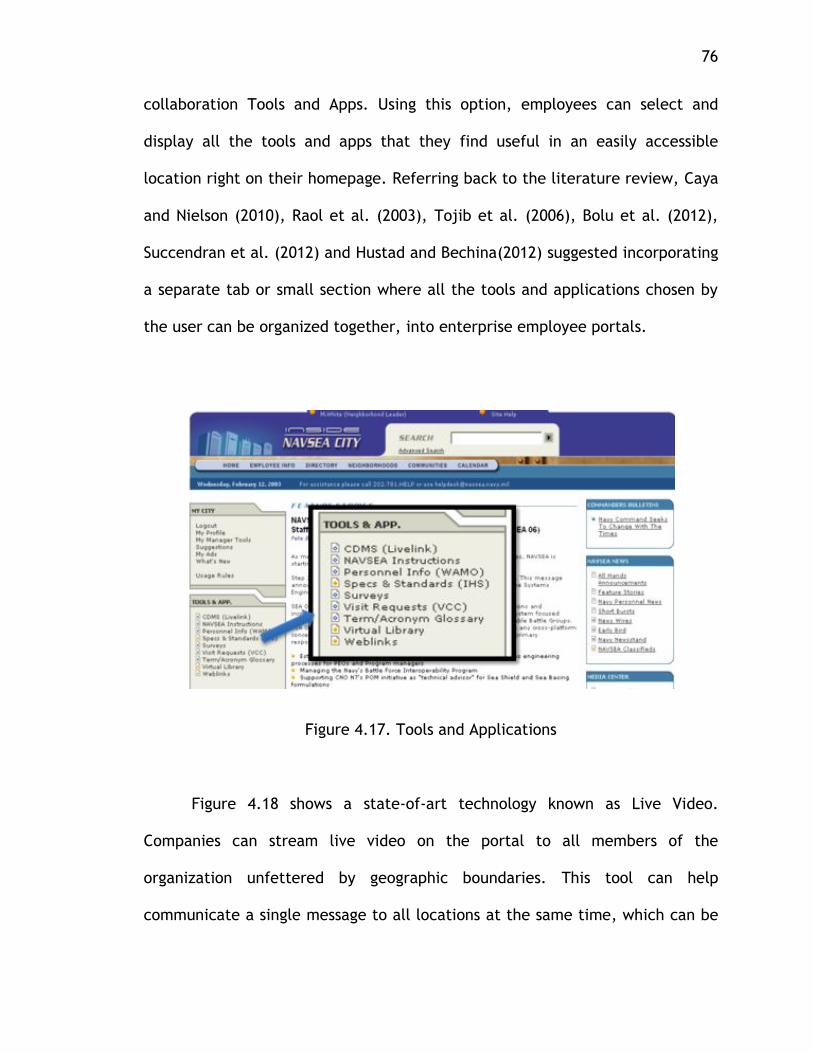
76
collaboration Tools and Apps. Using this option, employees can select and
display all the tools and apps that they find useful in an easily accessible
location right on their homepage. Referring back to the literature review, Caya
and Nielson (2010), Raol et al. (2003), Tojib et al. (2006), Bolu et al. (2012),
Succendran et al. (2012) and Hustad and Bechina(2012) suggested incorporating
a separate tab or small section where all the tools and applications chosen by
the user can be organized together, into enterprise employee portals.
Figure 4.17. Tools and Applications
Figure 4.18 shows a state-of-art technology known as Live Video.
Companies can stream live video on the portal to all members of the
organization unfettered by geographic boundaries. This tool can help
communicate a single message to all locations at the same time, which can be
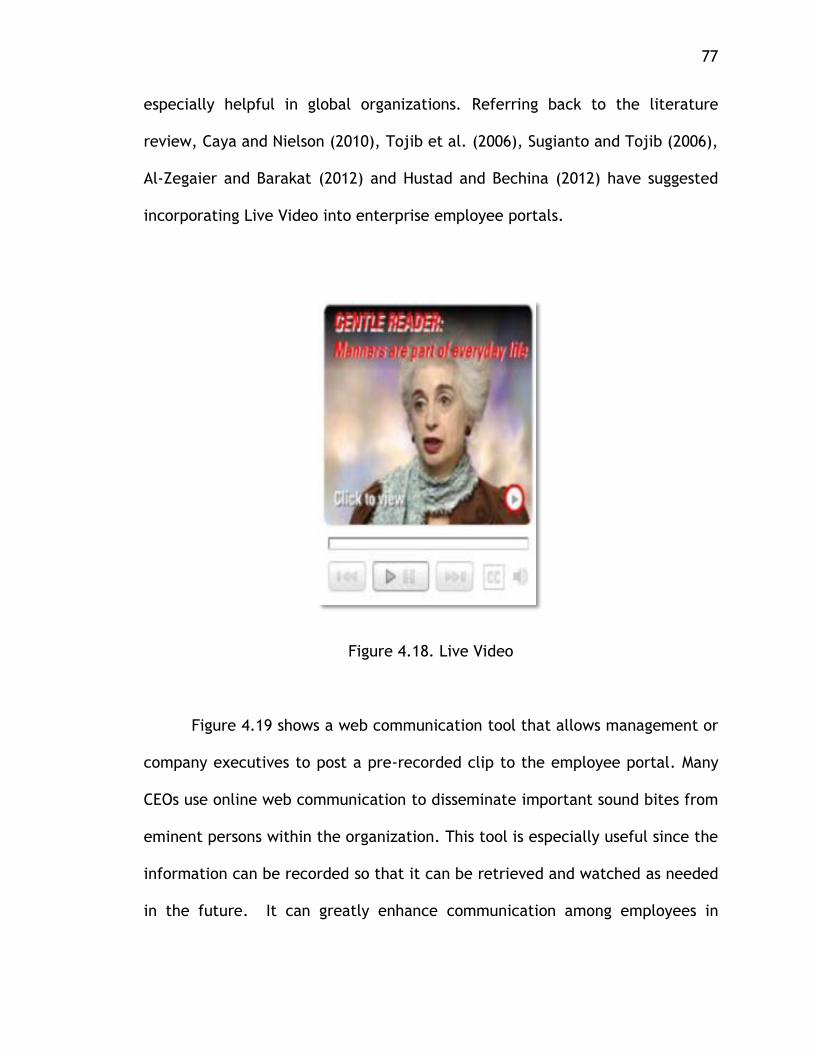
77
especially helpful in global organizations. Referring back to the literature
review, Caya and Nielson (2010), Tojib et al. (2006), Sugianto and Tojib (2006),
Al-Zegaier and Barakat (2012) and Hustad and Bechina (2012) have suggested
incorporating Live Video into enterprise employee portals.
Figure 4.18. Live Video
Figure 4.19 shows a web communication tool that allows management or
company executives to post a pre-recorded clip to the employee portal. Many
CEOs use online web communication to disseminate important sound bites from
eminent persons within the organization. This tool is especially useful since the
information can be recorded so that it can be retrieved and watched as needed
in the future. It can greatly enhance communication among employees in
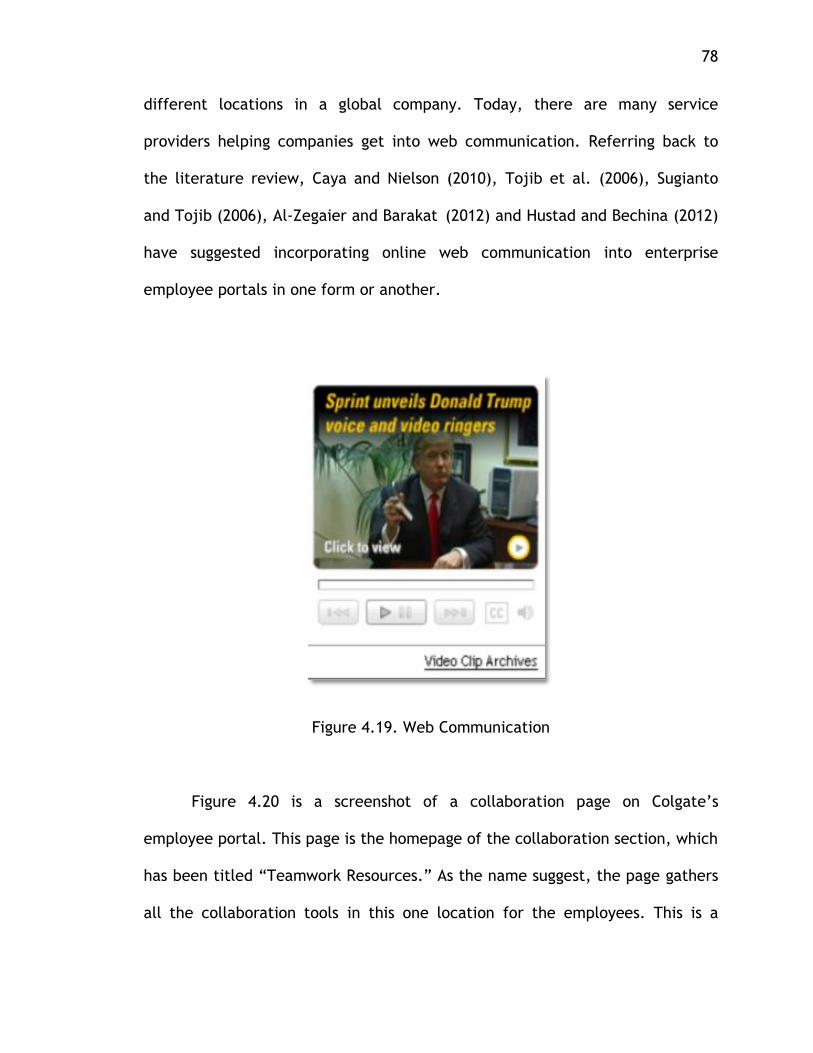
78
different locations in a global company. Today, there are many service
providers helping companies get into web communication. Referring back to
the literature review, Caya and Nielson (2010), Tojib et al. (2006), Sugianto
and Tojib (2006), Al-Zegaier and Barakat (2012) and Hustad and Bechina (2012)
have suggested incorporating online web communication into enterprise
employee portals in one form or another.
Figure 4.19. Web Communication
Figure 4.20 is a screenshot of a collaboration page on Colgate’s
employee portal. This page is the homepage of the collaboration section, which
has been titled “Teamwork Resources.” As the name suggest, the page gathers
all the collaboration tools in this one location for the employees. This is a
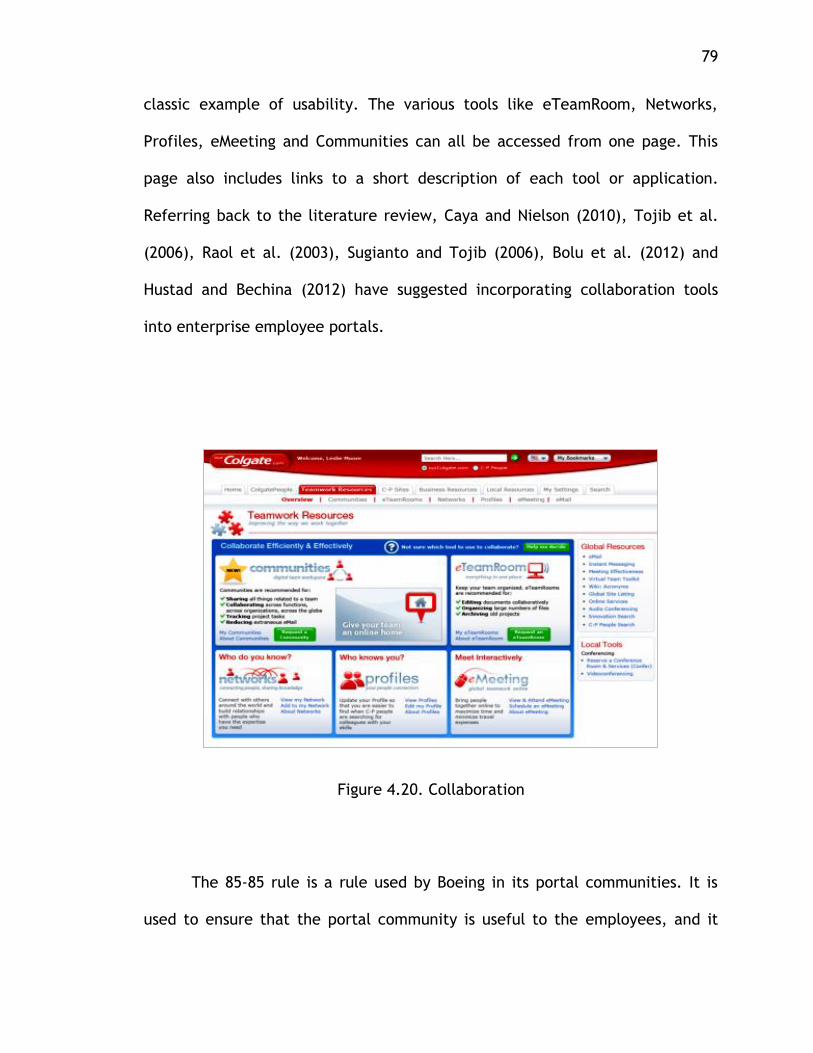
79
classic example of usability. The various tools like eTeamRoom, Networks,
Profiles, eMeeting and Communities can all be accessed from one page. This
page also includes links to a short description of each tool or application.
Referring back to the literature review, Caya and Nielson (2010), Tojib et al.
(2006), Raol et al. (2003), Sugianto and Tojib (2006), Bolu et al. (2012) and
Hustad and Bechina (2012) have suggested incorporating collaboration tools
into enterprise employee portals.
Figure 4.20. Collaboration
The 85-85 rule is a rule used by Boeing in its portal communities. It is
used to ensure that the portal community is useful to the employees, and it
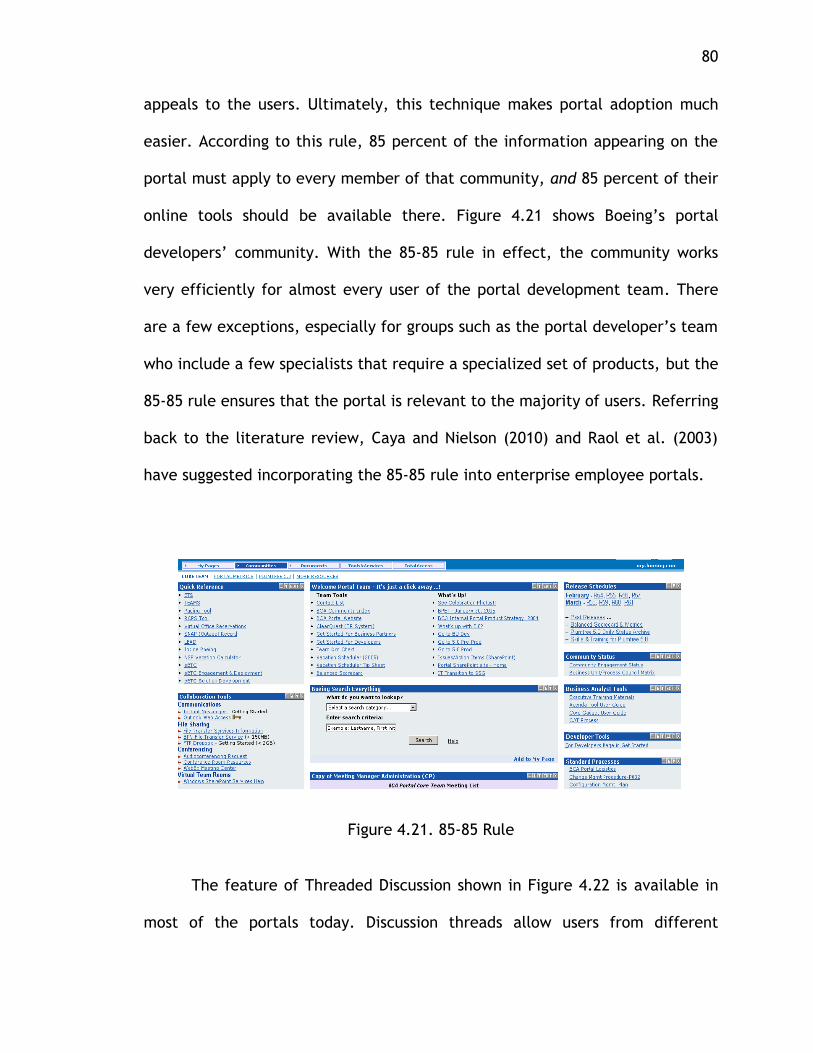
80
appeals to the users. Ultimately, this technique makes portal adoption much
easier. According to this rule, 85 percent of the information appearing on the
portal must apply to every member of that community, and 85 percent of their
online tools should be available there. Figure 4.21 shows Boeing’s portal
developers’ community. With the 85-85 rule in effect, the community works
very efficiently for almost every user of the portal development team. There
are a few exceptions, especially for groups such as the portal developer’s team
who include a few specialists that require a specialized set of products, but the
85-85 rule ensures that the portal is relevant to the majority of users. Referring
back to the literature review, Caya and Nielson (2010) and Raol et al. (2003)
have suggested incorporating the 85-85 rule into enterprise employee portals.
Figure 4.21. 85-85 Rule
The feature of Threaded Discussion shown in Figure 4.22 is available in
most of the portals today. Discussion threads allow users from different
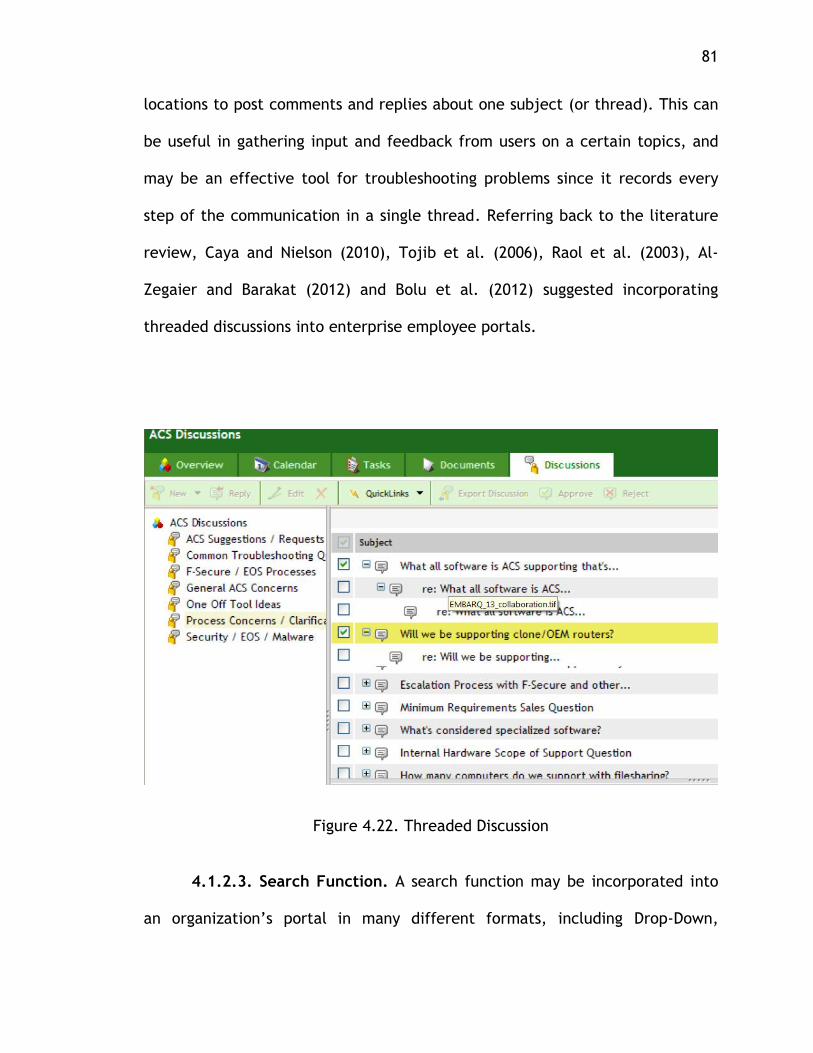
81
locations to post comments and replies about one subject (or thread). This can
be useful in gathering input and feedback from users on a certain topics, and
may be an effective tool for troubleshooting problems since it records every
step of the communication in a single thread. Referring back to the literature
review, Caya and Nielson (2010), Tojib et al. (2006), Raol et al. (2003), Al-
Zegaier and Barakat (2012) and Bolu et al. (2012) suggested incorporating
threaded discussions into enterprise employee portals.
Figure 4.22. Threaded Discussion
4.1.2.3. Search Function. A search function may be incorporated into
an organization’s portal in many different formats, including Drop-Down,
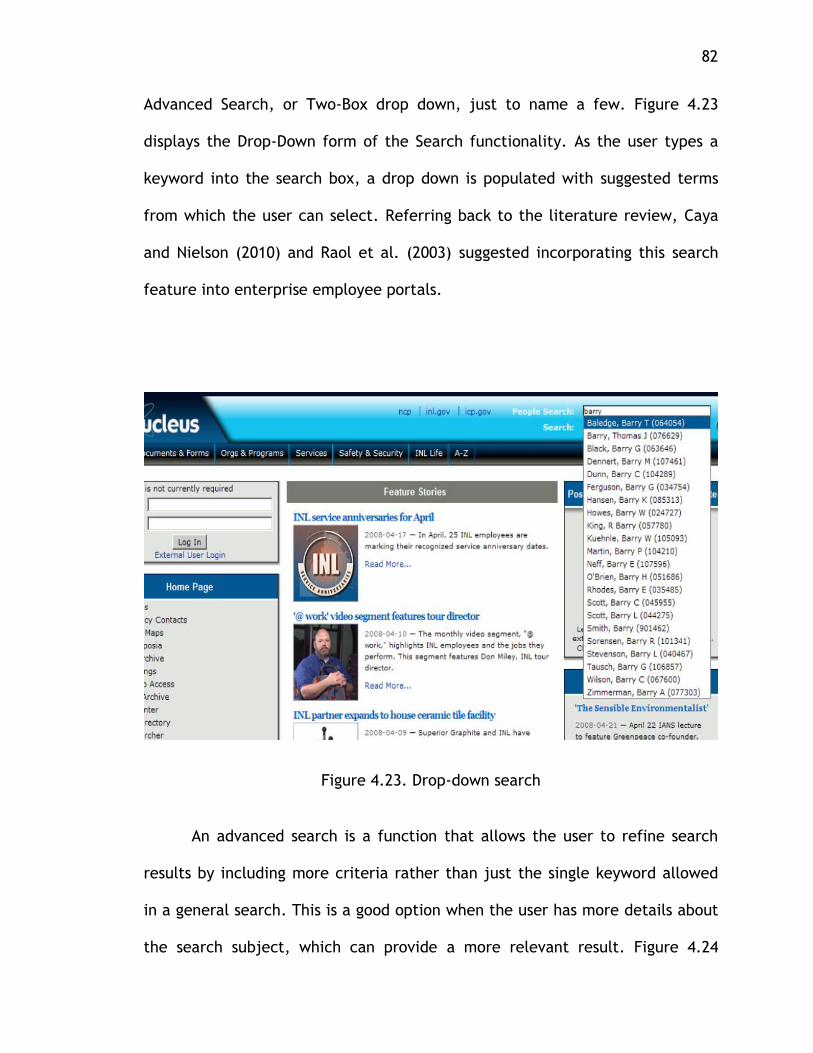
82
Advanced Search, or Two-Box drop down, just to name a few. Figure 4.23
displays the Drop-Down form of the Search functionality. As the user types a
keyword into the search box, a drop down is populated with suggested terms
from which the user can select. Referring back to the literature review, Caya
and Nielson (2010) and Raol et al. (2003) suggested incorporating this search
feature into enterprise employee portals.
Figure 4.23. Drop-down search
An advanced search is a function that allows the user to refine search
results by including more criteria rather than just the single keyword allowed
in a general search. This is a good option when the user has more details about
the search subject, which can provide a more relevant result. Figure 4.24
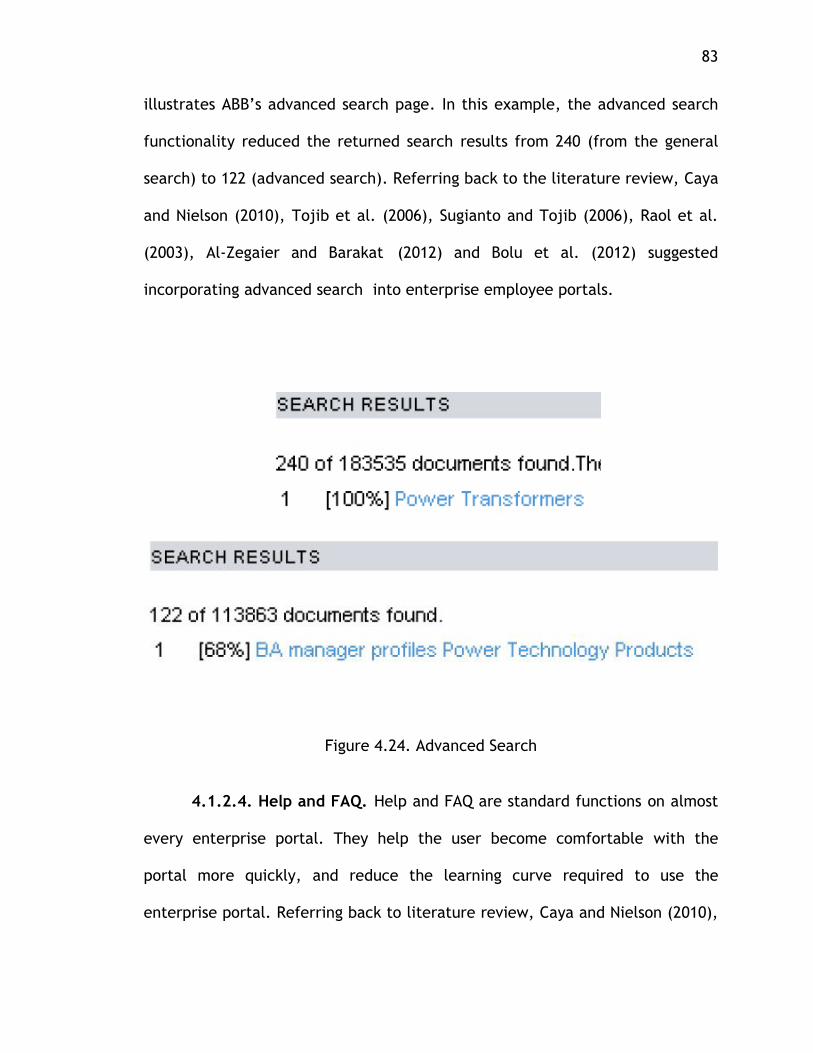
83
illustrates ABB’s advanced search page. In this example, the advanced search
functionality reduced the returned search results from 240 (from the general
search) to 122 (advanced search). Referring back to the literature review, Caya
and Nielson (2010), Tojib et al. (2006), Sugianto and Tojib (2006), Raol et al.
(2003), Al-Zegaier and Barakat (2012) and Bolu et al. (2012) suggested
incorporating advanced search into enterprise employee portals.
Figure 4.24. Advanced Search
4.1.2.4. Help and FAQ. Help and FAQ are standard functions on almost
every enterprise portal. They help the user become comfortable with the
portal more quickly, and reduce the learning curve required to use the
enterprise portal. Referring back to literature review, Caya and Nielson (2010),
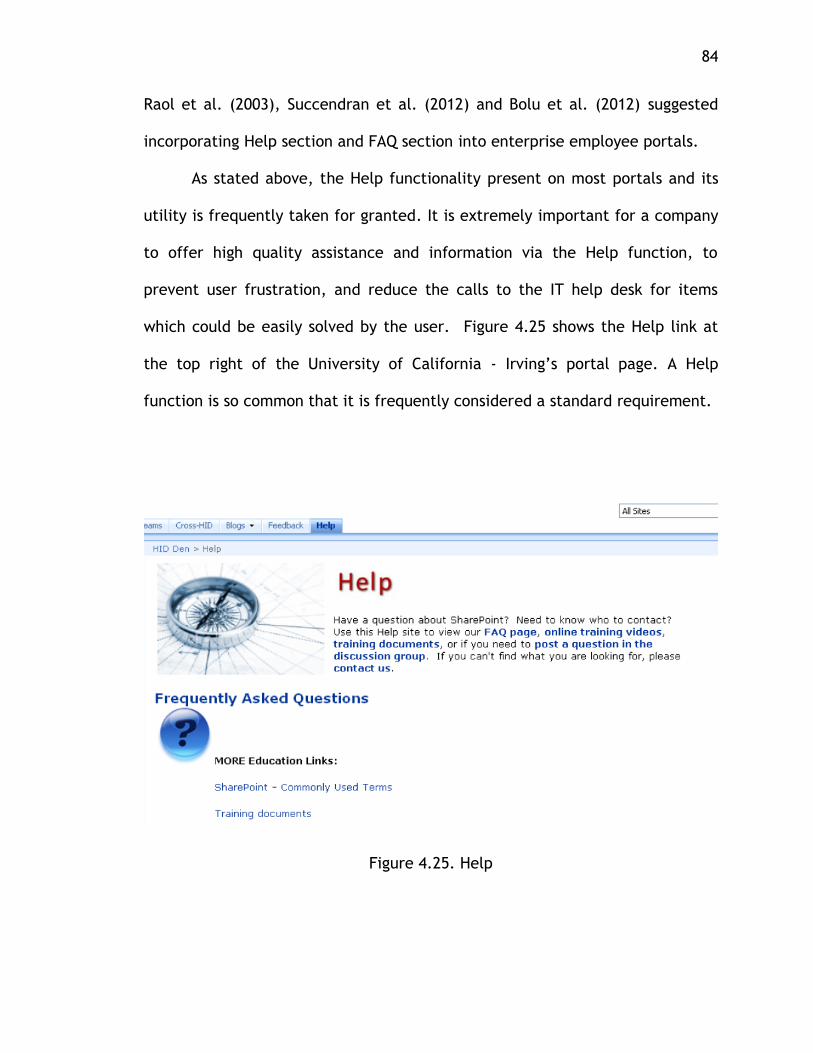
84
Raol et al. (2003), Succendran et al. (2012) and Bolu et al. (2012) suggested
incorporating Help section and FAQ section into enterprise employee portals.
As stated above, the Help functionality present on most portals and its
utility is frequently taken for granted. It is extremely important for a company
to offer high quality assistance and information via the Help function, to
prevent user frustration, and reduce the calls to the IT help desk for items
which could be easily solved by the user. Figure 4.25 shows the Help link at
the top right of the University of California - Irving’s portal page. A Help
function is so common that it is frequently considered a standard requirement.
Figure 4.25. Help
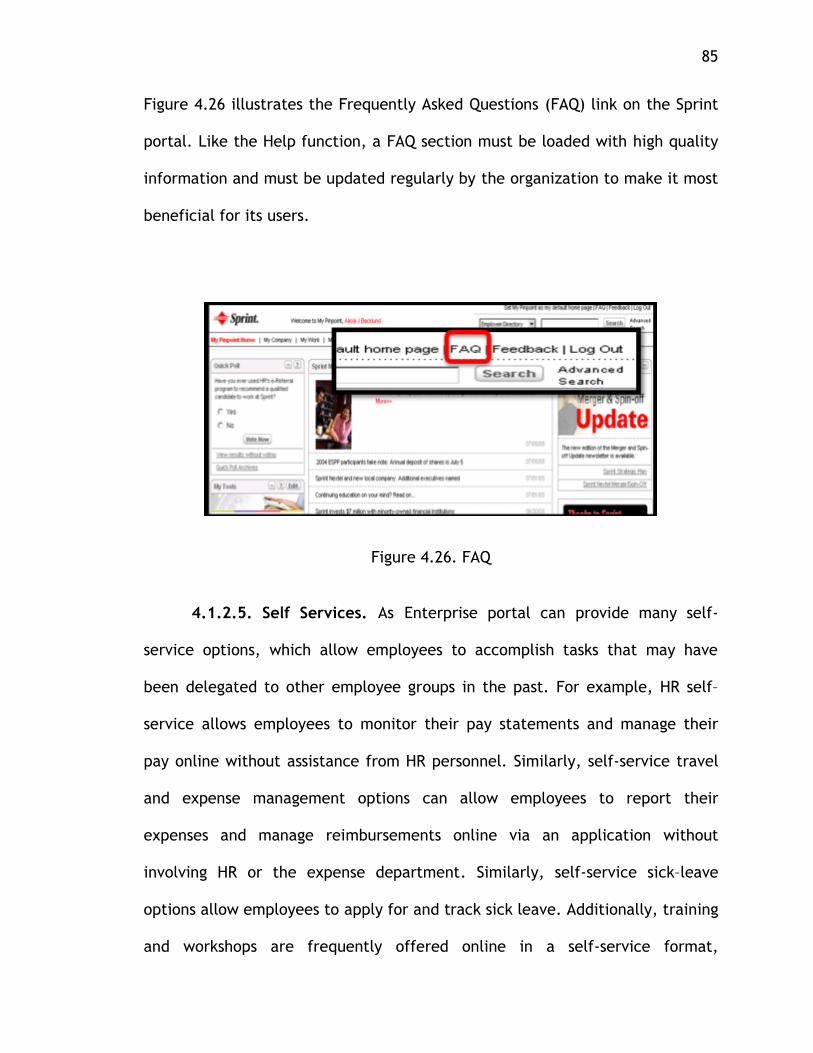
85
Figure 4.26 illustrates the Frequently Asked Questions (FAQ) link on the Sprint
portal. Like the Help function, a FAQ section must be loaded with high quality
information and must be updated regularly by the organization to make it most
beneficial for its users.
Figure 4.26. FAQ
4.1.2.5. Self Services. As Enterprise portal can provide many self-
service options, which allow employees to accomplish tasks that may have
been delegated to other employee groups in the past. For example, HR self–
service allows employees to monitor their pay statements and manage their
pay online without assistance from HR personnel. Similarly, self-service travel
and expense management options can allow employees to report their
expenses and manage reimbursements online via an application without
involving HR or the expense department. Similarly, self-service sick–leave
options allow employees to apply for and track sick leave. Additionally, training
and workshops are frequently offered online in a self-service format,
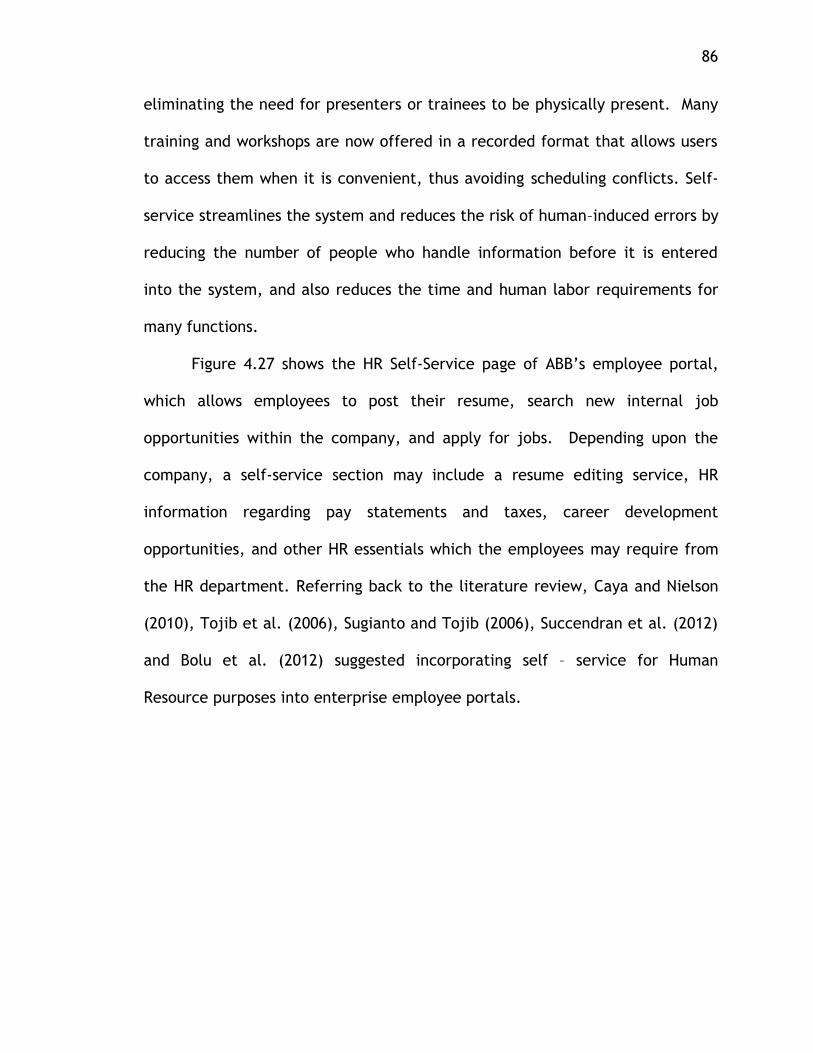
86
eliminating the need for presenters or trainees to be physically present. Many
training and workshops are now offered in a recorded format that allows users
to access them when it is convenient, thus avoiding scheduling conflicts. Self-
service streamlines the system and reduces the risk of human–induced errors by
reducing the number of people who handle information before it is entered
into the system, and also reduces the time and human labor requirements for
many functions.
Figure 4.27 shows the HR Self-Service page of ABB’s employee portal,
which allows employees to post their resume, search new internal job
opportunities within the company, and apply for jobs. Depending upon the
company, a self-service section may include a resume editing service, HR
information regarding pay statements and taxes, career development
opportunities, and other HR essentials which the employees may require from
the HR department. Referring back to the literature review, Caya and Nielson
(2010), Tojib et al. (2006), Sugianto and Tojib (2006), Succendran et al. (2012)
and Bolu et al. (2012) suggested incorporating self – service for Human
Resource purposes into enterprise employee portals.
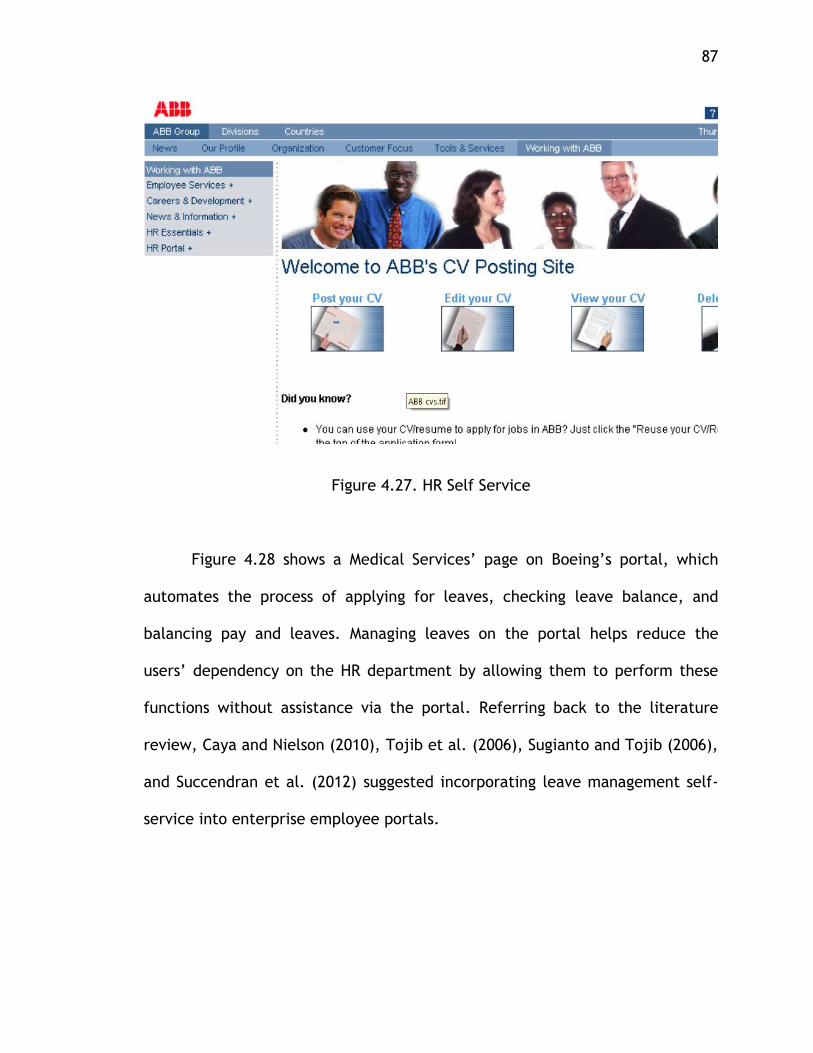
87
Figure 4.27. HR Self Service
Figure 4.28 shows a Medical Services’ page on Boeing’s portal, which
automates the process of applying for leaves, checking leave balance, and
balancing pay and leaves. Managing leaves on the portal helps reduce the
users’ dependency on the HR department by allowing them to perform these
functions without assistance via the portal. Referring back to the literature
review, Caya and Nielson (2010), Tojib et al. (2006), Sugianto and Tojib (2006),
and Succendran et al. (2012) suggested incorporating leave management self-
service into enterprise employee portals.
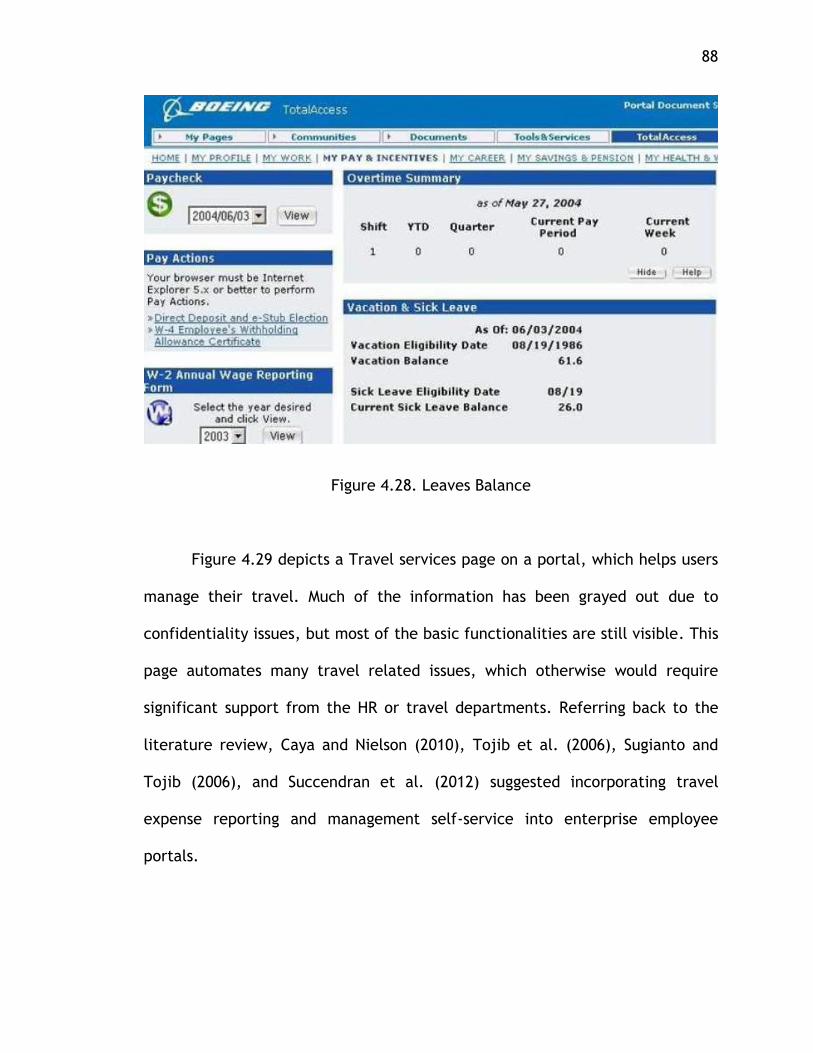
88
Figure 4.28. Leaves Balance
Figure 4.29 depicts a Travel services page on a portal, which helps users
manage their travel. Much of the information has been grayed out due to
confidentiality issues, but most of the basic functionalities are still visible. This
page automates many travel related issues, which otherwise would require
significant support from the HR or travel departments. Referring back to the
literature review, Caya and Nielson (2010), Tojib et al. (2006), Sugianto and
Tojib (2006), and Succendran et al. (2012) suggested incorporating travel
expense reporting and management self-service into enterprise employee
portals.
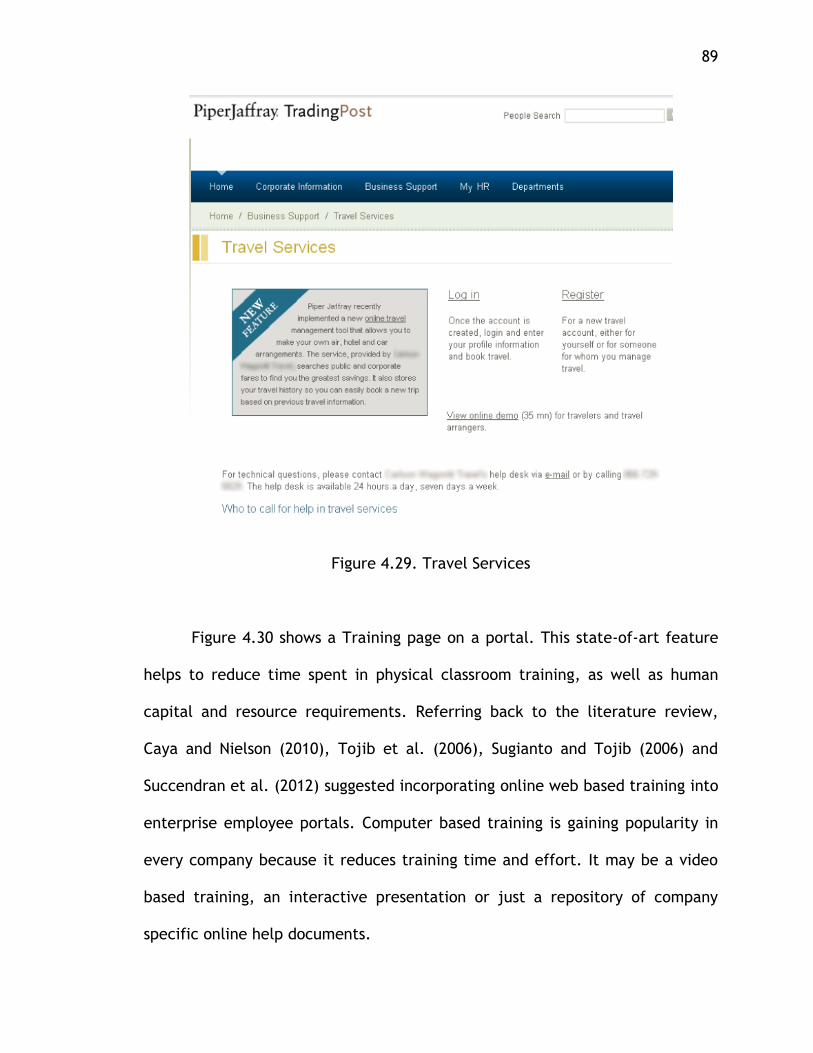
89
Figure 4.29. Travel Services
Figure 4.30 shows a Training page on a portal. This state-of-art feature
helps to reduce time spent in physical classroom training, as well as human
capital and resource requirements. Referring back to the literature review,
Caya and Nielson (2010), Tojib et al. (2006), Sugianto and Tojib (2006) and
Succendran et al. (2012) suggested incorporating online web based training into
enterprise employee portals. Computer based training is gaining popularity in
every company because it reduces training time and effort. It may be a video
based training, an interactive presentation or just a repository of company
specific online help documents.
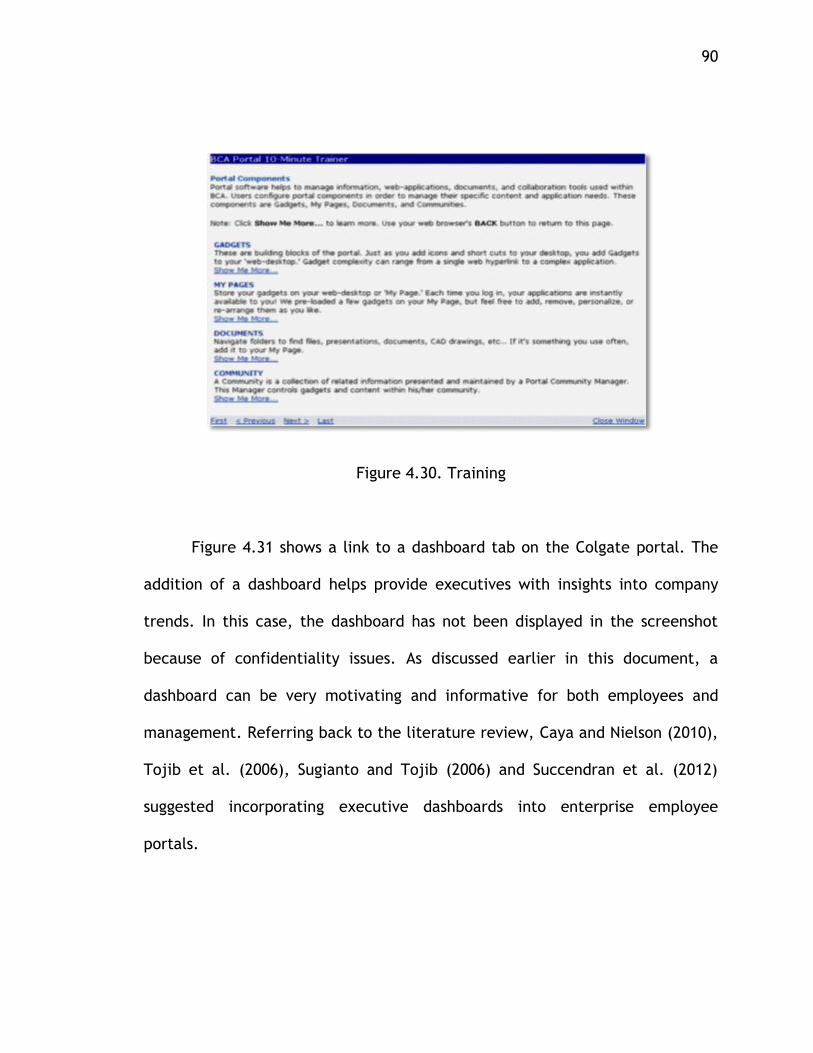
90
Figure 4.30. Training
Figure 4.31 shows a link to a dashboard tab on the Colgate portal. The
addition of a dashboard helps provide executives with insights into company
trends. In this case, the dashboard has not been displayed in the screenshot
because of confidentiality issues. As discussed earlier in this document, a
dashboard can be very motivating and informative for both employees and
management. Referring back to the literature review, Caya and Nielson (2010),
Tojib et al. (2006), Sugianto and Tojib (2006) and Succendran et al. (2012)
suggested incorporating executive dashboards into enterprise employee
portals.
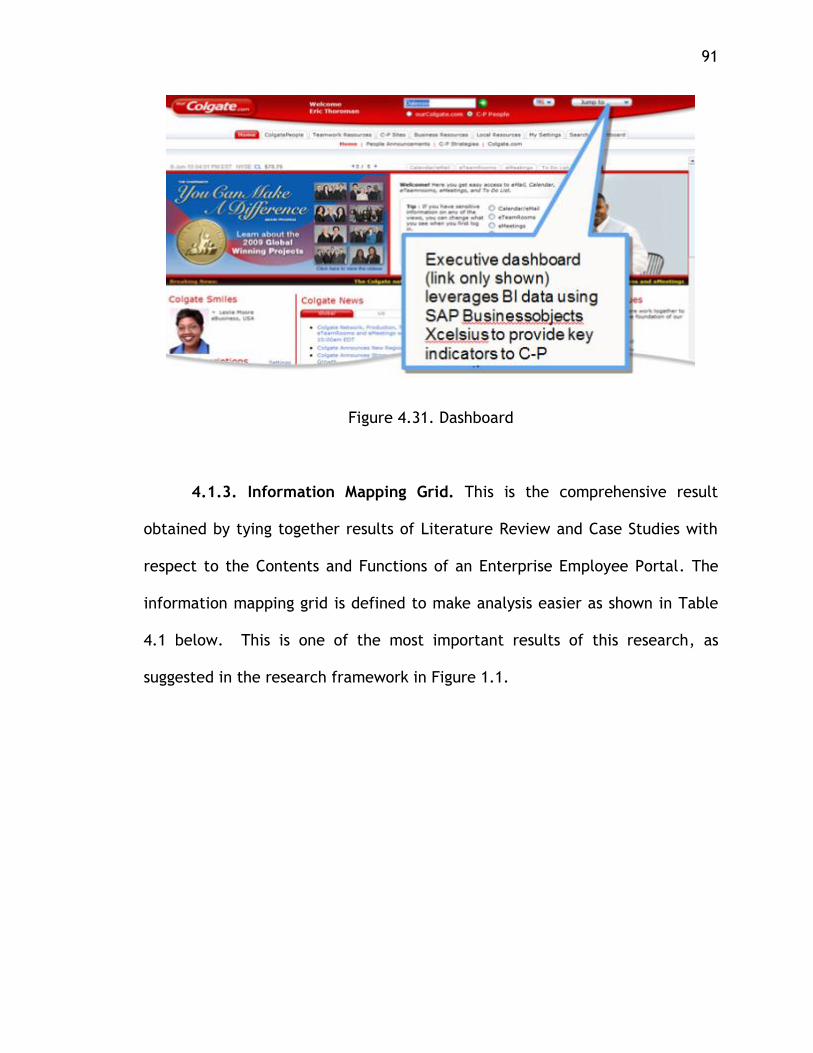
91
Figure 4.31. Dashboard
4.1.3. Information Mapping Grid. This is the comprehensive result
obtained by tying together results of Literature Review and Case Studies with
respect to the Contents and Functions of an Enterprise Employee Portal. The
information mapping grid is defined to make analysis easier as shown in Table
4.1 below. This is one of the most important results of this research, as
suggested in the research framework in Figure 1.1.
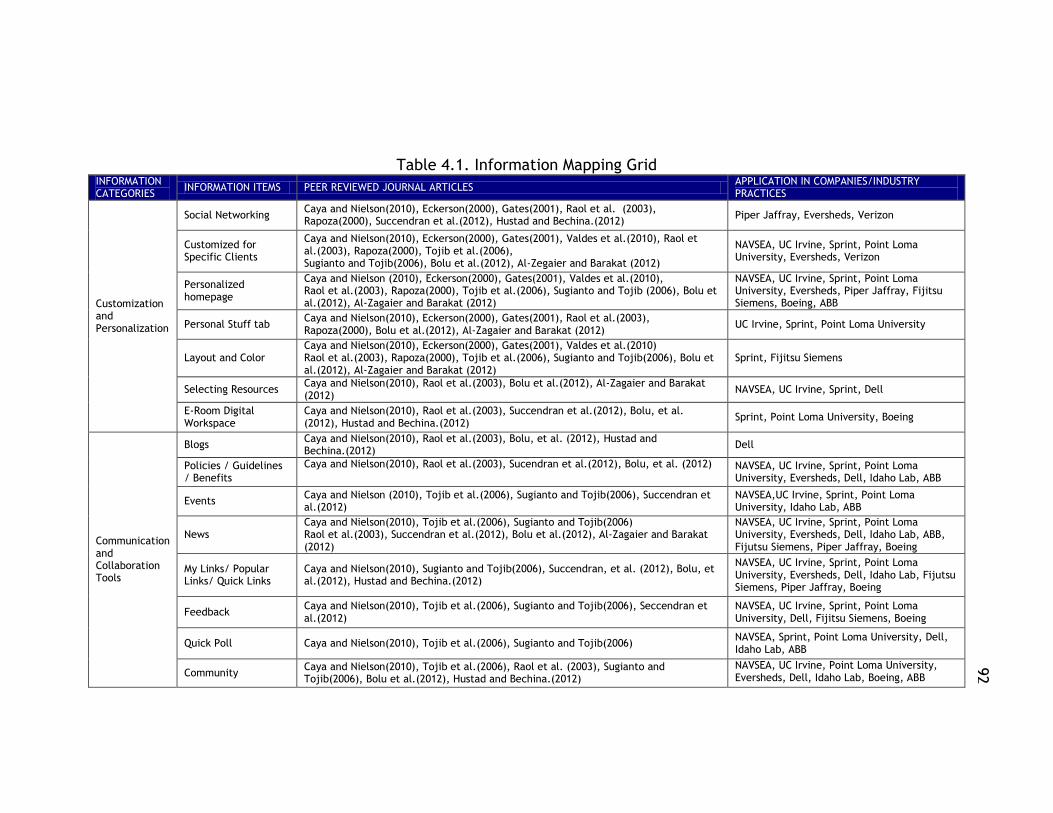
92
92
92
Table 4.1. Information Mapping Grid INFORMATION CATEGORIES
INFORMATION ITEMS PEER REVIEWED JOURNAL ARTICLES APPLICATION IN COMPANIES/INDUSTRY PRACTICES
Customization and Personalization
Social Networking Caya and Nielson(2010), Eckerson(2000), Gates(2001), Raol et al. (2003), Rapoza(2000), Succendran et al.(2012), Hustad and Bechina.(2012)
Piper Jaffray, Eversheds, Verizon
Customized for Specific Clients
Caya and Nielson(2010), Eckerson(2000), Gates(2001), Valdes et al.(2010), Raol et al.(2003), Rapoza(2000), Tojib et al.(2006), Sugianto and Tojib(2006), Bolu et al.(2012), Al-Zegaier and Barakat (2012)
NAVSEA, UC Irvine, Sprint, Point Loma University, Eversheds, Verizon
Personalized homepage
Caya and Nielson (2010), Eckerson(2000), Gates(2001), Valdes et al.(2010), Raol et al.(2003), Rapoza(2000), Tojib et al.(2006), Sugianto and Tojib (2006), Bolu et al.(2012), Al-Zagaier and Barakat (2012)
NAVSEA, UC Irvine, Sprint, Point Loma University, Eversheds, Piper Jaffray, Fijitsu Siemens, Boeing, ABB
Personal Stuff tab Caya and Nielson(2010), Eckerson(2000), Gates(2001), Raol et al.(2003), Rapoza(2000), Bolu et al.(2012), Al-Zagaier and Barakat (2012)
UC Irvine, Sprint, Point Loma University
Layout and Color Caya and Nielson(2010), Eckerson(2000), Gates(2001), Valdes et al.(2010) Raol et al.(2003), Rapoza(2000), Tojib et al.(2006), Sugianto and Tojib(2006), Bolu et al.(2012), Al-Zagaier and Barakat (2012)
Sprint, Fijitsu Siemens
Selecting Resources Caya and Nielson(2010), Raol et al.(2003), Bolu et al.(2012), Al-Zagaier and Barakat (2012)
NAVSEA, UC Irvine, Sprint, Dell
E-Room Digital Workspace
Caya and Nielson(2010), Raol et al.(2003), Succendran et al.(2012), Bolu, et al. (2012), Hustad and Bechina.(2012)
Sprint, Point Loma University, Boeing
Communication and Collaboration Tools
Blogs Caya and Nielson(2010), Raol et al.(2003), Bolu, et al. (2012), Hustad and Bechina.(2012)
Dell
Policies / Guidelines / Benefits
Caya and Nielson(2010), Raol et al.(2003), Sucendran et al.(2012), Bolu, et al. (2012) NAVSEA, UC Irvine, Sprint, Point Loma University, Eversheds, Dell, Idaho Lab, ABB
Events Caya and Nielson (2010), Tojib et al.(2006), Sugianto and Tojib(2006), Succendran et al.(2012)
NAVSEA,UC Irvine, Sprint, Point Loma University, Idaho Lab, ABB
News Caya and Nielson(2010), Tojib et al.(2006), Sugianto and Tojib(2006) Raol et al.(2003), Succendran et al.(2012), Bolu et al.(2012), Al-Zagaier and Barakat (2012)
NAVSEA, UC Irvine, Sprint, Point Loma University, Eversheds, Dell, Idaho Lab, ABB, Fijutsu Siemens, Piper Jaffray, Boeing
My Links/ Popular Links/ Quick Links
Caya and Nielson(2010), Sugianto and Tojib(2006), Succendran, et al. (2012), Bolu, et al.(2012), Hustad and Bechina.(2012)
NAVSEA, UC Irvine, Sprint, Point Loma University, Eversheds, Dell, Idaho Lab, Fijutsu Siemens, Piper Jaffray, Boeing
Feedback Caya and Nielson(2010), Tojib et al.(2006), Sugianto and Tojib(2006), Seccendran et al.(2012)
NAVSEA, UC Irvine, Sprint, Point Loma University, Dell, Fijitsu Siemens, Boeing
Quick Poll Caya and Nielson(2010), Tojib et al.(2006), Sugianto and Tojib(2006) NAVSEA, Sprint, Point Loma University, Dell, Idaho Lab, ABB
Community Caya and Nielson(2010), Tojib et al.(2006), Raol et al. (2003), Sugianto and Tojib(2006), Bolu et al.(2012), Hustad and Bechina.(2012)
NAVSEA, UC Irvine, Point Loma University, Eversheds, Dell, Idaho Lab, Boeing, ABB
92
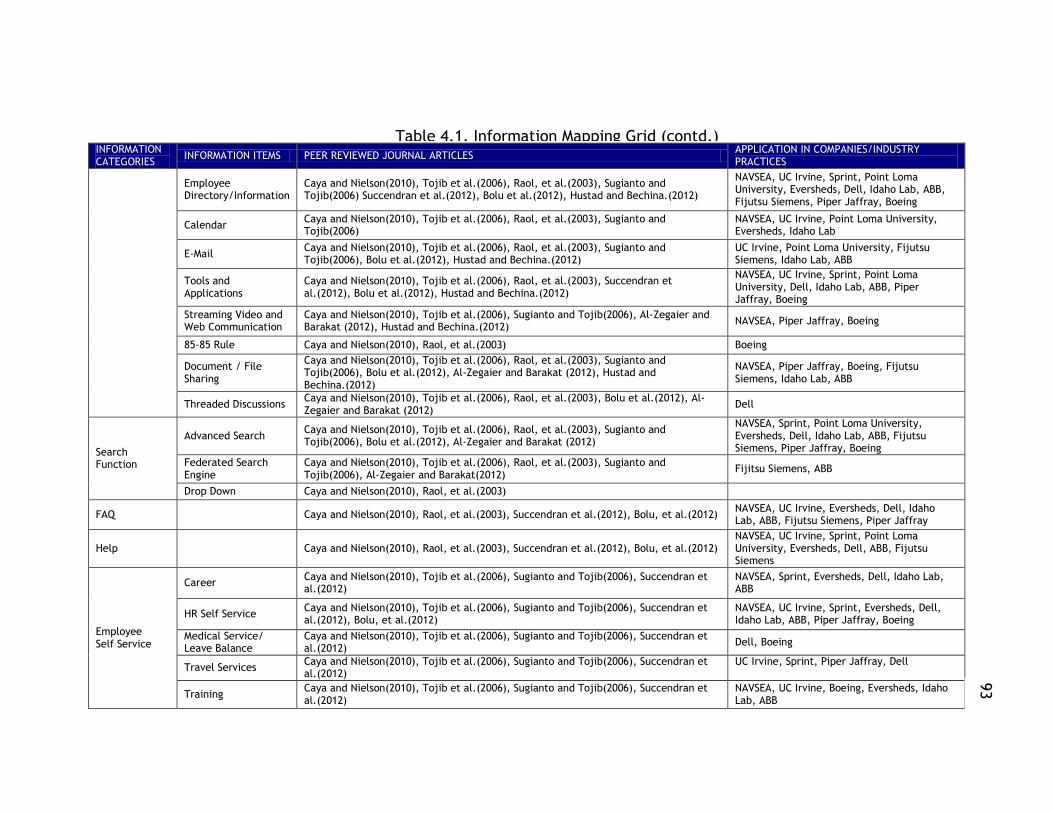
93
93
93
INFORMATION CATEGORIES
INFORMATION ITEMS PEER REVIEWED JOURNAL ARTICLES APPLICATION IN COMPANIES/INDUSTRY PRACTICES
Employee Directory/Information
Caya and Nielson(2010), Tojib et al.(2006), Raol, et al.(2003), Sugianto and Tojib(2006) Succendran et al.(2012), Bolu et al.(2012), Hustad and Bechina.(2012)
NAVSEA, UC Irvine, Sprint, Point Loma University, Eversheds, Dell, Idaho Lab, ABB, Fijutsu Siemens, Piper Jaffray, Boeing
Calendar Caya and Nielson(2010), Tojib et al.(2006), Raol, et al.(2003), Sugianto and Tojib(2006)
NAVSEA, UC Irvine, Point Loma University, Eversheds, Idaho Lab
E-Mail Caya and Nielson(2010), Tojib et al.(2006), Raol, et al.(2003), Sugianto and Tojib(2006), Bolu et al.(2012), Hustad and Bechina.(2012)
UC Irvine, Point Loma University, Fijutsu Siemens, Idaho Lab, ABB
Tools and Applications
Caya and Nielson(2010), Tojib et al.(2006), Raol, et al.(2003), Succendran et al.(2012), Bolu et al.(2012), Hustad and Bechina.(2012)
NAVSEA, UC Irvine, Sprint, Point Loma University, Dell, Idaho Lab, ABB, Piper Jaffray, Boeing
Streaming Video and Web Communication
Caya and Nielson(2010), Tojib et al.(2006), Sugianto and Tojib(2006), Al-Zegaier and Barakat (2012), Hustad and Bechina.(2012)
NAVSEA, Piper Jaffray, Boeing
85-85 Rule Caya and Nielson(2010), Raol, et al.(2003) Boeing
Document / File Sharing
Caya and Nielson(2010), Tojib et al.(2006), Raol, et al.(2003), Sugianto and Tojib(2006), Bolu et al.(2012), Al-Zegaier and Barakat (2012), Hustad and Bechina.(2012)
NAVSEA, Piper Jaffray, Boeing, Fijutsu Siemens, Idaho Lab, ABB
Threaded Discussions Caya and Nielson(2010), Tojib et al.(2006), Raol, et al.(2003), Bolu et al.(2012), Al-Zegaier and Barakat (2012)
Dell
Search Function
Advanced Search Caya and Nielson(2010), Tojib et al.(2006), Raol, et al.(2003), Sugianto and Tojib(2006), Bolu et al.(2012), Al-Zegaier and Barakat (2012)
NAVSEA, Sprint, Point Loma University, Eversheds, Dell, Idaho Lab, ABB, Fijutsu Siemens, Piper Jaffray, Boeing
Federated Search Engine
Caya and Nielson(2010), Tojib et al.(2006), Raol, et al.(2003), Sugianto and Tojib(2006), Al-Zegaier and Barakat(2012)
Fijitsu Siemens, ABB
Drop Down Caya and Nielson(2010), Raol, et al.(2003)
FAQ
Caya and Nielson(2010), Raol, et al.(2003), Succendran et al.(2012), Bolu, et al.(2012) NAVSEA, UC Irvine, Eversheds, Dell, Idaho Lab, ABB, Fijutsu Siemens, Piper Jaffray
Help
Caya and Nielson(2010), Raol, et al.(2003), Succendran et al.(2012), Bolu, et al.(2012) NAVSEA, UC Irvine, Sprint, Point Loma University, Eversheds, Dell, ABB, Fijutsu Siemens
Employee Self Service
Career Caya and Nielson(2010), Tojib et al.(2006), Sugianto and Tojib(2006), Succendran et al.(2012)
NAVSEA, Sprint, Eversheds, Dell, Idaho Lab, ABB
HR Self Service Caya and Nielson(2010), Tojib et al.(2006), Sugianto and Tojib(2006), Succendran et al.(2012), Bolu, et al.(2012)
NAVSEA, UC Irvine, Sprint, Eversheds, Dell, Idaho Lab, ABB, Piper Jaffray, Boeing
Medical Service/ Leave Balance
Caya and Nielson(2010), Tojib et al.(2006), Sugianto and Tojib(2006), Succendran et al.(2012)
Dell, Boeing
Travel Services Caya and Nielson(2010), Tojib et al.(2006), Sugianto and Tojib(2006), Succendran et al.(2012)
UC Irvine, Sprint, Piper Jaffray, Dell
Training Caya and Nielson(2010), Tojib et al.(2006), Sugianto and Tojib(2006), Succendran et al.(2012)
NAVSEA, UC Irvine, Boeing, Eversheds, Idaho Lab, ABB
Table 4.1. Information Mapping Grid (contd.)
93
94
4.2. USER PERCEIVED PORTAL USAGE
As mentioned in section 3.2, the perceived usage of the portal was
measured using two approaches; one being company visits and direct
interaction with the IT portal team experts, and the other from the results of a
third–party evaluation. The results from each approach are explained in the
following sub-sections.
4.2.1. Company Visits. A great deal of information was collected about
the way the company wanted to use the portal during visits to the Case
Company and direct interaction with the portal team. Several perceived
problems were also brought to our attention and addressed in the research
questions used. The result of this methodology was not a deliverable but rather
a method of data collection which helped us identify the key performance
indicators (KPI) used in this research.
KPIs form a base for evaluation and therefore should be selected very
carefully. Poorly chosen KPIs do not address the needs of the organization, and
can render the entire purpose of the research worthless. In addition to
providing a basis for evaluation, KPIs also help in Charting Business processes
with Industry Best Practices, Determining Portal Benefits to different User
Groups, and Determining Metric Areas. A KPI table template was used in this
research, which identified the major aspects of Key Performance Indicators as:
Dimension, Measure, KPI Type, KPI Description, Computation Formula,
Planned/budget value, Target/benchmarking, Data Source, Notes and guided
95
analysis. It takes into account that there may be multiple objectives for each
Dimension and multiple KPIs for each objective.
For Knowledge Management Data Analysis; the following dimensions were
identified: Financial Perspective, Customer Perspective, and Learning and
Growth Perspective.
4.2.1.1. Financial Perspective. The goal of this perspective is to create
a collaborative work environment.
The KPIs used to measure this objective are:
Total Downloads: This determines if users view the portal as a resource in
sharing files. Total Download type: This determines the preferred format used
for collaboration and monitors formats of increased size and functionality.
Least Downloaded: This determines if users are uploading documents of value.
It helps assess if Knowledge Management (KM) is being filled with trivial
documents, and provides data to justify deletion.
4.2.1.2. Customer Perspective. The goal of this perspective is to
measure Employee Job Satisfaction.
The KPIs used to measure this objective are:
Top 10 Downloaded files: This helps to determine the top 10 documents that
are most frequently downloaded. Downloads by Tier/Path Length: This
measures the depth at which the document is located in the folder hierarchy.
Pass/Fail Downloads: This helps to determine user behavior when accessing
files. It helps the analyst to develop applicable questions about user behavior.
96
4.2.1.3. Learning and Growth Perspective of KM data. The goal of this
perspective is to observe the pattern of document access.
The KPIs used to measure this objective are:
Daily Usage: This determines when documents are most frequently accessed,
which helps to analyze user behavior based on internal and external business
factors.
KPI Table (table 4.2) was compiled based on this data. It includes details
about the Key Performance Indicators which have been identified and grouped
by various dimensions to provide a better understanding of the Case Company’s
business needs.
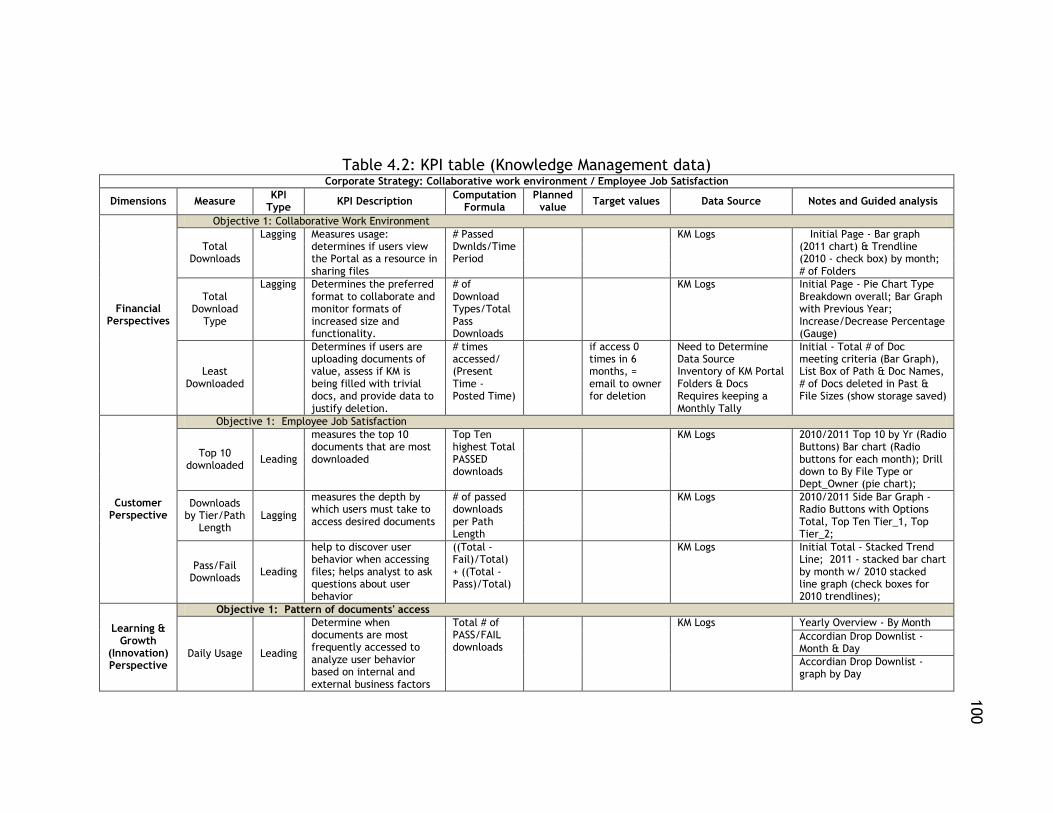
97
97
100
Table 4.2: KPI table (Knowledge Management data) Corporate Strategy: Collaborative work environment / Employee Job Satisfaction
Dimensions Measure KPI
Type KPI Description
Computation Formula
Planned value
Target values Data Source Notes and Guided analysis
Financial Perspectives
Objective 1: Collaborative Work Environment
Total Downloads
Lagging Measures usage: determines if users view the Portal as a resource in sharing files
# Passed Dwnlds/Time Period
KM Logs Initial Page - Bar graph (2011 chart) & Trendline (2010 - check box) by month; # of Folders
Total Download
Type
Lagging Determines the preferred format to collaborate and monitor formats of increased size and functionality.
# of Download Types/Total Pass Downloads
KM Logs Initial Page - Pie Chart Type Breakdown overall; Bar Graph with Previous Year; Increase/Decrease Percentage (Gauge)
Least Downloaded
Determines if users are uploading documents of value, assess if KM is being filled with trivial docs, and provide data to justify deletion.
# times accessed/ (Present Time - Posted Time)
if access 0 times in 6 months, = email to owner for deletion
Need to Determine Data Source Inventory of KM Portal Folders & Docs Requires keeping a Monthly Tally
Initial - Total # of Doc meeting criteria (Bar Graph), List Box of Path & Doc Names, # of Docs deleted in Past & File Sizes (show storage saved)
Customer Perspective
Objective 1: Employee Job Satisfaction
Top 10 downloaded
Leading
measures the top 10 documents that are most downloaded
Top Ten highest Total PASSED downloads
KM Logs 2010/2011 Top 10 by Yr (Radio Buttons) Bar chart (Radio buttons for each month); Drill down to By File Type or Dept_Owner (pie chart);
Downloads by Tier/Path
Length Lagging
measures the depth by which users must take to access desired documents
# of passed downloads per Path Length
KM Logs 2010/2011 Side Bar Graph - Radio Buttons with Options Total, Top Ten Tier_1, Top Tier_2;
Pass/Fail Downloads
Leading
help to discover user behavior when accessing files; helps analyst to ask questions about user behavior
((Total - Fail)/Total) + ((Total - Pass)/Total)
KM Logs Initial Total - Stacked Trend Line; 2011 - stacked bar chart by month w/ 2010 stacked line graph (check boxes for 2010 trendlines);
Learning & Growth
(Innovation) Perspective
Objective 1: Pattern of documents' access
Daily Usage Leading
Determine when documents are most frequently accessed to analyze user behavior based on internal and external business factors
Total # of PASS/FAIL downloads
KM Logs Yearly Overview - By Month
Accordian Drop Downlist -Month & Day
Accordian Drop Downlist - graph by Day
98
The following two dimensions were identified for the ClickStream Data
Analysis: Learning and Growth (Innovation) Perspective, and Internal Process
Perspective
4.2.1.4. Learning and growth perspective. Three Objectives were
assigned to the Learning and growth perspective: the first was to make the
Navigation more Intuitive, the Second was to identify the areas that the users
visit most often, and the third was to determine what information the users
access most frequently.
The KPIs used to measure the first objective are:
Clicks: Average number of clicks to reach the important pages.
Clicks: Average number of clicks to reach pages with highest view times.
The KPIs used to measure the second objective are:
PageViews: Average number of PageViews to a certain section of the
homepage. PageViews: Average number of PageViews to a certain sub-section
of the section.
The KPIs used to measure the third objective are:
PageViews: Average number of PageViews to the different pages of the portal.
4.2.1.5. Internal Process Perspective. This perspective has one
objective: to meet the needs of this geographically disperse workforce.
The KPIs used to measure this objective are:
Logins: Number of logins in a certain period of time. Users: Number of unique
users accessing the portals in a certain period of time. PageViews: Number of
99
PageViews in a certain period of time. Server-load: Load on the various servers
at different geographic locations.
The KPI Table (tables 4.3 and 4.4) was compiled based from the data
mentioned above. It provides details about the Key Performance Indicators
which have been identified and grouped by various dimensions to provide a
better understanding of the Case Company’s business needs.
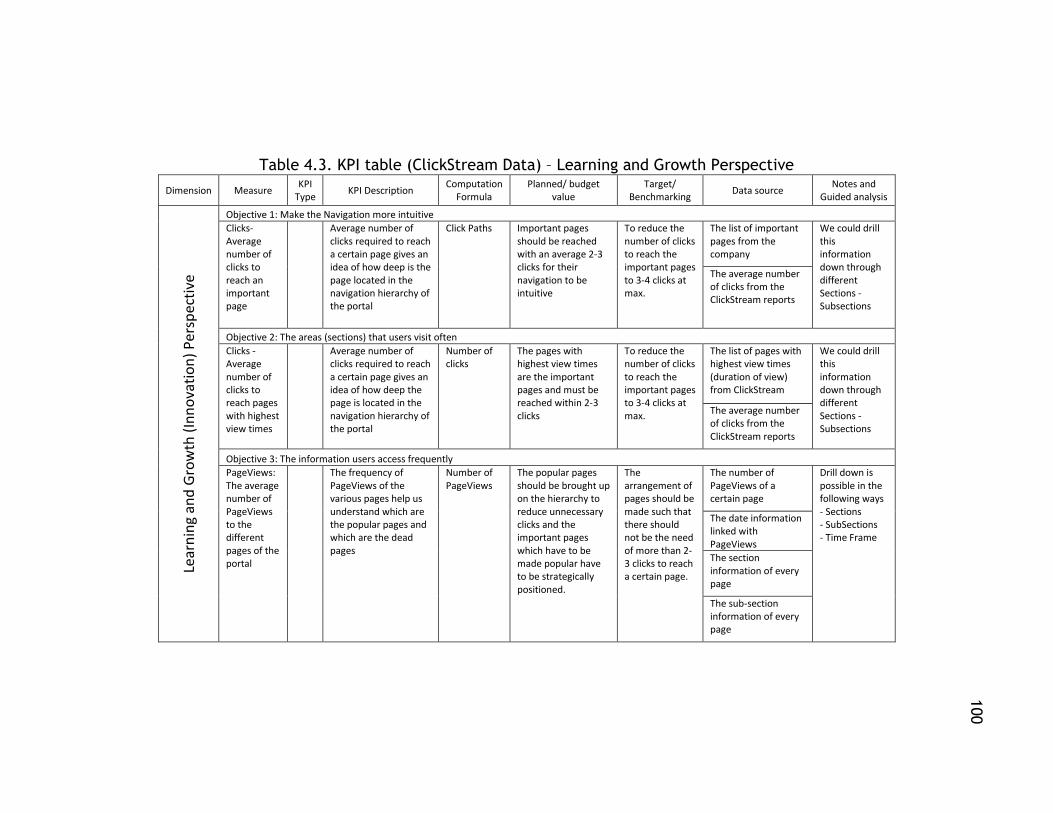
100
100
100
Table 4.3. KPI table (ClickStream Data) – Learning and Growth Perspective
Dimension Measure KPI
Type KPI Description
Computation Formula
Planned/ budget value
Target/ Benchmarking
Data source Notes and
Guided analysis Le
arn
ing
and
Gro
wth
(In
no
vati
on
) P
ersp
ecti
ve
Objective 1: Make the Navigation more intuitive
Clicks- Average number of clicks to reach an important page
Average number of clicks required to reach a certain page gives an idea of how deep is the page located in the navigation hierarchy of the portal
Click Paths Important pages should be reached with an average 2-3 clicks for their navigation to be intuitive
To reduce the number of clicks to reach the important pages to 3-4 clicks at max.
The list of important pages from the company
We could drill this information down through different Sections - Subsections
The average number of clicks from the ClickStream reports
Objective 2: The areas (sections) that users visit often
Clicks - Average number of clicks to reach pages with highest view times
Average number of clicks required to reach a certain page gives an idea of how deep the page is located in the navigation hierarchy of the portal
Number of clicks
The pages with highest view times are the important pages and must be reached within 2-3 clicks
To reduce the number of clicks to reach the important pages to 3-4 clicks at max.
The list of pages with highest view times (duration of view) from ClickStream
We could drill this information down through different Sections - Subsections
The average number of clicks from the ClickStream reports
Objective 3: The information users access frequently
PageViews: The average number of PageViews to the different pages of the portal
The frequency of PageViews of the various pages help us understand which are the popular pages and which are the dead pages
Number of PageViews
The popular pages should be brought up on the hierarchy to reduce unnecessary clicks and the important pages which have to be made popular have to be strategically positioned.
The arrangement of pages should be made such that there should not be the need of more than 2-3 clicks to reach a certain page.
The number of PageViews of a certain page
Drill down is possible in the following ways - Sections - SubSections - Time Frame
The date information linked with PageViews
The section information of every page
The sub-section information of every page
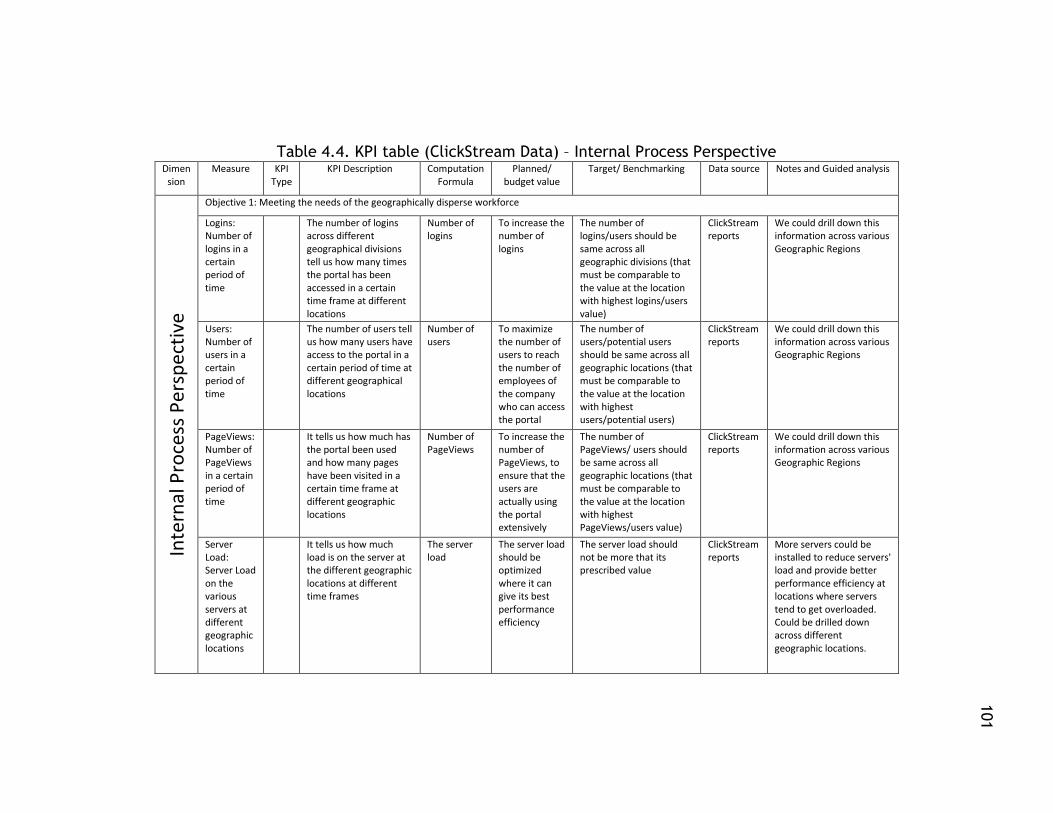
101
101
Table 4.4. KPI table (ClickStream Data) – Internal Process Perspective Dimen
sion Measure KPI
Type KPI Description Computation
Formula Planned/
budget value Target/ Benchmarking Data source Notes and Guided analysis
Inte
rnal
Pro
cess
Per
spe
ctiv
e
Objective 1: Meeting the needs of the geographically disperse workforce
Logins: Number of logins in a certain period of time
The number of logins across different geographical divisions tell us how many times the portal has been accessed in a certain time frame at different locations
Number of logins
To increase the number of logins
The number of logins/users should be same across all geographic divisions (that must be comparable to the value at the location with highest logins/users value)
ClickStream reports
We could drill down this information across various Geographic Regions
Users: Number of users in a certain period of time
The number of users tell us how many users have access to the portal in a certain period of time at different geographical locations
Number of users
To maximize the number of users to reach the number of employees of the company who can access the portal
The number of users/potential users should be same across all geographic locations (that must be comparable to the value at the location with highest users/potential users)
ClickStream reports
We could drill down this information across various Geographic Regions
PageViews: Number of PageViews in a certain period of time
It tells us how much has the portal been used and how many pages have been visited in a certain time frame at different geographic locations
Number of PageViews
To increase the number of PageViews, to ensure that the users are actually using the portal extensively
The number of PageViews/ users should be same across all geographic locations (that must be comparable to the value at the location with highest PageViews/users value)
ClickStream reports
We could drill down this information across various Geographic Regions
Server Load: Server Load on the various servers at different geographic locations
It tells us how much load is on the server at the different geographic locations at different time frames
The server load
The server load should be optimized where it can give its best performance efficiency
The server load should not be more that its prescribed value
ClickStream reports
More servers could be installed to reduce servers' load and provide better performance efficiency at locations where servers tend to get overloaded. Could be drilled down across different geographic locations.
101
102
4.2.2. Third–Party Evaluation. Valuable insights into users’ opinions
about the portal, their needs and expectations from the portal, and
improvement they would like to see, were gathered via Third-party evaluation.
In this research, a usability study was performed to determine ways to
improve the user experience of the employee portal. In all, five usability
workshops were conducted on-site and one usability workshop was conducted
remotely via video conferencing with 25 participants, which addressed user
requirements regarding content, navigation, presentations, and tasks. A wide
range of employees participated in these studies, including portal
administrators, Human Resources personnel, Corporate Communications,
Managers, and Global users.
4.2.2.1. Methods of study. Two different methods of study were
adopted to provide a fair consensus about the participants’/users’ opinion.
The first method was Roundtable Discussion. Here the users were asked
to state their name, job role, and overall use of the portal. Then they were
asked to list the most frequent things they did on the portal, and the three
things that they would like to change on the portal if they could. This method
highlighted variation of portal usage among different user groups, patterns of
portal usage in different user groups, the most important items on the portal,
and recommended changes - all from the users’ perspective.
The second method was Brainstorming and Affinity Clustering. Here the
users were asked to express their expectations for the case company Portal.
The users were given sticky notes and markers and asked to write one item on
103
each note and place it on a white board, one at a time. While doing so, the
participants were asked to read their note out loud and subsequent
participants were to add notes close to notes with similar contents. At the end
of the process, the groups of similar notes were circled and named.
4.2.2.2. Inference. Meaningful inferences were obtained from
Roundtable discussions, Brainstorming, Affinity Clustering and Face-to-Face
Interviews with the employees.
The employees stressed the need for an improved search feature for the
portal. Browsing and searching the portal to find even basic information was
difficult for many employees, and most wanted to reduce the number of clicks
required to reach a certain location on the portal. Because of these navigation
issues, HR received many calls from users trying to find information on the
portal.
Employees requested a standard to provide global consistency with
respect to images, icons, fonts and colors. The portal site appeared cluttered,
inconsistent, and it lacked visual appeal. According to the employees, the site
was so wordy that it deterred many users from using the portal. The site lacked
consistency due to many different developers contributing to it.
Communication and Safety were also identified as important to the
portal. The general perception was that most information on the portal applied
more to the company headquarters than to its geographically diverse
workforce. Therefore, a focus should be on adding more communication and
104
collaboration geared toward the users within the portal, and as with any portal
changes, safety of confidential information was the first priority.
Employees needed easy access to key information such as IT systems,
pay-statements, vacation request forms, business card order forms,
performance review documents, and other self-service functionalities on the
portal.
Employees also requested place–specific information about the
organizational structure of their work environments, that is, other employees
working at their location, how their location or department is performing
compared to other departments in the company as well as time zone, currency,
and weather information, etc. They suggested the portal include news,
articles, and pictures of their location that reflect the culture, and provide
information about office logistics, such as parking, directions, meeting rooms,
seating charts, etc.
It was observed that employees were interested in finding more
information about other people on the portal, that is, they requested more
than just a phone number and email address, but also a picture, office
location, position or role within the organizational structure, expertise, and
accomplishments, etc.
The Case Company’s portal lacked a calendar option and the employees
expressed great interest in this type of feature that would help keep them
informed of the internal company events, promotions, current events,
105
community events sponsored by the company, holidays, and even training and
development deadlines and opportunities.
Employees wanted easy access to relevant and timely news and
announcements including performance and financial news; local, regional and
global company news; regional announcements; news on production and safety;
internal company communications; internal announcements; press releases;
news about projects, mergers, acquisitions, company growth and strategic
plans, etc.
Employees recommended a myriad of other functionalities, some of
which were not as obvious but would add functionalities that would encourage
users to visit the portal, such as a careers/jobs portal within the employee
portal, the ability to add photos, videos and other user-generated personal
information to help users feel more connected to the portal and thereby to the
Company. The users also mentioned the possibility of accessing the portal
outside of the confined corporate firewall.
The results obtained from this study are summarized in table 4.5,
below.
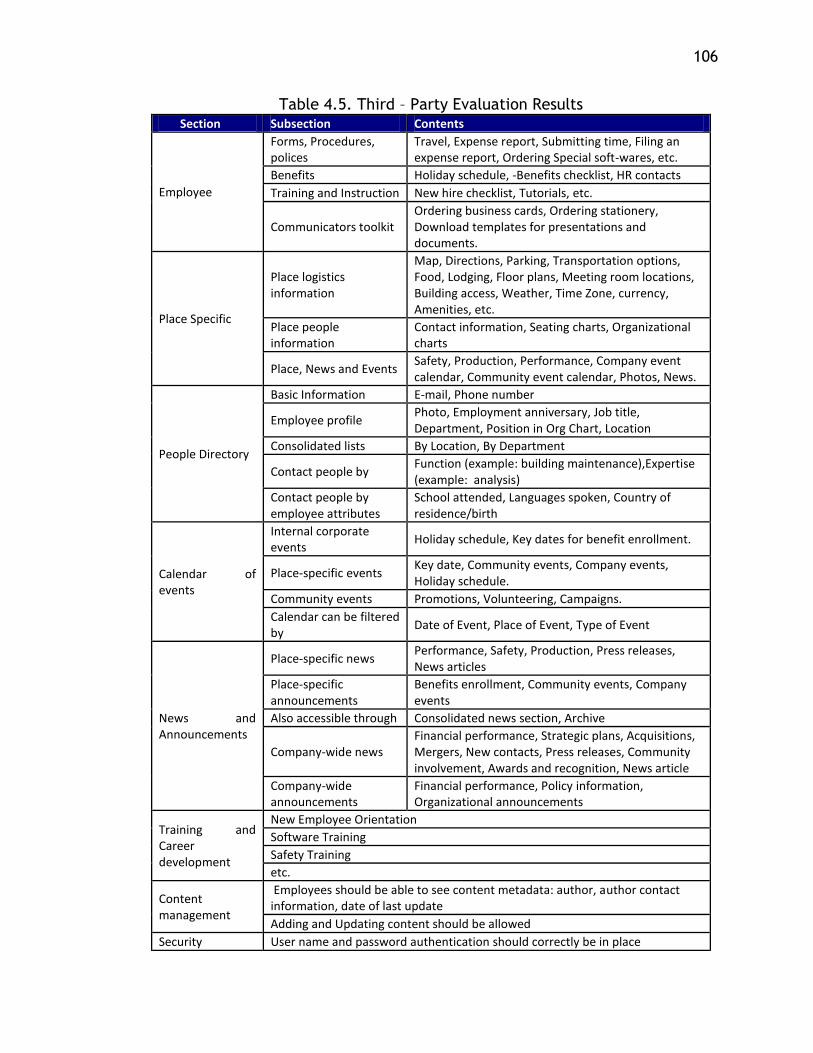
106
Table 4.5. Third – Party Evaluation Results Section Subsection Contents
Employee
Forms, Procedures, polices
Travel, Expense report, Submitting time, Filing an expense report, Ordering Special soft-wares, etc.
Benefits Holiday schedule, -Benefits checklist, HR contacts
Training and Instruction New hire checklist, Tutorials, etc.
Communicators toolkit Ordering business cards, Ordering stationery, Download templates for presentations and documents.
Place Specific
Place logistics information
Map, Directions, Parking, Transportation options, Food, Lodging, Floor plans, Meeting room locations, Building access, Weather, Time Zone, currency, Amenities, etc.
Place people information
Contact information, Seating charts, Organizational charts
Place, News and Events Safety, Production, Performance, Company event calendar, Community event calendar, Photos, News.
People Directory
Basic Information E-mail, Phone number
Employee profile Photo, Employment anniversary, Job title, Department, Position in Org Chart, Location
Consolidated lists By Location, By Department
Contact people by Function (example: building maintenance),Expertise (example: analysis)
Contact people by employee attributes
School attended, Languages spoken, Country of residence/birth
Calendar of events
Internal corporate events
Holiday schedule, Key dates for benefit enrollment.
Place-specific events Key date, Community events, Company events, Holiday schedule.
Community events Promotions, Volunteering, Campaigns.
Calendar can be filtered by
Date of Event, Place of Event, Type of Event
News and Announcements
Place-specific news Performance, Safety, Production, Press releases, News articles
Place-specific announcements
Benefits enrollment, Community events, Company events
Also accessible through Consolidated news section, Archive
Company-wide news Financial performance, Strategic plans, Acquisitions, Mergers, New contacts, Press releases, Community involvement, Awards and recognition, News article
Company-wide announcements
Financial performance, Policy information, Organizational announcements
Training and Career development
New Employee Orientation
Software Training
Safety Training
etc.
Content management
Employees should be able to see content metadata: author, author contact information, date of last update
Adding and Updating content should be allowed
Security User name and password authentication should correctly be in place
107
4.3. ACTUAL PORTAL USAGE
As discussed in Section 3.3, portal usage was studied from two aspects:
Knowledge management data and the ClickStream data captured by Sweetlets.
The two sets of data loosely are related, but they do not have the exact
same structure. The Knowledge Management files are organized into folders
and sub-folders based on functional area, while the ClickStream data is
organized according to how the sections and subsections on the portal
homepage relate to the portal front-end’s structure. In the ClickStream data,
the tabs on the homepage are considered sections containing one or more
subsections. A webpage is displayed at every level. An in-depth study of the
two data sets was able to relate the two via comparison and analysis.
4.3.1. Knowledge Management Data. The knowledge management data
provided insight about which files and folders users accessed from the portal.
The fundamental unit of measure here is the number of downloads. This raw
data was collected and fed into a data warehouse which was then queried to
obtain meaningful information, which was then visually represented in a
dashboard monitoring system. The raw data cannot be published here as it
contained potentially sensitive information, however, the visualization of the
summarized data can be seen in Section 4.4.1.
4.3.2. ClickStream Data. The ClickStream data was collected using
Sweetlets. It provides insight to the various sections and subsections of the
portal as seen both on the surface (number of clicks on portal links) and deeper
108
in the portal’s structure with information about how each item is accessed by
users. The fundamental units of measure here are number of PageViews and
duration of each PageView. Activity on all sections, sub-sections, and pages
within the portal were measured. The raw data was fed into a data warehouse
and queried before being graphically displayed using a dashboard monitoring
system. As with the Knowledge Management Data, the raw data of ClickStream
data was also specific to the Case Company and so cannot be published, but
the summarized data as presented in the dashboard is displayed in Section
4.4.2.
4.3.3. Technical Implementation. The technical implementation of this
research is considered from two perspectives: “data warehousing” and
“dashboard monitoring system.”
4.3.3.1. Data warehouse creation. Two sets of data were used for this
research (Knowledge Management data and ClickStream data). The first set of
data was housed in one InfoCube and the other set of data needed two
InfoCubes. The data were fed into the InfoCubes, all of which were built on a
logical structure called a star-schema. This data in the InfoCubes was then
queried to obtain meaningful information regarding portal usage. The query
results were then visualized in two dashboard monitoring systems. This gave us
meaningful information as suggested by the research framework in figure 1.1.
4.3.3.1.1. Knowledge management InfoCube. This was created by
other team members who were a part of this research. Only the information
from this is being used in this study.
109
4.3.3.1.2. ClickStream data InfoCube. The ClickStream data was
stored in two InfoCubes. One contained data about the number of PageViews,
user logins to the webpages and sections of the portal (this is named as
CLICK_TP) while the other InfoCube contained data regarding the duration of
PageViews and section-views within the portal (this is named CLICK_VT). Figure
4.33 shows the Star Schema of CLICK_TP and Figure 4.35 shows the Star
Schema of CLICK_VT. Figure 4.34 shows the data flow in CLICK_TP and Figure
4.36 shows the data flow in CLICK_VT.
The Star Schema of CLICK_TP has 5 dimensions – “Data Package,”
“Time,” “Unit,” “Webpages,” and “Time of Day.” The Star Schema of
CLICK_VT has 3 dimensions – “Sections and SubSections,” “Page Names” and
“Month and Year.”
The data warehouses (CLICK_TP and CLICK_VT) are created in SAP BW by
following the Extraction, Transformation, and Loading (ETL) process, which is
described in detail in Appendix A.
4.3.3.2. Dashboard implementation. Two dashboards monitoring
systems were created to monitor the two separate data sets, namely: the
Knowledge Management data, and the ClickStream data. This gave us
meaningful information in the form of data visualization as suggested by the
research framework in figure 1.1.
4.3.3.2.1. Knowledge management data monitoring dashboard. This
dashboard provides insight into the folder structure and the files that it
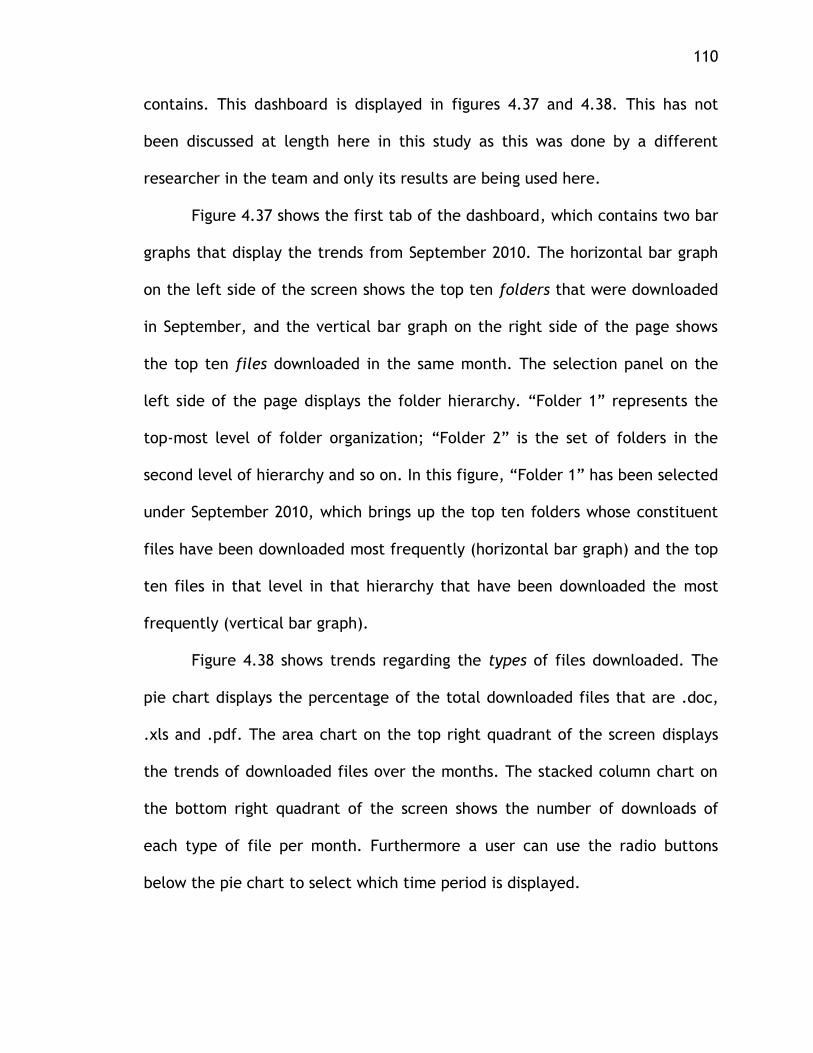
110
contains. This dashboard is displayed in figures 4.37 and 4.38. This has not
been discussed at length here in this study as this was done by a different
researcher in the team and only its results are being used here.
Figure 4.37 shows the first tab of the dashboard, which contains two bar
graphs that display the trends from September 2010. The horizontal bar graph
on the left side of the screen shows the top ten folders that were downloaded
in September, and the vertical bar graph on the right side of the page shows
the top ten files downloaded in the same month. The selection panel on the
left side of the page displays the folder hierarchy. “Folder 1” represents the
top-most level of folder organization; “Folder 2” is the set of folders in the
second level of hierarchy and so on. In this figure, “Folder 1” has been selected
under September 2010, which brings up the top ten folders whose constituent
files have been downloaded most frequently (horizontal bar graph) and the top
ten files in that level in that hierarchy that have been downloaded the most
frequently (vertical bar graph).
Figure 4.38 shows trends regarding the types of files downloaded. The
pie chart displays the percentage of the total downloaded files that are .doc,
.xls and .pdf. The area chart on the top right quadrant of the screen displays
the trends of downloaded files over the months. The stacked column chart on
the bottom right quadrant of the screen shows the number of downloads of
each type of file per month. Furthermore a user can use the radio buttons
below the pie chart to select which time period is displayed.
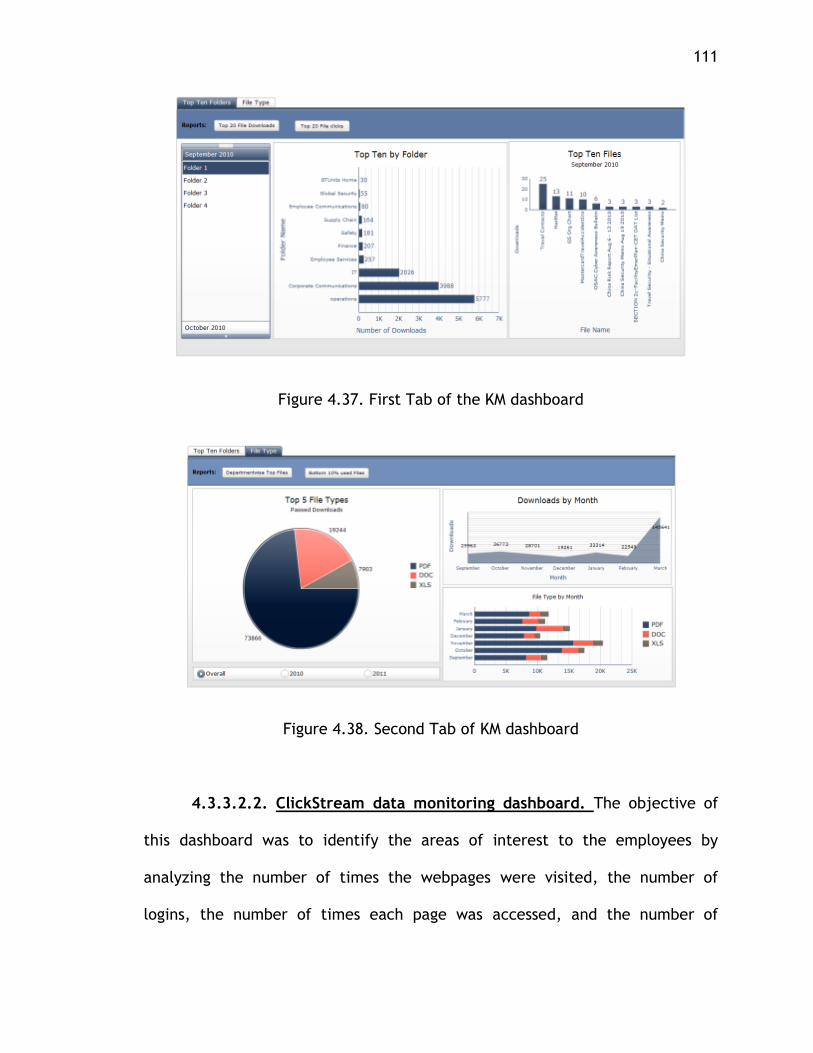
111
Figure 4.37. First Tab of the KM dashboard
Figure 4.38. Second Tab of KM dashboard
4.3.3.2.2. ClickStream data monitoring dashboard. The objective of
this dashboard was to identify the areas of interest to the employees by
analyzing the number of times the webpages were visited, the number of
logins, the number of times each page was accessed, and the number of
112
different users who visited the page within a certain time frame. The portal is
divided into various sections and each section is further divided into
subsections. So, the dashboards also ranked the sections and subsections with
respect to the number of PageViews as well as monitoring the time each user
spent viewing a certain page, which helped gauge the importance of the
webpage to the users. (More time spent viewing a page was interpreted to
mean that the page was more important.)
The performance dashboard proved to be a useful tool for the Case
Company. It helped identify strong and weak features and areas on the portal,
and highlighted services and pages that were or were not being used as much
as the company intended. It also provided feedback about users perceptions of
the portal and their recommendations concerning the services on the portal.
As stated earlier in this document, this dashboard falls into the “Tactical
to Strategic” type category. Table 4.6 below highlights the tactical and
strategic aspects of the dashboard.
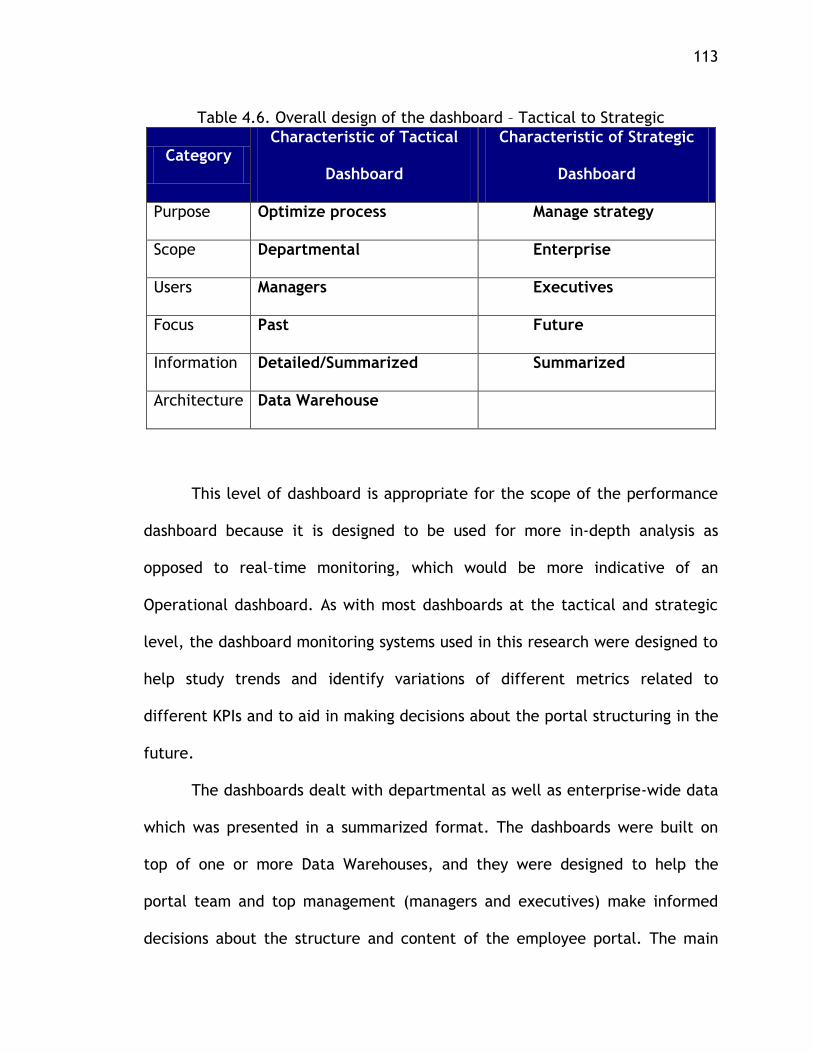
113
Table 4.6. Overall design of the dashboard – Tactical to Strategic
Category Characteristic of Tactical
Dashboard
Characteristic of Strategic
Dashboard
Purpose Optimize process Manage strategy
Scope Departmental Enterprise
Users Managers Executives
Focus Past Future
Information Detailed/Summarized Summarized
Architecture Data Warehouse
This level of dashboard is appropriate for the scope of the performance
dashboard because it is designed to be used for more in-depth analysis as
opposed to real–time monitoring, which would be more indicative of an
Operational dashboard. As with most dashboards at the tactical and strategic
level, the dashboard monitoring systems used in this research were designed to
help study trends and identify variations of different metrics related to
different KPIs and to aid in making decisions about the portal structuring in the
future.
The dashboards dealt with departmental as well as enterprise-wide data
which was presented in a summarized format. The dashboards were built on
top of one or more Data Warehouses, and they were designed to help the
portal team and top management (managers and executives) make informed
decisions about the structure and content of the employee portal. The main
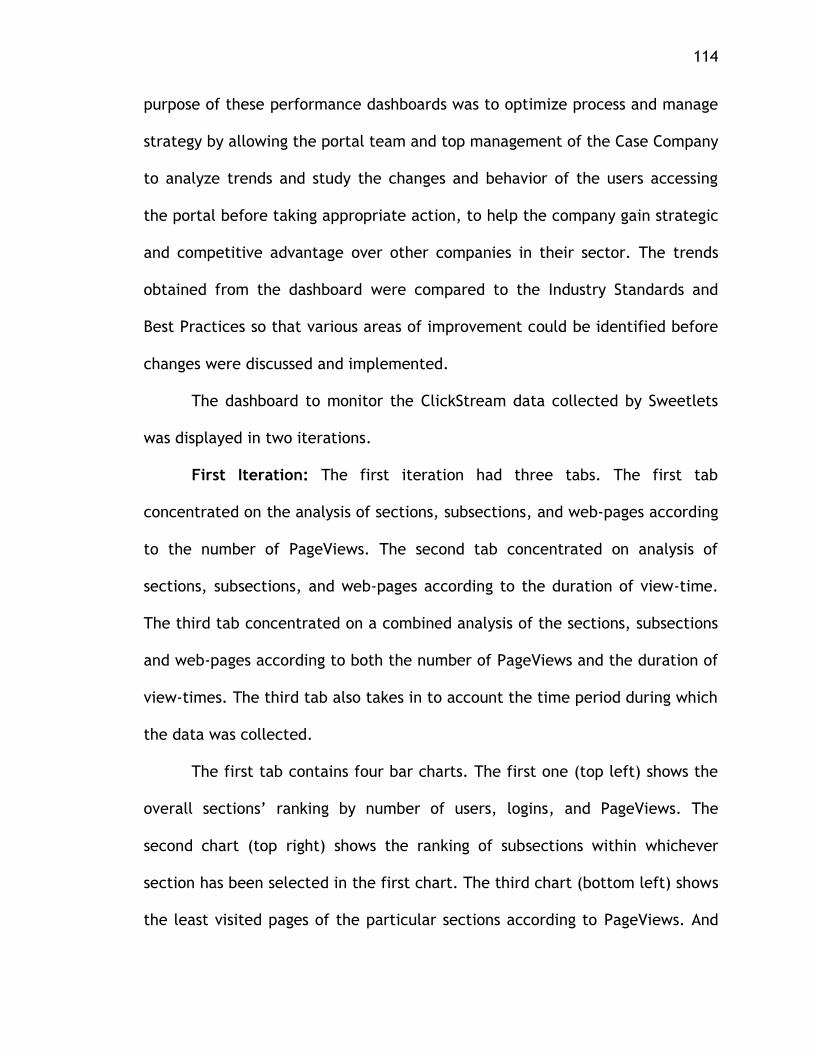
114
purpose of these performance dashboards was to optimize process and manage
strategy by allowing the portal team and top management of the Case Company
to analyze trends and study the changes and behavior of the users accessing
the portal before taking appropriate action, to help the company gain strategic
and competitive advantage over other companies in their sector. The trends
obtained from the dashboard were compared to the Industry Standards and
Best Practices so that various areas of improvement could be identified before
changes were discussed and implemented.
The dashboard to monitor the ClickStream data collected by Sweetlets
was displayed in two iterations.
First Iteration: The first iteration had three tabs. The first tab
concentrated on the analysis of sections, subsections, and web-pages according
to the number of PageViews. The second tab concentrated on analysis of
sections, subsections, and web-pages according to the duration of view-time.
The third tab concentrated on a combined analysis of the sections, subsections
and web-pages according to both the number of PageViews and the duration of
view-times. The third tab also takes in to account the time period during which
the data was collected.
The first tab contains four bar charts. The first one (top left) shows the
overall sections’ ranking by number of users, logins, and PageViews. The
second chart (top right) shows the ranking of subsections within whichever
section has been selected in the first chart. The third chart (bottom left) shows
the least visited pages of the particular sections according to PageViews. And
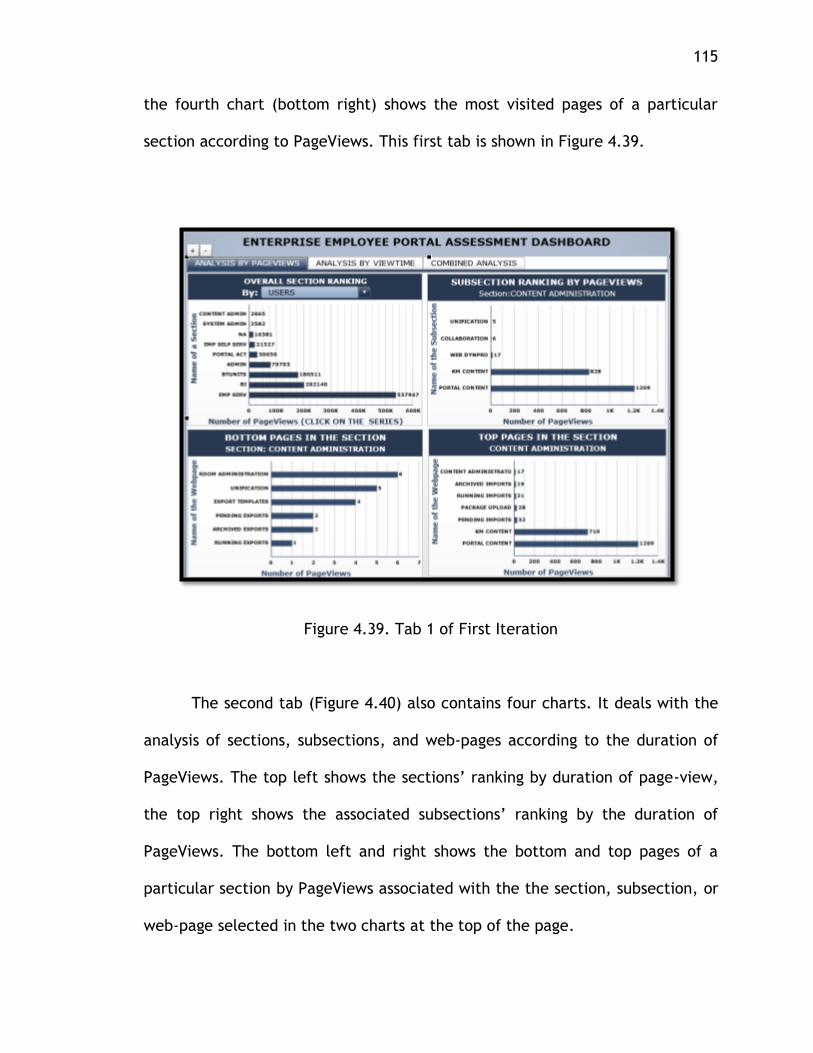
115
the fourth chart (bottom right) shows the most visited pages of a particular
section according to PageViews. This first tab is shown in Figure 4.39.
Figure 4.39. Tab 1 of First Iteration
The second tab (Figure 4.40) also contains four charts. It deals with the
analysis of sections, subsections, and web-pages according to the duration of
PageViews. The top left shows the sections’ ranking by duration of page-view,
the top right shows the associated subsections’ ranking by the duration of
PageViews. The bottom left and right shows the bottom and top pages of a
particular section by PageViews associated with the the section, subsection, or
web-page selected in the two charts at the top of the page.
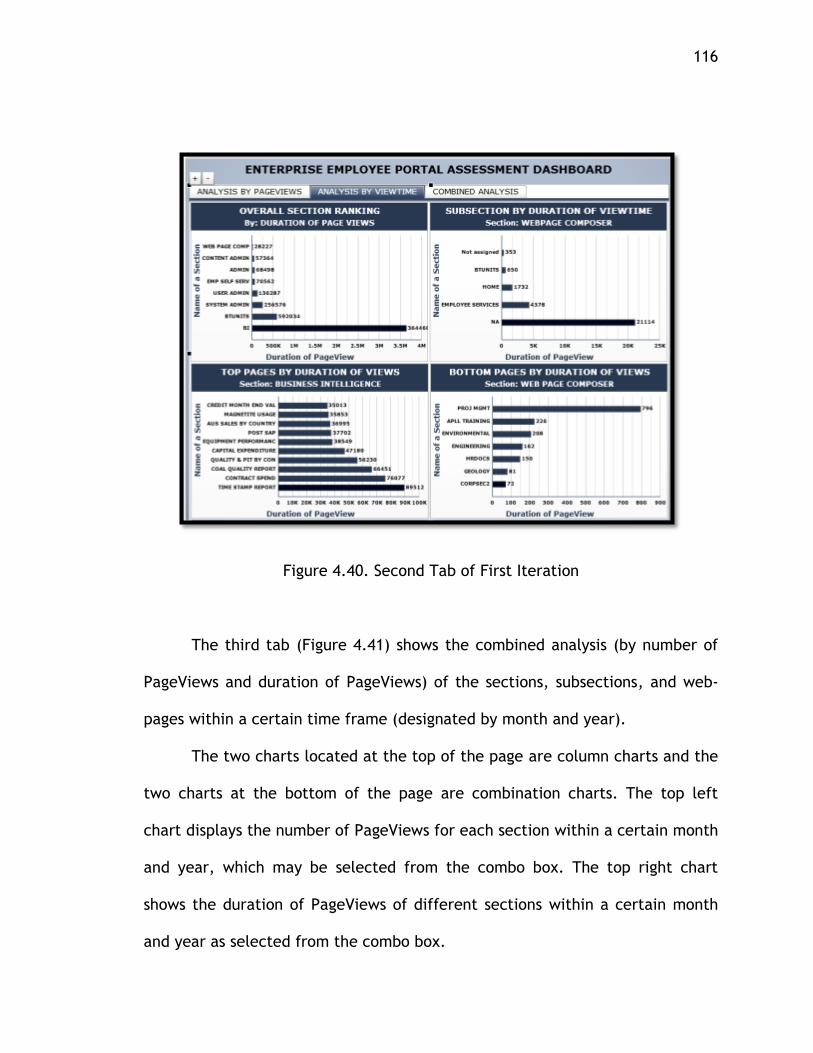
116
Figure 4.40. Second Tab of First Iteration
The third tab (Figure 4.41) shows the combined analysis (by number of
PageViews and duration of PageViews) of the sections, subsections, and web-
pages within a certain time frame (designated by month and year).
The two charts located at the top of the page are column charts and the
two charts at the bottom of the page are combination charts. The top left
chart displays the number of PageViews for each section within a certain month
and year, which may be selected from the combo box. The top right chart
shows the duration of PageViews of different sections within a certain month
and year as selected from the combo box.
117
The bottom left chart displays the top pages within whichever section is
selected from the combo box, and maps their number of PageViews against
their duration of PageViews. The bottom right chart shows the bottom pages
within whichever section is selected from the combo box, and maps the
number of PageViews against the duration of PageViews.
Figure 4.41. Third Tab of First Iteration
Second Iteration: The second iteration displays trends over a period of
time: months and years. This aspect was missing from the first iteration despite
the fact that trend analysis is a very important part of most dashboards;
therefore, the second iteration was added to resolve this oversight.
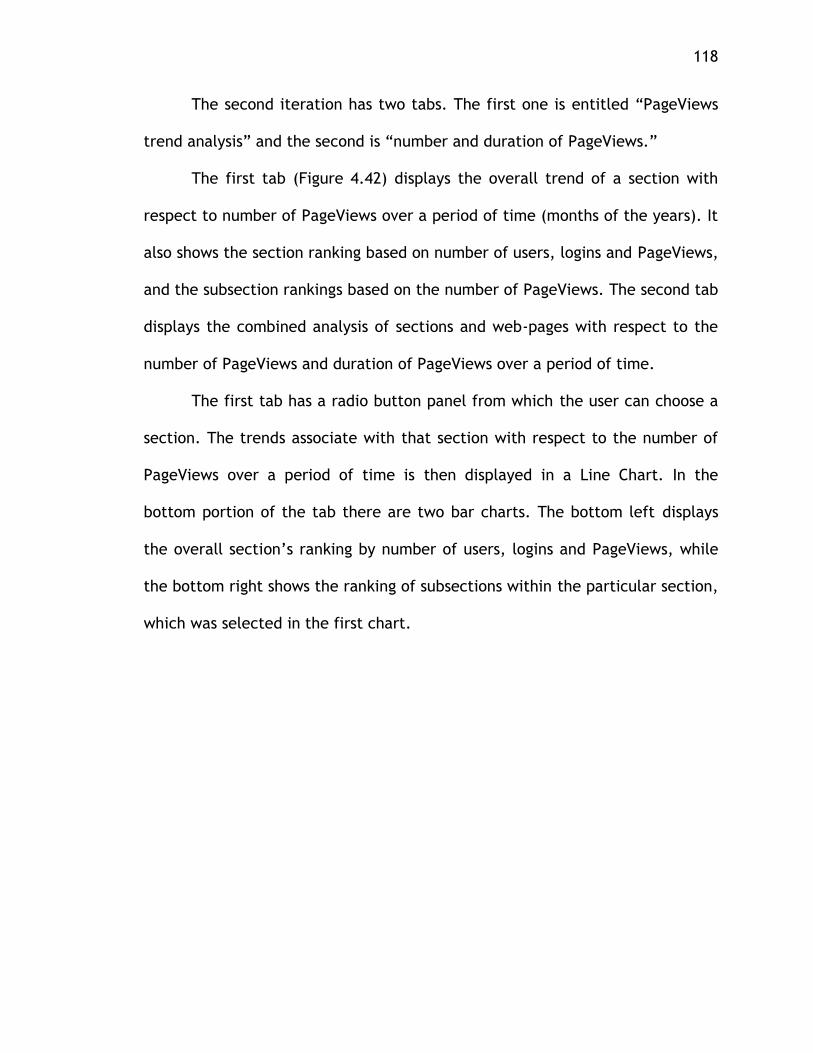
118
The second iteration has two tabs. The first one is entitled “PageViews
trend analysis” and the second is “number and duration of PageViews.”
The first tab (Figure 4.42) displays the overall trend of a section with
respect to number of PageViews over a period of time (months of the years). It
also shows the section ranking based on number of users, logins and PageViews,
and the subsection rankings based on the number of PageViews. The second tab
displays the combined analysis of sections and web-pages with respect to the
number of PageViews and duration of PageViews over a period of time.
The first tab has a radio button panel from which the user can choose a
section. The trends associate with that section with respect to the number of
PageViews over a period of time is then displayed in a Line Chart. In the
bottom portion of the tab there are two bar charts. The bottom left displays
the overall section’s ranking by number of users, logins and PageViews, while
the bottom right shows the ranking of subsections within the particular section,
which was selected in the first chart.
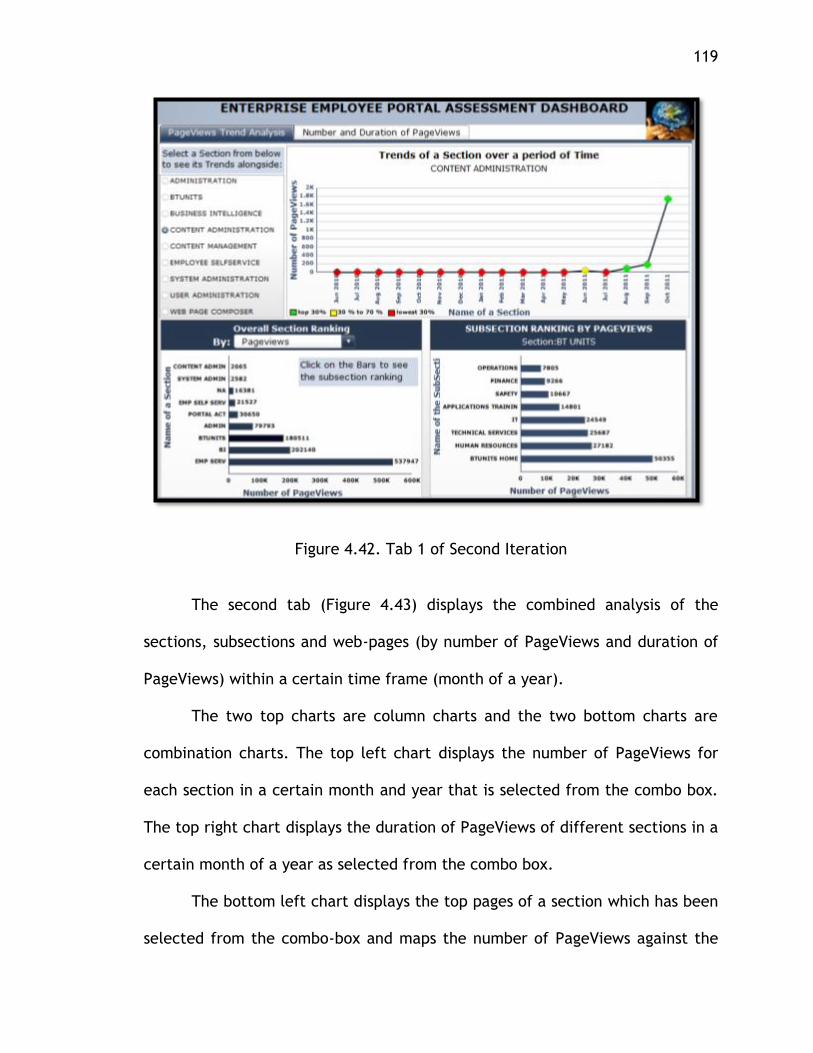
119
Figure 4.42. Tab 1 of Second Iteration
The second tab (Figure 4.43) displays the combined analysis of the
sections, subsections and web-pages (by number of PageViews and duration of
PageViews) within a certain time frame (month of a year).
The two top charts are column charts and the two bottom charts are
combination charts. The top left chart displays the number of PageViews for
each section in a certain month and year that is selected from the combo box.
The top right chart displays the duration of PageViews of different sections in a
certain month of a year as selected from the combo box.
The bottom left chart displays the top pages of a section which has been
selected from the combo-box and maps the number of PageViews against the
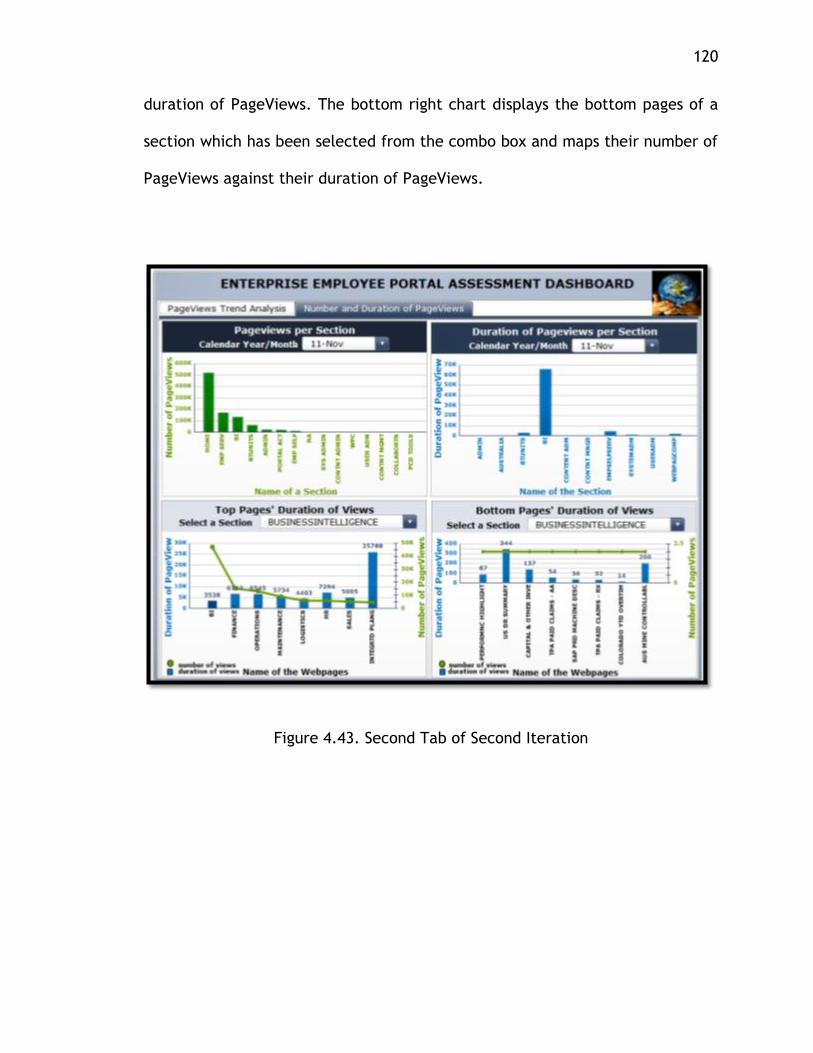
120
duration of PageViews. The bottom right chart displays the bottom pages of a
section which has been selected from the combo box and maps their number of
PageViews against their duration of PageViews.
Figure 4.43. Second Tab of Second Iteration
121
4.4. COMPARISION AND ANALYSIS
As stated in Section 3, this research was conducted in accordance with a
three-pronged approach: industry standards and best practices, actual portal
usage and user-perceived portal usage. After the results were collected via
different methodologies, they needed to be compiled in order to create
recommendations for the Case Company. This brought together results from
three different approaches used as suggested by the research framework in
figure 1.1.
4.4.1. Industry Standards and Best Practices. Table 4.7 displays the
comparison and analysis conducted on the Industry Standards and Best
Practices. The analysis of each information category revealed several
interesting trends. An area with a high volume of available literary
recommendations indicates that a great deal of research is currently being
conducted in this area, while a lower volume of literary recommendations is
indicative of an area with less active research. We calculated the percentage
of sources that made various recommendations as related to each information
category and will address the trends in the next paragraph.
The first Information category, Customization and Personalization, was
recommended by 92.30% of the literature reviewed and 90.91% of the case
studies. This clearly shows that this Information category is of high importance
in an enterprise employee portal.
122
The second information category, Communication and Collaboration,
was recommended by 61.53% of the literature but the percentage of companies
that have adopted communication and collaboration tools in their portals (in
our case studies) is 100%, thus every company has adopted this information
category in one form or the other and yet significant research is still being
conducted to discover more effective methods of communication and
collaboration within a portal. From an industry standpoint, this information
category is the most important in a portal. This difference is because
Communication and Collaboration was one of the drivers of the concept of
portal as it came into existence and is a mature information category within a
portal so not every literary article studied as a part of this research mentioned
it. This category includes: e-mail, blogs, calendar, video communication,
document sharing, threaded discussion and other such information items.
The third information category, Search function, was recommended by
46.15% of the literature reviewed and was supported by 90.91% of the case
studies. A Search function is a standard function for nearly every portal today
as highlighted by the fact that 90.91% of the case companies have this
functionality in one form or another. They may have an advanced search,
federated search, double word search or drop down search. A considerable
amount of research is still actively being conducted in this area in order to
improve this functionality, such as optimizing search functions and making
them more efficient and effective for internal search purposes within the
portal.
123
The next two information categories, Help and FAQ are both
recommended by 30.77% of the literature. Like the Search function, the Help
and FAQ are present in almost every portal. They are usually placed in the top
right corner of every portal page. Because they are so prevalent, it seems that
not a lot of research is actively being conducted in this area. They have
become mature information categories and almost standard in every internal
portal. Nevertheless some research is still being conducted with the goal of
continuing improvement in this area. Between 63.64% and 72.73% of the Case
Companies have implemented Help and FAQ features. This probably should be
100% but some companies place these functions in places other than on their
homepages which could not be verified in this research due to confidentiality
issues.
Employee Self Service is the next information category and its presence
and acceptance has been seen in 81.82% of the case companies. In terms of
active research, 38.46% of the literature recommended this. This indicates a
stark disconnect between theory and industry application. More research
should be done in this area as industry cases clearly show that this information
category is being actively adopted by industries.
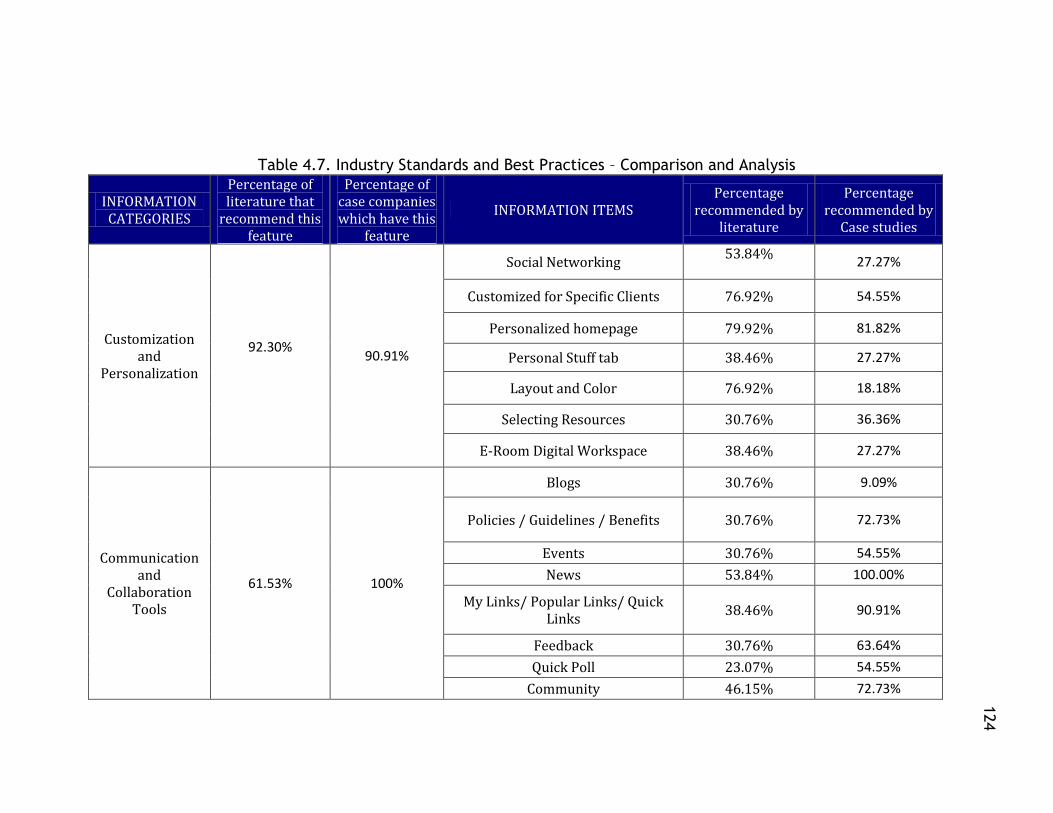
124
124
Table 4.7. Industry Standards and Best Practices – Comparison and Analysis
INFORMATION CATEGORIES
Percentage of literature that
recommend this feature
Percentage of case companies which have this
feature
INFORMATION ITEMS Percentage
recommended by literature
Percentage recommended by
Case studies
Customization and
Personalization
92.30%
90.91%
Social Networking 53.84%
27.27%
Customized for Specific Clients 76.92% 54.55%
Personalized homepage 79.92% 81.82%
Personal Stuff tab 38.46% 27.27%
Layout and Color 76.92% 18.18%
Selecting Resources 30.76% 36.36%
E-Room Digital Workspace 38.46% 27.27%
Communication and
Collaboration Tools
61.53% 100%
Blogs 30.76% 9.09%
Policies / Guidelines / Benefits 30.76% 72.73%
Events 30.76% 54.55%
News 53.84% 100.00%
My Links/ Popular Links/ Quick Links
38.46% 90.91%
Feedback 30.76% 63.64%
Quick Poll 23.07% 54.55%
Community 46.15% 72.73%
124
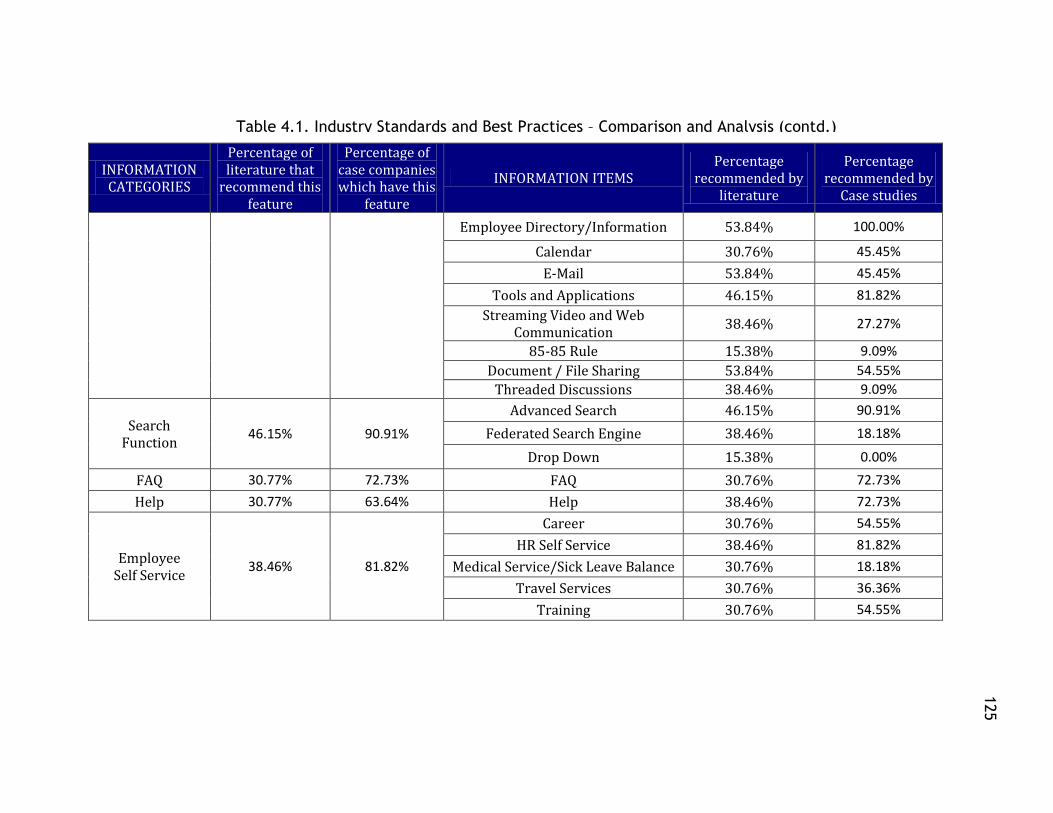
125
125
INFORMATION CATEGORIES
Percentage of literature that
recommend this feature
Percentage of case companies which have this
feature
INFORMATION ITEMS Percentage
recommended by literature
Percentage recommended by
Case studies
Employee Directory/Information 53.84% 100.00%
Calendar 30.76% 45.45%
E-Mail 53.84% 45.45%
Tools and Applications 46.15% 81.82%
Streaming Video and Web Communication
38.46% 27.27%
85-85 Rule 15.38% 9.09%
Document / File Sharing 53.84% 54.55%
Threaded Discussions 38.46% 9.09%
Search Function
46.15% 90.91%
Advanced Search 46.15% 90.91%
Federated Search Engine 38.46% 18.18%
Drop Down 15.38% 0.00%
FAQ 30.77% 72.73% FAQ 30.76% 72.73%
Help 30.77% 63.64% Help 38.46% 72.73%
Employee Self Service
38.46% 81.82%
Career 30.76% 54.55%
HR Self Service 38.46% 81.82%
Medical Service/Sick Leave Balance 30.76% 18.18%
Travel Services 30.76% 36.36%
Training 30.76% 54.55%
Table 4.1. Industry Standards and Best Practices – Comparison and Analysis (contd.)
125
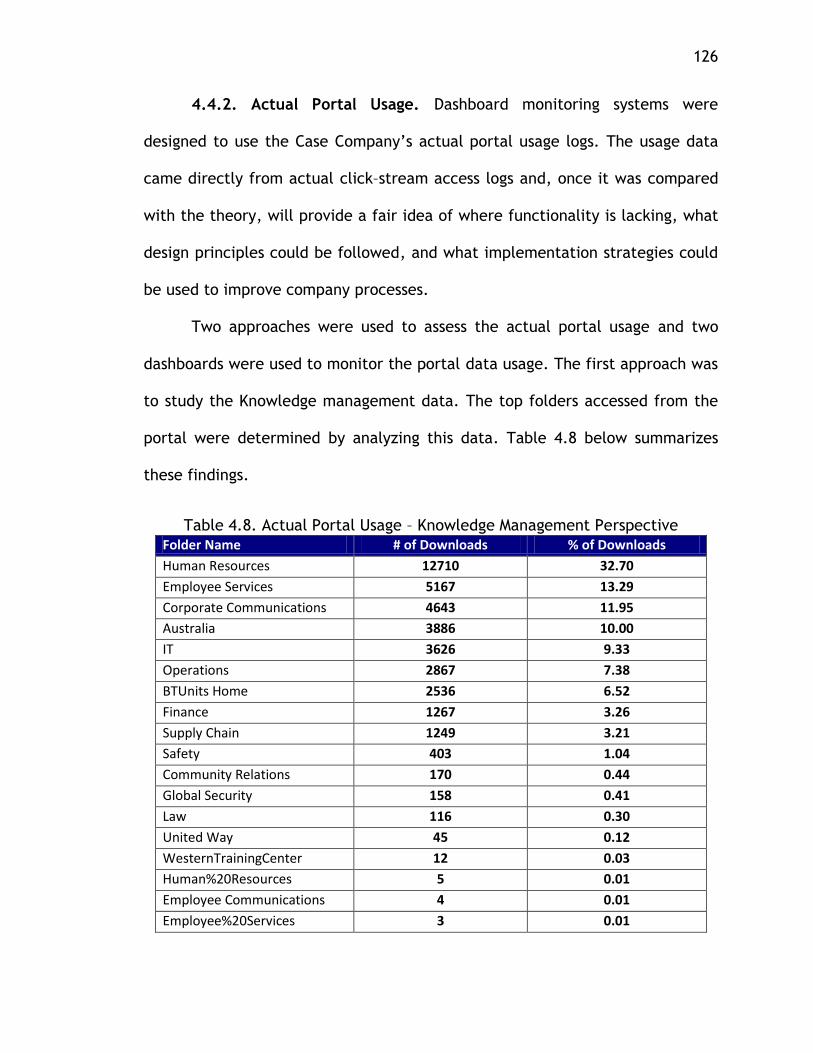
126
4.4.2. Actual Portal Usage. Dashboard monitoring systems were
designed to use the Case Company’s actual portal usage logs. The usage data
came directly from actual click–stream access logs and, once it was compared
with the theory, will provide a fair idea of where functionality is lacking, what
design principles could be followed, and what implementation strategies could
be used to improve company processes.
Two approaches were used to assess the actual portal usage and two
dashboards were used to monitor the portal data usage. The first approach was
to study the Knowledge management data. The top folders accessed from the
portal were determined by analyzing this data. Table 4.8 below summarizes
these findings.
Table 4.8. Actual Portal Usage – Knowledge Management Perspective
Folder Name # of Downloads % of Downloads
Human Resources 12710 32.70
Employee Services 5167 13.29
Corporate Communications 4643 11.95
Australia 3886 10.00
IT 3626 9.33
Operations 2867 7.38
BTUnits Home 2536 6.52
Finance 1267 3.26
Supply Chain 1249 3.21
Safety 403 1.04
Community Relations 170 0.44
Global Security 158 0.41
Law 116 0.30
United Way 45 0.12
WesternTrainingCenter 12 0.03
Human%20Resources 5 0.01
Employee Communications 4 0.01
Employee%20Services 3 0.01
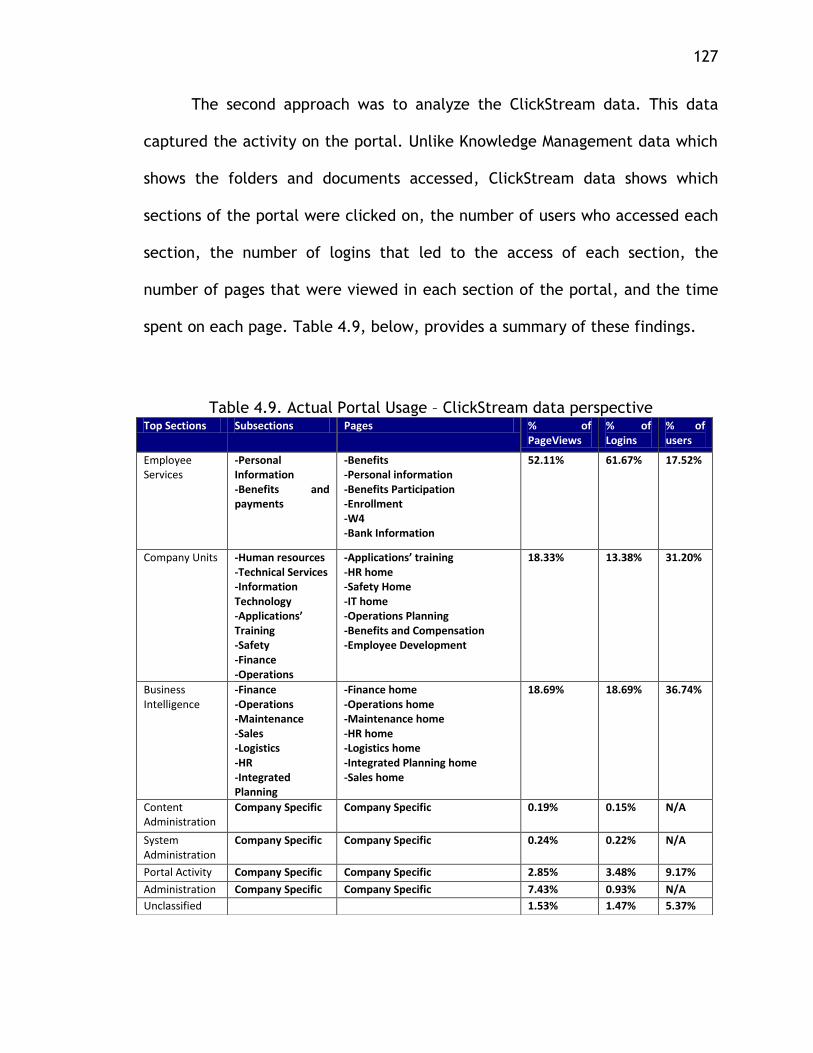
127
The second approach was to analyze the ClickStream data. This data
captured the activity on the portal. Unlike Knowledge Management data which
shows the folders and documents accessed, ClickStream data shows which
sections of the portal were clicked on, the number of users who accessed each
section, the number of logins that led to the access of each section, the
number of pages that were viewed in each section of the portal, and the time
spent on each page. Table 4.9, below, provides a summary of these findings.
Table 4.9. Actual Portal Usage – ClickStream data perspective Top Sections Subsections Pages % of
PageViews % of Logins
% of users
Employee Services
-Personal Information -Benefits and payments
-Benefits -Personal information -Benefits Participation -Enrollment -W4 -Bank Information
52.11%
61.67% 17.52%
Company Units -Human resources -Technical Services -Information Technology -Applications’ Training -Safety -Finance -Operations
-Applications’ training -HR home -Safety Home -IT home -Operations Planning -Benefits and Compensation -Employee Development
18.33% 13.38% 31.20%
Business Intelligence
-Finance -Operations -Maintenance -Sales -Logistics -HR -Integrated Planning
-Finance home -Operations home -Maintenance home -HR home -Logistics home -Integrated Planning home -Sales home
18.69% 18.69% 36.74%
Content Administration
Company Specific Company Specific 0.19% 0.15% N/A
System Administration
Company Specific Company Specific 0.24% 0.22% N/A
Portal Activity Company Specific Company Specific 2.85% 3.48% 9.17%
Administration Company Specific Company Specific 7.43% 0.93% N/A
Unclassified 1.53% 1.47% 5.37%
128
After individually studying the Actual Portal Usage from the Knowledge
Management and ClickStream perspectives, the two sets of data were
compared wherever possible in table 4.9, below. The correlations are
highlighted in the table. As stated earlier; the two sets of data are only loosely
related to each other, which made comparison difficult.
In table 4.10, the “Employee services” section of the ClickStream data is
compared to the “Human Resources” folder and the “Employee Self-Service
folder" together as this seemed to provide the best match between the data
contained in these folders. So, in this case, the HR and Employee Self Service
folders together address the same information as the repository for “Employee
Services” section on the portal page.
Similarly, the “Company Units” section is compared with the
“Operations,” “BT units,” “Finance” and “Supply Chain” folders combined.
The “Business Intelligence" section is compared to the “Information
Technology" section. The subsections and pages of the Business Intelligence
section are similar to those in the “Company Units” section because Business
Intelligence touches all the company units.
The other sections of the portal cannot be compared to the folders. For
example, the folder named “Australia,” does not match any sections on the
portal. Similarly, the "Corporate Communication" folder contains all the news
and announcements of the company, but this information would be displayed
on the homepage of the portal rather than being associated with any specific
section of the portal.
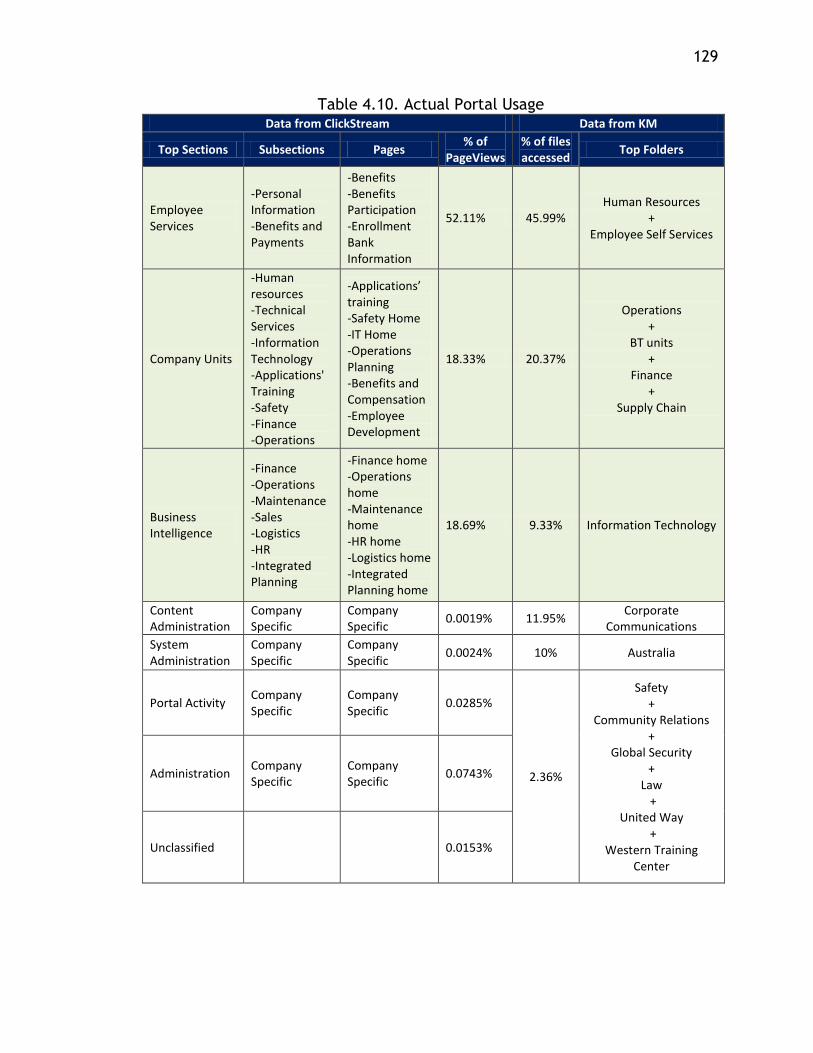
129
Table 4.10. Actual Portal Usage Data from ClickStream Data from KM
Top Sections Subsections Pages % of
PageViews % of files accessed
Top Folders
Employee Services
-Personal Information -Benefits and Payments
-Benefits -Benefits Participation -Enrollment Bank Information
52.11% 45.99% Human Resources
+ Employee Self Services
Company Units
-Human resources -Technical Services -Information Technology -Applications' Training -Safety -Finance -Operations
-Applications’ training -Safety Home -IT Home -Operations Planning -Benefits and Compensation -Employee Development
18.33% 20.37%
Operations +
BT units +
Finance +
Supply Chain
Business Intelligence
-Finance -Operations -Maintenance -Sales -Logistics -HR -Integrated Planning
-Finance home -Operations home -Maintenance home -HR home -Logistics home -Integrated Planning home
18.69% 9.33% Information Technology
Content Administration
Company Specific
Company Specific
0.0019% 11.95% Corporate
Communications
System Administration
Company Specific
Company Specific
0.0024% 10% Australia
Portal Activity Company Specific
Company Specific
0.0285%
2.36%
Safety +
Community Relations +
Global Security +
Law +
United Way +
Western Training Center
Administration Company Specific
Company Specific
0.0743%
Unclassified 0.0153%
130
4.4.3. User Perceived Portal Usage. The user-perceived portal usage is
obtained from the company visits and third party workshop results which
involved interviews and interactions with target user groups. The problem
areas cited by the users can be summarized as follows under the same
information categories established in the Information Mapping Grid:
- Search Function: The users expressed difficulty in finding very basic
information. Browsing and searching for the right information or document is
cited as painstaking.
- Usability of the portal: The users stated that site was visually
cluttered, inconsistent and lacked visual appeal. The site was called out to be
too wordy. Further, inconsistency in icons, fonts, images and colors were
pointed out.
- Communication and Collaboration tools: The users requested more
information on performance, safety, finance, company growth and strategic
plans of the company. They wanted news from headquarters to reach the other
global locations through the internal employee portal. They expected more
communication of internal company news and announcements through the
portal. They wanted local, regional and global company news, information
about press releases, new projects, mergers and acquisitions of the company.
They want to see employee information like their picture, their role in the
organization, their duration of service with the company, their location of
work, their knowledge expertise/skill set and their accomplishments. A need
for a calendar to keep track of internal events and promotions has been cited.
131
The calendar also needs to be able to display community events, location
specific events. The users also showed interest for a separate “holiday
calendar” and a separate “learning and development calendar.” The need for a
more intuitive and streamlined way of updating content was mentioned.
- Employee self-service: The users expressed the need to have easy
access to key information and tasks like accessing the IT systems, accessing
paystubs, requesting vacation time, submitting time sheets, entering the
building after hours, ordering business cards, ordering stationery, store items,
planning for the performance review, and much more. This could also be
further bolstered by the fact that the HR department gets a lot of phone calls
asking “why” and “how” questions. Thus, incorporating employee self-service
could drastically reduce this load on the HR department. The employees said
that training and career development was very important to them, so it needs
to have a strong presence on the portal.
- Personalization and Customization: The users wanted place-specific
information related to their location of work. They wanted information about
who works there, their time zone, currency, weather, photos and the like.
They would also like to know stories about their current location, the culture
around that place, office logistics like parking, directions, meeting rooms,
seating charts and the like. This can be possible with the help of
personalization and customization feature. If the users were able to choose and
select resources to display in their portal homepage they could incorporate any
of this information on their portal page. The users also liked the idea of
132
providing more people focused and personal content, like photos and videos
that are user generated.
- Help and FAQ: The employees have expressed the need for help
sections so calls to the HR department could be reduced.
4.4.4. Recommendations. The Industry Standards and Best Practices
provide a comprehensive list of information categories and information items
related to each information category as represented in the Information
Mapping Grid.
The current usage of the Case Company’s portal is very low and appears
to be limited to the Employee Services, Business Intelligence, and Functional
unit sections. There are many unused sections that should either be changed or
removed from the portal page.
The users’ suggestions that were collected at a workshop held by a third-
party to determine the user-perceived portal usage go hand-in-hand with the
information mapping grid.
So, the set of recommendations for the case company used to validate
the Information mapping Grid shown in Table 4.11 can be summarized and
explained as follows:
“Customization and Personalization” should definitely be incorporated
into the portal. This is supported by almost every company used as a part of
the case studies and very active research is being done in this area, as
suggested in section 4.4.1. The user-perceived portal usage also recommends
this heavily. This information category can be implemented in the portal by
133
enabling the users to be able to select the information they want to see on
their homepage like the weather, currency, zone and the like. They should also
have the ability to select the tools and applications they want to keep handy on
the homepage. A social network application would also be appreciated by the
users.
“Communication and Collaboration tools” is incorporated by the
companies that are a part of the case study and a significant amount of
research is also being carried out in this area, as suggested in section 4.4.1.
The user-perceived portal usage study also portrays the need to leverage
communication and collaboration in the internal portal. This feature is highly
recommended for being implemented in the portal in the form of news –
global, local and regional, announcements, press releases, calendars to show
holidays and company events, community and discussion forums, employee
directory, policies, guidelines and benefits.
“Employee Self-Service” is being actively considered by the companies
used as case studies and some research is still being done in this area.
Irrespective of the lower percentage of research being carried out in this area
(as suggested in section 4.4.1), the user-perceived portal usage expresses high
need of this feature in various ways. This feature should be incorporated in the
portal to provide HR self-service, training, career assistance and the like.
“Search function” has a very high acceptance by the case studies and
also a considerable amount of research is being carried out in this area as
suggested in section 4.4.1. The user-perceived portal usage has expressed this
134
as the first and foremost concern, which makes the portal completely non-user-
friendly. Document and information search has also been cited as a major
concern of the portal as the employees feel that it is very frustrating for them
not to be able to find information they seek from the portal. The portal should
incorporate a good search strategy in the form of advanced search.
“Help and FAQ” have both been seen to have been significantly
incorporated in the case studies and some research is still going on in this area.
In this study not every page of the portal could be studied due to
confidentiality issues. The “Help and FAQ” feature could be an area of further
research as it is a very important part of every portal. It is recommended that
“Help and FAQ” should be incorporated in the portal of the case company used
in this research.
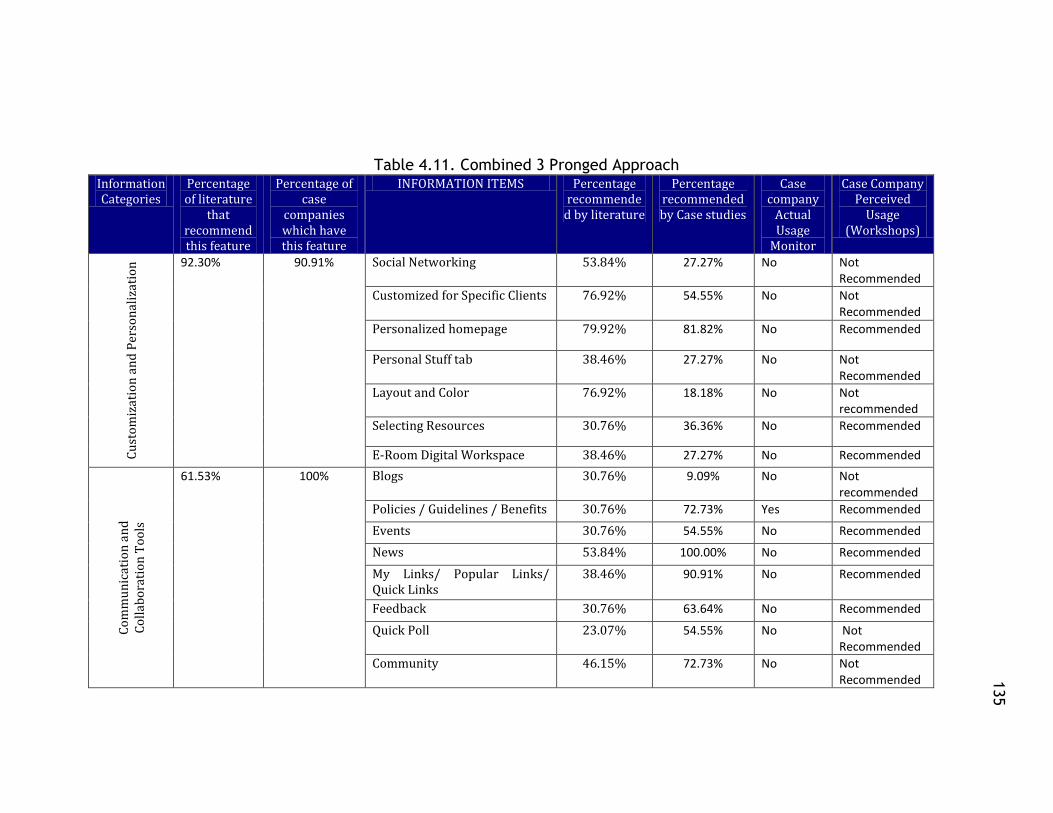
135
135
Table 4.11. Combined 3 Pronged Approach Information Categories
Percentage of literature
that recommend this feature
Percentage of case
companies which have this feature
INFORMATION ITEMS Percentage recommende
d by literature
Percentage recommended by Case studies
Case company
Actual Usage
Monitor
Case Company Perceived
Usage (Workshops)
Cu
sto
miz
atio
n a
nd
Per
son
aliz
atio
n 92.30%
90.91% Social Networking 53.84%
27.27% No Not
Recommended
Customized for Specific Clients 76.92% 54.55% No Not Recommended
Personalized homepage 79.92% 81.82% No Recommended
Personal Stuff tab 38.46% 27.27% No Not Recommended
Layout and Color 76.92% 18.18% No Not recommended
Selecting Resources 30.76% 36.36% No Recommended
E-Room Digital Workspace 38.46% 27.27% No Recommended
Co
mm
un
icat
ion
an
d
C
oll
abo
rati
on
To
ols
61.53% 100% Blogs 30.76% 9.09% No Not recommended
Policies / Guidelines / Benefits 30.76% 72.73% Yes Recommended
Events 30.76% 54.55% No Recommended
News 53.84% 100.00% No Recommended
My Links/ Popular Links/ Quick Links
38.46% 90.91% No Recommended
Feedback 30.76% 63.64% No Recommended
Quick Poll 23.07% 54.55% No Not Recommended
Community 46.15% 72.73% No Not Recommended 1
35
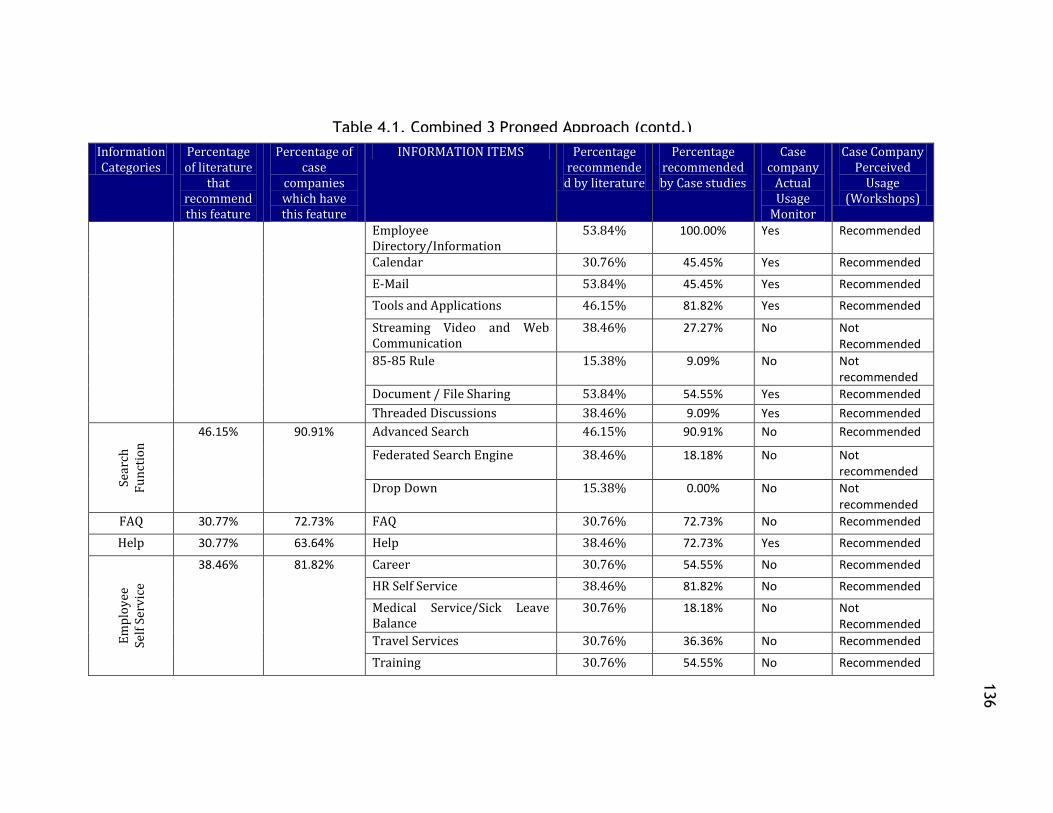
136
136
Information Categories
Percentage of literature
that recommend this feature
Percentage of case
companies which have this feature
INFORMATION ITEMS Percentage recommende
d by literature
Percentage recommended by Case studies
Case company
Actual Usage
Monitor
Case Company Perceived
Usage (Workshops)
Employee Directory/Information
53.84% 100.00% Yes Recommended
Calendar 30.76% 45.45% Yes Recommended
E-Mail 53.84% 45.45% Yes Recommended
Tools and Applications 46.15% 81.82% Yes Recommended
Streaming Video and Web Communication
38.46% 27.27% No Not Recommended
85-85 Rule 15.38% 9.09% No Not recommended
Document / File Sharing 53.84% 54.55% Yes Recommended
Threaded Discussions 38.46% 9.09% Yes Recommended
Sear
ch
F
un
ctio
n
46.15% 90.91% Advanced Search 46.15% 90.91% No Recommended
Federated Search Engine 38.46% 18.18% No Not recommended
Drop Down 15.38% 0.00% No Not recommended
FAQ 30.77% 72.73% FAQ 30.76% 72.73% No Recommended
Help 30.77% 63.64% Help 38.46% 72.73% Yes Recommended
Em
plo
yee
Self
Ser
vic
e
38.46% 81.82% Career 30.76% 54.55% No Recommended
HR Self Service 38.46% 81.82% No Recommended
Medical Service/Sick Leave Balance
30.76% 18.18% No Not Recommended
Travel Services 30.76% 36.36% No Recommended
Training 30.76% 54.55% No Recommended
Table 4.1. Combined 3 Pronged Approach (contd.)
136
137
Table 4.12 summarizes the recommendation for improving “contents and
functions” for an internal employee portal in general, irrespective of any case
company. The recommendations were derived from literature review, Industry
Standards and Best Practices, Actual Case Company verification (i.e., results of
Actual Portal Usage Monitoring derived from the Dashboard Monitoring system
and the results derived from the user-perceived portal usage derived from
Third-part workshop), and researchers’ analysis for the case company and for
the employee portal design in general.
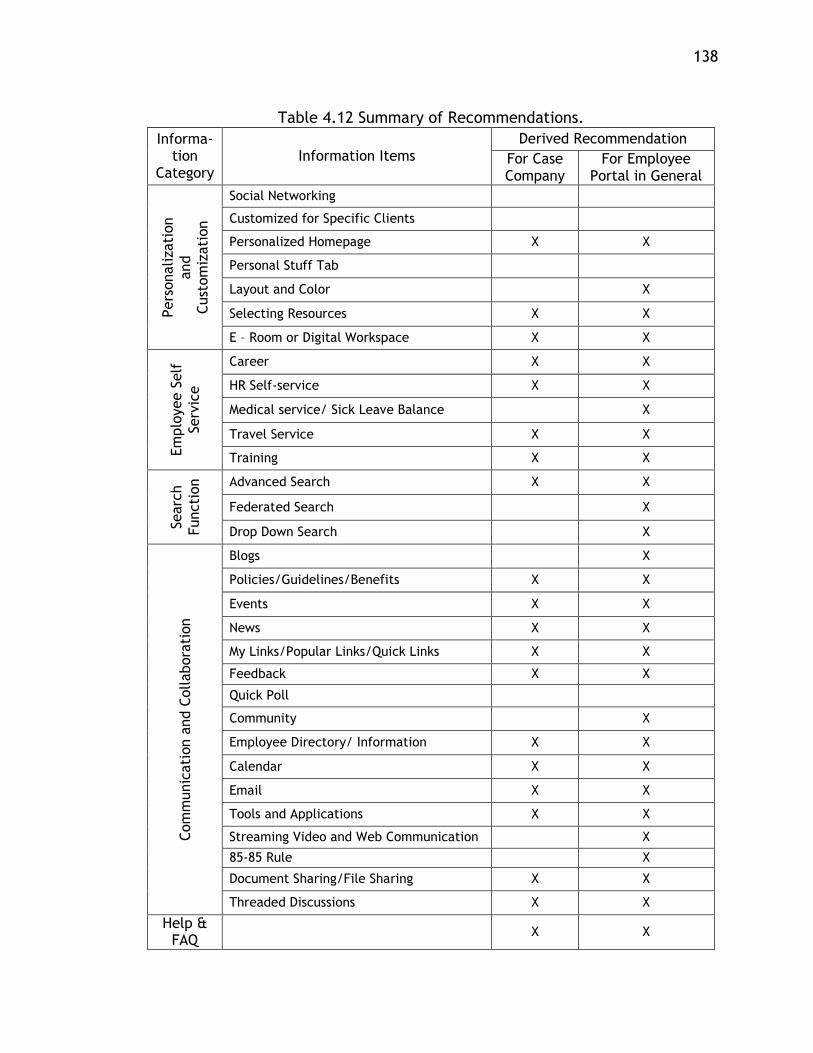
138
Table 4.12 Summary of Recommendations.
Informa-tion
Category Information Items
Derived Recommendation
For Case Company
For Employee Portal in General
Pers
onalizati
on
and
Cust
om
izati
on
Social Networking
Customized for Specific Clients
Personalized Homepage X X
Personal Stuff Tab
Layout and Color X
Selecting Resources X X
E – Room or Digital Workspace X X
Em
plo
yee S
elf
Serv
ice
Career X X
HR Self-service X X
Medical service/ Sick Leave Balance X
Travel Service X X
Training X X
Searc
h
Functi
on
Advanced Search X X
Federated Search X
Drop Down Search X
Com
munic
ati
on a
nd C
ollabora
tion
Blogs X
Policies/Guidelines/Benefits X X
Events X X
News X X
My Links/Popular Links/Quick Links X X
Feedback X X
Quick Poll
Community X
Employee Directory/ Information X X
Calendar X X
Email X X
Tools and Applications X X
Streaming Video and Web Communication X
85-85 Rule X
Document Sharing/File Sharing X X
Threaded Discussions X X
Help & FAQ
X X
139
5. SUMMARY, CONCLUSION, CONTRIBUTIONS AND FUTURE DIRECTIONS
This section is used to summarize the results of this research, draw
meaningful conclusions of this study, and discuss the contributions and
potential future research directions.
5.1. RESEARCH SUMMARY AND CONCLUSION
The objective of this research was to provide recommendations for the
improvement of efficiency and effectiveness of an internal employee portal.
The problems were mostly related to its contents and function and usability.
Based on the research framework, an information mapping grid was developed
to provide a comprehensive listing of all the information categories and
information items within the information categories relating to the “Contents
and Functions” of the portal. The information categories and information items
constituting them were determined by studying theory from literature and
actual usage via case studies.
A case company was used to validate the information mapping grid. The
research was carried out using a three pronged approach as shown in Figure
5.1. (Same as figure 3.1), which includes: formulating the Industry Standards
and Best Practices, determining the actual portal usage, and determining the
user–perceived portal usage.
140
The major findings from Literature Review and Industry Case Studies
categorize the contents and functions of an employee portal into five
Information Categories, which are: “Customization and Personalization,”
“Communication and Collaboration,” “Search function,” “Employee Self
Service,” and “Help and FAQ.” “Customization and Personalization” has been
mentioned as an important feature by both Literature and Industry Cases.
“Communication and Collaboration” was recommended by a significant portion
of the literature reviewed and it was adopted by all Industry cases studied.
“Search functionality” is a mature information category, so while only
approximately fifty percent of the literature mentioned its importance, it has
been widely adopted by almost all of the Industry Cases. Likewise, the “FAQ”
and “Help” and “Employee self-service” categories are rarely mentioned by the
literature reviewed, they have also been adopted by a significant percentage of
Industry cases examined. It is worth noting that “Employee Self-Service” needs
further research, since this is an evolving Information Category.
The second prong of this approach studied the actual portal usage,
which was accomplished by using dashboard monitoring systems, which present
data from portal usage logs of the case company. The results showed that the
portal was still in the early stages of integration into the company environment
and far from being widely used by employees in the case company. The only
group that used the portal regularly was the Information Technology group,
partly because the portal lacked employee-oriented features such as
141
“Personalization and Customization,” “Communication and Collaboration”
tools, “Employee Self-Service,” and “Help and FAQ.”
The third prong of the approach determined the usage of the portal as
perceived by the target users. For this purpose, workshops and interviews were
conducted with the users by a third-party company to ascertain their
perceptions and expectations of the portal. Results of those workshops helped
determine which areas of the portal needed improvement - from the users’
perspective. The results obtained from those workshops were closely related to
the Information Mapping Grid. The major problem users cited was that
information was difficult to find on the portal, and they provided a list of
information they needed. They wanted more “Communication and
Collaboration” in the form of News and announcements, calendars showing
holidays and company events, an employee directory, and location-specific
information such as weather gadgets, etc. Users also expressed a desire for
better “Employee Self-Service,” and “Help” and “FAQ,” which could reduce
frequent calls to the HR department for basic support. Those workshops also
highlighted the need for a better search strategy for the portal as well as
personalization and customization features.
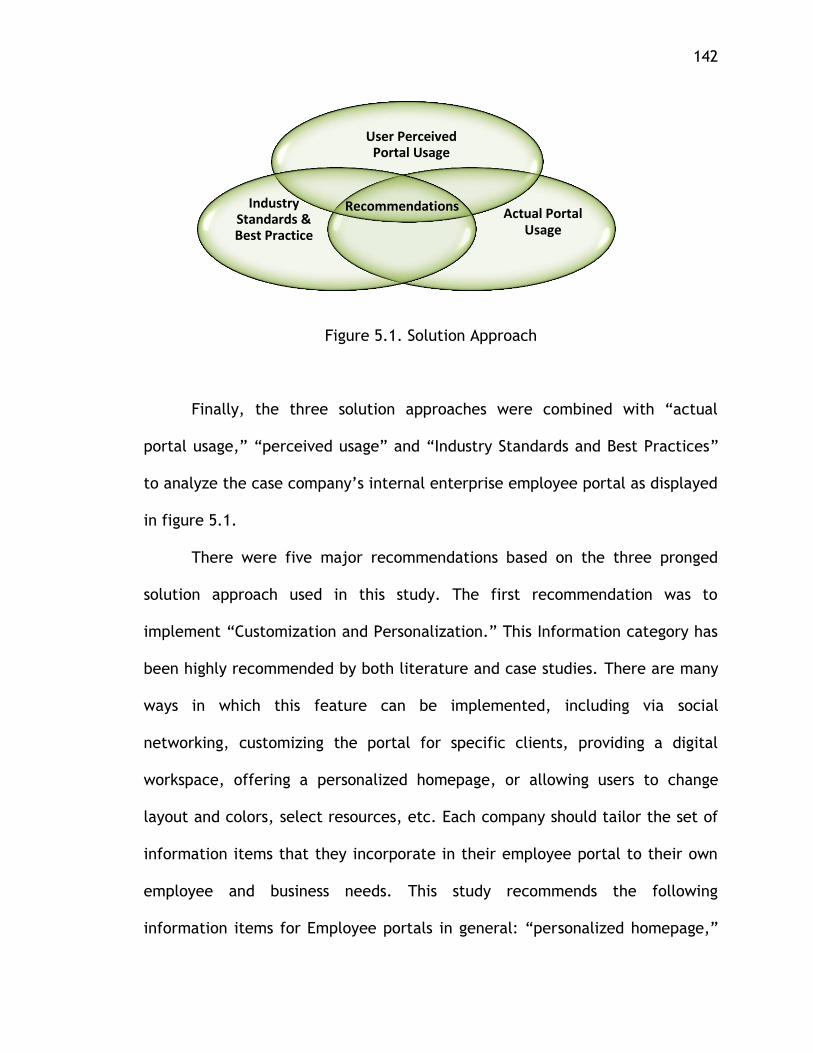
142
Figure 5.1. Solution Approach
Finally, the three solution approaches were combined with “actual
portal usage,” “perceived usage” and “Industry Standards and Best Practices”
to analyze the case company’s internal enterprise employee portal as displayed
in figure 5.1.
There were five major recommendations based on the three pronged
solution approach used in this study. The first recommendation was to
implement “Customization and Personalization.” This Information category has
been highly recommended by both literature and case studies. There are many
ways in which this feature can be implemented, including via social
networking, customizing the portal for specific clients, providing a digital
workspace, offering a personalized homepage, or allowing users to change
layout and colors, select resources, etc. Each company should tailor the set of
information items that they incorporate in their employee portal to their own
employee and business needs. This study recommends the following
information items for Employee portals in general: “personalized homepage,”
Actual Portal Usage
User Perceived Portal Usage
Industry Standards & Best Practice
Recommendations
143
“layout and color,” “selecting resources,” and having a “Digital workspace.”
All of these information items except for “Color and layout” were also provided
to the case company as recommendations for improving its current portal.
The second recommendation of this study was to provide a set of
“Communication and Collaboration” tools in an employee portal. All industry
cases studied implemented these tools and a significant portion of the
literature recommended the communication and collaboration feature,
indicating that it is both an important and mature information category of an
employee portal and one which is still evolving. News, Quick links, popular
links, personal links, community, employee directory, streaming video, and
web communication are the most common methods use to implement
“Communication and Collaboration” features, while Blogs, Events, Document
Sharing, and Threaded Discussions are not quite as popular (yet) according to
both industry cases and literature. The actual portal usage revealed that the
case company does offer a few of these features but the perceived portal usage
suggests that employees would like even more of these features incorporated
into the portal. As a result, incorporating more communication and
collaboration tools was strongly recommended to the case company.
The third recommendation was to incorporate “Employee Self-Service”
in an employee portal. Employee self-service has been widely adopted by the
industry cases studied, although literature research has yet to catch on. HR
self-service, which allows employees to manage pay statements and taxes, is
one of the most popular self-services. Career self-service has also been deemed
144
especially useful in managing internal job postings and recruiting from within
the organization and it has been extended to help in recruitment as well.
Medical self-service helps employees manage medical reimbursements. Travel-
service allows employees to manage travel expenses. Training self-service,
which is widely used in today’s business world, allows employees to obtain
training with the aid of online computer based training programs. A
considerable percentage of literature mentions “Employee Self services,”
though not enough to be significant. Although research is on-going to find new
ways to incorporate self-service features into employee portals, the full impact
is yet to be determined. This discrepancy could be a topic for further research
as self-service is rapidly evolving, with a significant amount of future research
expected. The actual portal usage suggests that this feature was not present in
the case company’s portal even though the user-perceived portal usage
suggests that this feature is very important to the employees. With this in
mind, this feature was strongly recommended both for employee portals in
general as well as for the case company.
The fourth recommendation of this study was to include search functions
in an employee portal. The search function has been widely adopted among
industry cases studied, but it was not frequently mentioned in the literature
reviewed. This research recommends including an Advanced and/or Federated
search feature in every employee portal, including the case company’s portal.
The fifth recommendation was to provide an FAQ section and a Help
section. These are two of the more mature information categories of an
145
enterprise portal as evidenced by the very high rate of implementation within
industry cases, combined with the low number of times it is mentioned in the
literature. FAQ section and Help sections are a highly recommended part of any
employee portal implementation. These have also been recommended by the
perceived portal usage though they were not present in the current portal of
the case company.
Table 5.1 provides a brief summary of research findings and
recommendations. The summary table consists of the information categories
along with their associated information items as they relate to the “contents
and functions” of an internal employee portal. An “X” represents
“recommended.” “Low” indicates less than 33% support; “med” indicates 33-
66% support and “high” indicates more than 66% support.
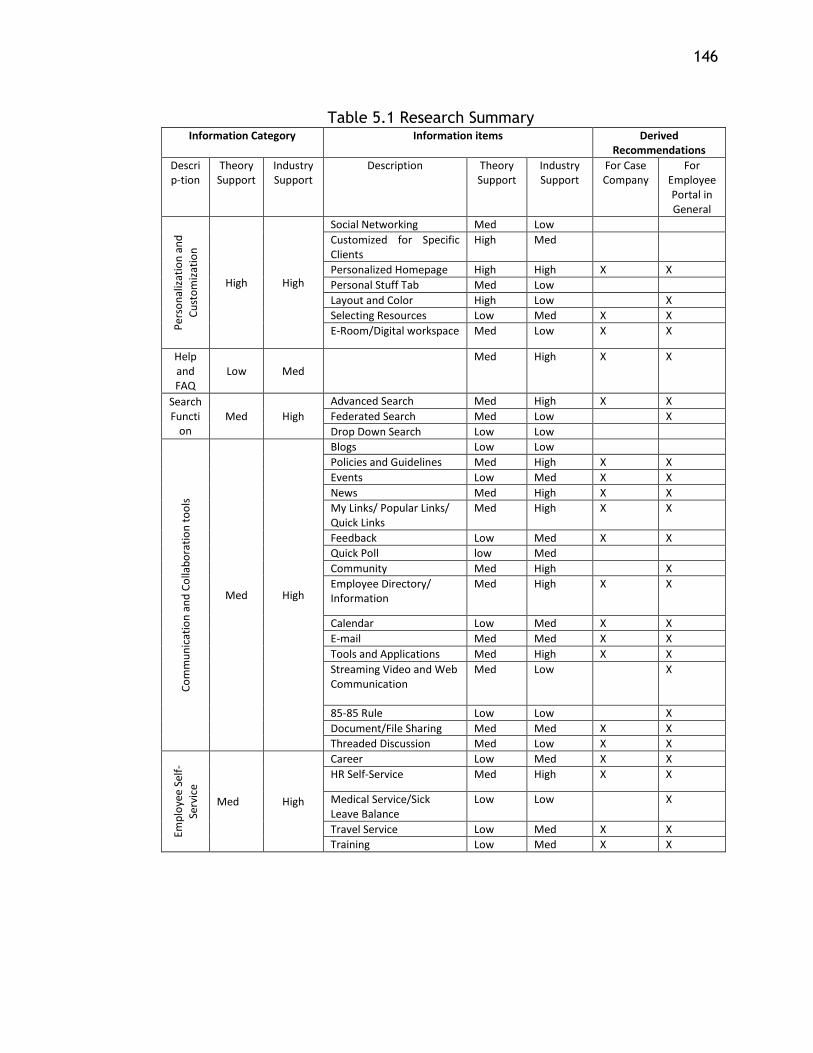
146
Table 5.1 Research Summary Information Category Information items Derived
Recommendations
Descrip-tion
Theory Support
Industry Support
Description Theory Support
Industry Support
For Case Company
For Employee Portal in General
Per
son
aliz
atio
n a
nd
Cu
sto
miz
atio
n
High High
Social Networking Med Low
Customized for Specific Clients
High Med
Personalized Homepage High High X X
Personal Stuff Tab Med Low
Layout and Color High Low X
Selecting Resources Low Med X X
E-Room/Digital workspace Med Low X X
Help and FAQ
Low Med
Med High X X
Search Functi
on
Med High
Advanced Search Med High X X
Federated Search Med Low X
Drop Down Search Low Low
Co
mm
un
icat
ion
an
d C
olla
bo
rati
on
to
ols
Med High
Blogs Low Low
Policies and Guidelines Med High X X
Events Low Med X X
News Med High X X
My Links/ Popular Links/ Quick Links
Med High X X
Feedback Low Med X X
Quick Poll low Med
Community Med High X
Employee Directory/ Information
Med High X X
Calendar Low Med X X
E-mail Med Med X X
Tools and Applications Med High X X
Streaming Video and Web Communication
Med Low X
85-85 Rule Low Low X
Document/File Sharing Med Med X X
Threaded Discussion Med Low X X
Emp
loye
e Se
lf-
Serv
ice
Med High
Career Low Med X X
HR Self-Service Med High X X
Medical Service/Sick Leave Balance
Low Low X
Travel Service Low Med X X
Training Low Med X X
147
5.2 RESEARCH CONTRIBUTIONS
This research made significant contributions to the world of research
pertaining to portal evaluation. First, the methodology used in this research is
very complex and novel as it involved three different approaches of “Industry
Standards and Best Practices,” “Actual Portal Usage Monitoring,” and the study
of “User-perceived Portal Usage” to assess an internal employee portal.
This is the first time that these three approaches have been combined
and compared in this manner to derive a set of recommendations with regards
to implementing “Personalization and Customization,” “Communication and
Collaboration,” “Search functionality,” “Employee Self-Services,” and “Help
and FAQ.” The recommendations are applicable for most global companies with
a diverse workforce. Companies will be able to use the comprehensive list of
“Industry Standards and Best Practices” as derived in the “Information Mapping
Grid” to evaluate their portals by comparing and analyzing actual and
perceived portal usage against these standards.
Another contribution is that the architecture and framework of data
warehouses and dashboard monitoring systems developed by this research are
applicable to companies using the same portal systems (i.e., SAP portal). The
data logs, which are extremely complicated and unreadable or comprehensible
in their raw form, can be used to develop meaningful information, which is
very significant given the fact that SAP has been adopted by more than 85% of
148
Fortune 500 companies and by more than 80% of Fortune 1000 companies. The
portal logs from Knowledge management can be fed into the Knowledge
Management dashboard and the logs from the ClickStream data can be fed into
the ClickStream data warehouses and eventually the ClickStream dashboard.
5.3 RESEARCH LIMITATIONS
The actual portal usage was studied based on data provided by the Case
Company as collected from their portal usage logs, sourced from SAP
Knowledge Management and ClickStream. The data was unstructured and
required significant time and effort in cleansing, which involved discarding
some figures and counts and potentially reduced the level of accuracy to some
extent.
Data logs, on which the actual usage was based, only covered a short
period of time, thus limiting our ability to discover long term trends and
patterns.
Also, this research did not consider demographics such as the average
age group of the users and the company culture (old-school or state-of-art) of
industry cases or the case company due to time constraints.
The creation of the data warehouse in SAP and the design of the
dashboard monitoring system encountered many technical difficulties. The
initial prototype required several re-design iterations, and the dashboard
suffered from multiple user experience and usability issues in the dashboard,
149
ranging from simple font and color choices to the type of graphs, and selection
options that would be used in the dashboard. The data warehouse creation was
also a challenging task, given the technical complexities that go into the
Extraction-Transformation-Loading (ETL) process. (Appendix A)
Communication with the Case Company was another limitation. Since
most of the research was conducted off-site far from the Case Company
location, day-to-day direct communication and access to the Case Company’s
environment were both extremely limited. The Case Company was visited three
times over ten months to gather periodic deliverables for the research. During
those visits, the company’s portal team and the research team met and
discussed future courses of actions. Otherwise, most of the communication was
carried out through e-mails and occasional phone/conference calls. Access to
general users was not an option.
Finally, this research was carried out amidst the regular academic
schedule and was to be completed in a definite time frame, which made this
research even more challenging.
5.4 FUTURE DIRECTIONS
In the future, it would be interesting to implement the changes
recommended and assess the user acceptance once the new features have been
incorporated into the portal.
150
It would also be exciting to study how the actual usage of the portal
changes after the recommendations are incorporated to determine if it
improves, deteriorates, or remains the same. This future research would be
easier to conduct than this initial study since dashboards and warehouses have
already been created and could be used to organize raw data from data logs
into valuable information about how the portal usage has changed.
Portals are an ever-growing field today, so the Industry Standards and
Best Practices will change continuously and this set of recommended employee
portal features may need to be revisited periodically.
Additional research is warranted to determine the reason for the
inconsistency between the actual industry adoption and theory research with
regards to the “Employee Self Service” information category. Further, different
methods of industry implementation for the information categories: “Help” and
“FAQ,” which could not be conducted in this paper due to the limited number
of available case studies, offers another opportunity for future research.
151
APPENDIX A
TECHNICAL DETAILS OF THE DATA WAREHOUSE IN SAP
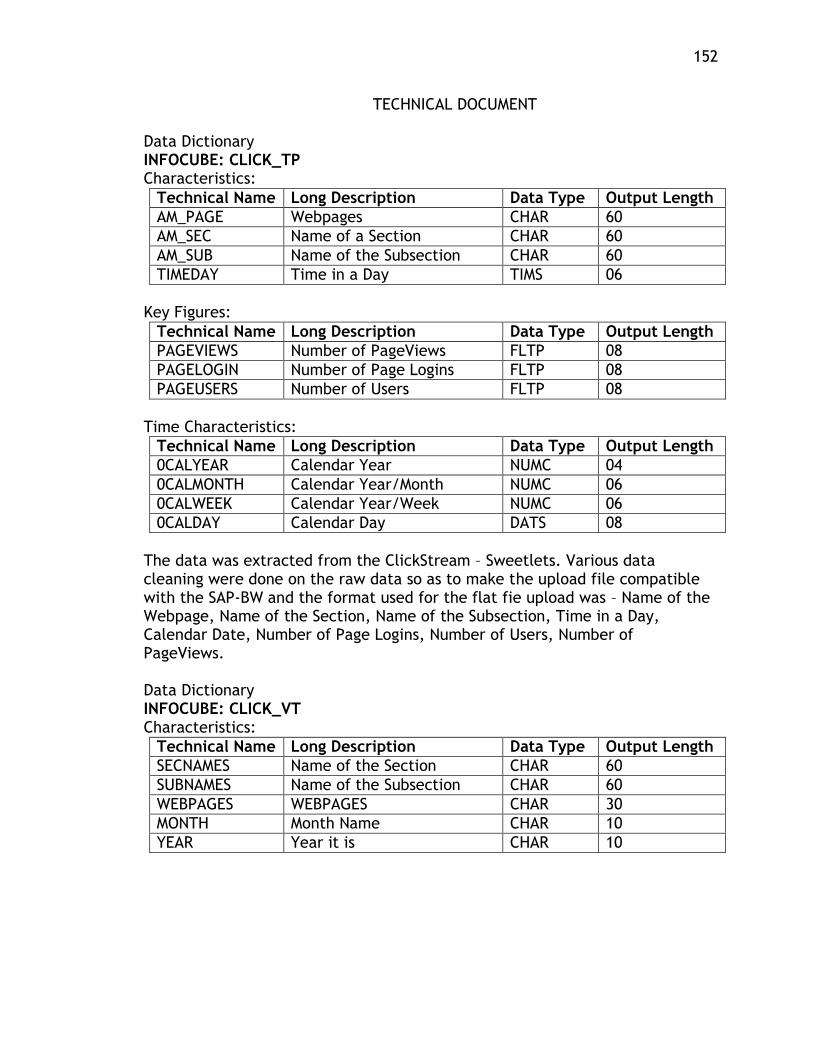
152
TECHNICAL DOCUMENT
Data Dictionary INFOCUBE: CLICK_TP Characteristics:
Technical Name Long Description Data Type Output Length
AM_PAGE Webpages CHAR 60
AM_SEC Name of a Section CHAR 60
AM_SUB Name of the Subsection CHAR 60
TIMEDAY Time in a Day TIMS 06
Key Figures:
Technical Name Long Description Data Type Output Length
PAGEVIEWS Number of PageViews FLTP 08
PAGELOGIN Number of Page Logins FLTP 08
PAGEUSERS Number of Users FLTP 08
Time Characteristics:
Technical Name Long Description Data Type Output Length
0CALYEAR Calendar Year NUMC 04
0CALMONTH Calendar Year/Month NUMC 06
0CALWEEK Calendar Year/Week NUMC 06
0CALDAY Calendar Day DATS 08
The data was extracted from the ClickStream – Sweetlets. Various data cleaning were done on the raw data so as to make the upload file compatible with the SAP-BW and the format used for the flat fie upload was – Name of the Webpage, Name of the Section, Name of the Subsection, Time in a Day, Calendar Date, Number of Page Logins, Number of Users, Number of PageViews. Data Dictionary INFOCUBE: CLICK_VT Characteristics:
Technical Name Long Description Data Type Output Length
SECNAMES Name of the Section CHAR 60
SUBNAMES Name of the Subsection CHAR 60
WEBPAGES WEBPAGES CHAR 30
MONTH Month Name CHAR 10
YEAR Year it is CHAR 10
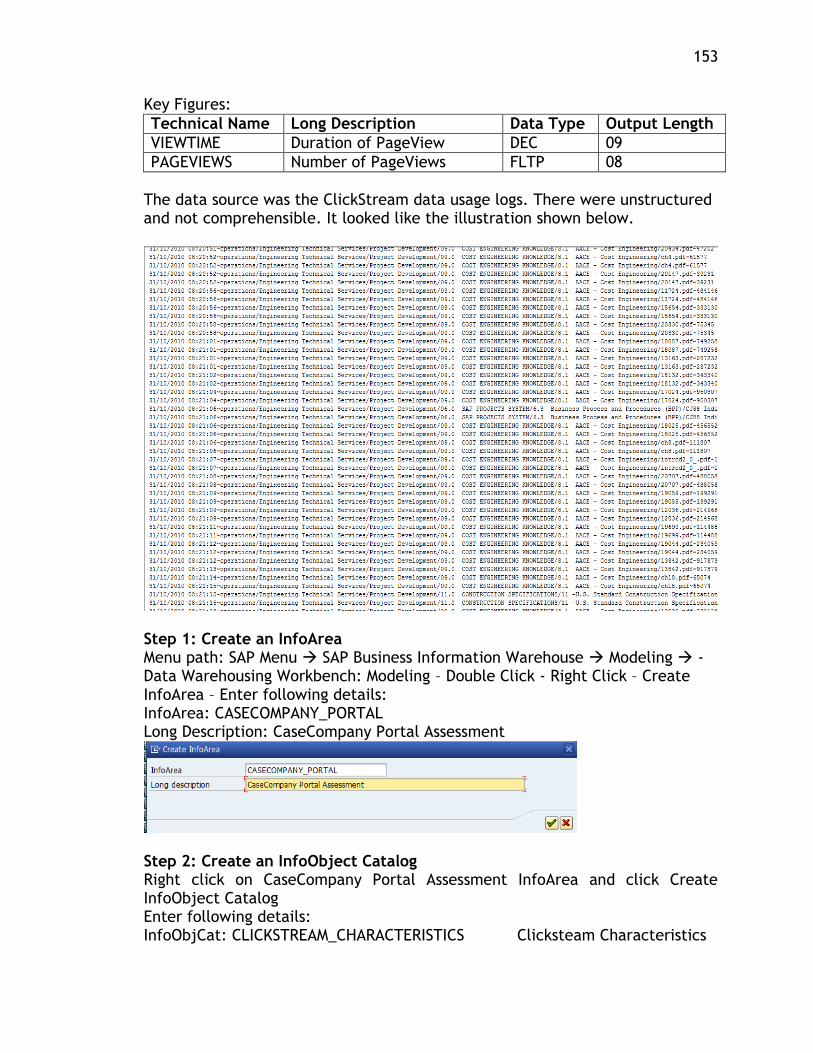
153
Key Figures:
Technical Name Long Description Data Type Output Length
VIEWTIME Duration of PageView DEC 09
PAGEVIEWS Number of PageViews FLTP 08
The data source was the ClickStream data usage logs. There were unstructured and not comprehensible. It looked like the illustration shown below.
Step 1: Create an InfoArea Menu path: SAP Menu SAP Business Information Warehouse Modeling - Data Warehousing Workbench: Modeling – Double Click - Right Click – Create InfoArea – Enter following details: InfoArea: CASECOMPANY_PORTAL Long Description: CaseCompany Portal Assessment
Step 2: Create an InfoObject Catalog Right click on CaseCompany Portal Assessment InfoArea and click Create InfoObject Catalog Enter following details: InfoObjCat: CLICKSTREAM_CHARACTERISTICS Clicksteam Characteristics
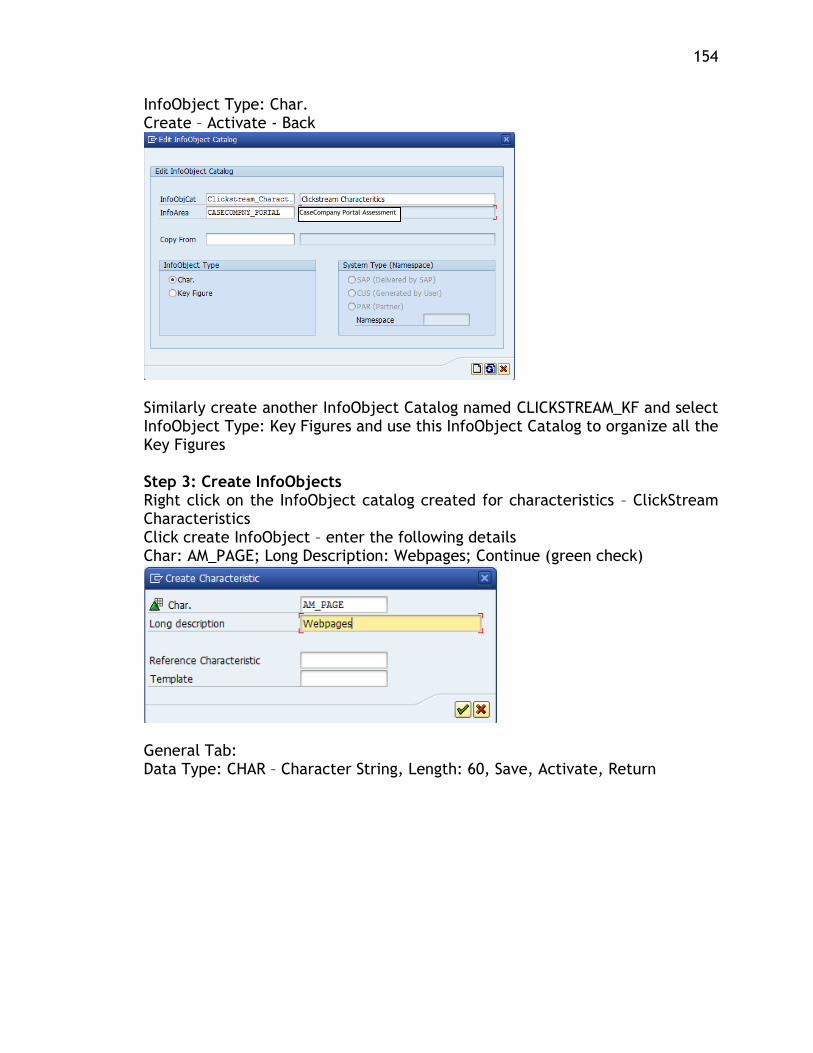
154
InfoObject Type: Char. Create – Activate - Back
Similarly create another InfoObject Catalog named CLICKSTREAM_KF and select InfoObject Type: Key Figures and use this InfoObject Catalog to organize all the Key Figures Step 3: Create InfoObjects Right click on the InfoObject catalog created for characteristics – ClickStream Characteristics Click create InfoObject – enter the following details Char: AM_PAGE; Long Description: Webpages; Continue (green check)
General Tab: Data Type: CHAR – Character String, Length: 60, Save, Activate, Return
CaseCompany Portal Assessment
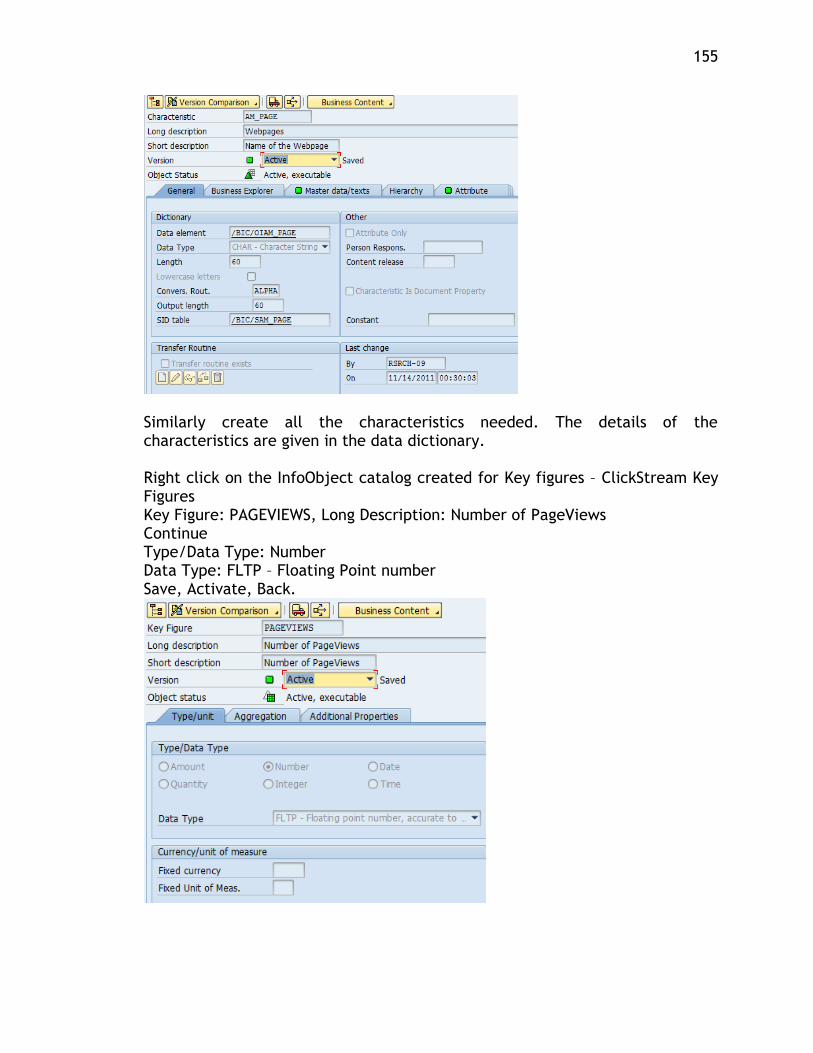
155
Similarly create all the characteristics needed. The details of the characteristics are given in the data dictionary. Right click on the InfoObject catalog created for Key figures – ClickStream Key Figures Key Figure: PAGEVIEWS, Long Description: Number of PageViews Continue Type/Data Type: Number Data Type: FLTP – Floating Point number Save, Activate, Back.
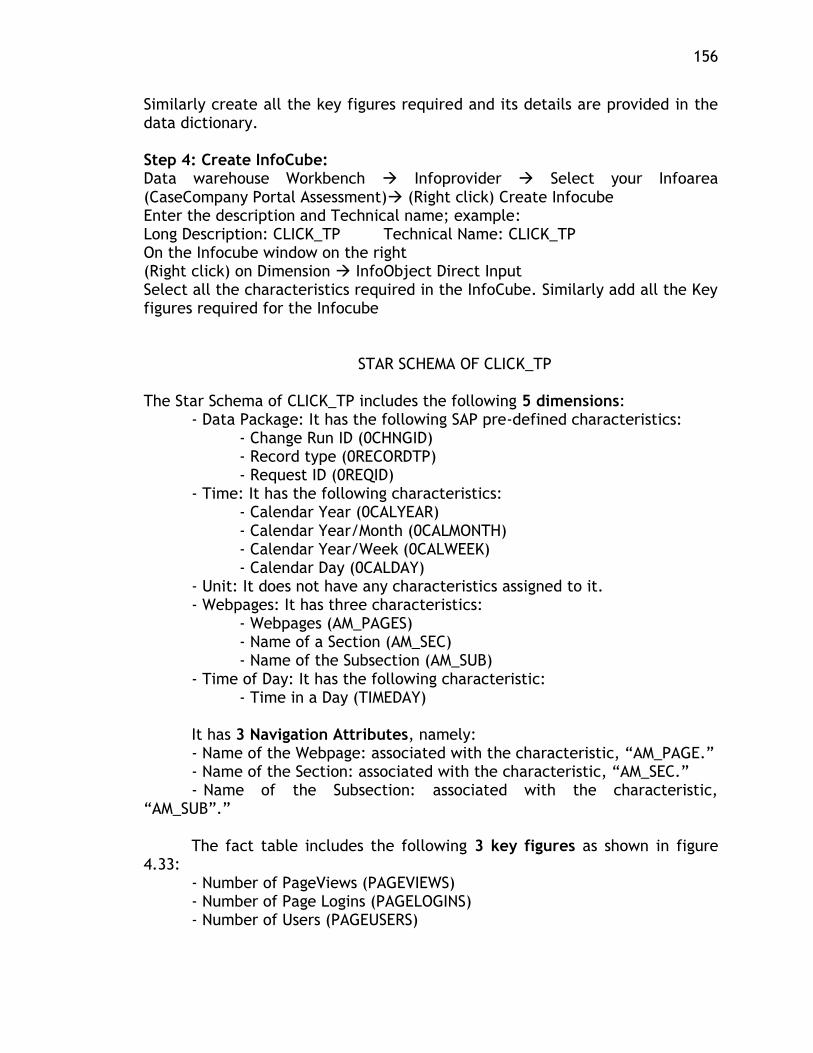
156
Similarly create all the key figures required and its details are provided in the data dictionary. Step 4: Create InfoCube: Data warehouse Workbench Infoprovider Select your Infoarea (CaseCompany Portal Assessment) (Right click) Create Infocube Enter the description and Technical name; example: Long Description: CLICK_TP Technical Name: CLICK_TP On the Infocube window on the right (Right click) on Dimension InfoObject Direct Input Select all the characteristics required in the InfoCube. Similarly add all the Key figures required for the Infocube
STAR SCHEMA OF CLICK_TP
The Star Schema of CLICK_TP includes the following 5 dimensions: - Data Package: It has the following SAP pre-defined characteristics: - Change Run ID (0CHNGID) - Record type (0RECORDTP) - Request ID (0REQID) - Time: It has the following characteristics: - Calendar Year (0CALYEAR) - Calendar Year/Month (0CALMONTH) - Calendar Year/Week (0CALWEEK) - Calendar Day (0CALDAY) - Unit: It does not have any characteristics assigned to it. - Webpages: It has three characteristics: - Webpages (AM_PAGES) - Name of a Section (AM_SEC) - Name of the Subsection (AM_SUB) - Time of Day: It has the following characteristic: - Time in a Day (TIMEDAY) It has 3 Navigation Attributes, namely: - Name of the Webpage: associated with the characteristic, “AM_PAGE.” - Name of the Section: associated with the characteristic, “AM_SEC.” - Name of the Subsection: associated with the characteristic,
“AM_SUB”.” The fact table includes the following 3 key figures as shown in figure
4.33: - Number of PageViews (PAGEVIEWS) - Number of Page Logins (PAGELOGINS) - Number of Users (PAGEUSERS)
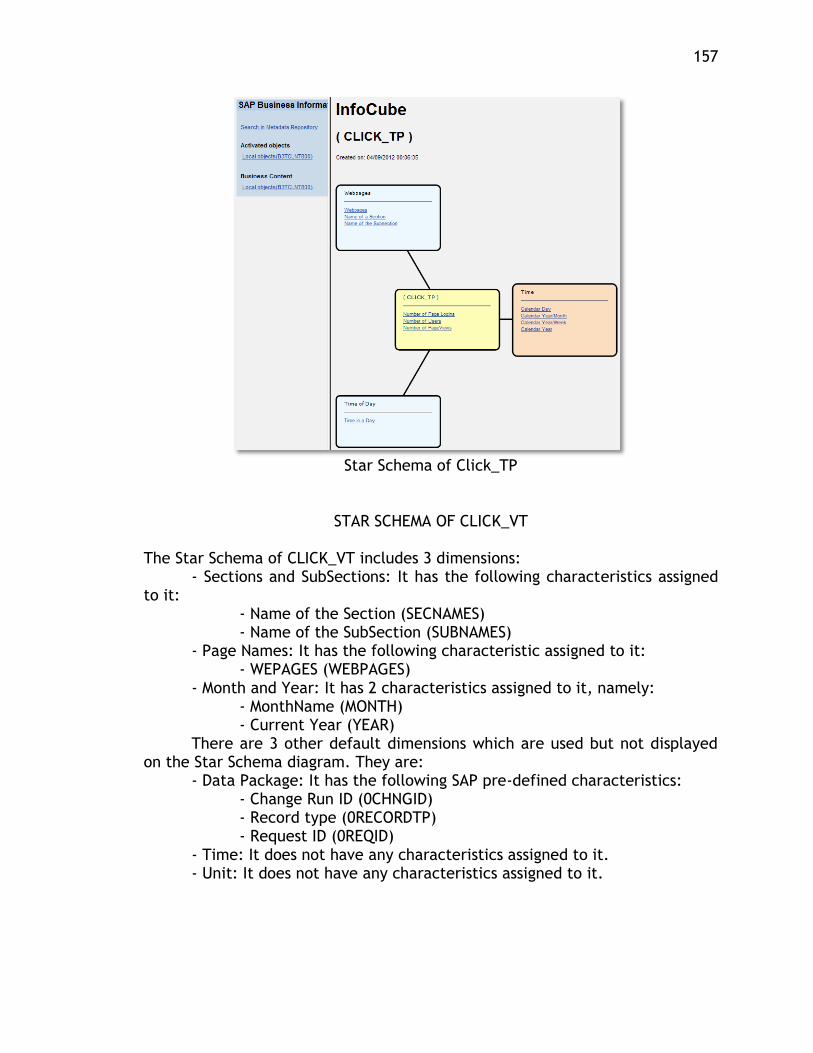
157
Star Schema of Click_TP
STAR SCHEMA OF CLICK_VT
The Star Schema of CLICK_VT includes 3 dimensions: - Sections and SubSections: It has the following characteristics assigned
to it: - Name of the Section (SECNAMES) - Name of the SubSection (SUBNAMES) - Page Names: It has the following characteristic assigned to it: - WEPAGES (WEBPAGES) - Month and Year: It has 2 characteristics assigned to it, namely: - MonthName (MONTH) - Current Year (YEAR) There are 3 other default dimensions which are used but not displayed
on the Star Schema diagram. They are: - Data Package: It has the following SAP pre-defined characteristics: - Change Run ID (0CHNGID) - Record type (0RECORDTP) - Request ID (0REQID) - Time: It does not have any characteristics assigned to it. - Unit: It does not have any characteristics assigned to it.
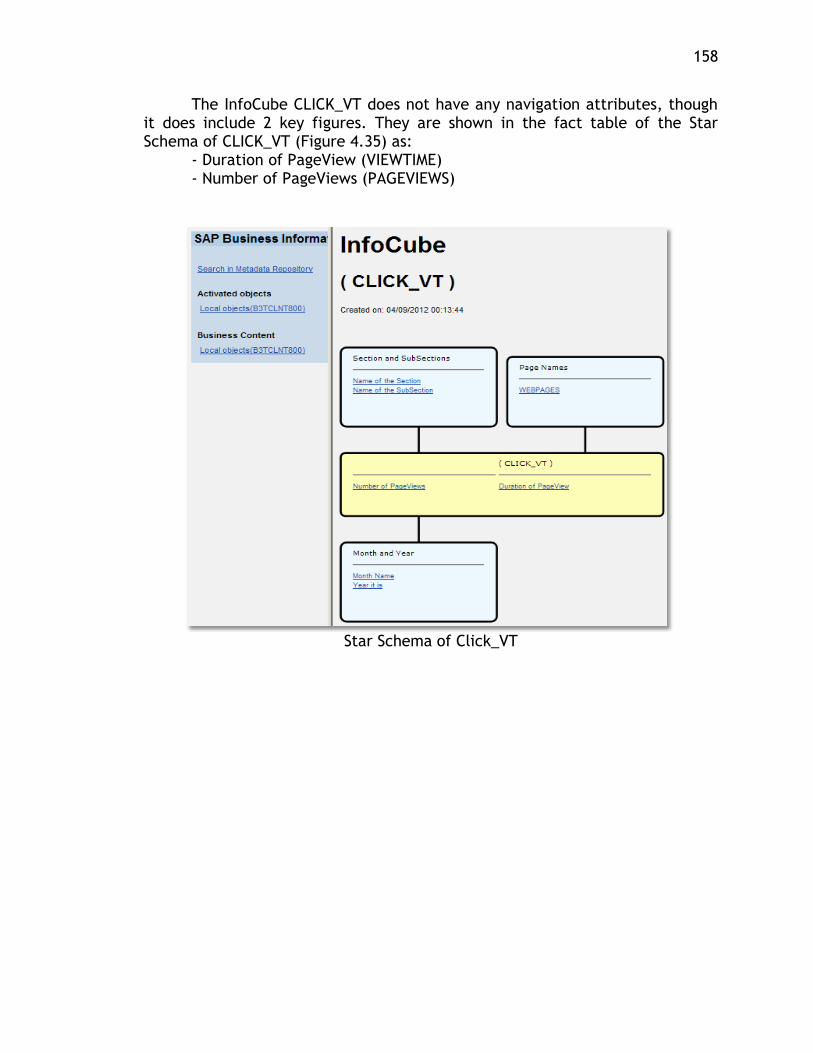
158
The InfoCube CLICK_VT does not have any navigation attributes, though it does include 2 key figures. They are shown in the fact table of the Star Schema of CLICK_VT (Figure 4.35) as:
- Duration of PageView (VIEWTIME) - Number of PageViews (PAGEVIEWS)
Star Schema of Click_VT
159
APPENDIX B
TECHNICAL DETAILS OF THE DASHBOARD MONITORING SYSTEM
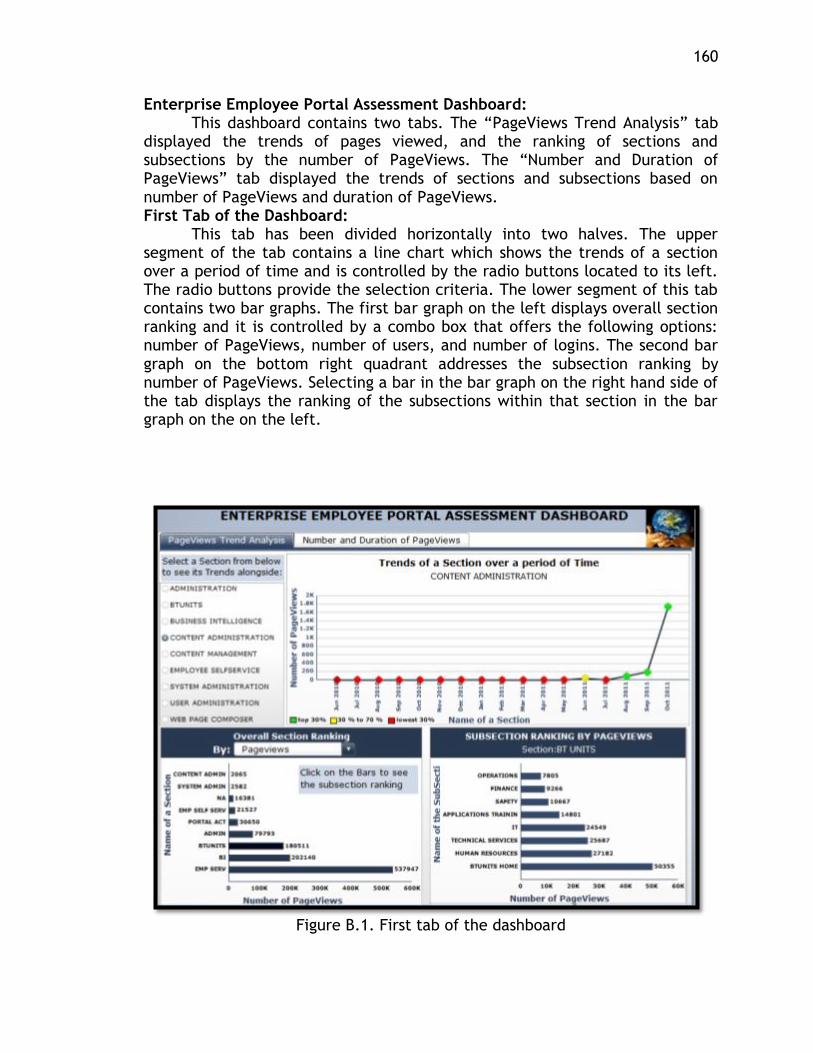
160
Enterprise Employee Portal Assessment Dashboard: This dashboard contains two tabs. The “PageViews Trend Analysis” tab
displayed the trends of pages viewed, and the ranking of sections and subsections by the number of PageViews. The “Number and Duration of PageViews” tab displayed the trends of sections and subsections based on number of PageViews and duration of PageViews. First Tab of the Dashboard:
This tab has been divided horizontally into two halves. The upper segment of the tab contains a line chart which shows the trends of a section over a period of time and is controlled by the radio buttons located to its left. The radio buttons provide the selection criteria. The lower segment of this tab contains two bar graphs. The first bar graph on the left displays overall section ranking and it is controlled by a combo box that offers the following options: number of PageViews, number of users, and number of logins. The second bar graph on the bottom right quadrant addresses the subsection ranking by number of PageViews. Selecting a bar in the bar graph on the right hand side of the tab displays the ranking of the subsections within that section in the bar graph on the on the left.
Figure B.1. First tab of the dashboard
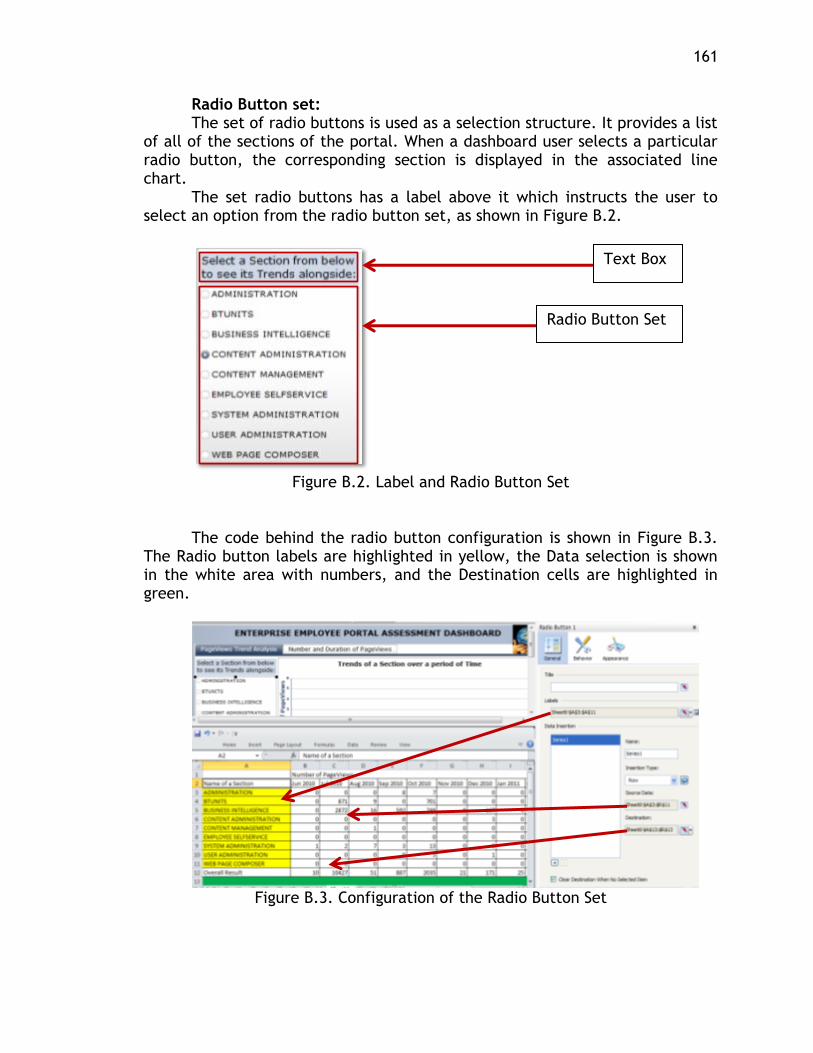
161
Radio Button set: The set of radio buttons is used as a selection structure. It provides a list
of all of the sections of the portal. When a dashboard user selects a particular radio button, the corresponding section is displayed in the associated line chart.
The set radio buttons has a label above it which instructs the user to select an option from the radio button set, as shown in Figure B.2.
Figure B.2. Label and Radio Button Set
The code behind the radio button configuration is shown in Figure B.3.
The Radio button labels are highlighted in yellow, the Data selection is shown in the white area with numbers, and the Destination cells are highlighted in green.
Figure B.3. Configuration of the Radio Button Set
Text Box
Radio Button Set
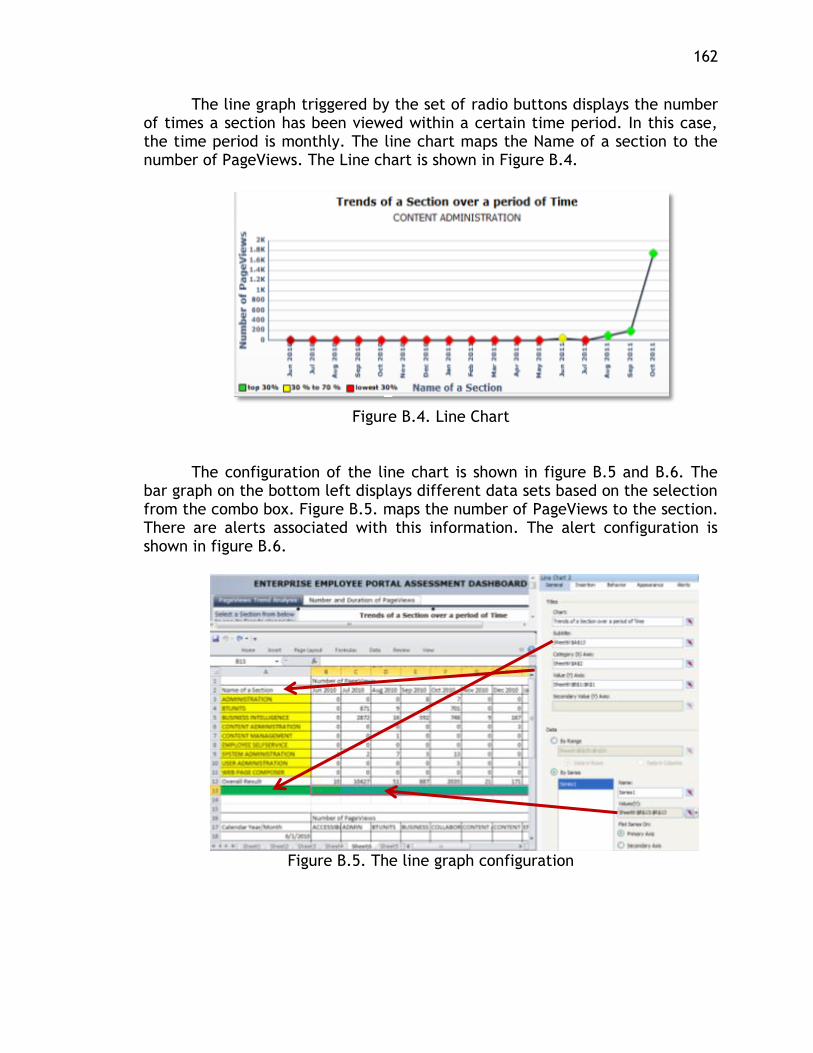
162
The line graph triggered by the set of radio buttons displays the number of times a section has been viewed within a certain time period. In this case, the time period is monthly. The line chart maps the Name of a section to the number of PageViews. The Line chart is shown in Figure B.4.
Figure B.4. Line Chart
The configuration of the line chart is shown in figure B.5 and B.6. The
bar graph on the bottom left displays different data sets based on the selection from the combo box. Figure B.5. maps the number of PageViews to the section. There are alerts associated with this information. The alert configuration is shown in figure B.6.
Figure B.5. The line graph configuration
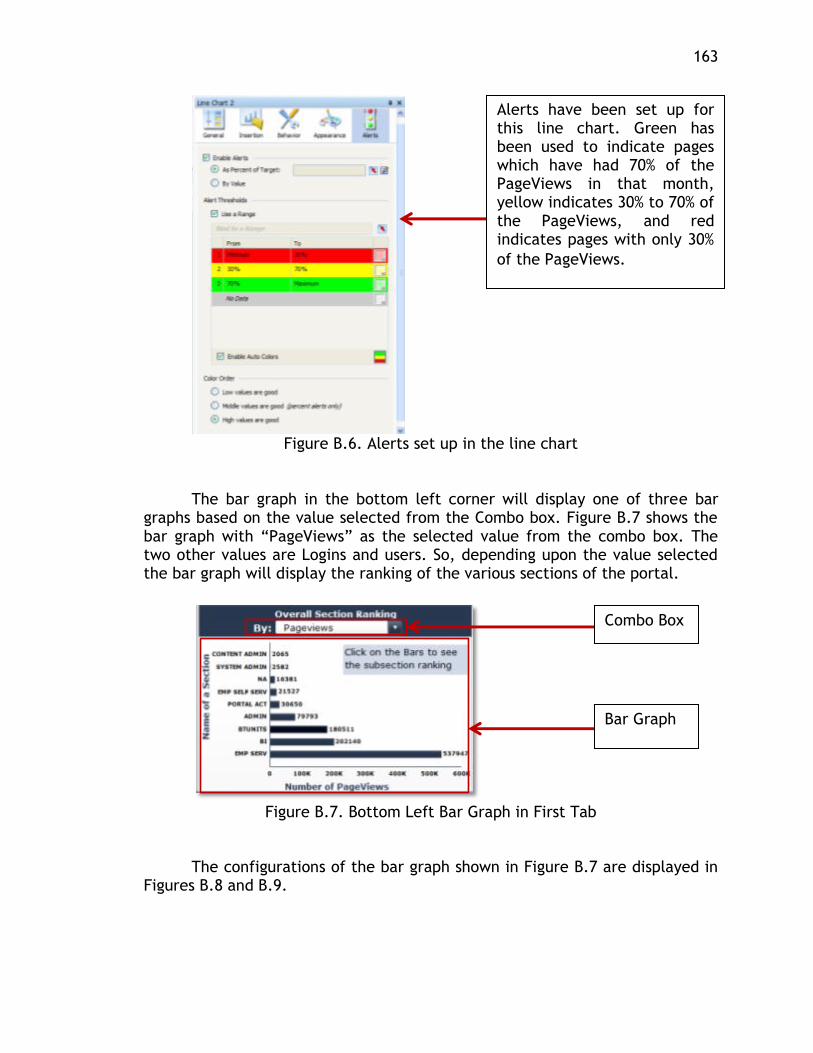
163
Figure B.6. Alerts set up in the line chart
The bar graph in the bottom left corner will display one of three bar
graphs based on the value selected from the Combo box. Figure B.7 shows the bar graph with “PageViews” as the selected value from the combo box. The two other values are Logins and users. So, depending upon the value selected the bar graph will display the ranking of the various sections of the portal.
Figure B.7. Bottom Left Bar Graph in First Tab
The configurations of the bar graph shown in Figure B.7 are displayed in Figures B.8 and B.9.
Alerts have been set up for this line chart. Green has been used to indicate pages which have had 70% of the PageViews in that month, yellow indicates 30% to 70% of the PageViews, and red indicates pages with only 30%
of the PageViews.
Combo Box
Bar Graph
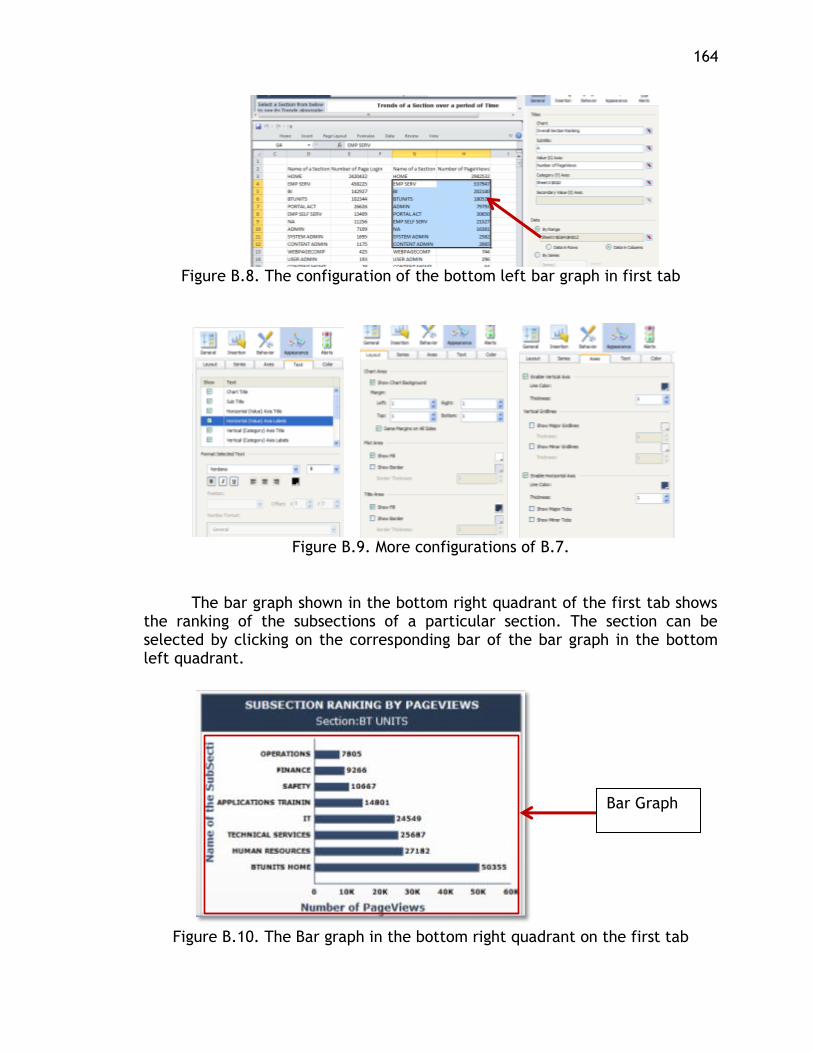
164
Figure B.8. The configuration of the bottom left bar graph in first tab
Figure B.9. More configurations of B.7.
The bar graph shown in the bottom right quadrant of the first tab shows
the ranking of the subsections of a particular section. The section can be selected by clicking on the corresponding bar of the bar graph in the bottom left quadrant.
Figure B.10. The Bar graph in the bottom right quadrant on the first tab
Bar Graph
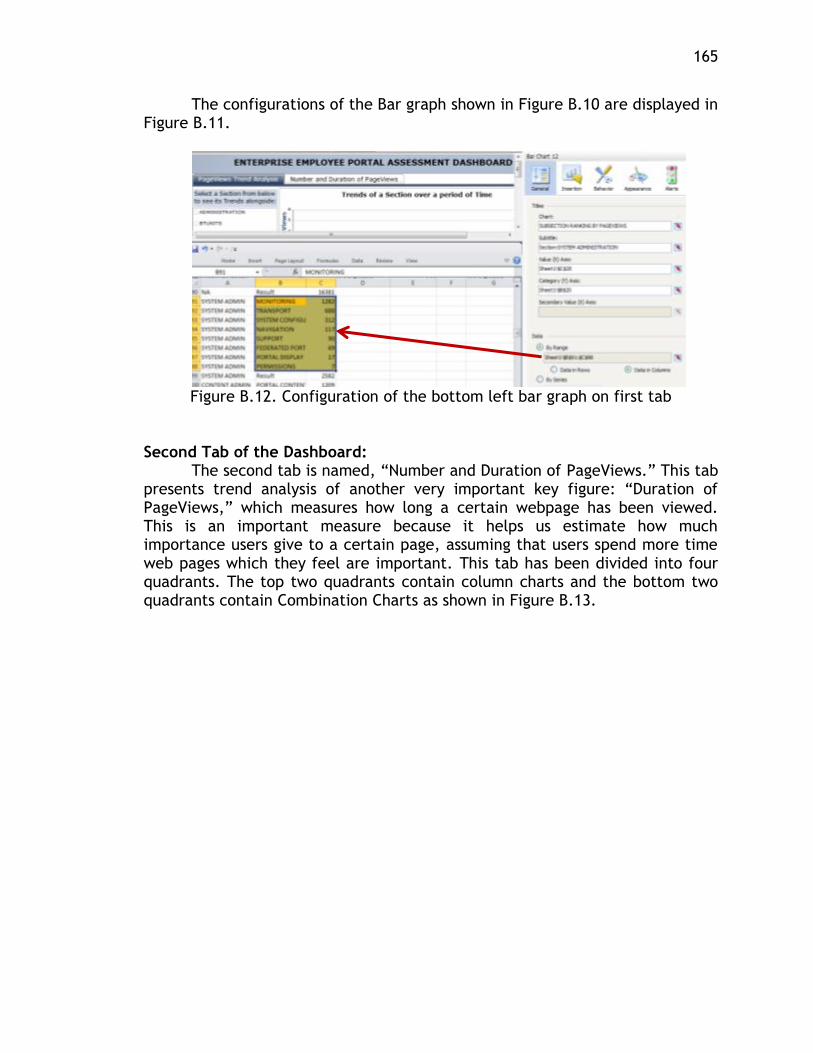
165
The configurations of the Bar graph shown in Figure B.10 are displayed in Figure B.11.
Figure B.12. Configuration of the bottom left bar graph on first tab
Second Tab of the Dashboard:
The second tab is named, “Number and Duration of PageViews.” This tab presents trend analysis of another very important key figure: “Duration of PageViews,” which measures how long a certain webpage has been viewed. This is an important measure because it helps us estimate how much importance users give to a certain page, assuming that users spend more time web pages which they feel are important. This tab has been divided into four quadrants. The top two quadrants contain column charts and the bottom two quadrants contain Combination Charts as shown in Figure B.13.
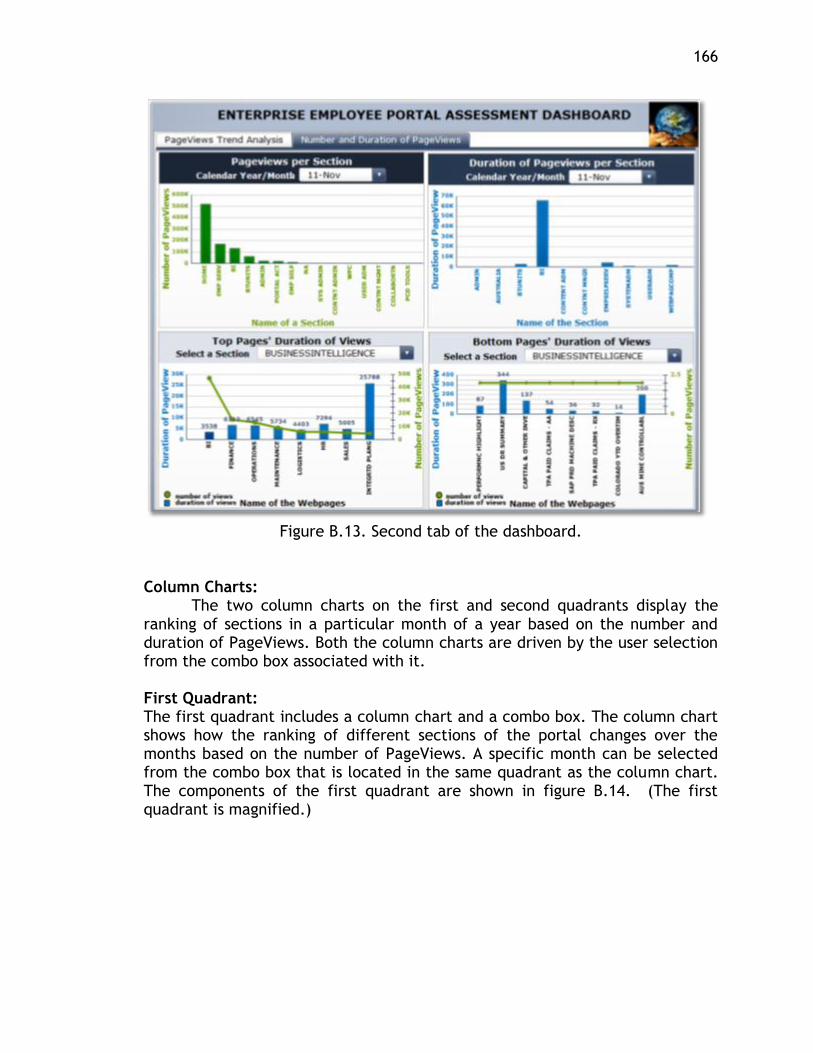
166
Figure B.13. Second tab of the dashboard.
Column Charts:
The two column charts on the first and second quadrants display the ranking of sections in a particular month of a year based on the number and duration of PageViews. Both the column charts are driven by the user selection from the combo box associated with it.
First Quadrant: The first quadrant includes a column chart and a combo box. The column chart shows how the ranking of different sections of the portal changes over the months based on the number of PageViews. A specific month can be selected from the combo box that is located in the same quadrant as the column chart. The components of the first quadrant are shown in figure B.14. (The first quadrant is magnified.)
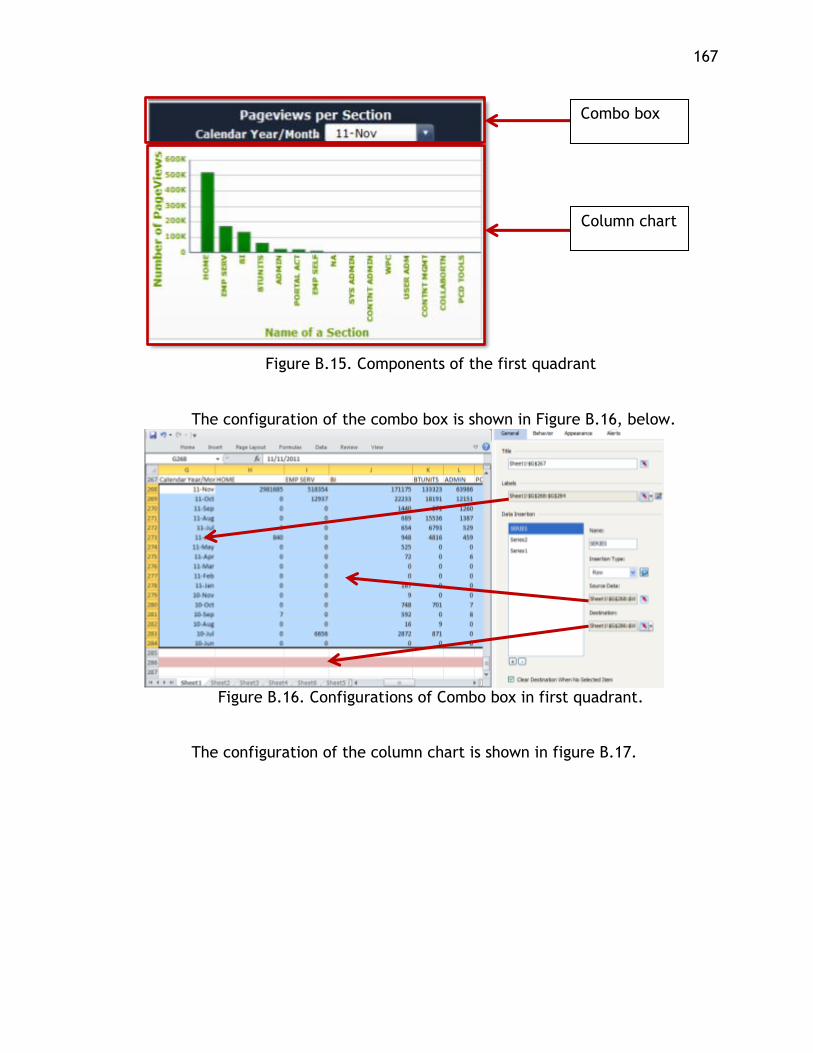
167
Figure B.15. Components of the first quadrant
The configuration of the combo box is shown in Figure B.16, below.
Figure B.16. Configurations of Combo box in first quadrant.
The configuration of the column chart is shown in figure B.17.
Column chart
Combo box
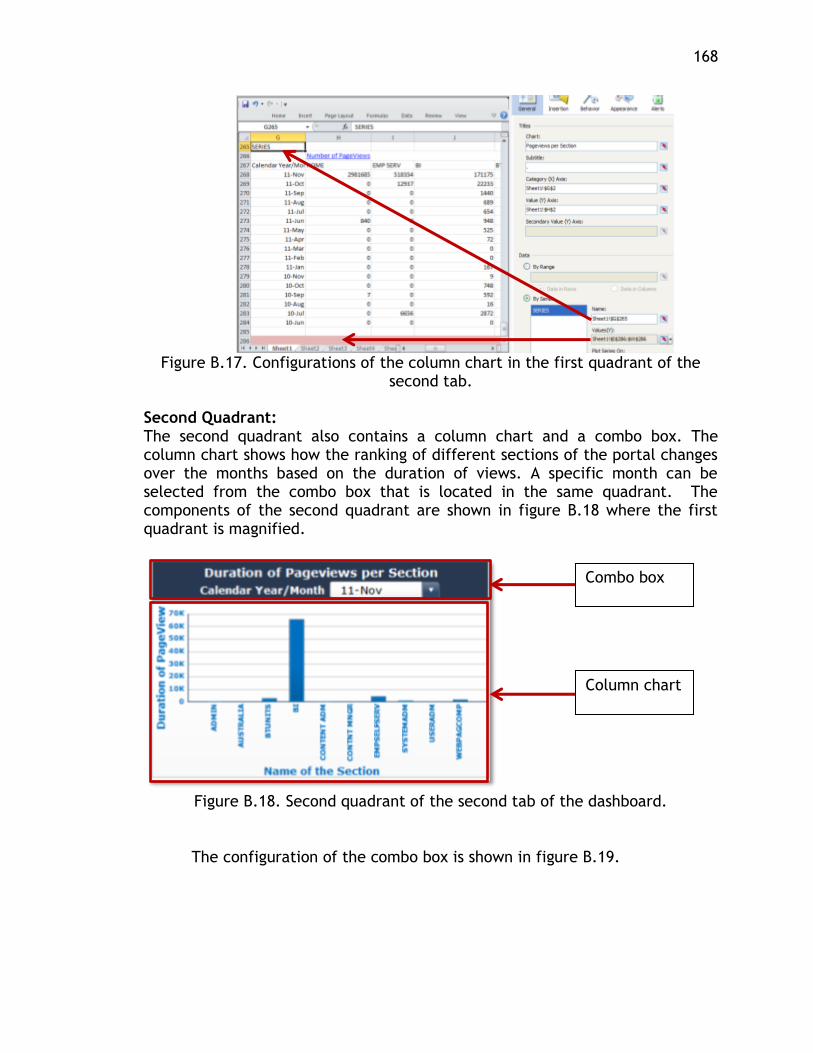
168
Figure B.17. Configurations of the column chart in the first quadrant of the
second tab. Second Quadrant: The second quadrant also contains a column chart and a combo box. The column chart shows how the ranking of different sections of the portal changes over the months based on the duration of views. A specific month can be selected from the combo box that is located in the same quadrant. The components of the second quadrant are shown in figure B.18 where the first quadrant is magnified.
Figure B.18. Second quadrant of the second tab of the dashboard.
The configuration of the combo box is shown in figure B.19.
Column chart
Combo box
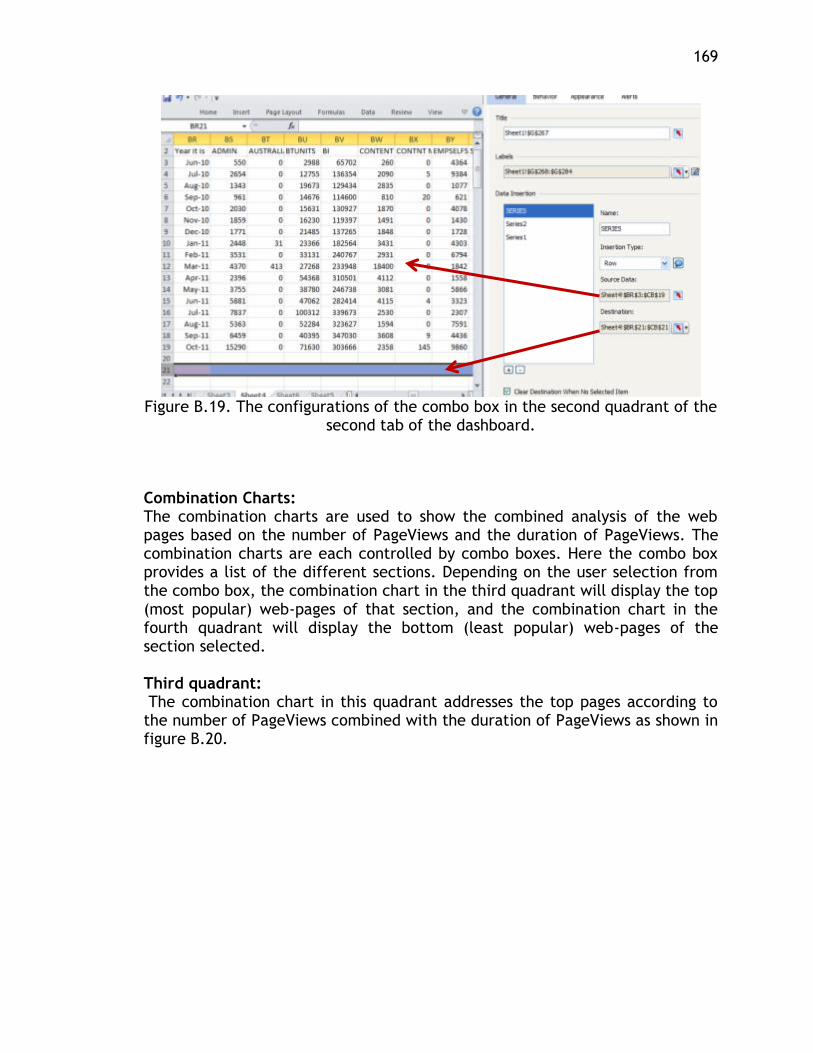
169
Figure B.19. The configurations of the combo box in the second quadrant of the
second tab of the dashboard.
Combination Charts: The combination charts are used to show the combined analysis of the web pages based on the number of PageViews and the duration of PageViews. The combination charts are each controlled by combo boxes. Here the combo box provides a list of the different sections. Depending on the user selection from the combo box, the combination chart in the third quadrant will display the top (most popular) web-pages of that section, and the combination chart in the fourth quadrant will display the bottom (least popular) web-pages of the section selected. Third quadrant: The combination chart in this quadrant addresses the top pages according to the number of PageViews combined with the duration of PageViews as shown in figure B.20.
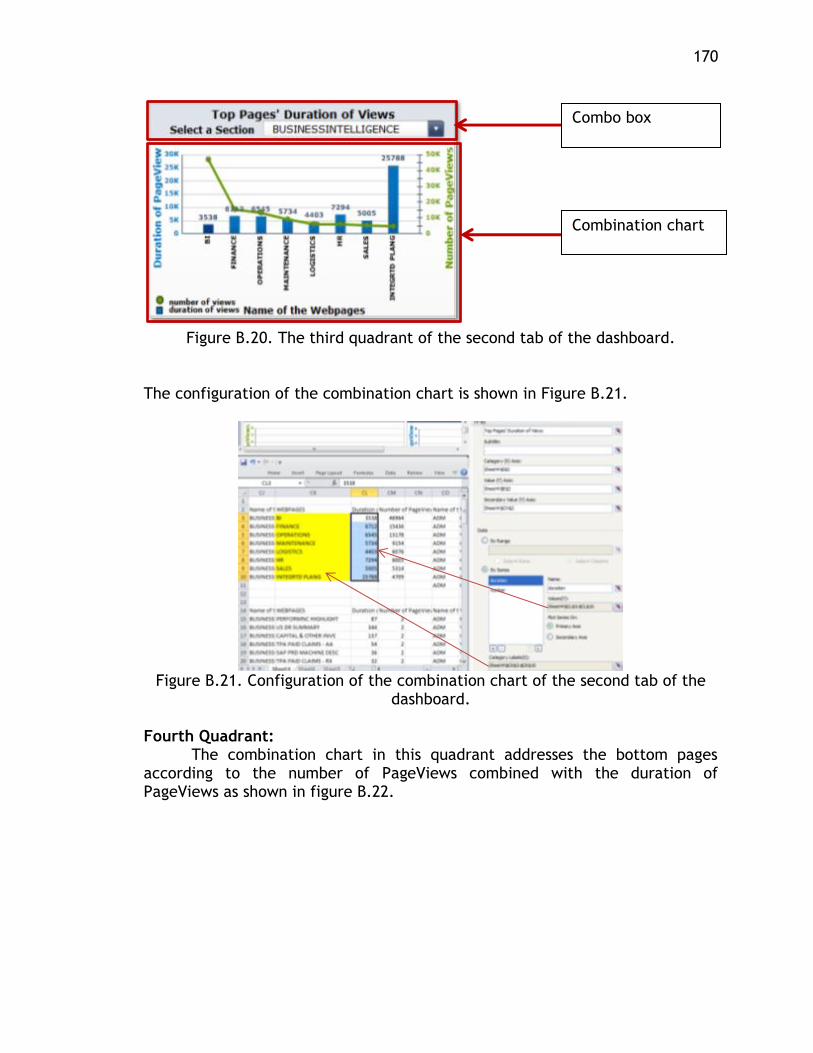
170
Figure B.20. The third quadrant of the second tab of the dashboard.
The configuration of the combination chart is shown in Figure B.21.
Figure B.21. Configuration of the combination chart of the second tab of the
dashboard. Fourth Quadrant:
The combination chart in this quadrant addresses the bottom pages according to the number of PageViews combined with the duration of PageViews as shown in figure B.22.
Combination chart
Combo box
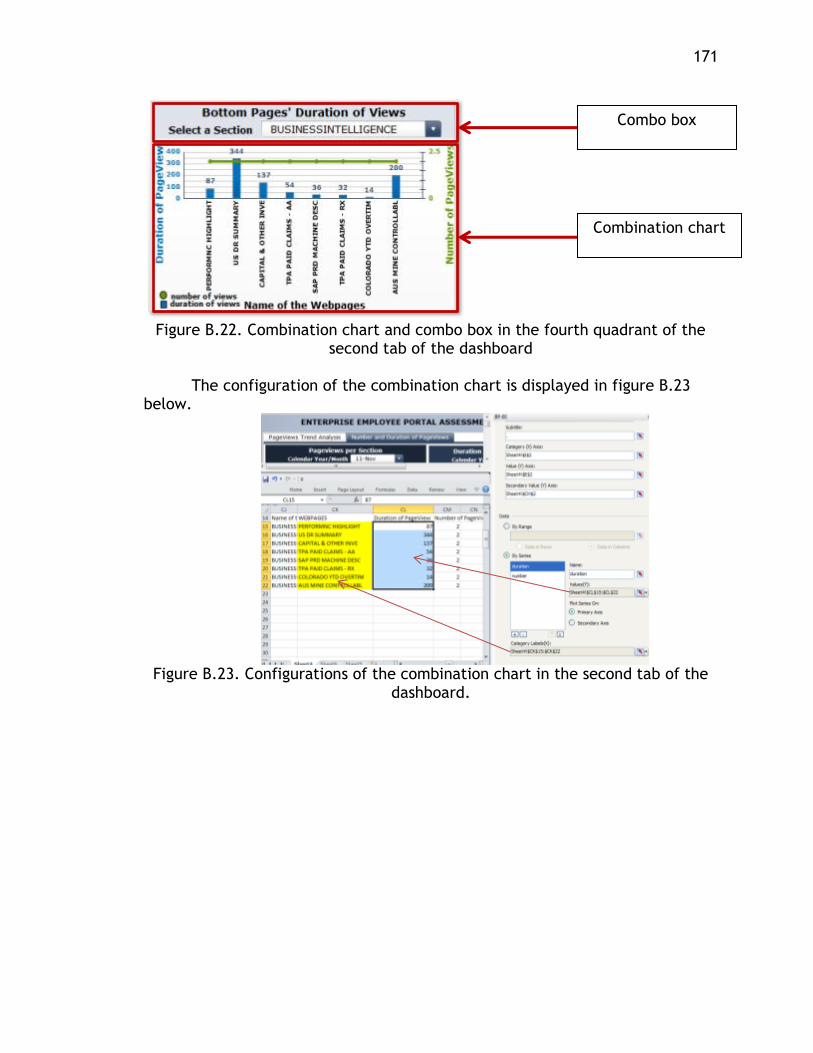
171
Figure B.22. Combination chart and combo box in the fourth quadrant of the
second tab of the dashboard
The configuration of the combination chart is displayed in figure B.23 below.
Figure B.23. Configurations of the combination chart in the second tab of the
dashboard.
Combination chart
chart
Combo box
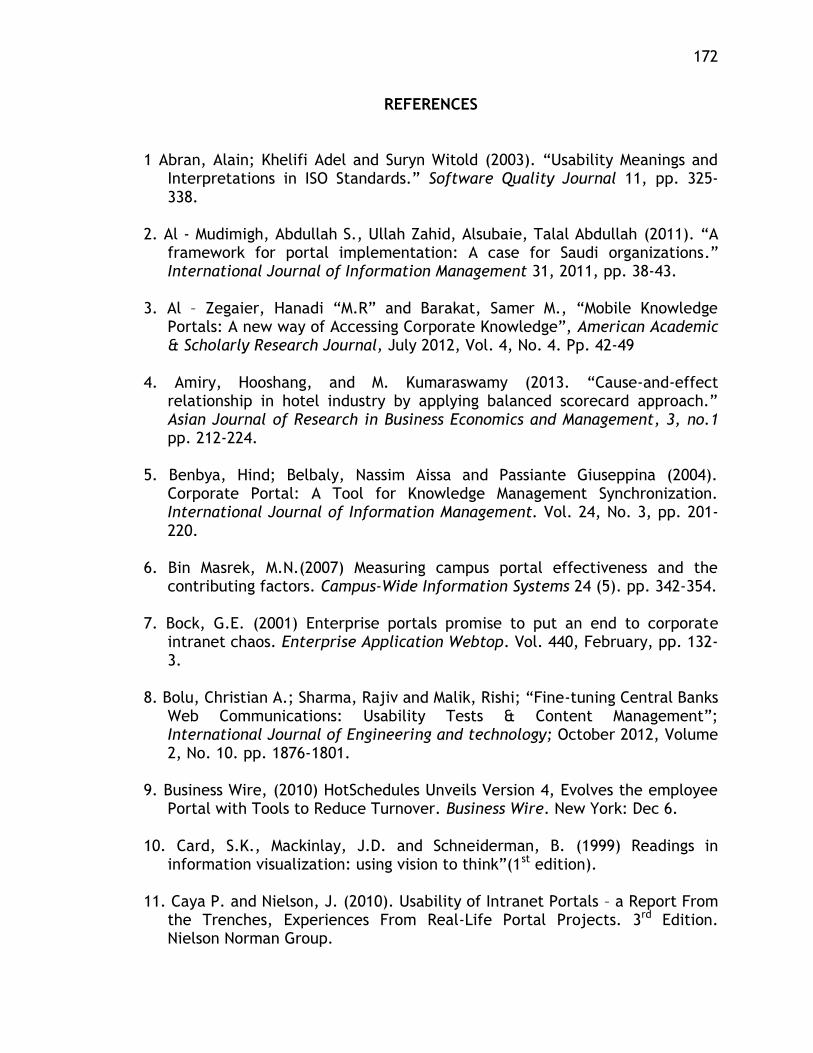
172
REFERENCES
1 Abran, Alain; Khelifi Adel and Suryn Witold (2003). “Usability Meanings and
Interpretations in ISO Standards.” Software Quality Journal 11, pp. 325-338.
2. Al - Mudimigh, Abdullah S., Ullah Zahid, Alsubaie, Talal Abdullah (2011). “A
framework for portal implementation: A case for Saudi organizations.” International Journal of Information Management 31, 2011, pp. 38-43.
3. Al – Zegaier, Hanadi “M.R” and Barakat, Samer M., “Mobile Knowledge
Portals: A new way of Accessing Corporate Knowledge”, American Academic & Scholarly Research Journal, July 2012, Vol. 4, No. 4. Pp. 42-49
4. Amiry, Hooshang, and M. Kumaraswamy (2013. “Cause-and-effect
relationship in hotel industry by applying balanced scorecard approach.” Asian Journal of Research in Business Economics and Management, 3, no.1 pp. 212-224.
5. Benbya, Hind; Belbaly, Nassim Aissa and Passiante Giuseppina (2004).
Corporate Portal: A Tool for Knowledge Management Synchronization. International Journal of Information Management. Vol. 24, No. 3, pp. 201-220.
6. Bin Masrek, M.N.(2007) Measuring campus portal effectiveness and the
contributing factors. Campus-Wide Information Systems 24 (5). pp. 342-354. 7. Bock, G.E. (2001) Enterprise portals promise to put an end to corporate
intranet chaos. Enterprise Application Webtop. Vol. 440, February, pp. 132-3.
8. Bolu, Christian A.; Sharma, Rajiv and Malik, Rishi; “Fine-tuning Central Banks
Web Communications: Usability Tests & Content Management”; International Journal of Engineering and technology; October 2012, Volume 2, No. 10. pp. 1876-1801.
9. Business Wire, (2010) HotSchedules Unveils Version 4, Evolves the employee
Portal with Tools to Reduce Turnover. Business Wire. New York: Dec 6. 10. Card, S.K., Mackinlay, J.D. and Schneiderman, B. (1999) Readings in
information visualization: using vision to think”(1st edition). 11. Caya P. and Nielson, J. (2010). Usability of Intranet Portals – a Report From
the Trenches, Experiences From Real-Life Portal Projects. 3rd Edition. Nielson Norman Group.
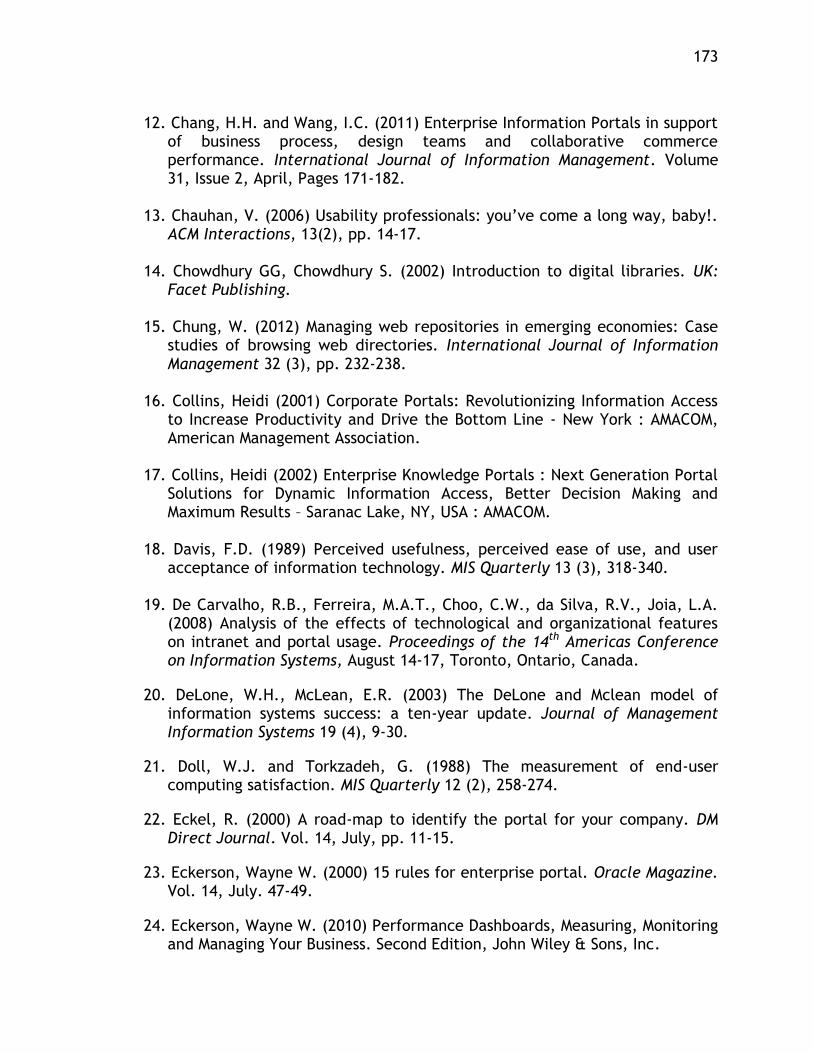
173
12. Chang, H.H. and Wang, I.C. (2011) Enterprise Information Portals in support
of business process, design teams and collaborative commerce performance. International Journal of Information Management. Volume 31, Issue 2, April, Pages 171-182.
13. Chauhan, V. (2006) Usability professionals: you’ve come a long way, baby!.
ACM Interactions, 13(2), pp. 14-17. 14. Chowdhury GG, Chowdhury S. (2002) Introduction to digital libraries. UK:
Facet Publishing. 15. Chung, W. (2012) Managing web repositories in emerging economies: Case
studies of browsing web directories. International Journal of Information Management 32 (3), pp. 232-238.
16. Collins, Heidi (2001) Corporate Portals: Revolutionizing Information Access
to Increase Productivity and Drive the Bottom Line - New York : AMACOM, American Management Association.
17. Collins, Heidi (2002) Enterprise Knowledge Portals : Next Generation Portal
Solutions for Dynamic Information Access, Better Decision Making and Maximum Results – Saranac Lake, NY, USA : AMACOM.
18. Davis, F.D. (1989) Perceived usefulness, perceived ease of use, and user
acceptance of information technology. MIS Quarterly 13 (3), 318-340. 19. De Carvalho, R.B., Ferreira, M.A.T., Choo, C.W., da Silva, R.V., Joia, L.A.
(2008) Analysis of the effects of technological and organizational features on intranet and portal usage. Proceedings of the 14th Americas Conference on Information Systems, August 14-17, Toronto, Ontario, Canada.
20. DeLone, W.H., McLean, E.R. (2003) The DeLone and Mclean model of information systems success: a ten-year update. Journal of Management Information Systems 19 (4), 9-30.
21. Doll, W.J. and Torkzadeh, G. (1988) The measurement of end-user computing satisfaction. MIS Quarterly 12 (2), 258-274.
22. Eckel, R. (2000) A road-map to identify the portal for your company. DM Direct Journal. Vol. 14, July, pp. 11-15.
23. Eckerson, Wayne W. (2000) 15 rules for enterprise portal. Oracle Magazine. Vol. 14, July. 47-49.
24. Eckerson, Wayne W. (2010) Performance Dashboards, Measuring, Monitoring and Managing Your Business. Second Edition, John Wiley & Sons, Inc.
174
25. Few, S. (2006) Information dashboard design, the effective visual communication of data. O'Reilly Media, Inc., First Edition.
26. Franceschini, F; Galetto, M; Turina, E. “Techniques for impact evaluation of performance measurement systems.”The International Journal of Quality & Reliability Management, 30, 2. 2013, pp. 197-220.
27. Gates, H. (2001) Professional services automation: the next generation of project management. Enterprise Systems Journal. Vol. 101, January. Pp. 47-49.
28. Grudin, Jonathan. (2005) Three-faces of Human-Computer Interaction. IEEE Annals of the History of Computing. Pp. 46-62.
29. Hanoa, E. (2009) Brain Gain. Accountancy Age. 21.
30. Hazra, Tushar K. (2002) Building Enterprise Portals: Principles to Practice. [Conference] Proceedings of the 24th international Conference on Software Engineering - Orlando, Florida : ACM, New York, NY, pp. 623-633.
31. Hertzum, M., (2010) Images of usability, International Journal of Human-Computer Interaction. 26(2), pp. 567-600.
32. Hertzum, Morten and Clemmenson, Torkil (2012). How do usability professionals construe usability?” International Journal of Human-Computer Studies. Volume 70, Issue 1, January, pp. 26-42.
33. Hertzum, M. Clemmenson, T. Hornbaek, K. Kumar J. Shi, Q. Yammiyavar, P. (2011). Personal usability constructs: how people construe usability across nationalities and stakeholder groups. International Journal of Human-Computer Interaction. 27(8), pp. 729-761.
34. Hub, Miloslav and Zatloukal, Michal (2010). Model of Usability. WEAS Transactions on Information Science and Applications. Issue 4, Volume 7, April, pp. 521-533.
35. Hussein, F., Masrek, M.N., Karim, N.S.A. (2008). “The utilization and effectiveness of intranet: a case study at selected Malaysian organizations”; Communications of the IBIMA 4, pp. 200-206.
36. Hustad, Eli and Bechina, Aurilla Aurelie (2012). “Exploring the Role of Boundary Spanning in Distributed Networks of Knowlwdge”; Electronic Journal of Knowledge Management;, Volume 10, Issue 2.
37. Jacoby, Grant A., Luqi, A; “Intranet Model and Metrics”; Communications of The ACM, February 2007, Vol. 50, No. 2, pp: 43-50.
175
38. Jafari, Ali (2003) “Designing Portals: Opportunities and Challenges”; IRM Press.
39. Kaplan, Robert S., and David P. Norton (2008). "Mastering the management system."harvard business review 86, no. 1. p. 62.
40. Kastel, B. (2003). Enterprise portals: For the business & IT professional. Sarasota, FL: Competitive Edge International., Sarasota, FL.
41. Kendler, P.B. (2000) Portals customize information access. Insurance & Technology. Vol. 25, October, pp. 47-51.
42. Madle, Gadle; Berger, Anouk; Cognat, Sebastien; Menna, Sylvio and Kostkova, Patty. (2009) User Information seeking behavior: Perceptions and reality. An evaluation of the WHO Lab resources Internet portal. Informatics for health & Social Care. January; 34(1), pp. 30-38.
43. Miller, A. and Cioffi, J.(2004) Measuring marketing effectiveness and value: The Unisys marketing dashboard. Journal of Advertising Research. Volume 44, Issue 3, September, pp. 237-243.
44. Pauwels, K., Ambler, T., Bruce, H.C., LaPointe P., Reibstein, D., Skiera, B. (2009) Dashboards as a service: why, what, how, and what research is needed? Journal of Service Research. Volume 12, Issue 2, November, pp. 175-189.
45. Phifer, Gene (2011) Key Issues for Web Computing. Gartner Research, 15 March, pp. 2-8.
46. Raol, Jaydip M. ;Koong, Kai S.;Liu, Lai C.; Yu, Chun S.. “An identification and classification of enterprise portal functions and features.” Industrial Management & Data Systems. Vol. 103 Iss: 9, 2003, pp. 693 – 702.
47. Rapoza, J. (2000) Portals: poles apart - time to benefit, extensibility are biggest differentiators. eWeek. Vol. 5, May. pp. 69-73.
48. Remus, U. (2006) Critical Success Factors of Implementing Enterprise Portals. IEEE 39th Hawaii International Conference on System Sciences, 182a.
49. Saracevic T. (2000). Digital library evaluation: towards an evolution of concepts. Library Trends 49, pp. 350–369.
50. Scheepers, R. “A conceptual framework for the implementation of enterprise information portals in large organizations,” European Journal of Information Systems 15 (6), pp 635-647.
176
51. Schulte, M.F. (2006). Business Objects Dashboards Manager, DM Rev, Volume 16, Issue 2, 49.
52. Shutibhinyo, Wasatorn. “Balanced Scorecard Attributes: Key Determinant and Perceived Benefits.” Global Journal of Business Research, Volume 7, Number 2. 2013. pp. 1-8.
53. Stevens, R.H. , Saint-Germes, J. (2010) Knowledge management: Using feedback from performance metrics to improve strategic and tactical plans. International Journal of Knowledge, Culture and Change Management. Volume 10, Issue 1, pp. 441-454.
54. Succendran, K M; Saravanam, R; Sarukesi, K; “Embedding Knowledge in HR Process”; IEEE – International Conference On Advances In Engineering, Science And Management (ICAESM – 2012), March 30, 31, 2012.
55. Sugianto, Ly-Fie and Tojib, Dewi Rooslani et al. (2006). Modeling User satisfaction with an Employee Portal. International Journal of Business and Information. December, Volume I, No. 2. pp. 239-255.
56. Sugianto, Ly-Fie., Tojib, Dewi Rooslani et al., Burnstein, F. (2007) A practical measure of employee satisfaction with B2E portals. Proceedings of the 28th International Conference on Information Systems. December 9-12, Montreal, Quebec, Canada.
57. Sullivan, D. (2004). Proven Portals: Best Practices for Planning, Designing, and Developing Enterprise Portals. Addison-Wesley Information Technology Series.
58. Sutherland, Lisa A.; Wildemuth, Barbara; Campbell, Marci; Haines, Pamela S. (2005). Unraveling the Web: An evaluation of the content quality, usability, and readability of nutrition Web sites. Journal of Nutrition Education and Behavior. Vol. 37(6), Nov-Dec, pp. 300-305.
59. Tojib, Dewi Rooslani, Ly-Fie Sugianto, and Sen Sendjaya. "User satisfaction with business-to-employee portals: conceptualization and scale development."European Journal of Information Systems 17, no. 6 (2008): pp. 649-667.
60. Urbach, Nils; Smolnik, Stefan; Riempp Gerold (2010).An Empirical investigation of employee portal success. The Journal of Strategic Information Systems. Vol. 19, Issue 3, September, pp. 184-206.
61. Valdes et al. (2010) Hype Cycle for Web and User Interaction Technologies, 2010. Gartner Research. pp. 1-10.
62. White, M. (2000). Corporate portal: realizing their promises, avoiding costly failure. Business Information Review. 17(12), pp. 71-81.
177
63. White, C.(2003). Determining Enterprise Portal ROI. DM Review. pp. 390-399.
64. Wunsche, B. (2004). A survey, classification and analysis of perceptual concepts and their application for the effective visualization of complex information. Proceedings of the 2004 Australasian symposium on Information Visualization, Australian Computer Society, Inc. Darlinghurst, Australia, pp. 17-24.
65. Yammiyavar, Pradeep G. (2010). Status of HCI and usability research in Indian educational institutions. IFIP Advances in Information and Communication Technology. Volume 316, Human Work Interaction Design: Usability in Social, Cultural and Organizational Contexts, pp. 21-27.
66. Yan, S.X., Lee, B.S., Zhao, G., Chen, C., Ma, D., Mohamed, P.(2012). Monsoon: Policy-based hybrid cloud management for enterprises. HP Laboratories Technical Report. Isuue 137. https://www.hpl.hp.com/techreports/2012/HPL-2012-137.pdf.
67. Yang, Z., Cai, S., Zhou, N. (2005) Development and validation of an instrument to measure user perceived service quality of information presenting web portals. Information & Management 42 (4), pp. 575-589.
68. Yigitbasioglu, Ogan M. and Velcu, Oana (2012) A review of dashboards in performance management: Implications for design and research. International Journal of Accounting Information Systems. Volume 13, Issue 1, March, pp. 41-59.
178
VITA
Aditi Mishra was born in Odisha, India. She received her Bachelor of
Technology degree in Computer Science and Engineering from Eastern Academy
of Science and Technology, Bhubaneswar, in 2010. After her graduation, she
joined Missouri University of Science and Technology in 2011. She completed
her Master’s degree in Information Science and Technology and earned a
Graduate Certificate in Business Intelligence from Missouri University of Science
and Technology in Spring 2013. During the course of her Master’s degree she
pursued co-op term with Union Pacific Railroad in Spring 2012, in the field of
SAP-BW; a co-op term with Monsanto Company in Summer and Fall of 2012 as a
SAP SD Business Analyst and worked full-time with Bunge North America from
Spring 2013 till date as a SAP-GTM Business Analyst.

179