Embed Size (px)
Citation preview

Assessment, Evaluation and Reporting for Secondary School
Students
Bonnie Brough and Jenny PerryFriday, May 19, 2006
The primary purpose of assessment and evaluation
is to improve student learning

Knowing Our Student Population
30% of students do not graduate after five years
33% of students go to university
19 % of students go to college
18% of students go directly to work
42% of students in applied programs get all of their 9/10 credits
29% of students in essential programs get 16 credits by age 16

Some of the PiecesSome of the Pieces
gathering data and providing feedback for improvement of achievement
process of judging quality of achievement against given standardsand assigning a representative score to it
communicating achievement
ASSESSMENT
EVALUATION
REPORTING
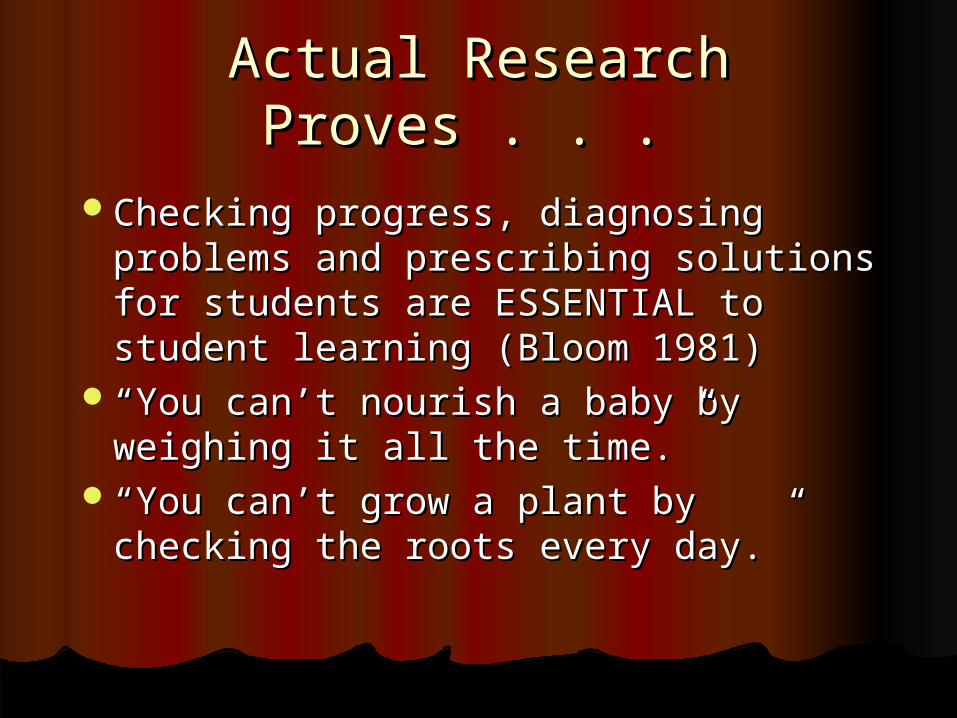
Actual Research Proves . . . Actual Research Proves . . .
Checking progress, diagnosing Checking progress, diagnosing problems and prescribing solutions problems and prescribing solutions for students are ESSENTIAL to for students are ESSENTIAL to student learning (Bloom 1981) student learning (Bloom 1981)
““You can’t nourish a baby by You can’t nourish a baby by weighing it all the time.”weighing it all the time.”
““You can’t grow a plant by checking You can’t grow a plant by checking the roots every day.”the roots every day.”
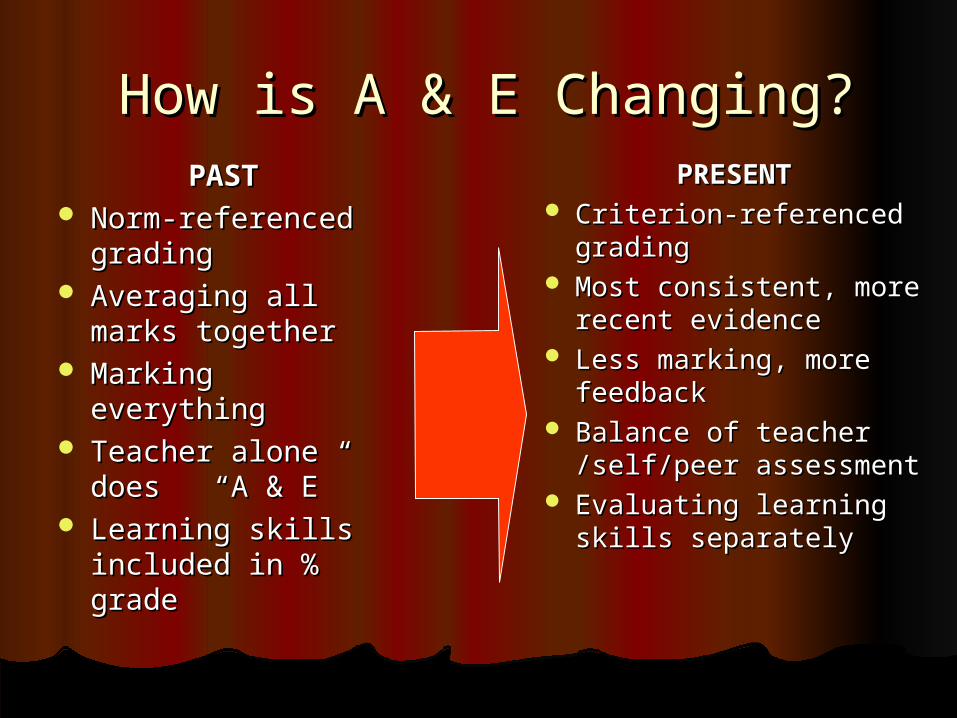
How is A & E Changing?How is A & E Changing?PRESENTPRESENT
Criterion-referenced Criterion-referenced gradinggrading
Most consistent, more Most consistent, more recent evidencerecent evidence
Less marking, more Less marking, more feedbackfeedback
Balance of teacher Balance of teacher /self/peer assessment/self/peer assessment
Evaluating learning Evaluating learning skills separatelyskills separately
PASTPAST Norm-referenced Norm-referenced
grading grading Averaging all Averaging all
marks togethermarks together Marking Marking
everythingeverything Teacher alone Teacher alone
does “A & E”does “A & E” Learning skills Learning skills
included in % included in % gradegrade
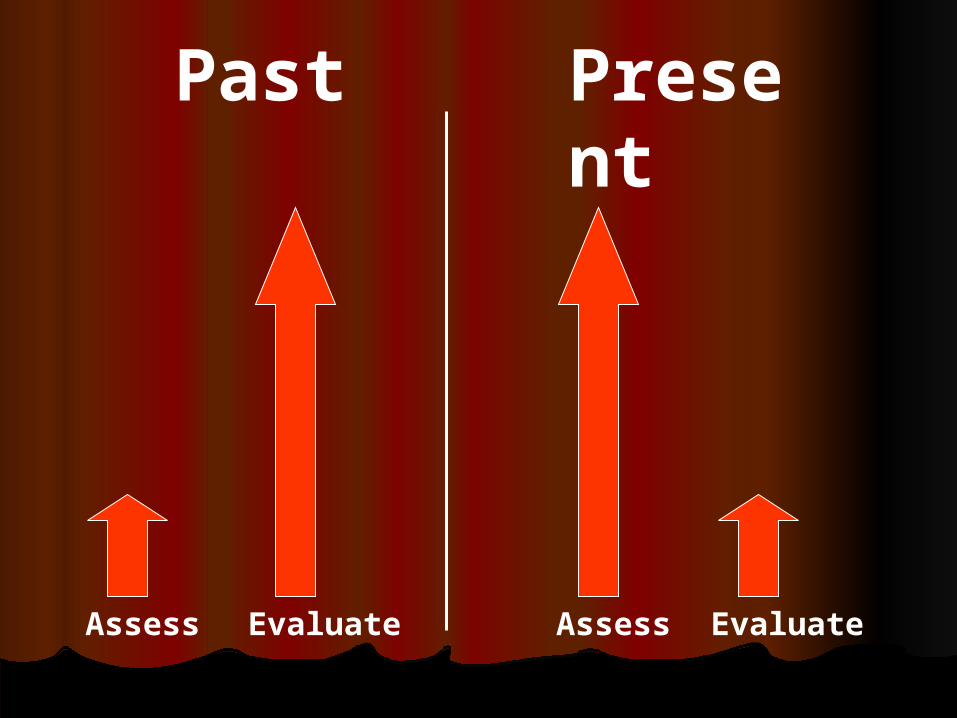
Past Present
Assess Evaluate Assess Evaluate

To assist students in reaching their full potential we must design curriculum which seamlessly weaves together effective instruction, rich feedback, opportunities for practice and revision, and allows for risk taking.
Garfield Gini-Newman
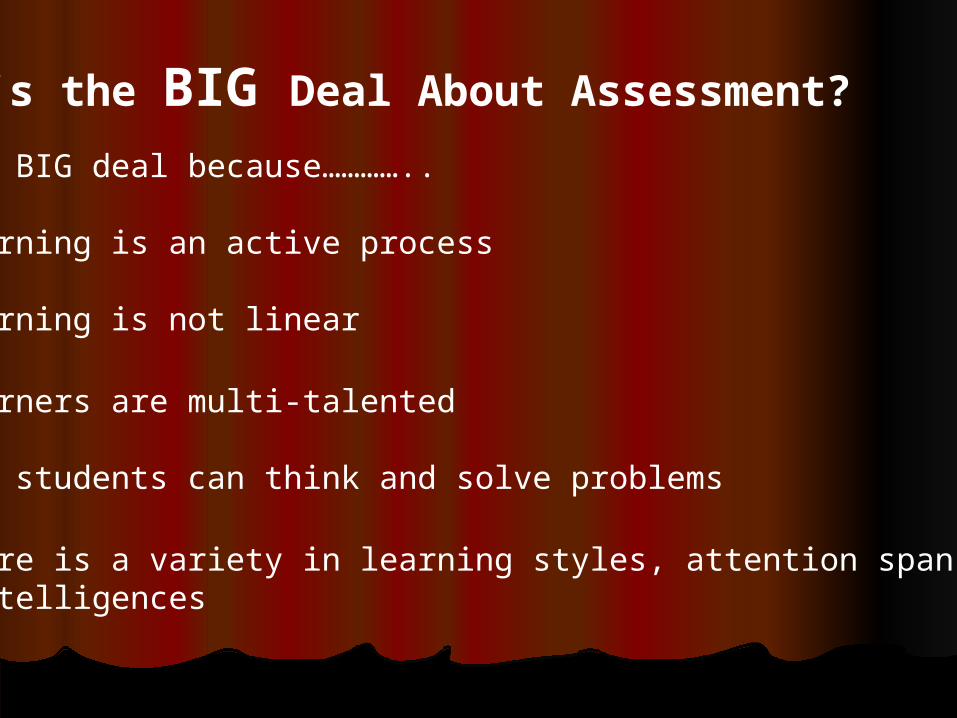
What’s the BIG Deal About Assessment?
It’s a BIG deal because…………..
• Learning is an active process
• Learning is not linear
• Learners are multi-talented
• All students can think and solve problems
• There is a variety in learning styles, attention spans and intelligences
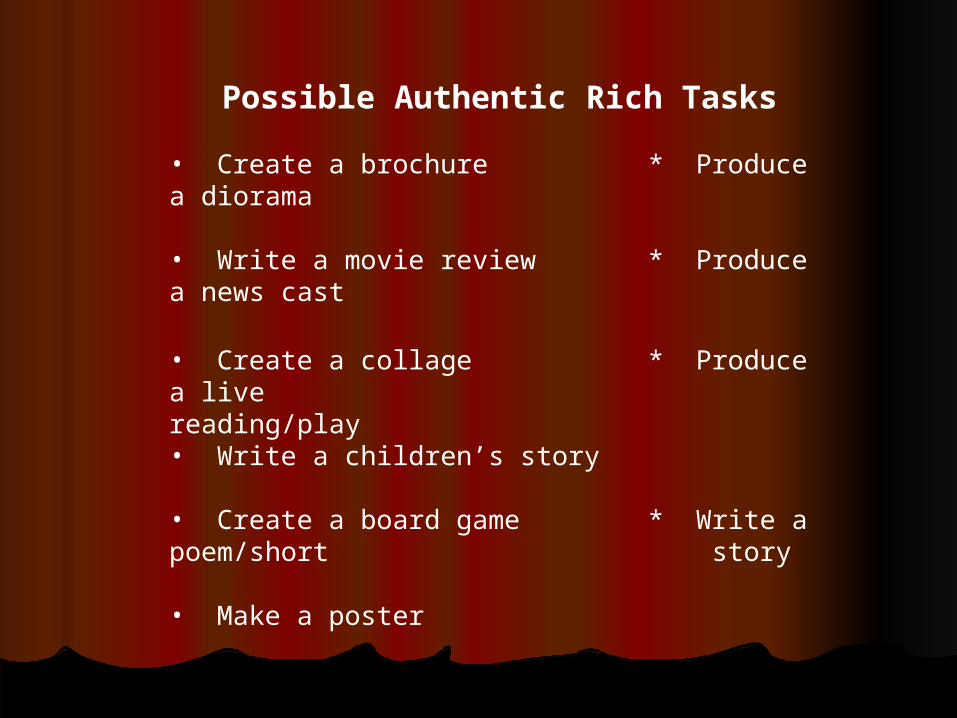
Possible Authentic Rich Tasks
• Create a brochure * Produce a diorama
• Write a movie review * Produce a news cast
• Create a collage * Produce a live reading/play
• Write a children’s story
• Create a board game * Write a poem/short story
• Make a poster
Four Elements of Student Engagement
1. Engagement through assessment
2. Engagement through inquiry
3. Engagement through instruction
4. Engagement through social and emotional security

Engagement Through Social/Emotional Security
“No Matter how excited you are about adding positives to the environment, first work to eliminate the negatives. Excess stress and threat in the school environment may be the single greatest contributor to impaired academic learning.”
Eric Jensen
More Ways to “Engage” Students…Integrating “Emotional Hooks” into Your Teaching
• Honour multiple intelligences
• Have students solve problems which relate to life outside the classroom
• Use film/music/props/tell stories/ go on a field trip
• Allow students to demonstrate their learning in ways that draw on their talents
• Make effective use of cooperative learning
• Encourage classroom talk to develop oral communication
Brain ResearchAttention/Motivation
To maximize learning:
• Physical needs
• Novelty
• Challenge/Mystery
• Self-made (percieved) choice
• Success
•Links to prior learning

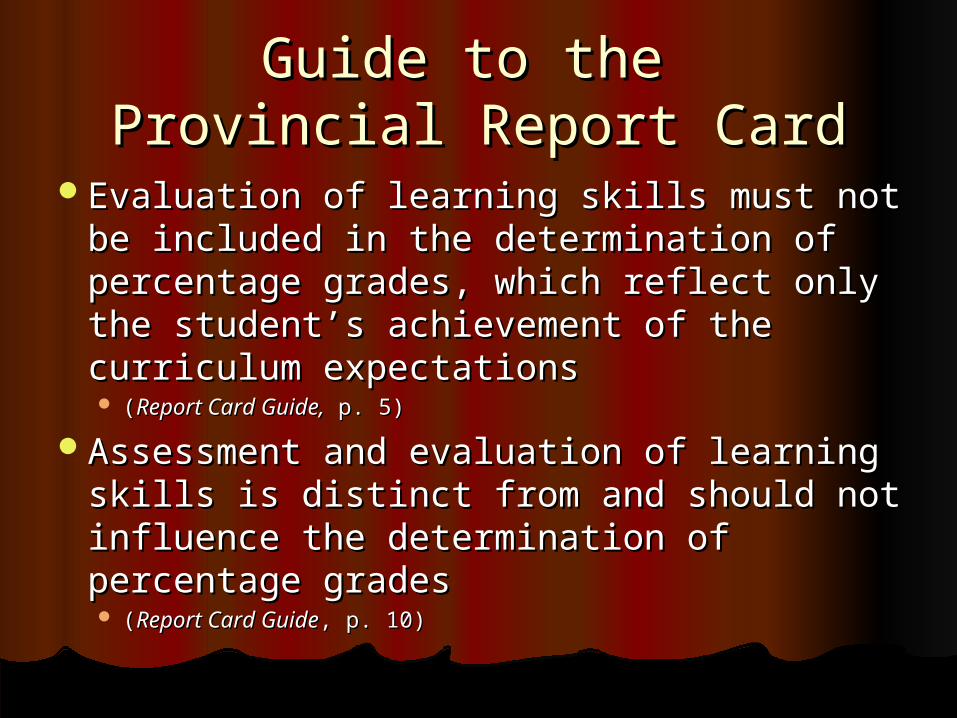
Guide to the Guide to the Provincial Report CardProvincial Report Card
Evaluation of learning skills must not be Evaluation of learning skills must not be included in the determination of included in the determination of percentage grades, which reflect only the percentage grades, which reflect only the student’s achievement of the curriculum student’s achievement of the curriculum expectationsexpectations ((Report Card Guide,Report Card Guide, p. 5) p. 5)
Assessment and evaluation of learning Assessment and evaluation of learning skills is distinct from and should not skills is distinct from and should not influence the determination of percentage influence the determination of percentage gradesgrades ((Report Card GuideReport Card Guide, p. 10), p. 10)
Ministry Policy DocumentsMinistry Policy Documentswww.edu.gov.on.cawww.edu.gov.on.ca
Ontario Secondary Schools Grades 9 to12Ontario Secondary Schools Grades 9 to12Program and Diploma RequirementsProgram and Diploma Requirements
Program Planning and Assessment Booklet Program Planning and Assessment Booklet (PPA)(PPA)
Assessment, Evaluation, and Reporting Assessment, Evaluation, and Reporting
Guide to the Provincial Report CardGuide to the Provincial Report CardLearning SkillsLearning SkillsReporting % gradesReporting % grades
Subject Curriculum DocumentsSubject Curriculum DocumentsCurriculum ExpectationsCurriculum ExpectationsAchievement ChartsAchievement Charts
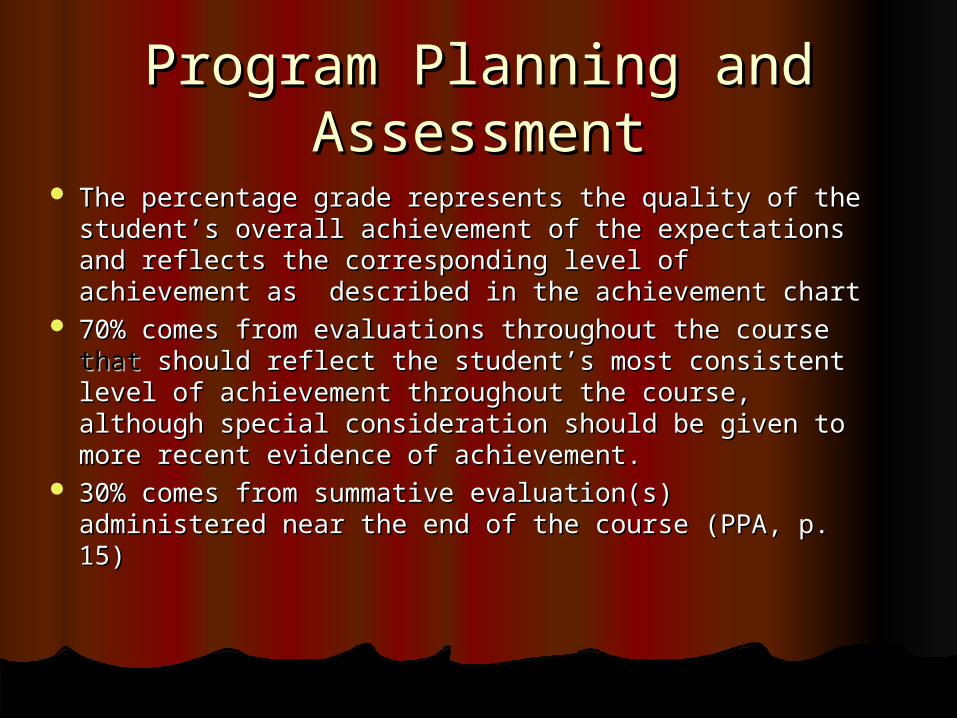
Program Planning and Program Planning and AssessmentAssessment
The percentage grade represents the quality of the student’s The percentage grade represents the quality of the student’s overall achievement of the expectations and reflects the overall achievement of the expectations and reflects the corresponding level of achievement as described in the corresponding level of achievement as described in the achievement chartachievement chart
70% comes from evaluations throughout the course 70% comes from evaluations throughout the course that that should reflect the student’s most consistent level of should reflect the student’s most consistent level of achievement throughout the course, although special achievement throughout the course, although special consideration should be given to more recent evidence of consideration should be given to more recent evidence of achievement.achievement.
30% comes from summative evaluation(s) administered near 30% comes from summative evaluation(s) administered near the end of the course (PPA, p. 15)the end of the course (PPA, p. 15)
Teach the Expectations
Evaluate the Performance
(not all expectations are created equally)

Key Questions:Key Questions:What is ...?What is ...?
Worth being familiar with
Important to Know and Do
“Enduring” Understandin
g
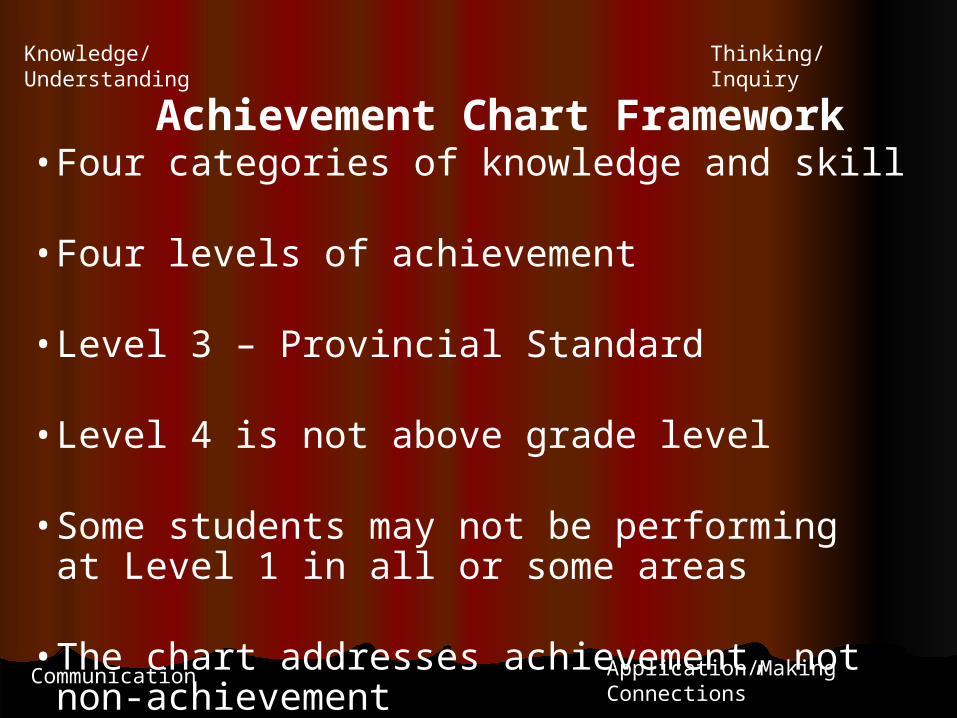
Achievement Chart Framework
Knowledge/Understanding Thinking/Inquiry
Communication Application/Making Connections
• Four categories of knowledge and skill
• Four levels of achievement
• Level 3 – Provincial Standard
• Level 4 is not above grade level
• Some students may not be performing at Level 1 in all or some areas
• The chart addresses achievement, not non-achievement

Achievement Chart
Categories 50 - 59%Level 1
60 - 69%Level 2
70 - 79%Level 3
Knowledge/ Understanding
---
Thinking/Inquiry
--
Communication
-
-
Application/Making Connections
---
80 -100%Level 4
Defines the category for this subject
Identifies the level of achievement
---
---
---
---
-
-
-
-
-
-
---
---
---
--
--
--
--
-
-
---

Why the Achievement Chart Matters!!
1. Properly used, it provides the framework for planning assessments and curriculum
2. Planning assessments around the Achievement chart helps ensure clear targets and that teachers do not confuse targets with methods
Guide to the Guide to the Provincial Report CardProvincial Report Card
Evaluation of learning skills must not be Evaluation of learning skills must not be included in the determination of included in the determination of percentage grades, which reflect only the percentage grades, which reflect only the student’s achievement of the curriculum student’s achievement of the curriculum expectationsexpectations ((Report Card Guide,Report Card Guide, p. 5) p. 5)
Assessment and evaluation of learning Assessment and evaluation of learning skills is distinct from and should not skills is distinct from and should not influence the determination of percentage influence the determination of percentage gradesgrades ((Report Card GuideReport Card Guide, p. 10), p. 10)

Calculating the Final Report Card Mark
70% : based on evaluations conducted throughout course
+ 30%: end of year summative evaluations
100%: Final mark
“Students don’t necessarilyremember all the things youteach them, but theyremember how you madethem feel.”