Embed Size (px)
Citation preview
Assessment and Refinement of Real-Time Travel Time Algorithms for Use in Practice May 9, 2007
Agenda
Detailed Corridor Study Results (60 min) Discussion on Remaining Tasks (30 min) ITS America Presentation (10 min) OTREC Proposal Status (10 min) Next Steps (10 min)
Study Results Outline
Data Collection Update Overall Error Analysis Algorithm Alternatives Summary Table – Statistics & conclusions Details & Recommendations I-5 and 217
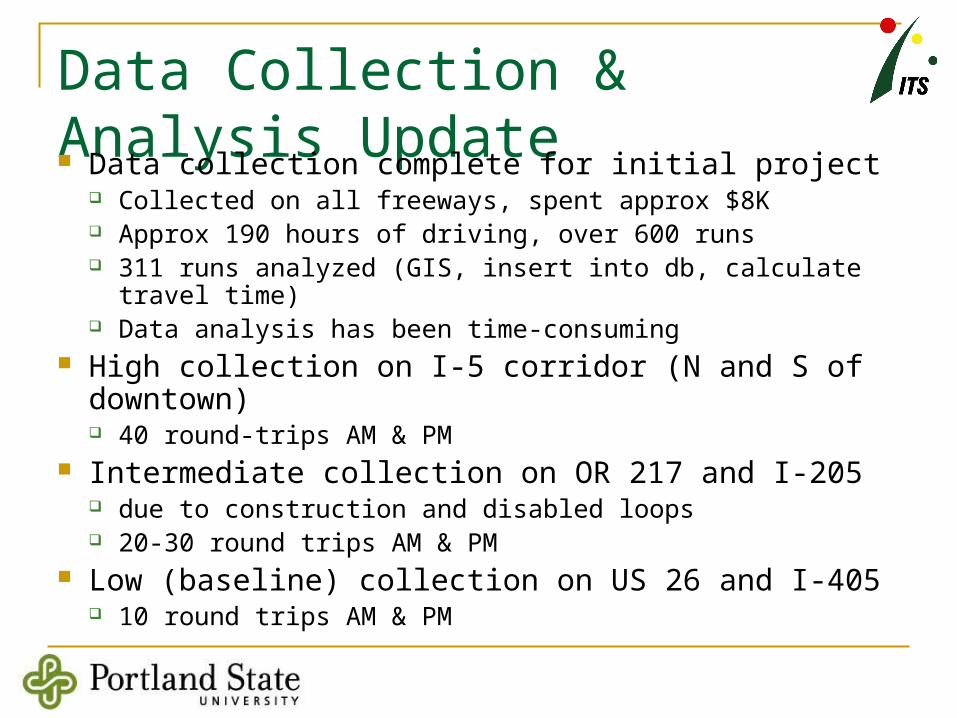
Data Collection & Analysis Update Data collection complete for initial project
Collected on all freeways, spent approx $8K Approx 190 hours of driving, over 600 runs 311 runs analyzed (GIS, insert into db, calculate travel time) Data analysis has been time-consuming
High collection on I-5 corridor (N and S of downtown) 40 round-trips AM & PM
Intermediate collection on OR 217 and I-205 due to construction and disabled loops 20-30 round trips AM & PM
Low (baseline) collection on US 26 and I-405 10 round trips AM & PM
0
5
10
15
20
25
30
35
< -30 (-30, -20) (-20, 10) (-10, 0) (0, 10) (10, 20) (20, 30) > 30
% Error
% o
f R
un
s
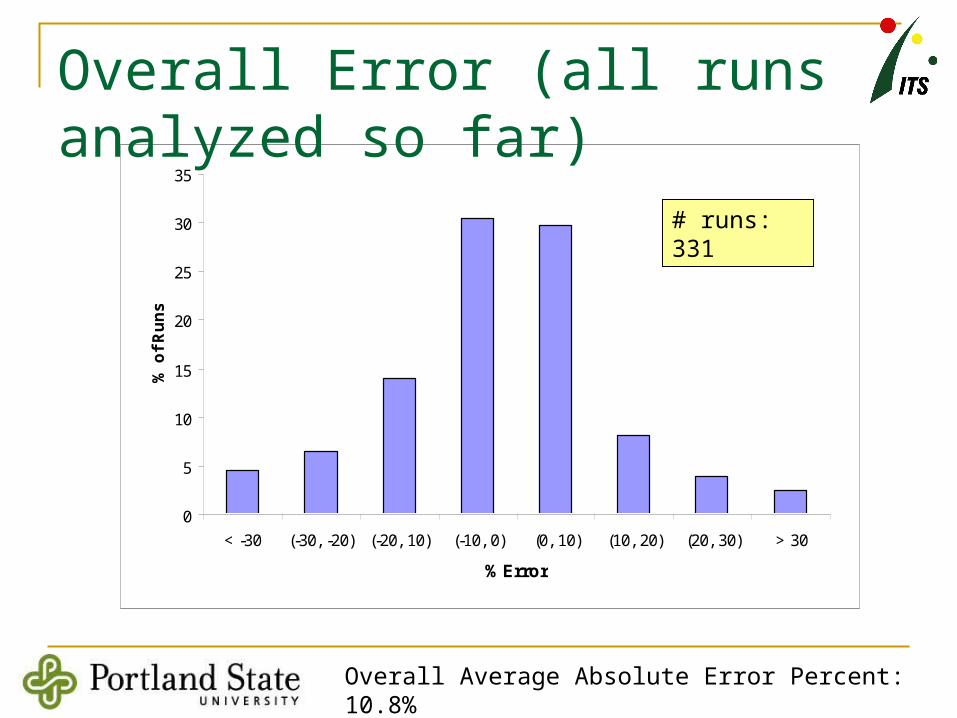
Overall Error (all runs analyzed so far)
# runs: 331
Overall Average Absolute Error Percent: 10.8%

Algorithm Alternatives I-5 N SoD
0
10
20
30
40
50
60
70
80
0-10 10-20 20-30 >30
% Error
% o
f R
un
sMidpoint
San Antonio
WashDOT

Algorithm Alternatives 217 SB
0
10
20
30
40
50
60
0-10 10-20 20-30 >30
% Error
% o
f R
un
s
Midpoint
San Antonio
WashDOT
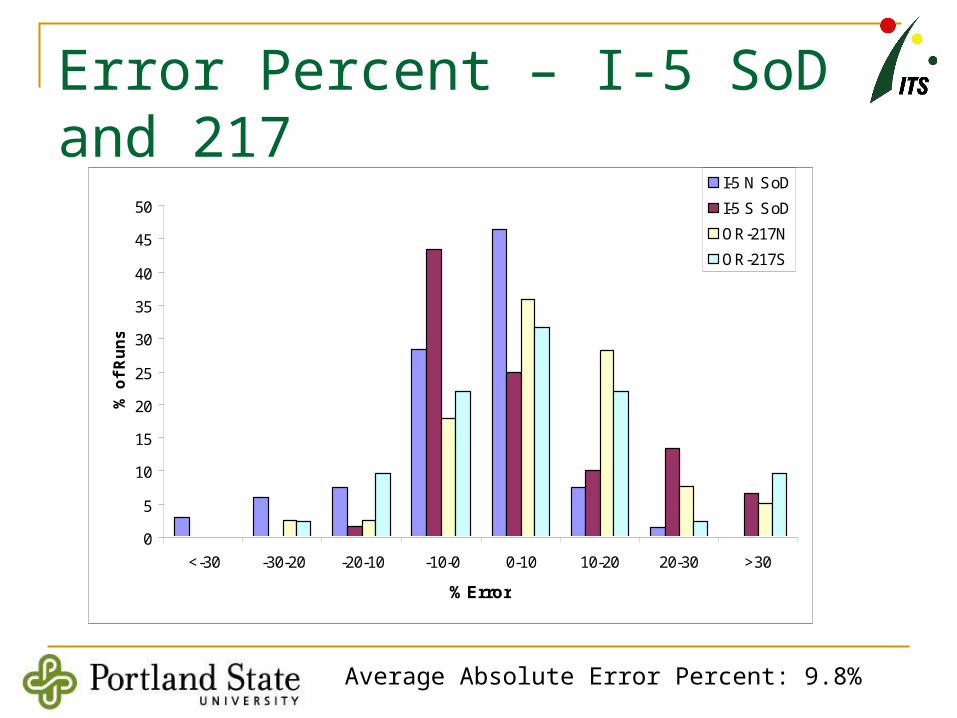
Error Percent – I-5 SoD and 217
0
5
10
15
20
25
30
35
40
45
50
<-30 -30-20 -20-10 -10-0 0-10 10-20 20-30 >30
% Error
% o
f R
un
s
I-5 N SoD
I-5 S SoD
OR-217N
OR-217S
Average Absolute Error Percent: 9.8%
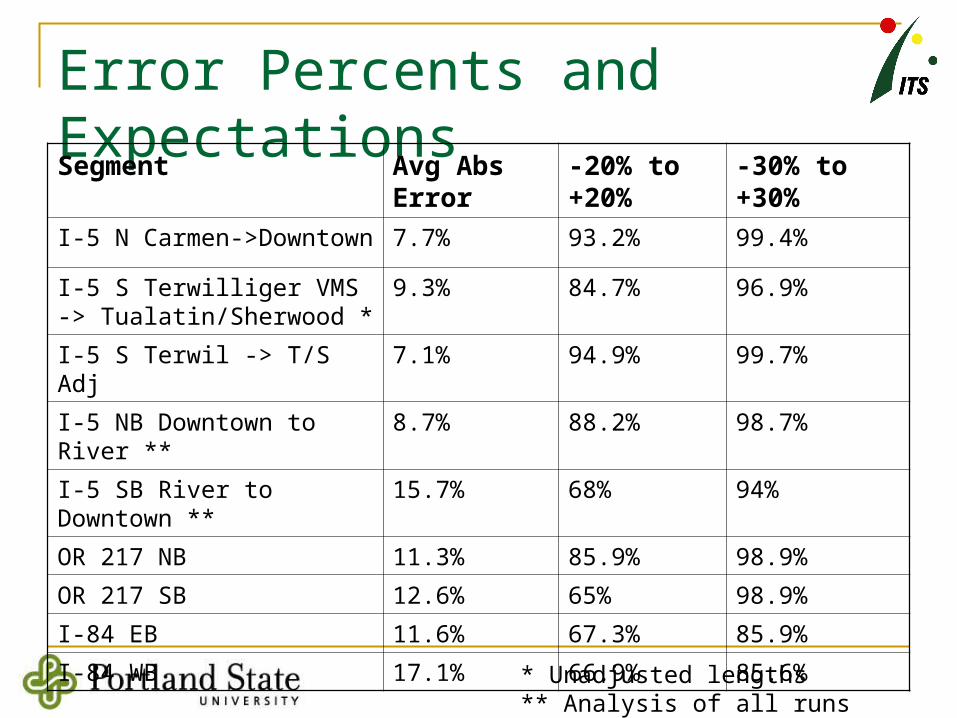
Error Percents and ExpectationsSegment Avg Abs
Error-20% to +20%
-30% to +30%
I-5 N Carmen->Downtown 7.7% 93.2% 99.4%
I-5 S Terwilliger VMS -> Tualatin/Sherwood *
9.3% 84.7% 96.9%
I-5 S Terwil -> T/S Adj 7.1% 94.9% 99.7%
I-5 NB Downtown to River ** 8.7% 88.2% 98.7%
I-5 SB River to Downtown ** 15.7% 68% 94%
OR 217 NB 11.3% 85.9% 98.9%
OR 217 SB 12.6% 65% 98.9%
I-84 EB 11.6% 67.3% 85.9%
I-84 WB 17.1% 66.9% 85.6%
* Unadjusted lengths** Analysis of all runs not complete

Adjustments I-5 S Terwill – T/SStation
IdLocation Milepost Standard
Midpoint Len
Actual
ODOT Len
ODOT Adjust – Scale
1036 Hood Ave 299.25 0.2 (2.95) Not used 2.39
1108 Spring Garden 299.26 2.04 1 0.6
1107 Capital Hwy 295.18 1.45 1 0.6
1105 99W 293.36 1.04 1 0.6
1131 Haines St 293.2 1.06 1 0.6
1038 Upper Boones 291.25 1.35 1.5 0.9
1039 Lower Boones 290.4 0.94 2 1.2
1040 Nyberg 289.38 0.10 (2.23) 0.68 1.32
Total Len: 8.18 8.18 8.2

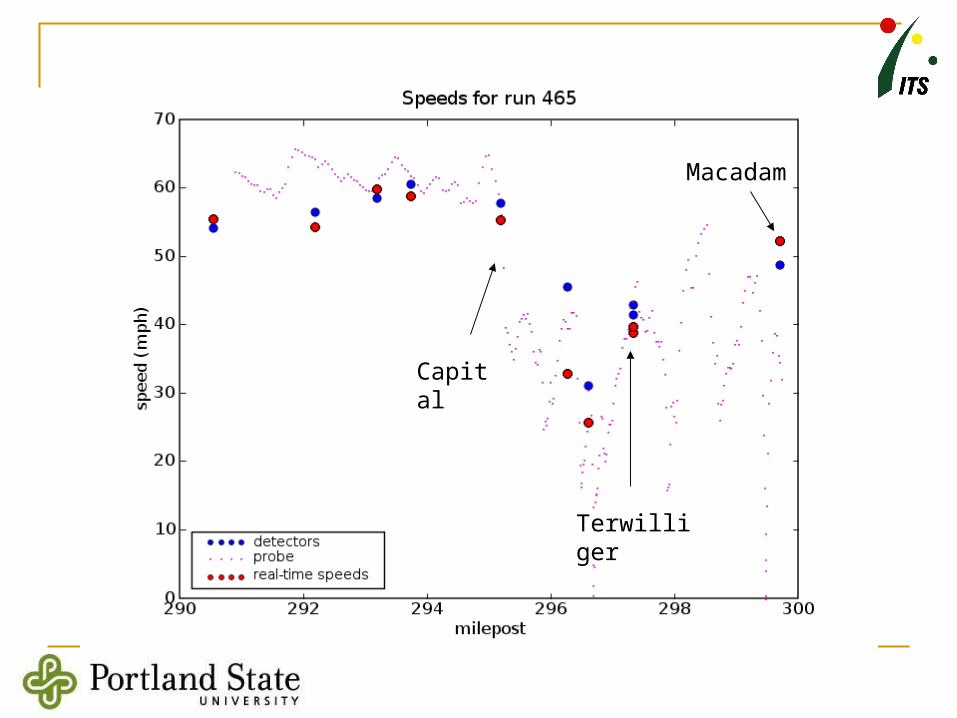
I-5 NB SoD Observations Problem areas
Capital – Terwilliger Sharp speed drop in this segment Possibly due to the curves
Terwilliger – Macadam Speed increases past Terwilliger Large spacing (2.37 miles)
Recommendation Add detection between Terwilliger and Macadam
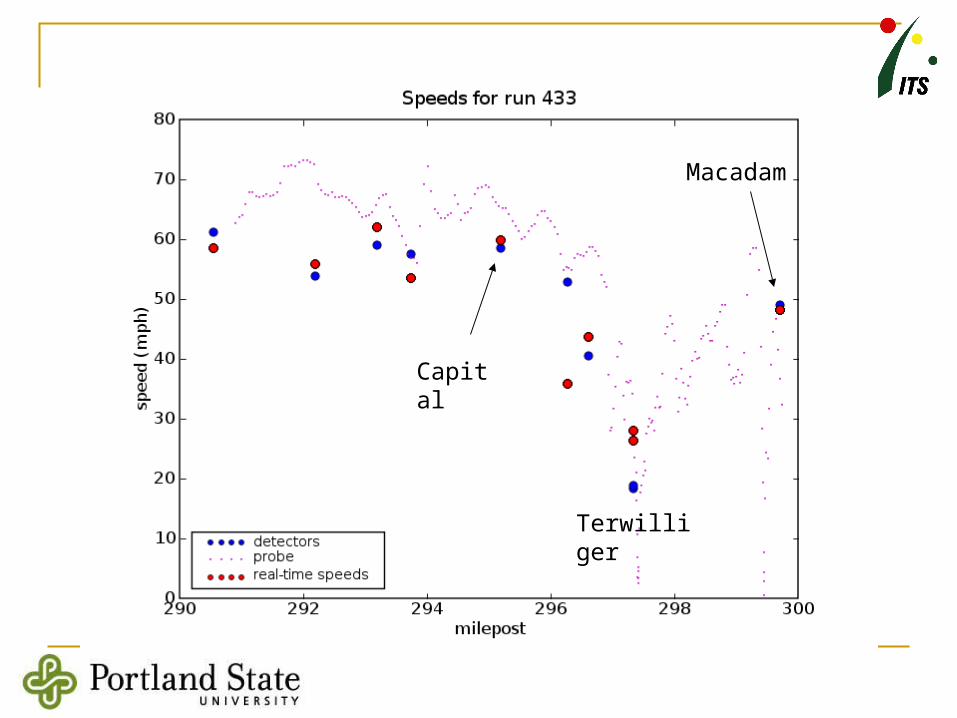
Macadam
Terwilliger
Capital
Macadam
Terwilliger
Capital

capital

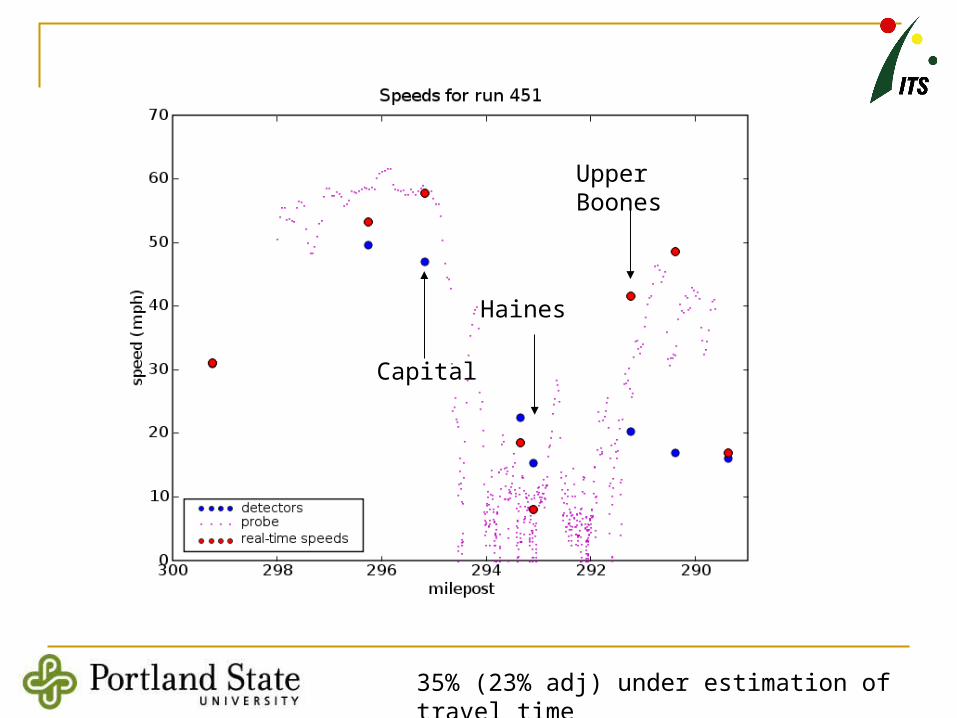
I-5 SB S of Downtown -Observations Problem Area
Haines – Upper Boones High errors runs all in PM peak Consistent speed drop Possibly caused due to merging/diverging
traffic from OR-217 Large detector spacing (1.85 miles)
Recommendation Add detector between Haines & Upper Boones
Also suggestion of problem between Haines & Capital

Upper Boones
Haines
22% (19% adj) under estimation of travel time
Speed drop between Haines & Upper Boones
Upper Boones
Haines
Capital
35% (23% adj) under estimation of travel time
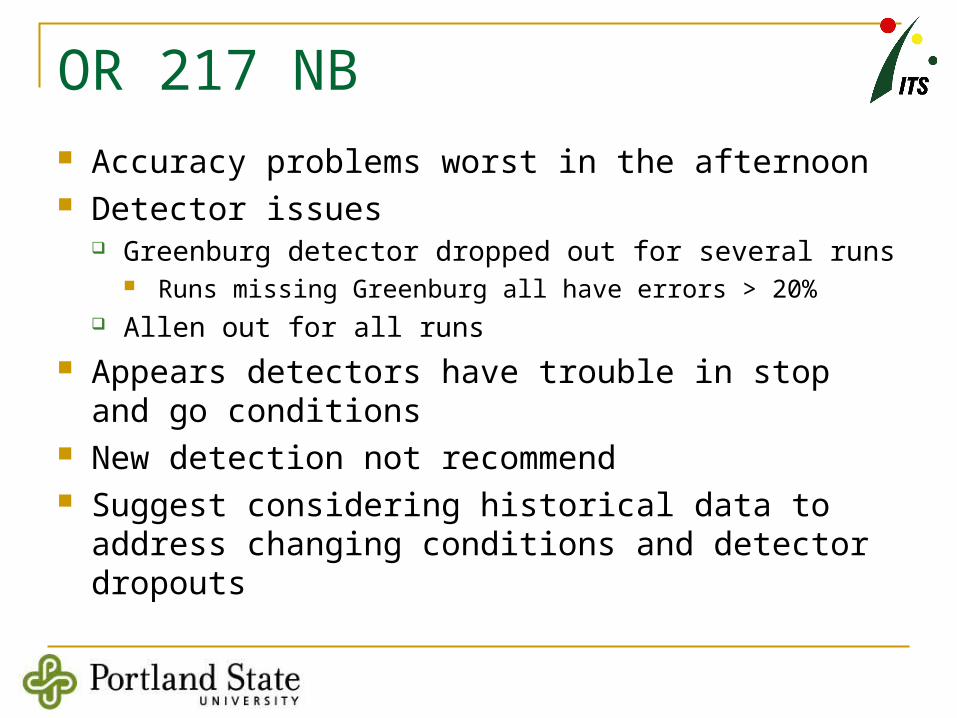
OR 217 NB Accuracy problems worst in the afternoon Detector issues
Greenburg detector dropped out for several runs Runs missing Greenburg all have errors > 20%
Allen out for all runs Appears detectors have trouble in stop and go
conditions New detection not recommend Suggest considering historical data to address
changing conditions and detector dropouts
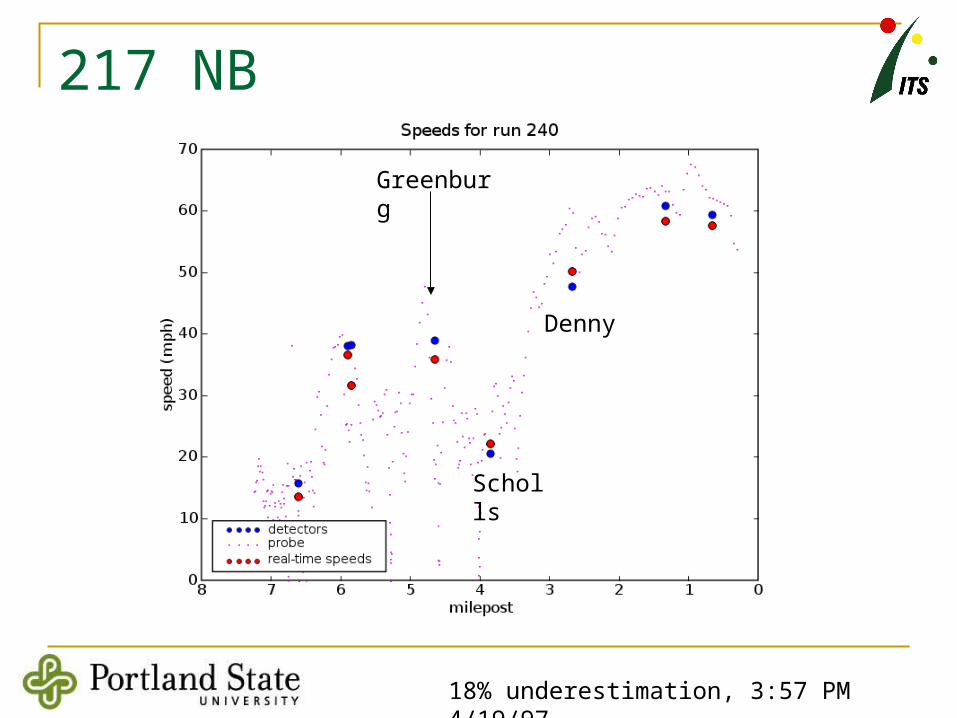
217 NB
Greenburg
Scholls
Denny
18% underestimation, 3:57 PM 4/19/97

Stop and go I-5 SB
Haines

OR 217 SB
Areas of concern Upstream of B-H Hwy, near Walker road (merge from 26
EB?) Scholls area – known bottleneck that activates between
Greenburg and Scholls Walker, Scholls detectors not functioning for all runs Need data when Walker & Scholls detectors are
functioning Accuracy may be fine if those detectors are functioinog Historical data can be used when detector drop out
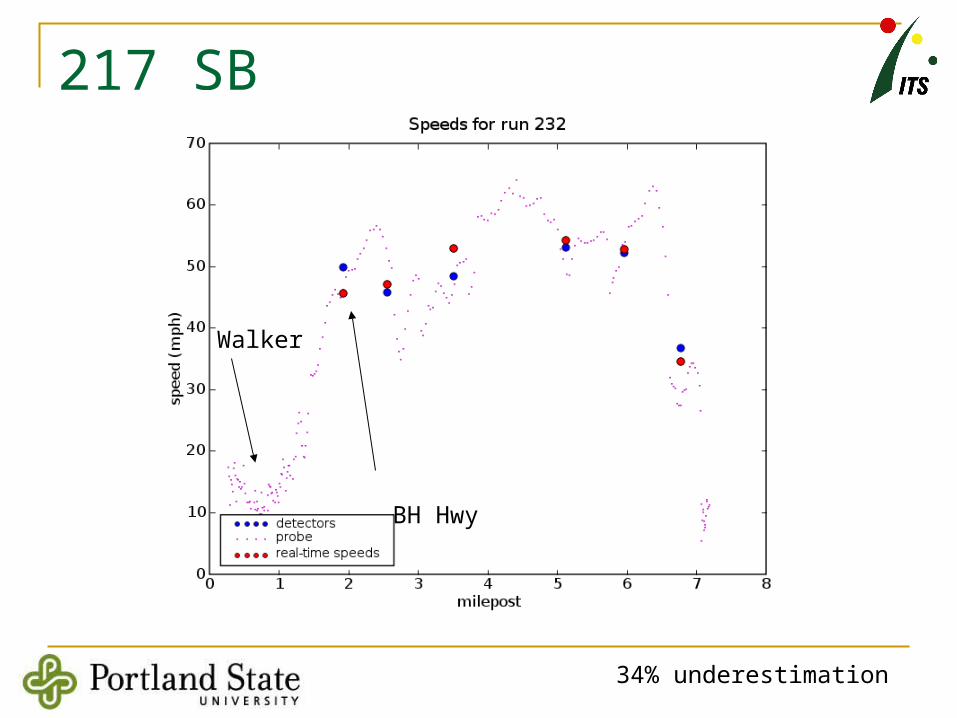
217 SB
34% underestimation
BH Hwy
Walker
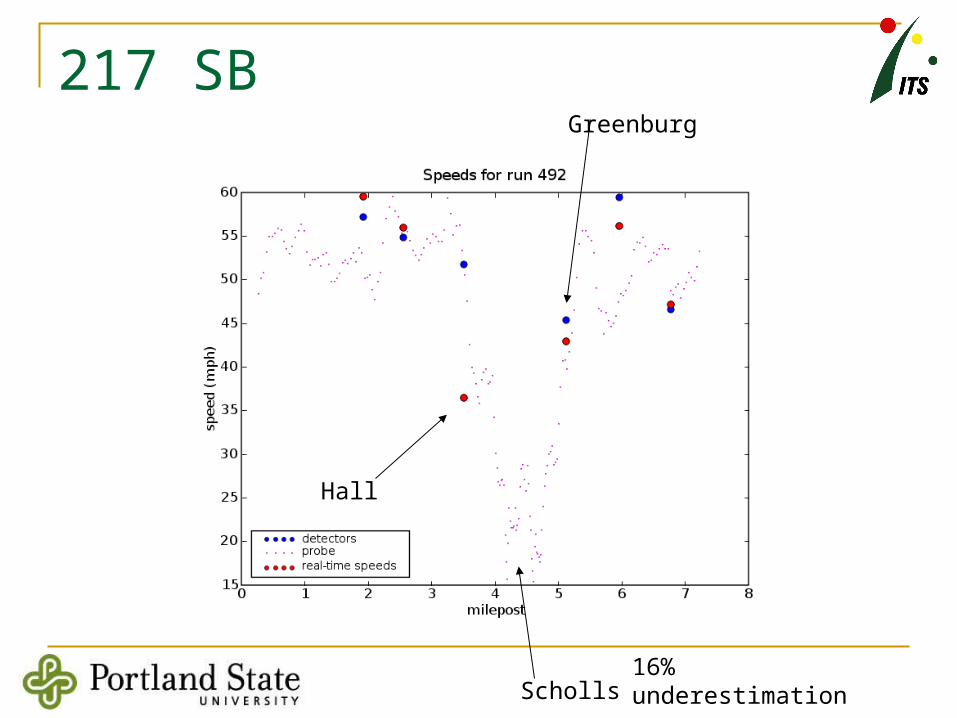
217 SB
16% underestimation
Hall
Greenburg
Scholls
Data Quality
How do the detectors fail? Communication errors Calibration errors Day-long failures?? Intermittent/sporadic failures?? Issues with stop and go? Overnight issues?

I-5 North of Downtown (NoD)
NB and SB segments between downtown and the Columbia River
NB – Initial Conclusions Data collected for this segment have encouraging error
rates Marine Drive detector malfunctioned during several runs. Additional data required for conclusions, this data has been
collected, needs to be analyzed SB – Initial Conclusions
Error rates are encouraging, but additional data required Area of concern around split between I-5 and I-205 Area of concern near lane drop north of Columbia

I-84 EB, I-84 WB
Conclusion – not enough detectors and detectors not stable enough to generate travel time estimates
Need additional detection before travel times can be provided

Project Results
Large amount of data collection and analysis Accuracy of current travel time predictions on all
corridors Evaluation of several algorithms (Coifman, WSDOT,
San Antonio, Midpoint) However, results generally inconclusive
Recommendations for corridors where travel time can be provided
Recommendations for infrastructure improvements Potential recommendation for influence area
adjustments
Project Phases
Initial Project (through June 07) OTREC – Phase 1 (July 2007 - Sept 2007)
$23,000 in funding Additional data analysis Some additional data collection (as needed) Real-time evaluation of travel time accuracy
FY02 (Oct 2007 – Sept 2008) Proposals due May 25 Have $34,000 in match left to use from original
project
OTREC FY02
Historical Data Apply historical data to
Detector Spacing Affect of detector spacing on travel time accuracy Initial work at PSU by Rob Bertini, also work by
Kwon Reviewers Interested In
Good set of metrics for accuracy Real-time quantification of accuracy

ITS America Presentation
Thoughts? Ideas? Comments?

Next Steps…
Continue analysis along lines of this presentation Comments?
OTREC FY02 Proposal Proposal Due May 25
Task 5: Detailed Comparative Study Proposed date: May 9 – next week? Draft Report: May 31
Final Report: June 30

EXTRAS

Macadam
Terwilliger
Capital

Extension – Phase I Promised
This project will produce the following three outcomes: Algorithm Recommendation The project will produce a
recommendation for an algorithm to be used for travel time estimation for the Portland area for display on DMS signs and availability on 511 and tripcheck.com.
Ground Truth Data Collection The project will produce a large collection of ground truth data which will be available to researchers in the OTREC consortium upon request. The project team is already aware of several projects including, PORTAL [8] and latte [13], which will be able to utilize the data collected.
Techniques for Evaluating Travel Time Accuracy The project will document a method for dynamically analyzing the accuracy of travel time estimates and evaluating when travel times are and are not accurate enough to be provided to travelers.
ITS America – Potential Outline Study Goals PORTAL Data Collection Analysis
What types of errors are we seeing Where are we seeing the errors What do we think is causing the errors
Algorithm Refinement Adjusting lengths of influence areas appears to make a
significant improvement
FOR KT’s reference
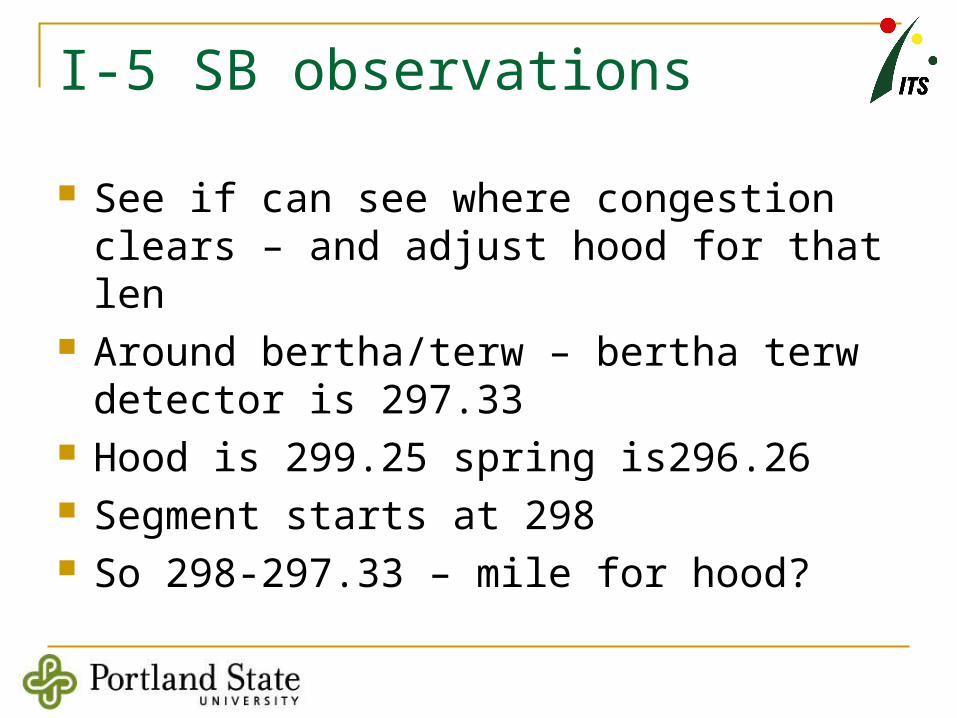
I-5 SB observations
See if can see where congestion clears – and adjust hood for that len
Around bertha/terw – bertha terw detector is 297.33
Hood is 299.25 spring is296.26 Segment starts at 298 So 298-297.33 – mile for hood?
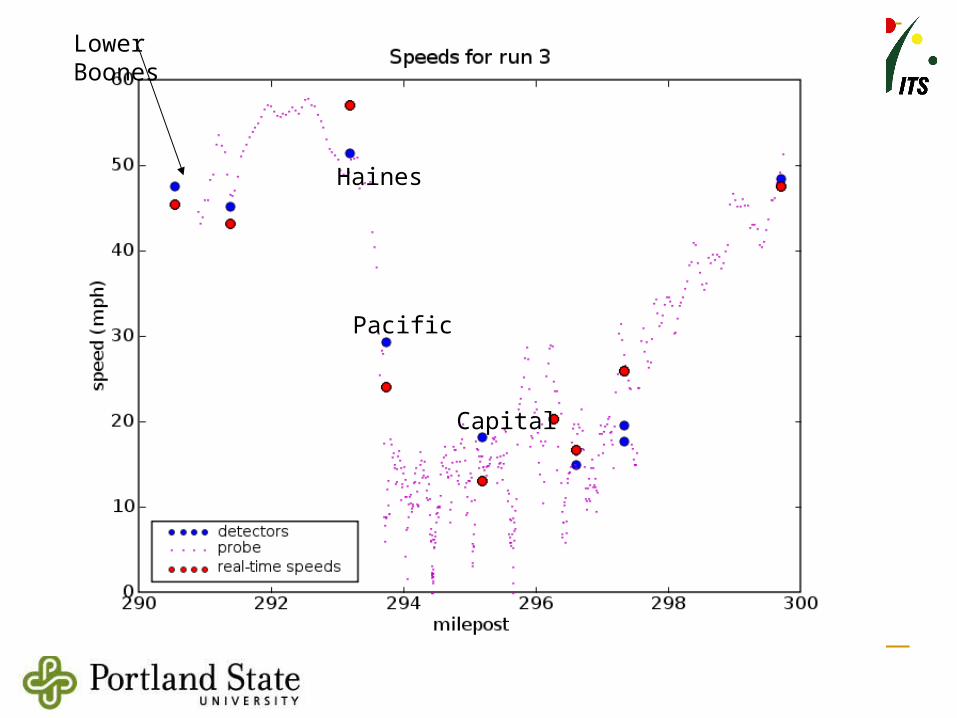
Lower Boones
Haines
Pacific
Capital

I-5S
Run 215, 221 – looks as if detectors aren’t capturing stop and go
Two patterns when error – stop and go pattern and error hasn’t propagated to haines (i.e. 257) (416 also)
449 congestion past haines, 437 also, 451 also, 435
14 – uncaptured congestion between haines and upper boones, 28 ditto, 257, 259, 274, 416,
Hau says Galen wants
A. The accuracy of travel time estimation given the current instrumentation as well as using the current algorithm.
B. Adjustments and changes to the travel time estimation approach that will provide a greater amount of confidence to provide travel time to the public
C. Recommendations for where travel time should be provided and what needs to happen to make it happen across the entire metro area
D. Is the level of accuracy appropriate for dissemination via VMS, the web and phone.

Results of this Study
1. average error pct & std dev 2. based on those numbers & assumption of normal distribution, % errors expected to be < 20% and < 30% (like I put in task 4) 3. locations of potential bottlenecks 4. comments from reviewing the plots as to where errors occur most commonly 5. manually create a set of segment lengths based on two previous bullets and see if those lengths improve accuracy 6. results from different types of influence areas (wadot, etc.) 7. Recommendations for reducing error - Additional detectors etc. with location 8. Can travel times be displayed with current configuration?
What did we promise from this study? Investigate ITS data fidelity Ground Truth Data Collection Sensitivity Analysis of Algorithms Algorithm Refinement Detailed Comparative Study
accuracy of the algorithm to generate real-time travel times; reliability of the approach such as detailed information regarding
when the algorithm performs well, and understanding of factors that may contribute to unreliable travel times,
impact on hardware and / or software requirements; scalability of approach; and suitability for use in VMS, Web-based, and telephone traveler
information applications.
Kristins 217 NB Notes
503 – allen missing seems to be issue 505, 233, 235, 240 – detectors aren’t getting
stop and go 480 slowdown at certain detectors 231, 496 conditions changed 517 slowdown in between detectors 1001b no seq!!! Affects rtspeeds Error much worse when greenburg dropped
out
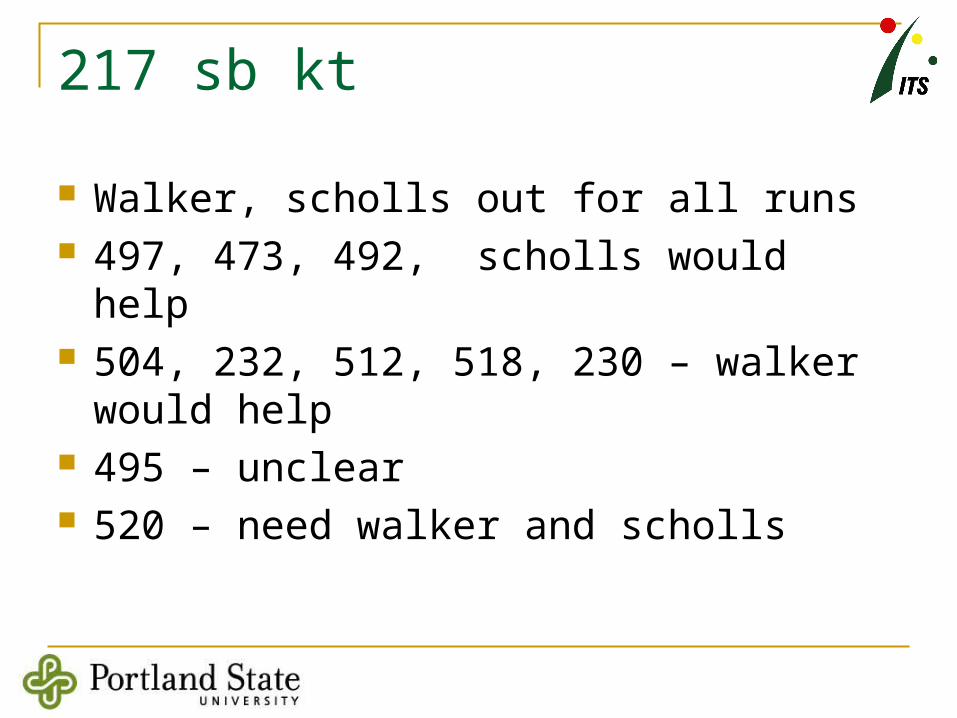
217 sb kt
Walker, scholls out for all runs 497, 473, 492, scholls would help 504, 232, 512, 518, 230 – walker would help 495 – unclear 520 – need walker and scholls
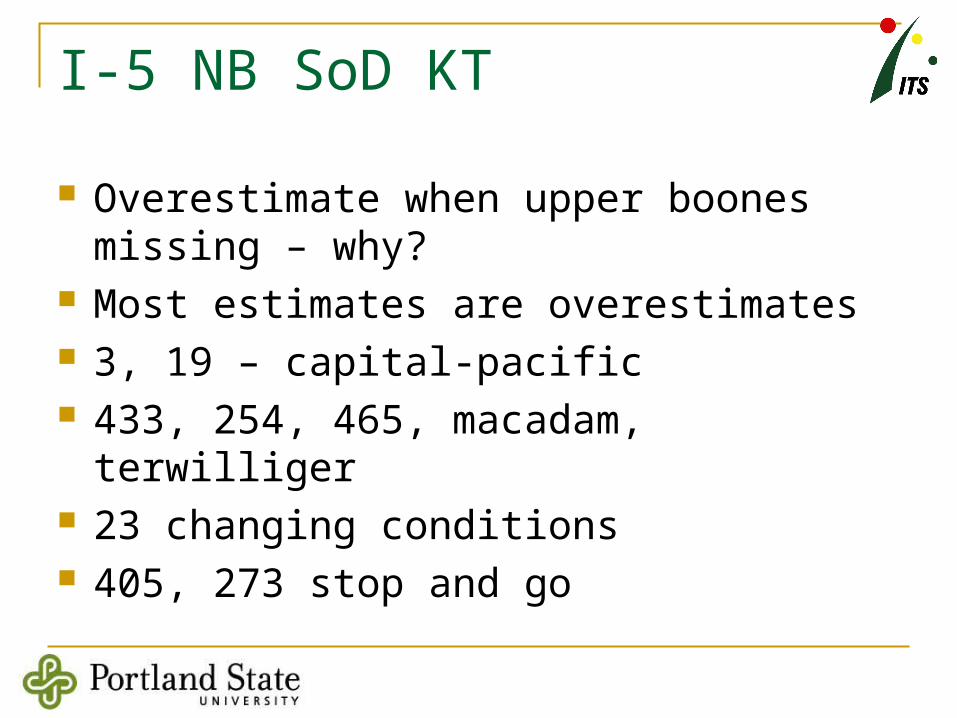
I-5 NB SoD KT
Overestimate when upper boones missing – why?
Most estimates are overestimates 3, 19 – capital-pacific 433, 254, 465, macadam, terwilliger 23 changing conditions 405, 273 stop and go