Embed Size (px)
Citation preview
Sergio Tarantino
CIFE Seed Proposal FY13-2018
Assessment and reduction of the risks inherent in Performance-Based Contracting by use of CIFE’s
automated Building Energy Model generator
Enabling Performance-Based Contracting
Designers, building owners and operators lack methods for assessing the impact of building operations on building performance as predicted by design-stage energy models.
PBC has been fraught with unacceptable risks of performance and costs uncertainty due to misalignment between predictions and measured energy consumption.
The research purpose is to assess the risk involved in using Building Energy Performance Simulation (BEPS) as a foundation for Performance Based Contracting (PBC) on new and existing buildings
The solution investigated is an automated rapid method to create an accurate Building Energy Model (BEM), coupled with a method to quantify the parametric error associated
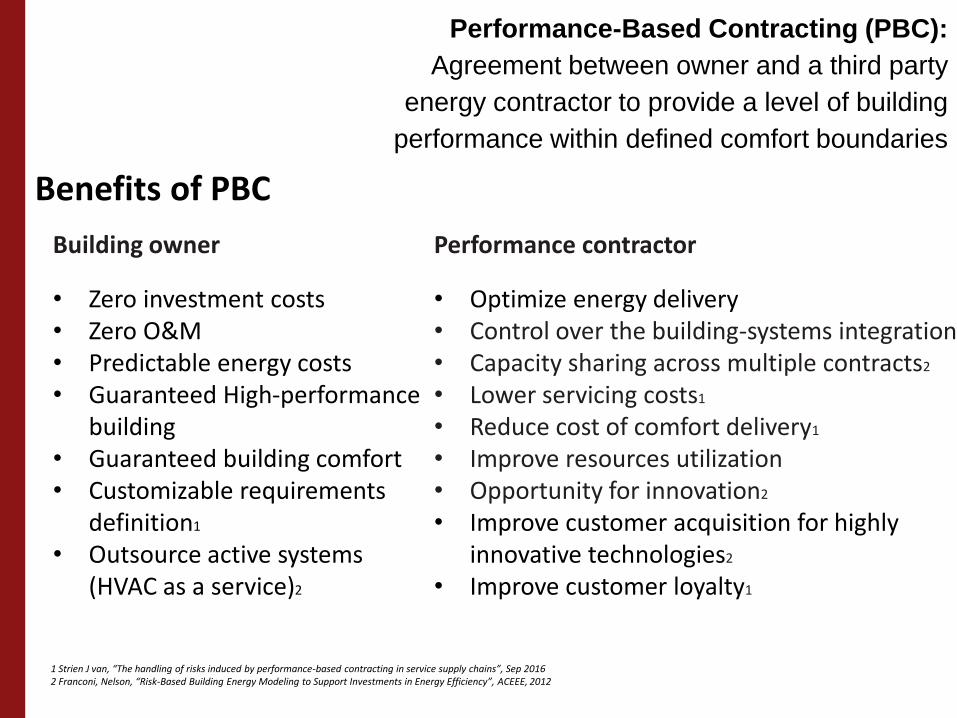
Benefits of PBC
Building owner
• Zero investment costs• Zero O&M• Predictable energy costs• Guaranteed High-performance
building• Guaranteed building comfort• Customizable requirements
definition1
• Outsource active systems(HVAC as a service)2
Performance contractor
• Optimize energy delivery• Control over the building-systems integration• Capacity sharing across multiple contracts2
• Lower servicing costs1
• Reduce cost of comfort delivery1
• Improve resources utilization• Opportunity for innovation2
• Improve customer acquisition for highly innovative technologies2
• Improve customer loyalty1
1 Strien J van, “The handling of risks induced by performance-based contracting in service supply chains”, Sep 20162 Franconi, Nelson, “Risk-Based Building Energy Modeling to Support Investments in Energy Efficiency”, ACEEE, 2012
Performance-Based Contracting (PBC):
Agreement between owner and a third party
energy contractor to provide a level of building
performance within defined comfort boundaries
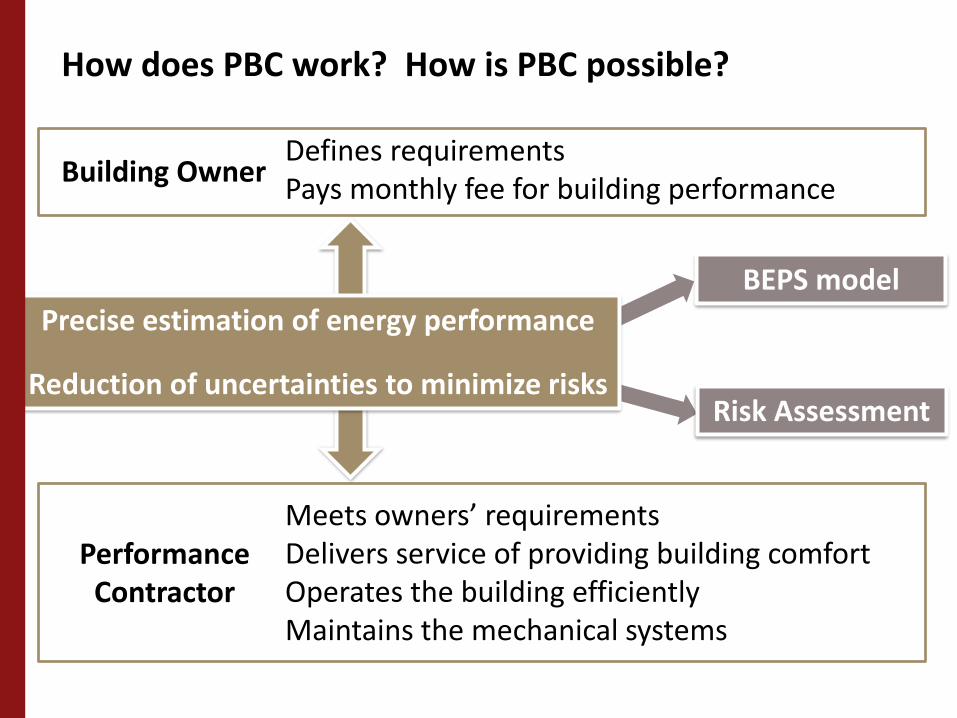
Building Owner
Performance Contractor
Defines requirementsPays monthly fee for building performance
Meets owners’ requirementsDelivers service of providing building comfortOperates the building efficientlyMaintains the mechanical systems
Precise estimation of energy performance
Reduction of uncertainties to minimize risks
BEPS model
Risk Assessment
How does PBC work? How is PBC possible?
BEPS model
Risk Assessment
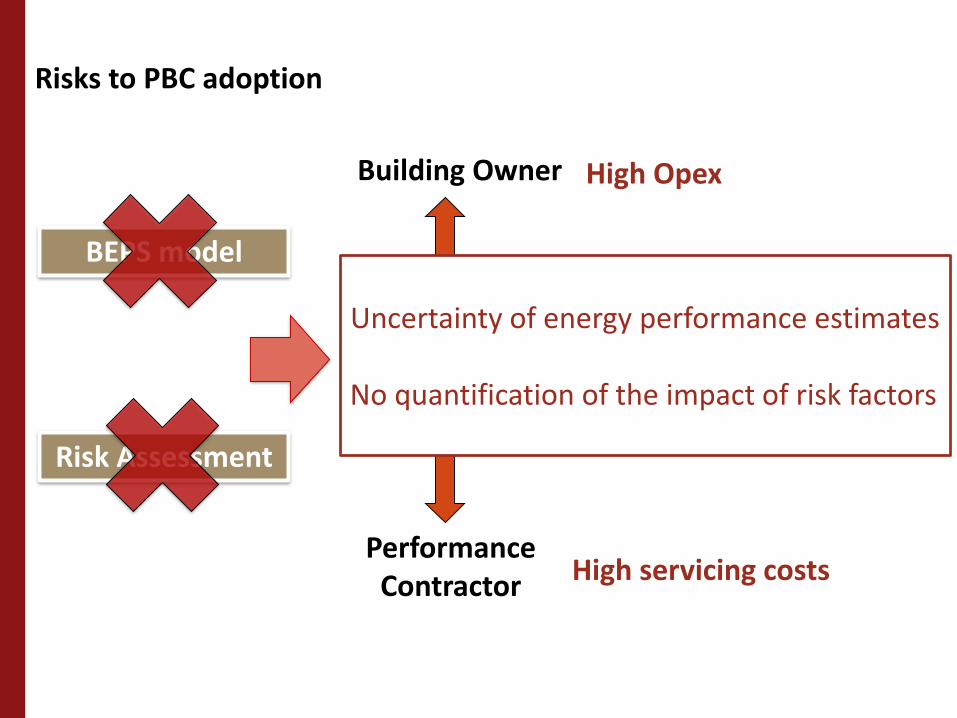
Risks to PBC adoption
High Opex
High servicing costs
Building Owner
Performance Contractor
Uncertainty of energy performance estimates
No quantification of the impact of risk factors
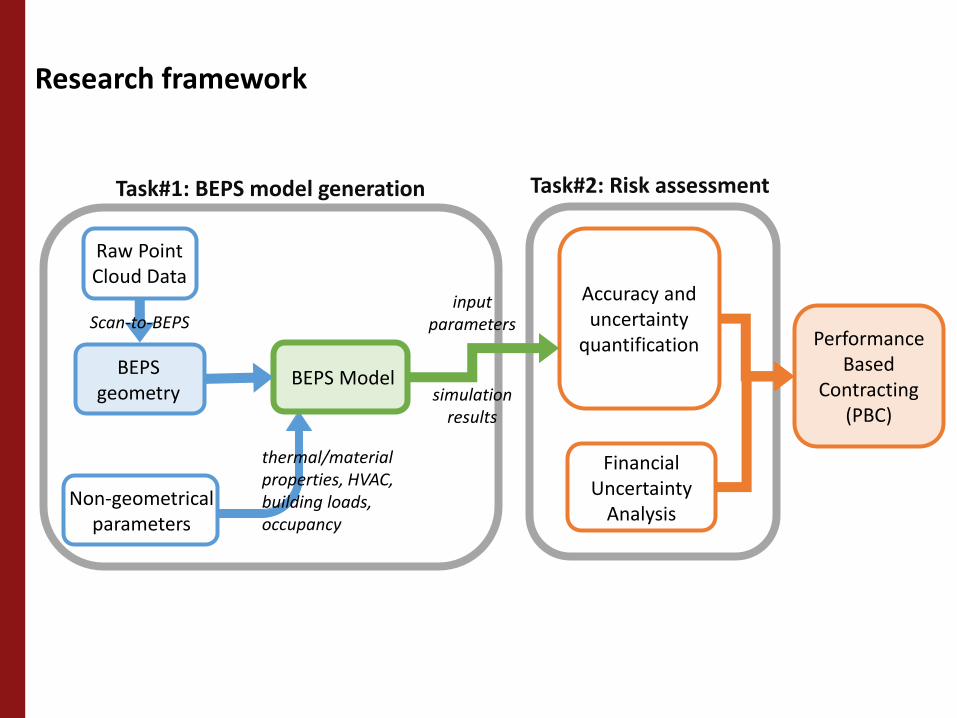
Task#2: Risk assessmentTask#1: BEPS model generation
Raw Point Cloud Data
BEPS geometry
Non-geometrical parameters
BEPS Model
thermal/material properties, HVAC, building loads, occupancy
Accuracy anduncertainty
quantification
Financial Uncertainty
Analysis
Performance Based
Contracting(PBC)
simulation results
Scan-to-BEPSinput
parameters
Research framework
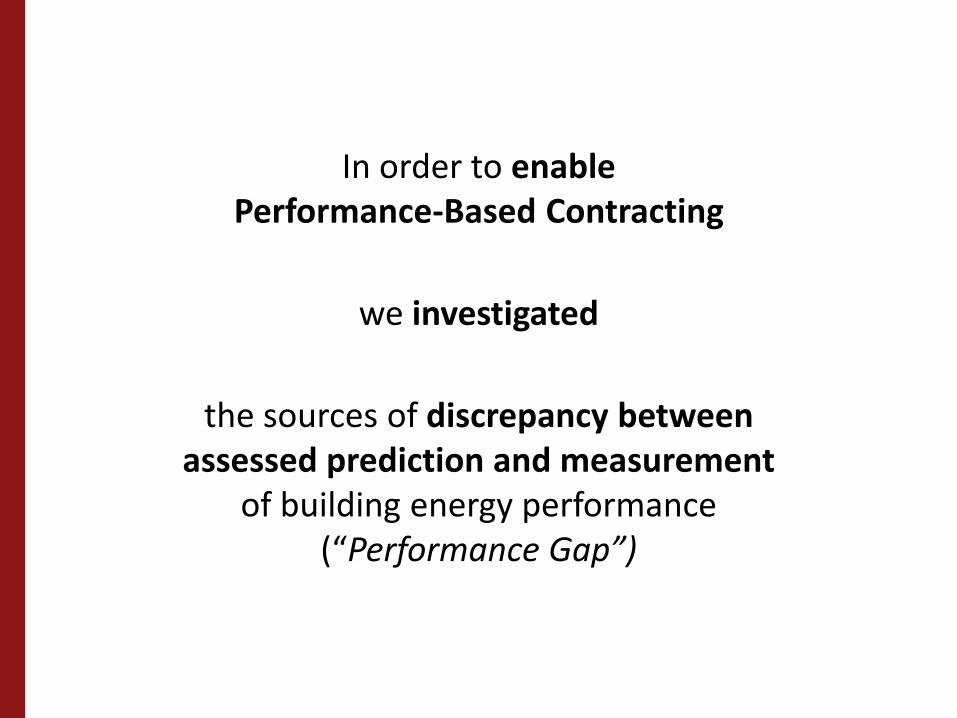
In order to enable Performance-Based Contracting
we investigated
the sources of discrepancy betweenassessed prediction and measurement
of building energy performance(“Performance Gap”)
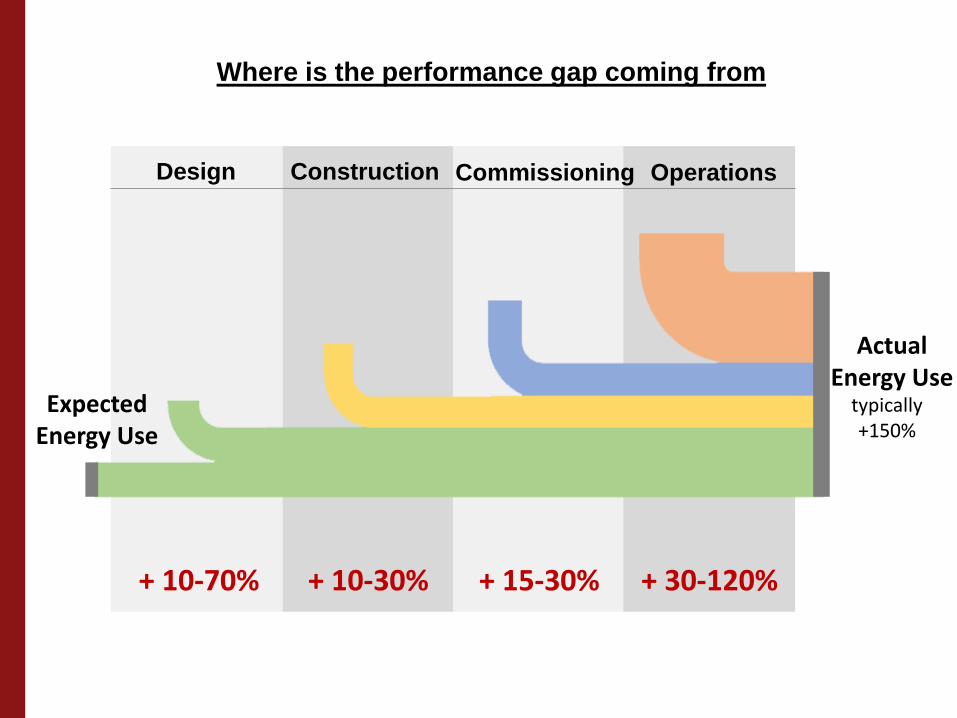
Where is the performance gap coming from
ExpectedEnergy Use
+ 10-70% + 10-30% + 15-30% + 30-120%
ActualEnergy Use
typically +150%
ConstructionDesign Commissioning Operations
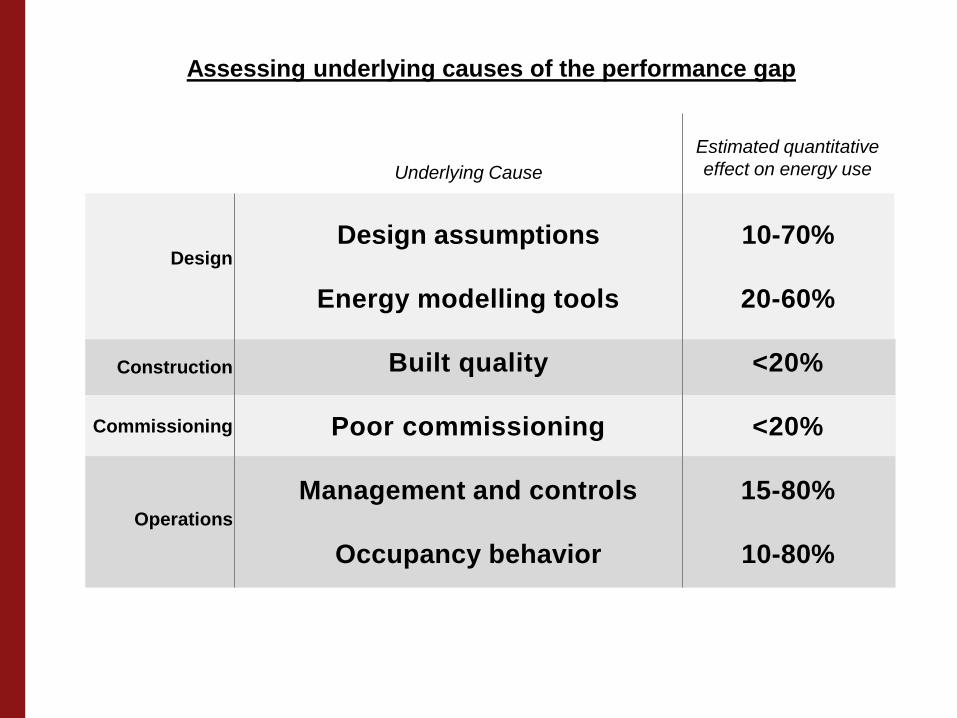
Assessing underlying causes of the performance gap
Design assumptions
Energy modelling tools
Built quality
Poor commissioning
Management and controls
Occupancy behavior
Construction
Design
Commissioning
Operations
10-70%
20-60%
<20%
<20%
15-80%
10-80%
Estimated quantitative
effect on energy useUnderlying Cause
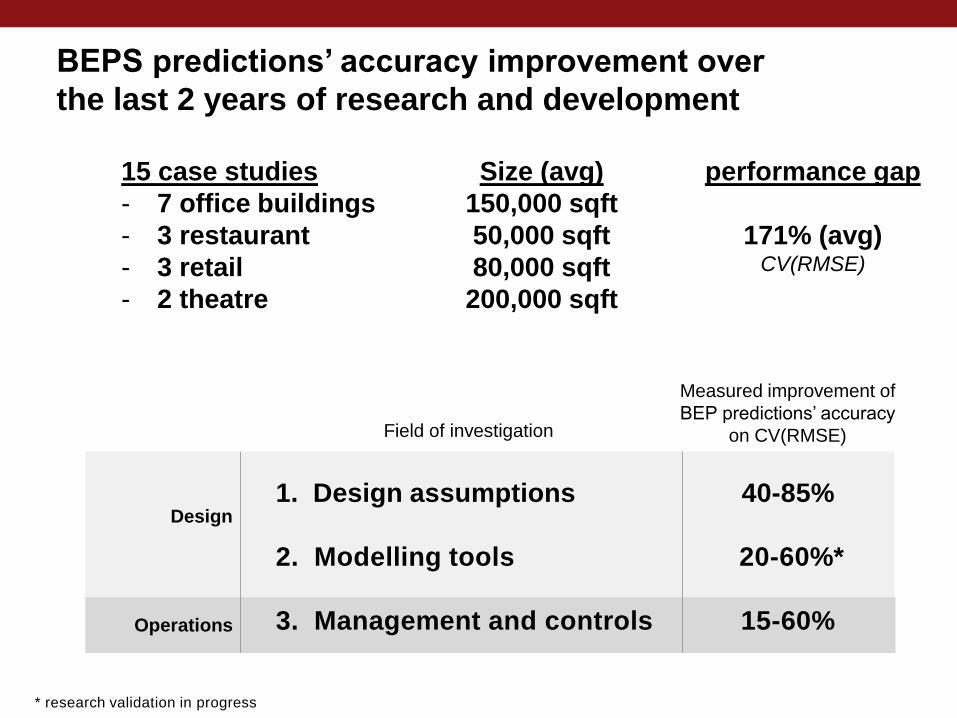
1. Design assumptions
2. Modelling tools
3. Management and controls
Design
Operations
40-85%
20-60%*
15-60%
Measured improvement of
BEP predictions’ accuracy
on CV(RMSE)Field of investigation
* research validation in progress
BEPS predictions’ accuracy improvement over
the last 2 years of research and development
15 case studies
- 7 office buildings
- 3 restaurant
- 3 retail
- 2 theatre
Size (avg)
150,000 sqft
50,000 sqft
80,000 sqft
200,000 sqft
performance gap
171% (avg)CV(RMSE)
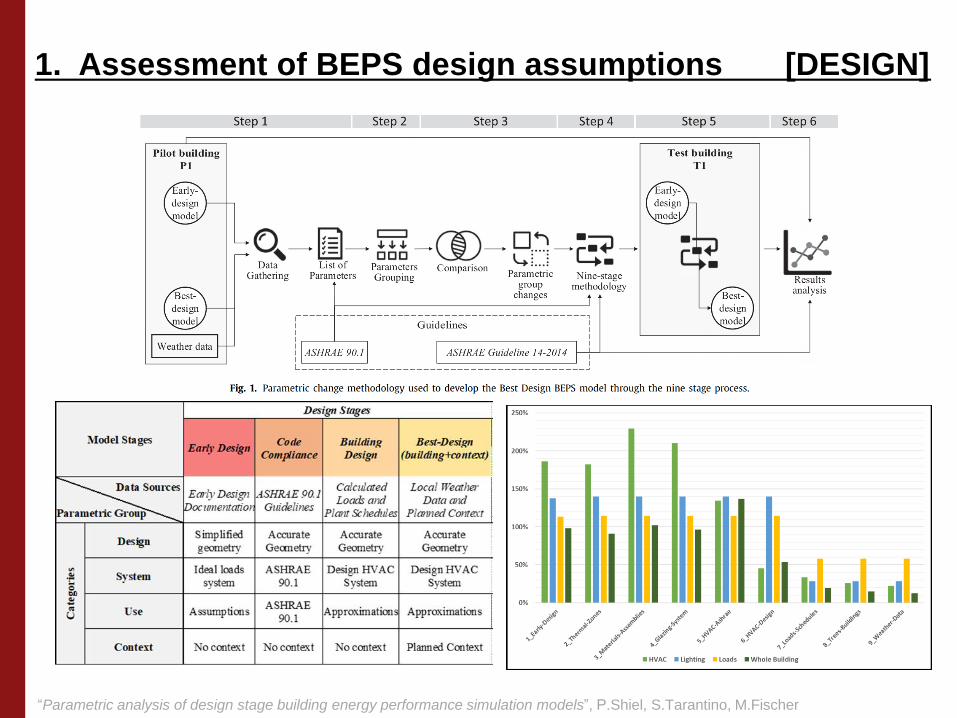
1. Assessment of BEPS design assumptions [DESIGN]
“Parametric analysis of design stage building energy performance simulation models”, P.Shiel, S.Tarantino, M.Fischer
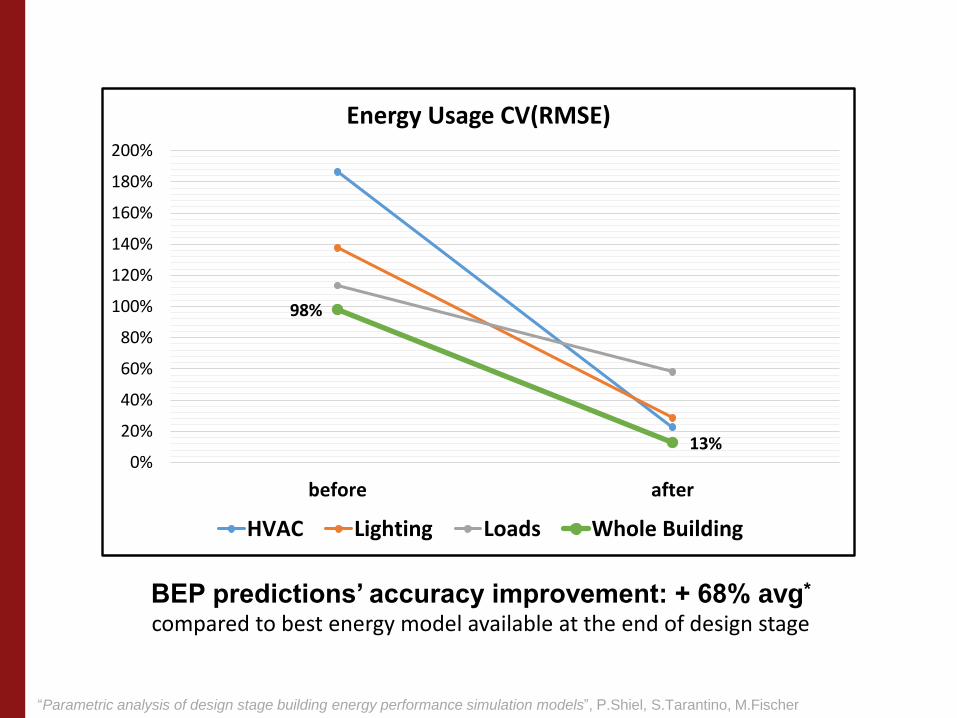
“Parametric analysis of design stage building energy performance simulation models”, P.Shiel, S.Tarantino, M.Fischer
98%
13%0%
20%
40%
60%
80%
100%
120%
140%
160%
180%
200%
before after
Energy Usage CV(RMSE)
HVAC Lighting Loads Whole Building
BEP predictions’ accuracy improvement: + 68% avg*
compared to best energy model available at the end of design stage
Hundreds of errors Manually re-entering building information
Missing
spaces/elements
Dislocated
elements
Space-
Element
Alignment
Incorrect
normal vector
BIM
construction-oriented details
3D elements
no seamless transition
time consuming
extensive manual post-processing
BEPS
simplified geometry
2D surfaces
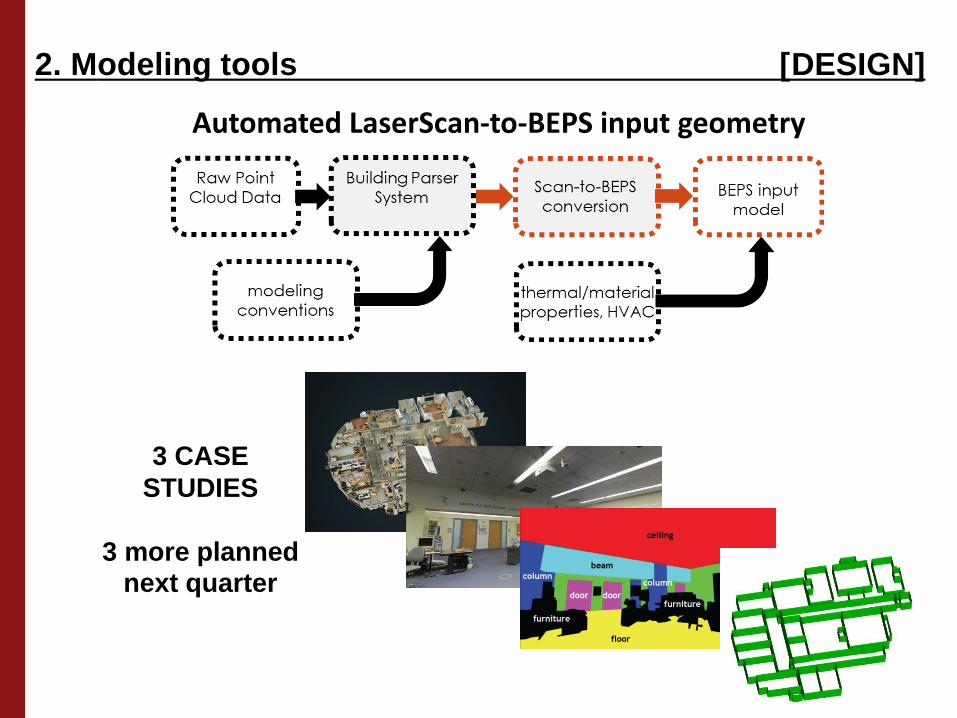
2. Modeling tools [DESIGN]
Automated LaserScan-to-BEPS input geometry
3 CASE
STUDIES
3 more planned next quarter
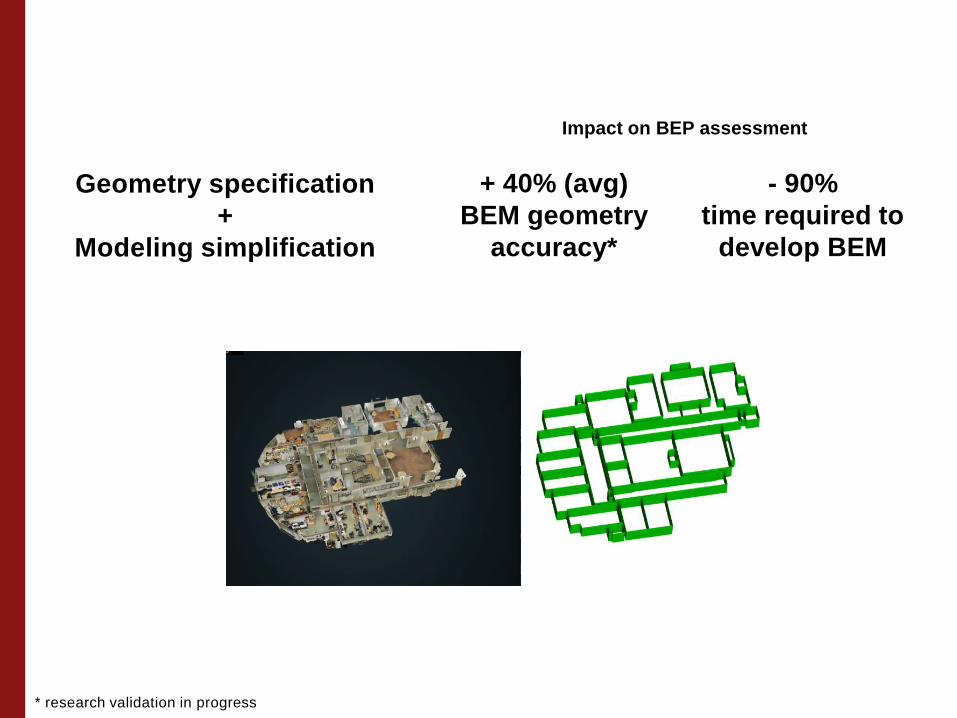
Geometry specification
+
Modeling simplification
+ 40% (avg)
BEM geometry
accuracy*
Impact on BEP assessment
- 90%
time required to
develop BEM
* research validation in progress
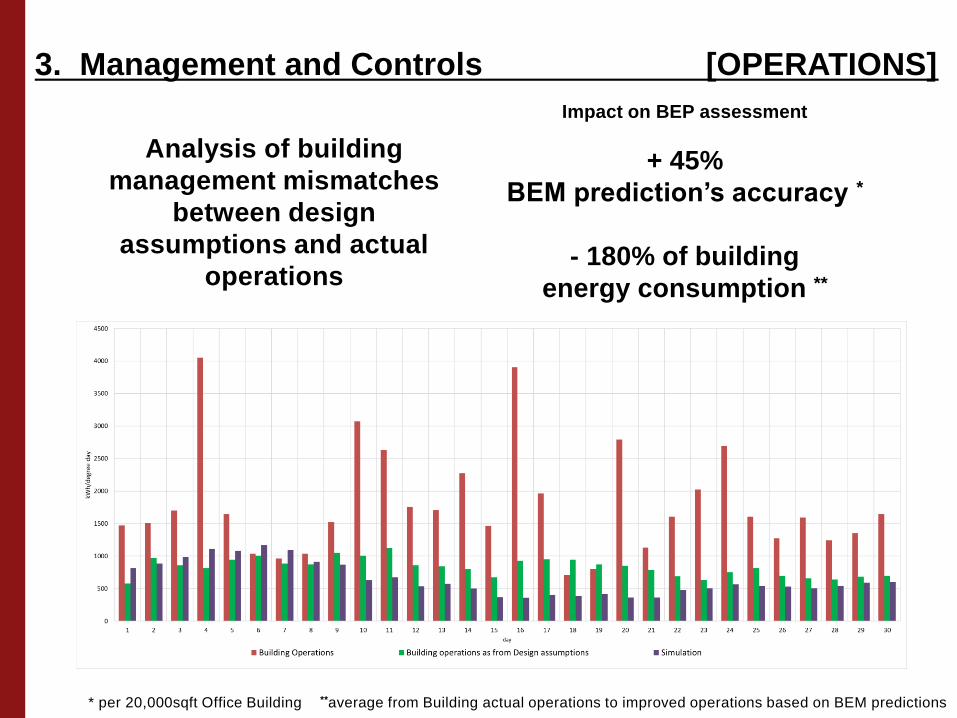
Analysis of building
management mismatches
between design
assumptions and actual
operations
+ 45%
BEM prediction’s accuracy *
- 180% of building
energy consumption **
Impact on BEP assessment
3. Management and Controls [OPERATIONS]
* per 20,000sqft Office Building **average from Building actual operations to improved operations based on BEM predictions
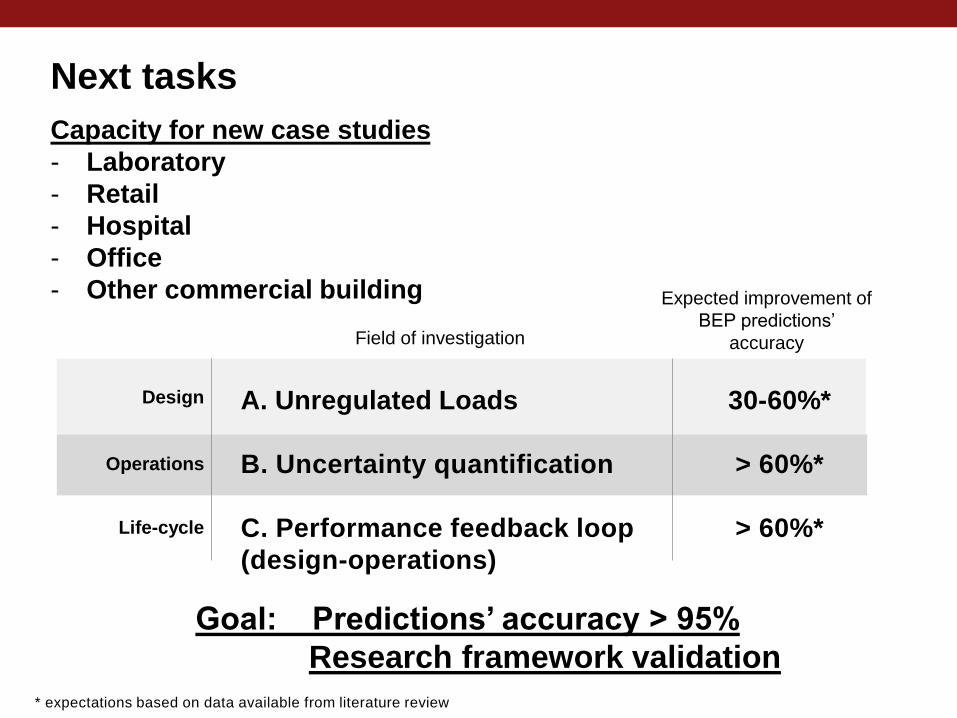
A. Unregulated Loads
B. Uncertainty quantification
C. Performance feedback loop
(design-operations)
Design
Operations
30-60%*
> 60%*
> 60%*
Expected improvement of
BEP predictions’
accuracyField of investigation
* expectations based on data available from literature review
Next tasks
Capacity for new case studies
- Laboratory
- Retail
- Hospital
- Office
- Other commercial building
Life-cycle
Goal: Predictions’ accuracy > 95%
Research framework validation

Thank you
Questions?


Appendix
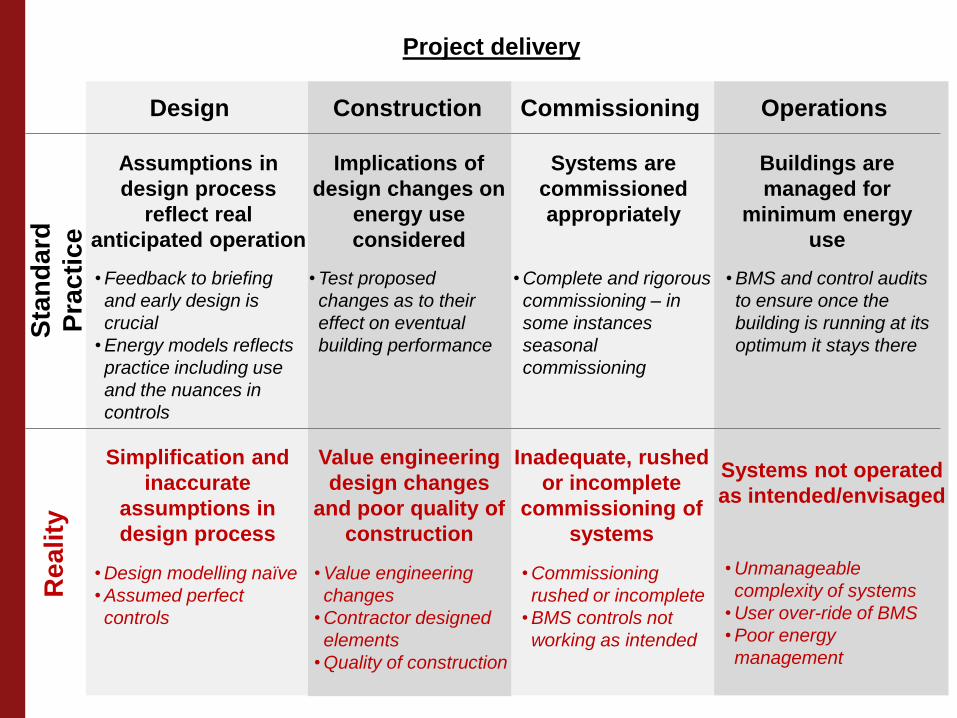
Project delivery
ConstructionDesign Commissioning Operations
Implications of
design changes on
energy use
considered
• Test proposed
changes as to their
effect on eventual
building performance
Systems are
commissioned
appropriately
• Complete and rigorous
commissioning – in
some instances
seasonal
commissioning
Buildings are
managed for
minimum energy
use
• BMS and control audits
to ensure once the
building is running at its
optimum it stays there
Sta
nd
ard
Pra
cti
ce
Simplification and
inaccurate
assumptions in
design process
Value engineering
design changes
and poor quality of
construction
Inadequate, rushed
or incomplete
commissioning of
systems
Systems not operated
as intended/envisaged
• Design modelling naïve
• Assumed perfect
controls
• Value engineering
changes
• Contractor designed
elements
• Quality of construction
• Commissioning
rushed or incomplete
• BMS controls not
working as intended
• Unmanageable
complexity of systems
• User over-ride of BMS
• Poor energy
management
Reality
Assumptions in
design process
reflect real
anticipated operation
• Feedback to briefing
and early design is
crucial
• Energy models reflects
practice including use
and the nuances in
controls
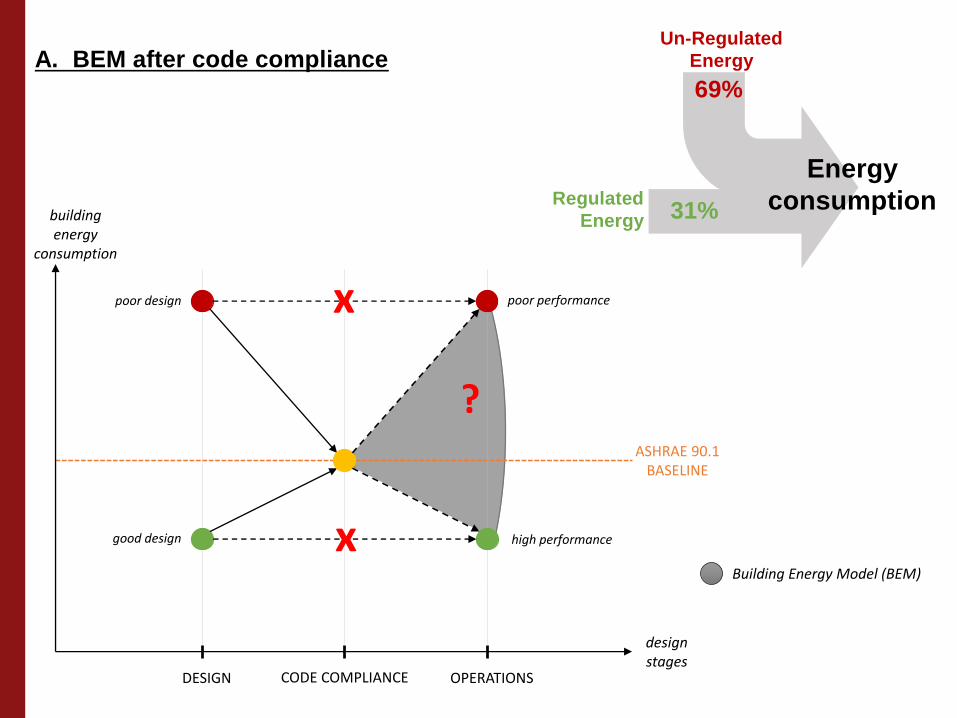
?
CODE COMPLIANCE
ASHRAE 90.1BASELINE
building energy
consumption
design stages
good design
poor design
high performance
poor performance
DESIGN OPERATIONS
x
x
Regulated
Energy 31%
69%
Un-Regulated
Energy
Energy
consumption
Building Energy Model (BEM)
A. BEM after code compliance
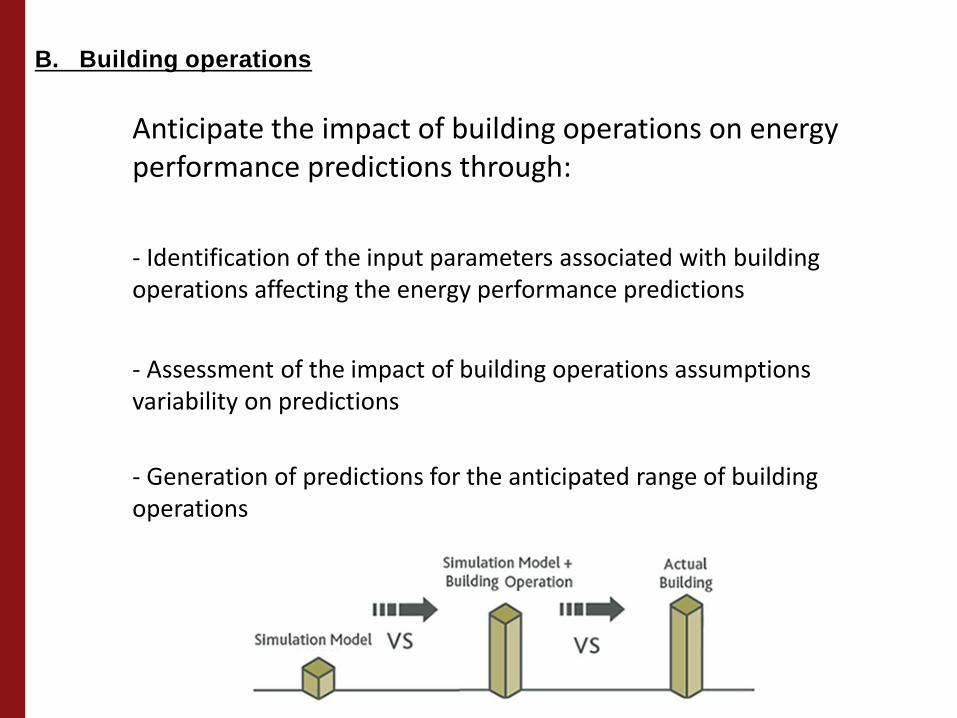
B. Building operations
Anticipate the impact of building operations on energy performance predictions through:
- Assessment of the impact of building operations assumptions variability on predictions
- Identification of the input parameters associated with building operations affecting the energy performance predictions
- Generation of predictions for the anticipated range of building operations
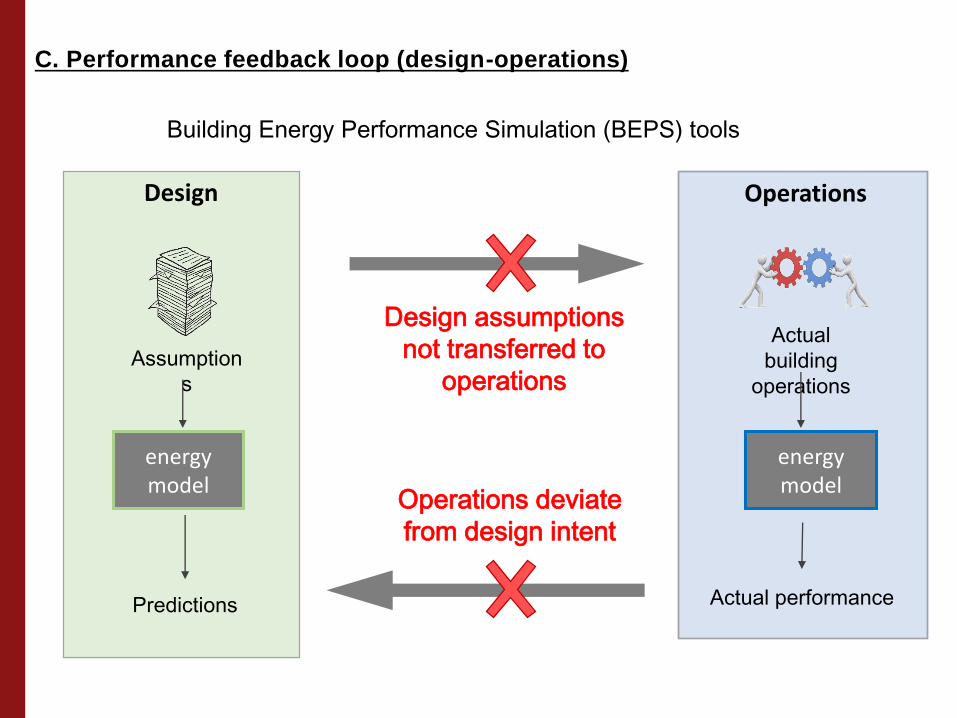
C. Performance feedback loop (design-operations)
Building Energy Performance Simulation (BEPS) tools
Design assumptions
not transferred to
operations
Operations deviate
from design intent
Design
energy model
Assumption
s
Predictions
Operations
Actual
building
operations
Actual performance
energy model

Case study
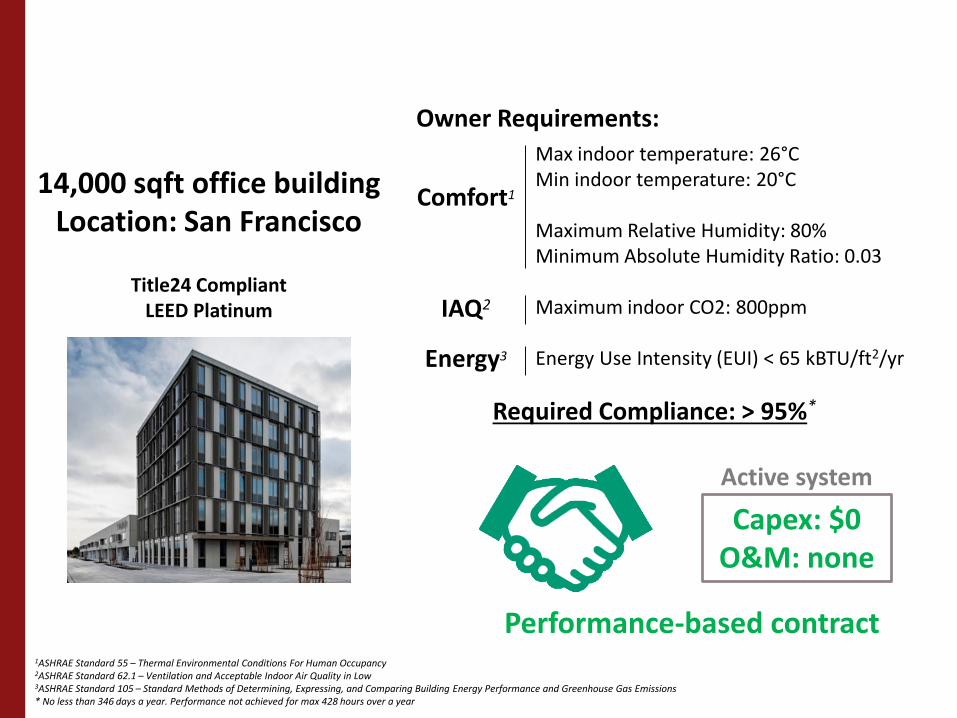
Max indoor temperature: 26°CMin indoor temperature: 20°C
Maximum Relative Humidity: 80%Minimum Absolute Humidity Ratio: 0.03
Maximum indoor CO2: 800ppm
Energy Use Intensity (EUI) < 65 kBTU/ft2/yr
14,000 sqft office buildingLocation: San Francisco
Title24 CompliantLEED Platinum
Performance-based contract
Active system
Capex: $0O&M: none
Comfort1
Owner Requirements:
IAQ2
Energy3
Required Compliance: > 95%*
1ASHRAE Standard 55 – Thermal Environmental Conditions For Human Occupancy2ASHRAE Standard 62.1 – Ventilation and Acceptable Indoor Air Quality in Low3ASHRAE Standard 105 – Standard Methods of Determining, Expressing, and Comparing Building Energy Performance and Greenhouse Gas Emissions* No less than 346 days a year. Performance not achieved for max 428 hours over a year
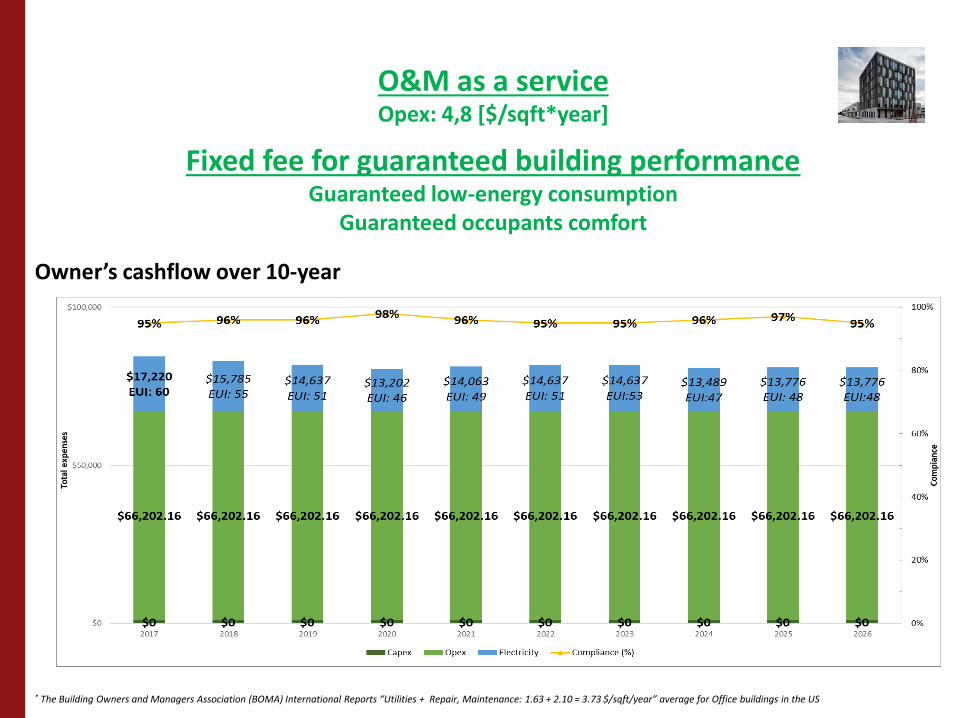
O&M as a serviceOpex: 4,8 [$/sqft*year]
Fixed fee for guaranteed building performance Guaranteed low-energy consumption
Guaranteed occupants comfort
Owner’s cashflow over 10-year
* The Building Owners and Managers Association (BOMA) International Reports “Utilities + Repair, Maintenance: 1.63 + 2.10 = 3.73 $/sqft/year” average for Office buildings in the US
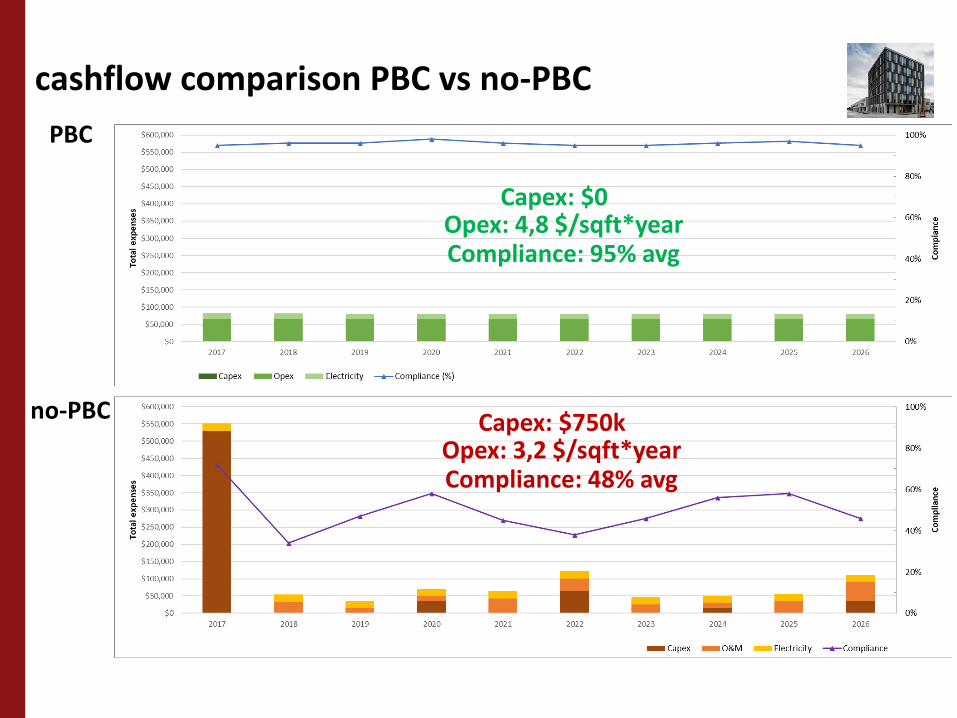
cashflow comparison PBC vs no-PBC
PBC
no-PBC
Capex: $0Opex: 4,8 $/sqft*yearCompliance: 95% avg
Capex: $750kOpex: 3,2 $/sqft*yearCompliance: 48% avg