Embed Size (px)
Citation preview
ASSESSMENT AND PREDICTION OF DAYLIGHT PERFORMANCE IN HIGH-RISE OFFICE BUILDINGS
DONG-HWAN KO*, MAHJOUB ELNIMEIRI AND RAYMOND J. CLARKCollege of Architecture, Illinois Institute of Technology, Chicago, Illinois, USA
SUMMARY
Effective use of daylighting is an essential component to achieve a sustainable building design. In a tall building, the amount of useable space with a potential for the use of daylight is the space between the exterior wall and the core. This is commonly referred to as the ‘lease span’. Class A offi ce buildings in the USA have typically utilized lease spans of around 45 ft (13·7 m), primarily due to effi ciency of space usage. In Europe, however, lease spans in high-rise offi ce buildings have typically been shortened due to concerns of natural light penetrations and views. For instance, in Germany, the amount of leasable space per fl oor is less than in the USA. The maximum allowable depth of space in Germany is typically about 18 ft (5·5 m), whereas in the USA, as much as 50 ft (15 m) is no rarity. The lease span also has an impact on other items, such as the aspect ratio, fl oor-to-fl oor height, total height and total fl oor area. In this study, to assess and predict daylight performance, two different requirements were analysed: daylight factor (DF) and the daylight requirement of Leadership in Energy and Environmental Design (LEED) 2.2 green-building rating system. The recommended average DF (DFave) ranges from 2 to 5% and LEED 2.2 requires that a minimum daylight illumination of 25 footcandles be achieved in at least 75% of all regularly occupied areas. This study conducted a series of computer simulations using RADIANCE to fi rst show the effects of each of the fenestration parameters and then to provide an optimum effective aperture to meet the two daylight requirements in four lease span types ranging from 20 to 50 ft. As a fi nal step, regression models and simple evaluation tools were developed to correlate the DF, daylight requirement in LEED 2.2 and the various fenestration parameters, such as window area, visible transmittance and lease span in four different cities (London, Chicago, Dubai and Bangkok). This paper provides a simplifi ed method for evaluating indoor daylight perfor-mance to meet the two daylight requirements. This can be used as a pre-design tool, not only to achieve more credits in LEED 2.2 green-building rating systems, but also to evaluate based on DFave to ensure that the build-ing meets the recommended level. Copyright © 2008 John Wiley & Sons, Ltd.
1. INTRODUCTION
1.1 Daylight
Daylighting in offi ce buildings, widely recognized as an important energy-conservation design strat-egy, requires careful architectural design in order for maximum benefi ts to be realized (Johnson et al., 1985). The amount of daylight entering a building is mainly determined by the window openings that provide the dual function of admitting light to the indoor environment for a more attractive and pleas-ing atmosphere, and allowing people to maintain visual contact with the outside world (Li and Tsang, 2008). It is widely known that electrical energy consumption can be reduced by a daylighting strategy, and there is an increasing demand to design daylight-effi cient buildings.
Besides the energy consumption, daylighting is also related to indoor environmental quality. More-over, the admission of sunlight is an important factor to increase the productivity of occupants. A
Copyright © 2008 John Wiley & Sons, Ltd.
* Correspondence to: Dong-Hwan Ko, College of Architecture, Illinois Institute of Technology, Chicago, IL, USA. E-mail: [email protected]
THE STRUCTURAL DESIGN OF TALL AND SPECIAL BUILDINGSStruct. Design Tall Spec. Build. 17, 953–976 (2008)Published online 28 October 2008 in Wiley Interscience (www.interscience.wiley.com). DOI: 10.1002/tal.474
954 D.-H. KO, M. ELNIMEIRI AND R. J. CLARK
Copyright © 2008 John Wiley & Sons, Ltd. Struct. Design Tall Spec. Build. 17, 953–976 (2008) DOI: 10.1002/tal
recent survey (Dogrusoy and Tureyen, 2007)that was conducted to verify the benefi ts showed that most occupants prefer natural light to artifi cial light, and that the three most important factors were natural light, sunlight and natural ventilation. Another study showed that a group of individuals working in daylight resolved approximately 10% more tasks correctly, as well as being faster and less tired, than a group that had to resolve the same tasks under artifi cial light (WAREMA, 2003). There-fore, building design that includes daylighting architectural features needs to take into consideration, not only the quantity of daylight, but also the occupants’ well-being and health.
1.2 Daylight usage in high-rise buildings
High-rise buildings fi rst appeared in the mid-1960s. They now play an important role in urban com-mercial business districts (Kim, 2004). These have been designed and constructed in major cities, because they have been recognized as one of the solutions for providing the increased space usage within a smallest site area. Whereas 30% of the world’s population lived in urban areas in 1950, the proportion of urban dwellers climbed to 47% in 2000 and is projected to rise to 60% by 2030 (Ho, 2007). Although tall buildings have grown rapidly with the economy, architecture and structural development, the effects of environmental factors have had loss of impact. Because green buildings, eco-architecture and sustainable buildings have now come into the daily vocabulary of both building designers and homebuyers (Niu, 2004), tall buildings should also be designed with a high degree of sustainability in mind.
Historically, in 1950, tall buildings were designed to maximize the natural daylight. For instance, numerous offi ce buildings used an atrium to admit more sunlight to overcome the insuffi cient artifi cial lights. However, in the 1970s, the daylight design method was reduced with the invention of effi cient artifi cial lighting. Moreover, since larger fl oor plates are considered to be more cost-effective in eco-nomical terms, at the request of building owners and developers, there has been a tendency to increase open-plan offi ce areas as much as possible. Thus, the percentage of rentable area can also be increased with a deeper fl oor plan.
However, in order to admit a suffi cient level of daylight or fulfi l the current daylight requirements, the optimum fl oor plan for daylighting is studied in this analysis. The value of the offi ce space can be increased since there is a great demand for buildings that meet the environmental requirements of a green-building rating system and Leadership in Energy and Environmental Design (LEED) certifi ca-tion. Thus, the quantity of daylight may infl uence the lease or renew decisions of tenants. For instance, the leasing rate of LEED-certifi ed buildings is higher than other offi ce buildings and there is a tendency for these to be leased more quickly to major tenants. Moreover, prospective tenants have the choice of a wide variety of spaces and are unlikely to prefer a dim, poorly lit offi ce with little daylight (Light-ing Research Center, 2008). As mentioned in an earlier section, in order to increase the occupants’ productivity and well-being, owners and employees do not want to renew leases for offi ce space that lacks daylight, relying on artifi cial lighting. Therefore, from the environmental point of view, everyone concerned with an offi ce-building project, including the owner, tenants and occupants, prefer daylight-effi cient buildings. Especially in a tall building, the design factors related to rentable area have an impact on the building’s design parameters.
1.3 Current problems
As pointed out in past literature, there have been various problems with daylight application in the building-design process. Although almost architects acknowledge the energy saving and other benefi ts of a daylight-effi cient building, there is a lack of the necessary methods and easy-to-use tools for environmental evaluation at an early stage of a design. It could also be pointed out that the daylight
DAYLIGHT PERFORMANCE IN HIGH-RISE BUILDINGS 955
Copyright © 2008 John Wiley & Sons, Ltd. Struct. Design Tall Spec. Build. 17, 953–976 (2008) DOI: 10.1002/tal
approach to building design has not been common until recently (Grimme and Laar, 2006). Therefore, there are three main barriers to the widespread use of daylight strategies. First is a lack of awareness of the impact of daylight in the design process. A recent study (Krarti et al., 2005) showed that quick decisions in the early stages of a design can have a large impact on the performance of the fi nished building. For example, choices about the overall form of the building, the depth and height of rooms, and the size of windows can together double the eventual energy consumption of the fi nished building. They can also halve the daylight levels, and later in the design process, radical design changes are rarely practical. According to another study (Canziani et al., 2004), there has been a progressive abandoning of daylighting in building planning; the forecast of daylighting behaviour is generally tackled in an inadequate way and considered only when the project is fi nished. In sum, since building design is a complicated process, the critical decisions related to the daylight performance should be considered and discussed during the schematic design process.
Second, the fenestration design may not be properly analysed in the glazing façade. The glass type and size are proportional to the level of daylighting and effi cient daylighting techniques, and depend on the proper integration of both window area and properties. Improperly designed or installed glass could not only lead to poor daylighting in building interiors, it could also contribute to fatigue, in somnia, depression and seasonal affective disorder (Wilson et al., 2002). Moreover, a recent survey investigated whether the glass selected provides the recommended daylight factor (DF). The results revealed that the glazing was misused in 70% of the buildings in the Gulf region. The DF in the selected offi ce building was unexpectedly high and was found to be far beyond the recommended level due to the misuse of glazing (Aboulnaga, 2006). Therefore, architects should be very careful when the fenestration parameters are selected, to ensure that they meet the daylight requirements. Because of these problems, only 14% of Colorado LEED-certifi ed projects successfully met the LEED daylight credit of ‘EQ 8.1 Daylight and view’ (Colorado Governor’s Offi ce and US Green Building Council (USGBC, 2006).
Third, many researches have been done to improve the energy performance of high-rise buildings to address the importance of façade confi gurations. However, studies on the impact of fenestration parameters and tall-building design for daylight evaluation have not been conducted, such as on the effects of considering LEED 2.2 daylight requirements during planning. Hence, it is of interest to evaluate the amount of daylight needed to meet the daylight requirements for high-rise buildings.
Therefore, this paper presents representative results concerning fenestration parameters to improve daylight quality. Moreover, in order to overcome the problems associated with tall-building daylight design, planning considerations were also considered. Finally, this paper provides a simplifi ed method for evaluating the qualifi ed daylight area based on the two different daylight requirements, DF and the daylight requirement in the LEED 2.2 green-building rating system.
2. DAYLIGHT REQUIREMENTS: DF AND LEED 2.1 AND 2.2
Indoor daylight levels are typically measured by lux or footcandle (FC). In the IESNA Lighting Handbook and Germany DIN standard (IESNA, 2000; Germany DIN 5034–4 Standard, 1994), optimum light levels at the workplane are recommended for generic types of activities. However, designing to meet a recommended level is diffi cult due to changes in the quantity of sunlight by time, location and sky conditions. Thus, instead of calculating the levels of daylight in an indoor space, a DF was created to measure relative light levels (WBDG, 2008). The daylighting performance of a building is always assessed in terms of the DF (Hopkinson et al., 1966). Moreover, in the early design stages, the concept of the average daylight factor (DFave) provides a useful technique for assessing the daylight potential of interior spaces under standard overcast conditions (UCD-OPET (University College Dublin—The Organisation for the Promotion of Energy Technologies), 1994). In the LEED
956 D.-H. KO, M. ELNIMEIRI AND R. J. CLARK
Copyright © 2008 John Wiley & Sons, Ltd. Struct. Design Tall Spec. Build. 17, 953–976 (2008) DOI: 10.1002/tal
green-building rating system, the LEED 2.1 daylight requirement also used the DF. However, in LEED 2.2, which was released on November 2005, the requirements were changed based on a slight limita-tion of the DF.
2.1 DFave
Traditionally, daylighting is often determined in terms of the DF, which by defi nition is the ratio of the internal illuminance to the entire illuminance of an unobstructed sky, expressed as a percentage and generally assumed to be the CIE overcast sky. The DF at any point on a working plane is calcu-lated in terms of the light coming directly from the sky (the Sky Component), light refl ected from outside surfaces (the Externally Refl ected Component) and light refl ected from surfaces within the room (the Internally Refl ected Component) (OPET Energy Research Group, 1994).
In relation to the recommended DF, the design criteria are often expressed in terms of DFave as a way to judge a daylight space. The DFave is the most widely used tool because it can be found in many codes, guides and regulations, as shown below. The British Standards Institution, BS 8206 part 2, recommends a DFave value of at least 2% (BSI, 1992). It states that if electric lighting is not nor-mally to be used during daytime, the DFave should not be less than 5%, and if electric lighting is to be used throughout daytime, the DFave should not be less than 2% if a predominantly daylight appear-ance is wanted. According to the British Council for Offi ces (BCO, 2005) guide, a DFave from 2 to 5% is recommended for an offi ce workplace. Moreover, a recommended DFave of 2% can be found in other literature (CIBSE, 1999; Saridar and Elkadi, 2002). Belgian regulations also include a ‘day-light zone’ procedure, which is defi ned by a DF of 3%. A recent survey of offi ce workers was con-ducted on daylight. Around 270 occupants of 16 buildings around the UK were questioned. First, it was found that their satisfaction with daylight was maximized with a DFave between 2 and 5%. Second, people were generally positive towards daylight. However, the responses showed that people were more likely to be dissatisfi ed with the daylight when the design DFave was over 5%. At these high daylight levels, there were increased complaints of sun and sky glare (Roche et al., 2000). More-over, above 5%, the room is likely to experience thermal problems due to the strong daylight (Brotas and Wilson, 2007).
Even though the DFave is used in many countries, it has some limitations. First, direct sunlight is excluded from the DF calculation due to overcast sky conditions. Whereas this characterization is appropriate for heavily cloudy climates, it should not be used in sunny climates (Brotas and Wilson, 2006). Second, as pointed out in one study (Reinhart, 2006), the credibility of the DF to judge the overall daylight situation in a given building is intrinsically limited. However, the DF has been widely accepted because of the simplicity of the calculation and provides an outline of whether the interior of a given building is dark or bright.
2.2 LEED 2.1 daylight requirement
The LEED rating system has also recognized the importance of natural light entering a building for improving the satisfaction and productivity of occupants while reducing global energy consumption (Aboulnaga, 2006). The LEED scheme is promoted by the US Green Building Council to encourage, among other things, the design of low-energy buildings. LEED is the nationally accepted benchmark for the design, construction and operation of high-performance green buildings (USGBC, 2008b). Especially in the USA, certifi cation by LEED is the most widely used green building certifi cation system. There is also a great demand in Canada and India to get LEED certifi cation.
In LEED 2.1, based on a computer simulation model, daylight requirements were a minimum DF of 2% in 75% of all regularly occupied areas under clear sky conditions, at noon, on the equinox (USGBC, 2002). However, two researches on the LEED 2.1 daylight requirement pointed out some
DAYLIGHT PERFORMANCE IN HIGH-RISE BUILDINGS 957
Copyright © 2008 John Wiley & Sons, Ltd. Struct. Design Tall Spec. Build. 17, 953–976 (2008) DOI: 10.1002/tal
problems concerning these requirements. Nabil and Mardaljevic (2006) conducted simulations and found two cases that did not meet the LEED 2.1 daylight requirement even though a light well was used and shading was implemented. Thus, a reconsideration of the LEED 2.1 daylight rating was suggested. Two studies (Moeck and Yoon, 2004; Yoon and Moeck, 2005) reported the results of DF and electrical light energy saving. Their results showed that the LEED 2.1 criteria cannot be achieved with side lighting.
2.3 LEED 2.2 daylight requirement
In November 2005, a new version, LEED 2.2, was released. As of 1 January 2006, all LEEDs for new construction projects must register under LEED version 2.2. Daylighting is still one of the factors that must be considered while determining the LEED 2.2 credit rating. The requirement for LEED 2.2 EQ Credit 8.1 is phrased as follows: ‘Achieve a minimum daylight illumination level of 25 FC in a minimum of 75% of all regularly occupied areas’ (USGBC, 2005). Although the USGBC is preparing a new version of LEED for 2009, this daylight requirement will not be changed, according to the fi rst public comments (USGBC, 2008a).
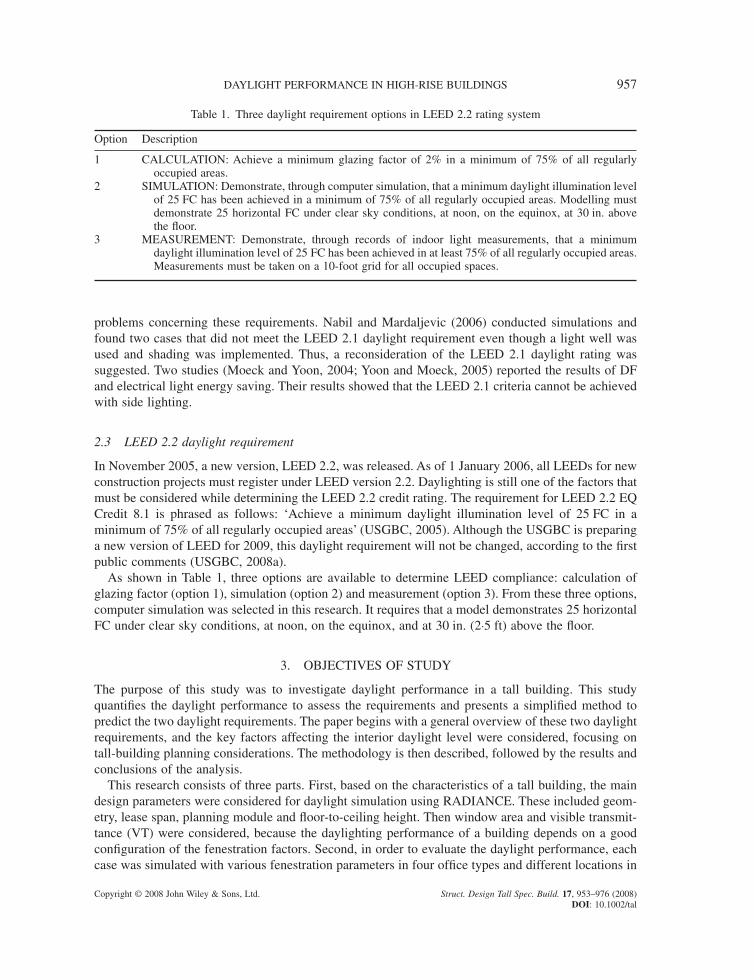
As shown in Table 1, three options are available to determine LEED compliance: calculation of glazing factor (option 1), simulation (option 2) and measurement (option 3). From these three options, computer simulation was selected in this research. It requires that a model demonstrates 25 horizontal FC under clear sky conditions, at noon, on the equinox, and at 30 in. (2·5 ft) above the fl oor.
3. OBJECTIVES OF STUDY
The purpose of this study was to investigate daylight performance in a tall building. This study quantifi es the daylight performance to assess the requirements and presents a simplifi ed method to predict the two daylight requirements. The paper begins with a general overview of these two daylight requirements, and the key factors affecting the interior daylight level were considered, focusing on tall-building planning considerations. The methodology is then described, followed by the results and conclusions of the analysis.
This research consists of three parts. First, based on the characteristics of a tall building, the main design parameters were considered for daylight simulation using RADIANCE. These included geom-etry, lease span, planning module and fl oor-to-ceiling height. Then window area and visible transmit-tance (VT) were considered, because the daylighting performance of a building depends on a good confi guration of the fenestration factors. Second, in order to evaluate the daylight performance, each case was simulated with various fenestration parameters in four offi ce types and different locations in
Table 1. Three daylight requirement options in LEED 2.2 rating system
Option Description
1 CALCULATION: Achieve a minimum glazing factor of 2% in a minimum of 75% of all regularly occupied areas.
2 SIMULATION: Demonstrate, through computer simulation, that a minimum daylight illumination level of 25 FC has been achieved in a minimum of 75% of all regularly occupied areas. Modelling must demonstrate 25 horizontal FC under clear sky conditions, at noon, on the equinox, at 30 in. above the fl oor.
3 MEASUREMENT: Demonstrate, through records of indoor light measurements, that a minimum daylight illumination level of 25 FC has been achieved in at least 75% of all regularly occupied areas. Measurements must be taken on a 10-foot grid for all occupied spaces.
958 D.-H. KO, M. ELNIMEIRI AND R. J. CLARK
Copyright © 2008 John Wiley & Sons, Ltd. Struct. Design Tall Spec. Build. 17, 953–976 (2008) DOI: 10.1002/tal
London, Chicago, Dubai and Bangkok. Thus, three main daylight results, DFave, average indoor illuminance and area percentage over 25 FC are presented and the effects of the fenestration param-eters are discussed. In the next step, to provide an evaluation method for different lease spans, ranging from 20 to 50 ft, the optimum effective aperture (EA) value, integrated with window size and VT, was determined. Third, based on the parametric simulation results, DF, and area percentage over 25 FC, regression analyses were conducted to verify the relationships with various parameters. Using a correlation analysis, the two daylight requirements could be predicted for tall-building design by a simplifi ed method using the ratio of the effective aperture to lease span. This resulted in the develop-ment of a simplifi ed procedure that can provide a prediction of the two daylight requirements. This could be considered by architects and engineers during the design process to achieve good daylight distribution.
4. METHODOLOGY
4.1 Planning consideration for tall buildings
The design of tall buildings could be determined by design factors that are dependent upon planning considerations, such as building functions, core planning, lease spans and fl oor-to-fl oor height. These considerations are interdependent and affect the overall design of a tall building (Park et al., 2004). In other words, a change in one planning consideration will generally result in variations in others. For example, a change in the lease span will affect the building aspect ratio, and therefore, the overall structural, architectural and mechanical systems of a tall building can be changed. This means that designers must understand the basic planning factors for tall offi ce buildings to achieve the optimum daylight level.
Therefore, a comprehensive design approach is needed in terms of variable planning conditions, such as overall building geometry, lease span, module and fenestration parameters. The following chapters will address the main parameters in this research, which will aid in the design and construc-tion of tall buildings to meet the daylight requirements in the schematic design process.
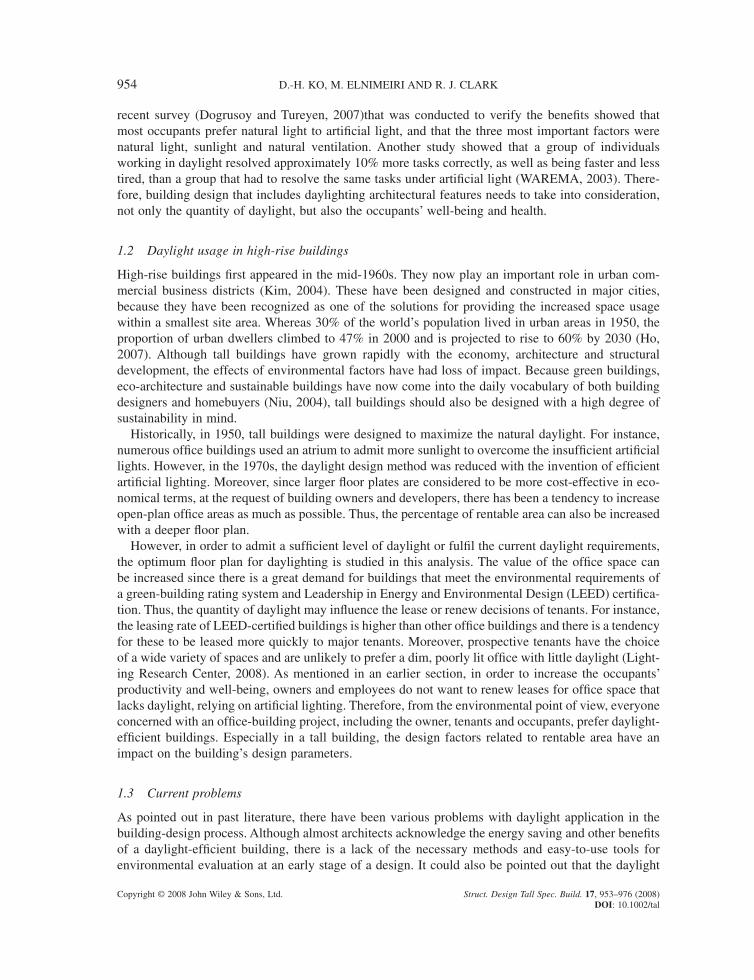
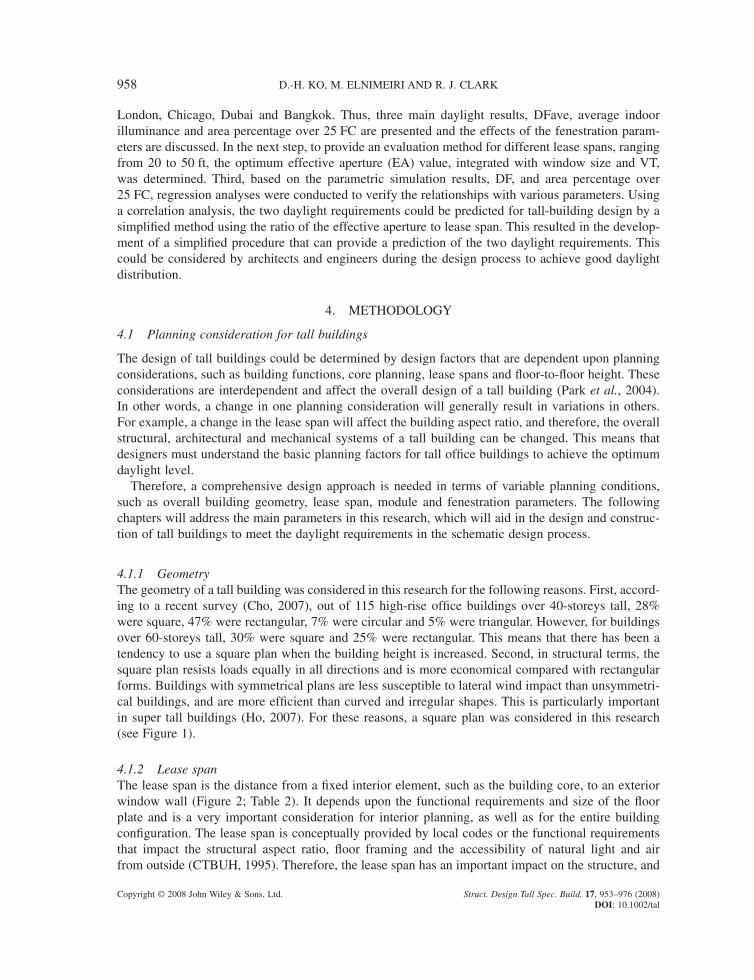
4.1.1 GeometryThe geometry of a tall building was considered in this research for the following reasons. First, accord-ing to a recent survey (Cho, 2007), out of 115 high-rise offi ce buildings over 40-storeys tall, 28% were square, 47% were rectangular, 7% were circular and 5% were triangular. However, for buildings over 60-storeys tall, 30% were square and 25% were rectangular. This means that there has been a tendency to use a square plan when the building height is increased. Second, in structural terms, the square plan resists loads equally in all directions and is more economical compared with rectangular forms. Buildings with symmetrical plans are less susceptible to lateral wind impact than unsymmetri-cal buildings, and are more effi cient than curved and irregular shapes. This is particularly important in super tall buildings (Ho, 2007). For these reasons, a square plan was considered in this research (see Figure 1).
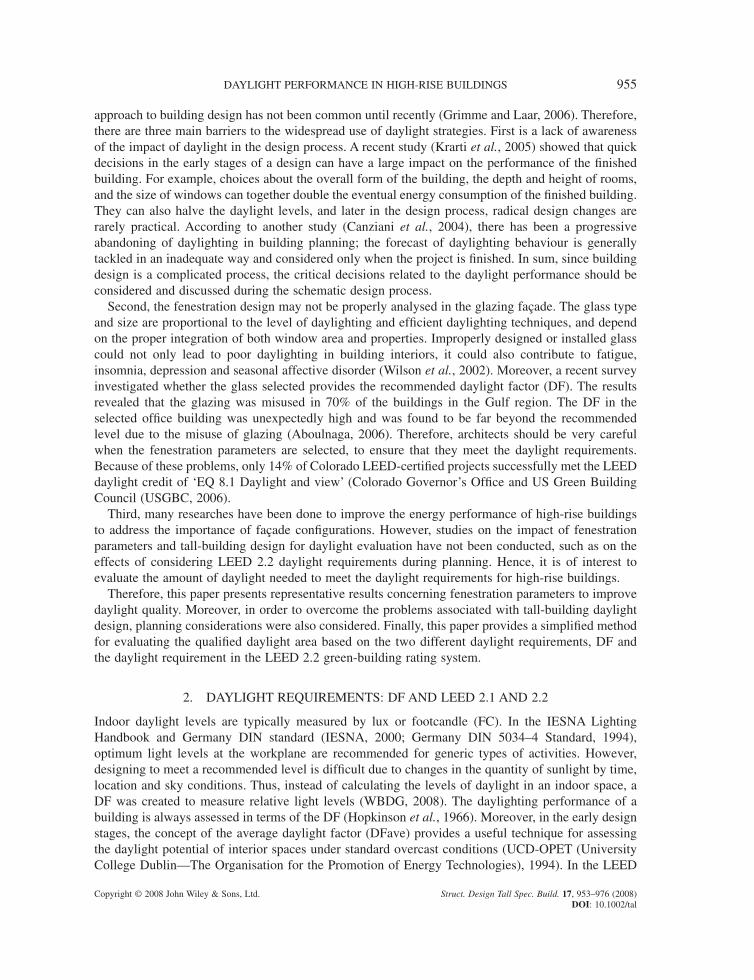
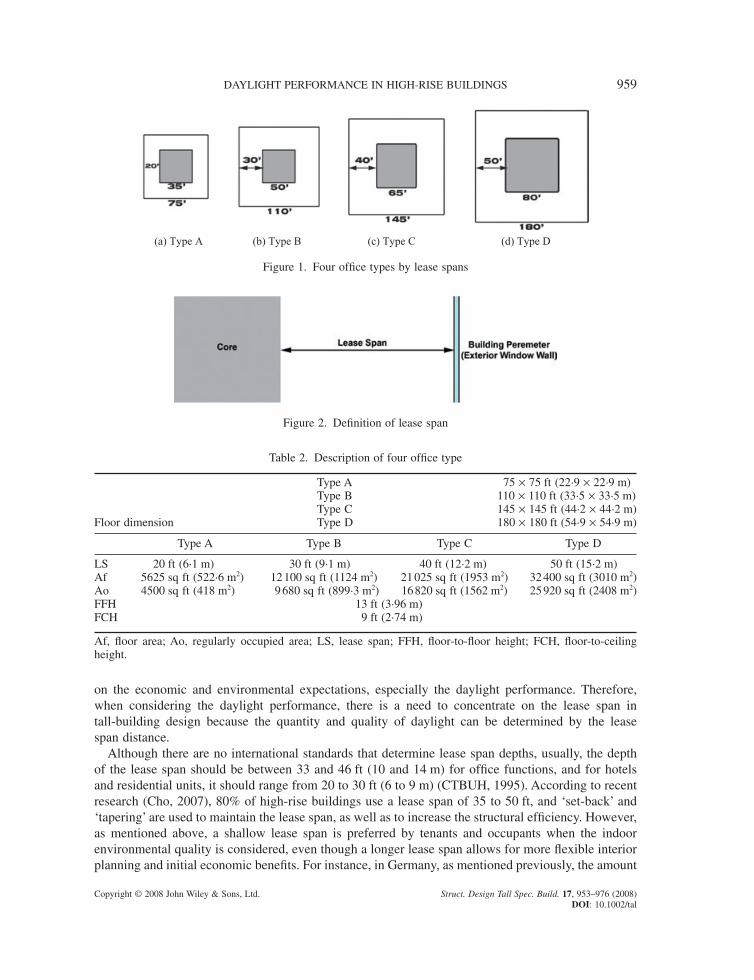
4.1.2 Lease spanThe lease span is the distance from a fi xed interior element, such as the building core, to an exterior window wall (Figure 2; Table 2). It depends upon the functional requirements and size of the fl oor plate and is a very important consideration for interior planning, as well as for the entire building confi guration. The lease span is conceptually provided by local codes or the functional requirements that impact the structural aspect ratio, fl oor framing and the accessibility of natural light and air from outside (CTBUH, 1995). Therefore, the lease span has an important impact on the structure, and
DAYLIGHT PERFORMANCE IN HIGH-RISE BUILDINGS 959
Copyright © 2008 John Wiley & Sons, Ltd. Struct. Design Tall Spec. Build. 17, 953–976 (2008) DOI: 10.1002/tal
on the economic and environmental expectations, especially the daylight performance. Therefore, when considering the daylight performance, there is a need to concentrate on the lease span in tall-building design because the quantity and quality of daylight can be determined by the lease span distance.
Although there are no international standards that determine lease span depths, usually, the depth of the lease span should be between 33 and 46 ft (10 and 14 m) for offi ce functions, and for hotels and residential units, it should range from 20 to 30 ft (6 to 9 m) (CTBUH, 1995). According to recent research (Cho, 2007), 80% of high-rise buildings use a lease span of 35 to 50 ft, and ‘set-back’ and ‘tapering’ are used to maintain the lease span, as well as to increase the structural effi ciency. However, as mentioned above, a shallow lease span is preferred by tenants and occupants when the indoor environmental quality is considered, even though a longer lease span allows for more fl exible interior planning and initial economic benefi ts. For instance, in Germany, as mentioned previously, the amount
(a) Type A (b) Type B (c) Type C (d) Type D
Table 2. Description of four offi ce type
Type A 75 × 75 ft (22·9 × 22·9 m) Type B 110 × 110 ft (33·5 × 33·5 m) Type C 145 × 145 ft (44·2 × 44·2 m)Floor dimension Type D 180 × 180 ft (54·9 × 54·9 m)
Type A Type B Type C Type D
LS 20 ft (6·1 m) 30 ft (9·1 m) 40 ft (12·2 m) 50 ft (15·2 m)Af 5625 sq ft (522·6 m2) 12 100 sq ft (1124 m2) 21 025 sq ft (1953 m2) 32 400 sq ft (3010 m2)Ao 4500 sq ft (418 m2) 9 680 sq ft (899·3 m2) 16 820 sq ft (1562 m2) 25 920 sq ft (2408 m2)FFH 13 ft (3·96 m)FCH 9 ft (2·74 m)
Af, fl oor area; Ao, regularly occupied area; LS, lease span; FFH, fl oor-to-fl oor height; FCH, fl oor-to-ceiling height.
Figure 1. Four offi ce types by lease spans
Figure 2. Defi nition of lease span
960 D.-H. KO, M. ELNIMEIRI AND R. J. CLARK
Copyright © 2008 John Wiley & Sons, Ltd. Struct. Design Tall Spec. Build. 17, 953–976 (2008) DOI: 10.1002/tal
of leasable space per fl oor is less than in the USA. The maximum allowable depth of space in Germany is typically about 18 ft (5·5 m), whereas in the USA, as much as 50 ft (15 m) is no rarity (Jappsen, 2002). Moreover, one study (Shpuza, 2006) considered four types of lease span, which were character-ized by the depth of the space: very deep, deep, medium and shallow. A very deep space was described as being over 66 ft (20 m) deep, a deep space was 36–62 ft (11–19 m) deep, medium was 20–33 ft (6–10 m) and a shallow space was 13–16 ft (4–5 m) deep.
Therefore, based on the collected lease span range data mentioned above, four offi ce types with lease spans ranging from 20 to 50 ft were considered and simulated in this research, as shown in Figure 2. This research addresses the optimum daylight performance by coupling the various lease spans with fenestration parameters, to meet the two different daylight requirements of the DF and LEED 2.2.
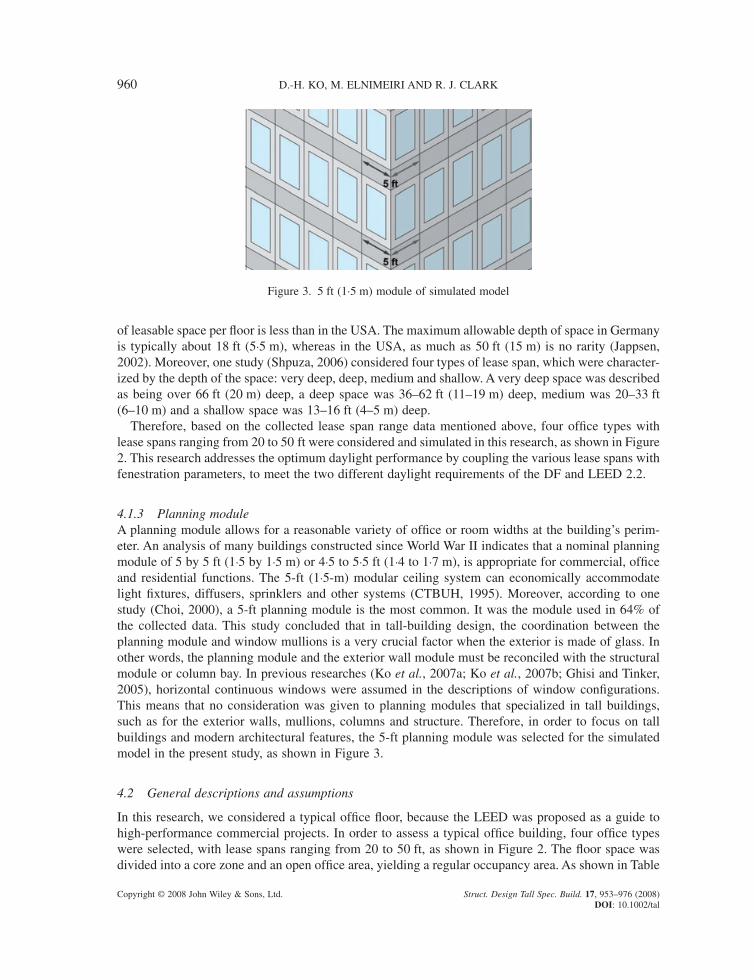
4.1.3 Planning moduleA planning module allows for a reasonable variety of offi ce or room widths at the building’s perim-eter. An analysis of many buildings constructed since World War II indicates that a nominal planning module of 5 by 5 ft (1·5 by 1·5 m) or 4·5 to 5·5 ft (1·4 to 1·7 m), is appropriate for commercial, offi ce and residential functions. The 5-ft (1·5-m) modular ceiling system can economically accommodate light fi xtures, diffusers, sprinklers and other systems (CTBUH, 1995). Moreover, according to one study (Choi, 2000), a 5-ft planning module is the most common. It was the module used in 64% of the collected data. This study concluded that in tall-building design, the coordination between the planning module and window mullions is a very crucial factor when the exterior is made of glass. In other words, the planning module and the exterior wall module must be reconciled with the structural module or column bay. In previous researches (Ko et al., 2007a; Ko et al., 2007b; Ghisi and Tinker, 2005), horizontal continuous windows were assumed in the descriptions of window confi gurations. This means that no consideration was given to planning modules that specialized in tall buildings, such as for the exterior walls, mullions, columns and structure. Therefore, in order to focus on tall buildings and modern architectural features, the 5-ft planning module was selected for the simulated model in the present study, as shown in Figure 3.
4.2 General descriptions and assumptions
In this research, we considered a typical offi ce fl oor, because the LEED was proposed as a guide to high-performance commercial projects. In order to assess a typical offi ce building, four offi ce types were selected, with lease spans ranging from 20 to 50 ft, as shown in Figure 2. The fl oor space was divided into a core zone and an open offi ce area, yielding a regular occupancy area. As shown in Table
Figure 3. 5 ft (1·5 m) module of simulated model
DAYLIGHT PERFORMANCE IN HIGH-RISE BUILDINGS 961
Copyright © 2008 John Wiley & Sons, Ltd. Struct. Design Tall Spec. Build. 17, 953–976 (2008) DOI: 10.1002/tal
1, one of the most important parameters in LEED is the area classifi ed as the ‘regularly occupied area’. In LEED, spaces such as photocopy rooms, storage areas, mechanical plant rooms, laundries and other low-occupancy support areas are excluded from the classifi cation. In this paper, a regularly occupied area is assumed to be an open-plan offi ce area. Therefore, the regularly occupied area (white) was considered in each simulation because the LEED 2.2 requirements are based on this area. Therefore, the core area (grey) was excluded for calculating daylight performance. The area percentage for the regularly occupied area was 80 in all four offi ce types. The fl oor-to-ceiling height was 9 ft (2·74 m). For the ground refl ectance, the prototype was considered to be on an upper fl oor of a high-rise offi ce building. The fl oor was assumed to be located at a height of about 150 ft above the ground, with a refl ectance of 30%. For the interior refl ectance, values of 80% for the ceiling, 50% for the walls and 20% for the fl oor were set in the simulation based on IESNA-recommended surface refl ectance. The general assumptions and parameters are listed in Table 3.
4.3 Daylight simulation program: RADIANCE
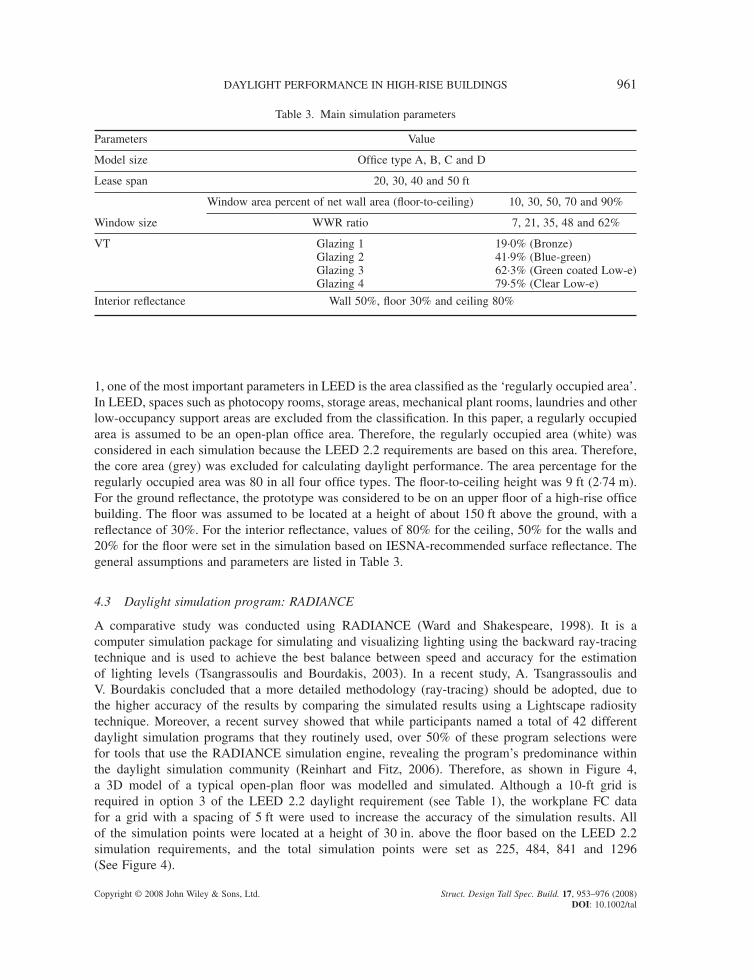
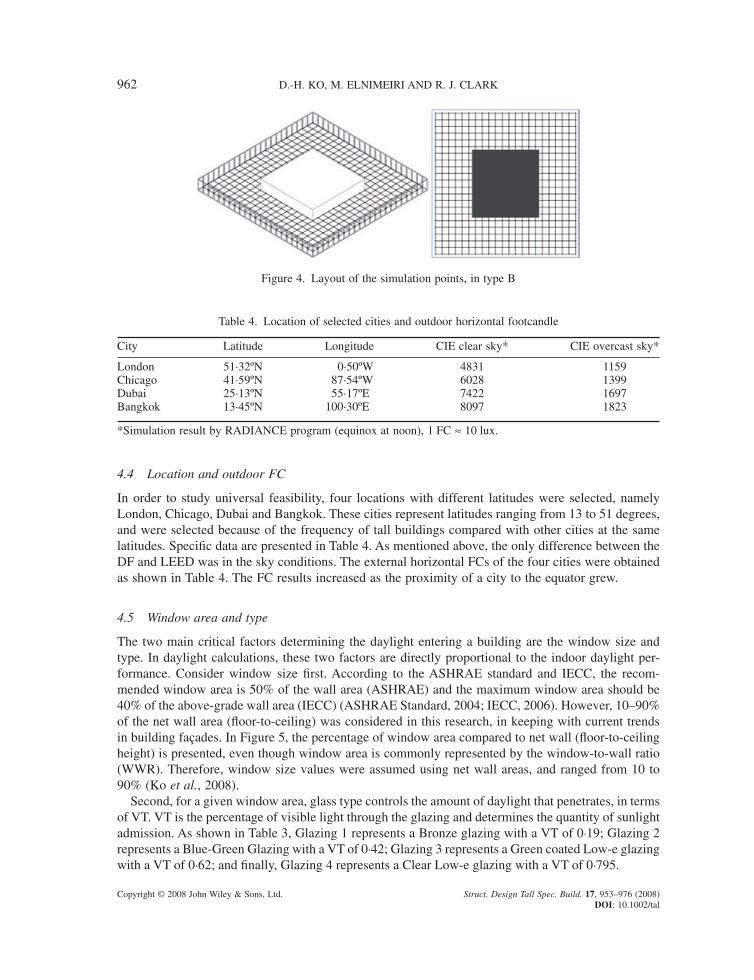
A comparative study was conducted using RADIANCE (Ward and Shakespeare, 1998). It is a computer simulation package for simulating and visualizing lighting using the backward ray-tracing technique and is used to achieve the best balance between speed and accuracy for the estimation of lighting levels (Tsangrassoulis and Bourdakis, 2003). In a recent study, A. Tsangrassoulis and V. Bourdakis concluded that a more detailed methodology (ray-tracing) should be adopted, due to the higher accuracy of the results by comparing the simulated results using a Lightscape radiosity technique. Moreover, a recent survey showed that while participants named a total of 42 different daylight simulation programs that they routinely used, over 50% of these program selections were for tools that use the RADIANCE simulation engine, revealing the program’s predominance within the daylight simulation community (Reinhart and Fitz, 2006). Therefore, as shown in Figure 4, a 3D model of a typical open-plan fl oor was modelled and simulated. Although a 10-ft grid is required in option 3 of the LEED 2.2 daylight requirement (see Table 1), the workplane FC data for a grid with a spacing of 5 ft were used to increase the accuracy of the simulation results. All of the simulation points were located at a height of 30 in. above the fl oor based on the LEED 2.2 simulation requirements, and the total simulation points were set as 225, 484, 841 and 1296 (See Figure 4).
Table 3. Main simulation parameters
Parameters Value
Model size Offi ce type A, B, C and D
Lease span 20, 30, 40 and 50 ft
Window size
Window area percent of net wall area (fl oor-to-ceiling) 10, 30, 50, 70 and 90%
WWR ratio 7, 21, 35, 48 and 62%
VT Glazing 1 19·0% (Bronze)Glazing 2 41·9% (Blue-green)Glazing 3 62·3% (Green coated Low-e)Glazing 4 79·5% (Clear Low-e)
Interior refl ectance Wall 50%, fl oor 30% and ceiling 80%
962 D.-H. KO, M. ELNIMEIRI AND R. J. CLARK
Copyright © 2008 John Wiley & Sons, Ltd. Struct. Design Tall Spec. Build. 17, 953–976 (2008) DOI: 10.1002/tal
4.4 Location and outdoor FC
In order to study universal feasibility, four locations with different latitudes were selected, namely London, Chicago, Dubai and Bangkok. These cities represent latitudes ranging from 13 to 51 degrees, and were selected because of the frequency of tall buildings compared with other cities at the same latitudes. Specifi c data are presented in Table 4. As mentioned above, the only difference between the DF and LEED was in the sky conditions. The external horizontal FCs of the four cities were obtained as shown in Table 4. The FC results increased as the proximity of a city to the equator grew.
4.5 Window area and type
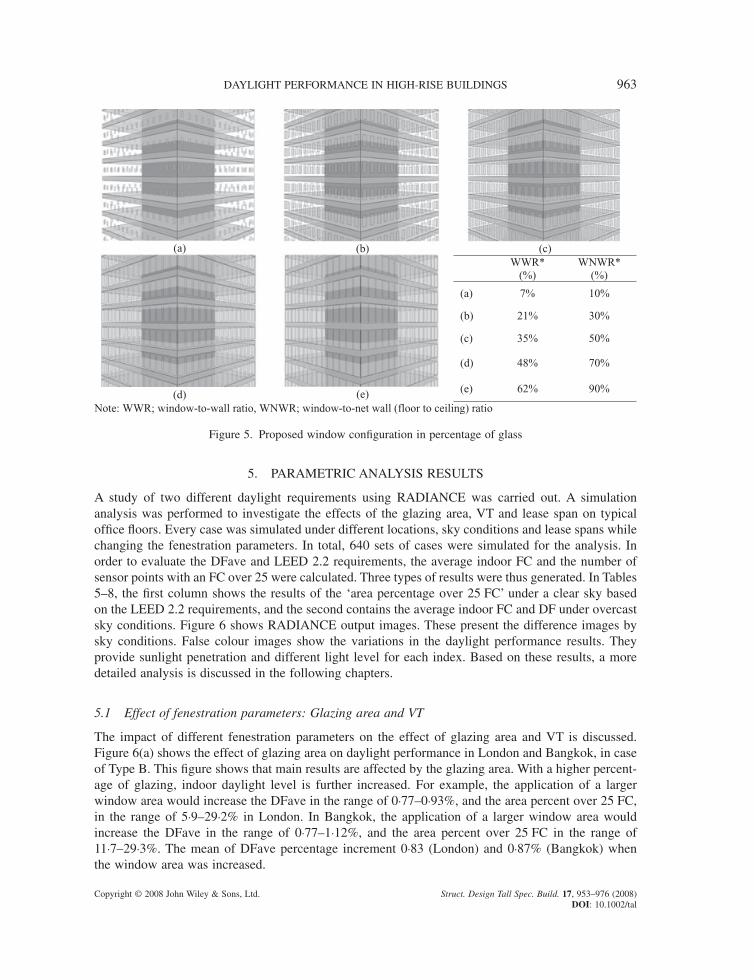
The two main critical factors determining the daylight entering a building are the window size and type. In daylight calculations, these two factors are directly proportional to the indoor daylight per-formance. Consider window size fi rst. According to the ASHRAE standard and IECC, the recom-mended window area is 50% of the wall area (ASHRAE) and the maximum window area should be 40% of the above-grade wall area (IECC) (ASHRAE Standard, 2004; IECC, 2006). However, 10–90% of the net wall area (fl oor-to-ceiling) was considered in this research, in keeping with current trends in building façades. In Figure 5, the percentage of window area compared to net wall (fl oor-to-ceiling height) is presented, even though window area is commonly represented by the window-to-wall ratio (WWR). Therefore, window size values were assumed using net wall areas, and ranged from 10 to 90% (Ko et al., 2008).
Second, for a given window area, glass type controls the amount of daylight that penetrates, in terms of VT. VT is the percentage of visible light through the glazing and determines the quantity of sunlight admission. As shown in Table 3, Glazing 1 represents a Bronze glazing with a VT of 0·19; Glazing 2 represents a Blue-Green Glazing with a VT of 0·42; Glazing 3 represents a Green coated Low-e glazing with a VT of 0·62; and fi nally, Glazing 4 represents a Clear Low-e glazing with a VT of 0·795.
Figure 4. Layout of the simulation points, in type B
Table 4. Location of selected cities and outdoor horizontal footcandle
City Latitude Longitude CIE clear sky* CIE overcast sky*
London 51·32ºN 0·50ºW 4831 1159Chicago 41·59ºN 87·54ºW 6028 1399Dubai 25·13ºN 55·17ºE 7422 1697Bangkok 13·45ºN 100·30ºE 8097 1823
*Simulation result by RADIANCE program (equinox at noon), 1 FC ≈ 10 lux.
DAYLIGHT PERFORMANCE IN HIGH-RISE BUILDINGS 963
Copyright © 2008 John Wiley & Sons, Ltd. Struct. Design Tall Spec. Build. 17, 953–976 (2008) DOI: 10.1002/tal
5. PARAMETRIC ANALYSIS RESULTS
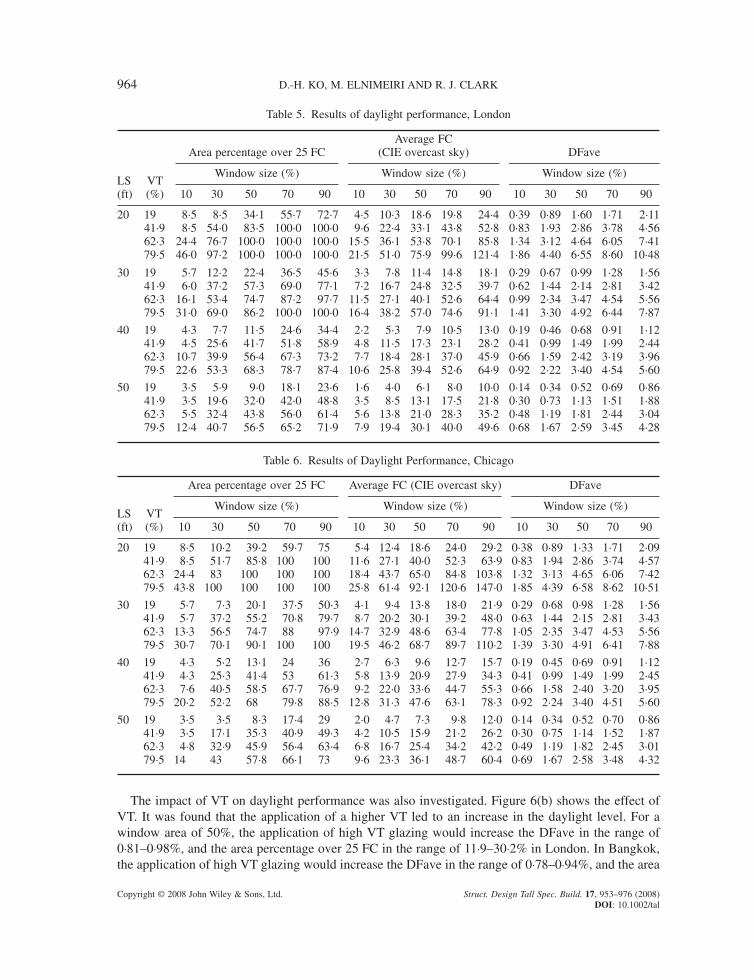
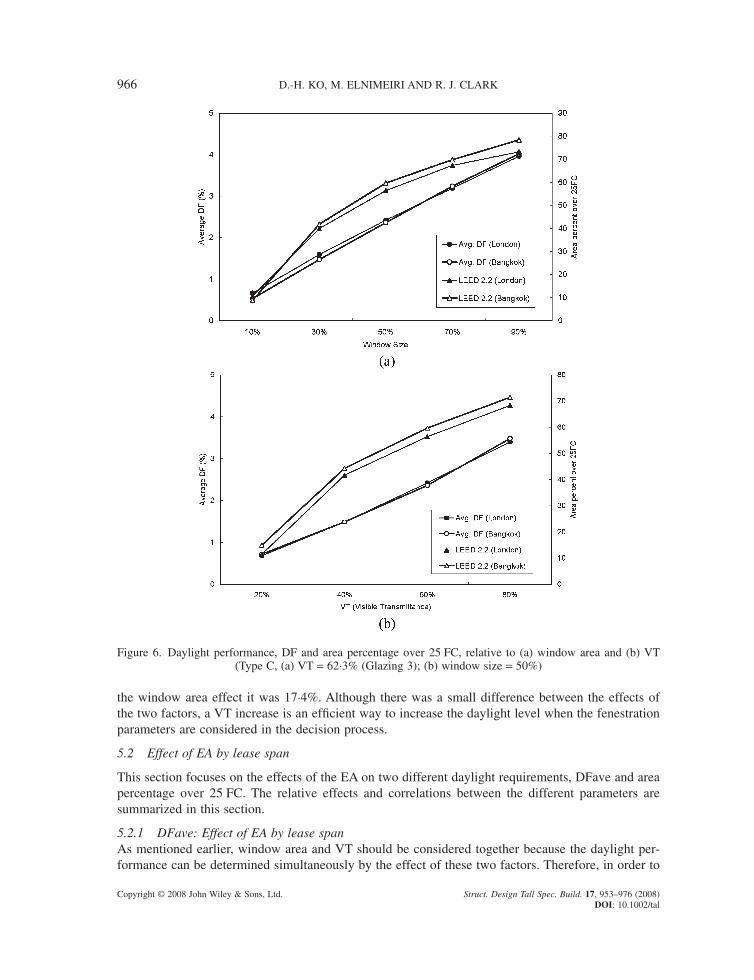
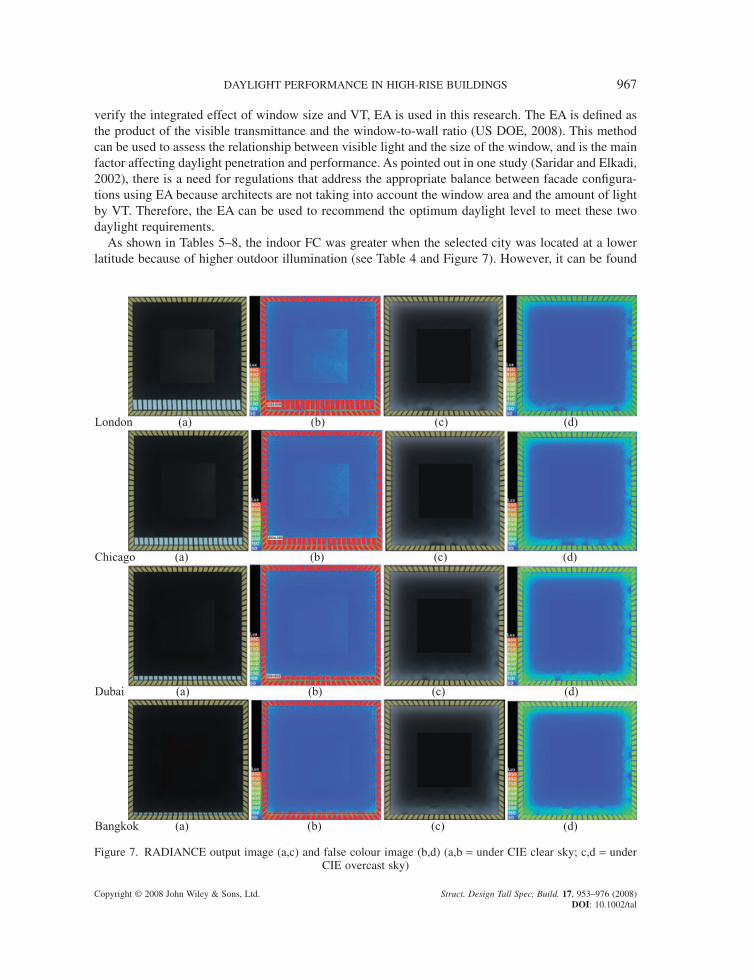
A study of two different daylight requirements using RADIANCE was carried out. A simulation analysis was performed to investigate the effects of the glazing area, VT and lease span on typical offi ce fl oors. Every case was simulated under different locations, sky conditions and lease spans while changing the fenestration parameters. In total, 640 sets of cases were simulated for the analysis. In order to evaluate the DFave and LEED 2.2 requirements, the average indoor FC and the number of sensor points with an FC over 25 were calculated. Three types of results were thus generated. In Tables 5–8, the fi rst column shows the results of the ‘area percentage over 25 FC’ under a clear sky based on the LEED 2.2 requirements, and the second contains the average indoor FC and DF under overcast sky conditions. Figure 6 shows RADIANCE output images. These present the difference images by sky conditions. False colour images show the variations in the daylight performance results. They provide sunlight penetration and different light level for each index. Based on these results, a more detailed analysis is discussed in the following chapters.
5.1 Effect of fenestration parameters: Glazing area and VT
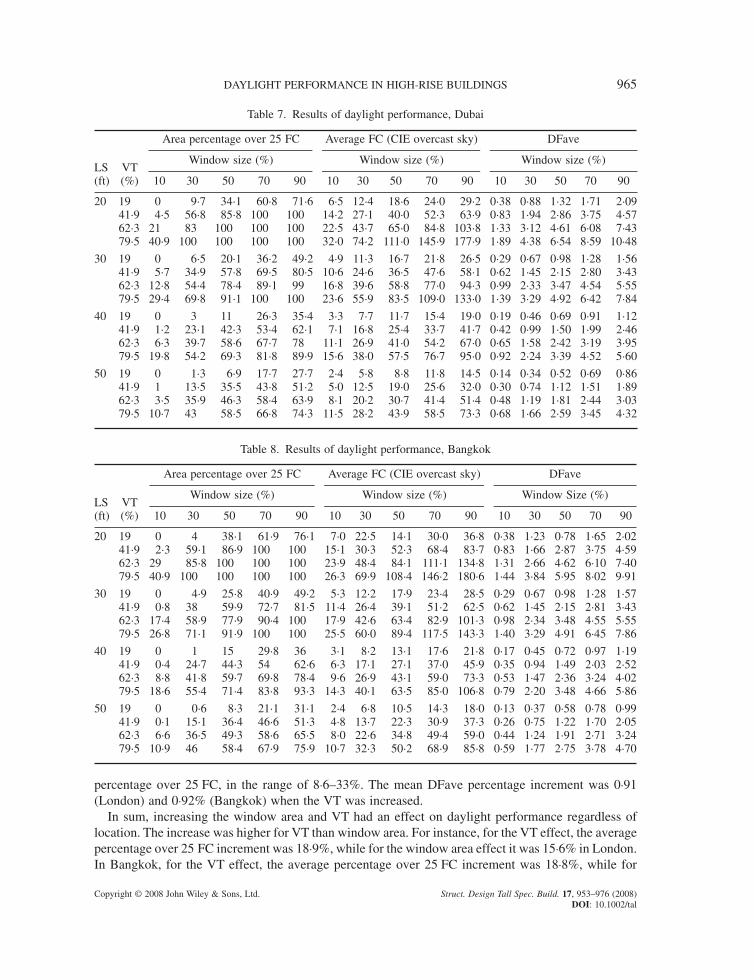
The impact of different fenestration parameters on the effect of glazing area and VT is discussed. Figure 6(a) shows the effect of glazing area on daylight performance in London and Bangkok, in case of Type B. This fi gure shows that main results are affected by the glazing area. With a higher percent-age of glazing, indoor daylight level is further increased. For example, the application of a larger window area would increase the DFave in the range of 0·77–0·93%, and the area percent over 25 FC, in the range of 5·9–29·2% in London. In Bangkok, the application of a larger window area would increase the DFave in the range of 0·77–1·12%, and the area percent over 25 FC in the range of 11·7–29·3%. The mean of DFave percentage increment 0·83 (London) and 0·87% (Bangkok) when the window area was increased.
(a) (b) (c)
(d) (e)
WWR*(%)
WNWR* (%)
(a) 7% 10%
(b) 21% 30%
(c) 35% 50%
(d) 48% 70%
(e) 62% 90%
Note: WWR; window-to-wall ratio, WNWR; window-to-net wall (floor to ceiling) ratio
Figure 5. Proposed window confi guration in percentage of glass
964 D.-H. KO, M. ELNIMEIRI AND R. J. CLARK
Copyright © 2008 John Wiley & Sons, Ltd. Struct. Design Tall Spec. Build. 17, 953–976 (2008) DOI: 10.1002/tal
Table 5. Results of daylight performance, London
LS (ft)
VT (%)
Area percentage over 25 FCAverage FC
(CIE overcast sky) DFave
Window size (%) Window size (%) Window size (%)
10 30 50 70 90 10 30 50 70 90 10 30 50 70 90
20 19 8·5 8·5 34·1 55·7 72·7 4·5 10·3 18·6 19·8 24·4 0·39 0·89 1·60 1·71 2·1141·9 8·5 54·0 83·5 100·0 100·0 9·6 22·4 33·1 43·8 52·8 0·83 1·93 2·86 3·78 4·5662·3 24·4 76·7 100·0 100·0 100·0 15·5 36·1 53·8 70·1 85·8 1·34 3·12 4·64 6·05 7·4179·5 46·0 97·2 100·0 100·0 100·0 21·5 51·0 75·9 99·6 121·4 1·86 4·40 6·55 8·60 10·48
30 19 5·7 12·2 22·4 36·5 45·6 3·3 7·8 11·4 14·8 18·1 0·29 0·67 0·99 1·28 1·5641·9 6·0 37·2 57·3 69·0 77·1 7·2 16·7 24·8 32·5 39·7 0·62 1·44 2·14 2·81 3·4262·3 16·1 53·4 74·7 87·2 97·7 11·5 27·1 40·1 52·6 64·4 0·99 2·34 3·47 4·54 5·5679·5 31·0 69·0 86·2 100·0 100·0 16·4 38·2 57·0 74·6 91·1 1·41 3·30 4·92 6·44 7·87
40 19 4·3 7·7 11·5 24·6 34·4 2·2 5·3 7·9 10·5 13·0 0·19 0·46 0·68 0·91 1·1241·9 4·5 25·6 41·7 51·8 58·9 4·8 11·5 17·3 23·1 28·2 0·41 0·99 1·49 1·99 2·4462·3 10·7 39·9 56·4 67·3 73·2 7·7 18·4 28·1 37·0 45·9 0·66 1·59 2·42 3·19 3·9679·5 22·6 53·3 68·3 78·7 87·4 10·6 25·8 39·4 52·6 64·9 0·92 2·22 3·40 4·54 5·60
50 19 3·5 5·9 9·0 18·1 23·6 1·6 4·0 6·1 8·0 10·0 0·14 0·34 0·52 0·69 0·8641·9 3·5 19·6 32·0 42·0 48·8 3·5 8·5 13·1 17·5 21·8 0·30 0·73 1·13 1·51 1·8862·3 5·5 32·4 43·8 56·0 61·4 5·6 13·8 21·0 28·3 35·2 0·48 1·19 1·81 2·44 3·0479·5 12·4 40·7 56·5 65·2 71·9 7·9 19·4 30·1 40·0 49·6 0·68 1·67 2·59 3·45 4·28
Table 6. Results of Daylight Performance, Chicago
LS (ft)
VT (%)
Area percentage over 25 FC Average FC (CIE overcast sky) DFave
Window size (%) Window size (%) Window size (%)
10 30 50 70 90 10 30 50 70 90 10 30 50 70 90
20 19 8·5 10·2 39·2 59·7 75 5·4 12·4 18·6 24·0 29·2 0·38 0·89 1·33 1·71 2·0941·9 8·5 51·7 85·8 100 100 11·6 27·1 40·0 52·3 63·9 0·83 1·94 2·86 3·74 4·5762·3 24·4 83 100 100 100 18·4 43·7 65·0 84·8 103·8 1·32 3·13 4·65 6·06 7·4279·5 43·8 100 100 100 100 25·8 61·4 92·1 120·6 147·0 1·85 4·39 6·58 8·62 10·51
30 19 5·7 7·3 20·1 37·5 50·3 4·1 9·4 13·8 18·0 21·9 0·29 0·68 0·98 1·28 1·5641·9 5·7 37·2 55·2 70·8 79·7 8·7 20·2 30·1 39·2 48·0 0·63 1·44 2·15 2·81 3·4362·3 13·3 56·5 74·7 88 97·9 14·7 32·9 48·6 63·4 77·8 1·05 2·35 3·47 4·53 5·5679·5 30·7 70·1 90·1 100 100 19·5 46·2 68·7 89·7 110·2 1·39 3·30 4·91 6·41 7·88
40 19 4·3 5·2 13·1 24 36 2·7 6·3 9·6 12·7 15·7 0·19 0·45 0·69 0·91 1·1241·9 4·3 25·3 41·4 53 61·3 5·8 13·9 20·9 27·9 34·3 0·41 0·99 1·49 1·99 2·4562·3 7·6 40·5 58·5 67·7 76·9 9·2 22·0 33·6 44·7 55·3 0·66 1·58 2·40 3·20 3·9579·5 20·2 52·2 68 79·8 88·5 12·8 31·3 47·6 63·1 78·3 0·92 2·24 3·40 4·51 5·60
50 19 3·5 3·5 8·3 17·4 29 2·0 4·7 7·3 9·8 12·0 0·14 0·34 0·52 0·70 0·8641·9 3·5 17·1 35·3 40·9 49·3 4·2 10·5 15·9 21·2 26·2 0·30 0·75 1·14 1·52 1·8762·3 4·8 32·9 45·9 56·4 63·4 6·8 16·7 25·4 34·2 42·2 0·49 1·19 1·82 2·45 3·0179·5 14 43 57·8 66·1 73 9·6 23·3 36·1 48·7 60·4 0·69 1·67 2·58 3·48 4·32
The impact of VT on daylight performance was also investigated. Figure 6(b) shows the effect of VT. It was found that the application of a higher VT led to an increase in the daylight level. For a window area of 50%, the application of high VT glazing would increase the DFave in the range of 0·81–0·98%, and the area percentage over 25 FC in the range of 11·9–30·2% in London. In Bangkok, the application of high VT glazing would increase the DFave in the range of 0·78–0·94%, and the area
DAYLIGHT PERFORMANCE IN HIGH-RISE BUILDINGS 965
Copyright © 2008 John Wiley & Sons, Ltd. Struct. Design Tall Spec. Build. 17, 953–976 (2008) DOI: 10.1002/tal
percentage over 25 FC, in the range of 8·6–33%. The mean DFave percentage increment was 0·91 (London) and 0·92% (Bangkok) when the VT was increased.
In sum, increasing the window area and VT had an effect on daylight performance regardless of location. The increase was higher for VT than window area. For instance, for the VT effect, the average percentage over 25 FC increment was 18·9%, while for the window area effect it was 15·6% in London. In Bangkok, for the VT effect, the average percentage over 25 FC increment was 18·8%, while for
Table 7. Results of daylight performance, Dubai
LS (ft)
VT (%)
Area percentage over 25 FC Average FC (CIE overcast sky) DFave
Window size (%) Window size (%) Window size (%)
10 30 50 70 90 10 30 50 70 90 10 30 50 70 90
20 19 0 9·7 34·1 60·8 71·6 6·5 12·4 18·6 24·0 29·2 0·38 0·88 1·32 1·71 2·0941·9 4·5 56·8 85·8 100 100 14·2 27·1 40·0 52·3 63·9 0·83 1·94 2·86 3·75 4·5762·3 21 83 100 100 100 22·5 43·7 65·0 84·8 103·8 1·33 3·12 4·61 6·08 7·4379·5 40·9 100 100 100 100 32·0 74·2 111·0 145·9 177·9 1·89 4·38 6·54 8·59 10·48
30 19 0 6·5 20·1 36·2 49·2 4·9 11·3 16·7 21·8 26·5 0·29 0·67 0·98 1·28 1·5641·9 5·7 34·9 57·8 69·5 80·5 10·6 24·6 36·5 47·6 58·1 0·62 1·45 2·15 2·80 3·4362·3 12·8 54·4 78·4 89·1 99 16·8 39·6 58·8 77·0 94·3 0·99 2·33 3·47 4·54 5·5579·5 29·4 69·8 91·1 100 100 23·6 55·9 83·5 109·0 133·0 1·39 3·29 4·92 6·42 7·84
40 19 0 3 11 26·3 35·4 3·3 7·7 11·7 15·4 19·0 0·19 0·46 0·69 0·91 1·1241·9 1·2 23·1 42·3 53·4 62·1 7·1 16·8 25·4 33·7 41·7 0·42 0·99 1·50 1·99 2·4662·3 6·3 39·7 58·6 67·7 78 11·1 26·9 41·0 54·2 67·0 0·65 1·58 2·42 3·19 3·9579·5 19·8 54·2 69·3 81·8 89·9 15·6 38·0 57·5 76·7 95·0 0·92 2·24 3·39 4·52 5·60
50 19 0 1·3 6·9 17·7 27·7 2·4 5·8 8·8 11·8 14·5 0·14 0·34 0·52 0·69 0·8641·9 1 13·5 35·5 43·8 51·2 5·0 12·5 19·0 25·6 32·0 0·30 0·74 1·12 1·51 1·8962·3 3·5 35·9 46·3 58·4 63·9 8·1 20·2 30·7 41·4 51·4 0·48 1·19 1·81 2·44 3·0379·5 10·7 43 58·5 66·8 74·3 11·5 28·2 43·9 58·5 73·3 0·68 1·66 2·59 3·45 4·32
Table 8. Results of daylight performance, Bangkok
LS (ft)
VT (%)
Area percentage over 25 FC Average FC (CIE overcast sky) DFave
Window size (%) Window size (%) Window Size (%)
10 30 50 70 90 10 30 50 70 90 10 30 50 70 90
20 19 0 4 38·1 61·9 76·1 7·0 22·5 14·1 30·0 36·8 0·38 1·23 0·78 1·65 2·0241·9 2·3 59·1 86·9 100 100 15·1 30·3 52·3 68·4 83·7 0·83 1·66 2·87 3·75 4·5962·3 29 85·8 100 100 100 23·9 48·4 84·1 111·1 134·8 1·31 2·66 4·62 6·10 7·4079·5 40·9 100 100 100 100 26·3 69·9 108·4 146·2 180·6 1·44 3·84 5·95 8·02 9·91
30 19 0 4·9 25·8 40·9 49·2 5·3 12·2 17·9 23·4 28·5 0·29 0·67 0·98 1·28 1·5741·9 0·8 38 59·9 72·7 81·5 11·4 26·4 39·1 51·2 62·5 0·62 1·45 2·15 2·81 3·4362·3 17·4 58·9 77·9 90·4 100 17·9 42·6 63·4 82·9 101·3 0·98 2·34 3·48 4·55 5·5579·5 26·8 71·1 91·9 100 100 25·5 60·0 89·4 117·5 143·3 1·40 3·29 4·91 6·45 7·86
40 19 0 1 15 29·8 36 3·1 8·2 13·1 17·6 21·8 0·17 0·45 0·72 0·97 1·1941·9 0·4 24·7 44·3 54 62·6 6·3 17·1 27·1 37·0 45·9 0·35 0·94 1·49 2·03 2·5262·3 8·8 41·8 59·7 69·8 78·4 9·6 26·9 43·1 59·0 73·3 0·53 1·47 2·36 3·24 4·0279·5 18·6 55·4 71·4 83·8 93·3 14·3 40·1 63·5 85·0 106·8 0·79 2·20 3·48 4·66 5·86
50 19 0 0·6 8·3 21·1 31·1 2·4 6·8 10·5 14·3 18·0 0·13 0·37 0·58 0·78 0·9941·9 0·1 15·1 36·4 46·6 51·3 4·8 13·7 22·3 30·9 37·3 0·26 0·75 1·22 1·70 2·0562·3 6·6 36·5 49·3 58·6 65·5 8·0 22·6 34·8 49·4 59·0 0·44 1·24 1·91 2·71 3·2479·5 10·9 46 58·4 67·9 75·9 10·7 32·3 50·2 68·9 85·8 0·59 1·77 2·75 3·78 4·70
966 D.-H. KO, M. ELNIMEIRI AND R. J. CLARK
Copyright © 2008 John Wiley & Sons, Ltd. Struct. Design Tall Spec. Build. 17, 953–976 (2008) DOI: 10.1002/tal
the window area effect it was 17·4%. Although there was a small difference between the effects of the two factors, a VT increase is an effi cient way to increase the daylight level when the fenestration parameters are considered in the decision process.
5.2 Effect of EA by lease span
This section focuses on the effects of the EA on two different daylight requirements, DFave and area percentage over 25 FC. The relative effects and correlations between the different parameters are summarized in this section.
5.2.1 DFave: Effect of EA by lease spanAs mentioned earlier, window area and VT should be considered together because the daylight per-formance can be determined simultaneously by the effect of these two factors. Therefore, in order to
Figure 6. Daylight performance, DF and area percentage over 25 FC, relative to (a) window area and (b) VT (Type C, (a) VT = 62·3% (Glazing 3); (b) window size = 50%)
DAYLIGHT PERFORMANCE IN HIGH-RISE BUILDINGS 967
Copyright © 2008 John Wiley & Sons, Ltd. Struct. Design Tall Spec. Build. 17, 953–976 (2008) DOI: 10.1002/tal
verify the integrated effect of window size and VT, EA is used in this research. The EA is defi ned as the product of the visible transmittance and the window-to-wall ratio (US DOE, 2008). This method can be used to assess the relationship between visible light and the size of the window, and is the main factor affecting daylight penetration and performance. As pointed out in one study (Saridar and Elkadi, 2002), there is a need for regulations that address the appropriate balance between facade confi gura-tions using EA because architects are not taking into account the window area and the amount of light by VT. Therefore, the EA can be used to recommend the optimum daylight level to meet these two daylight requirements.
As shown in Tables 5–8, the indoor FC was greater when the selected city was located at a lower latitude because of higher outdoor illumination (see Table 4 and Figure 7). However, it can be found
London (a) (b) (c) (d)
Chicago (a) (b) (c) (d)
Dubai (a) (b) (c) (d)
Bangkok (a) (b) (c) (d)
Figure 7. RADIANCE output image (a,c) and false colour image (b,d) (a,b = under CIE clear sky; c,d = under CIE overcast sky)
968 D.-H. KO, M. ELNIMEIRI AND R. J. CLARK
Copyright © 2008 John Wiley & Sons, Ltd. Struct. Design Tall Spec. Build. 17, 953–976 (2008) DOI: 10.1002/tal
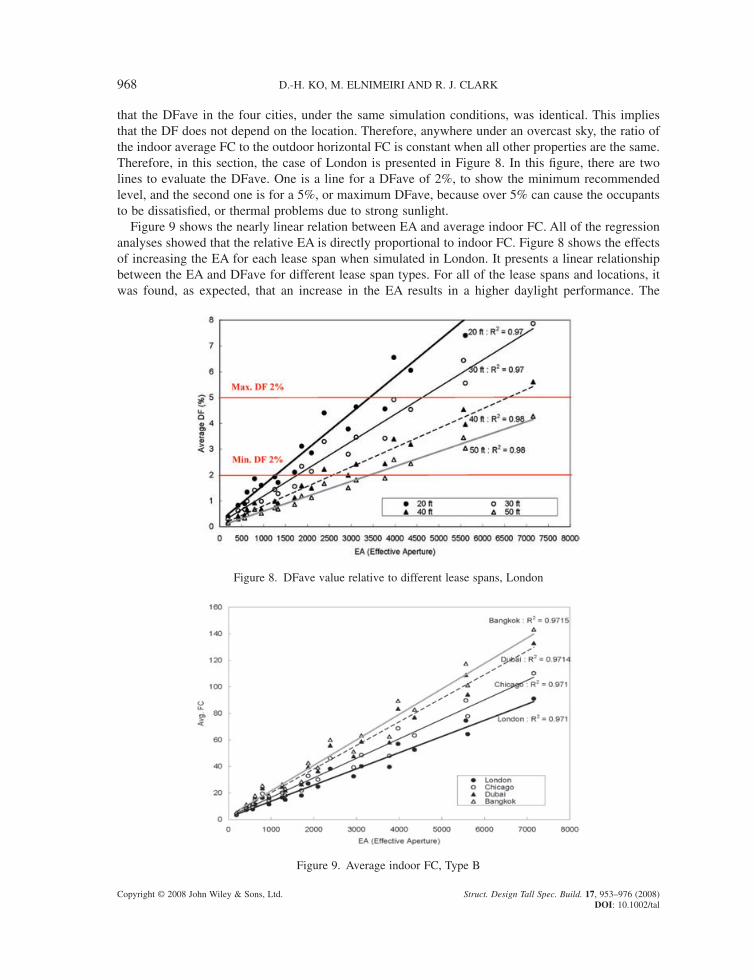
that the DFave in the four cities, under the same simulation conditions, was identical. This implies that the DF does not depend on the location. Therefore, anywhere under an overcast sky, the ratio of the indoor average FC to the outdoor horizontal FC is constant when all other properties are the same. Therefore, in this section, the case of London is presented in Figure 8. In this fi gure, there are two lines to evaluate the DFave. One is a line for a DFave of 2%, to show the minimum recommended level, and the second one is for a 5%, or maximum DFave, because over 5% can cause the occupants to be dissatisfi ed, or thermal problems due to strong sunlight.
Figure 9 shows the nearly linear relation between EA and average indoor FC. All of the regression analyses showed that the relative EA is directly proportional to indoor FC. Figure 8 shows the effects of increasing the EA for each lease span when simulated in London. It presents a linear relationship between the EA and DFave for different lease span types. For all of the lease spans and locations, it was found, as expected, that an increase in the EA results in a higher daylight performance. The
Figure 8. DFave value relative to different lease spans, London
Figure 9. Average indoor FC, Type B
DAYLIGHT PERFORMANCE IN HIGH-RISE BUILDINGS 969
Copyright © 2008 John Wiley & Sons, Ltd. Struct. Design Tall Spec. Build. 17, 953–976 (2008) DOI: 10.1002/tal
optimum DF level, ranging from 2 to 5%, could be achieved for 20 (1250–3400 of EA), 30 (1750–4600 of EA) and 40 ft (2600–6600 of EA). In case of a 50-ft lease span, a 2% DFave could be achieved with an EA of over 3400, and the biggest DFave of 4·28% was achieved with the highest EA (80% for VT and 90% for window area). Moreover, these results can be applied to other locations due to the constant value of DFave. Building designers should be aware of the recommended level of DFave and check the performance of their proposed project in relation to the various lease span and EA values. Moreover, when designing tall offi ce buildings, we should acknowledge that the effect of the lease span is larger than that of the location. The results suggest that the lease span effect on daylight performance for a high-rise offi ce plan can be as great as other planning considerations in tall buildings.
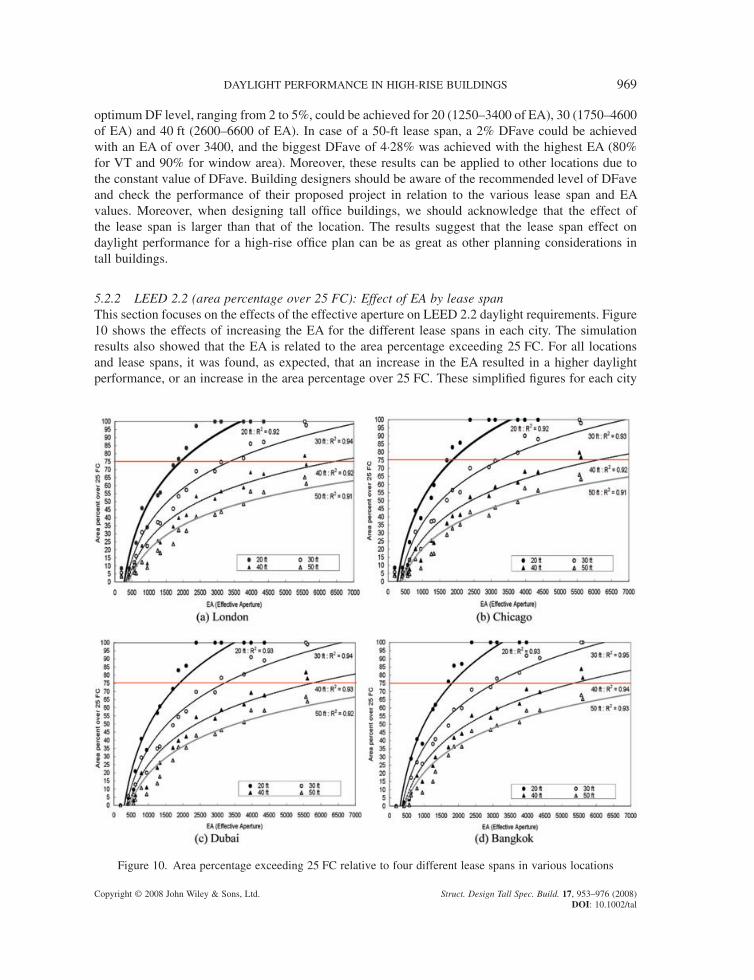
5.2.2 LEED 2.2 (area percentage over 25 FC): Effect of EA by lease spanThis section focuses on the effects of the effective aperture on LEED 2.2 daylight requirements. Figure 10 shows the effects of increasing the EA for the different lease spans in each city. The simulation results also showed that the EA is related to the area percentage exceeding 25 FC. For all locations and lease spans, it was found, as expected, that an increase in the EA resulted in a higher daylight performance, or an increase in the area percentage over 25 FC. These simplifi ed fi gures for each city
Figure 10. Area percentage exceeding 25 FC relative to four different lease spans in various locations
970 D.-H. KO, M. ELNIMEIRI AND R. J. CLARK
Copyright © 2008 John Wiley & Sons, Ltd. Struct. Design Tall Spec. Build. 17, 953–976 (2008) DOI: 10.1002/tal
can easily be used for the evaluation of indoor daylight performance to meet the LEED 2.2 require-ment, an area percentage exceeding 25 FC. Further, the results can be applied to other areas at the same latitude. This is because the sun altitude on the equinox at solar noon is the same when the location is at the same latitude on a solar sun-path diagram (Robbins, 1986; LBNL, 1997).
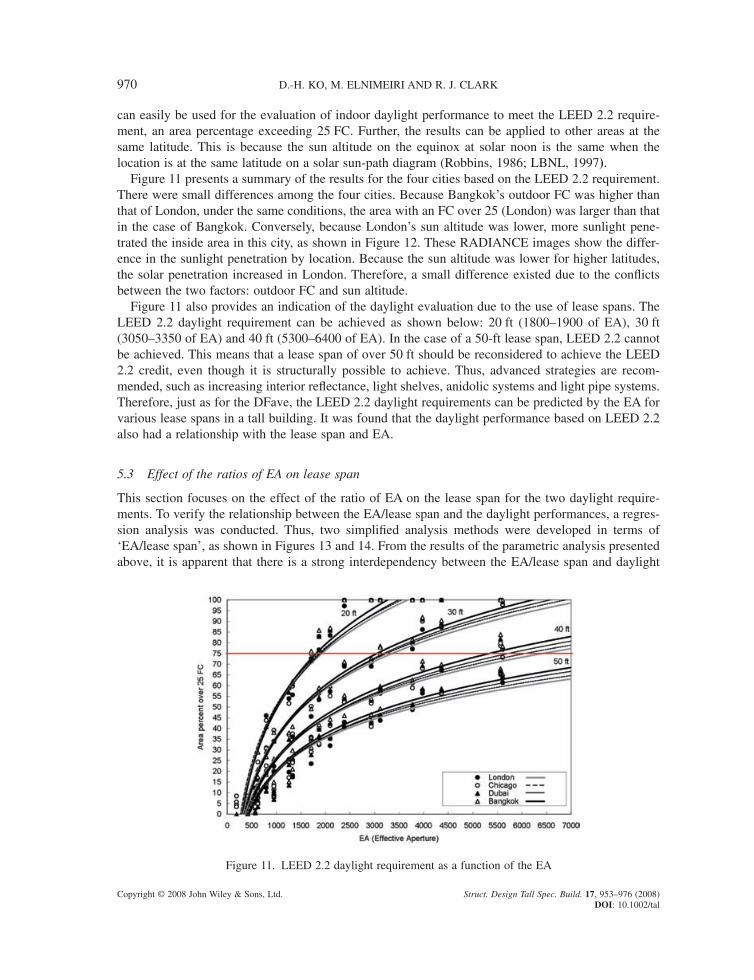
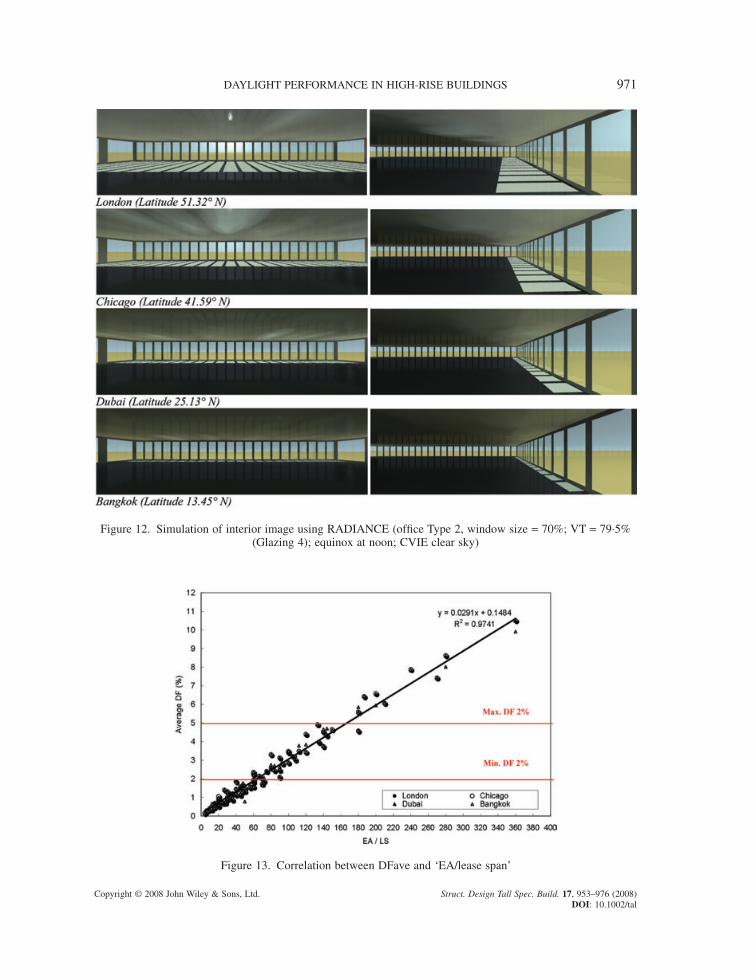
Figure 11 presents a summary of the results for the four cities based on the LEED 2.2 requirement. There were small differences among the four cities. Because Bangkok’s outdoor FC was higher than that of London, under the same conditions, the area with an FC over 25 (London) was larger than that in the case of Bangkok. Conversely, because London’s sun altitude was lower, more sunlight pene-trated the inside area in this city, as shown in Figure 12. These RADIANCE images show the differ-ence in the sunlight penetration by location. Because the sun altitude was lower for higher latitudes, the solar penetration increased in London. Therefore, a small difference existed due to the confl icts between the two factors: outdoor FC and sun altitude.
Figure 11 also provides an indication of the daylight evaluation due to the use of lease spans. The LEED 2.2 daylight requirement can be achieved as shown below: 20 ft (1800–1900 of EA), 30 ft (3050–3350 of EA) and 40 ft (5300–6400 of EA). In the case of a 50-ft lease span, LEED 2.2 cannot be achieved. This means that a lease span of over 50 ft should be reconsidered to achieve the LEED 2.2 credit, even though it is structurally possible to achieve. Thus, advanced strategies are recom-mended, such as increasing interior refl ectance, light shelves, anidolic systems and light pipe systems. Therefore, just as for the DFave, the LEED 2.2 daylight requirements can be predicted by the EA for various lease spans in a tall building. It was found that the daylight performance based on LEED 2.2 also had a relationship with the lease span and EA.
5.3 Effect of the ratios of EA on lease span
This section focuses on the effect of the ratio of EA on the lease span for the two daylight require-ments. To verify the relationship between the EA/lease span and the daylight performances, a regres-sion analysis was conducted. Thus, two simplifi ed analysis methods were developed in terms of ‘EA/lease span’, as shown in Figures 13 and 14. From the results of the parametric analysis presented above, it is apparent that there is a strong interdependency between the EA/lease span and daylight
Figure 11. LEED 2.2 daylight requirement as a function of the EA
DAYLIGHT PERFORMANCE IN HIGH-RISE BUILDINGS 971
Copyright © 2008 John Wiley & Sons, Ltd. Struct. Design Tall Spec. Build. 17, 953–976 (2008) DOI: 10.1002/tal
Figure 12. Simulation of interior image using RADIANCE (offi ce Type 2, window size = 70%; VT = 79·5% (Glazing 4); equinox at noon; CVIE clear sky)
Figure 13. Correlation between DFave and ‘EA/lease span’
972 D.-H. KO, M. ELNIMEIRI AND R. J. CLARK
Copyright © 2008 John Wiley & Sons, Ltd. Struct. Design Tall Spec. Build. 17, 953–976 (2008) DOI: 10.1002/tal
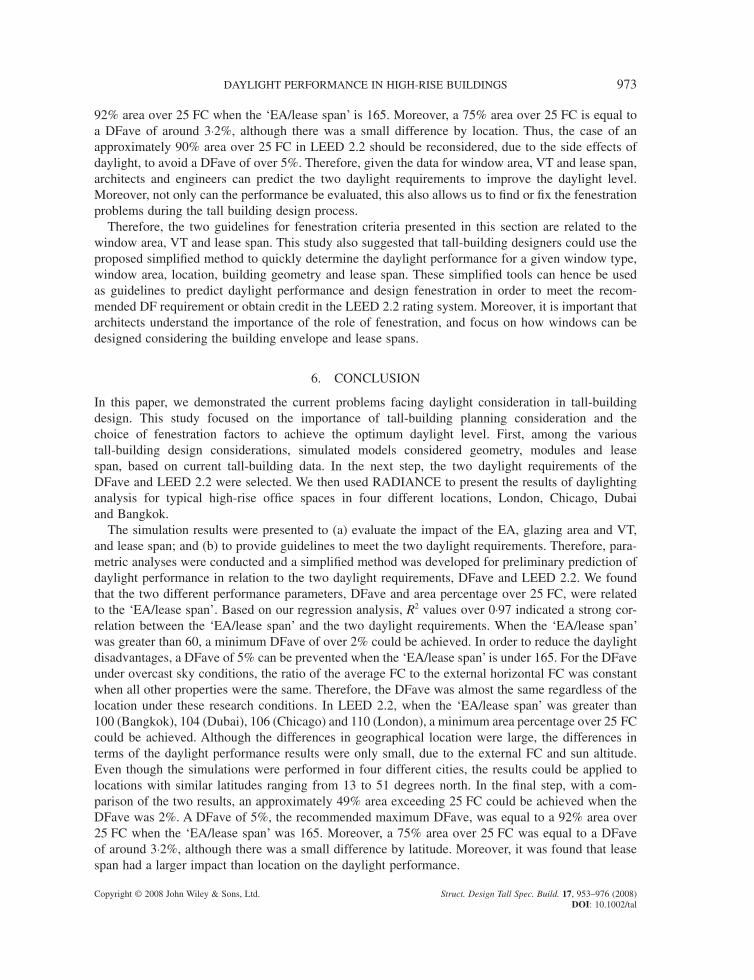
Figure 14. Correlation between ‘area percentage over 25 FC’ and ‘EA/lease span’
performance, in relation to the DFave and area percentage over 25 FC. Thus, a simplifi ed analysis method was developed to estimate the daylight performance from the window area, VT and lease span.
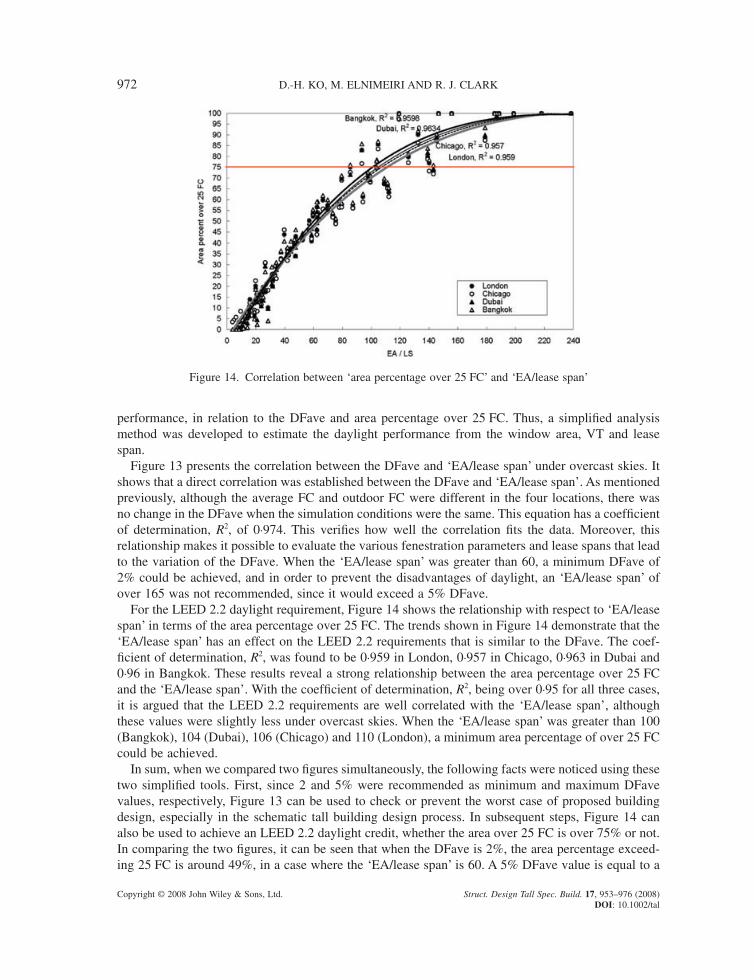
Figure 13 presents the correlation between the DFave and ‘EA/lease span’ under overcast skies. It shows that a direct correlation was established between the DFave and ‘EA/lease span’. As mentioned previously, although the average FC and outdoor FC were different in the four locations, there was no change in the DFave when the simulation conditions were the same. This equation has a coeffi cient of determination, R2, of 0·974. This verifi es how well the correlation fi ts the data. Moreover, this relationship makes it possible to evaluate the various fenestration parameters and lease spans that lead to the variation of the DFave. When the ‘EA/lease span’ was greater than 60, a minimum DFave of 2% could be achieved, and in order to prevent the disadvantages of daylight, an ‘EA/lease span’ of over 165 was not recommended, since it would exceed a 5% DFave.
For the LEED 2.2 daylight requirement, Figure 14 shows the relationship with respect to ‘EA/lease span’ in terms of the area percentage over 25 FC. The trends shown in Figure 14 demonstrate that the ‘EA/lease span’ has an effect on the LEED 2.2 requirements that is similar to the DFave. The coef-fi cient of determination, R2, was found to be 0·959 in London, 0·957 in Chicago, 0·963 in Dubai and 0·96 in Bangkok. These results reveal a strong relationship between the area percentage over 25 FC and the ‘EA/lease span’. With the coeffi cient of determination, R2, being over 0·95 for all three cases, it is argued that the LEED 2.2 requirements are well correlated with the ‘EA/lease span’, although these values were slightly less under overcast skies. When the ‘EA/lease span’ was greater than 100 (Bangkok), 104 (Dubai), 106 (Chicago) and 110 (London), a minimum area percentage of over 25 FC could be achieved.
In sum, when we compared two fi gures simultaneously, the following facts were noticed using these two simplifi ed tools. First, since 2 and 5% were recommended as minimum and maximum DFave values, respectively, Figure 13 can be used to check or prevent the worst case of proposed building design, especially in the schematic tall building design process. In subsequent steps, Figure 14 can also be used to achieve an LEED 2.2 daylight credit, whether the area over 25 FC is over 75% or not. In comparing the two fi gures, it can be seen that when the DFave is 2%, the area percentage exceed-ing 25 FC is around 49%, in a case where the ‘EA/lease span’ is 60. A 5% DFave value is equal to a
DAYLIGHT PERFORMANCE IN HIGH-RISE BUILDINGS 973
Copyright © 2008 John Wiley & Sons, Ltd. Struct. Design Tall Spec. Build. 17, 953–976 (2008) DOI: 10.1002/tal
92% area over 25 FC when the ‘EA/lease span’ is 165. Moreover, a 75% area over 25 FC is equal to a DFave of around 3·2%, although there was a small difference by location. Thus, the case of an approximately 90% area over 25 FC in LEED 2.2 should be reconsidered, due to the side effects of daylight, to avoid a DFave of over 5%. Therefore, given the data for window area, VT and lease span, architects and engineers can predict the two daylight requirements to improve the daylight level. Moreover, not only can the performance be evaluated, this also allows us to fi nd or fi x the fenestration problems during the tall building design process.
Therefore, the two guidelines for fenestration criteria presented in this section are related to the window area, VT and lease span. This study also suggested that tall-building designers could use the proposed simplifi ed method to quickly determine the daylight performance for a given window type, window area, location, building geometry and lease span. These simplifi ed tools can hence be used as guidelines to predict daylight performance and design fenestration in order to meet the recom-mended DF requirement or obtain credit in the LEED 2.2 rating system. Moreover, it is important that architects understand the importance of the role of fenestration, and focus on how windows can be designed considering the building envelope and lease spans.
6. CONCLUSION
In this paper, we demonstrated the current problems facing daylight consideration in tall-building design. This study focused on the importance of tall-building planning consideration and the choice of fenestration factors to achieve the optimum daylight level. First, among the various tall-building design considerations, simulated models considered geometry, modules and lease span, based on current tall-building data. In the next step, the two daylight requirements of the DFave and LEED 2.2 were selected. We then used RADIANCE to present the results of daylighting analysis for typical high-rise offi ce spaces in four different locations, London, Chicago, Dubai and Bangkok.
The simulation results were presented to (a) evaluate the impact of the EA, glazing area and VT, and lease span; and (b) to provide guidelines to meet the two daylight requirements. Therefore, para-metric analyses were conducted and a simplifi ed method was developed for preliminary prediction of daylight performance in relation to the two daylight requirements, DFave and LEED 2.2. We found that the two different performance parameters, DFave and area percentage over 25 FC, were related to the ‘EA/lease span’. Based on our regression analysis, R2 values over 0·97 indicated a strong cor-relation between the ‘EA/lease span’ and the two daylight requirements. When the ‘EA/lease span’ was greater than 60, a minimum DFave of over 2% could be achieved. In order to reduce the daylight disadvantages, a DFave of 5% can be prevented when the ‘EA/lease span’ is under 165. For the DFave under overcast sky conditions, the ratio of the average FC to the external horizontal FC was constant when all other properties were the same. Therefore, the DFave was almost the same regardless of the location under these research conditions. In LEED 2.2, when the ‘EA/lease span’ was greater than 100 (Bangkok), 104 (Dubai), 106 (Chicago) and 110 (London), a minimum area percentage over 25 FC could be achieved. Although the differences in geographical location were large, the differences in terms of the daylight performance results were only small, due to the external FC and sun altitude. Even though the simulations were performed in four different cities, the results could be applied to locations with similar latitudes ranging from 13 to 51 degrees north. In the fi nal step, with a com-parison of the two results, an approximately 49% area exceeding 25 FC could be achieved when the DFave was 2%. A DFave of 5%, the recommended maximum DFave, was equal to a 92% area over 25 FC when the ‘EA/lease span’ was 165. Moreover, a 75% area over 25 FC was equal to a DFave of around 3·2%, although there was a small difference by latitude. Moreover, it was found that lease span had a larger impact than location on the daylight performance.
974 D.-H. KO, M. ELNIMEIRI AND R. J. CLARK
Copyright © 2008 John Wiley & Sons, Ltd. Struct. Design Tall Spec. Build. 17, 953–976 (2008) DOI: 10.1002/tal
Therefore, these simplifi ed tools can be used as guidelines on how to estimate daylight performance and how to design fenestration in order to meet the two different daylight requirements. In particular, this will contribute to predicting the daylight performance of tall buildings and can be applied to appropriate daylight-effi cient strategies, whether a design meets the daylight requirement or not. We hope that this research will enable architects and engineers to help achieve better daylight performance through a consideration of fenestration design, sky conditions, location, tall-building planning consid-erations and daylight requirements.
REFERENCES
Aboulnaga MM. 2006. Towards green buildings: glass as a building element—the use and misuse in the Gulf region. Renewable Energy 31: 631–653.
ASHRAE Standard. 2004. ANSI/ASHRAE/IESNA Standard 90.1-2004. Energy standard for buildings except low-rise residential buildings.
BCO. 2005. BCO Guide 2005. Best practice in the specifi cation of offi ces. BCO: London.Brotas L, Wilson M. 2006. Daylight in urban canyons: planning in Europe. In Proceedings of PLEA2006, the
23rd Conference, Geneva, Switzerland, 6–8 September.Brotas L, Wilson M. 2007. The average total daylight factor. In Proceedings of the 12th National Conference on
Lighting Light 2007. Varna, Bulgaria, 10–12 June.BSI. 1992. BS 8206: Part 2 Lighting for buildings: code of practice for daylighting. BSI: London.Canziani R, Peron F, Rossi G. 2004. Daylight and energy performances of a new type of light pipe. Energy and
Buildings 36: 1163–1176.Cho JS. 2007. A study of form composition and effi ciency in high-rise offi ce buildings. Journal of the Architec-
tural Institute of Korea 23(6): 33–40.Choi YS. 2000. A study on planning and development of tall building: the exploration of planning considerations.
PhD Dissertation, Illinois Institute of Technology.CIBSE. 1999. Daylighting and window design. Lighting Guide LG10:1999. CIBSE: London.Colorado Governor’s Offi ce of Energy Management & Conservation and USGBC. 2006. Using LEED-NC in
Colorado: tips, resources and examples. Offi ce of Energy Management & Conservation (OEMC): Denver, Colorado, USA.
CTBUH. 1995. Architecture of Tall Building. McGraw-Hill: Bethlehem, Pennsylvania, USA.Dogrusoy IT, Tureyen M. 2007. A fi eld study on determination of preferences for windows in offi ce environ-
ments. Building and Environment 42(10): 3660–3668.Germany DIN 5034-4 Standard: Daylight in interiors—Part 4: Simplifi ed determination of minimum window
sizes for dwellings. 1994. German Institute for Standardization. Berlin, Germany.Ghisi E, Tinker JA. 2005. An Ideal Window Area concept for energy effi cient integration of daylight and artifi -
cial light in buildings. Building and Environment 40(1): 51–61.Grimme FW, Laar M. 2006. Solar Radiation & Orientation as a Key Information for Bioclimatic Design. Insti-
tute of Technology in the Tropics: Technology Resource Management & Development—Scientifi c Contribu-tions for Sustainable Development, Vol. 1, ISSN 1618-3312, Köln, Germany.
HO Paul HK. 2007. Economics Planning of Super Tall Buildings in Asia Pacifi c Cities. FIG (International Fed-eration of Surveyors). The 30th FIG General Assembly and Working Week, 13th May, Hong Kong, China.
Hopkinson GR, Petherbridge P, Longmore J. 1966. Daylighting. Heinemann: London.IESNA. 2000. IESNA Lighting Handbook (9th ed). IESNA: New York, NY.IECC. 2006. International Energy Conservation Code 2006. International Code Council, Inc.: Country Club Hills,
IL.Jappsen HM. 2002. Interview with Dipl.-Ing. Hans M. Jappsen. Emporis Corporation: New York, NY. https://
community.emporis.com.Johnson R, Connell D, Selkowitz S, Arasteh D. 1985. Advanced optical materials for daylighting in offi ce build-
ing. In Proceedings of the 10th National Passive Solar Conference, Raleigh, NC, USA.Kim HI. 2004. Space effi ciency in mixed-use high-rise building. PhD Dissertation, Illinois Institute of Technol-
ogy.Ko DH, Elnimeiri M, Clark RJ. 2007a. Application of LEED green building rating system in South Korea: day-
light requirement and energy performance. In Proceedings of SB07 (International Conference on Sustainable Building Asia), Seoul, South Korea; 101–106.
DAYLIGHT PERFORMANCE IN HIGH-RISE BUILDINGS 975
Copyright © 2008 John Wiley & Sons, Ltd. Struct. Design Tall Spec. Build. 17, 953–976 (2008) DOI: 10.1002/tal
Ko DH, Elnimeiri M, Clark RJ. 2007b. A simplifi ed method to evaluate the daylight and energy performance in the LEED 2.2 rating system. In Proceedings of PLEA2007, Singapore; 671–678.
Ko DH, Elnimeiri M, Clark RJ. 2008. Simulation-based assessment of two different daylight requirements: day-light factor and LEED 2.2. In Proceedings of SET2008, Seoul, South Korea; 1823–1830.
Krarti M, Erickson PM, Hillman TC. 2005. A simplifi ed method to estimate energy savings of artifi cial lighting use from daylighting. Building and Environment 40: 747–754.
LBNL. 1997. Tips for daylighting with window. LBNL-39945. Ernest Orlando Lawrence Berkeley National Laboratory: Berkeley, CA.
Lighting Research Center. 2008. Daylighting Resources—Design Guides. Rensselaer Polytechnic Institute: Troy, NY. http://www.lrc.rpi.edu/programs/daylighting.
Li DHW, Tsang EKW. 2008. An analysis of daylighting performance for offi ce buildings in Hong Kong. Build-ing and Environment 43(9): 1446–1458.
Moeck M, Yoon YJ. 2004. Green buildings and potential electric light energy savings. Journal of Architectural Engineering 10(4): 143–159.
Nabil A, Mardaljevic J. 2006. Useful daylight illuminances: A replacement for daylight factors. Energy and Buildings 38(7): 905–913.
Niu J. 2004. Some signifi cant environmental issues in high-rise residential building design in urban areas. Energy and Buildings 36(12): 1259–1263.
UCD-OPET (University College Dublin—The Organisation for the Promotion of Energy Technologies). 1994. Daylighting in Buildings, Energy Research Group, School of Architecture. University College Dublin, Dublin, Ireland.
Park SM, Elnimeiri M, Sharpe DC, Krawczyk RJ. 2004. Tall building form generation by parametric design process. In Proceedings of the CTBUH 2004 Conference, Seoul, Korea.
Reinhart CF. 2006. Tutorial on the use of daysim simulations for sustainable design. Institute for Research in Construction, National Research Council Canada: Ottawa, Canada.
Reinhart CF, Fitz A. 2006. Findings from a survey on the current use of daylight simulations in building design. Energy and Buildings 38: 824–835.
Robbins C. 1986. Daylighting: Design and Analysis. Van Nostrand Reinhold: New York.Roche L, Dewey HE, Littlefair HP. 2000. Occupant reactions to daylight in offi ces. International Journal of
Lighting Research and Technology 32(3): 119–126.Saridar S, Elkadi H. 2002. The impact of applying recent facade technology on daylighting performance in build-
ings in eastern Mediterranean. Building and Environment 37(11): 1205–1212.Shpuza E. 2006. Floorplate shapes and offi ce layouts: a model of the effect of fl oorplate shape on circulation
integration. PhD Dissertation, Georgia Institute of Technology.Tsangrassoulis A, Bourdakis V. 2003. Comparison of radiosity and ray-tracing techniques with a practical design
procedure for the prediction of daylight levels in atria. Renewable Energy 28: 2157–2162.US DOE. 2008. Daylighting in commercial buildings. Energy Effi ciency and Renewable Energy, Information
Resources. Design, Construct & Renovate. http://www1.eere.energy.gov/buildings/commercial/lighting.html.USGBC. 2002. LEED®-NC Green Building Rating System for New Construction & Major Renovation, Version
2.1.USGBC. 2005. LEED®-NC Green Building Rating System for New Construction & Major Renovation, Version
2.2.USGBC. 2008a. LEED® for New Construction 2009, For 1st Public Comment. USA: USGBC. 2008b. Online
Available: http://www.usgbc.org.Ward GL, Shakespeare R. 1998. Rendering with RADIANCE. The art and science of lighting visualization.
Morgan Kaufmann: Los Altos, CA.WAREMA. 2003. WAREMA Daylight Systems. Vorderbergstrasse 30, 97828 97828arktheidenfeld. http://www.
warema.de.WBDG. 2008. Executive Order 13423 Technical Guidance—Daylighting, General Principles and Commitments.
http://www.wbdg.org/references/mou_daylight.php.Wilson M, Walker JH, Santamouris M, Jaure S. 2002. Design Process for Energy Effi cient New and Refurbished
Housing. University of North London: London.Yoon JY, Moeck M. 2005. Two studies that investigate the impact of ceiling and wall refl ectance values on LEED
credits. Journal of Architectural Engineering 11(3): 81–90.