Embed Size (px)
Citation preview
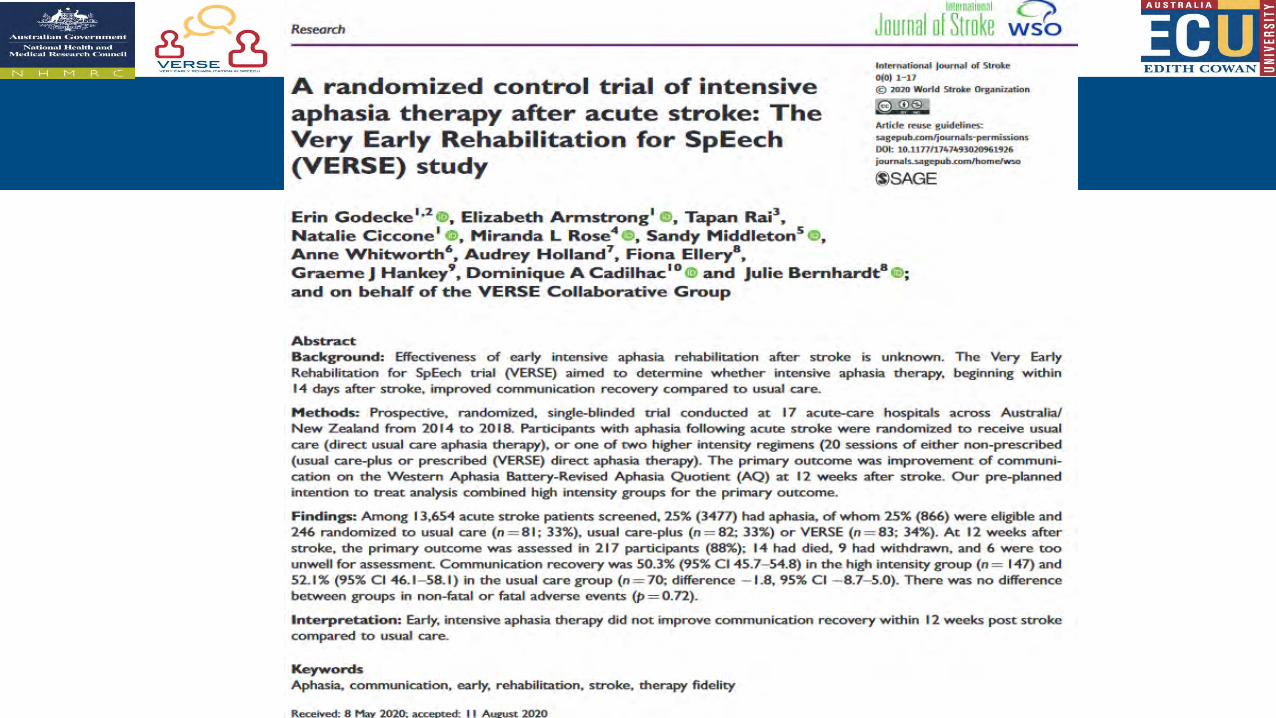
Assessment and management of Aphasia post
stroke
A/Prof Erin GodeckeSenior Research Fellow Speech PathologySchool of Medical and Health SciencesEmail: [email protected]
@ErinGodecke
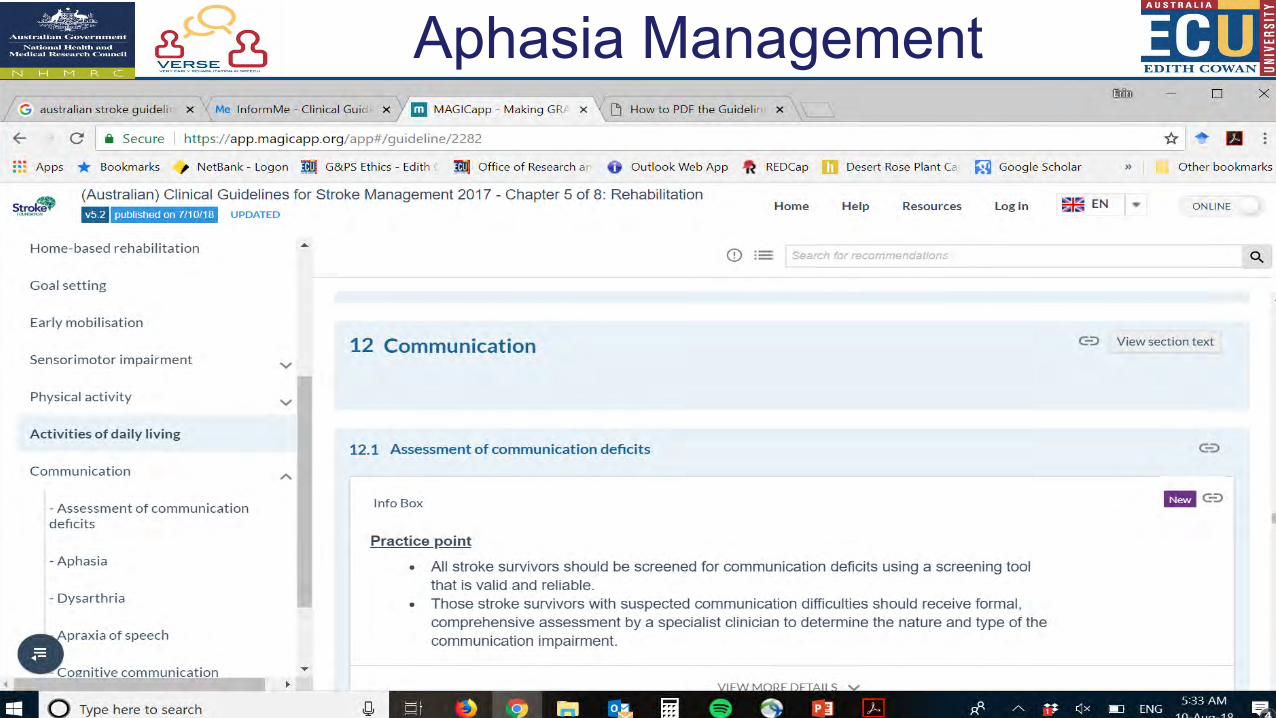
Aphasia Management
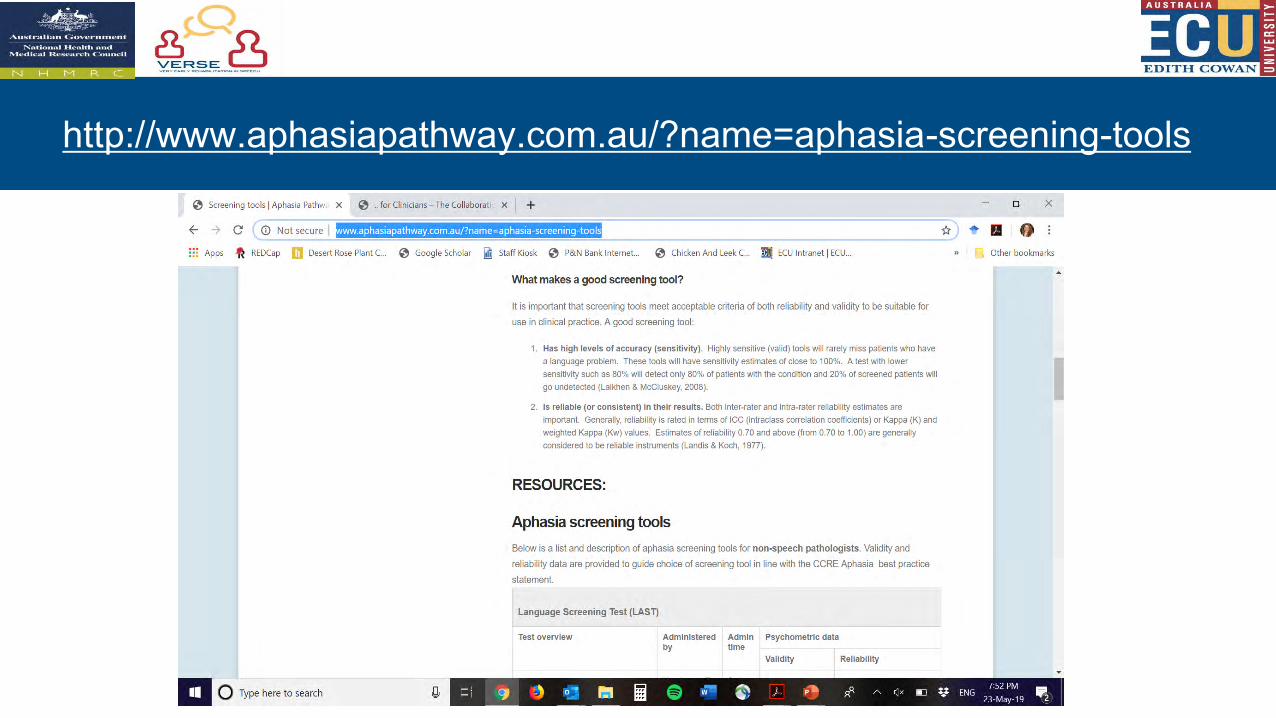
Screening toolshttp://www.aphasiapathway.com.au/?name=aphasia-screening-tools
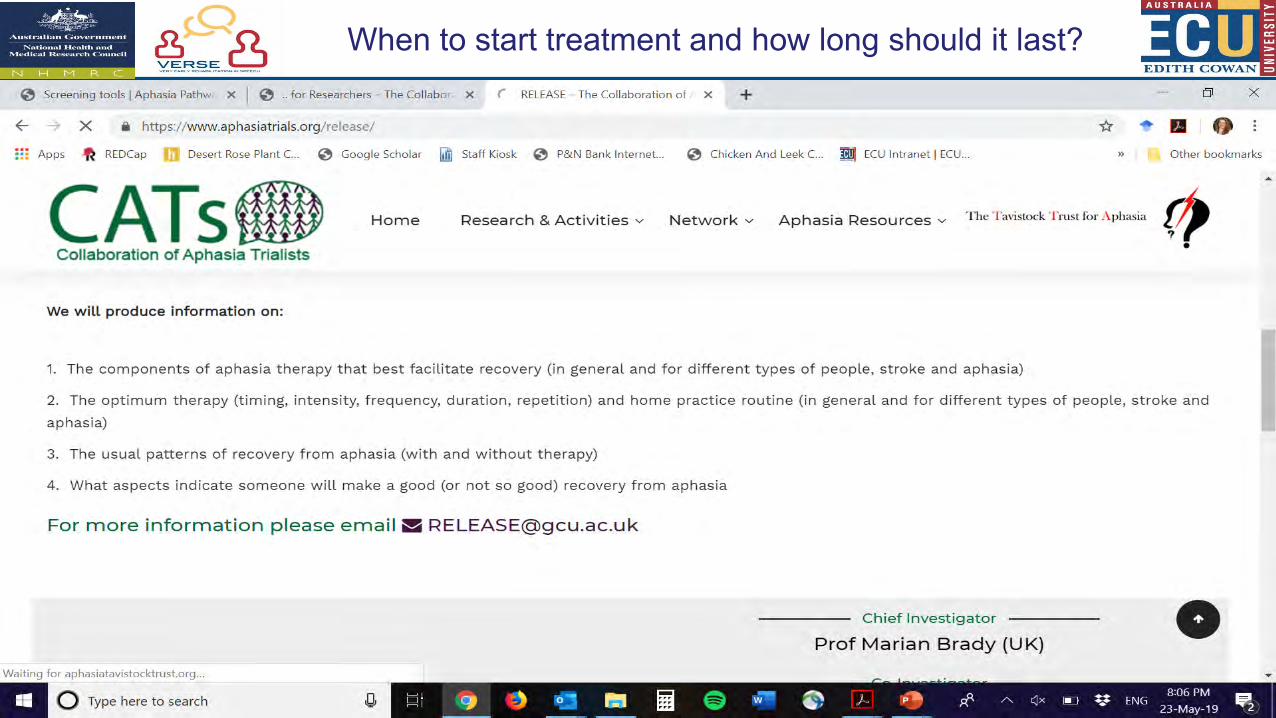
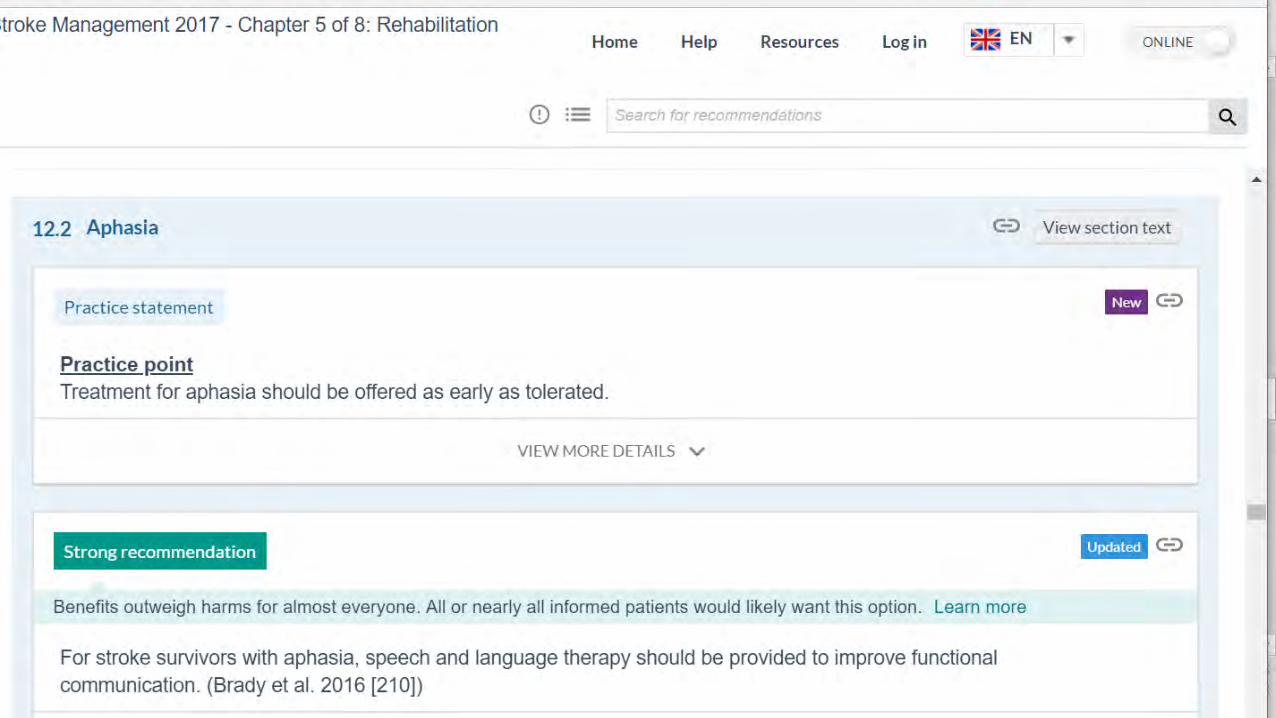
When to start treatment and how long should it last?
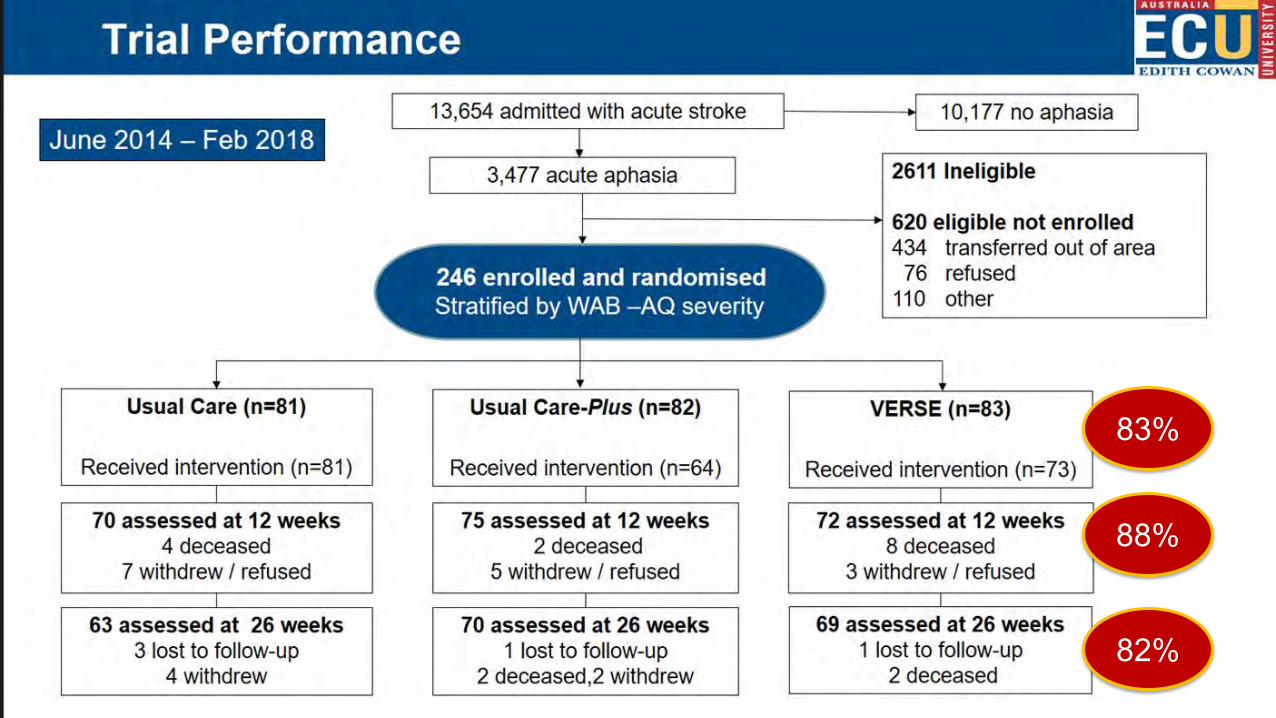
83%
88%
82%
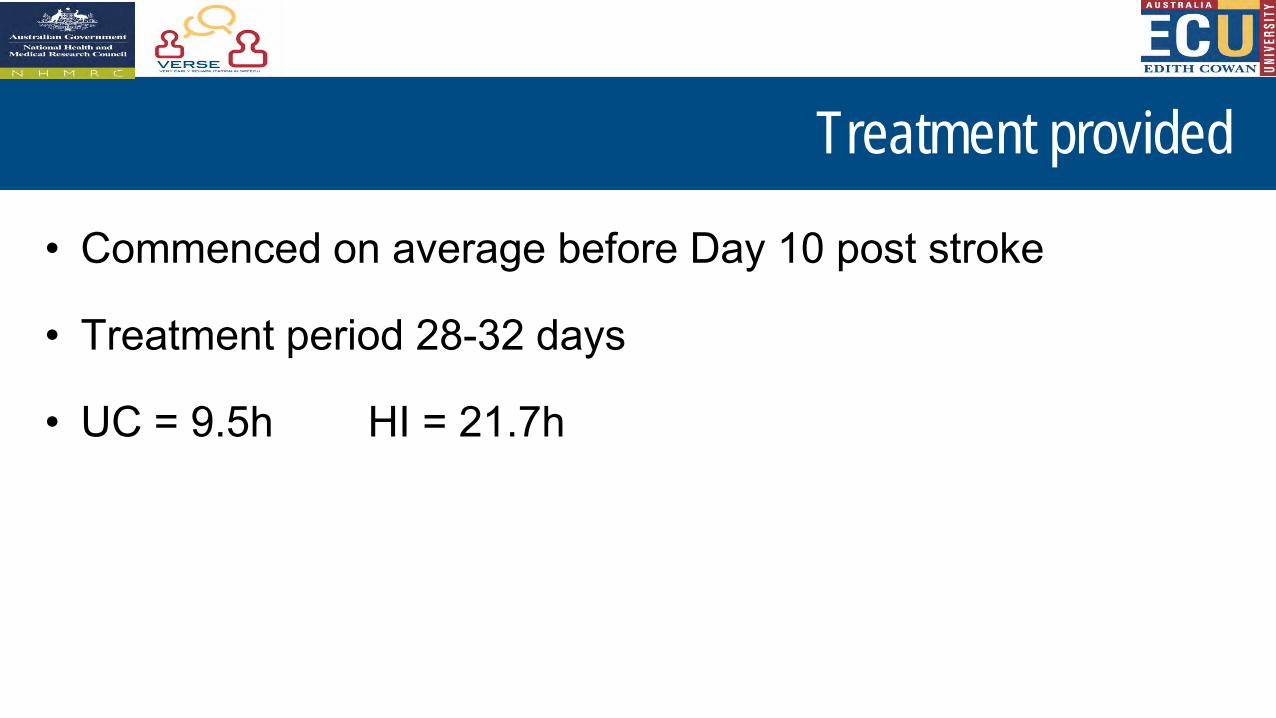
Treatment provided
• Commenced on average before Day 10 post stroke
• Treatment period 28-32 days
• UC = 9.5h HI = 21.7h
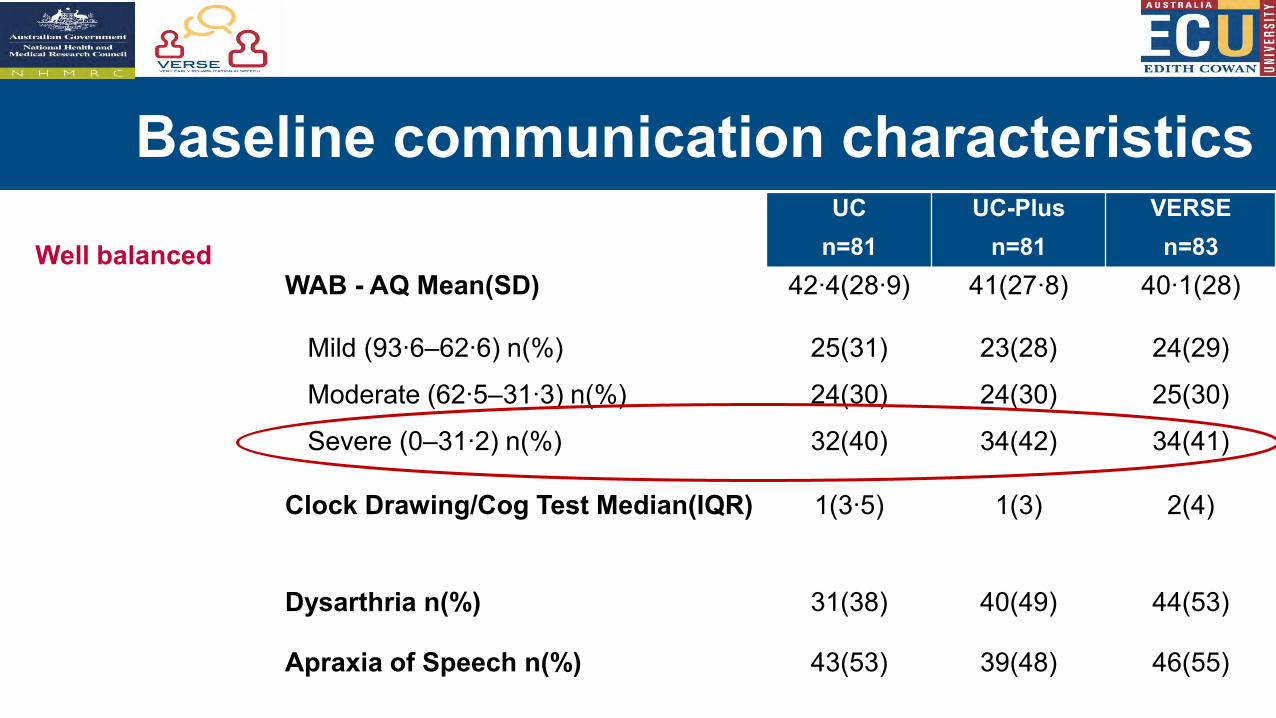
Baseline communication characteristicsUC
n=81UC-Plus
n=81VERSEn=83
WAB - AQ Mean(SD) 42∙4(28∙9) 41(27∙8) 40∙1(28)
Mild (93∙6–62∙6) n(%) 25(31) 23(28) 24(29)
Moderate (62∙5–31∙3) n(%) 24(30) 24(30) 25(30)
Severe (0–31∙2) n(%) 32(40) 34(42) 34(41)
Clock Drawing/Cog Test Median(IQR) 1(3∙5) 1(3) 2(4)
Dysarthria n(%) 31(38) 40(49) 44(53)
Apraxia of Speech n(%) 43(53) 39(48) 46(55)
Well balanced
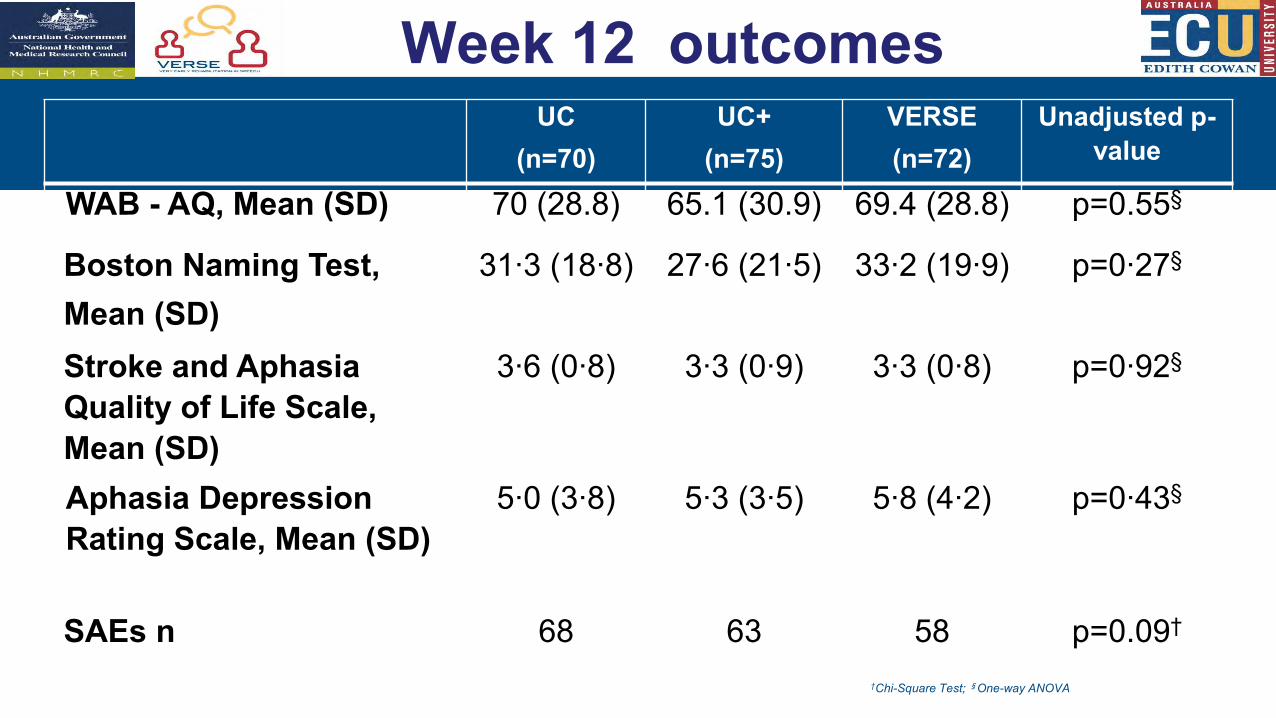
–Week 12 outcomesUC
(n=70)UC+
(n=75)VERSE(n=72)
Unadjusted p-value
WAB - AQ, Mean (SD) 70 (28.8) 65.1 (30.9) 69.4 (28.8) p=0.55§
Boston Naming Test, Mean (SD)
31∙3 (18∙8) 27∙6 (21∙5) 33∙2 (19∙9) p=0∙27§
Stroke and Aphasia Quality of Life Scale, Mean (SD)
3∙6 (0∙8) 3∙3 (0∙9) 3∙3 (0∙8) p=0∙92§
Aphasia Depression Rating Scale, Mean (SD)
5∙0 (3∙8) 5∙3 (3∙5) 5∙8 (4∙2) p=0∙43§
SAEs n 68 63 58 p=0.09†
†Chi-Square Test; §One-way ANOVA
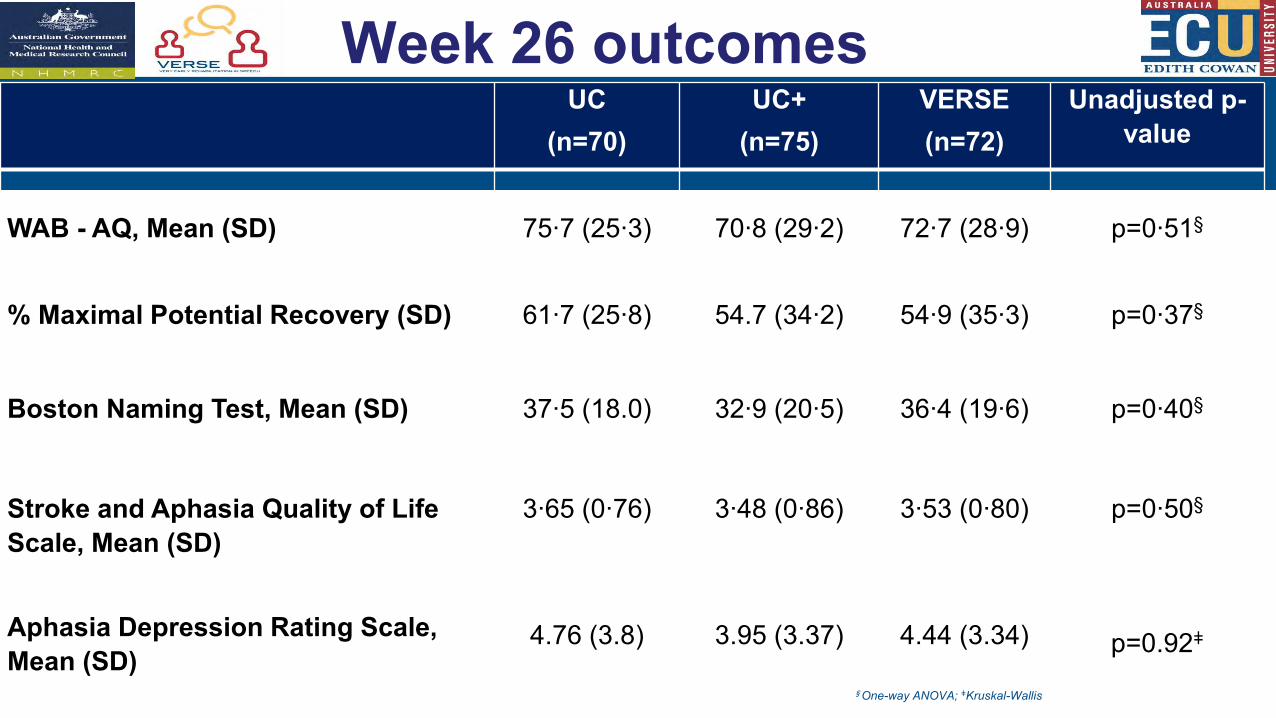
Week 26 outcomesUC
(n=70)UC+
(n=75)VERSE(n=72)
Unadjusted p-value
WAB - AQ, Mean (SD) 75∙7 (25∙3) 70∙8 (29∙2) 72∙7 (28∙9) p=0∙51§
% Maximal Potential Recovery (SD) 61∙7 (25∙8) 54.7 (34∙2) 54∙9 (35∙3) p=0∙37§
Boston Naming Test, Mean (SD) 37∙5 (18.0) 32∙9 (20∙5) 36∙4 (19∙6) p=0∙40§
Stroke and Aphasia Quality of Life Scale, Mean (SD)
Aphasia Depression Rating Scale, Mean (SD)
3∙65 (0∙76)
4.76 (3.8)
3∙48 (0∙86)
3.95 (3.37)
3∙53 (0∙80)
4.44 (3.34)
p=0∙50§
p=0.92ǂ
§One-way ANOVA; ǂKruskal-Wallis
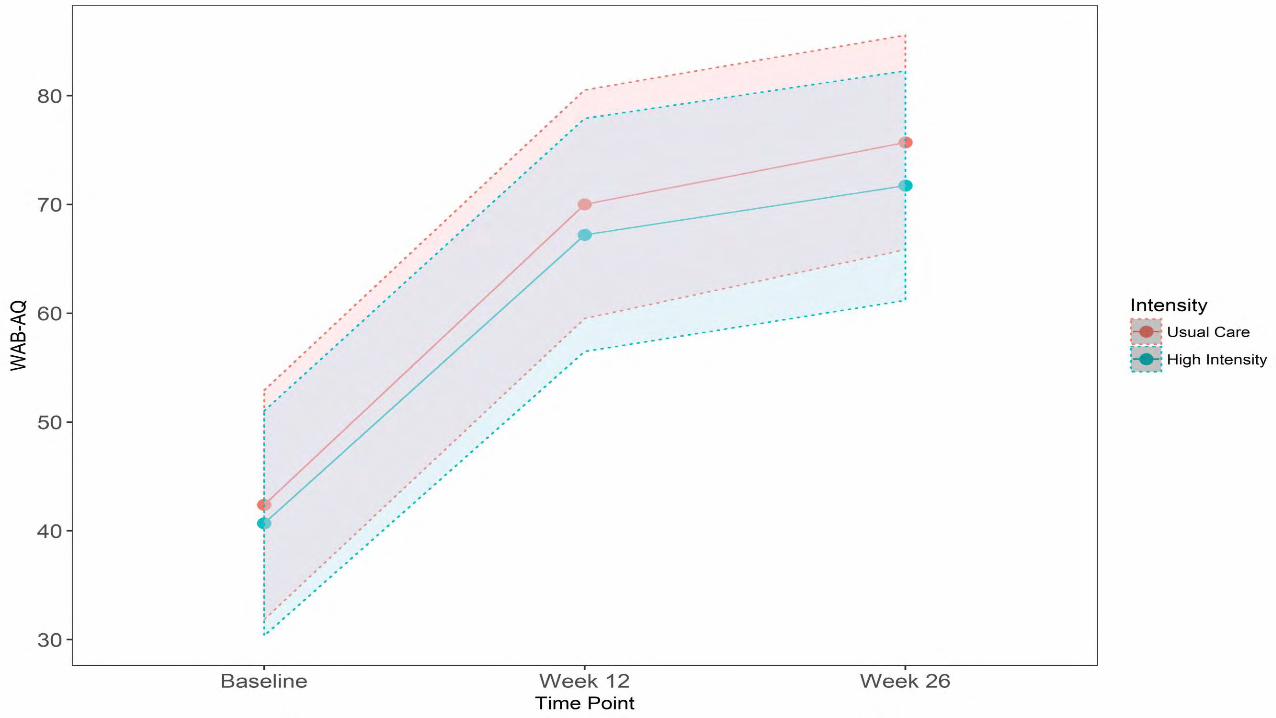
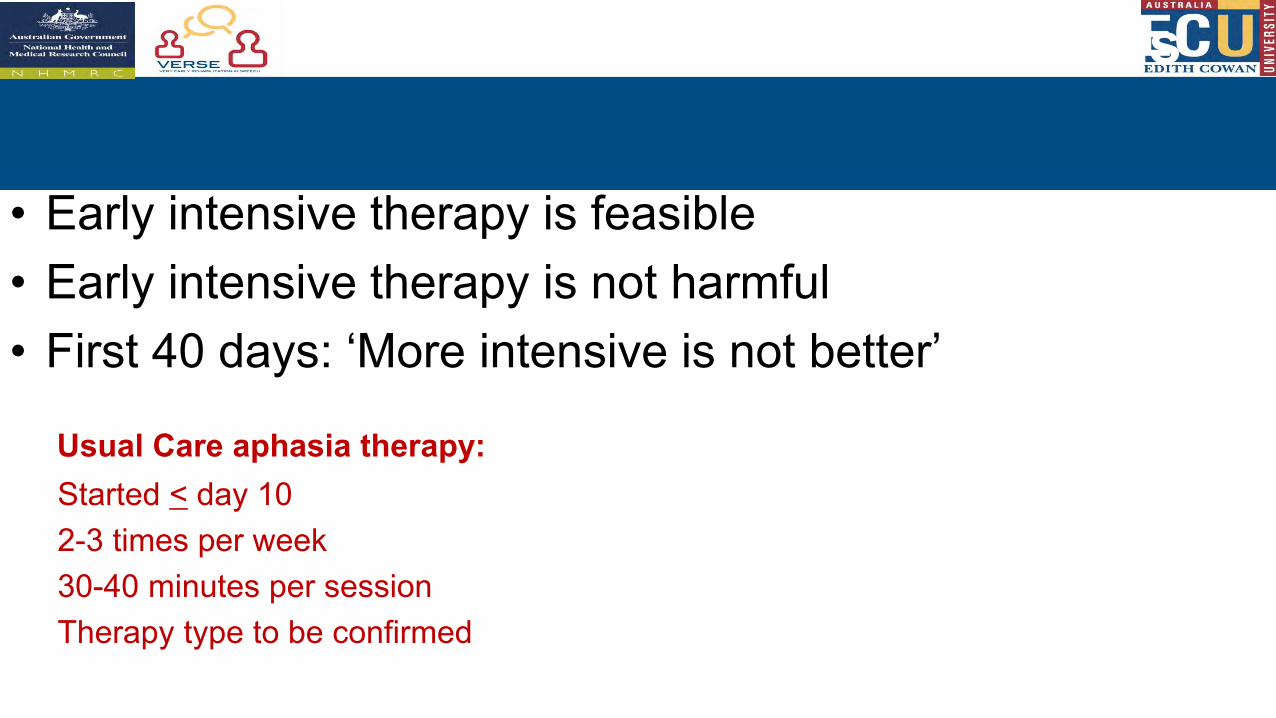
Conclusions
• Early intensive therapy is feasible • Early intensive therapy is not harmful• First 40 days: ‘More intensive is not better’
Usual Care aphasia therapy: Started < day 102-3 times per week30-40 minutes per sessionTherapy type to be confirmed
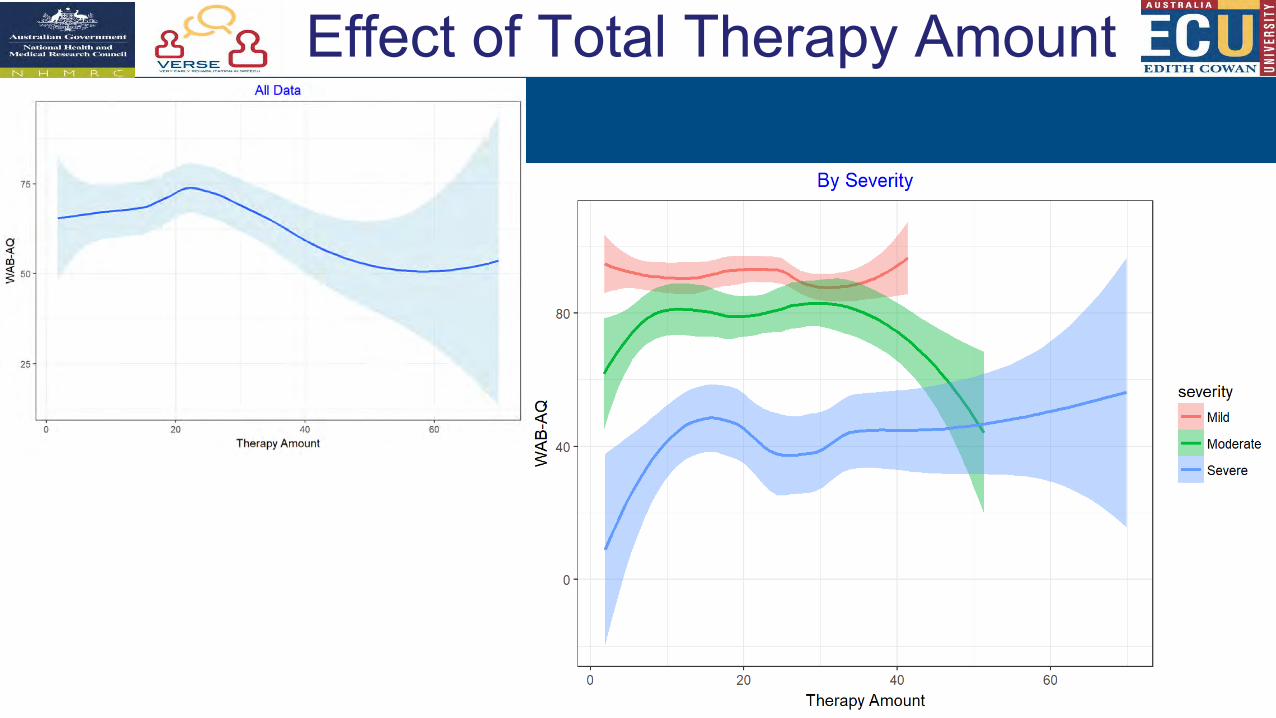
Effect of Total Therapy Amount
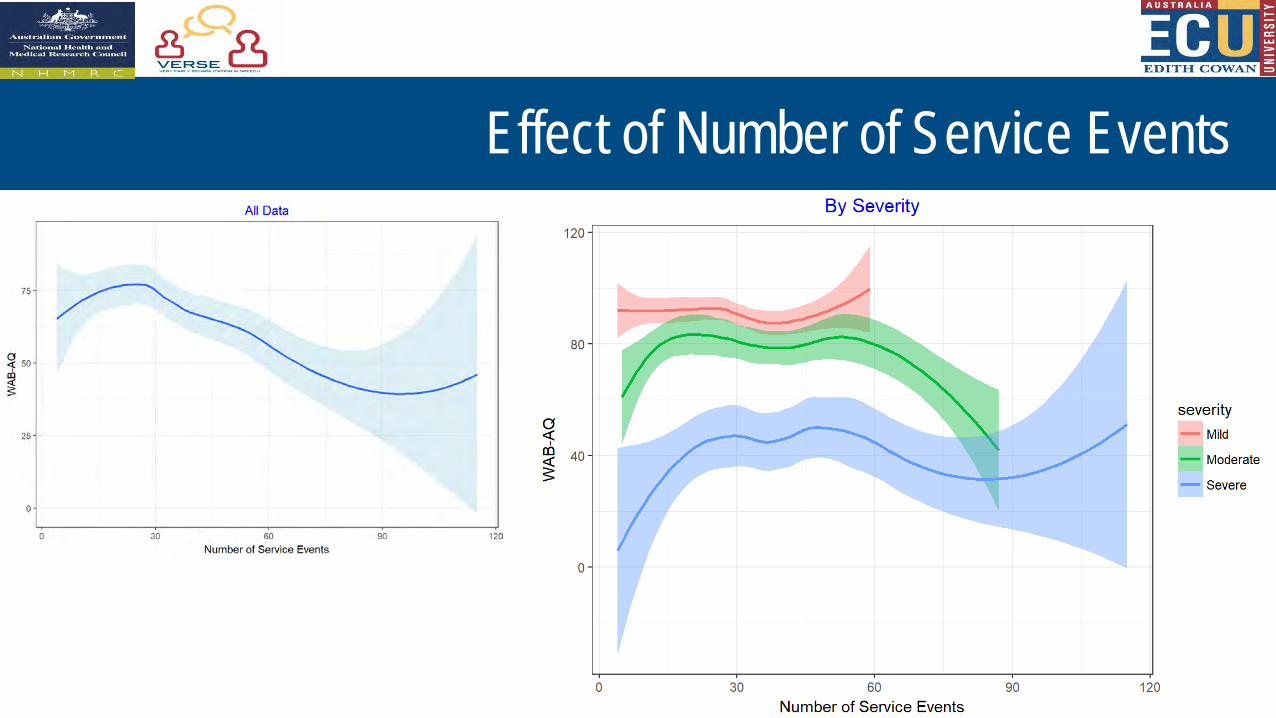
Effect of Number of Service Events
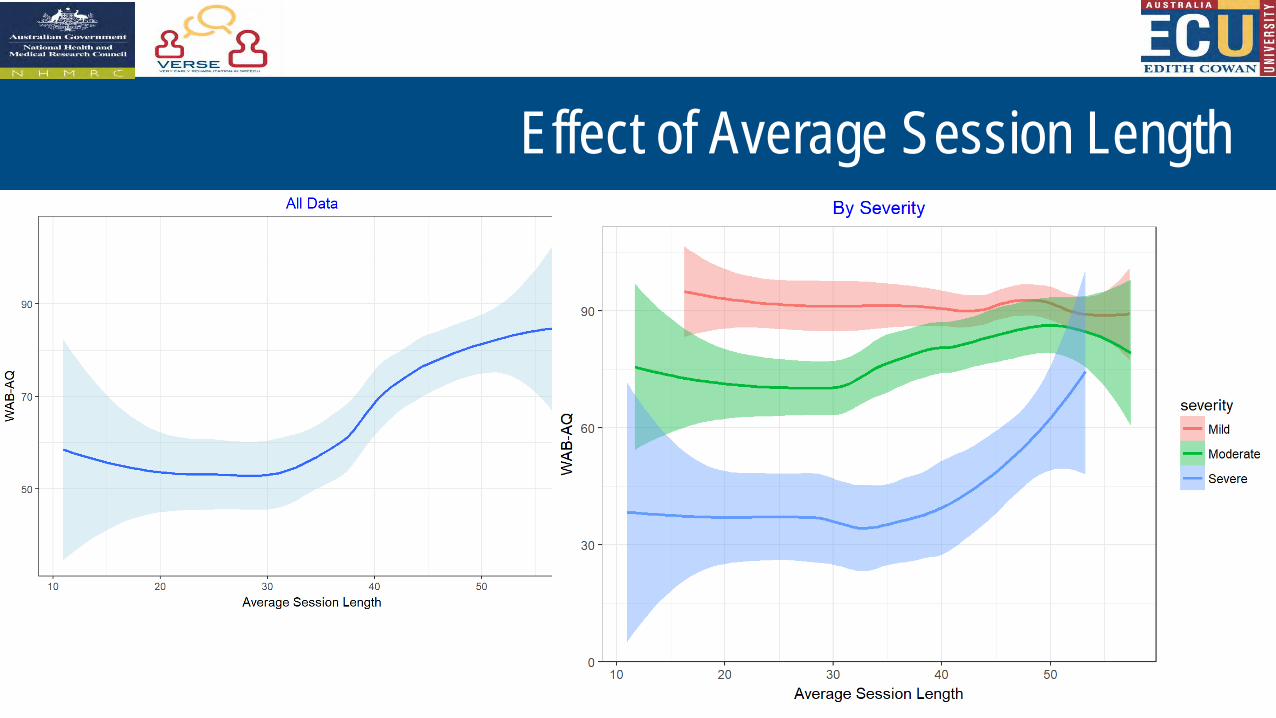
Effect of Average Session Length
21
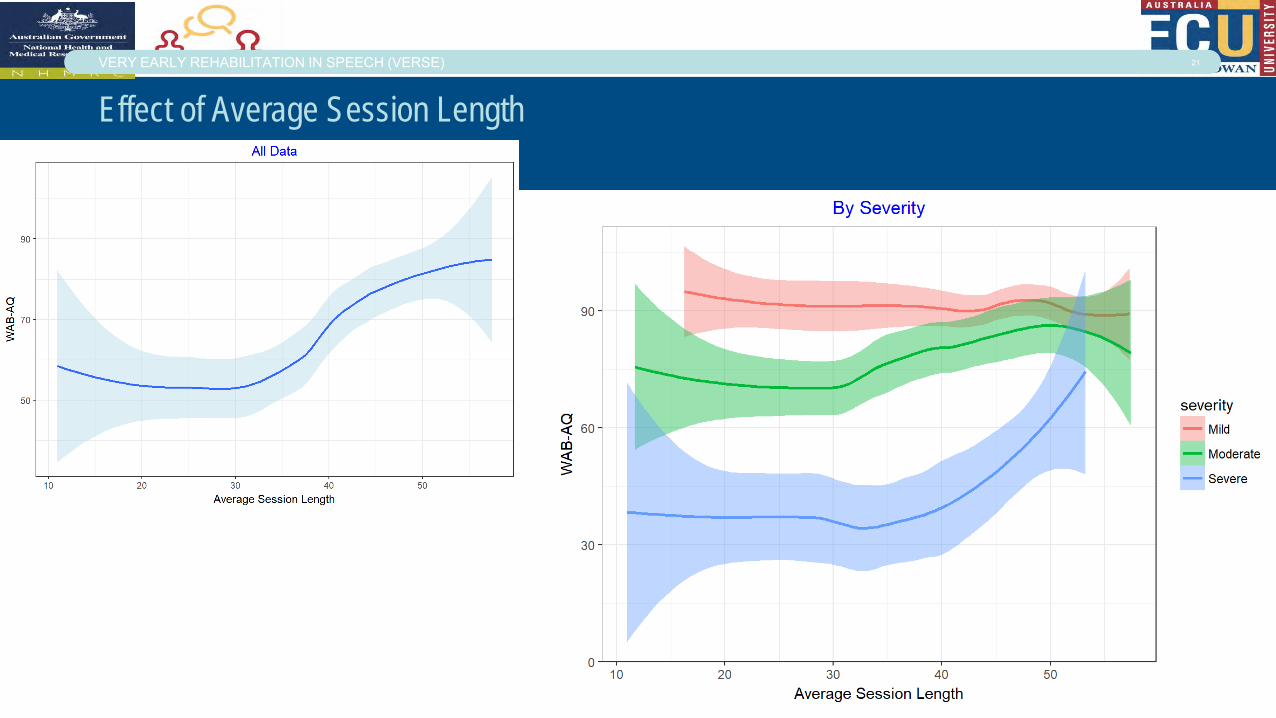
Effect of Average Session Length
VERY EARLY REHABILITATION IN SPEECH (VERSE)
The Results
After controlling for baseline aphasia severity, NIHSS, hospitalsite and total therapy amount:
1.Average Session Length had a significant effect on recovery(p=0.024)
2.On average, increasing the session length by 1 minuteresulted in a 0.33 point higher AQ score at 12 weeks post-stroke
The Results: Interpretation
If 2 participants have the same baseline AQ score and NIHSS scoreand each participant receives a total of 1350 minutes (22.5 hours) oftherapy in the first 12 weeks post-stroke, but
• Participant A receives 30 sessions of 45 minutes eachand
• Participant B receives 45 sessions of 30 minutes each
ThenParticipant A can be expected to achieve 5 points* more on AQ at 12
weeks than Participant B
Chronic recovery
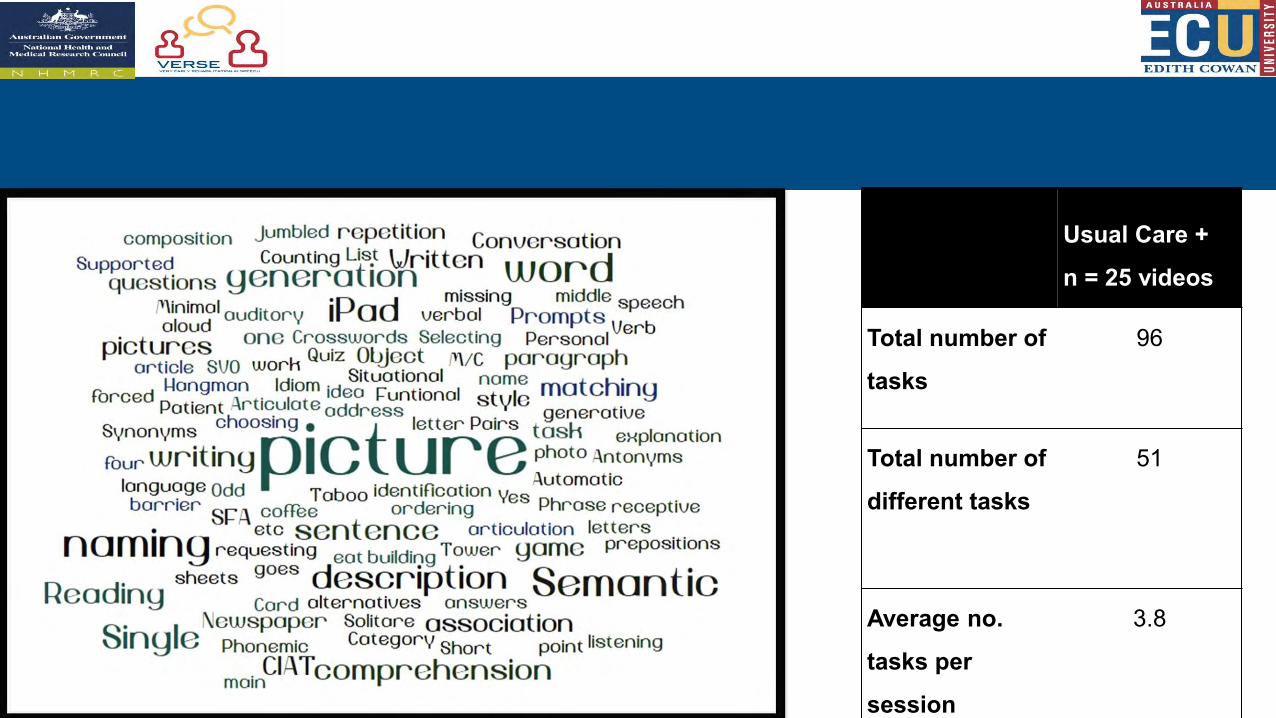
Usual Care +
n = 25 videos
Total number of
tasks
96
Total number of
different tasks
51
Average no.
tasks per
session
3.8
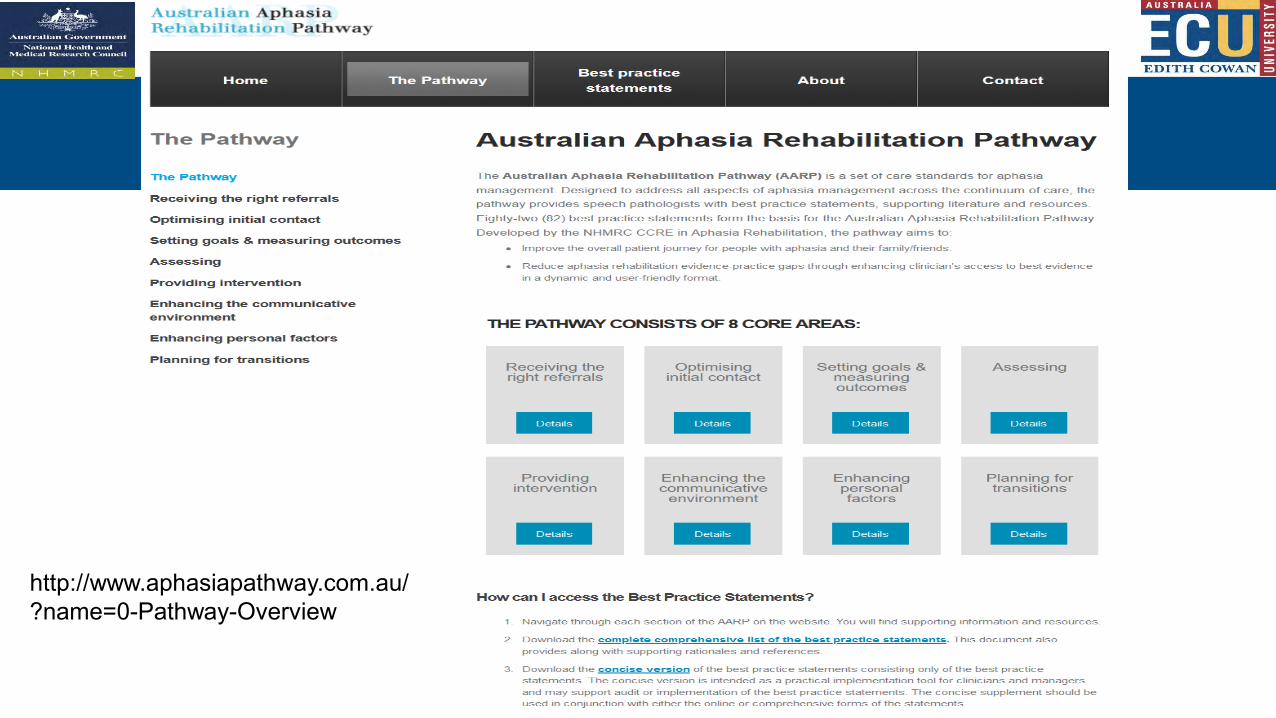
http://www.aphasiapathway.com.au/?name=0-Pathway-Overview
Questions?
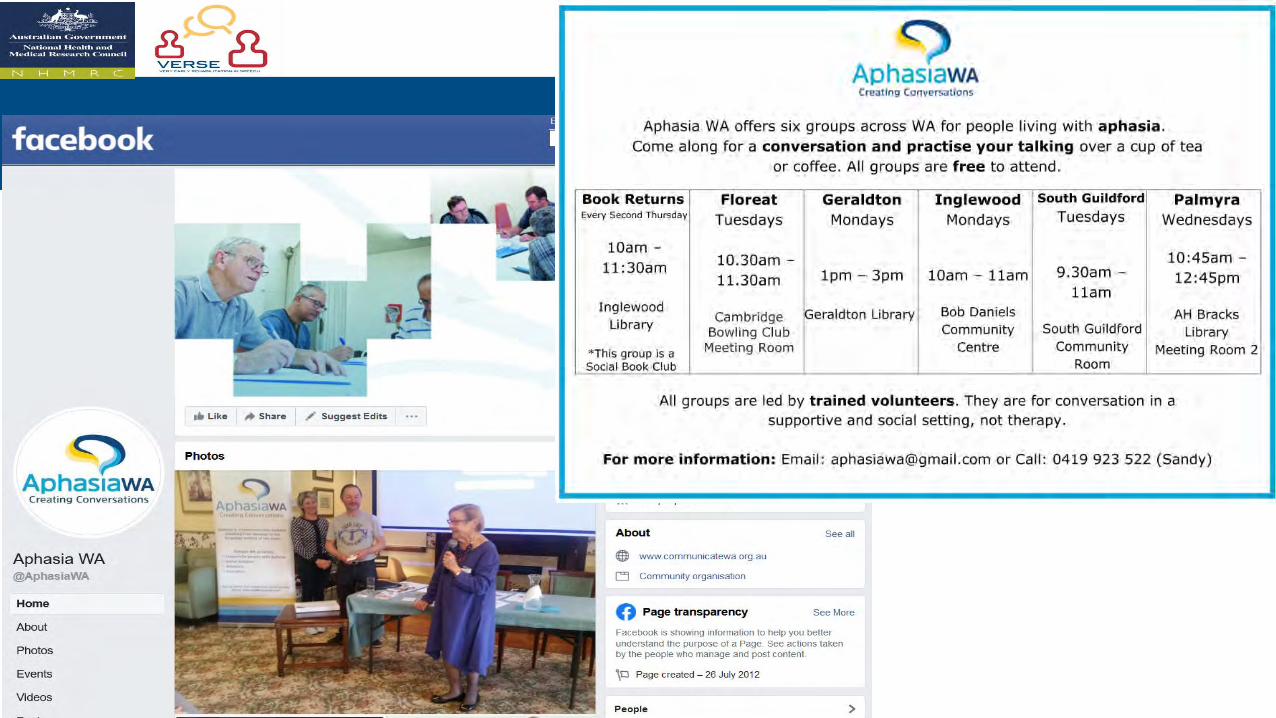
Community Aphasia Groups