Embed Size (px)
Citation preview


education is the standardized testing currently mandated by states and school dis-tricts. Standardized tests generally cover a very narrow range of subject matter andgenerally emphasize low-level thinking. Consequently, some scholars (e.g.,Romberg, Zarinnia, & Williams, 1989) claim that teachers who spend the bulk oftheir effort teaching to current standardized tests forgo the intellectual engagementstudents need to develop the kind of mathematical power recommended by the NationalCouncil of Teachers of Mathematics. However, after reviewing dozens of studieson the effects of mandated testing, Hancock and Kilpatrick (1993) conclude that“the picture given by the available research is neither so bleak as the one advancedby foes of standardized, multiple-choice testing, nor so rosy as that offered by pro-ponents of testing as the engine of school reform” (p. 169).
Even when district testing policies are relatively unobtrusive and when the sec-ondary school mathematics curriculum is changed in the direction outlined by theCurriculum and Evaluation Standards, teachers’ knowledge and beliefs also affecttheir assessment practices. For example, in studies conducted by the University ofChicago School Mathematics Project (UCSMP), teachers who field-tested preliminaryversions of UCSMP textbooks reported that, even when they felt confident teach-ing new content, they did not feel competent in writing exams about that new con-tent themselves (Hedges, Stodolsky, Mathison, & Flores, 1986). Teachers also reportedbeing troubled by issues relating assessment and grading. In particular, one teachernoted that, because the course she was teaching was much richer and more demand-ing than what her students had experienced earlier, her students’ grades weresometimes lower than they had been on tests covering only the simple skills on whichthey had been tested in the past (Usiskin et al., 1990/1993).
The discussion above suggests that changing assessment practices is a complexendeavor involving a variety of stakeholders. As the mathematics education com-munity makes detailed recommendations for changes in assessment practices(Marshall & Thompson, 1994; NCTM, 1995), it seems prudent that current prac-tices and the classroom teacher’s perspective on assessment be well documented.Surprisingly, when this study was begun there had been little reported research onhow mathematics teachers assess what their students know and can do, whatmathematics teachers think about current recommendations for changes in assess-ment, what factors they perceive to influence their assessment, or what problemsthey might encounter in trying to change current practices. Moreover, in the liter-ature on assessment in mathematics education there has been virtually no discus-sion about the relation between assessment and grading.
The lack of discussion about the relation between assessment and grading inmathematics education is curious, because several studies have reported that amongsecondary school teachers in both the United States (Stiggins & Conklin, 1992)and Canada (Wilson, 1990), assessment is generally perceived to be summativeand grading is the most frequently and consistently practiced assessment func-tion. For instance, Stiggins and Conklin report that assessment for purposes ofgrading among teachers of mathematics, science, social studies, and languagearts in Grades 7–12 consumes as much as a quarter of their instructional time in
188 Assessment and Grading in High School Mathematics
some classes and almost always provides the most direct and important feedbackto students on their academic progress. They also report that secondary school teach-ers are far less influenced by standardized tests than are elementary teachersworking in self-contained classrooms.
Since the research reported here was begun, several other studies have reportedon some aspects of high school teachers’ assessment practices. Cooney (1992)surveyed the assessment practices of secondary mathematics teachers in Georgia;Madaus and his colleagues (1992) surveyed teachers of mathematics in Grades4–12 from across the United States; Taylor (1992) surveyed algebra and geom-etry teachers in Ohio; and Garet and Mills (1995) surveyed mathematics depart-ment heads in high schools in Illinois, Wisconsin, and Michigan about instructionin Algebra I classes. All four studies reported that teachers rely heavily onshort-answer tests for assessment. Cooney, Taylor, and Madaus et al. eachreported a strong influence of publishers’ assessment materials on classroom prac-tices. According to both Cooney and Madaus et al., teachers regularly used thetests provided by their textbook’s publisher without making any modificationsto them. In contrast, Taylor reported that teachers in her sample tended to use pub-lishers’ tests more frequently as sources of questions for teacher-made tests. BothMadaus et al. and Taylor analyzed the textbook publishers’ tests and found thatthey reflected neither the content nor the processes recommended by theCurriculum and Evaluation Standards (NCTM, 1989). Analysis of sample testitems submitted by the teachers in Cooney’s and Taylor’s samples showed sim-ilar results. Like Stiggins and Conklin (1992), Cooney reported a strong link betweenassessment and grading in the minds of high school teachers.
The goals of the research reported here are to document high school mathematicsteachers’ practices and to understand teachers’ perspectives as they assess their stu-dents’ performance and translate the results of their assessment into grades. Thus, thisstudy examines some of the same issues addressed in the recent surveys by Cooney(1992), Taylor (1992), Madaus et al. (1992), and Garet and Mills (1995). However,it looks at teachers’ assessment practices in much more detail and over a longer periodthan any previous study. It also examines relations between assessment and grading,and it analyzes teachers’ perspectives on their practices.
There are four major research questions:
1. What types of instruments do high school mathematics teachers use for assess-ment in their classrooms?
2. How do teachers use these instruments to determine students’ grades?
3. To what extent are teachers’ assessment and grading practices consistent with therecommendations about assessment in the Curriculum and Evaluation Standards (NCTM,1989)? In particular, to what extent have teachers implemented recommendations regard-ing the use of multiple assessment techniques, the use of calculators and computersin assessment, and the assessment of communication and reasoning? To what extentdo assessment instruments use problems set in realistic contexts? To what extent do
189S. L. Senk, C. E. Beckmann, and D. R. Thompson

they emphasize exercises or word problems requiring only one or two steps?1
4. What factors account for teachers’ current assessment and grading practices?In particular, what influences do standardized tests, the subject matter, the textbook,or the available technology have on assessment and grading practices?
METHOD
Sample
Schools. Schools were recruited to represent a variety of socioeconomic and edu-cational opportunities. Because the researchers wanted to probe for teachers’ useof alternative forms of assessment, schools in which teachers were using newer formsof assessment, such as oral or written reports, were actively sought. In order to exam-ine the extent to which assessment instruments were aligned with recommendationsregarding the use of technology, schools where there was some evidence of the useof calculators and computers in mathematics classes were also recruited. Ultimately,five schools in three states were chosen to participate in this project. In this studythe schools are called Highpoint, Roan Valley, St. Bridgette’s, Broadview, and JacksonHigh Schools.2
Highpoint High School is located in an upper-middle-class suburb near a verylarge midwestern city. About 90% of the students are White; the largest minoritygroup is Asian American. Virtually all of Highpoint’s graduates attend college, withmost attending 4-year colleges. Scores on college entrance exams are well abovethe national average, and many students earn Advanced Placement credit in calculus.At the time of the study the district had recently implemented a mandate to incor-porate writing in all school subjects. Soon after data collection was completed, Highpoint’smathematics department received a national award for its high-quality program.
Roan Valley is located in an affluent suburb near a large city in the midwest. Allbut a few students are White. Students are virtually all college-intending, and as istrue at Highpoint, college entrance test scores are above the national average. AdvancedPlacement calculus is offered.
St. Bridgette’s is a small Catholic school in a medium-sized midwestern city. Familiesare generally less affluent than those of students at either Highpoint or Roan Valley,but virtually all students are college bound. Calculus is not currently offered.
Broadview and Jackson High Schools are located in the same large county in theSouth. The county includes urban and suburban areas. A busing plan ensures thatno school population is more than 30% minority. The largest minority group in eachschool is African American. For several years prior to the study, the district had offeredsummer in-service courses on such topics as the use of applications in teaching alge-bra and the use of calculators and computers in teaching mathematics.
190 Assessment and Grading in High School Mathematics
1This study was begun before the Working Draft of the Assessment Standards (NCTM, 1993) had beenreleased. Hence, these standards did not influence this study’s design.
2All names of schools and teachers in this article are fictitious.

Broadview draws students from middle-income families from mostly suburbanneighborhoods. College entrance scores at Broadview are at about the national aver-age and Advanced Placement calculus is offered. Jackson High School’s studentsare mostly from lower- to middle-income families. The school does not offerAdvanced Placement calculus, but it has a magnet program for the arts. The aver-age SAT-M (Scholastic Aptitude Test—Mathematics) score at Jackson is about 50points below the national average.
Courses and teachers. In this study, assessment was considered only in coursesin which the majority of the content comprised topics in the Curriculum andEvaluation Standards for Grades 9–12 (NCTM, 1989). That is, the assessment prac-tices of teachers of courses called algebra, geometry, advanced algebra, trigonom-etry, functions, and precalculus were studied, whether they were consideredremedial, average, or honors by the school. Assessment was not studied in generalmathematics, prealgebra, or calculus classes.
From among those teachers within each school who volunteered to participatein this study, one teacher was chosen from each core course as defined above.3 Twenty-two teachers began the study, but 3 were dropped either because they failed to sup-ply most of the data requested, or because the assessment instruments they used wereidentical to those used by another teacher in the study. This article reports on the19 teachers who supplied most of the data requested. Eight teachers are from Highpoint,4 are from Broadview, 3 are from Jackson, and 2 each are from Roan Valley andSt. Bridgette’s.4
The sample consists of 8 men and 11 women. Their number of years of experi-ence teaching mathematics ranges from 4 to 27, with a mean of 18. All but 2 of theteachers have at least one degree in mathematics or mathematics education; 13 havemasters’ degrees, and one of these also has a Ph.D. in mathematics education. Incontrast, Weiss (1994) reports that only 63% of mathematics teachers in Grades 9–12have either an undergraduate or graduate major in their field.
Many teachers in the sample participate in professional activities. One teacherat Highpoint had been an officer in local and state professional organizations andis a leader in curriculum and research projects. One teacher at Roan Valley oftenconducted workshops in the midwest on uses of technology. The mathematics teach-ers at St. Bridgette’s regularly attended local and regional mathematics conferencesand workshops, as did several teachers at each of Broadview, Jackson, andHighpoint. Thus, with respect to level of professional activity, the teachers in thesample are also above the national average (Weiss, 1994).
191S. L. Senk, C. E. Beckmann, and D. R. Thompson
3In three schools the Department Head or administrator agreed to have his or her school partici-pate in the study, then either asked for volunteers or assigned teachers to participate. In twoschools one of the researchers contacted teachers directly to solicit volunteers, then obtained per-mission from administrators.
4Each teacher from Roan Valley and St. Bridgette’s provided data for two classes. However, only onecourse for each teacher was analyzed for this study.

Textbooks. Each school in the study used some materials in the vein of curriculumreform. In particular, textbooks developed by the University of Chicago School MathematicsProject (UCSMP) were used in at least one class in each study school (McConnellet al., 1990; Peressini et al., 1992; Rubenstein et al., 1992; Senk et al., 1990; Usiskin,Coxford, & Hirschhorn, 1991). Among the classes in the study, 12 used UCSMP textsand 7 used other texts. One of the other texts (Foerster, 1986), like the UCSMP mate-rials, is known for its applications of mathematics. The remaining texts covered fairlytraditional content, even though some were recent editions.
The textbooks developed by UCSMP for Algebra I, Geometry, and Algebra II assumethat scientific calculators are available to students at all times. The UCSMPpost–Algebra II textbooks assume that graphics technology (either a graphing calculatoror function-graphing computer software) is also available. Several other texts usedby teachers in the sample recommend, but do not assume, the use of calculators.
Technology. During the course of the study, each teacher in the sample had someaccess to technology. However, the nature and extent of the access varied consid-erably across schools.
When selected for the study, Highpoint had several computer laboratories, butbecause of high demand, they were often not available to mathematics teachers. Duringthe study a laboratory with Macintosh and NEXT computers was installed for theexclusive use of the mathematics department. The department also had several setsof graphing calculators for teachers to use. Mathematics classrooms generally didnot have computers.
During the study each mathematics teacher in Roan Valley had a Macintosh com-puter and video monitor in the classroom for demonstration, and access toMacintosh computers in a laboratory. Classroom sets of graphing calculators werealso available for instruction.
The teachers at St. Bridgette’s shared a classroom set of graphing calculatorsand had occasional access to a computer laboratory containing Apple IIe andMacintosh computers.
The mathematics departments of Broadview and Jackson owned some scientificcalculators for use by teachers and students, and each school had a computer lab-oratory for instructional use. At Broadview at least one teacher in the study had acomputer in her classroom for demonstration. Teachers at Broadview also had accessto several sets of graphing calculators for classroom use.
Among the teachers in the sample, 11 required calculators, 6 recommended them,one permitted their use, and one teacher’s use of technology was not clear. No teacherprohibited the use of calculators. In four of the five post–Algebra II classes graph-ing calculators were required. In all other classes in which a calculator wasrequired, recommended, or permitted, a scientific calculator was listed. Computerswere required by only two teachers, both post–Algebra II teachers at Highpoint.
Data Sources
Data were collected from three sources: questionnaires completed by the teachers,the assessment instruments used in each target class, and an interview with each teacher.
192 Assessment and Grading in High School Mathematics

Questionnaires. At the end of the first marking period each teacher wasasked to complete a questionnaire eliciting information about: (a) her or his aca-demic background and experience, (b) the target course (including contentgoals and access to technology), and (c) her or his assessment goals and grad-ing practices. Questionnaires administered during the year, generally one at theend of each marking period, probed for further information about assessment andgrading practices and potential influences on those practices.5 Descriptive sta-tistics were calculated for quantitative data. Responses to other questions weretranscribed and analyzed qualitatively.
Tests and quizzes. At the end of each marking period, each teacher in the studywas asked to supply a copy of each written assessment instrument used in the tar-get class. Upon receipt of the instruments they were sorted by type (e.g., test, quiz,written report). Teachers’ responses to the initial questionnaire indicated thatwritten tests were the primary assessment tool in each class. Examination of the testsand quizzes submitted indicated that except for the number of items on eachinstrument, the tests and quizzes were quite similar in content and format. Hence,only the tests were analyzed. Reported here are the analyses of all tests given bythe teachers in the sample during the first semester of the 1991–92 school year.
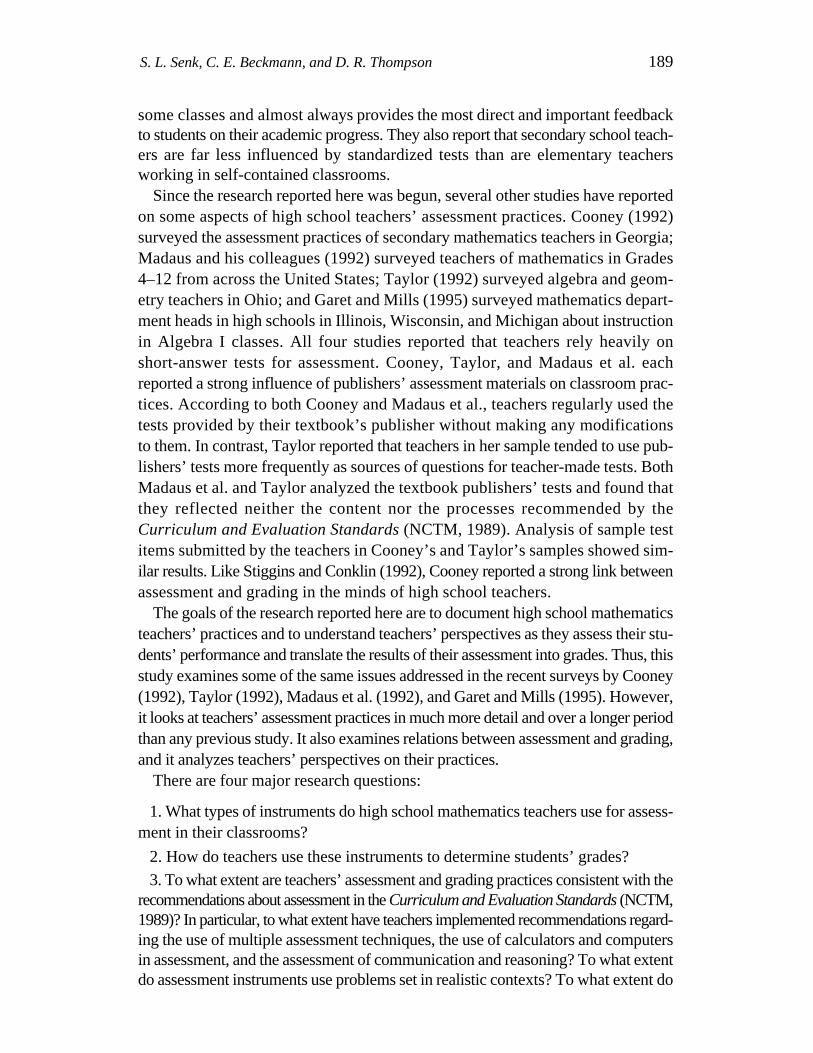
Categories and coding schemes were developed for individual items on thebasis of the terminology used in the Curriculum and Evaluation Standards (NCTM,1989) and other recent reports on assessment. Descriptions of the coding categoriesused in this study appear in Table 1.
Table 1Item Characteristics and Categories
CharacteristicCategory Description
Item formatAnswer given True or false, yes or no, multiple choice, or matchingAnswer not given Fill in the blank or longer free response
SkillYes Solution requires applying a well-known algorithm such as solving
equations or inequalities or bisecting an angle. Item does not require translation between representations.
No No algorithm is generally taught for answering such questions, or item requires translation across representations.
LevelLow A typical student in that course would use 1 or 2 steps to solve.Other A typical student in that course would use 3 or more steps to solve,
and the content is new to the course.
Realistic contextYes The item is set in a context outside of mathematics (e.g. art, fan-
tasy, science, sports).(table continued)
193S. L. Senk, C. E. Beckmann, and D. R. Thompson
5Highpoint issues report cards every 9 weeks, that is, twice each semester. In the other four schoolsreport cards are issued every 6 weeks.
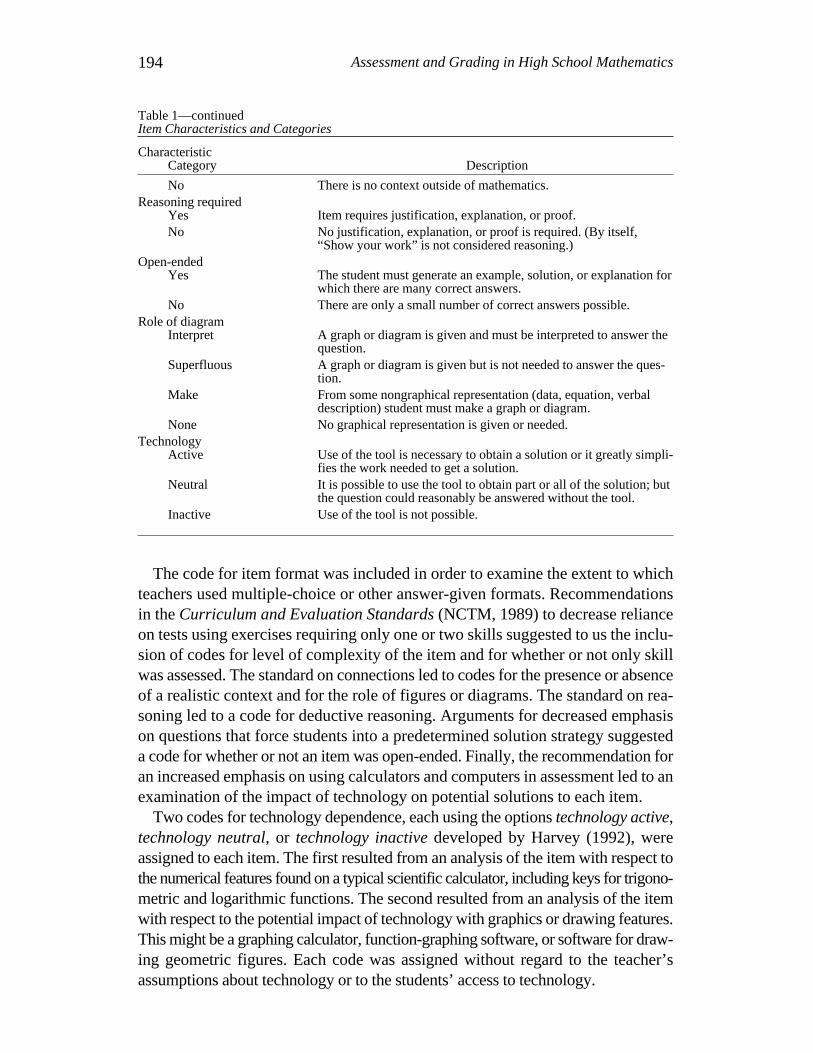
Table 1—continuedItem Characteristics and Categories
CharacteristicCategory Description
No There is no context outside of mathematics.Reasoning required
Yes Item requires justification, explanation, or proof.No No justification, explanation, or proof is required. (By itself,
“Show your work” is not considered reasoning.)Open-ended
Yes The student must generate an example, solution, or explanation forwhich there are many correct answers.
No There are only a small number of correct answers possible.Role of diagram
Interpret A graph or diagram is given and must be interpreted to answer the question.
Superfluous A graph or diagram is given but is not needed to answer the ques-tion.
Make From some nongraphical representation (data, equation, verbal description) student must make a graph or diagram.
None No graphical representation is given or needed.Technology
Active Use of the tool is necessary to obtain a solution or it greatly simpli-fies the work needed to get a solution.
Neutral It is possible to use the tool to obtain part or all of the solution; but the question could reasonably be answered without the tool.
Inactive Use of the tool is not possible.
The code for item format was included in order to examine the extent to whichteachers used multiple-choice or other answer-given formats. Recommendationsin the Curriculum and Evaluation Standards (NCTM, 1989) to decrease relianceon tests using exercises requiring only one or two skills suggested to us the inclu-sion of codes for level of complexity of the item and for whether or not only skillwas assessed. The standard on connections led to codes for the presence or absenceof a realistic context and for the role of figures or diagrams. The standard on rea-soning led to a code for deductive reasoning. Arguments for decreased emphasison questions that force students into a predetermined solution strategy suggesteda code for whether or not an item was open-ended. Finally, the recommendation foran increased emphasis on using calculators and computers in assessment led to anexamination of the impact of technology on potential solutions to each item.
Two codes for technology dependence, each using the options technology active,technology neutral, or technology inactive developed by Harvey (1992), wereassigned to each item. The first resulted from an analysis of the item with respect tothe numerical features found on a typical scientific calculator, including keys for trigono-metric and logarithmic functions. The second resulted from an analysis of the itemwith respect to the potential impact of technology with graphics or drawing features.This might be a graphing calculator, function-graphing software, or software for draw-ing geometric figures. Each code was assigned without regard to the teacher’sassumptions about technology or to the students’ access to technology.
194 Assessment and Grading in High School Mathematics

Most codes were independent of the course in which the item was given. However,coding for level was an exception. If an item required only one or two steps to solve,it was coded as low. If an item required more than two steps to solve and if it coveredcontent new to the course, it was coded as other. However, if an item was consideredto test a routine prerequisite for a particular course, it was coded as low, even thoughit might have required more than two steps to solve. For instance, a linear equation ofthe form ax + b = cx + d, requiring more than two steps to solve, would be coded otherin Algebra I but would be coded low in courses beyond Algebra I. Level is the onlycode that takes into account the course in which the item is being used.
Six items from the tests used by the teachers in the sample are given in Figure1. The codes assigned to each item are given in Table 2. Because none of these itemswas considered open, the category open is not listed in the table.
Figure 1. Sample test items, each from a different teacher
195S. L. Senk, C. E. Beckmann, and D. R. Thompson
2. If r (A) = B and r (C) = D, then which of the following is not justifiable?m ma. AC = BD b. m bisects BC c. r (B) = A d. m ⊥ AB e. All are justifiablem
3. Given: AD // BCE is the midpoint of AC
Prove ∆AED = ∆CEB~
A
D
C
B
E
4. The matrix below gives figures for paid circulation of several papers on 31 March 1986:
1. Gunther's corporation has a charity matching program. For every $20 Gunther gives to charity,
his corporation will give $25. If Gunther gives $400 to a charity for the homeless, how much willthe corporation give?
Paper Morning Sunday
Chicago Tribune 760,031 1,163,083
New York Times 1,035,426 1,625,649
Washington Post 781,371 1,091,307
Los Angeles Times 1,088,155 1,353,376
If each paper wanted to triple its paid circulation, what matrix describes the new circulation figures?
5. Simplify
6. Graph the function
2x 1− −
y
xy2
2 1
y x= −
+2 22
1cosπ
Tab
le 2
Cod
ing
for
Sam
ple
Item
s in
Fig
ure
1T
echn
olog
yIt
emC
ours
eFo
rmat
Skill
Lev
elR
ealis
ticR
easo
ning
Rol
e of
Scie
ntif
icG
raph
ing
cont
ext
requ
ired
diag
ram
calc
ulat
orca
lcul
ator
1A
lgeb
raA
nsw
er n
ot g
iven
No
Oth
erY
esN
oN
one
Neu
tral
Inac
tive
2G
eom
etry
Ans
wer
giv
enN
oO
ther
No
No
Non
eIn
activ
eN
eutr
al3
Geo
met
ryA
nsw
er n
ot g
iven
No
Oth
erN
oY
esIn
terp
ret
Inac
tive
Inac
tive
4A
lgeb
ra I
IA
nsw
er n
ot g
iven
No
Low
Yes
No
Non
eA
ctiv
eIn
activ
e5
Alg
ebra
II
Ans
wer
not
giv
enY
esL
owN
oN
oN
one
Inac
tive
Inac
tive
6Po
st-A
lgeb
raII
Ans
wer
not
giv
enN
oO
ther
No
No
Mak
eN
eutr
alA
ctiv
e

197S. L. Senk, C. E. Beckmann, and D. R. Thompson
Each item was coded independently and blindly by two researchers. The over-all mean percentage agreement on coding was 89%, with the following percentageagreements for each code: item format (88%), skill (82%), level (75%), context (98%),role of diagram (91%), reasoning (97%), open-ended (99%), scientific calculatortechnology (79%), and graphing/drawing technology (85%). When two ratersdisagreed, the third rater resolved the coding.
After each item on a test was coded, the percentage of items assigned each codewas calculated for the test. Then for all tests given by each teacher during the semes-ter, the mean percentages of items receiving each code were calculated.
Other assessment instruments. Other assessment instruments were categorizedby type—for instance, written report or computer laboratory experiment—on thebasis of the teacher’s self-report. The content of each instrument and a brief analy-sis of the extent to which it reflected recommendations in the NCTM Standards (1989)were also prepared. Because these instruments varied widely in style and substanceand because each had fewer questions than a typical test, the analysis was less detailedthan the analysis of the classroom tests.
Interviews. At the end of the school year each teacher was interviewed by oneof the researchers. Most interviews lasted from 30 to 60 minutes. Interviews wereaudiotaped and transcribed.6 Each researcher used the same script but was free tomodify it if modification seemed reasonable. Thus, although not all interviews touchedon exactly the same points, each provided additional information about the teacher’sassessment and grading goals and practices.
RESULTS
Instruments Used for Assessment and Grading
Although most recent reform documents separate assessment from grading, 11teachers (58%) graded all assessment tasks. The 8 teachers who said that they assessedsome work that was not graded gave as examples certain activities done in class usingcalculators or computers, or problems to be solved individually or in small groups.As Ms. K noted, “Kids don’t like to do things that aren’t graded.” Mr. Q explainedwhy some students might not be willing to do assignments that aren’t graded:
Our students are good “crap detectors.” They have terribly tight schedules. The kids Ihad were the most active in the school in terms of taking courses …. They were tak-ing physics or chemistry and so on. If I were a kid in their shoes, I would get a senseof what was really going to be graded, and what wasn’t, and put the thing that wasn’tgraded down low on the priorities. So I tend to have things that I grade, and if it is a require-ment, if it’s an assignment, it’s going to be graded.
Each teacher used a variety of assessment techniques. Table 3 lists the types ofassessment instruments used by each teacher during the first semester and the aver-age weight per semester given to each type of assessment.
6At Broadview High three teachers chose not to be taped, so only the notes taken by the researcherduring the interview were transcribed.

Tab
le 3
Per
cent
age
of G
rade
from
Var
ious
Typ
es o
f Ass
essm
ent I
nstr
umen
ts b
y T
each
er a
nd C
ours
e
Alg
ebra
IG
eom
etry
Alg
ebra
II
Post
–Alg
ebra
II
Inst
rum
ent
Ms.
Mr.
Ms.
Ms.
Ms.
Mr.
Ms.
Ms.
Ms.
Ms.
Ms.
Ms.
Mr.
Mr.
Mr.
Ms.
Mr.
Mr.
Mr.
AB
Ca
Db
EFa
GH
IJ
KL
aM
NO
PQ
RS
Tes
ts45
6072
5071
4560
2574
3235
4175
7639
6080
47
Qui
zzes
3525
1725
2923
2025
031
3138
08
3320
2027
Hom
ewor
k20
1510
203
2320
2526
1518
1525
89
50
20
Wri
tten
repo
rts
00
05
20
025
00
65
08
1615
00
Oth
er0
00
00
8c0
00
22d
8e0
00
3f0
07g
a Ms.
C, M
r. F
, and
Ms.
L r
epor
ted
perc
ents
that
did
not
sum
to 1
00%
. b Initi
al q
uest
ionn
aire
dat
a fo
r M
s. D
wer
e lo
st. A
sses
smen
t ins
trum
ents
and
inte
rvie
w r
evea
led
test
s,qu
izze
s, h
omew
ork,
and
wri
tten
repo
rts
wer
e us
ed to
det
erm
ine
stud
ents
’ gr
ades
. c Port
folio
s an
d pe
rson
al in
terv
iew
s. d O
ral r
epor
ts, n
oteb
ooks
and
cla
ss p
artic
ipat
ion.
e Ora
l rep
orts
and
inte
rvie
ws.
f Gro
up p
robl
em-s
olvi
ng a
ctiv
ities
. g Cla
ssw
ork
prob
lem
s.

199S. L. Senk, C. E. Beckmann, and D. R. Thompson
Every teacher gave tests, generally one at the end of each chapter in the text. Tenteachers also gave cumulative tests either at the end of the marking period or at the endof the semester. The mean number of tests given per teacher per semester was 6.8.
In all classes, performance on written tests or quizzes was the primary determi-nant of students’ grades, with these two types of assessment accounting forbetween 50% and 100% of a student’s grade. The mean weight given to tests andquizzes was 77%, about 6% higher than the weight given by the mathematics teach-ers in Grades 7–12 surveyed by Cooney (1992). Although every teacher relied heav-ily on tests and quizzes, there was considerable variability in the relative weight givento each type of instrument. The weight given to tests ranged from 25% to 80%, witha mean of 55%. Similar variety in grading practices was also noted by Cooney (1992).
For this study, homework was the third most important contributor to students’grades, with an average weight of 15%. Seven teachers relied exclusively on writ-ten tests, quizzes, and homework papers for determining grades. Twelve teachersfrom four of the five schools used some other form of assessment. Among the 12were 7 from Highpoint, where all teachers are required to give a grade in writing.
The other types of assessment used were written reports (n = 8), oral reports (n =2), interviews with students (n = 2), portfolios (n = 1), notebooks (n = 1), group prob-lem-solving (n = 1), classwork problems (n = 1), and class participation (n = 1). Forthe entire sample the mean weight given to these other forms of assessment was 7%.Among the 12 teachers who used something other than tests, quizzes, and homeworkto determine grades, the mean weight of other forms of assessment was 12%.
During the interviews 15 teachers were asked, “Of all the instruments you used toassess students’ performance during the year, which were the most informative to you,and why?” They answered as follows: tests (n = 5), writing assignments (n = 4), quizzes(n = 2), notebooks (n = 1), personal interviews (n = 1), and “it depends” (n = 2). Eightof the respondents had used at least one of written or oral reports, interviews, or port-folios during the year. Five of these eight teachers listed one of the newer forms of assess-ment as most informative. Below are some rationales for the teachers’ responses.
I think quizzes told me the most about how things were going on a day-to-day basisin the class. I think that the tests told me a lot about the student’s ability to capture largegroups of information and synthesize it …. But, I think daily homework tells me moreabout the kid’s willingness to participate. [Mr. M]
Quizzes were more limited because they focused on a smaller section of material ….I guess, the projects, I thought, were more interesting. They really helped me see a lit-tle bit where their interests lie. But I suppose the tests would tell me more about whatthey actually learned. [Ms. P]
The writing assignments are the ones that have given me a little bit different insightto what the student knows …. The writing assignments I’ve gotten have given me a muchbetter indication of who really understands the processes, because they can explain themto me. [Mr. O]
I’d have to say those personal interviews, hands down. I guess if you’re writing a test,you can just put the answer down … but when you’re talking to them, one-to-one, youknow whether they know what they are talking about or not. [Ms. G]

200 Assessment and Grading in High School Mathematics
Characteristics of Assessment Instruments
Tests. Table 4 summarizes the results of the coding of the test items. Itdescribes the extent to which the teachers’ test items reflect many of the changesrecommended in the Curriculum and Evaluation Standards (NCTM, 1989) andother reform documents.
The use of answer-given formats (e.g., true/false, multiple-choice, or matching)by teachers in the sample ranged from 3% to 42%, with a mean of 19%. No con-sistent pattern was found in the use of an answer-given format in terms of courseor text. However, the teachers who used answer-given formats most frequently onchapter tests also used such items on their end-of-quarter or semester exams.During the interviews the department head at Highpoint reported that often the end-of-term tests must be graded by the next day. This rapid turnaround time seemedto put pressure on teachers to use mostly multiple-choice items or items with shortnumerical responses that can be scored by people or machines in a very short time.
The emphasis on skill also varied considerably across teachers’ tests. The percentageof items coded as skill ranged from 4% to 80%, with a mean of 36%. In general, geom-etry teachers had fewer skill items on their tests than teachers of other subjects.
Most items on the tests were low level. That is, most questions either tested newcontent that could be answered in one or two steps or tested prerequisite knowledge.The percentage of low-level items on teachers’ tests ranged from 53% to 90%, witha mean of 68%. The percentage of low-level items was rather consistent across courses.
One of the most consistent recommendations for reform in mathematics educationhas been to put mathematics in context, that is, to relate mathematics to the world in whichthe student lives. The results in Table 4 show that there was a great deal of variety inthe extent to which teachers’ tests reflected this recommendation. The percentage of testitems with realistic contexts ranged from 0% to 41%, with a mean of 17%. In eight classesthe percent of questions set in a context exceeded 20%. In contrast, in five classes nomore than 5% of the test items throughout the semester were set in any context.
In general, the use of realistic contexts appears to be related to two factors: thetext used and the course content. Those teachers who gave test questions set in real-istic contexts most frequently were those whose textbooks supported this recom-mendation. Specifically, each of the teachers in the 10 classes with the highest percentageof test items set in realistic contexts used a textbook noted for emphasizing appli-cations of mathematics. Overall, the percentage of items set in a realistic contextwas lower in geometry than in other mathematics classes.
There is very little evidence that the test items required students to use reasoning.The percentage of items involving reasoning ranged from 0% (four teachers) to 15%,with a mean of 5%. The three teachers with the highest percentage of items requiringexplanations, justifications, or proofs taught geometry, the school mathematics coursethat traditionally has emphasized proof-writing. Some evidence of reasoning was alsofound in the post–Algebra II courses taught by Mr. O, Ms. P, and Mr. Q. The reasoningitems on their tests involved such items as explaining why a function is or is not even,proving trigonometric identities, or justifying number-theoretic arguments. Therewas virtually no evidence of reasoning being assessed on tests in Algebra I or II classes.

Tab
le 4
Per
cent
age
of F
irst
Sem
este
r T
est I
tem
s pe
r C
hara
cter
isti
c by
Tea
cher
Alg
ebra
IG
eom
etry
Alg
ebra
II
Post
–Alg
ebra
II
Cha
ract
eris
ticM
s.M
r.M
s.M
s.M
s.M
r.M
s.M
s.M
s.M
s.M
s.M
s.M
r.M
r.M
r.M
s.M
r.M
r.M
r.A
BC
DE
FG
HI
JK
LM
NO
PQ
RS
Item
for
mat
Ans
wer
giv
en11
1022
136
3231
1042
3026
4028
411
332
34
Skill
Yes
5036
3348
8023
1515
418
3028
3480
2831
3143
59
Lev
elL
ow78
6879
6979
9080
5355
7360
5760
7563
7056
6661
Rea
listic
con
text
Yes
2832
3312
59
1111
10
2422
234
3841
1616
2
Rea
soni
ng r
equi
red
Yes
01
00
14
812
1315
12
10
68
82
3
Ope
n-en
ded
Yes
01
12
01
510
00
01
20
27
30
0
Rol
e of
dia
gram
Inte
rpre
t12
1719
01
4436
4751
6715
2111
123
914
156
Supe
rflu
ous
151
10
07
110
14
11
10
104
21
1M
ake
85
53
37
1419
20
149
128
53
312
6
Num
ber
ofte
sts
code
d6
65
56
87
610
86
85
88
67
77

202 Assessment and Grading in High School Mathematics
Virtually no teachers used open-ended items on tests. The percentage of open-endeditems on tests ranged from 0% to 10%, with a mean of 2%. Occasionally, Ms. H, ageometry teacher, and Ms. P, a teacher of a post–Algebra II course, asked open-endedquestions. Often they were relatively simple items asking students to draw exam-ples of certain figures or to give examples of certain types of statements or data sets.
The standard on connections (NCTM, 1989) calls for emphasis on different butequivalent representations of concepts and procedures and for translation amongdifferent representations. Table 4 contains information about the extent to whichteachers in the sample used graphical representations on their tests. Again, there waswide variation among the classes. The percentage of items in which students hadto interpret a diagram given in the question ranged from 0% to 67%, with a meanof 22%. The percentage of items in which a superfluous diagram was given rangedfrom 0% to 15%, with a mean of 3%. The percentage of items in which studentshad to make a graph or figure ranged from 0% to 19%, with a mean of 7%.
Visual representation, particularly interpretation of diagrams, was more evidentin geometry than in other courses. However, in all five geometry classes these weregenerally low-level questions involving the identification of parts of figures. Thetests given by Ms. G and Ms. H required students to make graphs or draw figuresmore frequently than did the tests given by the other three geometry teachers. Ingeneral, these were items asking students to use a protractor to draw angles or touse a ruler and compass to construct certain geometric figures.
Among the 14 Algebra I, Algebra II, and post–Algebra II teachers, 4 (Ms. D, Ms.E, Mr. N, and Mr. S) seldom asked their students to interpret or to draw a graph ordiagram. Again the influence of the textbook was strong. These teachers all usedtexts in which visual representation played a very small role, or in which most useof graphs occured in the second half of the texts. In contrast, in those classes in whichdrawing or interpreting graphs was tested more frequently, the textbooks empha-sized visual representation.
The extent to which each item depended on technology is given in Table 5. Ingeneral, the use of technology-active items on tests was low. With respect to thefeatures of scientific calculators, the percentage of calculator-active items rangedfrom 0% (seven teachers) to 40%, with a mean of 8%. Only four teachers gave testswith more than 15% calculator-active items. All four taught at the post–Algebra IIlevel. In the geometry classes most items were calculator-inactive. In the other classesmost items were neutral as related to scientific calculators.
The demand for technology on test items was strongly influenced by content. Itemsinvolving trigonometry, logarithms, very large or very small exponents, and statisticalcalculations were often technology-active. Mr. R and Mr. S, the two teacherswhose tests contained the most calculator-active items, taught courses that were almostentirely devoted to trigonometry during the first semester. The classes taught by Mr.O and Ms. P, who were the next most likely to use calculator-active items, includeda substantial amount of statistics during the first semester.
Test items that actively encouraged the use of graphing or drawing technologywere even less common than those that encouraged the use of scientific calculators.

Tab
le 5
Per
cent
age
of F
irst
Sem
este
r T
est I
tem
s D
epen
dent
on
Tec
hnol
ogy
by T
each
er
Alg
ebra
IG
eom
etry
Alg
ebra
II
Post
–Alg
ebra
II
Cha
ract
eris
ticM
s.M
r.M
s.M
s.M
s.M
r.M
s.M
s.M
s.
Ms.
Ms.
Ms.
Mr.
Mr.
Mr.
Ms.
Mr.
Mr.
Mr.
AB
CD
EF
GH
IJ
KL
MN
OP
QR
S
Scie
ntif
ic c
alcu
lato
rA
ctiv
e6
78
02
00
00
02
42
017
245
4031
Neu
tral
5453
5880
5728
1613
3537
5956
5472
4238
4234
45In
activ
e39
4034
2042
7284
8765
6339
4144
2841
3953
2724
Gra
phin
g te
chno
logy
Act
ive
00
01
00
00
00
48
11
716
88
8N
eutr
al1
01
210
513
13
018
1817
1921
1420
2613
Inac
tive
9910
099
7810
095
8799
9710
078
7482
8072
7071
6779
Num
ber
ofte
sts
code
d6
65
56
87
610
86
85
88
67
77

204 Assessment and Grading in High School Mathematics
The percentage of graphing or drawing technology-active items ranged from 0%(nine teachers) to 16%, with a mean of 3%. Only one teacher (Ms. P) gave tests withmore than 15% graphing technology-active items. Another five teachers gavegraphing technology-active items either 7% or 8% of the time. They were the otherfour post–Algebra II teachers, and Ms. L, an Algebra II teacher. The rest of the sam-ple virtually never used items to take advantage of graphing or drawing features,with the mean percentage of such technology-inactive items being 86%.
Other assessment instruments. Eight teachers described or submitted copies of a totalof 30 assessment instruments other than tests or quizzes that were used to determinestudents’ grades during the semester. Five teachers supplied only 1 or 2 assignmentseach. Three teachers described or provided at least 3 such other assessment instruments.
Ms. E, an Algebra I teacher, gave six writing assignments during the first semester.Each included the objective, a description of the task to be accomplished, a sample solu-tion to a similar assignment, and the criteria to be used for grading the work. Each writ-ing assignment was to be one page and to be done by an individual. Assignments includedcomparing and contrasting an expression and an equation, making up and solving wordproblems, and explaining in detail how to solve a given linear inequality.
Mr. M, an Algebra II teacher, gave seven alternate assessment tasks: two writingassignments, two group quizzes, and three other group activities. These included deter-mining the weight of a box by using a calibrated seesaw, finding equations tomodel given data sets, and searching for Fibonacci numbers on a pineapple.
Ms. P, a post–Algebra II teacher, assigned seven nontraditional tasks: one writ-ten project in each of the three marking periods, which were to be chosen from thosein the textbook or from projects she created; a 5-minute oral presentation to the classabout one of the projects; two group problem-solving assignments; and one otherassignment involving analysis of tables or graphs from a newspaper. The projectsavailable to students included simulating a capture-recapture experiment, determininga model for the relation between neck and wrist sizes of students in the class, andexploring the locus of vertices of parabolas with equations of the form y = ax2 + bx+ c, where a and b are constant and c varies.
In general, each of the instruments identified by the eight teachers as other than atest, quiz, or homework paper covered a single concept or situation. Overall, these tasksasked higher-level questions than those asked on the tests. Several projects involvedusing physical materials. Although most tasks were highly structured, several providedopportunities for students to choose options, and several were somewhat open-ended.
Factors Influencing Assessment
The results reported above indicate numerous ways in which the subject matterand the textbook influenced the nature of the items on the teachers’ tests. A moredetailed look at technology and some other factors influencing teachers’ assessmentand grading practices is presented below.
Technology. Of the 18 teachers who described the frequency and nature of theiruse of calculators or computers in the target class, 12 (67%) said their students used
205S. L. Senk, C. E. Beckmann, and D. R. Thompson
calculators extensively or virtually every day, and 5 (28%) said calculators wereused whenever needed. Overall, the geometry teachers seemed to report using cal-culators less frequently than teachers of other courses. Seven teachers (39%), dis-tributed among all four course levels, said they used computers during the first markingperiod. For three of the seven, computer use was limited to demonstrations. In everycase teachers reported using computers far less frequently than calculators, with com-puter use ranging from once during the marking period to once every 2 weeks. Theseresults are consistent with the use of technology in Algebra I classes reported byGaret and Mills (1995).
Every teacher permitted students to use calculators during tests. Generally,when graphing calculators were available for instruction, they were also availablefor tests. Only one teacher mentioned using computers for testing. Nine teachersgave specific examples of how technology was used in assessment. The commentsbelow are representative.
We used calculators in class every day, for computation, for attempting to find solu-tions by trial and error, and for verifying solutions …. Students have not been gradedspecifically on their use of technology. [Ms. E]
Calculators are used daily for computations. Two computer activities using Geo-Explorerwere done in Chapter 4 …. Students were permitted to use an automatic drawing pro-gram on homework assignments. A few students used the computer to answer test ques-tions, but most did not, because of the time needed to get a hard copy. We have onlyone printer. [Ms. H]
Once or twice a week we used graphing calculators for linear relations and scatterplots—getting used to setting range, etc. (i.e., changing viewing window and zooming).We used the computer to illustrate any BASIC programs that were shown in the text,for example, for recursion and explicit formulas. [Ms. L]
During the interview at the end of the school year, teachers were asked, “Howhas the students’ access to technology influenced your assessment?” Of the 12 teach-ers who responded to this question, only Ms. K suggested that technology had notchanged her assessment practices. By this she seemed to mean that she used the text-book’s published tests and hence was not creating any assessment instruments. Sheclaimed that “all tests were geared for technology already.”
All other teachers stated that students’ access to technology had influencedassessment, and in many cases their responses to this question were very detailed.Teachers of all subjects pointed out that technology allowed them to deal with sit-uations that would have involved tedious calculations if no technology had beenavailable. They explained that “not-so-nice,” “nasty,” or “awkward” numbersarise from the need to find the slope of a line, the volume of a silo, the future valueof an investment, or the 10th roots of a complex number. Additionally, someteachers of Algebra II or post–Algebra II classes noted how technology influencedthem to ask new types of questions, how it influenced the production of assessmentinstruments, and how it raised questions about the accuracy of results.
I think you have to ask different kinds of things …. When we did trigonometry, youjust can’t ask them to graph y = 2 sin x or something like that. Because their calcula-tor can do that for them … I do a lot of going the other way around. I do the graph, and

206 Assessment and Grading in High School Mathematics
they write the equation …. The thing I think of most that has changed is just the topicof trigonometry in general. It’s a lot more application type things … given some situ-ation, an application that would be modeled by a trigonometric equation or somethinglike that. [Ms. P]
I use it [the computer] to create the papers, and I can do more things with it … notjust hand-sketched things. I can pull in a nice polynomial graph from Mathematica, putit on the page, and ask them questions about it. So, in that way, it’s had a dramatic effecton me personally …. We did talk about problems with technology. Sometimes itdoesn’t tell you the whole story. And sometimes it fails to show you the right graph.If you do the tangent graph on the TI-81, you see the asymptotes first. You know, that’sreally an error. It’s not the asymptote. [Mr. M]
Textbook publishers’ tests. Twice during the year teachers were asked to identifythe sources they used to make up tests and other assessment instruments. Eleven teach-ers responded to these items. Six teachers said that their main source for the first testof the third marking period was a test provided as an ancillary by the publisher oftheir text. Five teachers listed themselves as the principal source of the test items,but they each consulted a published test in writing their questions. Eight of the 11teachers relied only on the publisher’s or their own ideas for testing. The other 3 alsoconsulted colleagues or other commercially available materials when creating tests.
Teachers reported that they planned to use more varied sources in making up thefinal exam than they had used in making up the first test of the third marking period.Nine teachers expected to use at least two sources. Six teachers expected the pub-lisher’s ancillary materials to be their main source, one planned to use other com-mercially available materials, two expected to rely primarily on colleagues, one plannedto write the test himself, and one teacher planned to use last year’s final exam.
Some tests had a copyright notice from the textbook publisher, indicating the sourceof that particular instrument. Seven teachers regularly used tests provided by thepublishers without making any changes; three teachers volunteered that they reg-ularly modified published tests, and nine generally made up their own tests.Teachers who regularly used published tests gave reasons such as the following:
Convenience. This is the first time through the book. [Ms. K]
The tests in the ancillaries give us an advantage of keeping us honest and matching thefour dimensions of learning that are reflected in the students’ review and the students’ self-test …. I found the ancillaries a necessary resource because I could not have written a testfrom scratch. I could have in previous years in a more traditional course. [Mr. Q]
When asked if the tests provided by the publisher had been used in the past, mostteachers said “no,” saying that in the past either they did not have copies of pub-lisher’s test or that when they did, the tests weren’t nearly as well written.
Teachers who either modified the tests published for their textbook or whomade up their own tests gave the following rationales and methods:
Basically I go through and use the homework problems the kids have and from themtake problems similar to that [and] use them as the basis of the test …. If it’s a prob-lem that tends to be one we’ve spent a lot of time with, then I’ll make sure that I placeit on the test someplace, too. Give them new numbers; change them around. [Mr. F]
When I make up a test I mostly make it up from the problems that were on the assign-ments, and I try to put … the majority of the problems are problems that every student

207S. L. Senk, C. E. Beckmann, and D. R. Thompson
should be able to answer. And then I try to always put maybe a small percentage of prob-lems that would be for the better students. And I usually include bonus problems fromthe more difficult sections that we covered. [Ms. J]
I usually look through the sections we’ve done and they have done all the odd prob-lems, which they have all the answers for. And I have done some of the even ones inclass, but quite often I’ll take some of the even ones, either the same problem or a prob-lem similar to those and just create my own …. And looking at each section, if there’slike, I think five or six sections in the chapter, I try to get an equal number from eachsection … being careful to word the directions almost exactly as the book did so they’llbe familiar with the terminology and not questioning what do I mean. [Mr. S]
Standardized tests. During the interview teachers were asked about the extent towhich they take into account what students might be asked on standardized examssuch as the SAT, the American College Testing (ACT) program, or state proficiencyexams when they write their own test questions.7 Of the 15 teachers who respondedto this question, 12 reported little or no influence of standardized tests on their teach-ing or testing.
The only teachers who claimed that standardized tests were a very important influ-ence on their classes were three geometry teachers. However, when asked how theseexams influenced either the content taught or the form of questions asked in theircourses, these teachers generally cited relatively minor adjustments.
I don’t think I change my questions particularly. But I try to make sure I teach the thingsthat, you know, the Pythagorean Theorem, the basic things. I always say, you know, “Ifyou’ve taken high school geometry they’re expecting you to know this.” [Ms. G]
Basically, I would say … the questions are traditional, asked in a traditional way ….We’ve introduced some … comparison questions: “A, if it’s greater than …; B, if it’sless.” However those are. So, we’ve put some of those on our tests. [Ms. I]
Probably not a lot. I teach what’s in the book. It’s just that when I run across things thatI know are typical SAT question types, I do concentrate on them or at least zero in on them.A lot of times I’ll say to the kids, “Now this is a typical SAT problem.” [Ms. J]
Other factors . During the interviews several additional factors that might influ-ence teachers’ assessment and grading practices were explored. Two seemed to havestrong impact: (a) teachers’ knowledge and beliefs about assessment, and (b) thetime teachers need to create and grade various forms of assessment.
Knowledge and beliefs about assessment. Ten teachers had studied assessmenttechniques in a course, workshop, or conference. Seven reported having receivedtraining directly about assessment, either through college courses or in conferencesor workshops organized by their school or district, the Woodrow Wilson Institute,UCSMP, or local, state, or national professional organizations. Two of theseseven teachers and three others had received some information about assessmentindirectly, for instance, in workshops about uses of graphing calculators or coop-erative learning.
7Each school was required to give a high school proficiency exam. In one state it determined whethera high school diploma could be awarded; in the other states it did not affect graduation.

208 Assessment and Grading in High School Mathematics
Virtually all the teachers said they were familiar with the curriculum standards,but only three teachers said they were familiar with the assessment standards. Regardlessof their familiarity with the evaluation standards, when shown a list of aspects ofassessment that might receive either increased attention or decreased attention (NCTM,1989, p. 191), every teacher said that he or she supported the recommendations.
Because of time constraints in the interviews, only seven teachers were asked todescribe the extent to which their own assessment practices in the target class wereconsistent with these recommendations. All but one teacher expressed someprogress toward implementing recommendations for changes in assessment. Thefollowing comments illustrate the range of responses:
Well, as opposed to what one would like to have, probably not all that good. Let’ssee what they want increased [emphasis] on …. for example, “using multiple assess-ment techniques, including written, oral, and demonstration formats.” We don’t do muchof that. We have a problem with both the Algebra II and Geometry. You’re fighting theclock every day of the year just to cover the amount of material that we’re required to,which means that a lot of these things you really have difficulty working in, unless they’regoing to be outside of the classroom situations. [Mr. N]
I think overall, I try to do all these things. But I don’t think I do enough of them. Like,I agree that you should use multiple assessment techniques. I think I don’t do that enough.[Ms. A]
Very. We use calculators every day. The computer is used for demonstration purposes.The whole book is with problem situations. I use multiple assessment techniques. But Iused standardized tests too much. Maybe I need more variety. [Ms. L]
Virtually every teacher said that he or she would be interested in attending a work-shop or course on assessment if one were offered. Learning about different typesof assessment beyond tests was the topic in which teachers most frequently (n = 9)expressed an interest. Those who seldom or never used anything but tests, quizzes,or homework were interested in learning how to use other forms of assessment, andthose who had been using written projects wanted ideas about interpreting their stu-dents’ work. The topic with the second highest degree of interest was the relationbetween assessment and grading. One teacher wanted to know how to gradeassignments more fairly; another wanted to learn how to weight tests, quizzes, andhomework to assess students fairly. The use of calculators, computers, and manip-ulatives in assessment was also of interest to this sample. Many teachers requestedspecific examples of classroom-tested assignments and detailed instructions on howto implement the ideas in their classrooms.
When I see what other people do and the samples of other kids’ work,… it gives medifferent expectations. In my own limited way I have a vision of what I think writingis, but there may be all kinds of creative things out there that I don’t know about, andif I saw them, they’d be my ideas too then. [Mr. M]
Make it age-level appropriate, content appropriate, and look at alternatives, plus thepsychology of how to get students to do the things that they’re not necessarily goingto get a grade for. [Mr. B]
In addition to their own lack of knowledge of new assessment techniques, sev-eral teachers explained how students’ backgrounds and attitudes influenced the teacher’sability to implement some assessment techniques.

209S. L. Senk, C. E. Beckmann, and D. R. Thompson
If you have better students who are self-motivated, you can have them working onthings outside of class, special research projects, and computer work, and so on, I thinkthat would be great. But we don’t have that here. I’ll tell you frankly, we have difficultygetting our kids to do anything out of the classroom. [Mr. N]
This first one, “assessing what students know and how they think about mathematics.”It’s difficult for us in high school with juniors and seniors, and 15-, 16-, 17-year-olds. It’shard for them to talk mathematics because it’s not cool …. You would like them to standup and explain the problem or tell me everything you know about it, but it’s not, that’s notthe socially acceptable thing to do, you know, you’re weird. It’s wonderful theory, but it’sjust, it’s not the “in” thing to do, and I don’t think we’re overcoming that. [Mr. S]
Time. At the end of the year teachers were asked about the time required to makeup and grade each of the various types of assessment instruments they used. Most ofthe 16 teachers responding to these questions answered with an interval. For instance,to make up the last test given before the interview, the minimum amount of time neededwas 20–40 minutes [Mr. S], and the maximum amount of time was 3–4 hours [Mr.F]. The mean interval of time spent making up the last test was 1 hour and 20 min-utes to 1 hour and 43 minutes, for an average of 1 hour and 31 minutes. The time esti-mated to grade these tests for one section of the course ranged from 40 minutes [Mr.R] to 6–8 hours [Ms. P]. The mean time spent grading the last test was 1 hour and 28minutes per class. These results were almost identical to the data for a “typical test,”where the mean time reported to make it up was 1 hour and 19 minutes and to gradeit was 1 hour and 25 minutes. The mean time spent making up a typical quiz was 36minutes, and the mean time spent grading such a quiz was 28 minutes per class.
For the five teachers who reported specific estimates of the time needed tomake up assessment tasks such as oral or written projects or computer laboratoryassignments, the mean was 2 hours and 9 minutes. The mean time for grading suchassignments was 3 hours and 50 minutes per class. Two other teachers reported spend-ing “several hours” or “a couple of hours” per class grading such assignments. Thus,newer forms of assessment generally took, on average, twice as much time to pre-pare and twice as much time to grade as chapter tests.
DISCUSSION
Because the schools selected for this study had access to textbooks consistent withmany recent recommendations for reform, to state-of-the-art calculator and com-puter technology, and to above-average opportunities for professional development,the sample has a positive bias. That is, the picture painted by this article is proba-bly more optimistic than that of the entire set of high school classes in the UnitedStates. Even though the sample is somewhat selective, we believe the data suggesttrends and issues that may apply to many other high schools. We discuss these trendsand issues here to stimulate future research and development and to offer guidanceto reform efforts currently underway.
Tests Versus Other Forms of Assessment
New forms of classroom assessment. The Assessment Standards for SchoolMathematics calls for “a shift toward using multiple and complex assessment

210 Assessment and Grading in High School Mathematics
tasks, projects, writing assignments, oral demonstrations, and portfolios, and awayfrom sole reliance on answers to brief questions on quizzes and tests” (NCTM, 1995,p. 29). Among our relatively reform-minded sample, this shift had begun to occurin about two-thirds of the classes.
Why are newer forms of assessment used in some classes and not in others? Twofactors appear to be critical: (a) teachers’ knowledge and beliefs, and (b) theinstructional materials available to teachers. Thus we suggest that future researchinvestigate effective models for preservice and in-service education to help teach-ers address issues in assessment and that future curriculum development efforts includethe creation of assessment tasks. In particular, teachers need examples of worth-while assessment tasks geared to specific courses they are teaching, rather than exam-ples that are meant to assess more general levels of mathematical performance.
Teachers are also eager for training in reliable and easy-to-use methods for inter-preting and reporting students’ work on complex tasks and for ideas on how to imple-ment new assessment techniques in their classrooms. Because some teachers lackconfidence in their own writing ability or in their ability to comment fairly and con-structively on student writing, we suggest that preservice and in-service work in assess-ment deal with affective, as well as cognitive, issues related to assessmenttechniques. Researchers can help identify the major benefits—be they cognitive,affective, or practical—of various alternative assessments.
Classroom tests. The generally low level of test questions, the paucity of ques-tions set in realistic contexts or of those asking students to justify a conclusion, andthe apparent lack of impact of technology on the types of test items teachers use sug-gest that assessment on chapter tests often does not “reflect the mathematics thatall students need to know and be able to do” (NCTM, 1995, p. 11).
Initially, we were dismayed by the large number of test items that emphasizedlow-level thinking and fairly simple responses. However, given that chapter testsmust often address a dozen or more objectives and that they must often be admin-istered in 40- to 50-minute periods, teachers’ methods of selecting and creating testitems are both rational and consistent with traditional methods of test design.
Furthermore, one can argue that there should be some questions that can be answeredwith one or two steps. Such items give students a chance to be successful and to demon-strate some knowledge, even if they might run into roadblocks when doing amore complex task. Short-answer questions also potentially make it easier for a teacherto decide which objectives have yet to be mastered, so that appropriate remedia-tion can be determined. On complex tasks, when students have difficulty, it is some-times difficult to decide where the student has gone wrong.
Additionally, our coding of test items does not describe the content or the varietyof the mathematics that was being tested. In some cases, teachers whose tests con-sisted of mostly low-level items almost exclusively tested skills, such as factoring poly-nomials, that are considered to be of limited value (Usiskin, 1980/1995). In other cases,even though teachers consistently gave tests with mostly low-level items, there wasconsiderable variety in the questions. For instance, some items were set in realisticcontexts; some required graphical representation; some were technology-active;

211S. L. Senk, C. E. Beckmann, and D. R. Thompson
and in some the mathematics being tested involved new content, such as interpretinga boxplot or describing the effects of a scale change on a figure. We argue that the twotypes of tests are different in ways not detected by our analysis and that the latter testsdo show a shift in the directions outlined in NCTM’s Standards (1989, 1995). Thus,in this respect also, we believe that the state of assessment, at least in those high schoolsusing more innovative curricula, is a little rosier than our research might indicate.
Initially, we were also surprised by how teachers’ perceptions of the impact oftechnology on assessment were much greater than their use of technology onclassroom tests would indicate. There are several possible explanations for this phe-nomenon. First, having made major changes in their instructional practice, teach-ers may have simply assumed, incorrectly, that these changes resulted in major changesin their assessment practices. Second, it is possible that a few years before we con-ducted our research, no items on tests were technology-active and that the changefrom 0% to 5%, 10%, or 20% technology-active was considered a big change. Third,the teachers may have thought that the technological demands of some test itemswere higher than we thought. Clearly, classroom teachers, researchers, and test devel-opers could all benefit from further discussion of how to recognize and write worth-while technology-active test items or other tasks.
In recent years many curriculum projects have incorporated new content into thesecondary school mathematics curriculum, put mathematics in context, and workedto connect graphical and symbolic representation in instructional materials. Thereis some evidence of these features being incorporated into published tests and intoteacher-made tests. However, greater efforts need to be made to incorporate morereasoning and multistep problem-solving, as well as more substantive use of bothnumerical and graphical technology on tests.
Recent work (de Lange, 1993; Thompson, Beckmann, & Senk, 1997; van den Huevel-Panhuizen & Gravemeijer, 1993) provides some guidance on ways to think aboutimproving classroom tests. Perhaps a checklist based on the coding schemereported in this paper could also help both teachers and professional test develop-ers analyze the characteristics of tests and make them aware of the tests’ strengthsor weaknesses.
Research reported by Garet and Mills (1995) suggests that teachers’ emphasis onshort-answer classroom tests will continue to be strong in the immediate future. Hence,improving classroom tests may be the surest way to improve the quality of assess-ment in high school mathematics.
Balancing tests and other forms of assessment. Even when newer forms ofassessment are used, why are they used so seldom? Why is so little weight givento forms of assessment that many teachers report to be quite valuable? We suggestseveral explanations.
First, as mentioned above, teachers’ limited knowledge of alternate assessmenttechniques, and their lack of confidence in their ability to apply those techniques,is a clear deterrent to their using newer forms of assessment as often as more famil-iar chapter tests.
Second, time is a factor. Newer forms of assessment take about twice as muchtime to create and twice as long to score as textbook-supplied classroom tests. When

212 Assessment and Grading in High School Mathematics
time is limited, people will use ready-made instruments or instruments that are quickand easy to create.
Third, although there has been much written about the general characteristics ofgood assessment practices or examples of new forms of assessment (e.g., NCTM,1995; Stenmark, 1989, 1991), there has been little professional guidance about howto balance older and newer forms of assessment. Thus, teachers are left to decidefor themselves how to weight tests, quizzes, homework, and newer forms ofassessment. Without the support of a professional dialogue to respond to concernsof students, parents, and administrators about new kinds of assessment, teachers arelikely to be conservative in their first attempts.
Fourth, even with support, very few people can make sweeping changes intheir behavior in one year. As Leinwand suggests, a change of about 10% per yearin a teacher’s classroom practices probably is “large enough to represent real andsignificant change, but small enough to be manageable” (1994, p. 393). In manycases our research involved teachers who were using new forms of assessment forthe first or second time. When viewed from Leinwand’s perspective, our findingsare actually not that discouraging.
Last, even among teachers who have used written projects, oral demonstrations,or other newer forms of assessment, there appears to be no clear consensus as towhich is the most useful kind of assessment tool.
Clearly, no one can or should prescribe an exact mix of how to balance older andnewer forms of assessment. We contend that, when aligned with a rich curriculumand when sensitive to the other general characteristics outlined in the AssessmentStandards for School Mathematics (NCTM, 1995), tests and quizzes, like writingassignments, oral demonstrations, journals, and interviews, can each provide valu-able information to teachers. It is time for public discussion and systematic researchon possible mixes of assessment strategies that might be implemented in typical class-rooms. Case studies describing the circumstances under which newer forms of assess-ment can play a larger role than they currently do would be particularly welcome.
Assessment versus Grading
Despite attempts in recent literature to distinguish between assessment andgrading, many teachers tend to equate the two. That is, many teachers assigngrades to virtually every assessment task except for daily homework assignments,and when asked about their assessment practices, they refer to tests, quizzes, andother graded assignments. One explanation for this phenomenon is that teachers donot understand the distinction between assessment and grading. To the extent thatthis is true, greater attention to defining terms such as assessment, evaluation, andgrading, as is done in the Assessment Standards for School Mathematics (NCTM,1995) will help clarify communication.
A second explanation, and one that we expect is true of most teachers, is that althoughteachers understand the distinction between assessment and grading, the system inwhich they work does not easily allow them to ignore grading. Virtually every highschool teacher in the country has to give grades, whether letters or numbers, and

213S. L. Senk, C. E. Beckmann, and D. R. Thompson
colleges have come to expect them. As Wilson points out, “what gets graded is whatgets valued” (1994, p. 412).
Teachers who are in the process of making the types of shifts in assessment prac-tices advocated by the profession need guidance on how to aggregate results of stu-dents’ performance on these new tasks and on how to report summary commentsto students, parents, employers, and colleges. Because teachers need such guidanceas soon as they begin to try new forms of assessment, research on issues of aggre-gation and reporting of high school students’ performance on complex mathematicaltasks is a critical and immediate need. In the meantime, grading should come outof the shadows and onto the center stage of the discussion on how to improve thequality of assessment in schools.
Some Other Issues
The fact that the high school mathematics teachers in this sample rarely consideredstandardized tests when developing assessment instruments confirms the findingsof Stiggins and Conklin (1992). Apparently, except for geometry teachers, high schoolteachers do not feel pressured by external tests in the same way that elementary andmiddle school teachers often do. Thus, although we encourage further research andpolicy statements regarding the improvement of standardized tests, we believe thatthe bulk of the effort to improve assessment in high school should be focused at theassessment taking place in classrooms.
We hypothesize that geometry teachers may be more concerned than othermathematics teachers about standardized tests because, until recently, geometry oftenhas been taught in only one course. As a result, geometry teachers often cannot expectstudents to know much geometry when they begin the course, and they cannot counton much follow-up after students leave their course. Hence, they are unique in feel-ing solely responsible for a body of content.
The enormous variability among courses suggests that much information aboutteachers’ practices is masked by collapsing and aggregating survey results. In fact,different strategies for changing assessment practices may be necessary at differ-ent grade levels or in different courses. For instance, whereas geometry teachersappear to need to consider ways to assess reasoning via something other than for-mal proofs, Algebra II teachers need to consider how to assess reasoning in any form.Whereas Algebra I, Algebra II, and post–Algebra II teachers all need to considerthe impact of graphing technology on their courses, the appropriate balancebetween paper-and-pencil graphing and graphing with technology is likely to be dif-ferent for beginning algebra students than for more advanced students. Thus, wesuggest that future research on assessment not only be sensitive to potential differencesin issues at various school levels and in various courses, but that the manner of report-ing research results portray as much as possible the diversity among teachers, courses,and schools.
The teachers in this sample were more professionally active than average and spokethoughtfully on many subjects. They realized that creating worthwhile assessmenttasks is a time-consuming and difficult enterprise. When they are dealing with changes
214 Assessment and Grading in High School Mathematics
in curriculum and instruction, it is often difficult for them to find time to make changesin assessment. Our research suggests that teachers use published assessment mate-rials either because they think the quality of those materials is higher than those theycan create themselves, or because they think they can get the same quality in lesstime. Thus, teachers’ use of published materials is not simply a matter of blind trust.
The Assessment Standards for School Mathematics (NCTM, 1995) provides gen-eral criteria for judging the quality of an assessment program, instrument, or task.Such standards are helpful in thinking about assessment programs at the national,state, and district levels. However, the assessment that affects the daily instructionof millions of students occurs in the classroom and is directed by the classroom teacher.The research reported here suggests that assessment issues in high school are dif-ferent from those in elementary or middle school, and that assessment issues aredifferent across high school courses. We suggest that further research, teacher edu-cation, and materials development related to assessment be directed more towardthe classroom than they have been thus far.
REFERENCES
Collis, K. F., & Romberg, T. (1989). Assessment of mathematical performance: An analysis of open-ended items. Madison, WI: Wisconsin Center for Education Research.
Cooney, T. (1992). A survey of secondary teachers’ evaluation practices in the State of Georgia. Unpublishedmanuscript, College of Education, University of Georgia, Athens.
de Lange, J. (1993). Assessment in problem-oriented curricula. In N. Webb & A. F. Coxford (Eds.),Assessment in the mathematics classroom (pp. 197–208). Reston, VA: National Council of Teachersof Mathematics.
Foerster, P. A. (1986). Precalculus with trigonometry. Reading, MA: Addison-Wesley.Garet, M. S., & Mills, V. L. (1995). Changes in teaching practices: The effects of the Curriculum and
Evaluation Standards. Mathematics Teacher, 88, 380–389.Hancock, L., & Kilpatrick, J. (1993). Effects of mandated testing on instruction. In Mathematical Sciences
Education Board, Measuring what counts: A conceptual guide for mathematics assessment (pp. 149–174).Washington, DC: National Academy Press.
Harvey, J. G. (1992). Mathematics testing with calculators: Ransoming the hostages. In T. A. Romberg(Ed.), Mathematics assessment and evaluation: Imperatives for mathematics educators (pp. 139–168).Albany, NY: SUNY Press.
Hedges, L. V., Stodolsky, S. S., Mathison, S., & Flores, P. (1986). Transition Mathematics field study. Chicago:University of Chicago, Department of Education, University of Chicago School Mathematics Project.
Leinwand, S. (1994). Four teacher-friendly postulates for thriving in a sea of change. Mathematics Teacher,87, 392–393.
Madaus, G. F., West, M. M., Harmon, M. C., Lomax, R. G., & Viator, K. A. (1992). The influence oftesting on teaching math and science in grades 4–12, executive summary. Chestnut Hill, MA:Boston College, Center for the Study of Testing, Evaluation, and Educational Policy.
Marshall, S. P., & Thompson, A. G. (1994). Assessment: What’s new—and not so new—a review ofsix recent books. Journal for Research in Mathematics Education, 25, 209–218.
Mathematical Sciences Education Board. (n.d.). For good measure: Principles and goals for mathematicsassessment. Washington, DC: National Academy Press.
Mathematical Sciences Education Board. (1993). Measuring what counts: A conceptual guide for math-ematics assessment. Washington, DC: National Academy Press.
McConnell, J. W., Brown, S., Eddins, S., Hackworth, M., Sachs, L., Woodward, E., Flanders, J., Hirschhorn,D., Hynes, C., Polonsky, L., & Usiskin, Z. (1990). Algebra. Glenview, IL: Scott, Foresman.
National Commission on Testing and Public Policy. (1990). From gatekeeper to gateway: Transformingtesting in America. Chestnut Hill, MA: Boston College, National Commission on Testing andPublic Policy.

215S. L. Senk, C. E. Beckmann, and D. R. Thompson
National Council of Teachers of Mathematics. (1989). Curriculum and evaluation standards forschool mathematics. Reston, VA: Author.
National Council of Teachers of Mathematics, Assessment Standards Working Groups. (1993).Assessment standards for school mathematics, Working draft. Reston, VA: Author.
National Council of Teachers of Mathematics. (1995). Assessment standards for school mathematics.Reston, VA: Author.
Peressini, A. L., Epp, S. S., Hollowell, Brown, S., K. A., Ellis, W. E., Jr., McConnell, J. W., Sorteberg,J., Thompson, D. R., Aksoy, D., Birky, G. D., McRill, G., & Usiskin, Z. (1992). Precalculus and dis-crete mathematics. Glenview, IL: Scott, Foresman.
Romberg, T. A., & Wilson, L. D. (1992). Alignment of tests with the standards. Arithmetic Teacher,40, 18–22.
Romberg, T. A., Zarinnia, E. A., & Williams, S. R. (1989). The influence of mandated testing on mathe-matics instruction: Grade 8 teachers’ perceptions. Madison: University of Wisconsin, National Centerfor Research in Mathematical Sciences Education.
Rubenstein, R. N., Schultz, J. E., Senk, S. L., Hackworth, M., McConnell, J. W., Viktora, S. S.,Aksoy, D., Flanders, J., Kissane, B., & Usiskin, Z. (1992). Functions, statistics, and trigonometry.Glenview, IL: Scott, Foresman.
Senk, S. L., Thompson, D. R., Viktora, S. S., Rubenstein, R., Halvorson, J., Flanders, J., Jakucyn, N.,Pillsbury, G., & Usiskin, Z. (1990). Advanced algebra. Glenview, IL: Scott, Foresman.
Stenmark, J. K. (1989). Assessment alternatives in mathematics. Berkeley, CA: EQUALS.Stenmark, J. K. (1991). Mathematics assessment: Myths, models, good questions, and practical sug-
gestions. Reston, VA: National Council of Teachers of Mathematics.Stiggins, R. J., & Conklin, N. F. (1992). In teachers’ hands: Investigating the practices of classroom
assessment. Albany, NY: SUNY Press.Taylor, L. T. (1992). Survey of algebra and geometry teachers assessment practices, and an investiga-
tion of publisher-provided testing materials. Dissertation Abstracts International, 52, 11. (UniversityMicrofilms No. AAC 9211232)
Thompson, D. R., Beckmann, C. E., & Senk, S. L. (1997). Improving classroom tests as a means of improv-ing assessment. Mathematics Teacher, 90, 58–64.
Usiskin, Z. (1980). What should not be in the algebra and geometry curricula for average students. MathematicsTeacher, 73, 413–424. (Reprinted in Mathematics Teacher, 88, 156–164, 1995.)
Usiskin, Z., Coxford, A., & Hirschhorn, D. (1991). Geometry. Glenview, IL: Scott, Foresman.Usiskin, Z., Flanders, J., Hynes, C., Polonsky, L., Porter, S., & Viktora, S. (1993). Transition mathe-
matics, Teachers’ Edition. Glenview, IL: Scott, Foresman. (Original work published in 1990)van den Heuvel-Panhuizen, M., & Gravemeijer, G. (1993). Tests aren’t all bad: An attempt to change
the face of written tests in primary school mathematics instruction. In N. Webb & A. F. Coxford (Eds.),Assessment in the mathematics classroom (pp. 54–64). Reston, VA: National Council of Teachersof Mathematics.
Webb, N. L., & Coxford, A. F., (Eds.). (1993). Assessment in the mathematics classroom. Reston, VA:National Council of Teachers of Mathematics.
Weiss, I. (1994). A profile of science and mathematics education in the United States: 1993. Chapel Hill,NC: Horizon Research.
Wilson, L. (1994). What gets graded is what gets valued. Mathematics Teacher, 87, 412–414.Wilson, R. J. (1990). Classroom processes in evaluating student achievement. Alberta Journal of
Educational Research, XXXVI, 4–16.
Authors
Sharon L. Senk, Associate Professor, Department of Mathematics, Michigan State University, East Lansing,MI 48824, [email protected].
Charlene E. Beckmann, Associate Professor, Department of Mathematics, Grand Valley StateUniversity, Allendale, MI 49401, [email protected].
Denisse R. Thompson, Assistant Professor, College of Education, University of South Florida, EDU208B, Tampa, FL 33620, [email protected].