Embed Size (px)
Citation preview
1
ASSESSMENT AND CLASSIFICATION OF
EMERGENCIES (ACE) PROJECT
MAPPING OF KEY EMERGENCY NEEDS ASSESSMENT
AND ANALYSIS INITIATIVES
FINAL REPORT
February 2009
OCHA appreciates the generous support of ECHO for conducting this review.
2
- List of Content -
EXECUTIVE SUMMARY 4
Key Findings and Recommendations 4
I INTRODUCTION 6
1.1 Methodology 7
II LINKING NEEDS ASSESSMENTS 8
2.1 Assessment and Analysis Process 8
2.2 Sequence of Humanitarian Assessments 8
III HUMANITARIAN ASSESSMENT STANDARDS 10
3.1 Health and Nutrition Tracking Service (HNTS) 10
3.2 Standardized Monitoring and Assessment of Relief and Transitions (SMART) 11
3.3 The SPHERE Project 13
IV HUMANITARIAN ASSESSMENT TOOLS 14
4.1 Pre-Crisis Vulnerability and Risks 14 4.1.1 Comprehensive Food Security and Vulnerability Analyses (CFSVAs) 14 4.1.2 Multiple Indicator Cluster Survey (MICS) 14 4.1.3 Risk Mapping and Shelter Response Planning 14
4.2 Multi-Cluster/ Multi-Sectoral Tools 15 4.2.1 ICRC and IFRC Emergency Assessments 15 4.2.2 Initial Rapid Assessment (IRA) 16
4.3 Cluster / Sector Specific Tools 17 4.3.1 Camp Coordination and Camp Management (CCCM) Assessment Framework 17 4.3.2 Rapid Assessment in the Education Sector 19 4.3.3 WFP’s Emergency Food Security Assessment Tools 19 4.3.4 Guidance on Profiling Internally Displaced Persons 20 4.3.5 Health Resources Availability and Mapping System (HeRAMS) 21 4.3.6 Protection Monitoring/Assessment Systems 22 4.3.7 Shelter Assessment Tools 22 4.3.8 WASH Cluster Survey Tool 23 4.3.9 The Livelihood Assessment Tool-kit (LAT) 25 4.3.10 Household Economy Approach (HEA) 25
V ANALYTICAL FRAMEWORKS FOR CONSOLIDATION OF INFORMATION 27
5.1 Integrated Food Security Phase Classification (IPC) 27
5.2 Nutritional Information in Crisis Situations (NICS) 28
5.3 Needs Analysis Framework (NAF, 2007 version) 29
3
5.4 Post-Disaster Needs Assessment (PDNA) 30
5.5 Post Conflict Needs Assessments (PCNAS) 32
VI OTHER RELEVANT INITIATIVES 33
6.1 Global Risk Identification Program (GRI-P) 33
6.2 Protection of Conflict-Induced IDPs: Assessment for Action 33
6.3 DevInfo in Emergencies 33
6.4 UNHCR’s Global Needs Assessment (GNA) 34
VII MAJOR FINDINGS AND RECOMMENDATIONS 35
7.1 Major Findings 35
7.2 Recommendations 37
ANNEX I: SEQUENCE OF HUMANITARIAN ASSESSMENTS IN SUDDEN ONSET CRISIS 39
ANNEX II: ASSESSMENT INITIATIVES 40
ANNEX III: LIST OF ACRONYMS 42
4
EXECUTIVE SUMMARY
Within the humanitarian response field, there are increasingly strong calls for the improved
assessment and analysis of needs at all phases of an emergency, including established
indicators, definitions, and assessment methodologies, standardized information requirements,
and accepted thresholds for humanitarian action. Improving assessment and analysis in this way
would support the identification of acute humanitarian needs and create a solid evidence base
for humanitarian decision making regarding the level and type of action required to respond to
those needs. Central to meeting these challenges is improving coherence among the multiple
tools and practices that exist to assess needs within the humanitarian community.
The IASC Working Group at its June 2007 meeting requested OCHA to conduct a mapping of
the various humanitarian assessment initiatives in consultation with IASC members to explore
opportunities for establishing synergies among them, and to facilitate the development of an
overarching approach to assessment and analysis. OCHA established the Assessment and
Classification of Emergencies (ACE) project to undertake this mapping exercise and other
related tasks. The mapping began in early 2008, and included a series of consultations with
IASC representatives at the global and regional levels. In addition, the 2008 CAP and Flash
Appeal documents were reviewed to identify the key indicators and the prioritization criteria
used to measure humanitarian needs. The draft report was shared with the global cluster leads
and participants at the November 2008 meeting of the IASC Working Group for comment; this
final version incorporates feedback and new materials received.1
This report covers the main assessment and analysis framework initiatives currently underway
at the global level, including major humanitarian standards, multi-cluster assessments, cluster or
sector-specific assessments, and analysis framework initiatives. The wide range of multi-
sectoral and/or sector-specific tools that have been developed at the field level are not included,
including those developed by donors. Also, long-established early warning or monitoring
systems (e.g. for food security) are not covered, except for a few new initiatives which serve
both monitoring and assessment functions.
The report organises the various assessment initiatives according to three levels:
1. Standards-related initiatives, which serve as a foundation for assessment tools and data
collection;
2. Primary data collection, with a distinction between rapid and in-depth assessments; and
3. Analysis frameworks, where information and data generated by the two previous levels is
integrated into a framework for analysis and in some cases, response planning.
A possible way of organizing needs assessments along a linear sequence according to the
emergency timeline is also proposed (see Annex 1).
Key Findings and Recommendations
Overall, agencies/clusters are seriously engaged in efforts to standardize and improve their own
assessment practice and build partnerships for joint assessments and information consolidation.
All initiatives aim to address the need for better information for sectoral programming, as well
as the need for more timely information at the onset of an emergency.
1 This final version reflects all comments received as of 13 February 2009. All efforts were made to ensure
accuracy regarding individual initiatives/tools, but OCHA takes full responsibility for any errors.
5
Coordination: With the large number of initiatives currently underway at all levels, following
similar design processes and collecting similar information, there is greater scope for improved
consultation and coordination among them, allowing for greater comparability and sharing of
lessons learned.
Timeframe: Many tools as currently designed have not taken into account the type and depth of
information that is required at different times throughout an emergency. This is particularly the
case at the early on-set of a crisis, when only limited information may be available and must be
collected in a timely manner. As a result, stronger linkages are required with contingency
planning, in order to draw on pre-crisis baseline information in the initial phases of an
emergency.
Standardisation: The review revealed a strong opportunity to increase standardization of
indicators and definitions of key terms, to ensure that “similar levels of vulnerability in different
settings do not trigger different levels of response”.2 In addition, greater focus on the ranking of
severity within or across sectors would enable better prioritization of the response. Agreement
on a core set of indicators to correspond with the emergency timeline could improve
comparability in measuring needs and severity across sectors, and ultimately across
emergencies.
The term ‘rapid assessment’ is used to cover a wide range of time frames, from a few days to
several weeks, blurring the distinction between truly rapid assessments and more in-depth
assessments. Many of the new initiatives are in-depth assessments, addressing specific
cluster/sector programming needs in detail. However, a significant amount of data collected is
common across all initiatives. Therefore, multi-sectoral needs assessment tool(s) could be used
to collect this common data across all the different sectors, particularly after a sudden on-set
crisis.
Skills and Capacity: Although some agencies/clusters have established strong capacity-building
programmes, others need to strengthen substantive and technical capacity to develop and
implement assessment tools, and conduct multi-sectoral analysis. Clusters/agencies should
consider conducting a review of existing capacities for design and implementation of the
various tools, and create materials/capacity-building strategies as necessary. The development
of further training materials/capacity-building strategies should build upon work by
agencies/initiatives which have made substantial investment in these topics.
It is recommended that individual agencies as well as sector/cluster leads ensure that
assessment-related tools are reviewed and cleared by both substantive and technical experts,
including in particular data management experts, prior to field-testing, finalization and
deployment.
2 ECHO, Terms of Reference: Humanitarian Needs- Building blocks toward a common approach to needs
assessment and classification, October 2007.
6
I Introduction
As a result of the call for improved needs assessments in the Tsunami Evaluation Coalition, the
UN Humanitarian Response Review and the UN Reform Process, a large number of assessment
initiatives are currently underway. Based on the widely accepted humanitarian priorities of
saving lives, alleviating suffering and maintaining dignity, it is essential for the humanitarian
system to work collectively to define which set of information and indicators is required at the
immediate onset of an emergency, in the medium and longer term and for which purpose.
At the 68th Inter-Agency Standing Committee (IASC) Working Group’s meeting in June 2007,
a discussion was held on the need to improve the linkages between recent initiatives on
humanitarian needs assessments, many of which were begun in response to the Humanitarian
Reform agenda. OCHA was requested to map these initiatives, in consultation with IASC
members, to explore opportunities for harmonizing and establishing synergies among them, and
to facilitate the development of an overarching assessment/analytical approach.
The mapping began in early 2008 and included two informal meetings with representatives of
the IASC on cluster/agency assessment initiatives (30 January and 23 September, 2008), in
addition to a stocktaking report and consultative workshop in Nairobi on major assessment and
analysis initiatives being implemented in Central and East Africa (12 May 2008), and numerous
bilateral consultations. Consultations focused on the objectives and status of the initiatives, the
main indicators used to determine the scale and severity humanitarian needs, and the existing
analytical frameworks for consolidating information from diverse sectors.
The following report covers the main assessment and analysis framework initiatives currently
underway at the global level, based on information has been shared with OCHA as of February
2009 or is available on the web. It does not include the wide range of multi-sectoral and/or
sector-specific tools that have been or are in development at the field level. Also, long-
established early warning or monitoring systems (e.g. for food security) are not covered, except
for a small number of new initiatives which serve both monitoring and assessment functions.
Three major humanitarian standards, two multi-cluster assessments, ten cluster or sector-
specific assessments, and five analysis framework initiatives are reviewed. Three major
initiatives to improve collection of pre-crisis information and four additional relevant initiatives
are also included. Also, 2008 CAP and Flash Appeal documents were reviewed to identify the
indicators and the prioritization criteria used. The report includes an initial sequencing
framework, which organizes the needs assessment initiatives according to the emergency
timeline (Annex 1).
The findings presented below should be seen as indicative, since many of the global initiatives
to develop assessments are still in the design stage and have not been field tested in actual
emergencies. For example, approximately half of the multi-sectoral and cluster-specific
initiatives are still being designed. (See table in Annex 2)
The fact that these initiatives are at different stages of development, and therefore can still be
modified, underscores the importance of the OCHA’s role in coordinating and harmonizing the
ongoing development of the tools, including sharing of good practices and lessons. For
example, as a result of mapping work, informal discussions have been held on linking food
security severity classification work with initiatives on improving collection of health and
mortality statistics.
7
Further investigation and analysis of the key information required by donors, decision-makers
and field operations and its availability in a sudden onset crisis would support the refinement of
the following findings and the proposed sequence of assessment activities.
1.1 Methodology
The assessment initiatives were screened against a set of systematic criteria (general information
on the type of tool, level of funding, indicators and variables generated, needs analysis and
severity ranking, methodology, development process including the level of completion, staffing
requirements and level of consensus). However, information was not consistently available on
all these criteria across all initiatives.
The review of 2008 CAP and Flash appeal documents also identified the indicators used in these
appeals. The indicators were then classified by cluster/sectors and regrouped into four classes of
frequency of utilization (indicators used in less than 30% of the documents, from 30 to 60%,
from 60 to 90%, more than 90%).3
3 This document is available upon request from OCHA.
8
II Linking Needs Assessments
As an attempt to organise the multiple initiatives, a generic grouping is suggested for all types
of initiatives, and a possible way of organizing needs assessments along a linear sequence
according to the emergency timeline is also proposed (see Sections II.1 and II.2, respectively).
2.1 Assessment and Analysis Process
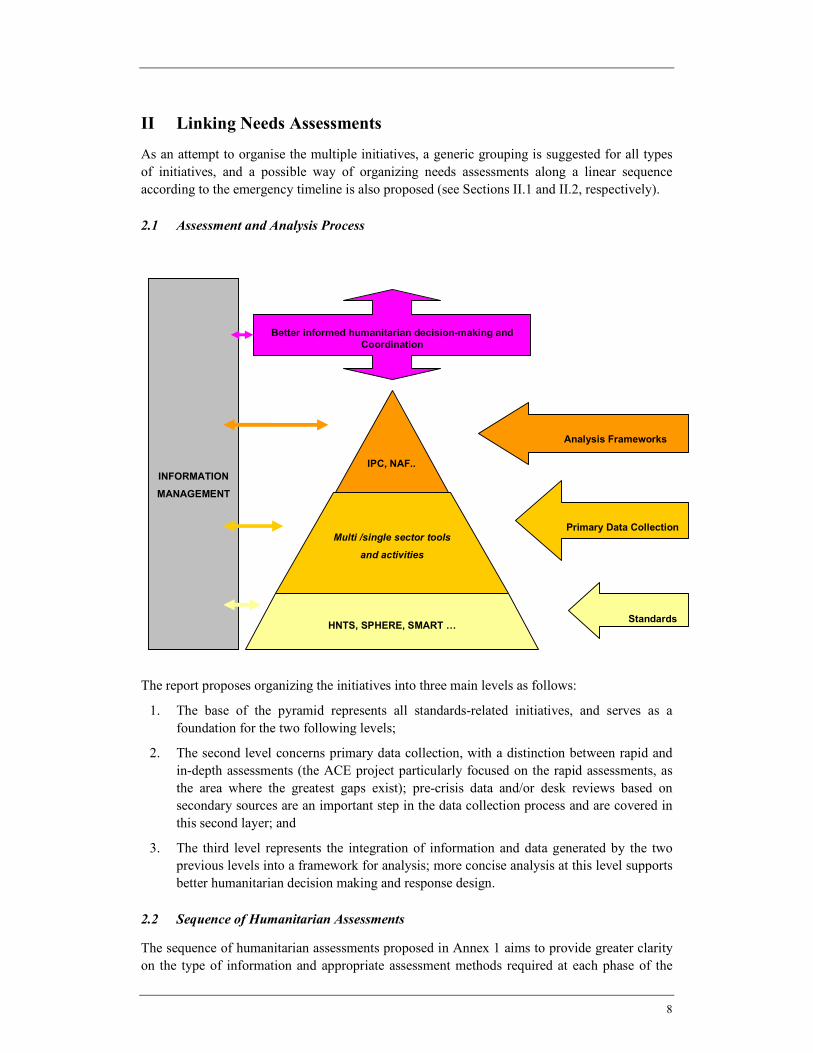
The report proposes organizing the initiatives into three main levels as follows:
1. The base of the pyramid represents all standards-related initiatives, and serves as a
foundation for the two following levels;
2. The second level concerns primary data collection, with a distinction between rapid and
in-depth assessments (the ACE project particularly focused on the rapid assessments, as
the area where the greatest gaps exist); pre-crisis data and/or desk reviews based on
secondary sources are an important step in the data collection process and are covered in
this second layer; and
3. The third level represents the integration of information and data generated by the two
previous levels into a framework for analysis; more concise analysis at this level supports
better humanitarian decision making and response design.
2.2 Sequence of Humanitarian Assessments
The sequence of humanitarian assessments proposed in Annex 1 aims to provide greater clarity
on the type of information and appropriate assessment methods required at each phase of the
IPC, NAF..
Multi /single sector tools
and activities
HNTS, SPHERE, SMART …
Better informed humanitarian decision-making and
Coordination
Analysis Frameworks
Standards
Primary Data Collection
INFORMATION
MANAGEMENT
9
crisis. Each phase of the sequence corresponds to a different phase of the crisis. Five phases are
proposed: phase 0 corresponding to preparedness prior to the crisis, phase 1 corresponding to
the first days after on-set, phase 2 corresponding to the first two weeks, phase 3 corresponding
to the second two weeks and phase 4 corresponding to the second month onwards.
For each phase, there are:
� Different assessment methods and tools; and
� A specific set of information required.
Information becomes progressively refined and increasingly thorough throughout the sequence,
resulting in a comprehensive evidence base for humanitarian action from decision-making to
programming. While time is a key factor, it is only one of many factors that will influence the
content and scope of assessments, as well as the methodology used. Access, security on the
ground, resources and logistics will be equally influential. This attempt to sequence assessment
tools must remain flexible enough to reflect this complexity. The sequence will be further
refined and developed into a comprehensive framework for assessments, linked to response
planning, based on analysis of the information requirements and needs at field level and
agreement on a core set of indicators and further consultation.
10
III Humanitarian Assessment Standards
3.1 Health and Nutrition Tracking Service (HNTS)
The Health and Nutrition Tracking Service (HNTS) is an independent interagency initiative
launched in late 2007 by the members of the Health and Nutrition Clusters of the Inter-Agency
Standing Committee (IASC) in response to the request made by the United Nations Emergency
Relief Coordinator. The HNTS is overseen by a Steering Committee (SC).4
The three main HNTS goals are to:
� Contribute to the improvement of humanitarian operations and promote mutual
accountability of the humanitarian community and beneficiaries;
� Detect and prevent, if possible, excess mortality and malnutrition in crises;
� Ensure that information relevant to humanitarian policy and evidence based reports on
health and nutrition needs in humanitarian crises situations are available for high level
decision making fora such as the UN and the European Union.
The purpose of the initiative is to establish systematic technical and field arrangements to
provide impartial, credible and timely information, analysis and dissemination on a core of
mortality and nutrition indicators related to populations affected by humanitarian emergencies
and crises.
HNTS is organized around two functions:
1. An operational function, including help desk support to the field operations, as part of the
roll out of the Health and Nutrition Clusters, in collaboration with already existing
country initiatives, systems or local data repositories; standardization of data processing;
2. A normative function, such as data generation and analysis, technical consensus on data
collection and measurement issues, data synthesis/independent peer review function, data
dissemination, Expert Reference Group.
In the course of 2008, the “help desk” provided technical support upon request to six different
countries and field projects, primarily focussing on the design of survey research instruments
and monitoring systems.5 HNTS also supported development of tools and information systems
such as the Initial Rapid Assessment Tool (IRA), the SPHERE project, the Somalia Food
Security Analysis Unit and the Integrated Food Security Phase Classification by providing
technical input on health and nutrition issues.
Other products developed in 2008 include:
4 HNTS is hosted by WHO; the SC comprises one representative each from the Health and Nutrition clusters
(co-chairs), and representatives from ACF, CIDA, DFID, ECHO, EpiCentre, FAO, the International Red
Cross, OCHA, SCF-UK, SIDA, UNHCR, UNICEF, WFP and WHO. 5 (1) Uganda: review the MoH health facility services reporting and the Nutritional Guidelines for the Nutrition
Cluster Uganda; (2) Pakistan: design survey research instruments, support the earthquake recovery
monitoring and assess food price crisis research opportunities; (3) Kenya: advise various agencies on
humanitarian assessment, monitoring the post-election conditions and recovery among displaced; (4)
Myanmar: extensive assistance in producing the Post-Nargis Joint Assessment (PONJA) report; see
http://www.asean.org/21765.pdf ; (5) Sudan: support to WHO Darfur program in improving the monitoring
of government health institutional data; (6) Chad and Central African Republic: critical review of
Communicable Disease Epidemiological Profile for Chad and CAR, and review of Chad Early Warning
System Bulletin.
11
� A software application and guidelines, HINTS (Health Information and Nutrition
Tracking System), for tracking health events and nutrition status in health facilities;
� “Priority indicators in complex emergencies: summary” summarizing efforts to advise
HNTS regarding a very short priority list of health indicators to be promoted for use in all
health crises settings. This included a brief review of the evidence base for the SPHERE
Indicators. The document provided a ringing endorsement of the SMART Initiative.
Malnutrition and mortality rates are priority measures for most agencies and scholars, and
meet the criteria of a good health indicator; and
� “Mortality estimates in crisis affected populations: inference from multiple sources”
reviewed how to combine different sources of information on mortality into single
estimate of the death toll attributable to crises.6 A proposed system for scoring the
quality of surveys is presented, and suggestions are made on how to use surveillance and
body count data. Outstanding issues, limitations and possible next steps are discussed.
In January 2009, the HNTS Steering Committee reaffirmed the HNTS’ important normative and
global function, with a strong emphasis on operations and tracking activities at country level.
The SC also identified the Democratic Republic of Congo as a priority country for HNTS
implementation in 2009. A first HNTS Expert Reference Group meeting took place in February.
Key Indicators: The “Priority indicators in complex emergencies: summary” paper suggested
that HNTS advocates for collecting crude mortality rate (CMR) and under 5 mortality rate
(<5MR) at a minimum, and in addition, include both maternal mortality (despite the fact that it
is often difficult to measure), and water consumption as part of an expanded list of priority
indicators.
3.2 Standardized Monitoring and Assessment of Relief and Transitions (SMART)
SMART began in the late 1990s to develop a basic integrated, standardized method to improve
the estimates of nutritional status and mortality rates during emergencies. Two of its major
objectives are: (a) to balance simplicity with technical soundness (data quality and reliability) so
that rapid data analysis can occur in support of strategic decision-making and (b) standardize
survey methods used by the humanitarian community for collecting and analyzing data,
including sampling.
During 2002-2007, SMART developed and piloted (in several countries) Version 1 of a manual
on conducting surveys and an accompanying software program that integrates the planning,
collection and analysis of mortality rates and nutritional data. The manual is flexible; it allows
other indicators to be added or adjustments to be made to adapt to specific situations (e.g. for
population displacement or migration). Subsequently, a food security module based on the
Household Economy Approach (HEA) was developed and implemented separately in 4
countries; the aim was to help clarify the context on whether the mortality and malnutrition
levels were “normal” and identify possible causes and trends. This effort was funded by CIDA
and involved numerous individuals and non-governmental and UN organizations and academic
institutions, under the overall coordination of USAID and UNICEF.
6 A four-step approach is outlined: (i) quality scoring of all available sources (surveys, surveillance, other
studies); (ii) metadata collection from each source and reanalysis of important datasets, if needed; (iii)
maximum likelihood estimation of the excess death toll for time and administrative unit strata within the
total crisis person-time that are covered by data, based on weighted averages of the different sources; and
(iv) extrapolation to person-time not covered by data, primarily based on statistical modelling of the under
5 years mortality rate informed by predictive variables easily collectible based on agency reports.
12
The IASC Global Nutrition Cluster held a meeting on SMART in April 2008 to resolve a
number of technical issues arising from field experience on anthropometry, mortality statistics,
sampling, and food security/context analysis, and discuss next steps. This included clarification
of key terms (e.g. CMR, crude death rate (CDR); <5MR, mortality recall periods) and
suggestions for best practice in assessing mortality, calculating age, and adjusting weight and
height. The participants noted that further work is needed to ensure that the manual and software
reflect best practices for estimating mortality. They also concluded that an additional “Context
Analysis” module should be developed to guide the collection of secondary data and primary
qualitative data on health, water and sanitation and other factors to help identify the main
underlying causes of high malnutrition or mortality, e.g. whether nutritional outcomes are
primarily related to illness care practices, or access to food. This would require the
development, jointly with the other clusters, of a few key questions for possible inclusion in
future nutrition or mortality questionnaires.
Two major recommendations were made concerning training and guidance. First, standard
global training materials should be developed covering survey methods, data analysis and
interpretation, and use of the software. Second, guidance should be developed for the wider
humanitarian community on how to interpret and report on data quality, including a checklist on
the minimum information to be included in every survey report (e.g. confidence intervals,
design effect). These would indeed be useful for actors who conduct household surveys to
inform humanitarian programming.
These and other outstanding technical questions will be identified through further consultations,
including with the HNTS Expert Reference Group (see III.1). As recommended by the Global
Nutrition Cluster, it may be useful to consider adapting their guidance on sampling for broader
use, and seek their input on the checklist of minimum information to be included in all survey
reports, and key questions for inclusion in mortality and nutrition surveys on contextual factors
(health, water and sanitation).
Key Indicators:7 Adoption of two key indicators widely considered as the most basic, vital
public health indicators of the severity of the crisis and useful to identify needs:
� Crude mortality/death rates (CMR/CDR), including comparison of CDR with the age 0-5
death rate;
� Nutritional status of Under-five children based on height-for-age (HFA or stunting),
weight-for-height (WFH or wasting), and weight-for-age (WFA reflecting both wasting
or stunting or a combination of the two) compared to international reference standards
and presence of oedema;8
� Middle-Upper Arm Circumference (MUAC) as an optional indicator, i.e. not to be used
on its own to estimate prevalence of moderate or acute malnutrition, but to be combined
with weight and height and
� Population size and demographics.
7 SMART, 2006: “Measuring Mortality, Nutritional Status, and Food Security in Crisis Situations: SMART
Methodology Version 1, April 2006.” See: http://www.smartindicators.org/SMART_Methodology_08-07-
2006.pdf 8 Wasting among children aged 6–59 months is used as a proxy of the health and wellbeing of the entire
community, because there are no internationally agreed indicators and related cut-off points to assess
nutritional status in other age groups.
13
3.3 The SPHERE Project
The SPHERE project was launched in 1997 by a group of NGOs and the Red Cross and Red
Crescent Movement. The aim is to improve the quality of humanitarian assistance provided to
people affected by disasters and to enhance the accountability of the humanitarian system in
disaster response by developing a set of universal minimum standards in core areas of
humanitarian assistance. The guiding values and principles of the project are:
� International Humanitarian, Human Rights and Refugee Law; and
� The Code of Conduct (Principles of Conduct for International Red Cross and Red
Crescent Movement and NGOs in Disaster Response Programmes).
The 2004 version of the Handbook provides standards and indicators for four sectors:
� Water and Sanitation, Hygiene promotion;
� Food Security, Nutrition and Food Aid;
� Settlement and non-Food items; and
� Health Services.
Based on a wide consultation process, a revision process of the SPHERE handbook is planned
for 2009. SPHERE has not been formally endorsed by most agencies or by individual clusters;
use of SPHERE Standards is voluntary. However, the SPHERE Project and associated standards
have had one of the strongest influences on the collection of health information in emergencies.
Also, some donors, including ECHO, require implementing partners to report against SPHERE
Standards and indicators.
14
IV Humanitarian Assessment Tools
4.1 Pre-Crisis Vulnerability and Risks
A variety of pre-crisis data collection initiatives exist. A number of them have been widely
implemented for many years in a large number of countries, have a long-established track
record, and are essential references for secondary data review as input to the various assessment
processes. Examples include the Comprehensive Food Security and Vulnerability Analysis
(CFSVA), the Household Economy Approach (HEA, which includes both baseline and follow-
up surveys; see section IV), and the Multiple Indicator Cluster Survey (MICS).
4.1.1 Comprehensive Food Security and Vulnerability Analyses (CFSVAs)
Between June 2004 and August 2008, WFP completed 22 and was currently implementing nine
CFSVAs to obtain pre-crisis information on the scale, nature and causes of food insecurity and
vulnerability in countries exposed to recurrent and protracted emergencies. These involve in-
depth, large-scale household surveys (generally covering the entire country) and analyses of
secondary data. Field work typically lasts 3-4 weeks and data analysis and report writing can
take up to 3-4 months; the baseline is expected to be valid for 3-5 years unless major shocks
occur.
Recent CFSVAs have identified what can be done to address food insecurity and vulnerability,
and included an improved analysis of risks, which allows a projection to be made of the likely
changes over the CFSVA timeframe. In 2008, WFP received a six-year grant from the Gates
Foundation to conduct two CFSVAs per year, and plans to issue updated CFSVA guidelines in
early 2009.
Key Indicators: CFSVAs typically analyze the same core set of indicators and information as
used in WFP’s Emergency Food Security Assessments (EFSAs) (see Section IV.3.3 on
Emergency Food Security Assessment tools). However, it includes many more indicators.
4.1.2 Multiple Indicator Cluster Survey (MICS)
The MICS is a household survey programme developed by UNICEF to monitor the situation of
children and women at approximately 5-year intervals. It produces statistically representative,
internationally comparable estimates of nutrition, food security, health, mortality and WASH-
related indicators, including 21 of the 48 Millennium Development Goal indicators. The
analysis uses the nutrition framework. Initiated in 1995, the programme has implemented more
than 200 MICS surveys, some of them already on the third round. MICS and a similar tool, the
Demographic and Health Surveys (DHS) funded by USAID, represent the main sources of
baseline data for many indicators of household welfare.
4.1.3 Risk Mapping and Shelter Response Planning
UN-HABITAT and GRIP have undertaken on behalf of the IASC Emergency Shelter Global
Cluster, a “Risk Mapping and Shelter Response Planning” initiative as part of a disaster risk-
reduction strategy, to systematically incorporate risk management into urban planning. The goal
of this long-term activity is to improve capacities to predict causes, magnitude and geographic
coverage of the damage, address future post-disaster shelter recovery needs and to manage
information about on-going risk after a disaster and their implications for shelter planning. It is
currently being pilot tested in selected big cities and is envisioned for large-scale deployment.
15
4.2 Multi-Cluster/ Multi-Sectoral Tools
4.2.1 ICRC and IFRC Emergency Assessments
The Federation distinguishes three types of assessments:
1. Rapid assessment, undertaken by IFRC after a major upheaval to gather information on
the needs and existing capacities of the affected populations, possible areas of
intervention and resource requirements; the time frame is normally one week maximum;
2. Detailed assessment, following a rapid assessment, takes normally about a month; and
3. Continual assessments undertaken after a detailed one to regularly updating the situation
and seeking relevant feed back from the beneficiaries; it is equivalent to an M&E system
and the information gathered can be used as secondary information during rapid and
detailed assessments.
These assessments are all based on either the ICRC Household Economy framework or the
International Federation’s vulnerability and capacity framework, similar to the household
economy framework, analysing the problems and people’s capacity to address them. Seven
priority sectors are considered:
� Relief;
� Health;
� Livelihoods;
� Water, sanitation and hygiene promotion;
� Food and nutrition;
� Safety, security and protection; and
� Shelter.
Although these assessments should follow a similar process, there is no standardisation and the
quality of the assessment remains highly dependent on the team’s skills. This lack of
standardisation has been identified by the Federation itself as a gap to address. The sampling
methodology varies depending on the situation. Random sampling is used when locations and
households’ livelihoods are similar. Otherwise a “purposive” sampling, i.e. stratified sampling,
reflecting the different characteristics is used; this enables a statistical treatment of the
information as long as a random sampling is used within each strata.
Country-specific questionnaires for rapid assessments are designed on the basis of pre-
established checklists corresponding to three different time periods (24 hours, 72 hours, 1
week). These are simple yes-no or three-level ranking questionnaires. A specific assessment
must be seen as part of an iterative process and constitutes a step to prepare the ground to
continue the assessment process in a more detailed manner:
� The first step will collect information focusing on the changes of situation before and
after the disaster;
� In early recovery assessment, the main purpose is to find how the disaster has impacted
people’s access to key services, livelihoods, vulnerability and coping strategies.
16
A ranking element is introduced in the problem analysis with an approximate order of severity.
PRA techniques are extensively used to complement and understand globally the statistical
analysis. The assessment report uses a standard format and states which are the needs and
if/where gaps exist. The programme prioritisation is then based on a combination of criteria like
the resources availability, the capacity of the National Societies, the geographic areas and
sectors covered by other actors, including the Government, in addition to a sound judgment.
Two major points are worth highlighting in the case of the ICRC/IFRC Movement:
1. The Movement does not need government authorisation to undertake its assessment; and
2. By the time the FACT team arrives, a rapid assessment has already been undertaken by
the National Society team, which is permanently present in the country.
4.2.2 Initial Rapid Assessment (IRA)
The IRA was developed as an action-oriented tool for assessing needs as soon as possible after
the onset of a crisis. Field work and reporting should be completed within one to three weeks. It
is a rapid assessment using qualitative methods and triangulation from a wide range of
information sources to complement a pre-crisis review of secondary data. It is the product of a
process initially involving the Nutrition, Health and WASH clusters, but was expanded to
include shelter and food security, involving WFP, UNICEF, FAO, WHO, ACF, SCF, IFRC and
others. The results of field tests in 6 countries of an initial version were positive, although the
ability to obtain rapid results was identified as a remaining challenge. In February 2009, a
version considered as final is available,
Designed to be rapidly conducted by non-specialised personnel, with the objective of answering
essential questions for humanitarian response planning and programming, the tool includes:
� A guidance note for country and field levels to advise IRA teams on how to prepare for,
organise and carry out an IRA and analyse the data;
� A two page “Aide mémoire” for field teams;
� A check list for pre-crisis secondary data and information, organised by cluster; and
� A set of four templates for data collection, which contain questions and specific data
collection and recording notes. The unit of analysis is the site.
The IRA is meant to be flexible to enable its use across contexts and countries. This is the
reason why the sampling methodology is not precisely pre-defined and will depend on the
country context and prevailing situation regarding access, security, funding and time frame
available for the assessment. Two main criteria are used for selecting the sites: focus on areas of
greatest needs and coverage of a range of locations qualitatively representative of the affected
population. Emphasis is place on establishing a categorisation according to geographical areas,
ethnic groups and gender differences, which means the diversity of the situation is taken into
consideration for the interview site selection, although it will not be statistically representative.
The IRA form is divided into two parts:
� Summary conclusion sheet reflecting the joint findings of the assessment team and
completed at the end of each site visit; and
� Data sheets organised into six sections, covering demographics, nutrition, shelter and
non-food items, water and sanitation and health. There are three different forms, A) for
key informants’ interviews, B) for focus group discussions and C) for observations and
local secondary data.
17
The summary conclusion sheet captures the overall summary of the crisis as well as problems
and priorities identified by the affected population and establishes a severity ranking of the
needs for each of the six sections in three levels:
1. Severe situation: urgent intervention required;
2. Situation of concern or lack of data/unreliable data: further assessment/surveillance
required; and
3. Normal situation or local population able to cope with the crisis: no further action
required).
Although the needs are consistently ranked within each sector, a systematic ranking to prioritise
across sectors is not included.
Lessons learned drawn from Bangladesh, Kenya and Myanmar have shown that despite the
positive field tests and the clear need for an inter-sectoral rapid assessment tool, country teams
were reluctant to use the initial version of the IRA questionnaire because of its length and
specialized nature. This version has undergone a series of revisions and has been significantly
shortened and re-structured. The final version will be field tested in the next emergency that will
occur. However, it is worth noting that UN Country Teams (UNCTs) in Nepal and more
recently in Georgia have been using the questionnaire as a basis to develop much shorter
versions. Interviews were conducted at village level, using rapid assessment (RA) techniques
with key informants and groups of villagers. One of the most appreciated characteristics of the
tool most appreciated is its flexible approach.
4.3 Cluster / Sector Specific Tools
4.3.1 Camp Coordination and Camp Management (CCCM) Assessment Framework
Since January 2008, the CCCM Cluster9 has been developing a needs assessment system for use
in the initial humanitarian response for displaced people residing in camps and collective
centres. The primary purposes of the needs assessment system are:
� To know how many camps there are, where they are located, how many people are living
at each site;
� To know to what extent camps are covered by humanitarian actors and which camps lack
services in particular sectors;
� To identify key actors responsible for each camp, including camp administrators,
government officials, community leaders and humanitarian actors;
� To track changes in the number and composition of the camp population; and
� To be able to compare a camp to other camps, or regions to other regions.
It is a surveillance system for non-specialist primary data collection at the community level,
with data organized according to camp (geographic location). The system will be comprised of
guidance, data collection forms and a database in which to store and analyze the information.
9 This comprises: CARE, International Organisation for Migration (IOM) – cluster lead in natural disasters,
International Rescue Committee, Lutheran World Federation (LWF); Norwegian Refugee Council,
UNOCHA, Shelter Centre, United Nations Environment Programme (UNEP) and United Nations High
Commissioner for Refugees (UNHCR) – cluster lead in conflict situations.
18
The system focuses primarily on closed questions that can be quickly and automatically be
compiled into statistical reports.
The CCCM tool organizes data collection into five layers, each of which is broken down
according to the phase of the emergency and data collection frequency and sequenced in order
to gradually build upon an initial core dataset:
1. Camp Geographic and Snapshot Data
a. Data are collected once, at the onset of the emergency.
b. Contents cover the following information topics: Core dataset; geographic
location, physical characteristics of site, population estimation, mortality in the
last seven days.
2. Population Tracking Form
a. Data are collected shortly after onset (after snapshot data are collected) at high
frequency (determined locally by field capacity and volume of population
movement) to capture frequent changes.
b. Contents cover the following sectors/information topics: Population figures;
displacement information; government officials responsible for the camp.
3. Multi-Sectoral Needs Assessment
a. Data are collected one or two months into the emergency, once humanitarian
services are in place, and are collected infrequently (every 3 – 6 months)
because the situation usually does not change substantially.
b. Contents cover the following sectors/information topics: Community
Participation, Protection, Food, WASH, Health and Shelter.
4. Camp Capacity Mapping
a. This assessment is to be conducted for the first time once humanitarian services
are in place, on an ad hoc basis as needed, depending on how frequently
humanitarian actors servicing a camp change.
b. This seeks to answer the following questions: Who is doing what projects
inside the camp and when did they start? Have any needs assessments been
conducted?
5. Urgent Action Report
a. It is conducted at the onset of an emergency and continuing throughout on an ad
hoc basis as needed.
b. It is a qualitative report aiming at reporting the urgent need for life-saving
interventions, with a different – and more direct – data path than other reports,
because it goes to CCCM Coordinator and not a data entry clerk.
Key Indicators: Most of the indicators in the assessment relate primarily to availability of
services and community governance structures. Other indicators tracked include land
ownership, population figure accuracy, community participation, dispute resolution
mechanisms, local capacity for food supply and shelter construction, and distance to the nearest
primary school.
19
4.3.2 Rapid Assessment in the Education Sector
Developed for use in the first 72 hours of an emergency, UNICEF has developed an Integrated
Rapid Assessment Field Data Checklist for the Education Sector. This checklist is ideally to be
used as part of a cross-sectoral rapid needs assessment effort.
After conducting this initial, cross-sectoral rapid assessment, the education sector/cluster aims
to assess the condition of learning spaces in greater detail, using the Rapid Education
Assessment of Learning Spaces (RALS) tool. This tool is meant for use on a regular basis to
monitor programme developments.
Both tools are available as part of the resource toolkit entitled “Education in Emergencies”,
which also includes guidelines for the contextualization and use of the tools.10
Key Indicators: Key indicators to be used in the initial, rapid cross-sectoral assessment relate to
school attendance, education priorities, education infrastructure, education system capacity and
education materials. Additional indicators included in the RALS include number, ages and
gender of affected children and location, gender and qualification of teachers. All indicators
reflect the Inter-agency Network for Education in Emergency (INEE)’s Minimum Standards for
Education in Emergencies.
4.3.3 WFP’s Emergency Food Security Assessment Tools
In late 2003, WFP launched a multi-year project to build capacity and enhance the quality,
credibility, accountability and transparency of food security assessment practice in three areas:
pre-crisis vulnerability baselines, assessment methods, and food security monitoring. This
“Strengthening Emergency Needs Assessment Implementation Plan (SENAIP)11 was jointly
funded by donors including ECHO, DFID and the German Government, and was guided by an
Advisory Group of experts from NGOs, other UN agencies and academia.
Improved guidance and tools were developed on a range of assessment topics, including how to
analyze the role and potential of markets, integrate food security and nutrition analysis and
estimate population numbers. Guidelines were produced for WFP-led and joint assessments,
including the Emergency Food Security Assessment (EFSA) Handbook (2005) and the
UNHCR/WFP Joint Assessment Guidelines (JAG) (2004). A major capacity-building effort
was undertaken: over 1,700 persons - 900 WFP staff and nearly 800 staff from partner
organizations - were given basic or advanced training between 2005 and end 2007. Partnerships
on food security baselines, assessments and monitoring were strengthened with NGOs, FEWS
NET, FAO and UNICEF, including efforts to pilot the Integrated Food Security Phase
Classification (see section V.1).
Special emphasis was given to develop a standardized way to group households according to
three levels of food (in)security, including the food consumption score (FCS), which uses a
combination of dietary diversity and food frequency. The goal is to enable comparisons over
time by using similar methods in the pre-crisis baselines (CFSVAs) and post-crisis assessments
(EFSAs). Assessments determine the household food security situation and project their
evolution over the next 6-12 months by combining the analysis of FCS, food access categories,
context-specific indicators and thresholds, and risks to lives and livelihoods based on coping
strategies. (See the revised EFSA Handbook, forthcoming.)
10 www.ineesite.org/toolkit
11 The Strengthening Emergency Needs Assessment Capacity or SENAC project was launched in 2005 to carry
out major components of this implementation plan.
20
Although SENAIP officially ended in early 2008, the essential activities are continued by the
newly re-organized Food Security Analysis Service (FSAS), which covers pre- and post-crisis
activities. The priorities include continued capacity-building, development of improved methods
to integrate nutrition and food security analysis and analyze response options including the use
of cash transfers, and piloting the Integrated Food Security Classification system.
Key Indicators (standard categories of indicators to be analyzed):
1. Mortality: crude mortality rate, under-5 mortality rate;
2. Nutrition status: wasting, stunting and underweight in children, body mass index (BMI)
in adults, Middle Upper Arm Circumference (MUAC) in children and adults;
3. Food consumption: Food Consumption Score (FCS) (still under development);
4. Food access, and
5. Coping strategies.
The recently activated Task Force on Assessment, Monitoring and Evaluation (TF-AME) of the
UN Standing Committee on Nutrition (SCN), conducted an inventory of specific food security
indicators which may contribute in future to assessment work. This Task Force is co-chaired by
FAO and WFP.
4.3.4 Guidance on Profiling Internally Displaced Persons12
In June 2004, the IASC Working Group agreed to develop a framework and related guidance to
help systematize information collected on internally displaced persons (IDPs). The resulting
provisional guidance document, dated November 2007, proposes that core data on the number,
age and sex (even if rough estimates) and location of IDPs in a country be collected through
“profiling” exercises. These exercises mainly aim to obtain more consistent estimates of IDP
numbers and thus are mainly demographic rather than needs assessment tools; however, they
could also be used to collect information on urgent humanitarian and protection needs, as well
as on the causes and patterns of displacement.
It is intended that IDP profiling should complement, rather than replace, sectoral needs
assessments e.g. on food security and nutrition, shelter and protection. Indeed, although
evidence suggests that in many situations displaced persons face increased vulnerability, it is
understood that IDP status alone does not necessarily signify having unmet humanitarian needs.
The provisional guidance provides a listing of methods for obtaining reliable IDP population
numbers and distinguishing between IDPs and members of the local (host) community (e.g.
flow monitoring, household surveys, dwelling and head counts, and registration exercises). It
also identifies common problems that may arise during profiling exercises, and proposes several
‘indicators’ to help determine when IDPs may no longer be considered to be displaced. The
“minimum data requirements” for each assessment method outlined in the listed methods do not
specify which key indicators should be collected to determine protection and humanitarian
needs.
12 Although assessing the needs of IDPs represents a cross cutting concern, the Guidance on Profiling IDPs is
included under the cluster/sector-specific tools as it is primarily aimed at gathering population data, broken
down by geographic factors. See the guidance document developed by the Norwegian Refugee Council’s
Internal Displacement Monitoring Centre and OCHA’s Displacement and Protection Support Section at:
www.unhcr.org/cgi-bin/texis/vtx/refworld/rwmain?docid=47b5ad3a2.
21
The selection of a particular profiling method is to be based on the actual circumstances (e.g.
security and access levels) as well as the availability of resources. National authorities are
expected to lead the profiling with the support of international organizations. When these
authorities do not act, the UN Resident and/or Humanitarian Coordinator would undertake
profiling in consultation with the wider humanitarian community. The guidance advises that a
lead agency be identified, which will lead the exercise and with support of specialists, determine
the best method to use. The guidance recommends that data sharing agreements should be
worked out in advance of the exercise as well as how data will be analyzed. The guidance does
not deal with how differing estimates will be handled as the fundamental starting point of the
exercise is that it would take place as a joint activity with all parties concerned. Future field
exercises should ensure that all actors who collect data agree on the final goal, to arrive at a
“commonly agreed” number of IDPs.
Key Indicators: The core data set to be collected includes the total number of IDPs
(disaggregated where possible by age and sex) and location of IDPs. When compared with the
total population in a country or region, (i.e. used as the ‘numerator’ with total population as the
denominator) this information is useful for comparing severity between geographic areas.
However, for this number to be used as the ‘denominator’ of need, and for a more reliable
indicator of severity, further information would need to be collected on the number of IDPs who
actually require some type of humanitarian assistance. This remains a future challenge for data
collection on IDPs, although IDP Profiling is sometimes done in conjunction with Needs
Assessments. Reference is made to the IDP Protection Handbook being prepared to assist with
analysis of protection gaps faced by IDPs.
4.3.5 Health Resources Availability and Mapping System (HeRAMS)
The Health Cluster is currently designing this new tool whose primary objective is to allow for
better coordination of the health response in a humanitarian situation and support informed-
based decision making in this sector.
It is designed to supplement weakened, disrupted or non-existent routine health information
systems from the early phase of the crisis through the recovery and development stages. It has in
addition been adapted to prepare the ground for the rehabilitation or upgrading (when/if needed)
of pre-existing information systems and should be interrupted as soon as this is achieved.
HeRAMS provides a comprehensive inventory of available health resources in an assessment
mode or, when repeated over time, as an M&E tool.
HeRAMS has been extensively pilot tested in Darfur and will be further refined and
implemented in other crisis situations.
Key Indicators: The tool generates indicators on health resources availability, in terms of
services, human resources or infrastructures and allows for a detailed analysis of the situation to
be made from various angles (geographical comparison of resource availability, identification of
critical gaps, identification of trends, etc). It does not take into consideration the access
dimension. It also allows predictions of the evolution of the situation as a result of important
changes such as the arrival/withdrawal of key partners, and its effect on resource availability.
Depending on the context and the type of use, indicators can be simplified. For example, if the
situation does not permit an exhaustive collection of the services provided, the tool may look at
sub-sectors (e.g. Maternal & Newborn Health, General Clinical Services, etc.) covered by each
partner, which may already permit the identification of response gaps.
22
4.3.6 Protection Monitoring/Assessment Systems
The global Protection Cluster Working Group (PCWG) undertook an extensive mapping and
analysis of existing protection assessment and monitoring tools in 2007. The results confirm
that there is an urgent need for greater standardization, coordination and, where possible,
consolidation of assessment tools and practices.
The PCWG, together with the Cluster Working Group on Early Recovery (CWGER), has
already developed an analytical framework intended to facilitate analysis of protection gaps in
situations of internal displacement (Assessment for Action, PCWG, 2008). At present the
PCWG’s strategy with regard to assessments has three aspects:
1. To work with partners to mainstream protection within other sectors/clusters, including as
regards the development of assessment tools and practices. This includes, for example,
CCCM and Early Recovery Clusters.
2. To support the development of standardized tools and guidance on multi-sectoral rapid
needs assessments, with a strong protection component. The development of such
guidance could facilitate the streamlining and coordination of rapid assessments at the
field level, eliminate some of the existing overlaps and maximize the use of limited
resources.
3. To develop standardized guidance on rapid protection assessments. This includes the
identification of information requirements and development of guidance on methodology,
tools (such as forms and Standard Operating Procedures), and possibly software support.
This ongoing work will be closely coordinated with partners to avoid overlaps and ensure
complementarities with other tools and processes. Separate tools and guidance also exist
and/or may be developed for specific areas of responsibility within the PCWG, such as
child protection, GBV, mine action, land, housing and property, and rule of law.
4.3.7 Shelter Assessment Tools
Since May 2008, the Emergency Shelter Cluster has been developing a post-disaster shelter
needs assessment toolkit, the Local Estimate of Needs for Shelter and Settlement (LENSS) to be
used since the onset of a disaster. The current draft is designed to collect information for
decisions on shelter and settlement needs at local level13 and to be used by non-technical
specialists. LENSS assumes that a central information management function is available and
scaleable from the local level to the national level.
This tool kit attempts to consolidate pre-existing data, like census, together with data
immediately collected. The tool kit does not, however, prescribe or describe how to conduct
those activities. It is intended “to generate data for both urgent shelter interventions that save
lives and early recovery interventions that save settlements”.
LENSS tool kit includes:
� A glossary;
� A framework and a comprehensive ten-pages data collection plan specifying possible data
sources for each information topic;
� A quality control guide;
13 Locality is the term used in the document and is defined as a distinct population cluster (also designated as
inhabited place, populated centre, settlement), including fishing hamlets, mining camps, ranches, farms,
market towns, villages, towns, cities... Large urban municipalities are often divided into units.
23
� A set of 11 data collection sheets (35 pages Q&A) for needs assessment during a disaster:
Affected state, Who What Where, Census, First hand observation, Locality, Assisting
actors, Story page template, Registration, Damage assessment, Hazard assessment, Focus
group.
The end product is a summary for every affected locality covering the following:
� Geographic location of affected communities;
� Pre-disaster population and housing in those localities;
� The impact of the disaster on shelter and settlement in those localities;
� The initial response of affected households in/from those localities, for example where
they moved;
� The preferences of those affected households in terms of whether they want to stay return
or relocate.
Key Indicators: Using the SPHERE Minimum Standards, needs are assessed for the following
outcomes:
1. Shelter;
2. Basic goods and supplies to meet personal hygiene needs, prepare and eat food, provide
thermal comfort, build, maintain or repair shelters;
3. Distance or protection from security threats, threats from disease, or other natural hazards
and safety hazards;
4. Access to livelihood support activities;
5. Return to country/settlement of origin where possible or dispersed settlements;
6. Access to water and sanitation services and social facilities;
7. Freedom of movement in/out of settlements;
8. Land and property ownership and/or user rights;
9. Access to information about and participation in shelter and settlement outputs;
10. Attention to the needs of persons most frequently, but not consistently at risk in disasters
(female heads of households, persons with disabilities, refugees, single parents,
unaccompanied children and elders).
4.3.8 WASH Cluster Survey Tool
Learning from recent attempts at country level to develop needs assessment surveys led the
Global WASH Cluster to develop not prescriptive 'tools' for needs assessment, but a toolkit of
indicators. The toolkit includes a range of indicators from which to develop a selected, county
level, context specific set of indicators and associated needs assessment format. This approach
aims to ensure ownership of specifically adapted and context specific formats, of the data
collected and the results for more effective humanitarian response.
The WASH Cluster Survey Tool is a database of indicators which can be used to develop (i) a
Rapid Assessment Tool (RAT); (ii) a Comprehensive Assessment Tool (CAT); or (iii) a
Monitoring Tool. It is intended to help WASH Cluster agencies identify critical problems/risks
faced by the populations in disaster situations. Using indicators selected from the WASH
Survey Tool database by the WASH Cluster agencies in the field, data are collected from the
24
field in order to facilitate a rapid comparison of the severity of needs, by each WASH sub-
sector.
The WASH Survey Tool is part of the Global WASH Information Management Project, which
is being implemented by the International Rescue Committee (IRC) and OXFAM with support
from UNICEF and the participation of WASH agencies in reviewing the overall structure of the
tools and the indicators used for the WASH Survey database.
Data collection methods and timing: Data collection for the WASH Survey Tool uses a mix of
quantitative and qualitative methods and does not include specific guidance on sampling. As
some of the data on impact-type indicators is gathered through a household survey, it is likely to
take some days to complete at larger sites or for a population scattered over several sites. The
information is intended to be collected by WASH specialists working in their various agencies.
The data are captured either in Excel or into a simple version of Access, in order to generate
various types of reports according to severity of need. A simple Excel template has been
designed to facilitate rapid compilation of information on where individual WASH agencies are
working, what they plan to do and the approximate schedule of planned actions. The data
collation and analysis tool will automatically compile this data to produce a summary who-
what-where-when report and an analysis of gaps (i.e. where there are high levels of need but no
agency responding), in order to make critical programming and resource allocation decisions.
These can then also be used to develop maps in order to more effectively communicate response
and specific gaps identified.
The CAT is likely to be carried out some days/weeks after a rapid-onset disaster once priority
locations for intervention have been defined through the IRA Tool (multi-sectoral in nature and
aimed at generalists) and/or the RAT tool (aimed at WASH specialists). However, the Survey
Tool is designed to be used at any phase of the emergency and includes templates for rapid and
comprehensive assessments, as well as periodic and regular monitoring, all which can all be
customized at the field level.
Key Indicators: The indicators are mainly based on SPHERE Standards and the ACF
Handbook.14 Two types of indicators are measured with the CAT:
1. Conditions at the location being assessed, in terms of the situation of the population and
the status of WASH conditions (environmental sanitation and access, coverage and use of
WASH facilities and services). These are referred to here as impact-type indicators and
are used in the monitoring tool to track the impact of the response; and
2. Estimated needs/proposed interventions in terms of the delivery of WASH services and
facilities required in order to meet defined targets and create acceptable levels of
availability, access and use of WASH facilities and services.
Classification: Data for each impact-type indicator of the CAT form is scored against a scale
that ranges from an acceptable situation at one end to a potentially life-threatening situation
requiring urgent action at the other. These scales may be modified at national level to create a
context-appropriate tool as a disaster-preparedness measure. The data collation and analysis tool
can be configured to give higher weighting to selected indicators in any sub-sector and
individual indicators can also be given an override capacity such that the final score for the sub-
sector will not be less severe than indicated by the overriding indicator. In all cases, the
'automatic' analysis provided by the data collation and analysis tool would be verified and
14 Action Contre la Faim (2005): Water, Sanitation and Hygiene Manual for Populations at Risk
25
interpreted through discussions of WASH staff at field and coordination levels to ensure it is
appropriate.
Next Steps: The WASH Cluster information management tools were presented to WASH
Cluster agencies in Geneva on 28th February 2009 for final feedback. A roster of Information
Managers for deployment to emergencies is being organized and training for initially selected
candidates will be delivered on 9-11 March 2009 in Geneva. The tools will be piloted in an
(acute) emergency in the near future.
4.3.9 The Livelihood Assessment Tool-kit (LAT)
FAO and ILO issued a working draft of this tool-kit in October 2007 for use in assessing the
impacts of disasters on people’s livelihoods, and the capacities and opportunities for recovery.
The draft identifies the following three technical elements:
1. Livelihood Baseline (LB) undertaken pre-disaster to provide background information for
a range of response instruments, and lasting 2-6 weeks;
2. Initial Livelihood Impact Appraisal (ILIA) to be completed within the first 10 days after a
disaster to support Flash Appeals; lasting 1-7 days; and
3. Detailed Livelihood Assessment (DLA), usually conduced within 90 days after a disaster
to support revised Flash Appeals or donor recovery conferences DLA; lasting 30 days
The tool-kit is currently geared towards post natural-disaster situations, and parts of it were
applied and adapted in 2007-2008 following natural disasters in the Philippines, Bangladesh and
Bolivia and as input to disaster preparedness efforts in Pakistan. The lessons learned on the use
of LAT and the potential for extending its application to conflict and post-conflict situations
were discussed at an interagency meeting in February 2008. This will feed into the work of the
Cluster Working Group on Early Recovery (CWGER) Technical Working Group on
Livelihoods and Economic Recovery established in July 2007.
Key Indicators:
� % of households losing employment due to disaster;
� % of households undertaking various coping strategies (including looking for work) after
disaster; and
� Assets lost at household and community levels (physical, human, financial, social and
natural) after disaster.
4.3.10 Household Economy Approach (HEA)
The Household Economy Approach is a livelihoods-based framework for analysing the way
people obtain food, non-food goods and services, and how they might respond to changes in
their external environment, shock or hazard. It aims to capture the situation of different wealth
groups in different livelihoods zones. This analytical framework can be used in a wide variety of
different settings and in recent years, the approach has also been used in emergency situations
(1999 drought in Pakistan, 2004 Tsunami in Asia, 2005 Kashmir earthquake in Pakistan and the
2006 conflict in Lebanon).
In a classic HEA assessment, the procedure is to build the baseline first, then conduct the
outcome analysis to plan the response as a separate exercise. In rapid assessments, it is usually
necessary to combine all the steps into one single assessment process. However, no single
26
“Rapid HEA” approach currently exists and, for the time being, only tips and issues for
consideration based on a variety of lessons have been produced.
The Practitioners’ Guide to HEA15 recommends four major considerations for rapid HEA
assessments:
1. The most important requirement is to use highly competent staff: “the more rapid the
HEA-based assessment, the more experienced the assessment leader needs to be”;
2. To make good use of existing secondary data in order to focus primary data collection on
understanding the impact of the disaster; a check list is provided of possible sources of
secondary information in emergencies and issues to consider when reviewing secondary
data to understand the baseline/pre-disaster situation;
3. To use rapid rural appraisal methods rather than structured questionnaires, as time and
access constraints typically limit one’s ability to prepare an adequate questionnaire, to
sample properly and to interview the large number of households usually needed for a
representative sample; and
4. Considering the fluidity of the context, it is recommended that analysts provide scenario-
based projections and recommendations, being very clear about what variables are being
taken into account in the analysis and what their different values are under the different
conditions.
15 Document: www.eldis.org/assets/Docs/35732.html
27
V Analytical Frameworks for Consolidation of Information
The frameworks detailed in the following paragraphs are not the only existing frameworks.
Some go further into response planning than others, e.g. the Recovery Framework associated
with the PDNA project and Transition Results Framework associated with the PCNA. IPC has a
very generic element of Response Analysis. The Recovery framework intends to cover early
recovery requirements in its first iteration and be ready before the revision of a flash appeal.
Also, the guidance on Profiling IDPs developed a framework for durable solutions aiming at
enabling humanitarian organisations to assist the relevant authorities and non state actors to take
on the responsibility to provide solutions to IDPs, to ensure their protection and assistance.
5.1 Integrated Food Security Phase Classification (IPC)16
The IPC was developed by the FAO Food Security Analysis Unit (FSAU) in Somalia in 2004 to
organize and present information on food security, nutrition and livelihoods collected through
different assessment methods. The IPC maps countries and the regions within according to five
phases of food security based on the “convergence of evidence” from a range of “reference
characteristics” which include outcome and process indicators. The approach does not impose
any specific data collection methods, but uses information from all methods, taking into account
the reliability of the method or data sources. A key differentiating feature is that every piece of
evidence used to determine the phase classification is assigned a reliability score from 1-3 with
1 rated as “very reliable”. This is used to include a statement on the overall confidence of the
situation analysis.
The IPC is currently being implemented in a number of different countries, under the guidance
of a Steering Committee.17 This group submitted a proposal to donors to conduct iterative
development and lessons-learning activities for a common food security classification system in
25-30 countries over a multi-year period. In 2008, with funding by CIDA, DFID and ECHO,
pilots are underway in 5 East African countries, as well Nepal and Tajikistan. In addition,
awareness raising or training activities have been conducted in nearly 30 countries.
The IPC primarily focuses on situation analysis, but provides a “strategic response framework”
which identifies broad categories of the types of assistance that may be applicable to mitigate
immediate problems, support livelihoods and address underlying causes.18
Key Indicators: Multiple indicators of outcomes, processes, welfare and livelihoods are drawn
together under the heading of “Key Reference Outcomes”, which are assigned absolute
(quantitative) and relative reference thresholds depending on the 5 phases. Also, different
reference outcomes are included in each phase. The key indicators for the “Acute Food and
Livelihood Crisis” are:
� Crude Mortality Rate
� Nutritional status: Wasting & Stunting
� Acute Malnutrition (w/h <-2 z-score)
16 The IPC was previously called the Integrated Food Security and Humanitarian Phase Classification; a
technical advisory group recommended deleting the reference to “humanitarian”, in recognition that the
expertise applied is mainly in the food security or nutrition field. 17 The IPC SC currently comprises: CARE International, the EC Joint Research Centre (JRC), FAO, FEWS
NET, Oxfam GB, Save the Children US and UK and WFP. In 2008, this group may be expanded to include
representatives from regional organizations. 18 For further information, see http://www.ipcinfo.org/ipc_ecard_04.htm#1
28
� Food Access/Availability (Kcal ppp day)
� Dietary Diversity
� Water Access/Availability (liters ppp day)
� Destitution/Displacement
� Civil Security Coping strategies
� Livelihood Assets
Classification: The IPC classifies the overall severity of food (in)security in five main phases,
ranging from Phase 1 A and B (generally food secure) to Phase 5 (famine/humanitarian
catastrophe).
5.2 Nutritional Information in Crisis Situations (NICS)
The UN Standing Committee on Nutrition issues the NICS report quarterly, based on
consolidated information from nutrition and mortality surveys submitted (voluntarily) by UN
agencies and NGOs. These reports are aimed to cover populations affected by a crisis, such as
refugees, internally displaced populations and resident populations. They are designed to
provide information over time on key outcome indicators from emergency- affected
populations, play an advocacy role in bringing the plight of emergency affected populations to
the attention of donors and humanitarian agencies, and to identify recurrent problems in
international response capacity.
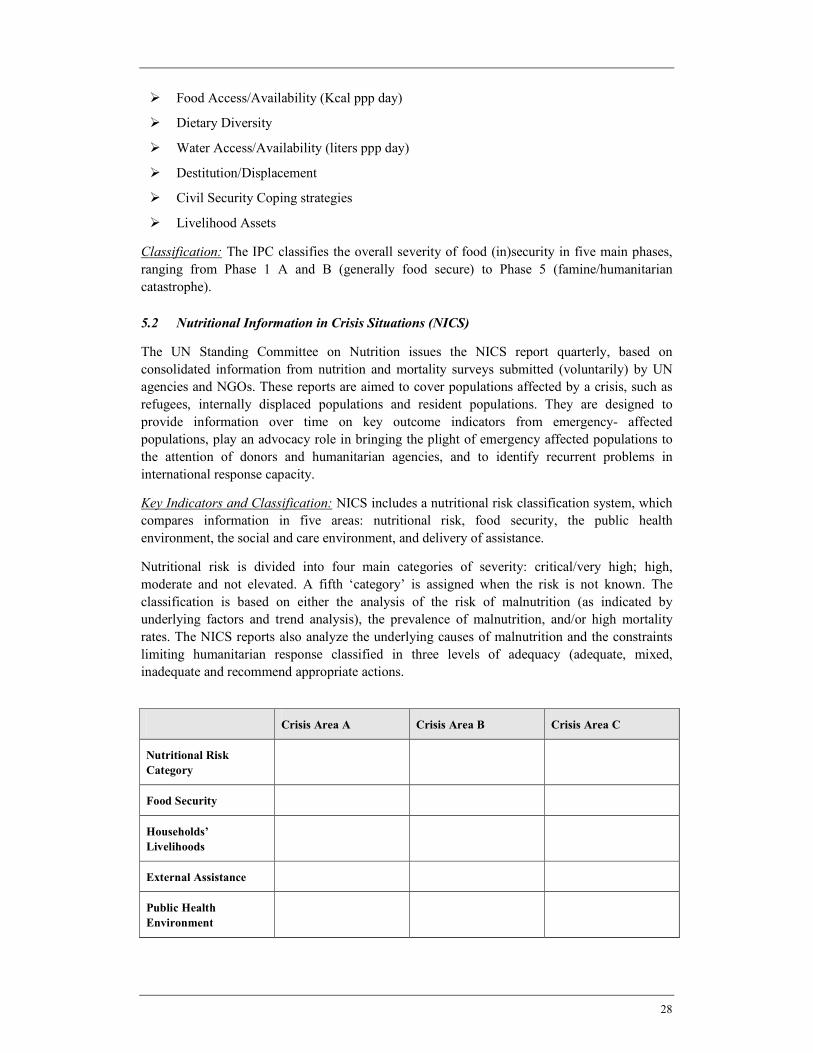
Key Indicators and Classification: NICS includes a nutritional risk classification system, which
compares information in five areas: nutritional risk, food security, the public health
environment, the social and care environment, and delivery of assistance.
Nutritional risk is divided into four main categories of severity: critical/very high; high,
moderate and not elevated. A fifth ‘category’ is assigned when the risk is not known. The
classification is based on either the analysis of the risk of malnutrition (as indicated by
underlying factors and trend analysis), the prevalence of malnutrition, and/or high mortality
rates. The NICS reports also analyze the underlying causes of malnutrition and the constraints
limiting humanitarian response classified in three levels of adequacy (adequate, mixed,
inadequate and recommend appropriate actions.
Crisis Area A Crisis Area B Crisis Area C
Nutritional Risk
Category
Food Security
Households’
Livelihoods
External Assistance
Public Health
Environment
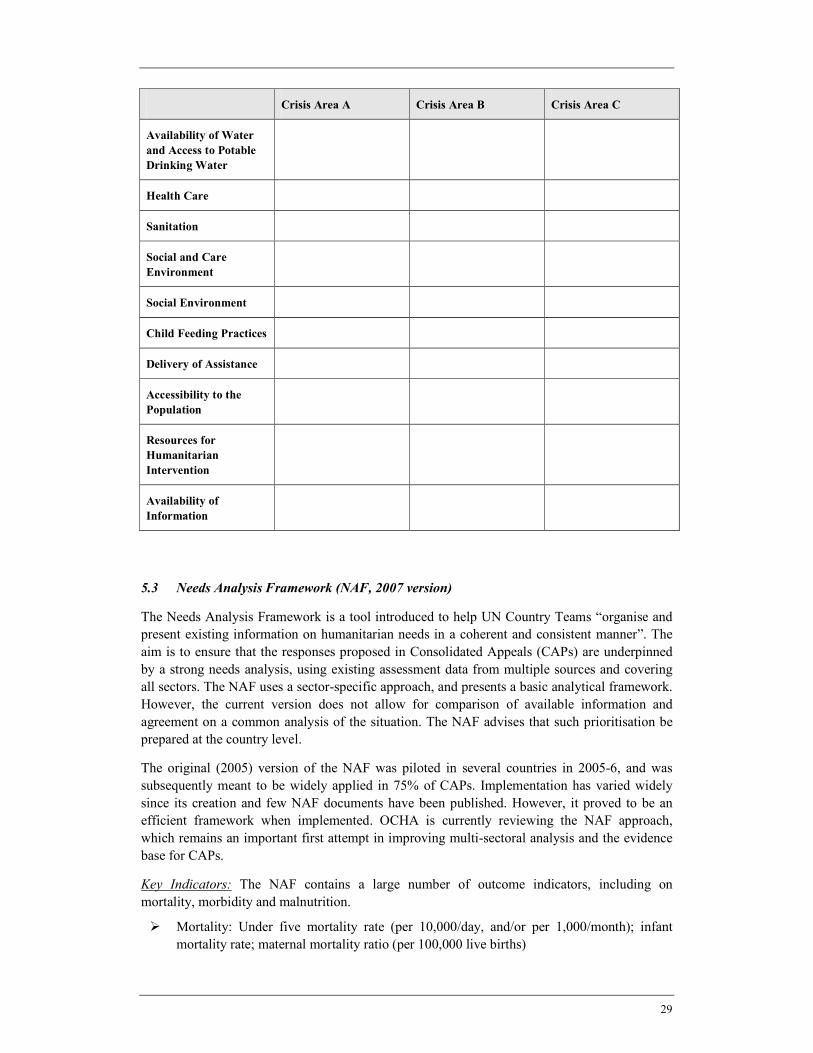
29
Crisis Area A Crisis Area B Crisis Area C
Availability of Water
and Access to Potable
Drinking Water
Health Care
Sanitation
Social and Care
Environment
Social Environment
Child Feeding Practices
Delivery of Assistance
Accessibility to the
Population
Resources for
Humanitarian
Intervention
Availability of
Information
5.3 Needs Analysis Framework (NAF, 2007 version)
The Needs Analysis Framework is a tool introduced to help UN Country Teams “organise and
present existing information on humanitarian needs in a coherent and consistent manner”. The
aim is to ensure that the responses proposed in Consolidated Appeals (CAPs) are underpinned
by a strong needs analysis, using existing assessment data from multiple sources and covering
all sectors. The NAF uses a sector-specific approach, and presents a basic analytical framework.
However, the current version does not allow for comparison of available information and
agreement on a common analysis of the situation. The NAF advises that such prioritisation be
prepared at the country level.
The original (2005) version of the NAF was piloted in several countries in 2005-6, and was
subsequently meant to be widely applied in 75% of CAPs. Implementation has varied widely
since its creation and few NAF documents have been published. However, it proved to be an
efficient framework when implemented. OCHA is currently reviewing the NAF approach,
which remains an important first attempt in improving multi-sectoral analysis and the evidence
base for CAPs.
Key Indicators: The NAF contains a large number of outcome indicators, including on
mortality, morbidity and malnutrition.
� Mortality: Under five mortality rate (per 10,000/day, and/or per 1,000/month); infant
mortality rate; maternal mortality ratio (per 100,000 live births)
30
� Morbidity patterns: prevalence of the most common diseases in order of importance;
HIV/AIDS prevalence;
� Malnutrition: prevalence of underweight children under five years of age; Weight/age;
rates of acute, severe and chronic malnutrition and oedema; proportion of population
below minimum level of dietary energy consumption.
Classification: The NAF does not provide any method for classifying overall or sectoral
severity, although this was originally proposed when it was developed in 2003. However,
country teams are now required to prioritize projects in CAPs, although guidance is currently
limited (see box for examples, including DRC’s severity classification approach). The 2008
CAP document highlights the following basic statistics, which can be used to compare the
relative severity of the CAP countries in terms of their underlying vulnerability:
� Infant, Children under 5 and maternal mortality ratios;
� % of population undernourished;
� Number and % of population displaced;
� Number of refugees in country and abroad; and
� ECHO Global Needs Analysis score and UNDP Human Development Index (HDI) score
and rank.
Prioritization Methods Used in the 2008 CAP Documents:
The 2008 CAP for DRC is widely recognized as a best practice example of prioritization of
acute humanitarian needs as the basis for the country’s humanitarian strategy and subsequent
funding appeal. Needs assessment information was compiled from all districts of concern and
each district was ranked according to the severity of needs in 6 priority sectors: IDPs, returnees,
protection, sexual and gender-based violence (SGBV), malnutrition and health. The final
product is a consolidated map of all districts, clearly displaying the geographical areas with the
most urgent needs.
Other 2008 CAPs (e.g. CAR, Iraq) have used different prioritization methods, assigning points
to various prioritization criteria established by the humanitarian country team. Projects are then
classified as high, medium or low priority based on the number of prioritization criteria they
meet.
5.4 Post-Disaster Needs Assessment (PDNA)
The PDNA project is a cooperative effort between United Nations Agencies – led by UNDP as
the Chair of the Cluster Working Group on Early Recovery (CWGER), the World Bank and the
European Commission to develop a Practical Guide to a Multi-Stakeholder Post-Disaster Needs
Assessment (PDNA) and the Recovery Framework (RF). The main aim of the project is to
“support effective transition from relief to development by improved capacity and coordination
at national and international levels for the conduct of recovery-oriented needs assessment and
recovery planning.” The project aims to address not only the need for effective recovery
assessment and planning at the national level, but also the how-to of connecting national plans
with effective means of delivering recovery programs at the local level.
31
The PDNA guide and Recovery Framework seek to integrate two of the main strands of
recovery-oriented needs assessment, i.e. the determination of programmatic needs in support of
human recovery with the evaluation of damages and losses caused by the disaster, to ensure that
recovery planners have a picture as complete as possible when designing recovery interventions
and prioritizing between sectors and programs. The PDNA seeks to integrate the use of the
Damage and Loss Assessment (DaLA) methodology developed by UN ECLAC with the use of
sectorally comparable tools designed and used by UN sector leads, IASC humanitarian clusters,
the World Bank and other recovery actors for the identification of human recovery needs, thus
enhancing compatibility and avoiding duplication.
A PDNA is foreseen to commence as soon as possible after the disaster onset, ideally within the
first weeks and following the more immediate, relief-oriented, assessments. A first objective for
the PDNA is to support the elaboration of an initial iteration of the Recovery Framework, i.e. in
the shape of an Early Recovery Strategic Framework, in time for the revision of a humanitarian
flash appeal - normally within five to six weeks following the onset of a disaster.
The project reviewed a representative set of existing assessment methods and information
management tools used to determine recovery needs by different stakeholders across the
recovery timeline (including humanitarian and early recovery, recovery and developmental
elements) and produced two pilot software tools to support the assessment process together with
a conceptual guide to recovery-oriented needs assessment. One finding was that because of the
varying scope, timing and rigor of assessments (many of which are country-specific and have
been endorsed by the respective governments), the development of the recovery framework will
not be based on a single integrated assessment method. However, the need was recognized to
build complementarity between the assessment methods used by the International Financial
Institutions, which focus mainly on macro-economic issues (primarily the ECLAC Damage and
Loss Assessment), and those used by UN agencies and NGOs, which are human-development
oriented in order to develop a shared understanding of the overall impact of natural disasters.
Following major consultative meetings held in May 2008 in Brussels and in January 2009 in
Geneva, the next project outputs include development of (a) agreement on protocols of
cooperation between the United Nations, the World Bank and the European Commission (e.g.
covering joint missions and capacity building); (b) a practical guide to multi-stakeholder post-
disaster needs assessment and the recovery framework; and (c) applying, field-testing and
conducting training on this framework in high-risk countries with national and international
recovery partners. In addition, work would be undertaken to adapt sectoral assessment methods
that are relevant to PDNA to enable them to better determine early recovery needs in each
sector.
As currently envisioned, the recovery framework involves a joint analysis of information from
assessments of human recovery needs and economic damages and losses and related response
options, based on agreed recovery sectors and expected outcomes. It would evolve over time;
the first version would be prepared drawing on information from rapid humanitarian
assessments and other sources in the immediate days post-disaster. More detailed recovery-
oriented assessments should begin as soon as possible after the disaster to elaborate a first
iteration of the Recovery Framework - the Early Recovery Strategic Framework - for inclusion
in the revised Flash Appeal. The Framework would establish and help prioritize activities
required to return to the pre-disaster development plans for the affected area, including disaster
risk reduction measure to mitigate future vulnerability.
32
The details of the framework, including reliance (if any) upon core indicators of need, are being
further elaborated and will be discussed at a multi-stakeholder consultation within the coming
year.
5.5 Post Conflict Needs Assessments (PCNAS)
PCNAs (also sometimes called Joint Needs Assessment or JNA) are typically coordinated by
the World Bank and UNDG with multiple stakeholders (UN agencies, national government,
donor countries and regional institutions) in countries emerging from conflict. They represent a
planning process for “conceptualizing, negotiating and financing a common shared strategy for
recovery and development in fragile, post-conflict setting[s]” rather than a single assessment
method. The PCNA process currently involves three main steps:
First, a ‘pre-assessment’ or shared situation and context analysis is conducted to develop the
PCNA concept note. Depending on the available time, this involves consultations among key
stakeholders, review of pre-existing information, and in some cases the development of a
database containing an inventory and bibliography of baseline data and essential documents.
The aim is to identify the main causes and characteristics of the conflict; risks and trends e.g. in
access and insecurity; key population groups, institutions or regions that may need to be
prioritized, e.g. in terms of receipt of benefits or reconstruction efforts; and the capacity of
national (state and non-state) actors and institutions.
Second, sectoral field and desk assessments are conducted by national and international
technical experts (including from the UN and the World Bank) for each priority area (called
‘clusters’). The identified needs are prioritized according to criteria agreed beforehand by the
stakeholders, which should reflect how the activity contributes to stabilization of peace and how
it links with the government’s priorities. No specific guidance is currently provided on how to
conduct these assessments.
Finally, the resulting information from all the “clusters” is consolidated and used to produce a
prioritized and costed overview of the needs, which is encapsulated in a 3-5 year recovery
action plan - the Transitional Results Framework (TRF). A PCNA tool kit has recently been
developed after a year-long process to consolidate the lessons learned from PCNAs conducted
between 2002 and 2006.19
19 As of December 2008, PCNAs had been undertaken in Iraq, Liberia, Haiti, Sudan (North and South), Darfur,
Somalia and Georgia. For further information see http://www.undg.org/index.cfm?P=148
33
VI Other relevant Initiatives
6.1 Global Risk Identification Program (GRI-P)
This seeks to develop an improved evidence base for natural disaster risk management by
developing common tools and standards for damage and loss assessments. Activities will be
undertaken to standardize terminology used (e.g. missing, affected, disaster) and analyze
historical loss/damage data to help predict future risks and assess vulnerability.
GRIP was launched in June 2007 as a 5 year, US$ 20 million, multi-partner/donor activity,
including EU, DFID, USAID, ISDR, the World Bank, IFRC and the Inter-American
Development Bank. The funds will be used to establish Disaster Loss Observatories in 30
countries, which will be involved in real-time data collection as well as historical analysis, e.g.
to compile a National Risk Atlas.
A key product will be the development, by mid 2009, of a “Global Update” or Risk Index which
ranks countries according to their combined risks of 6-10 hazards: volcanic eruptions,
earthquakes, floods, tsunamis, drought, landslides and tropical storms. This will link and update
previous work on the Risk Index, including by Columbia University on Global Hotspots.
This effort is closely linked to the Post-Disaster Needs Assessment (PDNA) work, as it
contributes to the improved understanding of the disaster impact, from which agencies develop
their estimates of macro-economic and human/social losses and related needs.
6.2 Protection of Conflict-Induced IDPs: Assessment for Action
The Protection Cluster Working Group (PCWG), together with the Early Recovery Cluster
Working Group, published a provisional version of an analytical framework entitled “Protection
of Conflict-Induced IPS: Assessment for Action” in February 2008. The framework is the result
of a collaborative effort involving among others UNHCR (coordinator), OCHA, WFP,
UNICEF, UNDP, OHCHR, UNMAS, IOM, ICVA, NRC and others. The framework is
currently being field-tested and a final version will be published in 2009.
The framework is composed of two parts. The first contains a framework for analysis, which
includes a comprehensive checklist covering 11 key protection areas, while the second provides
guidance on participatory methodologies, aimed at facilitating dialogue and gathering of
information from individuals and communities. The framework is not intended as a primary
data collection tool but rather as a framework for analysis and the identification of protection
gaps following other assessment or profiling exercises.
6.3 DevInfo in Emergencies
EmergencyInfo is a decision support system, based on DevInfo database technology that seeks
improve the response of humanitarian actors to emergency situations. It combines the advanced
data access and presentation features of DevInfo with new data capture technologies.
EmergencyInfo aims to bridge information gaps within the first 72 hours of an emergency and
provide support for rapid data collection, situation assessment, standard monitoring reports and
disaster preparedness.
34
6.4 UNHCR’s Global Needs Assessment (GNA)
In 2008, as part of a Result-Based Management and integrated change initiative, UNHCR began
a process of identifying unmet needs of people of concern to the agency, and how much it
would cost to fulfil all these needs. This Global Needs Assessment is not a new assessment tool
or method, but draws on the results of the Strengthening Protection Capacity Project’s approach
to identify unmet needs through consultation with all stakeholders, as well as statistics compiled
through UNHCR’s monitoring system (Standards and Indicators system). The GNA was piloted
in eight countries in 2008 and will be applied worldwide in 2009 to inform the agency’s 2010-
2011 biennial planning process. The goal is to develop a comprehensive, prioritized plan and
related budget for UNHCR or its partners to meet their responsibilities.20
20 For more information, see www.unhcr.org/gna.
35
VII Major Findings and Recommendations
7.1 Major Findings
The following findings are primarily based on a review of the methods and the scope of
information that the various needs assessment initiatives aim to capture. Additional information
came from interagency consultations.
Coordination
� There are a large number of initiatives currently underway, not only to design
assessments, but also repository data bases, reporting mechanisms etc.
� Many of the new assessment initiatives are undergoing a similar design process, often
with a limited analysis of the underlying information collection requirements and linkages
with Information Management considered afterwards. Subsequently, some questionnaires
are being shortened and re-structured, contributing to higher costs and longer
development processes.
� In addition, a number of parallel initiatives are also underway at the regional and country
levels, which could benefit from greater coordination with global level initiatives.
� Limited consultation among these recent initiatives could result in possible duplication,
higher costs, and increased assessment fatigue, both among populations of concern as
well as humanitarian actors.
Timeframe
� Despite an abundance of detailed information collected, further agreement is needed on
the type and depth of information required at each phase of the crisis. At the initial phase,
when only limited information may be available, maximizing the use of pre-crisis
information and baselines is highly important.
� Effective contingency planning and preparedness measures identify and map key
vulnerabilities and risks. However, this information does not systematically feed into
rapid initial needs assessments once a crisis has occurred.
Standardisation
� Most of the initiatives and related guidelines do not include definitions of key terms, such
as ‘affected’, ‘homeless’ etc. This makes it difficult to differentiate between all people
living in affected areas versus those who are in need of specific types of humanitarian
assistance.
� Key indicators used by the various tools are indicated throughout the mapping paper;
however, there is limited standardization across sectoral indicators, as also found in the
CAP and Flash Appeal review. The large number and variety of indicators generated by
needs assessments and used in CAPS/Flash Appeals, hamper enhanced aggregation of
data, the prioritization of needs across sectors, and comparability of severity between
different crises.
� Core sets of indicators per cluster/sector have not yet been agreed upon.
� Some of the tools being developed are incorporating a severity ranking approach within a
given sector, although currently no cross-sectoral severity ranking approach with a well
defined methodology exists.
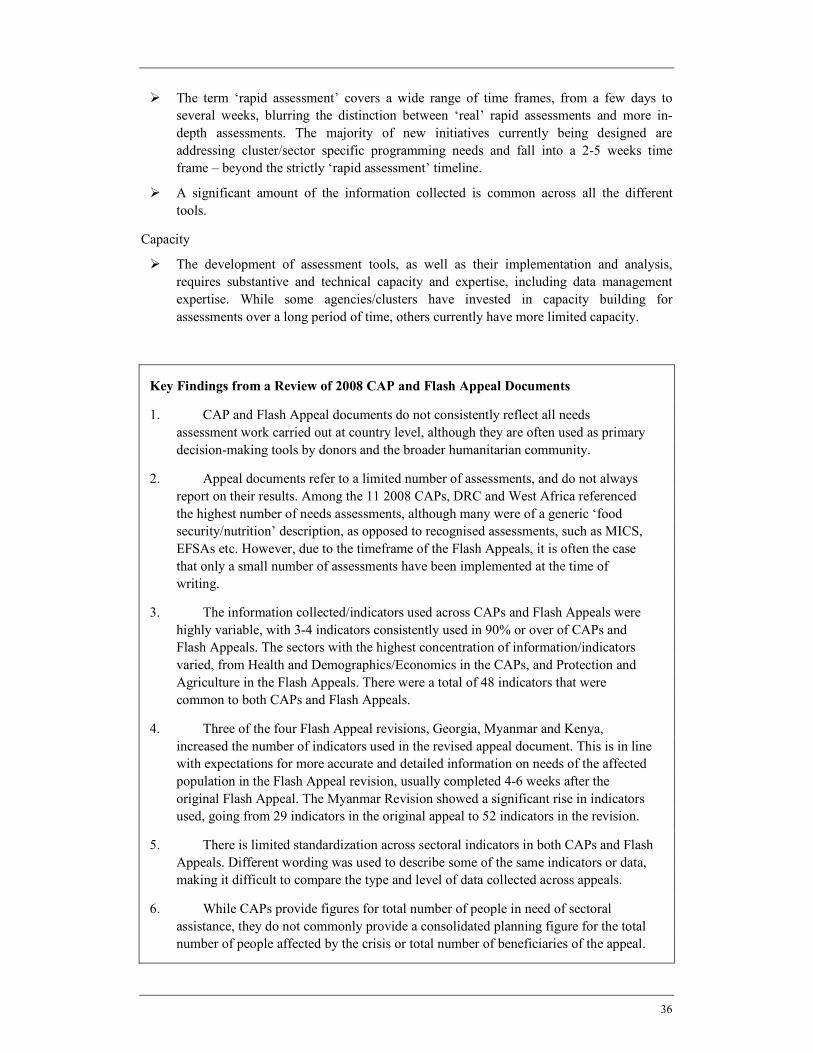
36
� The term ‘rapid assessment’ covers a wide range of time frames, from a few days to
several weeks, blurring the distinction between ‘real’ rapid assessments and more in-
depth assessments. The majority of new initiatives currently being designed are
addressing cluster/sector specific programming needs and fall into a 2-5 weeks time
frame – beyond the strictly ‘rapid assessment’ timeline.
� A significant amount of the information collected is common across all the different
tools.
Capacity
� The development of assessment tools, as well as their implementation and analysis,
requires substantive and technical capacity and expertise, including data management
expertise. While some agencies/clusters have invested in capacity building for
assessments over a long period of time, others currently have more limited capacity.
Key Findings from a Review of 2008 CAP and Flash Appeal Documents
1. CAP and Flash Appeal documents do not consistently reflect all needs
assessment work carried out at country level, although they are often used as primary
decision-making tools by donors and the broader humanitarian community.
2. Appeal documents refer to a limited number of assessments, and do not always
report on their results. Among the 11 2008 CAPs, DRC and West Africa referenced
the highest number of needs assessments, although many were of a generic ‘food
security/nutrition’ description, as opposed to recognised assessments, such as MICS,
EFSAs etc. However, due to the timeframe of the Flash Appeals, it is often the case
that only a small number of assessments have been implemented at the time of
writing.
3. The information collected/indicators used across CAPs and Flash Appeals were
highly variable, with 3-4 indicators consistently used in 90% or over of CAPs and
Flash Appeals. The sectors with the highest concentration of information/indicators
varied, from Health and Demographics/Economics in the CAPs, and Protection and
Agriculture in the Flash Appeals. There were a total of 48 indicators that were
common to both CAPs and Flash Appeals.
4. Three of the four Flash Appeal revisions, Georgia, Myanmar and Kenya,
increased the number of indicators used in the revised appeal document. This is in line
with expectations for more accurate and detailed information on needs of the affected
population in the Flash Appeal revision, usually completed 4-6 weeks after the
original Flash Appeal. The Myanmar Revision showed a significant rise in indicators
used, going from 29 indicators in the original appeal to 52 indicators in the revision.
5. There is limited standardization across sectoral indicators in both CAPs and Flash
Appeals. Different wording was used to describe some of the same indicators or data,
making it difficult to compare the type and level of data collected across appeals.
6. While CAPs provide figures for total number of people in need of sectoral
assistance, they do not commonly provide a consolidated planning figure for the total
number of people affected by the crisis or total number of beneficiaries of the appeal.
37
7.2 Recommendations
Coordination
� OCHA should continue discussions with cluster/sectors and other actors on ways to
harmonize and share lessons learned from the various initiatives.
� As appropriate, OCHA should liaise with the IASC Information Management (IM) Task
Force to discuss how to improve links between needs assessments and IM, particularly
regarding data collection formats, sampling, and secondary data review standards and
analysis approaches.
� There is a need for consolidated needs assessment ‘tool box’, including guidance on
assessments, lessons learned from various initiatives, and standardized tools (e.g.
forms/questionnaires) that can be adapted for specific contexts. See recommendation
from the Global Nutrition Cluster.21
Timeframe
� The mapping paper proposes a sequence to organize needs assessments according to the
emergency timelines, as a means of clarifying what type and depth of information is
required at each phase of the crisis. (See Annex 1).
� The linkages between contingency planning/preparedness and needs assessment
processes need to be strengthened to ensure ready availability of consolidated core pre-
crisis data. This data should feed into initial rapid needs assessments to avoid unnecessary
collection of similar information at the onset of a crisis, and ensure time- and resource-
effective assessment. Systematic implementation of the IASC Guidelines on Interagency
Contingency Planning provides an opportunity to improve the complementarity between
contingency plans and needs assessments.
Standardisation
� Clusters/sectors should agree on common definitions for selected key terms, such as
‘affected’, ‘homeless’, ‘vulnerable groups’ etc. to ensure a common understanding of a
particular crisis setting.
� The development of an agreed core set of indicators per cluster/sector, which would be
consistently collected, would improve data aggregation, prioritization of needs across
sectors, and equitable response according to vulnerability across crises. It is suggested
that a set of minimum information be agreed for priority collection in the first days
following on-set of a crisis, and then gradually expanded as time progresses.
� A multi-sectoral needs assessment tool(s) to collect core common data on the initial phase
of a sudden on-set crisis, would support more timely and coordinated information
collection for decision making and immediate life-saving interventions.
Skills and Capacity
� Clusters/agencies should consider conducting a review of existing capacities for design
and implementation of the various tools, and create materials/capacity-building strategies
as necessary. The development of further training materials/capacity-building strategies
21 “Guidance should be developed for the wider humanitarian community on how to interpret and report on data
quality, including a checklist on the minimum information to be included in every survey report (e.g.
confidence intervals, design effect)”, SMART.
38
should build upon work by agencies/initiatives which have made substantial investment
in these topics.
� Prior any field-testing, it is recommended that sector/cluster leads ensure assessment tools
are designed along information management requirements.
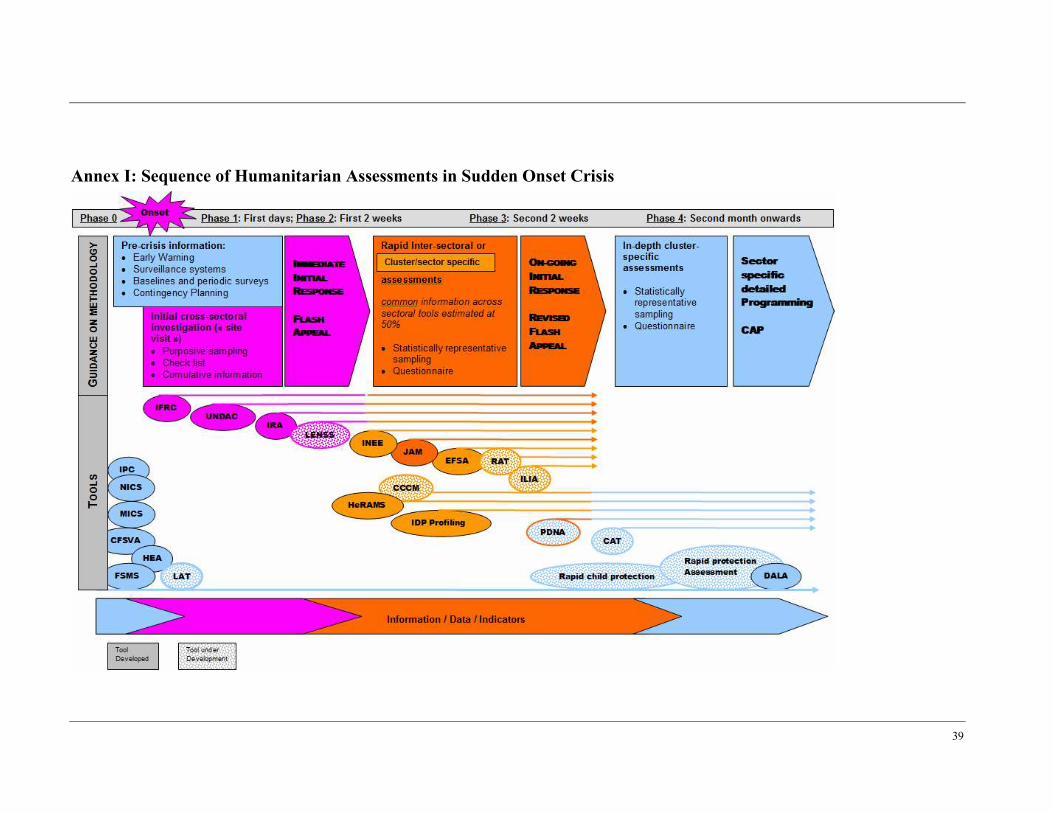
39
Annex I: Sequence of Humanitarian Assessments in Sudden Onset Crisis
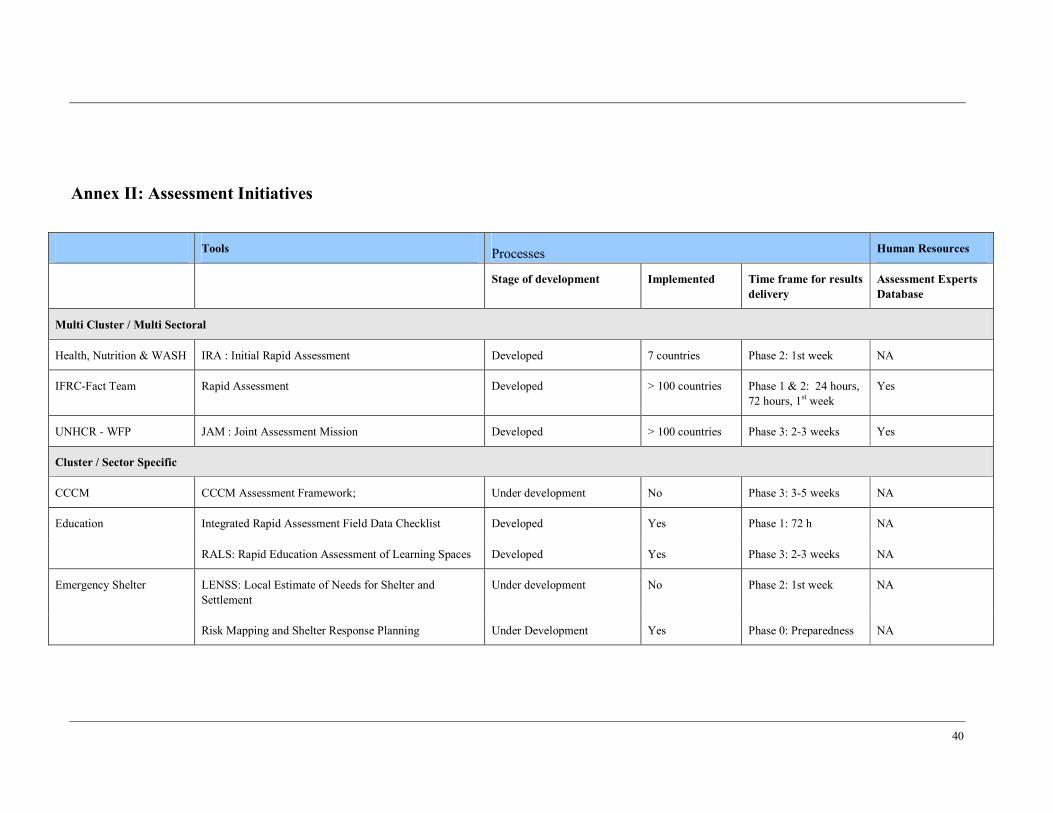
40
Annex II: Assessment Initiatives
Tools Processes Human Resources
Stage of development Implemented Time frame for results
delivery
Assessment Experts
Database
Multi Cluster / Multi Sectoral
Health, Nutrition & WASH IRA : Initial Rapid Assessment Developed 7 countries Phase 2: 1st week NA
IFRC-Fact Team Rapid Assessment Developed > 100 countries Phase 1 & 2: 24 hours,
72 hours, 1st week
Yes
UNHCR - WFP JAM : Joint Assessment Mission Developed > 100 countries Phase 3: 2-3 weeks Yes
Cluster / Sector Specific
CCCM CCCM Assessment Framework; Under development No Phase 3: 3-5 weeks NA
Integrated Rapid Assessment Field Data Checklist Developed Yes Phase 1: 72 h NA Education
RALS: Rapid Education Assessment of Learning Spaces Developed Yes Phase 3: 2-3 weeks NA
LENSS: Local Estimate of Needs for Shelter and
Settlement
Under development No Phase 2: 1st week NA Emergency Shelter
Risk Mapping and Shelter Response Planning Under Development Yes Phase 0: Preparedness NA
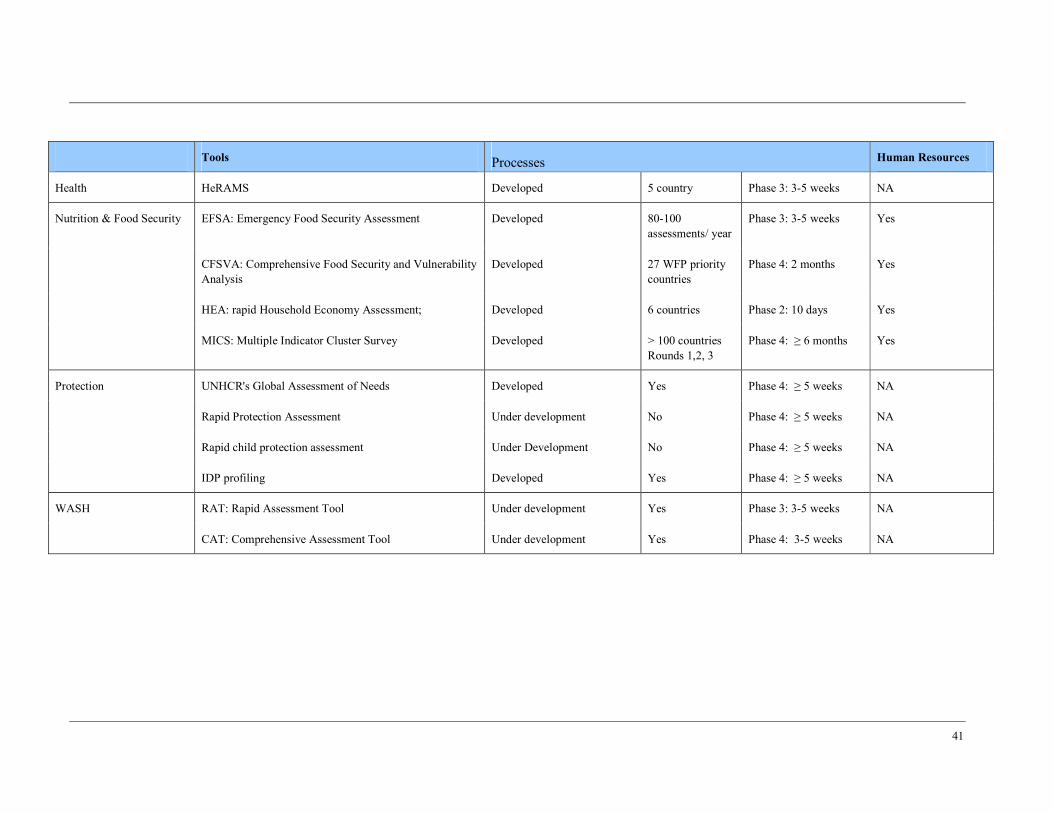
41
Tools Processes Human Resources
Health HeRAMS Developed 5 country Phase 3: 3-5 weeks NA
EFSA: Emergency Food Security Assessment Developed 80-100
assessments/ year
Phase 3: 3-5 weeks Yes
CFSVA: Comprehensive Food Security and Vulnerability
Analysis
Developed 27 WFP priority
countries
Phase 4: 2 months Yes
HEA: rapid Household Economy Assessment; Developed 6 countries Phase 2: 10 days Yes
Nutrition & Food Security
MICS: Multiple Indicator Cluster Survey Developed > 100 countries
Rounds 1,2, 3
Phase 4: ≥ 6 months Yes
UNHCR's Global Assessment of Needs Developed Yes Phase 4: ≥ 5 weeks NA
Rapid Protection Assessment Under development No Phase 4: ≥ 5 weeks NA
Rapid child protection assessment Under Development No Phase 4: ≥ 5 weeks NA
Protection
IDP profiling Developed Yes Phase 4: ≥ 5 weeks NA
RAT: Rapid Assessment Tool Under development Yes Phase 3: 3-5 weeks NA WASH
CAT: Comprehensive Assessment Tool Under development Yes Phase 4: 3-5 weeks NA
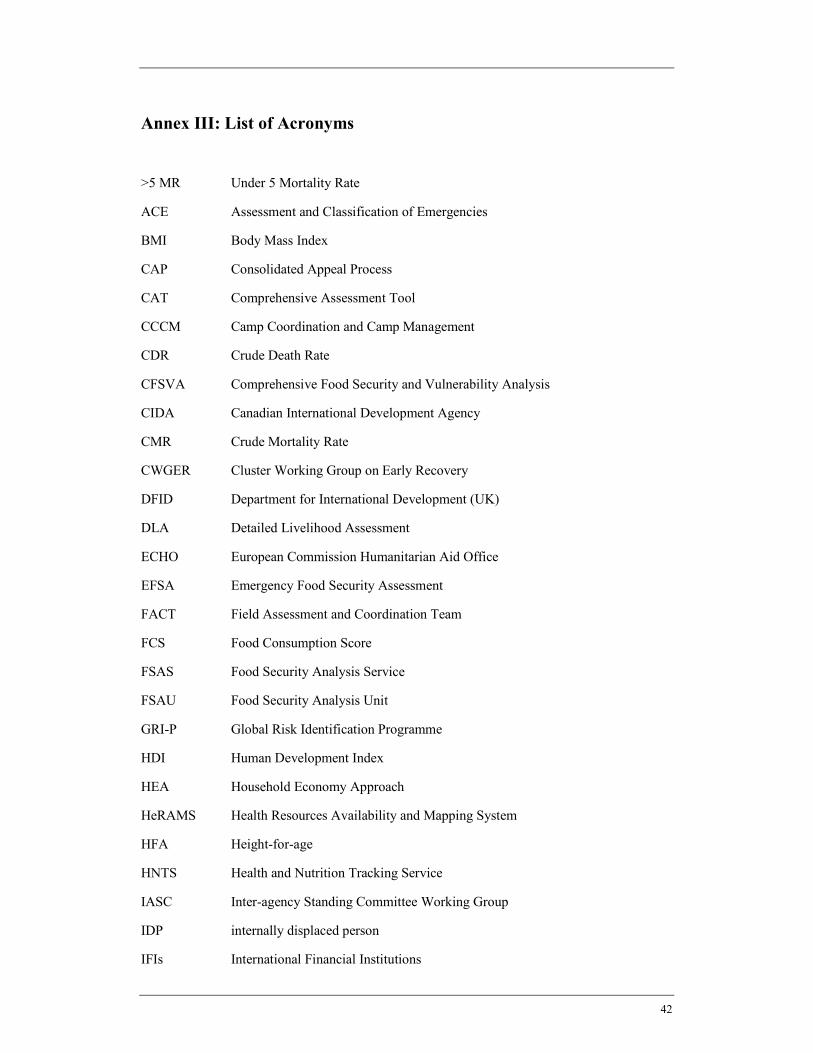
42
Annex III: List of Acronyms
>5 MR Under 5 Mortality Rate
ACE Assessment and Classification of Emergencies
BMI Body Mass Index
CAP Consolidated Appeal Process
CAT Comprehensive Assessment Tool
CCCM Camp Coordination and Camp Management
CDR Crude Death Rate
CFSVA Comprehensive Food Security and Vulnerability Analysis
CIDA Canadian International Development Agency
CMR Crude Mortality Rate
CWGER Cluster Working Group on Early Recovery
DFID Department for International Development (UK)
DLA Detailed Livelihood Assessment
ECHO European Commission Humanitarian Aid Office
EFSA Emergency Food Security Assessment
FACT Field Assessment and Coordination Team
FCS Food Consumption Score
FSAS Food Security Analysis Service
FSAU Food Security Analysis Unit
GRI-P Global Risk Identification Programme
HDI Human Development Index
HEA Household Economy Approach
HeRAMS Health Resources Availability and Mapping System
HFA Height-for-age
HNTS Health and Nutrition Tracking Service
IASC Inter-agency Standing Committee Working Group
IDP internally displaced person
IFIs International Financial Institutions
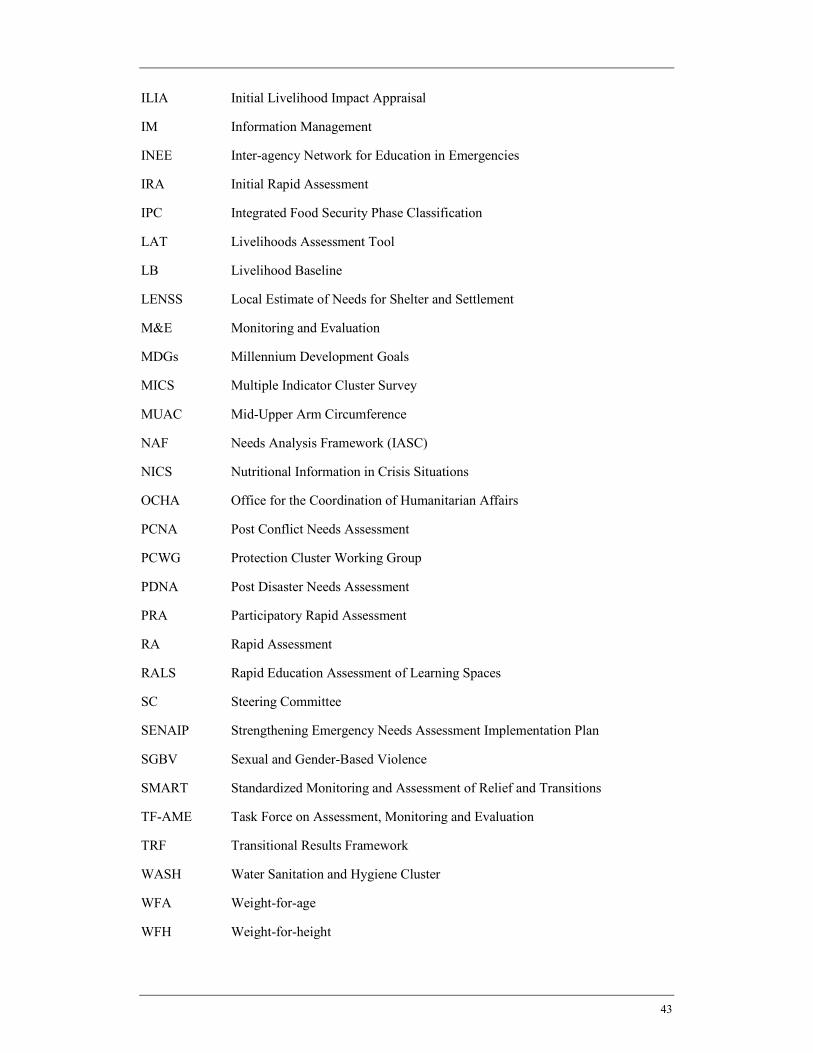
43
ILIA Initial Livelihood Impact Appraisal
IM Information Management
INEE Inter-agency Network for Education in Emergencies
IRA Initial Rapid Assessment
IPC Integrated Food Security Phase Classification
LAT Livelihoods Assessment Tool
LB Livelihood Baseline
LENSS Local Estimate of Needs for Shelter and Settlement
M&E Monitoring and Evaluation
MDGs Millennium Development Goals
MICS Multiple Indicator Cluster Survey
MUAC Mid-Upper Arm Circumference
NAF Needs Analysis Framework (IASC)
NICS Nutritional Information in Crisis Situations
OCHA Office for the Coordination of Humanitarian Affairs
PCNA Post Conflict Needs Assessment
PCWG Protection Cluster Working Group
PDNA Post Disaster Needs Assessment
PRA Participatory Rapid Assessment
RA Rapid Assessment
RALS Rapid Education Assessment of Learning Spaces
SC Steering Committee
SENAIP Strengthening Emergency Needs Assessment Implementation Plan
SGBV Sexual and Gender-Based Violence
SMART Standardized Monitoring and Assessment of Relief and Transitions
TF-AME Task Force on Assessment, Monitoring and Evaluation
TRF Transitional Results Framework
WASH Water Sanitation and Hygiene Cluster
WFA Weight-for-age
WFH Weight-for-height