Embed Size (px)
Citation preview
Assessing Usability of
Products in the Low Vision
Field Craig Jason Tam Wing
A dissertation submitted to the Faculty of Engineering, University of the
Witwatersrand, Johannesburg,
In fulfillment of the requirements for the degree of Master of Science in Engineering.
Johannesburg, April 2006
Masters of Science in Engineering
Craig Wing Page i
Declaration I declare that this research report is my own, unaided work, except
where otherwise acknowledged. It is being submitted for the
Degree of Master of Science in Engineering in the University of the
Witwatersrand, Johannesburg. It has not been submitted before for
any degree or examination in any other university.
_________________________ Craig Jason Tam Wing Signed this ___ day of ___ 20___
Masters of Science in Engineering
Craig Wing Page ii
Abstract This paper presents the implementation of usability engineering into a device to meet the
requirements of a Visually Impaired Person (VIP). Users of such a device may suffer
from conditions such as Macular Degeneration, Diabetes and HIV/AID’s related
disorders. Since these disorders affect a person’s vision, the device enlarges the desired
text to reduce the effects of loss of vision. Other functionality may include image
manipulation and colour modification.
A usability engineering framework is incorporated into the design as well as
accommodating user requirements in the design process. Usability principles are
implemented, hence meeting the aims of effectiveness, efficiency, learnability,
satisfaction and context of use. The device is examined via heuristic evaluation and
usability testing from specialists and end users, with comments, ratings and times
recorded. Research indicates that this device successfully implements usability
engineering techniques and provides a cost effective, highly functional device for the
VIP.

Masters of Science in Engineering
Craig Wing Page iii
Acknowledgments
Professor Barry Dwolatzky, for his supervision, guidance, instrumental assistance and
encouragement throughout the course of this research project.
Mr Kenneth Birch for his financial support and assistance to purchase components
required to conduct research.
Belinda Leibowitz and Hazel Sachorowitz from the Rand Afrikaans University,
Optometry Department for their advice, input, guidance and allowing me to conduct
research at their premises.
South African Council for the Blind (SANCB), Retina South Africa and management
from Sensory Solutions for their time, input and valuable advice.
Mrs Moruthane, Sam Boshilo and Sibonile Primary School, for allowing me to
conduct a usability study at their premises for research.
Masters of Science in Engineering
Craig Wing Page iv
Page Number/
Document Number
Declaration…………………………………………….………………………..I
Abstract……………………………………………….....……………………..II
Acknowledgements………………………………….....……………………..III
Table of Contents……………………………………..…………..……………IV
Foreword……………………………………………….……………...….……..V
Project Overview…………………………………………………...…………...1
Msc Paper - CJT Wing……………………………….……………………….3
Conclusion…………………………………………….……………...………..12
References…………………………………………….……………...………..14
Appendix A: Literature Survey…………………………………….…...A1 - A21
Appendix B: Prototype Description……………………………….…...B1 - B11
Appendix C: Usability Inspection………………………………...…...C1 - C11
Appendix D: Usability Testing……………………….…………...…..D1 - D14
Appendix E: Usability Test Documentation……….……………..…….E1 - E41
Table of Contents
Masters of Science in Engineering
Craig Wing Page v
Foreword
The format of this Masters Dissertation differs from conventional dissertation
formats, in that it contains a short body and multiple appendices. The main documents
of the body consist of a project overview, technical paper, conclusion and a reference
section. The technical paper provides an overview of the work done and highlights all
the important knowledge gained, whereas the documents presented in the appendices,
serve as a reference to the reader that may be interested in gaining additional
understanding into the engineering methods, technology and results that were
obtained throughout this research.
The remainder of the foreword provides the reader with details concerning the various
documents that are presented and provides a brief description of them in the order in
which they appear in the table of contents.
As mentioned above, the technical paper encompasses the project in its entirety.
Hence, it is not possible to concentrate on any particular aspect of the research in as
much detail as is given in the relevant documents found in the appendices. The
technical paper provides a literature survey into macular degeneration and the fields
of usability engineering, the software design and creation of a prototype and the
implementation of usability engineering techniques into the aforementioned
prototype. Finally, results are given and recommendations and a conclusion drawn.
The conclusion section following the paper provides a short description of general
conclusions reached in this project, whereas more specific and detailed conclusions
are given in the appendices.
The reference document contains the reference list of the all the documents that were
used in the course of this research. Each reference has a number associated with it that
corresponds to its use in the appendices.
The appendices are divided into five sections, with the first page of each appendix
detailing the specific content of each appendix. In view of the fact that the appendices
are separate documents within this dissertation, the page numbers have a separate
convention. Each page of the appendix has a corresponding entry that can be found a
the bottom right. The convention used is the letter of the appendix followed by the
page number of the entire appendix. For example, the fourth page of appendix A
would have the convention, A4 of A21.
Appendix A contains a comprehensive literature survey into various aspects of the
project including Macular degeneration, and some of the other visual disorders where
this research and prototype may be applicable. The second half of the appendix
addresses the current state of usability engineering and the methods that may be used
to implement usability engineering into a product or service.
Appendix B details a brief background to the project and the initial functionality
offered by the prototype, termed Revision, the associated modules, hardware
considerations and the rationale for their implementation.
Masters of Science in Engineering
Craig Wing Page vi
Appendix C discusses usability techniques, specifically Heuristic evaluation. The
major usability concerns as found by using usability engineering knowledge and
specialist understanding in the optometric field are addressed and the manner in which
product evolution is implemented to improve the usability of the prototype.
Additional information is given into product evolution and the style in which
recommendations are implemented.
Appendix D examines usability testing and the methods that are used to implement
this engineering principle. Details concerning participants and the testing environment
are given. A statistical and data analysis is given and a final recommendation is
provided in more detail for future development. This section ends with a conclusion
drawn from the results of the data analysis and examples of the test documents are
given.
Appendix E provides the original test data, including the evaluations and post test
questionnaire that was used during the usability test. The spreadsheets where the data
is combined for analysis is provided and separated into sheets depending on age,
CAL, and one for the summary. Finally the documents that were used to conduct the
usability test are attached.
Masters of Science in Engineering
Craig Wing Page 1
Project Overview
The Handbook of Ocular Disease Management states that Age-related Macular
Degeneration (AMD) is a degenerative condition of the macula (the central retina),
which is responsible for sharp, central vision and colour. As a result, MD patients
experience deteriation of their central vision and rely on their peripheral vision. It is
the most common cause of vision loss in the United States in those 50 years or older.
AMD is present in approximately 10 percent of the population over the age of 52 and
in up to 33 percent of individuals older than 75. Similar Central Acuity Loss (CAL)
disorders exist that have a similar effect of reducing the central vision.
It is conservatively estimated, by Retina South Africa, that there are approximately 72
000 confirmed and registered Macular Degeneration (MD) sufferers in South Africa
and more than 150 000 South Africans affected by some form of retinal degeneration.
In addition there are over half a million carriers of the defective gene that causes
MD1.
The United Nations Programme on HIV/Aids reports, at the end of 2003, an estimated
37 million people were living with HIV/Aids. It is estimated by the South African
Department of health that in 2001, there were 4.74 million adults affected with HIV,
rising to 5.3 million in 2002. It is estimated by the Bennet and Bloom Eye Centre,
Louisville, USA, that 15 - 46% of these individuals will have Cytomegalovirus
(CMV2) and hence experience visual disorders as a result of having a combination of
CMV and HIV/Aids.
Diabetes is the leading cause of blindness amongst people aged between twenty and
74. It is estimated that 100 million in the developing world and 75 million people in
developed countries are affected with diabetes [46]. The effect of Diabetes on the eye
is called Diabetic Retinopathy and is the main cause of visual disorders after cataracts
and glaucoma. Again, a percentage of persons with diabetes experience visual
disorders.
A number of additional disorders exist, such as Glaucoma, Cataracts, Far/Near
Sighted, and those associated with an increase in age. These are some instances of
where a locally manufactured visual aid can be beneficial.
Currently, low vision devices are imported into South Africa from international
suppliers to a local supplier. This supplier in turn adds their profit margin, increasing
the already high price on these devices. The supplier will then sell these devices to
prospective clients (clinics, individuals, etc.) that require them. Should a problem
exist in one of these devices, the client would then contact the supplier and return the
device, who in turn will attempt to either have a replacement part imported or send the
device back.. As can be noted, this results in tremendous problems for the end client,
which include, fluctuations in price (due to exchange rates) and protracted service
delivery times.
1 Carriers do not exhibit conditions associated with Macular Degeneration, but they “carry” the dysfunctional gene, hence any children may be affected with MD. 2 Infection of the Retina, ultimately leading to detachment of the Retina and eventual blindness
Masters of Science in Engineering
Craig Wing Page 2
The purpose of this research is to address these, and other related problems, by
engineering a locally manufactured prototype able to compete with its international
counterparts. As a result, usability engineering techniques were implemented to
ensure that a user-centric approach was adopted to ensure its success.
This project was hence done in order to address this need, by creating a prototype that
would be locally manufactured and implement usability engineering techniques to
ensure a successful user driven approach. The process was to initially investigate the
current state of the market and the functionality offered by low vision devices.
Discussions were had with a number of individuals and groups as to the required
functionality of a locally created alternative. Once this was complete, an initial
prototype was created using usability engineering techniques and evaluated with
potential clients and experts in the low vision field.
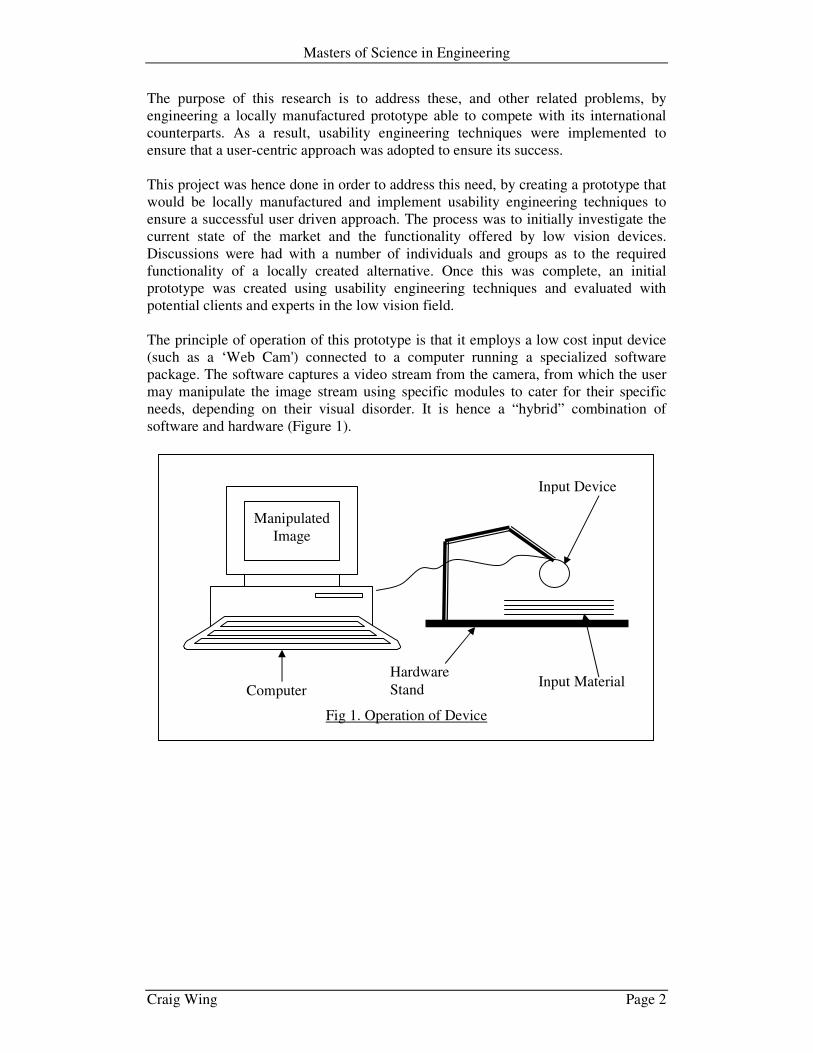
The principle of operation of this prototype is that it employs a low cost input device
(such as a ‘Web Cam') connected to a computer running a specialized software
package. The software captures a video stream from the camera, from which the user
may manipulate the image stream using specific modules to cater for their specific
needs, depending on their visual disorder. It is hence a “hybrid” combination of
software and hardware (Figure 1).
Computer
Input Device
Input Material Hardware
Stand
Manipulated
Image
Fig 1. Operation of Device
Masters of Science in Engineering
Page 3
Table 1. Product Comparison [19]
Product Country Price*
Colour Invert Split Zoom
Andromeda Ireland R 28,125 x x 1-10x
Genie Pro US R 20,595 x x 5.5-50x
Prisma Ireland R 5,625 x x 4-35
Revision South Africa R 5,000** x x x Variable
*Prices taken at 1US$/R6.25
** Maximum price allowed for device
Features1. Introduction There are a number of vision disorders that may
cause an individual to experience low vision and
Central Acuity Loss (CAL). Of these conditions
the most common syndromes are Macular
Degeneration (MD) and Albinism. The effect of
CAL is that the affected individual experiences a
visual impairment that is the opposite of tunnel
vision. Hence, the centre of the Visually Impaired
Person‘s (VIP’s) eyesight is distorted and the
affected individual needs to utilise their peripheral
vision to see objects around them.
In addition to the aforementioned disorders, there
are a number of other conditions that are not CAL
conditions, but affect an individual’s vision,
amongst these are HIV/AID’s related disorders.
Diabetes, Glaucoma and age related disorders.
The device to be created is termed Revision and is
required to cost a maximum of R5,000 and offer
functionality comparable to other devices (see
Table 1. Product Comparison, for some devices
available). There are a number of visual aids
available to assist VIP’s and these can be
segmented into two subgroups; external hardware
products and software based devices. There are
however no devices that are a combination of the
two types. In addition, available devices are not
manufactured in South Africa, and range in price
from R5,625 to in above R25,000 (Table 1.
Product comparison), have extensive service
times and are difficult to obtain.
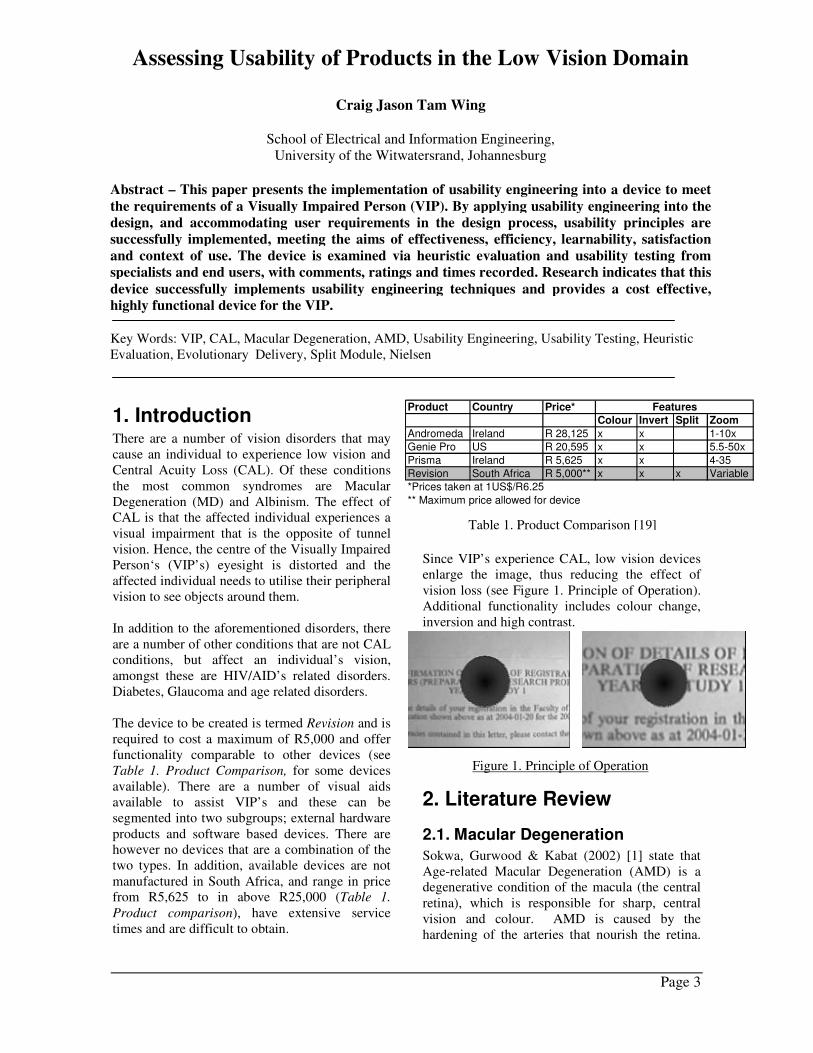
Since VIP’s experience CAL, low vision devices
enlarge the image, thus reducing the effect of
vision loss (see Figure 1. Principle of Operation).
Additional functionality includes colour change,
inversion and high contrast.
2. Literature Review
2.1. Macular Degeneration
Sokwa, Gurwood & Kabat (2002) [1] state that
Age-related Macular Degeneration (AMD) is a
degenerative condition of the macula (the central
retina), which is responsible for sharp, central
vision and colour. AMD is caused by the
hardening of the arteries that nourish the retina.
Assessing Usability of Products in the Low Vision Domain
Craig Jason Tam Wing
School of Electrical and Information Engineering,
University of the Witwatersrand, Johannesburg
Abstract – This paper presents the implementation of usability engineering into a device to meet
the requirements of a Visually Impaired Person (VIP). By applying usability engineering into the
design, and accommodating user requirements in the design process, usability principles are
successfully implemented, meeting the aims of effectiveness, efficiency, learnability, satisfaction
and context of use. The device is examined via heuristic evaluation and usability testing from
specialists and end users, with comments, ratings and times recorded. Research indicates that this
device successfully implements usability engineering techniques and provides a cost effective,
highly functional device for the VIP.
Key Words: VIP, CAL, Macular Degeneration, AMD, Usability Engineering, Usability Testing, Heuristic
Evaluation, Evolutionary Delivery, Split Module, Nielsen
Figure 1. Principle of Operation
Masters of Science in Engineering
Page 4
This deprives the sensitive retinal tissue of the
oxygen and nutrients that it needs to function and
thrive, as a result, the central vision deteriorates.
AMD is the most common cause of vision loss in
the United States in those that are 50 years or
older and is present in approximately 10 percent
of the population over the age of 52 and in up to
33 percent of individuals older than 75 [1].
Statistics quoted by Retina South Africa (2004)
[2], confirm there are at least 71 500 confirmed
cases nationwide, with another 505 900 carriers of
the gene that causes retinal degeneration
confirmed [2].
The progression of AMD varies widely in
severity, usually affecting both eyes, and can be
either gradual or abrupt. In the worst cases, it
may cause a complete loss of central vision,
making reading or driving impossible. In the less
severe case, distortion of images may occur.
Fortunately, macular degeneration does not cause
total blindness since it only affects central vision
and does not affect the peripheral vision.
2.2. Usability Engineering
The process of integrating usability from the onset
of the design is often referred to as usability
engineering [3], [4]. Usability engineering begins
with the identification of users, analysis of tasks,
setting usability specifications, moving through to
developing and testing prototypes and continues
through iterative cycles of development and
testing [5].
There are two definitions of usability that provide
insight and explanation into usability,
1. Nielsen (1993) [6] states , “Usability is about
learnability, efficiency, memorability, errors
(context of use), and satisfaction”. This gives
specific goals for usability engineering and;
2. ISO 9241-11 (1998) states [18] (Guidance on
Usability) - “the extent to which a product
can be used by specified users to achieve
specified goals of effectiveness, efficiency and
satisfaction in a specific context of use”
Gould and Lewis (1985) [7] recommend three key
principles for developing usable products.
• Early Focus on users and tasks: That is
understanding potential users and not just
identifying them. If usability engineers do not
understand the needs of users before creating
a specification for a project, they risk
developing a specification that does not
reflect the user’s needs [3].
• Empirical Measurement: Two factors are
emphasised; actual behavioural measurements
of learnability and usability and conducting
these experimental and empirical studies early
in the development process.
• Iterative Design: Problems must be identified
and fixed with regularity; hence designs must
be iterative (cycle of design, test and measure,
and redesigned). An additional approach as
mentioned by Good (1988) [3], is to adopt an
approach, whereby developers start by
building a small subset of the system, then
“grow” the system, in incremental stages,
through the development process. New
features are added and existing features
refined with successive versions of the
system. The prototype evolves into the
finished project [3].
2.2.1. Usability Inspection Techniques
“Usability inspection” is the general name given
to the process of having evaluators inspect a user
interface by using a set of cost effective ways of
evaluating user interfaces to find usability
problems [8]. The most common technique is
Heuristic evaluation; the goal of which is to find
usability problems in an existing design, such that
they can be addressed in subsequent iterations [9],
[10].
Jeffries, Miller, Wharton & Uyeda (1989) [11]
have shown that heuristic usability evaluation
identifies more of the minor problems associated
with a user interface than any other technique.
Additionally, Nielsen (1992) [9] suggests that
heuristic evaluation identifies minor usability
problems that are not even seen in actual testing.
2.2.2. Usability Testing
Usability testing refers to allowing “real” users to
use a product in the same manner that they would
in their daily tasks. It is crucial that usability
testing has the following characteristics;
• Participants are real users
• Participants do real tasks
• Observe participants behaviour
• Data Analysis and Recommendations
• Results are applied
Masters of Science in Engineering
Page 5
3. Research Question The aim of this research is twofold,
1. Provide usability engineering techniques into
the development of a device to meet the
distinctive requirements for VIP’s,
2. To create a visual aid that will address the
problems of affordability of a low vision
device (maximum price of R5,000), while
providing adequate functionality.
The device will use aspects of both hardware and
software to create a hybrid device.
4. Prototype Description
4.1. Design Methodology
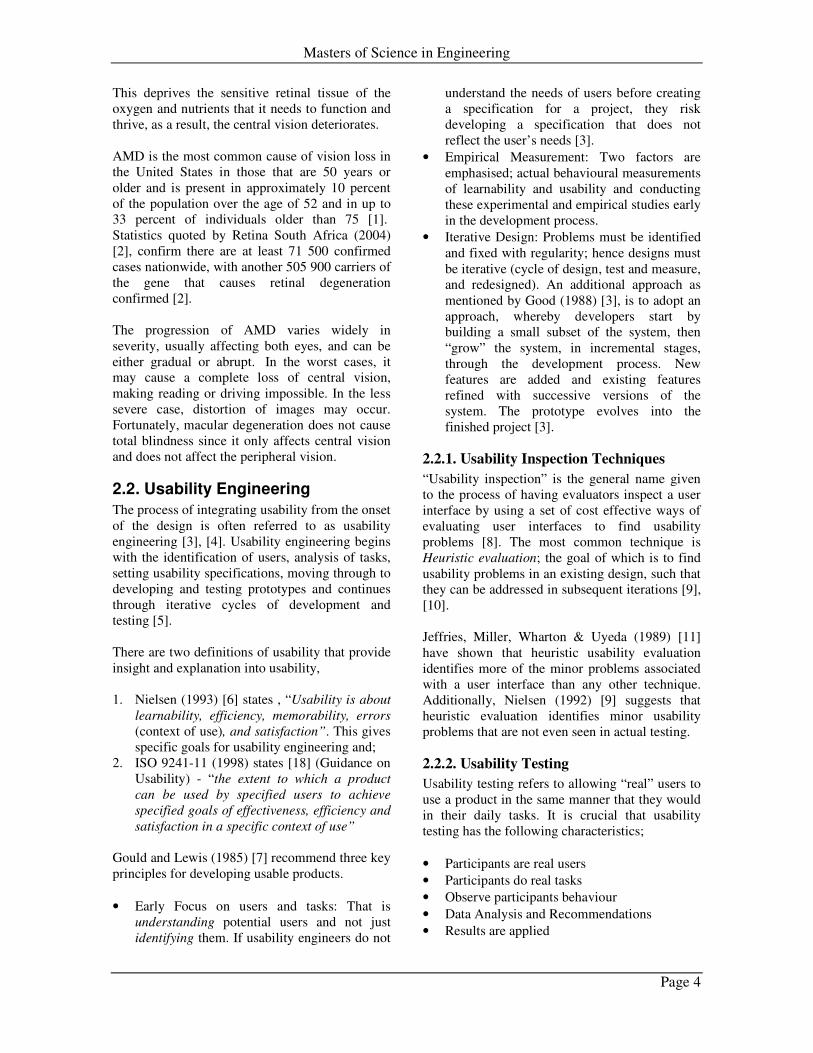
The principle of operation of Revision is that a
low cost imaging device, typically a web camera
(webcam), would be used to stream images to a
computer. Software would then be written that
was able to utilise these images, which can be
manipulated by the user, to best display the
resultant image, after enhancement, onto the
computer screen. User functions include zooming,
and colour manipulation. The system therefore
comprises both hardware (webcam, computer and
stand) and specialist software to manipulate the
image, to meet the needs of a VIP.
4.1.1. Development Language
Revision was chosen to run on Microsoft’s
Windows Operating System (OS) as 90% of
machines worldwide operate on this OS [20]. The
chosen programming language needs to be object-
orientated (OO), allow for visual programming
and cater for Rapid Application Development
(RAD). This was required to reduce the task of
programming Windows based applications to the
handling of objects in a visual environment. In
addition, the chosen language needs to be able to
handle real time processing and ideally
incorporate a 32-bit compiler. Based upon these
conditions, Delphi was selected as the
programming language [12], [13], [14].
4.1.2. Design Model
Applying usability engineering principles, it was
realised that the design had to undergo usability
testing and inspection at an early stage. These
changes needed to be implemented and additional
user data to be gathered, hence an evolutionary
approach was used [3]. An initial prototype was
developed comprising of modules, which could be
evolved or removed as required or additional
modules added. Thus the prototype would evolve
from the initial design, though iterative evaluation
into the final product [3]. The hardware aspect of
the device would undergo a similar process.
4.2. Initial Prototype
The initial prototype comprised a number of
modules that would offer functionality
comparable to the currently available visual aids
(see Table 1). This functionality includes zoom
functionality, colour manipulation and inversion.
Modules were included as required, during
interviews with specialists and users during the
initial research phase.
4.2.1. Module Addition
The following modules were implemented and
initialised by the user clicking on the appropriate
button from the start page,
M1. GetVideo: streamed (extracted) images from
the webcam and captured selected frames as
Bitmaps (BMP) for further processing. All
subsequent modules used these saved BMP
image.
M2. Snapshot viewer: the user could magnify
portions of the captured BMP.
M3. Invert Image: Inverted the pixels of the BMP
to produce a “negative” of the original BMP.
M4. Configuration Module: used to configure the
size of the strip or the hole that appeared in
the previous two modules.
M5. Optical Character Recognition (OCR) and
Speech: when used in conjunction with the
developed software, extracted the text from
the captured BMP, then using the speech
Application Program Interface (API), the
program was able to read this extracted text.
Computer
Input Device
Hardware Stand
Manipulated
Image
Figure 2. Operation of Device
Input
Material
Masters of Science in Engineering
Page 6
4.2.2. Innovative Modules
In addition to the above modules, two modules
were added that might challenge the conventional
manner in which VIP’s view objects. These both
compensate for the CAL that is experienced, by
inserting “gaps” where the loss of vision is
experienced. These modules are,
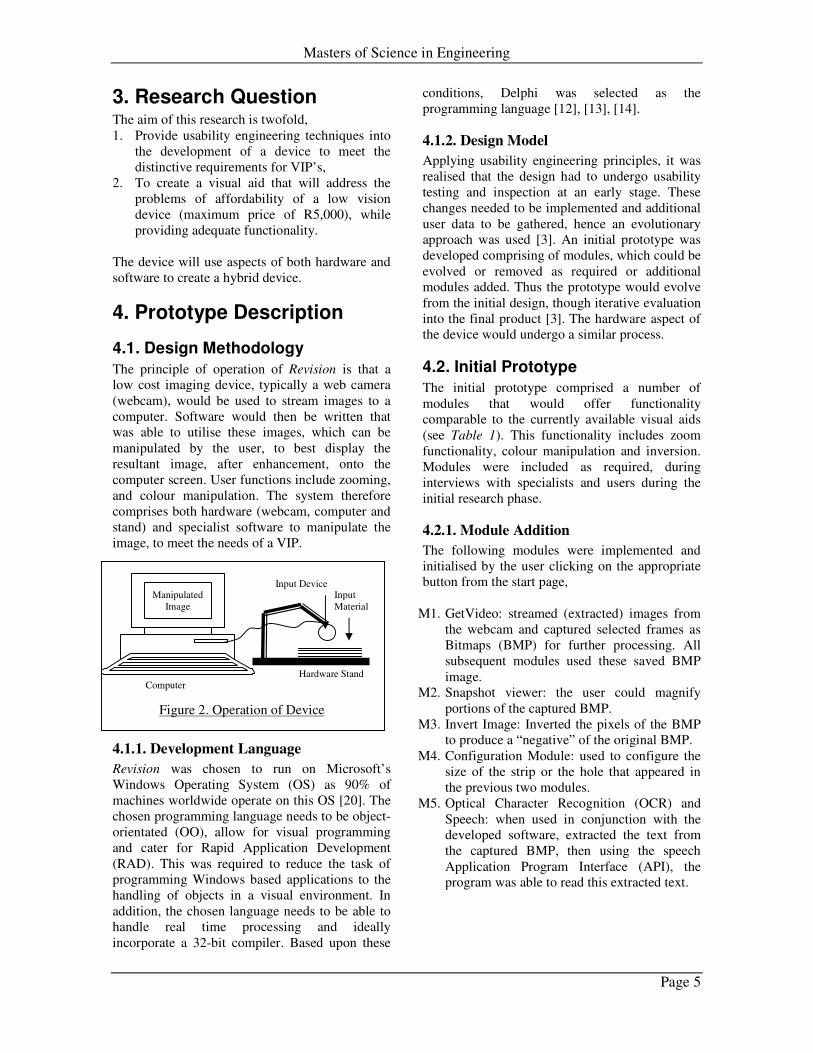
M6. Split Module: The software compensates for
the CAL by inserting a varying vertical or
horizontal, blank “strip” to compensate for
CAL (see Figure 3. Split Mode), essentially
creating a “paragraph break” of varying
height for the horizontal strip.
M7. Wrap Around: An extension of the Split
module, except the centre of the image was
manipulated by inserting a “hole” as opposed
to a strip, with the original text appearing on
each side of the hole.
The premise of this is that the VIP would be able
to look directly at an object, as a “normal sighted
individual” and use their peripheral vision to read
the compensated text (see Figure 3. Split Mode).
In addition to the software changes, a number of
hardware stand configurations were explored to
mount the webcam. Different approaches were
tried that would allow the camera to be mounted
relative to the input image. Lighting was
considered as was a counteracting lens to oppose
the distortion of the image (Barrel effect1). This
lens was to cancel the effect of the internal
convex lens of the webcam.
4.3. Device Evolution
Once the initial process in the evolutionary
delivery was complete, heuristic evaluation was
1 Barrel Effect is attributed to the internal curvature of
the webcam lens, causing images to be spherised at
their centre and occurs at the edge of the lens.
conducted in conjunction with the Low Vision
clinic at the Optometry unit based at the
University of Johannesburg, previously Rand
Afrikaans University (RAU), and members from
the South African National Council for the Blind
(SANCB). The results (see M1- M7, above) from
the usability inspection were applied to the
prototype by refining or creating new modules,
and the process repeated, until the specialists were
satisfied, fulfilling the requirements of an
evolutionary delivery [3]. The following key
features were introduced into the device,
4.3.1. Removal of Modules
Four modules were removed from the device as
they were either not necessary or did not meet
usability requirements. Theses modules were
snapshot viewer (M2), wrap around (M7), and
configuration (M4). Additionally the OCR and
speech module (M5) was removed as the
functionality offered was not required at this stage
of development (heuristic evaluation) due to time
constraints, but consideration would be given to
include these in future iterations of the device.
4.3.2. Module Evolution
Within the software program, the remaining
modules were re-analyzed and improved to reduce
the resources required and enhance the
performance. Module one (M1) (getvideo
module), the process used to obtain the image
from the webcam, was configured to
automatically initiate at startup using components
that are distributed under the freeware license,
Mozilla Public License (MPL) 1.1. The split
module (M6) was reduced to supply only a
horizontal split to simulate a paragraph break and
the gap size could be dynamically altered.
4.3.3. Module Additions
Modules were added that increased the
functionality of the device. This was determined
during feedback sessions with the evaluators and
formal comments and opinions were given. These
modules are (listed as a continuation of the above
list, see 4.2. Initial Prototype, M1- M7),
M8. Grayscale: the initial prototype was able to
convert the captured image into greyscale
(black and white) using the built in drivers,
but it was a complex and under utilised
function.
M9. High Contrast: manipulated the image to
display either “pure white” or “pure black”,
Figure 3. Split Mode
Masters of Science in Engineering
Page 7
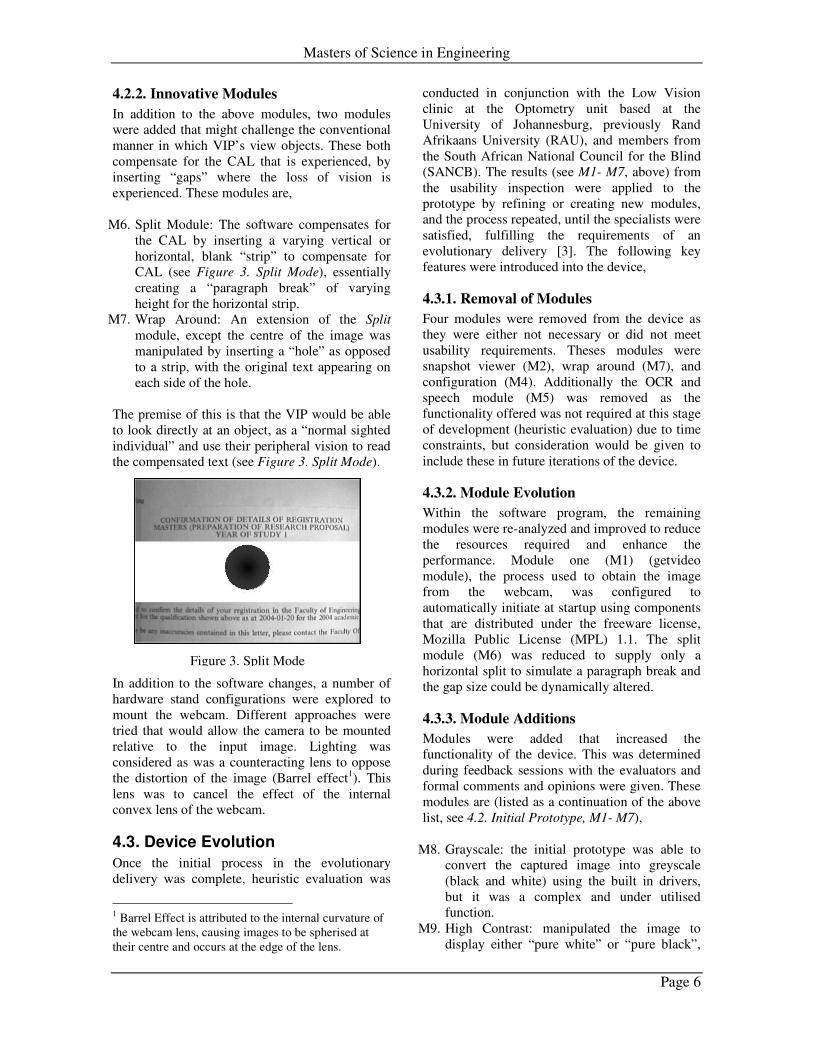
Figure 4. Hardware Prototype
unlike greyscale where an image appeared in
black, white and grey or degrees thereof.
M10. Zoom Enhancement: Using mathematical
algorithms, the resolution was effectively
doubled, increasing the visual clarity.
M11. Luminance and Glare control: Automatically
catered for poor lighting conditions (over or
under exposed) on the image or parts thereof.
4.3.4. General Operation
The operation of the software was more
automated at startup with modules initialized
automatically; in particular the operation became
“real-time”. Previously users needed to control
every aspect of operation including initializing of
the software to start capturing in images.
Additionally the Human Machine Interface (HMI)
was altered such that the different modules could
be initiated by mouse operations as opposed to
clicking on the call buttons. This was effective as
VIP’s experienced difficulties in maneuvering the
mouse to click on the buttons, and linking
modules to mouse operations reduced these
problems
The counteracting lens was removed, as the
benefit of using a counteracting lens to reduce the
barrel effect was minimal. In addition, the lens
darkened the image and reduced its overall clarity.
Lighting was addressed by the inclusion of the
luminance and glare control modules to
automatically compensate for poor lighting
conditions. Finally different modules could be
used in combination to cater for the specific needs
of each VIP (e.g. zoom, grayscale and split).
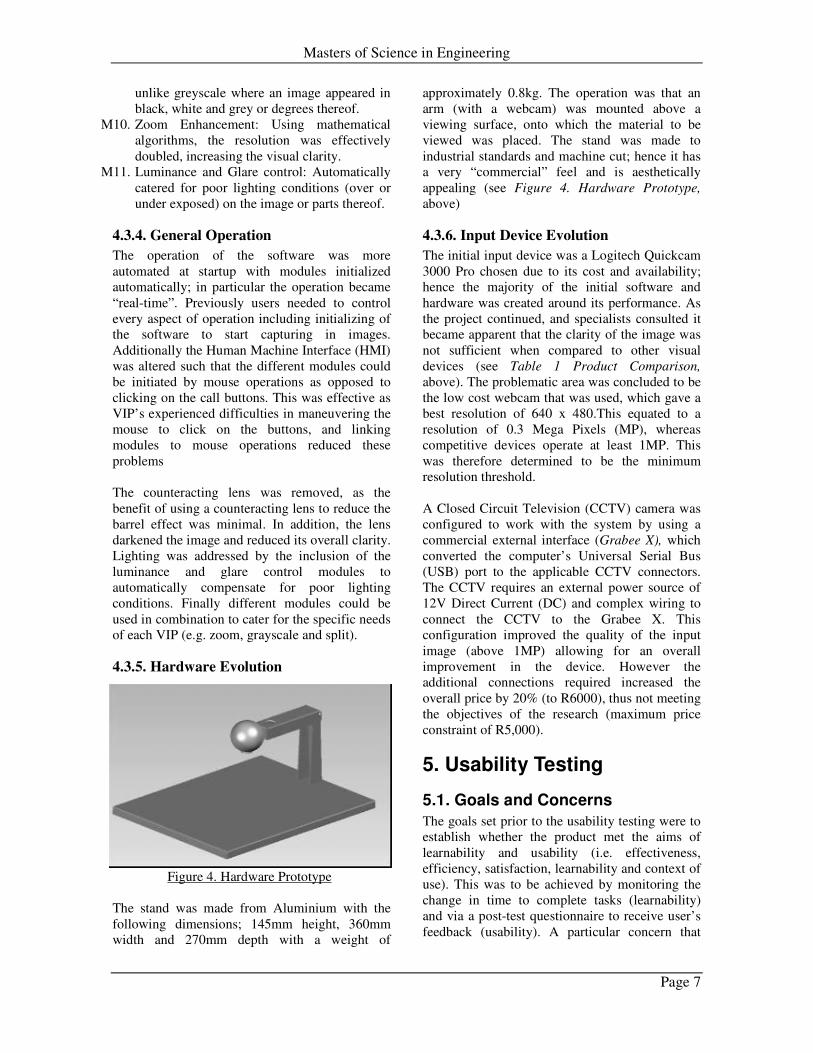
4.3.5. Hardware Evolution
The stand was made from Aluminium with the
following dimensions; 145mm height, 360mm
width and 270mm depth with a weight of
approximately 0.8kg. The operation was that an
arm (with a webcam) was mounted above a
viewing surface, onto which the material to be
viewed was placed. The stand was made to
industrial standards and machine cut; hence it has
a very “commercial” feel and is aesthetically
appealing (see Figure 4. Hardware Prototype,
above)
4.3.6. Input Device Evolution
The initial input device was a Logitech Quickcam
3000 Pro chosen due to its cost and availability;
hence the majority of the initial software and
hardware was created around its performance. As
the project continued, and specialists consulted it
became apparent that the clarity of the image was
not sufficient when compared to other visual
devices (see Table 1 Product Comparison,
above). The problematic area was concluded to be
the low cost webcam that was used, which gave a
best resolution of 640 x 480.This equated to a
resolution of 0.3 Mega Pixels (MP), whereas
competitive devices operate at least 1MP. This
was therefore determined to be the minimum
resolution threshold.
A Closed Circuit Television (CCTV) camera was
configured to work with the system by using a
commercial external interface (Grabee X), which
converted the computer’s Universal Serial Bus
(USB) port to the applicable CCTV connectors.
The CCTV requires an external power source of
12V Direct Current (DC) and complex wiring to
connect the CCTV to the Grabee X. This
configuration improved the quality of the input
image (above 1MP) allowing for an overall
improvement in the device. However the
additional connections required increased the
overall price by 20% (to R6000), thus not meeting
the objectives of the research (maximum price
constraint of R5,000).
5. Usability Testing
5.1. Goals and Concerns
The goals set prior to the usability testing were to
establish whether the product met the aims of
learnability and usability (i.e. effectiveness,
efficiency, satisfaction, learnability and context of
use). This was to be achieved by monitoring the
change in time to complete tasks (learnability)
and via a post-test questionnaire to receive user’s
feedback (usability). A particular concern that
Masters of Science in Engineering
Page 8
was raised during initial heuristic evaluation was
the clarity of the input image and the concept of
using a mouse for the HMI. The former was
especially crucial for the partially sighted that
were using the product.
5.2. User Participants
Users were divided into three sample groups,
depending on their age and a further group for
those VIP’s that experienced CAL.
Nielsen and Molich (1990) [15] found that three
participants discovered not quite half of all major
usability problems. Virzi (1992) [16] found that
80% of usability errors were found with four or
five participants and 90% with ten participants.
Additional participants were unlikely to uncover
additional problems. Coupled with reliability
requirements [6] at a confidence level of 80% and
tolerance of approximately 20%, and the
information from [16] the number of users
required was estimated to be eight, per group or
subgroup thereof.
5.3. Onsite Testing
The usability tests were conducted at Sibonile
Primary School’s2, computer class and RAU
University, optometry unit. The computer class
houses approximately 20 computers and children
are introduced to their operation. The optometry
unit is open to the public and consults many VIP’s
and recommends assistance where necessary. The
users would be VIP’s and most likely be using a
device such as this in this type of environment.
5.4. Pre-test Concerns
Prior to the usability tests, a number of tasks
needed to be complete. These included a pre-test
questionnaire (user data was gathered), orientation
(ensure that users were familiar with mouse
operation), thinking aloud scenarios (gather user’s
thoughts) and a pilot test to ensure operation
efficiency. All user information was anonymous
and only a user number made references. The
Human research ethics committee (medical) of
WITS University assessed the proposed testing
methodology and approved the process (protocol
number: R14/49 WING).
2 School for the Visually impaired, based in
Vereeninging. Currently have 143 partially sighted
and blind children (August 2004).
5.5. Tasks and Observations
Several tasks were done to determine the ease
with which the user could operate the device, e.g.
maneuvering objects below the camera. The time
to complete individual tasks was recorded and a
final task was conducted, and was a combination
of the previous tasks.
Should the time to complete that final task be less
than the sum of the subparts, one of the aspects of
usability engineering was met (learnability).
The following user observations were made
(usability objective shown in brackets); time to
complete the tasks (efficiency), number of help
referrals (memorability), number of errors
committed (errors) and finally the number of non-
user errors (program errors, e.g. crashes).
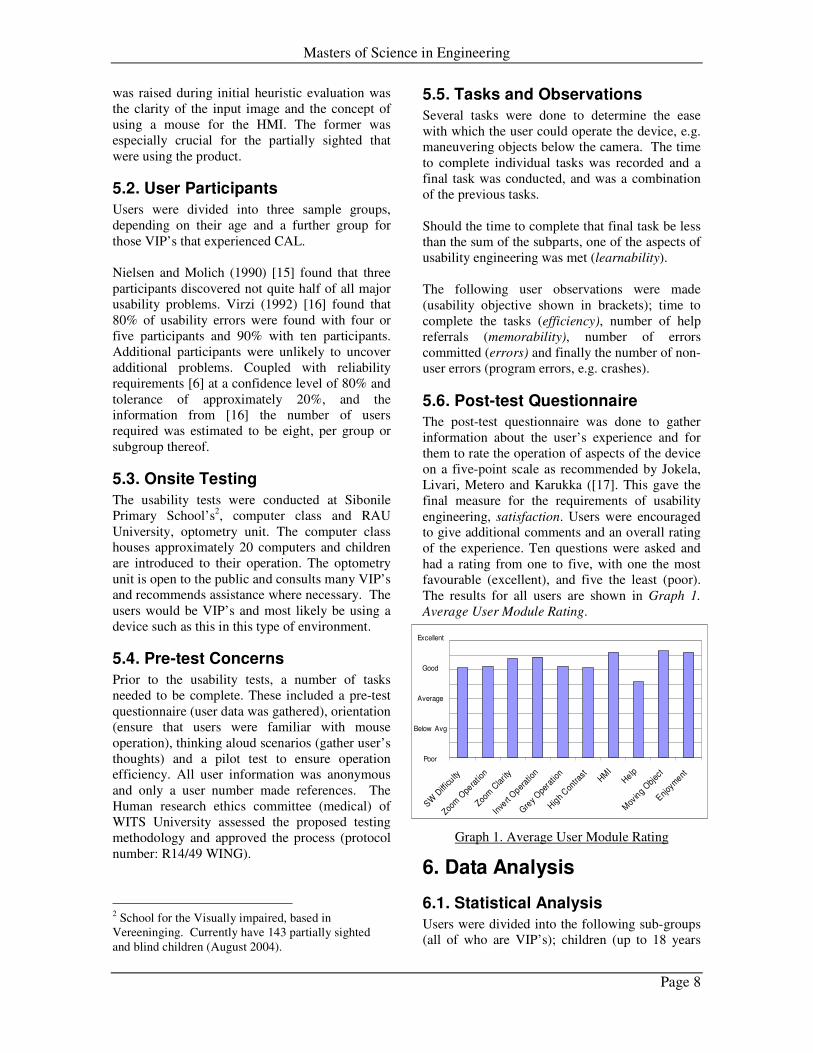
5.6. Post-test Questionnaire
The post-test questionnaire was done to gather
information about the user’s experience and for
them to rate the operation of aspects of the device
on a five-point scale as recommended by Jokela,
Livari, Metero and Karukka ([17]. This gave the
final measure for the requirements of usability
engineering, satisfaction. Users were encouraged
to give additional comments and an overall rating
of the experience. Ten questions were asked and
had a rating from one to five, with one the most
favourable (excellent), and five the least (poor).
The results for all users are shown in Graph 1.
Average User Module Rating.
6. Data Analysis
6.1. Statistical Analysis
Users were divided into the following sub-groups
(all of who are VIP’s); children (up to 18 years
Graph 1. Average User Module Rating
SW D
ifficu
lty
Zoom
Ope
ratio
n
Zoom
Cla
rity
Inve
rt O
perat
ion
Gre
y O
pera
tion
High
Con
trast
HMI
Help
Mov
ing
Obj
ect
Enjoy
ment
Excellent
Good
Average
Below Avg
Poor
Masters of Science in Engineering
Page 9
old) adults (18-50 years), elderly (above 50 years
old), VIP’s with and those without CAL. Once the
data was collected (test participant evaluation and
post-test questionnaire), an analysis was done.
6.2. Observations
A number of observations were made from the
data. These results were taken from the entire
population group, although the individual
subgroups exhibited similar results.
• Many users experienced difficulty with the
centre scroll button, in particular with the
clicking.
• The time to complete a major task, comprised
of a number of smaller tasks, was less than
the sum of these tasks by an average of
23.3%.
• The help document needs to be evaluated as
many users gave poor feedback (average
rating of 2.42; with one being the best
possible rating and 5 being the worst rating).
• The concept of a mouse driven HMI was
favourable with users expressing positive
ratings (average rating of 1.42).
• Although the clarity was questioned during
heuristic evaluation; participant feedback and
ratings for the webcam operation was
favorable (average rating for clarity 1.63 and
operation of 1.89)
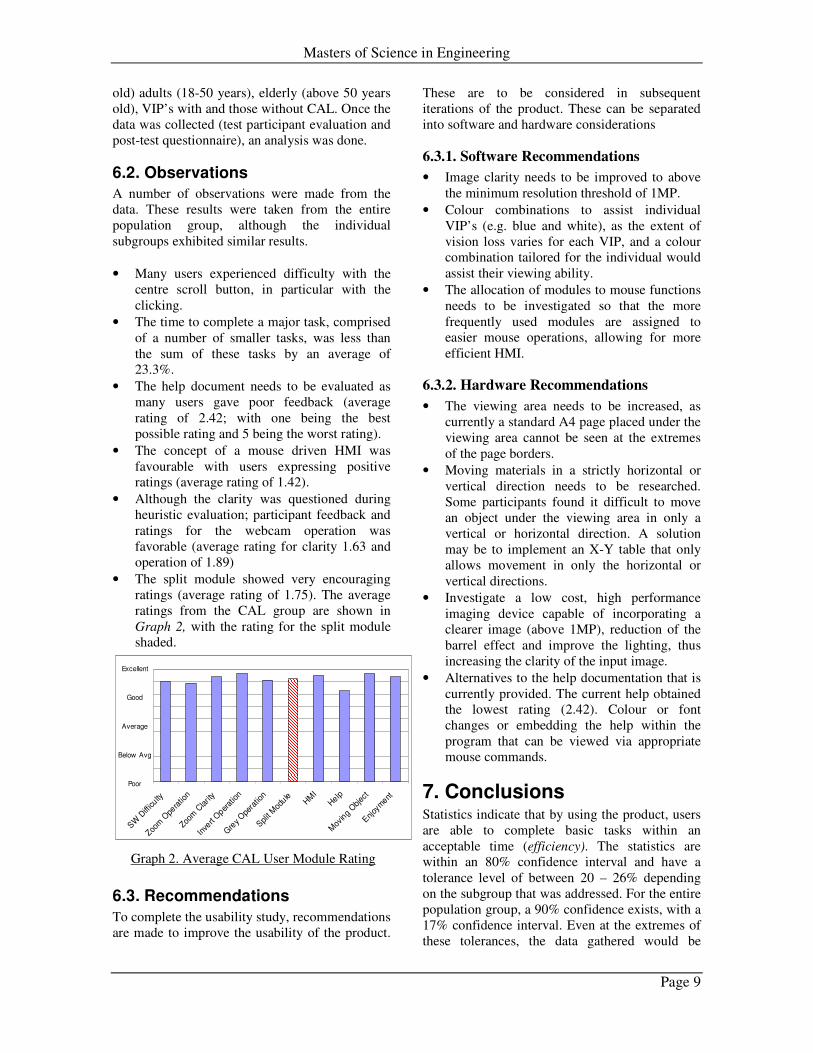
• The split module showed very encouraging
ratings (average rating of 1.75). The average
ratings from the CAL group are shown in
Graph 2, with the rating for the split module
shaded.
6.3. Recommendations
To complete the usability study, recommendations
are made to improve the usability of the product.
These are to be considered in subsequent
iterations of the product. These can be separated
into software and hardware considerations
6.3.1. Software Recommendations
• Image clarity needs to be improved to above
the minimum resolution threshold of 1MP.
• Colour combinations to assist individual
VIP’s (e.g. blue and white), as the extent of
vision loss varies for each VIP, and a colour
combination tailored for the individual would
assist their viewing ability.
• The allocation of modules to mouse functions
needs to be investigated so that the more
frequently used modules are assigned to
easier mouse operations, allowing for more
efficient HMI.
6.3.2. Hardware Recommendations
• The viewing area needs to be increased, as
currently a standard A4 page placed under the
viewing area cannot be seen at the extremes
of the page borders.
• Moving materials in a strictly horizontal or
vertical direction needs to be researched.
Some participants found it difficult to move
an object under the viewing area in only a
vertical or horizontal direction. A solution
may be to implement an X-Y table that only
allows movement in only the horizontal or
vertical directions.
• Investigate a low cost, high performance
imaging device capable of incorporating a
clearer image (above 1MP), reduction of the
barrel effect and improve the lighting, thus
increasing the clarity of the input image.
• Alternatives to the help documentation that is
currently provided. The current help obtained
the lowest rating (2.42). Colour or font
changes or embedding the help within the
program that can be viewed via appropriate
mouse commands.
7. Conclusions Statistics indicate that by using the product, users
are able to complete basic tasks within an
acceptable time (efficiency). The statistics are
within an 80% confidence interval and have a
tolerance level of between 20 – 26% depending
on the subgroup that was addressed. For the entire
population group, a 90% confidence exists, with a
17% confidence interval. Even at the extremes of
these tolerances, the data gathered would be
Graph 2. Average CAL User Module Rating
SW D
ifficu
lty
Zoom
Ope
ratio
n
Zoom
Clarit
y
Inve
rt Oper
atio
n
Gre
y O
pera
tion
Split
Mod
uleHM
IHelp
Mov
ing
Obj
ect
Enjoy
ment
Excellent
Good
Average
Below Avg
Poor
Masters of Science in Engineering
Page 10
acceptable enough to demonstrate a very usable
and effective device (context of use).
The most important finding is that the device
rated favourably in terms of the operation of the
individual modules (satisfaction). Learnability is
observed as the time to complete a major task
comprising of a number of smaller tasks and was
less than the time to complete those individual
smaller tasks (memorability).
With these findings and based upon the definition
of usability engineering (ISO 9241-11 standard
[18], Nielsen (1993) [6]) it can be seen that
usability principles (effectiveness, efficiency,
satisfaction and context of use) have been
successfully implemented into the device, thus
meeting the first goal of the research question.
The “split” module, where a “gap” is inserted into
the image to introduce a paragraph break, has
shown positive results and has been applauded by
heuristic evaluation and may be an additional
approach to alleviate the problems faced by
VIP’s. This could lead to a different mindset and
teaching approach for CAL VIP’s. The very
favourable rating received during the usability
testing, and the numerous comments from CAL
patients that such a module offers much promise
reinforces this claim.
With the low cost of materials in the hardware
and the negligible cost of software development,
it is concluded that this device is affordable
(maximum price of R5,000), while maintaining
functionality to assist the VIP (seven completed
modules). This complies with the second
objective of the research question.
8. References [1] Sokwa,J., Gurwood, A.S., Kabat, A.G.
Handbook of Ocular Disease Management, 5th
Edition. Review of Optometry. Pg 139 (10). 2002.
[2] Retina South Africa. Retinal Degenerative
Disorders. Retina South Africa. N.P.O. Clyde
Printers. NPO number 003-184.
[3] Good, M.D. Software Usability Engineering.
Digital Technical Journal No. 6. Pg 117-124.
1988.
[4] Whiteside, J. A., Bennett, J. L. and Holtzblatt,
K. A. (1988). Usability engineering: Our
experience and evolution. In M. Helander (Ed.),
Handbook of Human-Computer Interaction,
North-Holland, Amsterdam, Pg. 791-817. 1988.
[5] Dumas, J.S & Redish, J.C. A Practical Guide
to Usability Testing, Revised edition. Intellect
Books, Exeter, England, 1993.
[6] Nielsen J. Usability Engineering. Academic
Press, Inc. San Diego, 1993.
[7] Gould, J, Lewis, C. Designing for Usability:
Key Principles and What Designers Think.
Communications of the ACM, Volume 28,3 , Pg
300- 311, 1985.
[8] Nielsen, J. Usability Inspection Methods.
CHI’95 Mosaic of Creativity, Mountain View.
May 7 –11, 1995. Pg 377, 378.
[9] Nielsen, J. Finding Usability Problems
Through Heuristic Evaluation. CHI ’92, May 3-7,
1992.
[10] Doubleday, A., Ryan, M., Springett, M.,
Sutecliffe. A Comparison of Usability Techniques
for Evaluating Design. Centre for HCI Design,
City University, Northampton Square, London.
[11] Jeffries, R., Miller, J. R., Wharton, C.,
Uyeda, K.M. User Interface Evaluation in the
Real World: A Comparison of Four Techniques.
Proc. ACM CHI’91. New Orleans, L.A., 27 April
– 2 May 1989. Pg 119-124.
[12] Borland. Borland Delphi 3. Borland
International Inc. California, United States of
America. Copyright 1995.
[13] DelphiLand. Lesson 1:Turbo Start.
http://www.festra.com/eng. Last Accessed 12
September 2002.
[14] Cantu M. Mastering Delphi 5. Sybex Inc.
Alameda, California, United States of America.
Copyright 1999.
[15] Nielsen, J., Molich, R. Heuristic Evaluation
of User Interfaces. Proc ACM Interchi ’93 Conf.
Seattle, WA, April 1-5. 1990. Pg 249-256.
[16] Virzi, R.A. Refining the Test Phase of
Usability Evaluation: How Many Subjects is
Enough? Human Factors. 1992, pg. 457 –468.

Masters of Science in Engineering
Page 11
[17] Jokela, T., Livari N., Metero, J., Karukka M.
The Standard of User-Centred Design and the
Standard Definition of Usability: Analyzing ISO
13407 Against ISO 9241-11. Ouluo University,
Finland.
[18] ISO/IEC. 9241-14 Ergononomic
requirements for office work with visual display
terminals (VDT)s – Part 14 Menu Dialogues,
ISO/IEC 9241 – 14: 1998 (E), 1998.
[19] Assertive Technology Lending Libraries.
http://disabilities.temple.edu/programs/assistiv
e/atlend/blindequipment.html. Pennsylvania's
Assistive Technology Lending Library. Last
accessed 26 April 2005.
[20] OS. IT Facts.
http://www.itfacts.biz/index.php?id=P1059.
Last accessed 26 April 2005.
Masters of Science in Engineering
Craig Wing Page 12
Conclusion
Based upon the definitions of usability (ISO standards and from Nielsen) and the
extensive research and test participant evaluation, it can be seen that usability
principles (effectiveness, efficiency, satisfaction and context of use) have been
successfully implemented into the device.
The device that was assessed during heuristic evaluation was not the same that was
tested in the user environment, having “evolved” from its initial stage. Modules that
were not needed were removed, and more important modules improved and
streamlined and finally additional modules were added as needed. The process
repeated till the majority of usability errors were recovered.
Of the major findings from the usability test, the most important is that the device
rated favourably in terms of the operation of the individual modules. Concerns raised
by specialists during the heuristic evaluation about the clarity and operation of the
zoom are addressed by the usability participation test, and found to have no basis
when considered against the research question.
Additionally, learnability is observed as the time to complete a major tasks
comprising of a number of smaller tasks, was less than the time to complete the
smaller tasks individually. This indicates that participants were gaining familiarity
with the device after a short period of time.
The major usability problem that was uncovered during the usability test was the
regularity of crashes. Should this problem not be addressed with the next iteration, the
device is rendered useless and does not meet basic usability requirements. The help
documentation needs to be reviewed as it did not receive a favourable rating and may
need to introduce different colours or be supplied with a reading aid, or implemented
within the program itself upon a mouse operation.
The hardware portion of the device needs to be addressed as the viewing area was
smaller than initially hoped as a result of changing the input device, and consideration
given to introduce a X-Y table for horizontal and vertical movement. The input device
needs to be evaluated to improve the clarity of the image to compete with other visual
aids.
The HMI implementation of a mouse driven interface was received with great
approval and user participants and evaluators alike believe that with further use it
could show additional favourable results. Additional thought needs to be given to the
operation of the individual modules with the more often used modules being
associated with easier mouse driven operations.
The “split” module, where a “gap” is inserted into the image to introduce a paragraph
break, has shown positive results and has been applauded by heuristic evaluation and
may be an additional approach to alleviate the problems faced by VIP’s. This could
lead to a different mindset and teaching approach. This is reinforced by the very
favourable rating received during the usability testing (1.75), and the numerous

Masters of Science in Engineering
Craig Wing Page 13
comments from CAL patients that such a module, upon initial reflection, offers much
promise.
Furthermore, statistics indicate that using the product, users are able to complete basic
tasks within an acceptable time and that learning of the product is implemented. The
statistics are within an 80% confidence interval and have a tolerance level of between
20 – 26% depending on the subgroup that was addressed. Even at the extremes of
these tolerances, the data gathered would be acceptable enough to show a very usable
device.
This research indicates that should a user have no prior experience with visual aids,
the proposed device is beneficial in all areas. However, should the user have prior
experience in visual aids; the device does not offer the same quality in terms of image
quality when compared to other available visual aids.
Masters of Science in Engineering
Craig Wing Page 14
References
[1] Wardeiner, M.R What is Usability?
http://www.grc.nasa.gov/WWW/usability/usabilitycss.html. Last accessed 3 June
2004.
[2] Dumas, J.S & Redish, J.C. A Practical Guide to Usability Testing, Revised
edition. Intellect Books, Exeter, England, 1993.
[3] Nielsen J. Usability Engineering. Academic Press, Inc. San Diego, 1993.
[4] ISO/IEC. 9241-14 Ergononomic requirements for office work with visual display
terminals (VDT)s – Part 14 Menu Dialogues, ISO/IEC 9241 – 14: 1998 (E), 1998.
[5] ANSI. Common Industry Format for Usability Test Reports., NCITS 354-
2001,2001.
[6] Jokela, T., Iivari N., Metero, J., Karukka M. The Standard of User-Centred Design
and the Standard Definition of Usability: Analyzing ISO 13407 Against ISO 9241-11.
Ouluo University, Finland.
[7] Bevan, N. Quality in use: incorporating human factors into the software
engineering lifecycle. In ISESS, Pg. 533-522. 1988
[8] ISO, International Organization for Standardization.
http://www.iso.org/iso/en/ISOOnline.frontpage. Last accessed 30 June 2004.
[9] Gould, J, Lewis, C. Designing for Usability: Key Principles and What Designers
Think. Communications of the ACM, Volume 28,3 , Pg 300- 311, 1985.
[10] Good, M.D. Software Usability Engineering. Digital Technical Journal No. 6. Pg
117-124. 1988.
Masters of Science in Engineering
Craig Wing Page 15
[11] Whiteside, J. A., Bennett, J. L. and Holtzblatt, K. A. (1988). Usability
engineering: Our experience and evolution. In M. Helander (Ed.), Handbook of
Human-Computer Interaction, North-Holland, Amsterdam, Pg. 791-817. 1988.
[12] Science. New Project Explores Disability Research. 1984, Pg 157.
[13] Nielsen, J. Usability Inspection Methods. CHI’95 Mosaic of Creativity, Mountain
View. May 7 –11, 1995. Pg 377, 378.
[14] Desurvire, H. W. Faster, Cheaper!! Are Usability Inspection Methods as
Effective as Empirical Testing? Usability Inspection Methods, John Wiley & Sons.
New York. 1994. Pg 173 – 202.
[15] Desurvire, H. W., Kondziela, J.M., Atwood, M.E. What is Gained and Lost when
Using Evaluation Methods Other than Empirical Testing. People and Computers VIZ.
Cambridge University Press, Cambridge, UK. 1992. Pg 89-102.
[16] Karat, C., Campbell, R., Fiegel T. Comparison of Empirical Testing and
Walkthrough Methods in User Interface Evaluation. Proceedings of CHI’92. ACM,
New York. 1992. Pg 397-404.
[17] Nielsen, J. Heuristic Evaluation. Usability Inspection Methods. John Wiley&
Sons, New York. Pg 25-64.
[18] Nielsen, J., Molich, R. Heuristic Evaluation of User Interfaces. Proc ACM
Interchi ’93 Conf. Seattle, WA, April 1-5. 1990. Pg 249-256.
[19] Lewis, C., Polson,P., Wharton, C.,Rieman, J. Testing a Walkthrough
Methodology for Theory-Based Design of Walk-Up-and-Use Interface. Proc ACM
CHI’90 Conf. Seattle, WA, April 1-5.1990, Pg 235-242.
[20] Polson, P., Lewis,C., Rieman, J., Wharton, C. Cognitive Walkthroughs: A
Method for Theory Based Evaluation of User Interfaces. International Journal of
Man-Machine Studies. Vol 36, Ed 5. 1992. Pg 741-773.
Masters of Science in Engineering
Craig Wing Page 16
[21] Wharton, C., Rieman, J., Lewis, C., Polson, P. The Cognitive Walkthrough
Method: A Practitioner’s Guide. Usability Inspection Methods, John Wiley& Sons,
New York. 1994. Pg 105-140.
[22] Kahn, M.J., Prail, A. Formal Usability Inspections. Usability Inspection
Methods, John Wiley& Sons, New York. 1994. Pg 141-172.
[23] Bias, R. Walkthroughs: Efficient Collaborative Testing. IEEE Software. Vol 8,5.
1991. Pg 94-95.
[24] Bias, R. G. The Pluristic Usability Walkthrough: Coordinated Empathies. .
Usability Inspection Methods, John Wiley& Sons, New York. 1994. Pg 65-78.
[25] Bell, B. Using Programming Walkthroughs to Design a Visual Language.
Technical Report, PhD Thesis, University of Colorado, Boulder. CO. 1992.
[26] Wixen, D., Jones, S., Tse, L., Casaday, G., Inspections and Design Reviews:
Framework, History and Reflection. Usability Inspection Methods, John Wiley&
Sons, New York. 1994. Pg 79- 104.
[27] Nielsen, J. Usability Engineering at a Discount. Designing and Using Human –
Computer Interfaces and Knowledge Based Systems. Elseier Science Publishers,
Amsterdam. 1989. Pg 394-401.
[28] Nielsen, J. Finding Usability Problems Through Heuristic Evaluation. CHI ’92,
May 3-7, 1992.
[29] Doubleday, A., Ryan, M., Springett, M., Sutecliffe. A Comparison of Usability
Techniques for Evaluating Design. Centre for HCI Design, City University,
Northampton Square, London.
[30] Jeffries, R., Miller, J. R., Wharton, C., Uyeda, K.M. User Interface Evaluation in
the Real World: A Comparison of Four Techniques. Proc. ACM CHI’91. New
Orleans, L.A., 27 April – 2 May 1989. Pg 119-124.
Masters of Science in Engineering
Craig Wing Page 17
[31] Faulkner, X., Culwin, F. Enter the Usability Engineer: Integrating HCI and
Software Engineering. South Bank University, England.
[32] Myers, B., Robson, M.B. Survey on User Interface Programming. Proc ACM
CHI ’92.
[33] Scown, McManus. Educating Computer People About People and Computers.
Proc. BCS HCI ’95.
[34] Jordan, P. An Introduction to Usability. Taylor and Francis, London. 1998.
[35] Sokwa,J., Gurwood, A.S., Kabat, A.G. Handbook of Ocular Disease
Management, 5th
Edition. Review of Optometry. Pg 139 (10). 2002.
[36] Faye E E, Fischer M, Macular Degeneration,
http://www.lighthouse.org/macular_degeneration.htm. Lighthouse International
Last Accessed 3 June 04.
[37] Wing, C. ELEN455- Preliminary Laboratory Report, School of Electrical and
Information Engineering, University of the Witwatersrand, 2002.
[38] Hackman, G. S., Biers, D.W. Team Usability Testing: Are Two Heads Better
than One? Proceedings of the Human factors Society 36th
Annual Meeting. Santa
Monica, CA. 1992.
[39] South African Department of Labour. Employment Equity Act No. 55 of 1998.
http://www.labour.gov.za/docs/legislation/eea/act98-055.html. Last accessed 19
July 2004.
[40] Avert.org. South Africa HIV/AIDS Statistics.
http://www.avert.org/safricastats.htm. Last Accessed 19 July 2004.
[41] UNAIDS.UNAIDS 2004 Report on the Global Aids Epidemic. International
AIDS Conference, Bangkok, 2004.
Masters of Science in Engineering
Craig Wing Page 18
[42] Eye Centres. What You Should Know About AIDS and Cytomegalovirus (CMV)
Retinitis. http://www.eyecenters.com/aids.html. Last Accessed 19 July 2004.
[43] University of Michigan. Opportunistic Infections.
http://www.med.umich.edu/hivaids/opinf.html. Last accessed 19 July 2004.
[44] National Centre for Infectious Diseases. Cytomegalovirus (CMV) Infection.
http://www.cdc.gov/ncidod/diseases/cmv.htm. Last accessed 19 July 2004.
[45] Better Vision Institute. Vision Conditions: Diabetes and Vision Disorders.
http://www.sola.com/eyesight/about/conditions/diabetes.html. Last Accessed 19
July 2004.
[46] International Diabetes Federation. Global Prevalence of Diabetes. 15th
International Diabetes Federation Congress, Kobe Japan. 1994.
[47] St. Luke’s Cataract and Laser Centre. Diabetic Retinopathy.
http://www.stlukeseye.com/Conditions/DiabeticRetinopathy.asp. Last accessed 19
July 2004.
[48] Bhula Prema B, Digital Magnification Aid For People with Low Vision. 5P/2001,
Department of Electrical Engineering, University of the Witwatersrand,
Johannesburg, 2001.
[49] Lakha V, Digital Magnification Aid For People with Low Vision. 23P/2001,
Department of Electrical Engineering, University of the Witwatersrand,
Johannesburg, 2001.
[50] Borland. Borland Delphi 3. Borland International Inc. California, United States
of America. Copyright 1995.
[51] DelphiLand. Lesson 1:Turbo Start. http://www.festra.com/eng. Last Accessed 12
September 2002.
Masters of Science in Engineering
Craig Wing Page 19
[52] Cantu M. Mastering Delphi 5. Sybex Inc. Alameda, California, United States of
America. Copyright 1999.
[53] Unger E. DirectDraw. http://www.delphi-jedi.org/DelphiGraphics/. 23 July
2004.
E-Mail: [email protected].
[54] Gourvest H. DirectShow. http://www.progdigy.com. 23 July 2004. E-Mail:
[55] Steinman I. DirectShow. http://www.delphi-jedi.org/DelphiGraphics/. 23 July
2004E-Mail: [email protected].
[56] Baumgarten T. DirectXGraphics. 23 July 2004. E-Mail : [email protected].
[57] Orthkon. DXCapture. 23 July 2004. http://www.mp3.com/orthkon.
E-mail: [email protected].
[58] Unknown. DXCommon.
[59] Loboda G.DsZoomNavigtor. version 1.0. 23 July 2004. http://delphistep.cis.si.
E-mail: [email protected].
[60] Sacharowitz H and Leibowitz B, Personal Communication. Rand Afrikaanse
Universiteit, Low Vision Unit.
[61] Delphi. Delphi Help Files. As packaged with Delphi 6.
[62] Bernard M. Personal Communication. Contact Lens Laboratories (PTY) LTD.
[63] Gourvest, H. Prodigy. http://www.progdigy.com/. Last accessed29 July 2004.
[64] Pilu M., Pollard S., A light-weight text image processing method for hanheld
embedded cameras, HP Laboratories, Bristol England, March 2002.
Masters of Science in Engineering
Craig Wing Page 20
[65] Van Huysteen, A and Grove, J. Personal Communication. South African
National Council for the Blind.
[66] Radue, R. Personal Communication. Digital Channel Solutions (Pty) Ltd.
Kyalami.
[67] Cameraman Video Systems. Personal Communication. March 2004.
[68] Frontier Electronics. Personal Communication. Frontier Electronics (Pty) Ltd.
[69] Ericsson, K.A., Simon, H.A. Protocol Analysis. Verbal Reports as Data.
Cambridge, Massachusetts: MIT.
[70] Denning, S., Hoiem, D., Simpson, M., Sullivan K. The Value of Thinking –aloud
Protocols in Industry: A Case Study at the Microsoft Corporation. Proceedings of the
Human Factors Society 34th
Annual Meeting. Santa Monica, CA .Pg 1285- 1289.
[71] Virzi, R.A. Refining the Test Phase of Usability Evaluation: How Many Subjects
is Enough? Human Factors. 1992, pg. 457 –468.
[72] Hel-Or, Y., Elad,M. A Fast Super-Resolution Algorithm, for Pure Translation
Motion and Common Space Invariant Blur. HP Laboratories, Israel. Dec 1998.
[73] Transysm. Transym OCR Software, TOCR Version 1.1.
http://www.sorcery.demon.co.uk/index.html. Last accessed 10 August 2004.
[74] Microsoft. Getting Started!. http://www.windows.com./Last accessed 8 August
2004.
[75] Retina South Africa. Retinal Degenerative Disorders. Retina South Africa.
N.P.O. Clyde Printers. Number 003-184.
[76] World Book Inc. World Book Encyclopaedia -E. World Book Inc, United States
of America, 1984.
Masters of Science in Engineering
Craig Wing Page A1 of A21
Appendix A: Literature Survey
A.1. User Profiles
A.1.1 Structure of the Eye
A.1.2. Macular Degeneration
A.1.3. HIV/AIDS Related
A.1.4. Diabetes
A.1.5. Other Users
A.1.6. Other Vision Disorders
A.2. Usability Engineering
A.2.1. General View of Usability
A.2.2. Usability Engineering
A.3. Usability Testing
A.3.1. Usability Testing Characteristics
A.3.2. Usability Inspection Techniques
A.3.3. Heuristic Evaluation
A.3.4. Usability Lab
A.3.5. Pretest Questionnaire
A.3.6. Posttest evaluation
A.3.7. Performance Measures
A.4. Participant Evaluation
A.4.1. Thinking Aloud
A.4.2. Co-discovery
A.4.3. Active Intervention
A.4.4. Training
A.5. Data Analysis
A.5.1. Tabulating and Summarising Data
A.5.2. Trend Analysis
A.5.3 Outliers
A.6. Usability Engineering Background
A.6.1. Integrating HCI and Software Engineering
A.6.2. Mis-Understanding of Usability Principles
Masters of Science in Engineering
Craig Wing Page A2 of A21
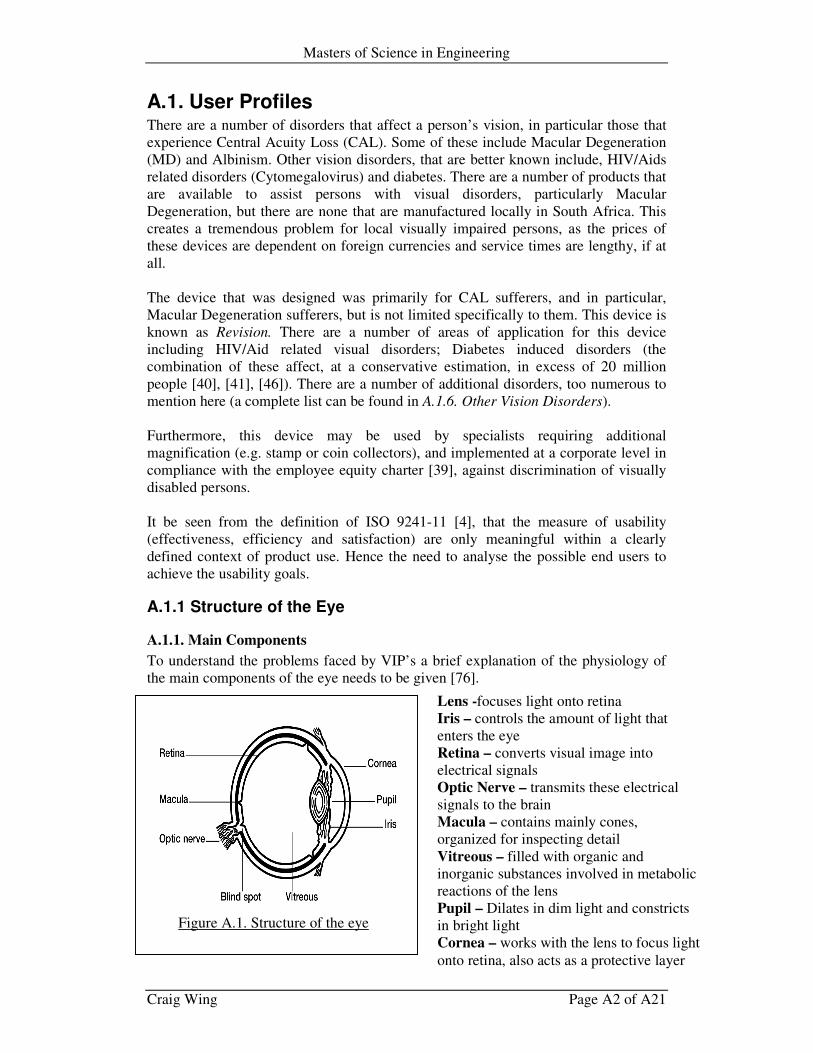
Lens -focuses light onto retina
Iris – controls the amount of light that
enters the eye
Retina – converts visual image into
electrical signals
Optic Nerve – transmits these electrical
signals to the brain
Macula – contains mainly cones,
organized for inspecting detail
Vitreous – filled with organic and
inorganic substances involved in metabolic
reactions of the lens
Pupil – Dilates in dim light and constricts
in bright light
Cornea – works with the lens to focus light
onto retina, also acts as a protective layer
A.1. User Profiles There are a number of disorders that affect a person’s vision, in particular those that
experience Central Acuity Loss (CAL). Some of these include Macular Degeneration
(MD) and Albinism. Other vision disorders, that are better known include, HIV/Aids
related disorders (Cytomegalovirus) and diabetes. There are a number of products that
are available to assist persons with visual disorders, particularly Macular
Degeneration, but there are none that are manufactured locally in South Africa. This
creates a tremendous problem for local visually impaired persons, as the prices of
these devices are dependent on foreign currencies and service times are lengthy, if at
all.
The device that was designed was primarily for CAL sufferers, and in particular,
Macular Degeneration sufferers, but is not limited specifically to them. This device is
known as Revision. There are a number of areas of application for this device
including HIV/Aid related visual disorders; Diabetes induced disorders (the
combination of these affect, at a conservative estimation, in excess of 20 million
people [40], [41], [46]). There are a number of additional disorders, too numerous to
mention here (a complete list can be found in A.1.6. Other Vision Disorders).
Furthermore, this device may be used by specialists requiring additional
magnification (e.g. stamp or coin collectors), and implemented at a corporate level in
compliance with the employee equity charter [39], against discrimination of visually
disabled persons.
It be seen from the definition of ISO 9241-11 [4], that the measure of usability
(effectiveness, efficiency and satisfaction) are only meaningful within a clearly
defined context of product use. Hence the need to analyse the possible end users to
achieve the usability goals.
A.1.1 Structure of the Eye
A.1.1. Main Components
To understand the problems faced by VIP’s a brief explanation of the physiology of
the main components of the eye needs to be given [76].
Figure A.1. Structure of the eye
Masters of Science in Engineering
Craig Wing Page A3 of A21
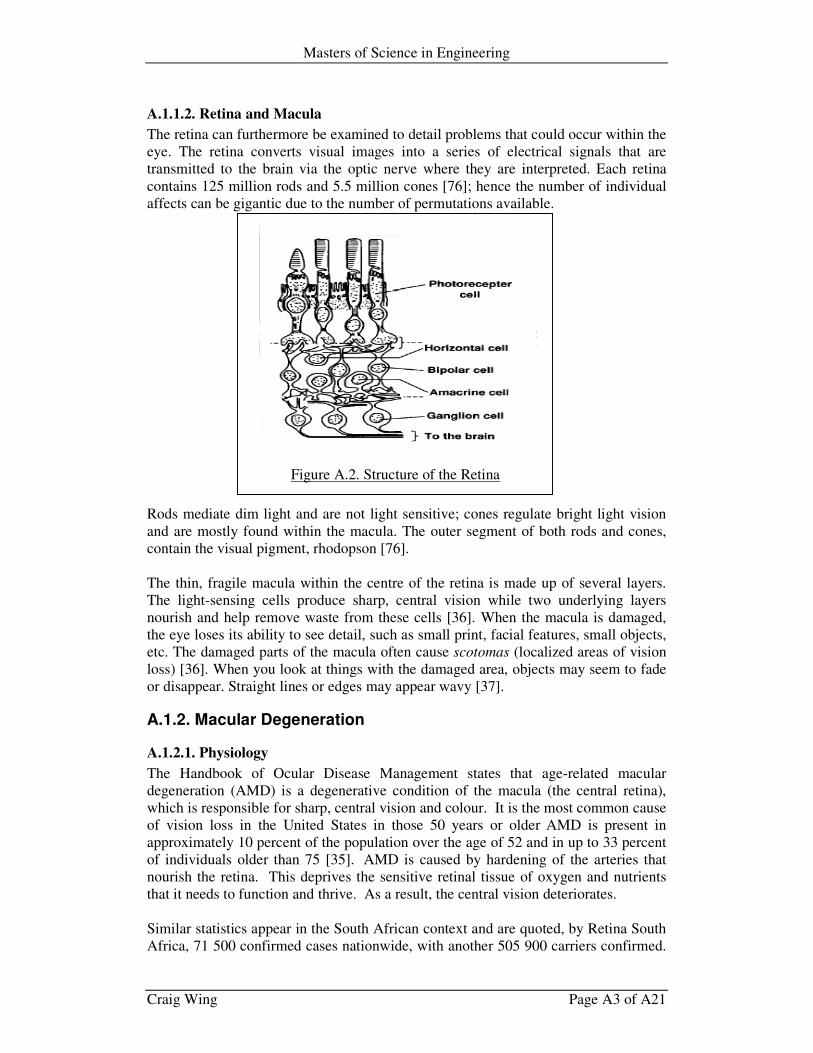
A.1.1.2. Retina and Macula
The retina can furthermore be examined to detail problems that could occur within the
eye. The retina converts visual images into a series of electrical signals that are
transmitted to the brain via the optic nerve where they are interpreted. Each retina
contains 125 million rods and 5.5 million cones [76]; hence the number of individual
affects can be gigantic due to the number of permutations available.
Rods mediate dim light and are not light sensitive; cones regulate bright light vision
and are mostly found within the macula. The outer segment of both rods and cones,
contain the visual pigment, rhodopson [76].
The thin, fragile macula within the centre of the retina is made up of several layers.
The light-sensing cells produce sharp, central vision while two underlying layers
nourish and help remove waste from these cells [36]. When the macula is damaged,
the eye loses its ability to see detail, such as small print, facial features, small objects,
etc. The damaged parts of the macula often cause scotomas (localized areas of vision
loss) [36]. When you look at things with the damaged area, objects may seem to fade
or disappear. Straight lines or edges may appear wavy [37].
A.1.2. Macular Degeneration
A.1.2.1. Physiology
The Handbook of Ocular Disease Management states that age-related macular
degeneration (AMD) is a degenerative condition of the macula (the central retina),
which is responsible for sharp, central vision and colour. It is the most common cause
of vision loss in the United States in those 50 years or older AMD is present in
approximately 10 percent of the population over the age of 52 and in up to 33 percent
of individuals older than 75 [35]. AMD is caused by hardening of the arteries that
nourish the retina. This deprives the sensitive retinal tissue of oxygen and nutrients
that it needs to function and thrive. As a result, the central vision deteriorates.
Similar statistics appear in the South African context and are quoted, by Retina South
Africa, 71 500 confirmed cases nationwide, with another 505 900 carriers confirmed.
Figure A.2. Structure of the Retina
Masters of Science in Engineering
Craig Wing Page A4 of A21
The “carriers” are the parents that have been identified with the responsible gene
(only one of two genes have MD), and “affected” are the children (both genes have
MD). MD occurs when children receive the gene causing MD from both parents. The
distribution of which is as follows [75],
Province Affected Carriers
1. Mnupumalnaga 3 900 35 000
2. Northern Province 3 900 61 000
3. Gauteng 21 500 92 000
4. Kwazulu / Natal 10 400 105 000
5. Freestate 4 900 33 000
6. Western Cape 12 600 49 000
7. Eastern Cape 7 900 79 000
8. Northern Cape 1 800 10 000
9. North West 4 400 41 900
TOTAL 71 300 505 900
These numbers are only of the confirmed numbers and are not of the total infected
population. This can be attributed to the fact that not all MD sufferers will have access
to the appropriate clinics where they can be registered and seek assistance. This is
verified by noting that the largest incidence occurs in Gauteng and Kwazulu / Natal
where clinics are readily available.
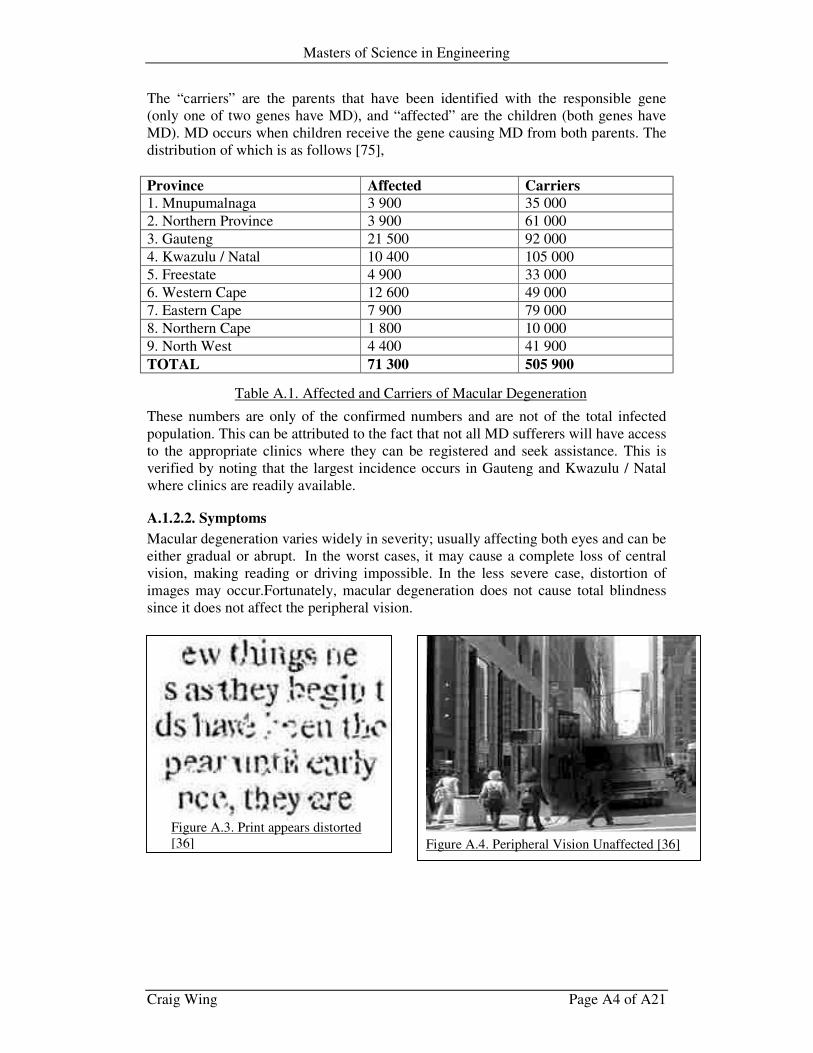
A.1.2.2. Symptoms
Macular degeneration varies widely in severity; usually affecting both eyes and can be
either gradual or abrupt. In the worst cases, it may cause a complete loss of central
vision, making reading or driving impossible. In the less severe case, distortion of
images may occur.Fortunately, macular degeneration does not cause total blindness
since it does not affect the peripheral vision.
Table A.1. Affected and Carriers of Macular Degeneration
Figure A.4. Peripheral Vision Unaffected [36]
Figure A.3. Print appears distorted
[36]
Masters of Science in Engineering
Craig Wing Page A5 of A21
A.1.3. HIV/AIDS Related
The United Nations Programme on HIV/Aids reports that at the end of 2003, an
estimated 37 million people were living with HIV/Aids [41]. It is estimated by the
South African Department of health that in 2001, there were 4.74 million adults
affected with HIV, rising to 5.3 million in 2002 [40].
A.1.3.1 Physiology
There are a number of visual disorders associated with HIV/Aids, including Kaposi’s
sarcoma, HIV retinopathy, syphilis, however the most common is an infection of the
Retina, called Cytomegalovirus (CMV) [42].
CMV is found universally throughout geographical locations and socioeconomic
groups and infects 50 – 80% of the general population show symptoms of CMV [44]
(related to the Herpes Simplex Virus [43]), but it is the combination of CMV and
HIV/Aids that causes CMV Retinitis. CMV occurs in 15-46% of Aids sufferers [42].
A.1.3.2. Symptoms
Results of CMV that ultimately affects the Retina and causes it to separate from the
back of the eye, is known as retinal detachment. Resultant symptoms include
“floaters” or painless loss of central or peripheral vision [42].
A.1.4. Diabetes
A.1.4.1. Physiology
Diabetes is the leading cause of blindness amongst people aged between twenty and
74 [45]. It is estimated that 100 million in the developing world and 75 million people
in developed countries are affected with diabetes [46]. The effect of Diabetes on the
eye is called Diabetic Retinopathy [47] and is the main cause of visual disorders
above cataracts and glaucoma.
A.1.4.2. Symptoms
Over time, Diabetes affects the circulatory system of the Retina. In the earliest phase
(background diabetic retinopathy), the arteries of the retina become weakened and
leak, forming tiny dot like haemorrhages, causing a decrease in vision. The next stage,
proliferate diabetic retinopathy; the retina becomes oxygen deprived causing more
fragile vessels to develop. These vessels are likely to haemorrhage, the resulting blood
flowing to the retina causing “spot” or “floaters”. In the final stages, vessel growth
and scar tissue may eventually lead to more serious problems such as retinal
detachment or glaucoma [47].
Masters of Science in Engineering
Craig Wing Page A6 of A21
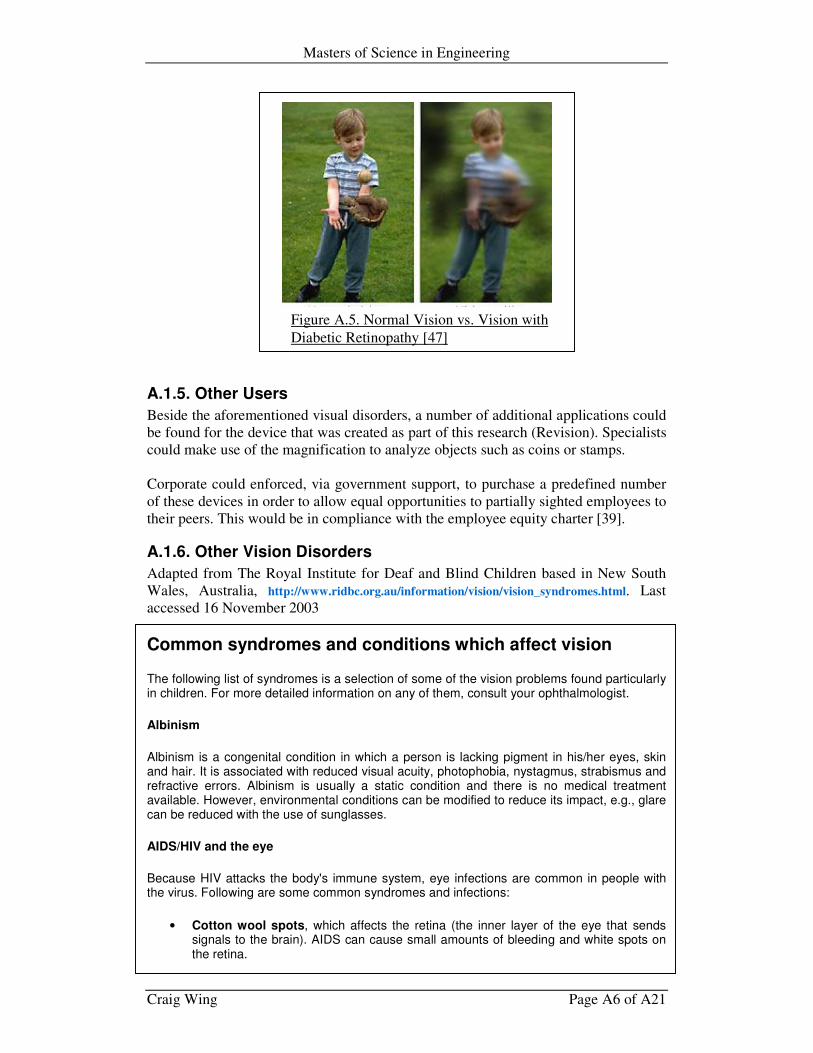
A.1.5. Other Users
Beside the aforementioned visual disorders, a number of additional applications could
be found for the device that was created as part of this research (Revision). Specialists
could make use of the magnification to analyze objects such as coins or stamps.
Corporate could enforced, via government support, to purchase a predefined number
of these devices in order to allow equal opportunities to partially sighted employees to
their peers. This would be in compliance with the employee equity charter [39].
A.1.6. Other Vision Disorders
Adapted from The Royal Institute for Deaf and Blind Children based in New South
Wales, Australia, http://www.ridbc.org.au/information/vision/vision_syndromes.html. Last
accessed 16 November 2003
Common syndromes and conditions which affect vision
The following list of syndromes is a selection of some of the vision problems found particularly in children. For more detailed information on any of them, consult your ophthalmologist.
Albinism
Albinism is a congenital condition in which a person is lacking pigment in his/her eyes, skin and hair. It is associated with reduced visual acuity, photophobia, nystagmus, strabismus and refractive errors. Albinism is usually a static condition and there is no medical treatment available. However, environmental conditions can be modified to reduce its impact, e.g., glare can be reduced with the use of sunglasses.
AIDS/HIV and the eye
Because HIV attacks the body's immune system, eye infections are common in people with the virus. Following are some common syndromes and infections:
• Cotton wool spots, which affects the retina (the inner layer of the eye that sends signals to the brain). AIDS can cause small amounts of bleeding and white spots on the retina.
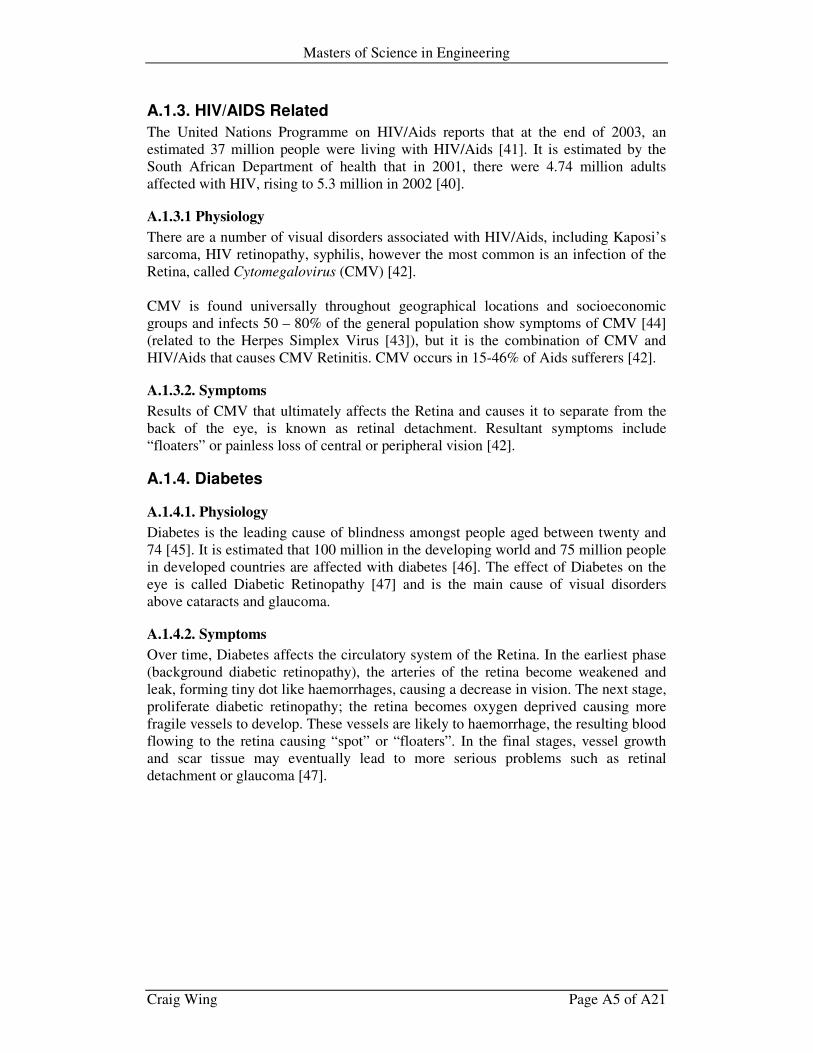
Figure A.5. Normal Vision vs. Vision with
Diabetic Retinopathy [47]
Masters of Science in Engineering
Craig Wing Page A7 of A21
• Cytomegalovirus, (CMV) causes a serious infection of the retina. CMV can harm vision permanently. CMV can cause the retina to separate from the back of the eye (become a detached retina) causing serious vision loss.
Cataracts
Cataracts occur when the lens of the eye clouds, causing blurred vision. They can be present at birth either in one eye or in both. Where sometimes a person's eyes can look red in a photo, a cataract may make the eye look white. Cataracts can develop as the result of injury or metabolic disorders and they often occur in older people. Cataract treatment involves removing the opaque lens surgically. In young babies this is done as soon as possible after diagnosis, whereas in older people a cataract will be removed only when it interferes with the person's daily living. An artificial lens can be inserted after the cataract has been removed, however artificial lenses are not normally implanted in babies until they reach the age of 3-4 years old. Hence, contact lenses and/or glasses must be worn in order to allow normal vision development and to avoid the development of amblyopia.
DC Cortical Vision Impairment (CVI)
This is vision impairment caused by a disorder in the visual areas of the brain or the posterior pathways leading to the brain. It can result from damage to the brain. There is no medical treatment available for CVI, however, there may be an improvement over time in vision as the brain regains function. A person with CVI will often experience fluctuations in vision.
Glaucoma - loss of peripheral vision - adapted from The Canadian National Institute for the
Blind
The basic cause of glaucoma is unknown but a number of risk factors have been identified: these include age, heredity, myopia (near-sightedness), general diseases such as early heart attack and stroke, and raised intraocular pressure (IOP).
Basically, glaucoma is a condition in which pressure of the fluid inside the eye is too high. In its most common form the condition is usually painless and the loss of vision gradual, beginning with the peripheral vision. If glaucoma is diagnosed early - by simple eye test - and treatment followed, progress of the disease can be halted. Treatment may include drops and pills. However if this fails, laser therapy or even surgery may be required.
Macular Degeneration - blurred central vision - adapted from The Canadian National
Institute for the Blind
The most common form of macular degeneration occurs in elderly people.
Macular degeneration occurs when there is damage to the macula, a small area of the retina. The retina is a thin layer of light-sensitive nerve cells and fibres that turns light into an electrical impulse that the brain understands as an image. When the macula is damaged, the retina resembles a camera with a spot on the film. The centre of the field of vision blurs and all detail is lost - macular degeneration occurs.
In a dry type of macular degeneration, symptoms tend to develop over many months or years. In the more severe wet type, leakage and often haemorrhage occur under the macula, causing the symptoms to develop over a short period. Treatment can take the form of laser technology, but in general, people with the condition can usually continue their daily activities using their peripheral vision and making the best of their remaining vision, so that low vision aids can help to make fine work possible.
Masters of Science in Engineering
Craig Wing Page A8 of A21
Nystagmus
Nystagmus is a repetitive involuntary movement of the eyes. The movement can be horizontal, vertical or rotary and can be exacerbated when a person is sick, stressed or tired. The cause can be of a sensory or mechanical nature, whereby the muscles that control the eye are receiving incorrect innervation. Nystagmus can be present on its own and for no apparent reason. It can also occur with a number of other conditions including cataract, albinism, high refractive errors, optic nerve hypoplasia and many more. There is no medical treatment available; however most people with nystagmus have a "null point". The null point is a position of the eyes where the nystagmoid movement is still or very minimal. In order for a person to effectively use his/her null point, they will often adopt a head posture that positions their eyes in the null point.
Refractive Errors
Refractive errors include:
• Myopia (or short-sightedness) where near objects are seen clearer than distant objects
• Hypermetropia (or long-sightedness) where distant objects are seen clearer than near objects
• Astigmatism (distorted vision) due to unevenly shaped cornea (front of eye)
Contact lenses (and glasses) can be safe and effective ways of correcting refractive errors. Contact lenses are small, curved, thin plastic disks designed to cover the cornea, the clear front covering the eye including the iris and the pupil.
Retinitis pigmentosa
Retinitis pigmentosa (RP) refers to a group of diseases that cause slow but progressive loss of vision. RP tends to be an inherited condition where there is a gradual destruction of some of the light sensing cells in the retina (the retina is the tissue lining the inside of the eye that sends visual images to the brain). Common symptoms can occur in the following order: night blindness, tunnel vision, colour vision problems, blurred central vision, loss of central vision.
There is as yet no cure for RP.
Retinopathy of prematurity - ROP
ROP is a disorder of the retina that occurs in some premature babies caused by oxygen treatment after birth. The more premature the baby, the higher the chance of the development of ROP. Sometimes the condition will spontaneously resolve while other babies may need laser treatment, cryopathy and/or surgery. The effects of ROP on vision vary greatly from no perception of light to normal vision.
Strabismus/squint
This occurs when there is a misalignment of the eyes, causing them to look in different directions. Treatment can consist of corrective lenses, patching and surgery. Strabismus can occur on its own or with other disorders such as cataracts. Types of strabismus include:
Esotropia - inward turn of the eye Hypertropia - upward turn of the eye Exotropia - outward turn of the eye Hypotropia - downward turn of the eye
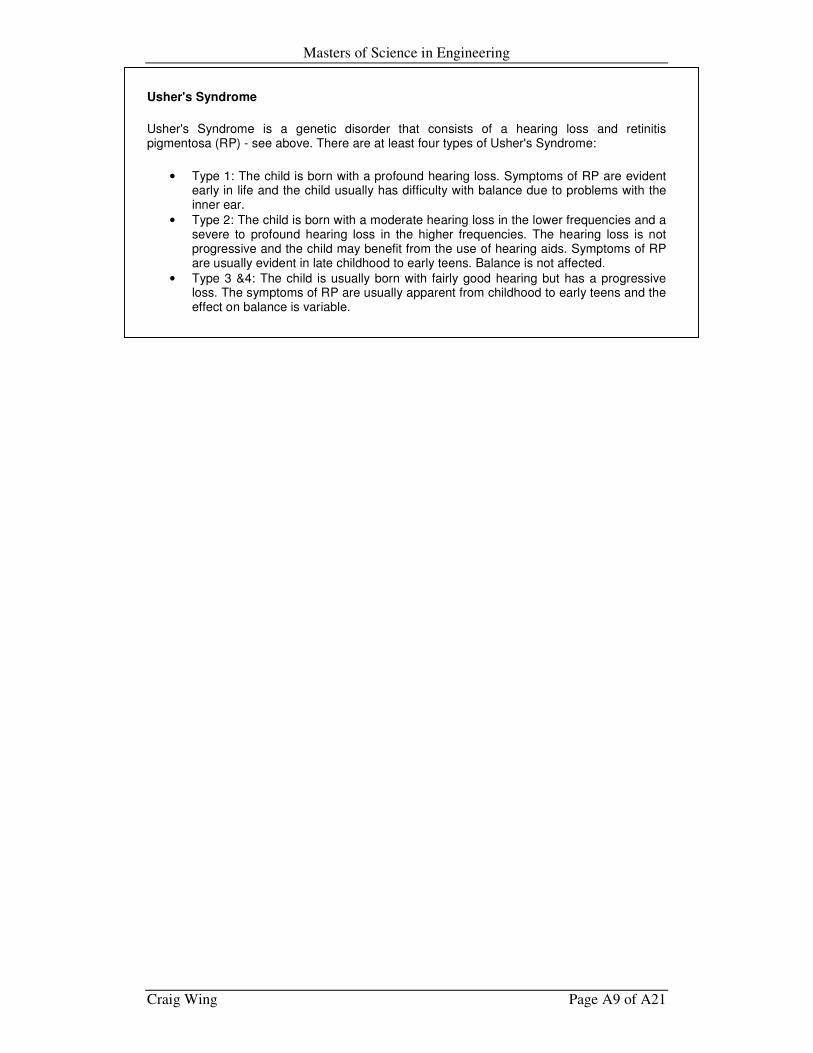
Masters of Science in Engineering
Craig Wing Page A9 of A21
Usher's Syndrome
Usher's Syndrome is a genetic disorder that consists of a hearing loss and retinitis pigmentosa (RP) - see above. There are at least four types of Usher's Syndrome:
• Type 1: The child is born with a profound hearing loss. Symptoms of RP are evident early in life and the child usually has difficulty with balance due to problems with the inner ear.
• Type 2: The child is born with a moderate hearing loss in the lower frequencies and a severe to profound hearing loss in the higher frequencies. The hearing loss is not progressive and the child may benefit from the use of hearing aids. Symptoms of RP are usually evident in late childhood to early teens. Balance is not affected.
• Type 3 &4: The child is usually born with fairly good hearing but has a progressive loss. The symptoms of RP are usually apparent from childhood to early teens and the effect on balance is variable.

Masters of Science in Engineering
Craig Wing Page A10 of A21
A.2. Usability Engineering
A.2.1. General View of Usability
There are a number of definitions for the term Usability, some of which are given by
[1], [2] and [3]. Perhaps the best-known and most utilised definition is by Nielsen [3],
“Usability is about learnability, efficiency, memorability, errors, and satisfaction.”
There is however a standard, that is becoming the main reference of usability- ISO
9241-11 (Guidance on usability) [4], that states “the extent to which a product can be
used by specified users to achieve specified goals of effectiveness, efficiency and
satisfaction in a specific context of use”. Upon further analysis of ISO 9241-11 [4],
we define the following terms;
o Effectiveness: the accuracy and the completeness with which users achieve
specific goals
o Efficiency: the resources expelled in relation to the accuracy and completeness
with which users achieve goals
o Satisfaction: freedom from discomfort and positive attitude to the use of the
product.
o Context of use: characteristic of the users, tasks and the organization and
physical environments.
In addition to being formally recognised in literature and having an ISO standard1,
ISO 9241-11 was recently used in the Common Industry Format, CIF, for usability
testing [5]. This indicates the relevance and importance of the definition as the
creation of CIF was supported by a number of corporations and stakeholders actively
involved in the field of usability engineering [6].
This definition gives a wide approach to usability [7]; usability is about supporting
users in achieving their goals in their work, it is not only a characteristic of a user
interface.
This definition implies that usability is a function of users. Hence the following
important factors emerge,
1. Usability means focusing on users of a product or system: To develop a usable
product, you have to know, understand and work with people who represent
the actual or potential users of the product [2]. This is especially true in Low
Vision field, as the end user has specialised requirements.
2. People use products to be productive: Partially sighted individuals rely more
on “external, third party” devices than their fully sighted peers. Hence the
need becomes necessary that these tools allow them to have the equal
advantages as others in their surroundings.
3. Users Decide when a product is easy to use: To develop usable products, you
need to understand how much time and effort typical users are willing to
spend on figuring out how to do a task with a product [2].
1 International Organization for Standard, World’s largest developer of standards; Network of the
national standards institutes of 148 countries [8]
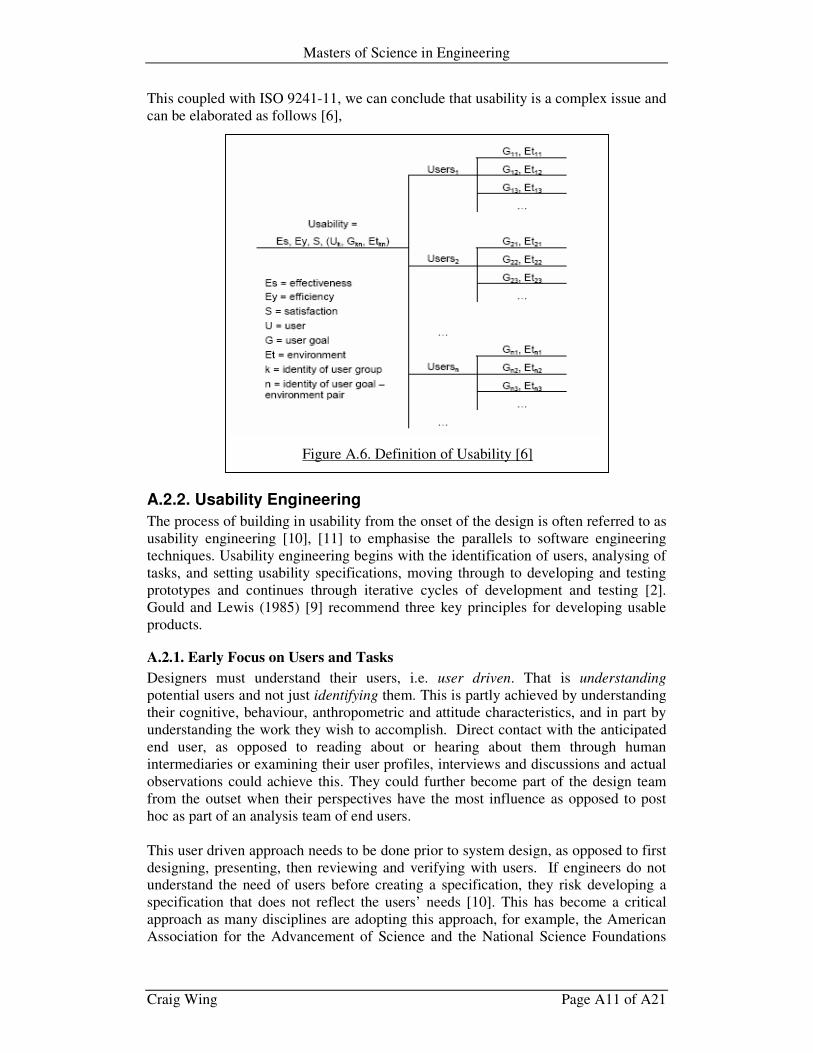
Masters of Science in Engineering
Craig Wing Page A11 of A21
This coupled with ISO 9241-11, we can conclude that usability is a complex issue and
can be elaborated as follows [6],
A.2.2. Usability Engineering
The process of building in usability from the onset of the design is often referred to as
usability engineering [10], [11] to emphasise the parallels to software engineering
techniques. Usability engineering begins with the identification of users, analysing of
tasks, and setting usability specifications, moving through to developing and testing
prototypes and continues through iterative cycles of development and testing [2].
Gould and Lewis (1985) [9] recommend three key principles for developing usable
products.
A.2.1. Early Focus on Users and Tasks
Designers must understand their users, i.e. user driven. That is understanding
potential users and not just identifying them. This is partly achieved by understanding
their cognitive, behaviour, anthropometric and attitude characteristics, and in part by
understanding the work they wish to accomplish. Direct contact with the anticipated
end user, as opposed to reading about or hearing about them through human
intermediaries or examining their user profiles, interviews and discussions and actual
observations could achieve this. They could further become part of the design team
from the outset when their perspectives have the most influence as opposed to post
hoc as part of an analysis team of end users.
This user driven approach needs to be done prior to system design, as opposed to first
designing, presenting, then reviewing and verifying with users. If engineers do not
understand the need of users before creating a specification, they risk developing a
specification that does not reflect the users’ needs [10]. This has become a critical
approach as many disciplines are adopting this approach, for example, the American
Association for the Advancement of Science and the National Science Foundations
Figure A.6. Definition of Usability [6]
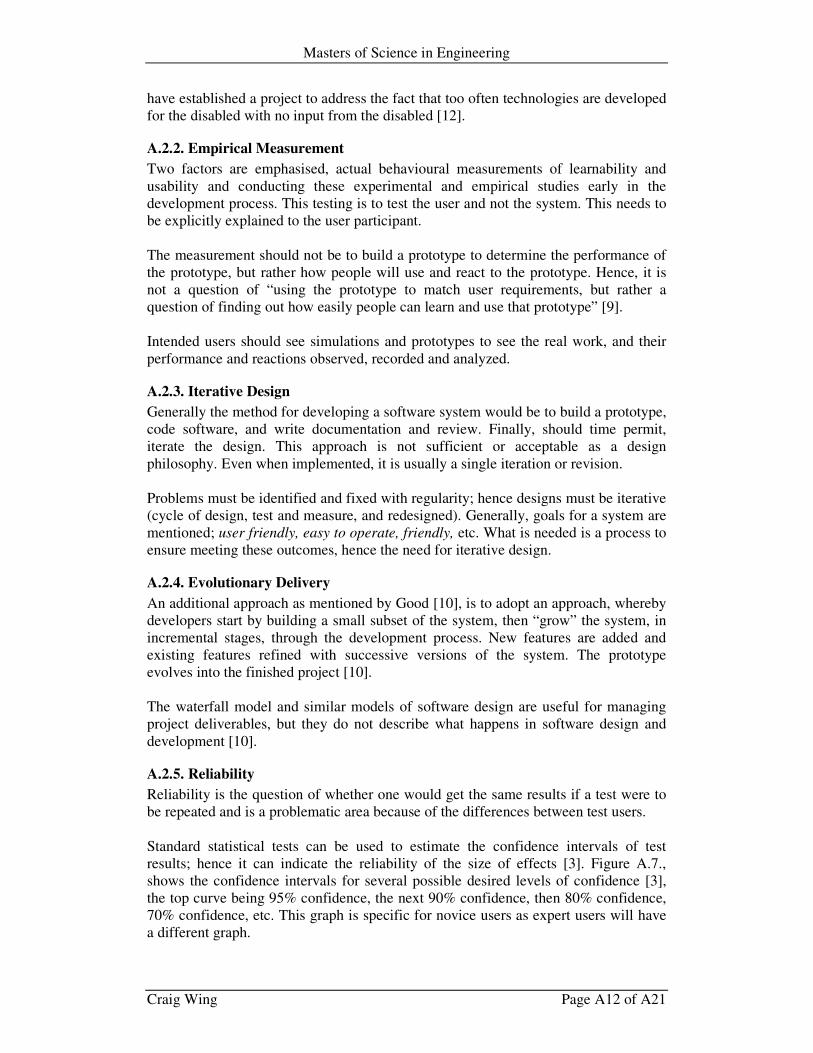
Masters of Science in Engineering
Craig Wing Page A12 of A21
have established a project to address the fact that too often technologies are developed
for the disabled with no input from the disabled [12].
A.2.2. Empirical Measurement
Two factors are emphasised, actual behavioural measurements of learnability and
usability and conducting these experimental and empirical studies early in the
development process. This testing is to test the user and not the system. This needs to
be explicitly explained to the user participant.
The measurement should not be to build a prototype to determine the performance of
the prototype, but rather how people will use and react to the prototype. Hence, it is
not a question of “using the prototype to match user requirements, but rather a
question of finding out how easily people can learn and use that prototype” [9].
Intended users should see simulations and prototypes to see the real work, and their
performance and reactions observed, recorded and analyzed.
A.2.3. Iterative Design
Generally the method for developing a software system would be to build a prototype,
code software, and write documentation and review. Finally, should time permit,
iterate the design. This approach is not sufficient or acceptable as a design
philosophy. Even when implemented, it is usually a single iteration or revision.
Problems must be identified and fixed with regularity; hence designs must be iterative
(cycle of design, test and measure, and redesigned). Generally, goals for a system are
mentioned; user friendly, easy to operate, friendly, etc. What is needed is a process to
ensure meeting these outcomes, hence the need for iterative design.
A.2.4. Evolutionary Delivery
An additional approach as mentioned by Good [10], is to adopt an approach, whereby
developers start by building a small subset of the system, then “grow” the system, in
incremental stages, through the development process. New features are added and
existing features refined with successive versions of the system. The prototype
evolves into the finished project [10].
The waterfall model and similar models of software design are useful for managing
project deliverables, but they do not describe what happens in software design and
development [10].
A.2.5. Reliability
Reliability is the question of whether one would get the same results if a test were to
be repeated and is a problematic area because of the differences between test users.
Standard statistical tests can be used to estimate the confidence intervals of test
results; hence it can indicate the reliability of the size of effects [3]. Figure A.7.,
shows the confidence intervals for several possible desired levels of confidence [3],
the top curve being 95% confidence, the next 90% confidence, then 80% confidence,
70% confidence, etc. This graph is specific for novice users as expert users will have
a different graph.
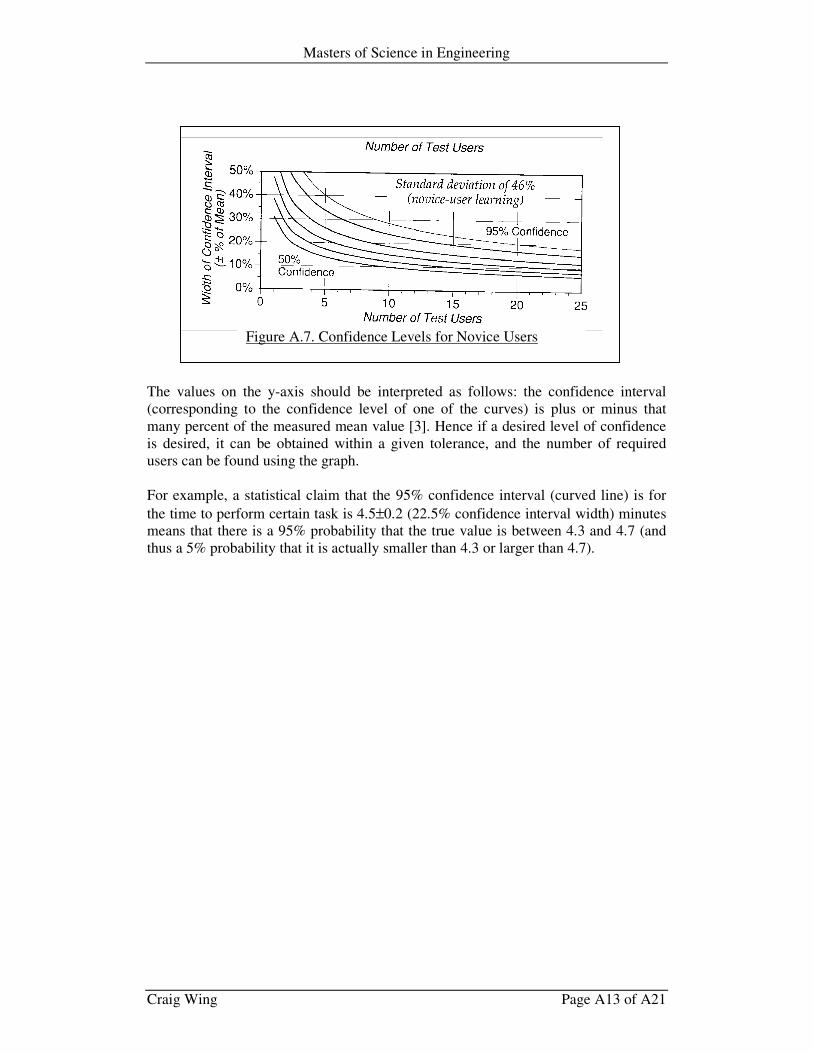
Masters of Science in Engineering
Craig Wing Page A13 of A21
The values on the y-axis should be interpreted as follows: the confidence interval
(corresponding to the confidence level of one of the curves) is plus or minus that
many percent of the measured mean value [3]. Hence if a desired level of confidence
is desired, it can be obtained within a given tolerance, and the number of required
users can be found using the graph.
For example, a statistical claim that the 95% confidence interval (curved line) is for
the time to perform certain task is 4.5±0.2 (22.5% confidence interval width) minutes
means that there is a 95% probability that the true value is between 4.3 and 4.7 (and
thus a 5% probability that it is actually smaller than 4.3 or larger than 4.7).
Figure A.7. Confidence Levels for Novice Users
Masters of Science in Engineering
Craig Wing Page A14 of A21
A.3. Usability Testing Prior to usability testing, the purpose of the testing needs to be clarified, as it will
impact the type of testing to be conducted. There are two types of testing, formulative,
to improve the interface as part of the iteration process. Hence the aim is learn which
aspects of the interface can be improved. The second is summative, where the overall
quality is determined [3].
A.3.1. Usability Testing Characteristics
Though there may be variations to the location and manner of the implemented
usability testing, all usability tests have common characteristics [2].
A.3.1.1. Improve the Usability of the Product
This should be the primary objective of a usability test, with a subsidiary objective
being to improve the process associated with the design and development of the
product so as to avoid the same problems reoccurring. This characteristic
differentiates it from a research study (investigate existence of a phenomena), or a
quality assurance and quality test (determine if the product meets the specifications).
Within the general view of improving the usability, more specific goals can be
specified, e.g. user interface through menus. These more specific goals assist in
identifying which users are appropriate participants for each test and which tasks are
necessary for them to perform [2].
A.3.1.2. Participants are Real Users
If the individuals testing the system are programmers and the system is designed to
assist secretaries, the results will be inaccurate. Similarly, the participants need to be
at the level of experience of end users, as more experience users may circumvent
“minor” problems and lesser-experienced users may cause unnecessary changes and
misuse of resources.
A.3.1.3. Participants do Real Tasks
The tasks must be same that the end user will use the device for, whether it is in their
workplace or home situation. Hence the need becomes clear to adhere to the
principles advocated by [9]. These tasks should have a high probability of uncovering
any usability problems that may be apparent.
A.3.1.4. Observe Participants Behaviour
All aspects of the participants must be observed, albeit performance or comments.
Opinions of the system are also recorded. The usability test must include the time to
complete the tasks with the product and the time to complete questionnaires about the
product.
A.3.1.5. Data Analysis and Recommendations
Data must be collected and analysed with problems identified and addressed. All the
data must be analysed and the qualitative and quantitative information processed
along with own observations and comments. This information is used to diagnose and
document problems as well as make recommended solutions to the problem.
Masters of Science in Engineering
Craig Wing Page A15 of A21
A.3.1.6. Results are Applied
As mentioned above, this information can be used to address problems with the
product and/or the process. A usability test is only successful if it improves the
product tested and the process in which it was developed [9].
A.3.2. Usability Inspection Techniques
Usability inspection is the general name of having evaluators inspect an interface by
using a set of cost effective ways of evaluating user interfaces to find usability
problems [13]. Several studies have shown that a combination of usability inspection
methods and user testing may find most usability problems [14], [15], [16]. There are
a number of inspection methods namely [13],
o Heuristic Evaluation [17], [18] most informal method and involves having
usability specialists evaluate the user interface to determine if usability
principles are adhered to (See Below for more information). This method is
intended as a “discount usability Engineering” method [3], [27]
o Cognitive Walkthrough [19], [20], [21] uses an explicit procedure whereby
user’s problem solving process is simulated. It then checks if the simulated
user’s goals and memory can be assumed to lead to the next correct action.
o Formal Usability Inspection [22] uses a six-step procedure with strictly
defined roles to combine heuristic evaluation and a simplified form of
cognitive walkthroughs.
o Pluralistic Walkthrough [23], [24] are meetings where users, developers and
human factors specialists step through a scenario, discussing each dialogue
element [13].
o Feature Inspection [25] lists a sequence of features used to accomplish tasks,
both simple and complex, in order to assess a proposed feature set.
o Consistency Inspection [26] uses designers that represent multiple projects to
determine consistency between their projects.
o Standards Inspection [26] where an expert on an interface standard inspects
the interface for compliance
A.3.3. Heuristic Evaluation
This technique warrants further explanation as it is the most used technique. The goal
of heuristic evaluation is the finding of usability problems in an existing design, such
that they can be addressed in subsequent iterations [28], [29]. This technique was
originally developed for evaluators that had experience with usability principles, but
were not experts in this field [18].
According to the findings of Nielsen [28], usability specialists find more errors than
non-specialists and that those with experience in the applicable interface are more
likely to find errors. Furthermore, groups of “double “(experience in both usability
and the applicable area of application) and regular usability specialists perform better
than groups of novice evaluators.
It was concluded by [28],that between three and five regular usability specialists will
recover between 74% and 87% of all usability problems, two or three “double”
specialists will find between 81% and 90% of errors and finally, a group of fourteen is
necessary to find more than 75% of the usability problems. The results are shown
graphically as follows,
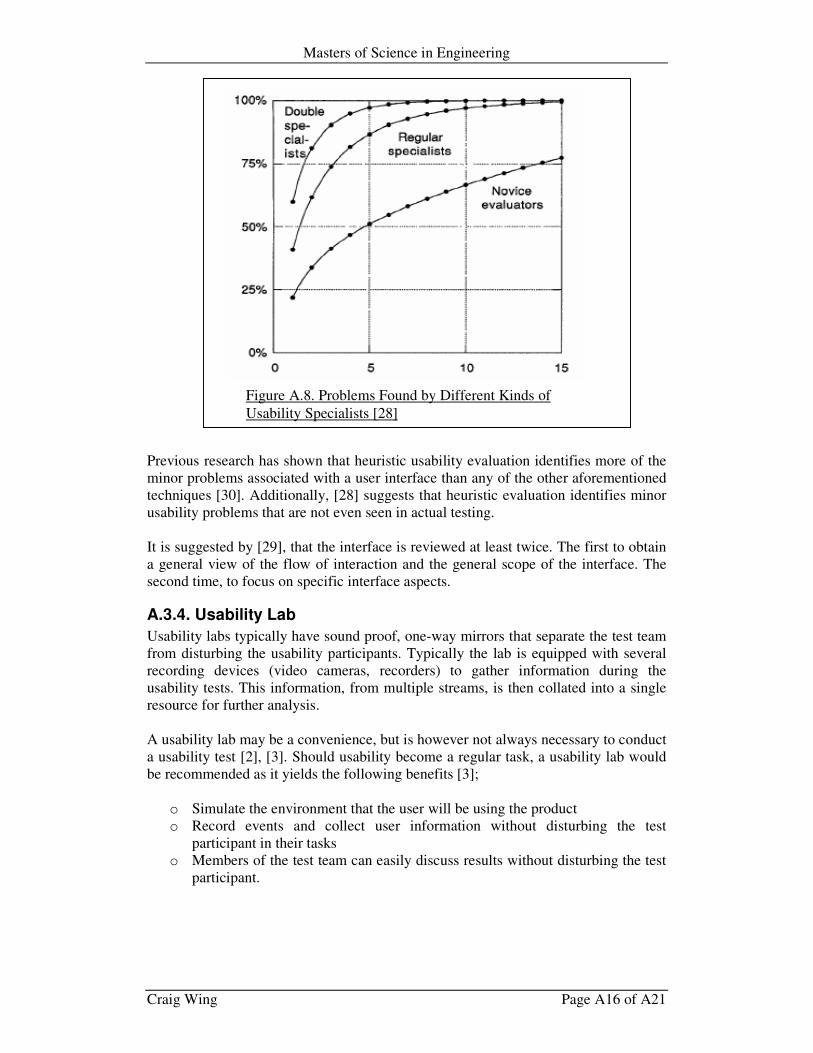
Masters of Science in Engineering
Craig Wing Page A16 of A21
Previous research has shown that heuristic usability evaluation identifies more of the
minor problems associated with a user interface than any of the other aforementioned
techniques [30]. Additionally, [28] suggests that heuristic evaluation identifies minor
usability problems that are not even seen in actual testing.
It is suggested by [29], that the interface is reviewed at least twice. The first to obtain
a general view of the flow of interaction and the general scope of the interface. The
second time, to focus on specific interface aspects.
A.3.4. Usability Lab
Usability labs typically have sound proof, one-way mirrors that separate the test team
from disturbing the usability participants. Typically the lab is equipped with several
recording devices (video cameras, recorders) to gather information during the
usability tests. This information, from multiple streams, is then collated into a single
resource for further analysis.
A usability lab may be a convenience, but is however not always necessary to conduct
a usability test [2], [3]. Should usability become a regular task, a usability lab would
be recommended as it yields the following benefits [3];
o Simulate the environment that the user will be using the product
o Record events and collect user information without disturbing the test
participant in their tasks
o Members of the test team can easily discuss results without disturbing the test
participant.
Figure A.8. Problems Found by Different Kinds of
Usability Specialists [28]
Masters of Science in Engineering
Craig Wing Page A17 of A21
A.3.5. Pretest Questionnaire
The purpose of the pretest questionnaire is to gather data on the qualifications of the
test participant. This data will be used to interpret the data once the usability test is
concluded
A.3.6. Posttest evaluation
Once the test has been completed, data is gathered to obtain users usability
perspective of the product. It is crucial that during the conducting of this test that
evaluators do not attempt to influence feedback from the users.
There are two types of questions in conducting a posttest questionnaire – General and
Specific.
A.3.6.1. General Questions
These questions could apply to any product and may include the following [2];
o How do you rate the overall ease of use or difficulty?
o What do you like most/least about the product?
o How easy was it to find information in the help manual?
A.3.6.2. Specific Questions
Evaluators are able to use this to address specific usability issues in their product.
Often the designers will know the areas of concern and these areas may be addressed
at this stage.
A.3.7. Performance Measures
User performance is always measured by evaluating test users perform a predefined
set of tasks while collecting the time and error data [3]. In order for the performance
to be clearly measure, the exact goals need to be determined, with even smaller
objectives defined. It is important, while evaluating, that a clear definition exists as to
when a task starts and ends. These are known as performance measures. Typical
quantifiable usability measurements may include [2], [3];
o Time to complete a specific task
o Number of errors committed during a task
o Frequency of referrals to help/manual
o Observations of frustration
o Observations of confusion
An additional area is to collect the subjective measures. That is people’s perceptions,
opinions and judgements and can be quantitative or qualitative. For example, asking
users questions and getting them to rate on a five point scale and ask about the
difficulty. The judgement is then subjective, but a quantitative response is drawn [3].
Some examples of subjective measures are,
o Ratings of ease of learning
o Using the product
o Ease of completing a particular task
Masters of Science in Engineering
Craig Wing Page A18 of A21
A.4. Participant Evaluation Generally, usability testing is done with one participant working at a time. Help is
typically available, but is only used when asked by the participant. This is done to
simulate the environment that the product will be used in. The participants need to be
encouraged to “thinking aloud” their thought process as they complete required tasks.
A.4.1. Thinking Aloud
This may be the single most valuable usability engineering technique [3]. Essentially
it involves a test participant verbalizing their thoughts while they use a product. This
allows the evaluator the opportunity to understand how the user evaluates the system
and identify its major shortcomings [3]. This method was initially used as a
psychological research method [69], but has more recently been used as a practical
evaluation tool for HMI’s [70].
The problem with this technique is that often users find thinking out loud as
unnatural. This may make a user test more difficult to conduct and “skew” results
shown under test conditions (slow the process, problem solving abilities may be
reduced).
There have been two additional techniques that have proven to be successful [2], Co-
discovery and active intervention.
A.4.2. Co-discovery
Two participants work together and to perform the required tasks. In the process, they
will talk to each other. This is more effective as talking to another person is more
natural than speaking aloud. Hence, co-discovery typically reveals more information
into what the users are thinking and the strategies involved in solving the tasks.
Hackman and Biers [38], confirm that co-discovery participants make useful
comments that provide insight into design.
A.4.3. Active Intervention
Active intervention is when an evaluator sits with the participant and takes a more
active role on the test. These activities could include, questioning the participants
actions, probing the participant actions and understanding. This is contrary to the
more standard technique of questioning at the end, as during the process, thoughts are
“fresh” and more insight is obtained into the participants evolving mental mode of the
project. Furthermore, an impression given after a task is complete is often sketchy and
may gloss over difficulties that were eventually overcome [9].
Additionally, this is useful as it was found by [29], that most users don’t access help,
even if they are struggling. It was further found that only 10% of all users utilise the
help available [29].
This technique is particularly useful early on in the design process especially when
used with prototypes, as it provides a wealth of diagnostic information. This method
is not recommended should timing be a crucial factor [2]. In order for this test to be
implemented successfully, goals and concerns need to be planned beforehand, as well
Masters of Science in Engineering
Craig Wing Page A19 of A21
as the questions, probes and care needs to be taken as not to bias participants by
asking leading questions [2], [9].
A.4.4. Training
The essential objective is to allow all users the opportunity to begin testing from the
same level of skill or knowledge. A training script needs to be made to ensure that all
users receive the same level of training. It is rare that a test is started without training
being done first [2].
A.5. Data Analysis Usability tests generate a large amount of data. Some of the data collected may
include the following [2],
o Problematic areas in the system
o Quantitative data on times, errors and other performance measures
o Qualitative data on subject ratings and other questions during after the session
o Participants comments and/or recommendations
o Additional notes from the test team, made during the interview process.
o Background data on each of the users, including experience and applicability
in the chosen areas.
This data needs to be analysed to overcome “real” problems that the eventual end user
may have. It is recommended that all problems be grouped together to determine the
applicability of problems mentioned. This would give a framework for considering
the data in totality.
A.5.1. Tabulating and Summarising Data
This will aid in the collecting and analysis of the quantitative data. It is recommended
that the information be collated into a spreadsheet as this will aid in the statistical
analysis. Statistics that may be valuable include, the frequency of scores, average (or
median) of values, amount of variability (range of scores) [2].
A.5.2. Trend Analysis
Usability testing is an empirical evaluation method, hence the problems found will
need to be justified by the data collected. Trends will give an indication that the
problem is commonplace and not an isolated occurrence. It should be noted that
trends might be due to the experience of the users in question.
A.5.3 Outliers
This is a value that is much more different from the other values and could indicate a
substantial problem for an (group of) individual. These values need to be taken
seriously as when the number of participants is small, the one value may be indicative
of a larger subset of eventual users that will experience similar problems. It may be
that the outlier is an anomaly, but this can only be validated by iterative testing [2],
with persons with a similar background and experience.
Masters of Science in Engineering
Craig Wing Page A20 of A21
A.6. Usability Engineering Background
A.6.1. Integrating HCI and Software Engineering
Human – computer interaction (HCI) may be taught in departments of psychology,
cognitive science or ergonomics as well as certain departments of computing [31].
However, many of these students have little or no training in software engineering,
hence they lack credibility when they interact with and attempt to influence attitudes
and activities of commercial programmers. Additionally, many software engineers
have very limited, if any, experience in usability and user needs. This is astounding as
between 50% and 80% of all source code is concerned with user interface [32], [33].
Users want systems to work for them and not the other way around [34]
HCI is often only taught at a theoretical level and not implemented in practice.
Engineers frequently concern themselves with the operation of the system and see
interfaces as a means to an end. Hence usability has suffered and the HCI often been
neglected. Additionally, an increasing number of tools make it possible to design a
graphical user interface (GUI), (Visual Basic, Delphi, etc.) These tools undermine the
complexities involved with the development of a user interface that has sound
software engineering and usability principles, i.e. the use of these tools are not
governed by usability considerations or even of the principles of software engineering
[31].
It is concluded by [31] that “a unification of HCI and software engineering knowledge
is required in order that the accumulated expertise of both communities can be
effectively employed for the benefit of the end users”. This person be termed a
usability engineer and would see the product through from the start to the end of the
process. Additionally, as they would posses firm understanding of both the principles
of software engineering and an appreciation of the needs of the user, these engineers
would be capable of designing a system that users need and deserve [31].
A.6.2. Mis-Understanding of Usability Principles
Usability engineering has been recommended since the 1970’s [9], it has however not
been well established into the design cycle of most products. To understand the
misconception and applicability of usability, Gould and Lewis [9], conducted a survey
in 1981/1982, during which they had five groups of system planners, designers,
programmers and developers detail the major steps to be followed in developing and
evaluating a new computer system for end users. The selected individuals (447
people) were attending human factors talk and were the ones designing interfaces
based upon usability principles. Hence they provided an excellent indication of the
intuitiveness, obviousness, regularly advocated and practised the principles of
usability engineering [9].
The responses to basic questions surrounding usability were graded very liberally,
with credit given for the mere mention of factors relating to any of the three factors
(See below) mentioned above [9], irrespective of the lack of completeness or degree
of “correctness”.
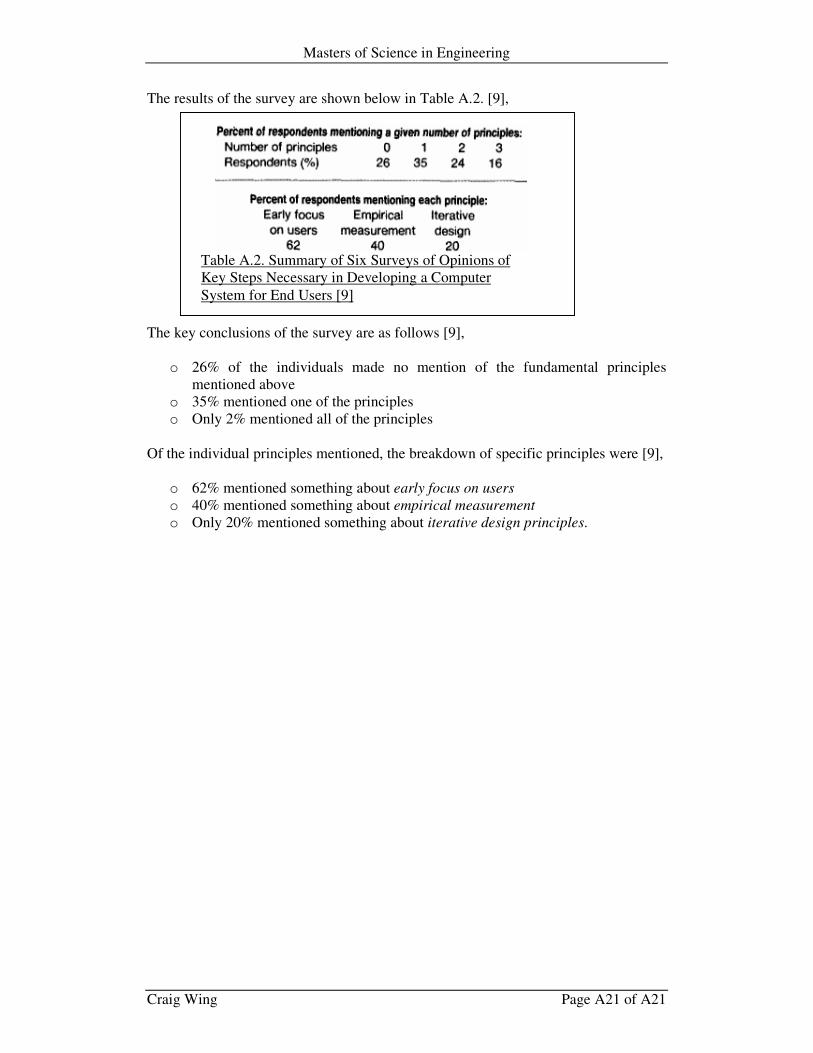
Masters of Science in Engineering
Craig Wing Page A21 of A21
The results of the survey are shown below in Table A.2. [9],
The key conclusions of the survey are as follows [9],
o 26% of the individuals made no mention of the fundamental principles
mentioned above
o 35% mentioned one of the principles
o Only 2% mentioned all of the principles
Of the individual principles mentioned, the breakdown of specific principles were [9],
o 62% mentioned something about early focus on users
o 40% mentioned something about empirical measurement
o Only 20% mentioned something about iterative design principles.
Table A.2. Summary of Six Surveys of Opinions of
Key Steps Necessary in Developing a Computer
System for End Users [9]

Masters of Science in Engineering
Craig Wing Page B1 of B11
Appendix B: Prototype Description
B.1. Background
B.1.1. Initial Version - Magnificam
B.1.2. Project History
B.1.3. Design Goals
B.1.4. Software Language
B.1.5. Design Process
B1.6. Principle of Operation
B.2. Initial Prototype
B.2.1. Get Video Module
B.2.2. Snapshot Viewer Module
B.2.3. Invert Image Module
B.2.4. Splitter Module
B.2.5. Wrap Around Module
B.2.6. Configuration Module
B.2.7. OCR and Speech engine integration
B.2.8. Hardware Stands
B.2.9. Counter Acting lens
B.2.10. Lighting
Masters of Science in Engineering
Craig Wing Page B2 of B11
B.1. Background
B.1.1. Initial Version - Magnificam
This project was initiated in 2001 as the final year design project to fulfill
requirements for a Bsc (Eng)/ Elect degree at the University of the Witwatersrand.
The Optometry and Orphomology unit at the Rand Afrikaans University initially
requested it. The project was required to create a digital magnification device for
people with “Low Vision” using a webcam and enhance the input image. The project
was termed “Magnificam” [48], [49], and achieved limited success in terms of
functionality
B.1.2. Project History
8.1.2.1. Undergraduate Project
The project was offered in 2002, again to fulfill the requirements of the Bsc (Eng)/
Elect degree. Two groups undertook this project with two students each. The working
arrangement was then that the two groups work independently and the results, upon
completion, analyzed. Upon successful completion of the project and subsequent
qualification, the project was left as the relevant parties took up positions in the
working environment.
B.1.2.2. Postgraduate Studies
In the middle of 2003, amid constant consultation with the project supervisor,
Professor Barry Dwolatzky, the author returned to continue work on the project as
part of a postgraduate dissertation.
B.1.3. Design Goals
The project was given with very broad goals,
o The input device needed to be a low cost device; a webcam was supplied
(Logitech Quickcam Pro 3000).
o The Device had to assist “Low Vision” sufferers using a software approach.
With no experience in the field of low vision, in depth research had to be undertaken
to obtain an understanding of the current industry standards and customer profile and
needs. This would initially be conducted from the specialists (optometrists, etc.) [60],
[65], then with the partially sighted themselves.
B.1.4. Software Language
B.1.4.1. Performance Criteria
A number of programming languages were considered, but the criteria was that the
selected language needed to be an object orientated language (OOL), and be able to
operate in a modular fashion, as well have plentiful resources available. In addition,
the selected package needed to have a powerful compiler to handle real time
applications.
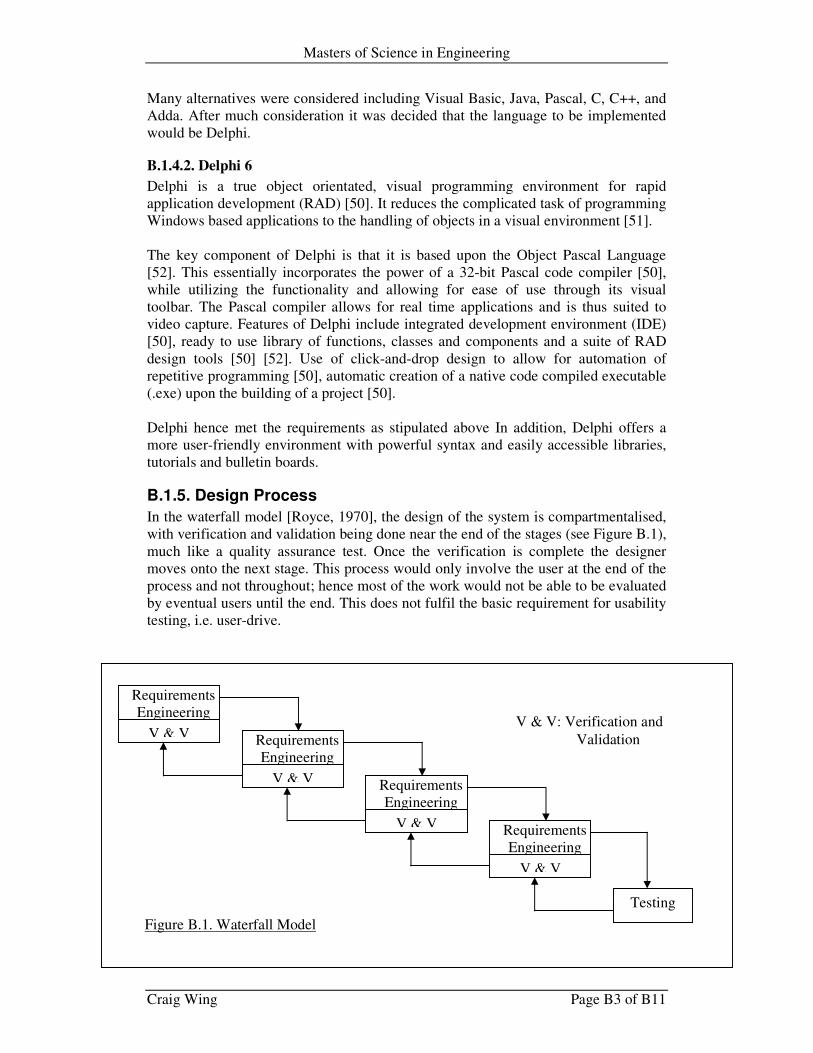
Masters of Science in Engineering
Craig Wing Page B3 of B11
Requirements
Engineering
V & V Requirements
Engineering
V & V Requirements
Engineering
V & V Requirements
Engineering
V & V
Testing
V & V: Verification and
Validation
Figure B.1. Waterfall Model
Many alternatives were considered including Visual Basic, Java, Pascal, C, C++, and
Adda. After much consideration it was decided that the language to be implemented
would be Delphi.
B.1.4.2. Delphi 6
Delphi is a true object orientated, visual programming environment for rapid
application development (RAD) [50]. It reduces the complicated task of programming
Windows based applications to the handling of objects in a visual environment [51].
The key component of Delphi is that it is based upon the Object Pascal Language
[52]. This essentially incorporates the power of a 32-bit Pascal code compiler [50],
while utilizing the functionality and allowing for ease of use through its visual
toolbar. The Pascal compiler allows for real time applications and is thus suited to
video capture. Features of Delphi include integrated development environment (IDE)
[50], ready to use library of functions, classes and components and a suite of RAD
design tools [50] [52]. Use of click-and-drop design to allow for automation of
repetitive programming [50], automatic creation of a native code compiled executable
(.exe) upon the building of a project [50].
Delphi hence met the requirements as stipulated above In addition, Delphi offers a
more user-friendly environment with powerful syntax and easily accessible libraries,
tutorials and bulletin boards.
B.1.5. Design Process
In the waterfall model [Royce, 1970], the design of the system is compartmentalised,
with verification and validation being done near the end of the stages (see Figure B.1),
much like a quality assurance test. Once the verification is complete the designer
moves onto the next stage. This process would only involve the user at the end of the
process and not throughout; hence most of the work would not be able to be evaluated
by eventual users until the end. This does not fulfil the basic requirement for usability
testing, i.e. user-drive.
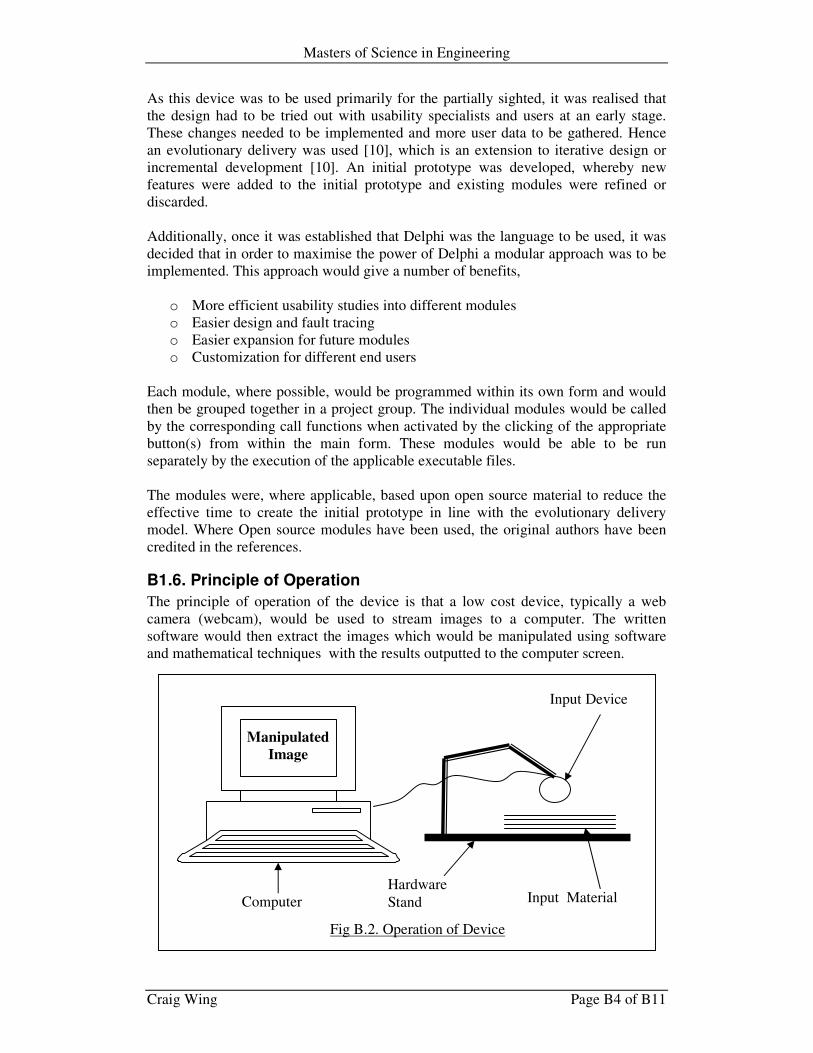
Masters of Science in Engineering
Craig Wing Page B4 of B11
As this device was to be used primarily for the partially sighted, it was realised that
the design had to be tried out with usability specialists and users at an early stage.
These changes needed to be implemented and more user data to be gathered. Hence
an evolutionary delivery was used [10], which is an extension to iterative design or
incremental development [10]. An initial prototype was developed, whereby new
features were added to the initial prototype and existing modules were refined or
discarded.
Additionally, once it was established that Delphi was the language to be used, it was
decided that in order to maximise the power of Delphi a modular approach was to be
implemented. This approach would give a number of benefits,
o More efficient usability studies into different modules
o Easier design and fault tracing
o Easier expansion for future modules
o Customization for different end users
Each module, where possible, would be programmed within its own form and would
then be grouped together in a project group. The individual modules would be called
by the corresponding call functions when activated by the clicking of the appropriate
button(s) from within the main form. These modules would be able to be run
separately by the execution of the applicable executable files.
The modules were, where applicable, based upon open source material to reduce the
effective time to create the initial prototype in line with the evolutionary delivery
model. Where Open source modules have been used, the original authors have been
credited in the references.
B1.6. Principle of Operation
The principle of operation of the device is that a low cost device, typically a web
camera (webcam), would be used to stream images to a computer. The written
software would then extract the images which would be manipulated using software
and mathematical techniques with the results outputted to the computer screen.
Computer
Input Device
Input Material Hardware
Stand
Manipulated
Image
Fig B.2. Operation of Device
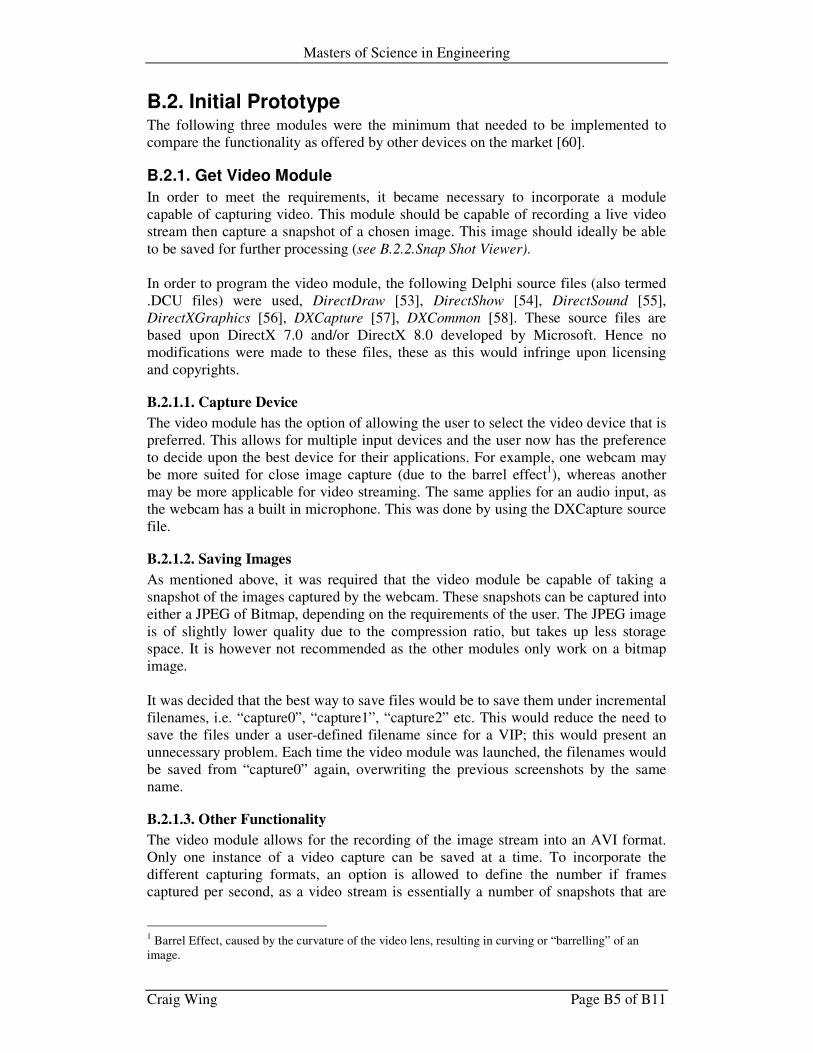
Masters of Science in Engineering
Craig Wing Page B5 of B11
B.2. Initial Prototype The following three modules were the minimum that needed to be implemented to
compare the functionality as offered by other devices on the market [60].
B.2.1. Get Video Module
In order to meet the requirements, it became necessary to incorporate a module
capable of capturing video. This module should be capable of recording a live video
stream then capture a snapshot of a chosen image. This image should ideally be able
to be saved for further processing (see B.2.2.Snap Shot Viewer).
In order to program the video module, the following Delphi source files (also termed
.DCU files) were used, DirectDraw [53], DirectShow [54], DirectSound [55],
DirectXGraphics [56], DXCapture [57], DXCommon [58]. These source files are
based upon DirectX 7.0 and/or DirectX 8.0 developed by Microsoft. Hence no
modifications were made to these files, these as this would infringe upon licensing
and copyrights.
B.2.1.1. Capture Device
The video module has the option of allowing the user to select the video device that is
preferred. This allows for multiple input devices and the user now has the preference
to decide upon the best device for their applications. For example, one webcam may
be more suited for close image capture (due to the barrel effect1), whereas another
may be more applicable for video streaming. The same applies for an audio input, as
the webcam has a built in microphone. This was done by using the DXCapture source
file.
B.2.1.2. Saving Images
As mentioned above, it was required that the video module be capable of taking a
snapshot of the images captured by the webcam. These snapshots can be captured into
either a JPEG of Bitmap, depending on the requirements of the user. The JPEG image
is of slightly lower quality due to the compression ratio, but takes up less storage
space. It is however not recommended as the other modules only work on a bitmap
image.
It was decided that the best way to save files would be to save them under incremental
filenames, i.e. “capture0”, “capture1”, “capture2” etc. This would reduce the need to
save the files under a user-defined filename since for a VIP; this would present an
unnecessary problem. Each time the video module was launched, the filenames would
be saved from “capture0” again, overwriting the previous screenshots by the same
name.
B.2.1.3. Other Functionality
The video module allows for the recording of the image stream into an AVI format.
Only one instance of a video capture can be saved at a time. To incorporate the
different capturing formats, an option is allowed to define the number if frames
captured per second, as a video stream is essentially a number of snapshots that are
1 Barrel Effect, caused by the curvature of the video lens, resulting in curving or “barrelling” of an
image.
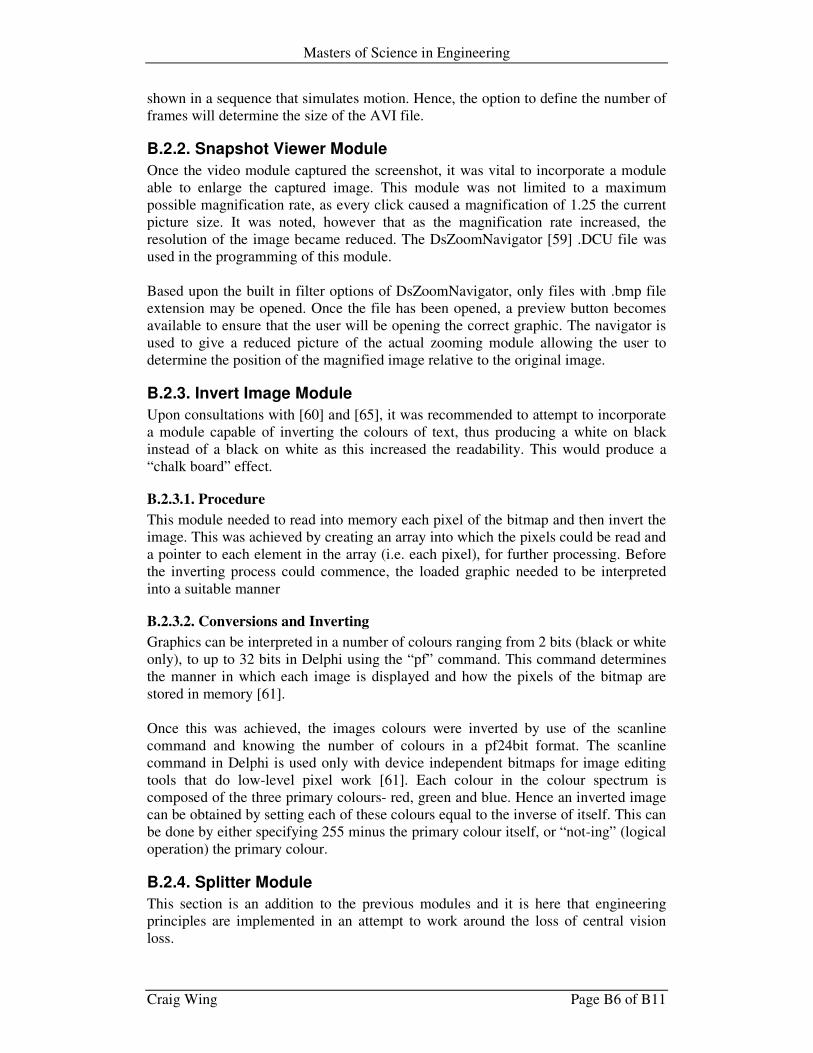
Masters of Science in Engineering
Craig Wing Page B6 of B11
shown in a sequence that simulates motion. Hence, the option to define the number of
frames will determine the size of the AVI file.
B.2.2. Snapshot Viewer Module
Once the video module captured the screenshot, it was vital to incorporate a module
able to enlarge the captured image. This module was not limited to a maximum
possible magnification rate, as every click caused a magnification of 1.25 the current
picture size. It was noted, however that as the magnification rate increased, the
resolution of the image became reduced. The DsZoomNavigator [59] .DCU file was
used in the programming of this module.
Based upon the built in filter options of DsZoomNavigator, only files with .bmp file
extension may be opened. Once the file has been opened, a preview button becomes
available to ensure that the user will be opening the correct graphic. The navigator is
used to give a reduced picture of the actual zooming module allowing the user to
determine the position of the magnified image relative to the original image.
B.2.3. Invert Image Module
Upon consultations with [60] and [65], it was recommended to attempt to incorporate
a module capable of inverting the colours of text, thus producing a white on black
instead of a black on white as this increased the readability. This would produce a
“chalk board” effect.
B.2.3.1. Procedure
This module needed to read into memory each pixel of the bitmap and then invert the
image. This was achieved by creating an array into which the pixels could be read and
a pointer to each element in the array (i.e. each pixel), for further processing. Before
the inverting process could commence, the loaded graphic needed to be interpreted
into a suitable manner
B.2.3.2. Conversions and Inverting
Graphics can be interpreted in a number of colours ranging from 2 bits (black or white
only), to up to 32 bits in Delphi using the “pf” command. This command determines
the manner in which each image is displayed and how the pixels of the bitmap are
stored in memory [61].
Once this was achieved, the images colours were inverted by use of the scanline
command and knowing the number of colours in a pf24bit format. The scanline
command in Delphi is used only with device independent bitmaps for image editing
tools that do low-level pixel work [61]. Each colour in the colour spectrum is
composed of the three primary colours- red, green and blue. Hence an inverted image
can be obtained by setting each of these colours equal to the inverse of itself. This can
be done by either specifying 255 minus the primary colour itself, or “not-ing” (logical
operation) the primary colour.
B.2.4. Splitter Module
This section is an addition to the previous modules and it is here that engineering
principles are implemented in an attempt to work around the loss of central vision
loss.
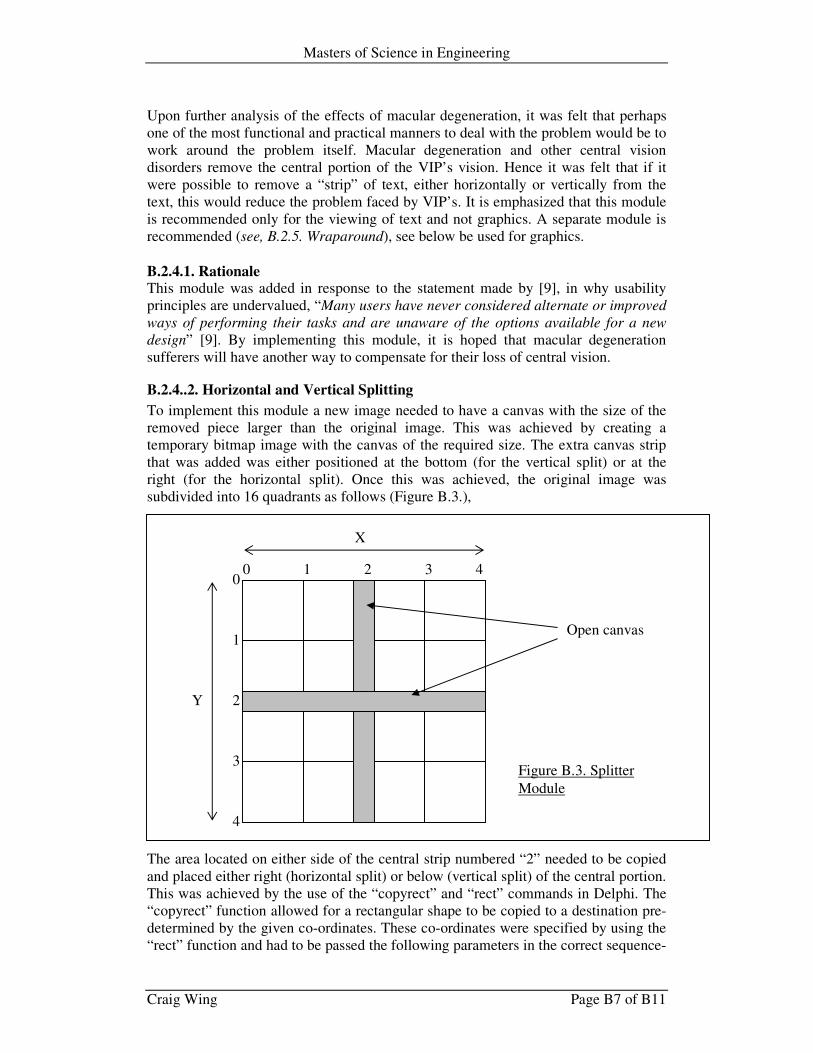
Masters of Science in Engineering
Craig Wing Page B7 of B11
Upon further analysis of the effects of macular degeneration, it was felt that perhaps
one of the most functional and practical manners to deal with the problem would be to
work around the problem itself. Macular degeneration and other central vision
disorders remove the central portion of the VIP’s vision. Hence it was felt that if it
were possible to remove a “strip” of text, either horizontally or vertically from the
text, this would reduce the problem faced by VIP’s. It is emphasized that this module
is recommended only for the viewing of text and not graphics. A separate module is
recommended (see, B.2.5. Wraparound), see below be used for graphics.
B.2.4.1. Rationale This module was added in response to the statement made by [9], in why usability
principles are undervalued, “Many users have never considered alternate or improved
ways of performing their tasks and are unaware of the options available for a new
design” [9]. By implementing this module, it is hoped that macular degeneration
sufferers will have another way to compensate for their loss of central vision.
B.2.4..2. Horizontal and Vertical Splitting
To implement this module a new image needed to have a canvas with the size of the
removed piece larger than the original image. This was achieved by creating a
temporary bitmap image with the canvas of the required size. The extra canvas strip
that was added was either positioned at the bottom (for the vertical split) or at the
right (for the horizontal split). Once this was achieved, the original image was
subdivided into 16 quadrants as follows (Figure B.3.),
The area located on either side of the central strip numbered “2” needed to be copied
and placed either right (horizontal split) or below (vertical split) of the central portion.
This was achieved by the use of the “copyrect” and “rect” commands in Delphi. The
“copyrect” function allowed for a rectangular shape to be copied to a destination pre-
determined by the given co-ordinates. These co-ordinates were specified by using the
“rect” function and had to be passed the following parameters in the correct sequence-
X
0 1 4 0
1
3 2
3
2
4
Y
Open canvas
Figure B.3. Splitter
Module
Masters of Science in Engineering
Craig Wing Page B8 of B11
“left”, “top”, “right”, “bottom”. Once this was achieved the bottom and the top (or left
and right) sections simply needed to be anchored in the correct position to allow the
bitmap to be shown correctly.
B.2.5. Wrap Around Module
This module was essentially an extension of the splitter module mentioned above.
Using Figure B.4., below and using the same programming philosophy as above, this
module was created successfully. The first and last rows needed to be copied exactly
as shown into the new canvas, while the central squares needed to be “squashed” into
an area half the original size. Hence the area that is shaded will be reduced in size.
This module is only recommended for the viewing of bitmaps, as text would be
distorted and compressed adding unnecessary complications.
B.2.6. Configuration Module
Once the above splitter and wrap around modules were completed successfully, it was
felt that in order to achieve optimum results, a configuration module was needed to
maximize the effect of these modules. This was since, the severity of macular
degeneration varied from patient to patient depending on the deterioration of the
cones and rods of the macular that control vision.
The interface was designed to be as simple, but as functional as possible. This was
achieved by requesting the patient to select the greatest viewing area that was
unaffected. Upon the selection of the area, the size of the viewing area was written to
a file called “revision.conf”, which was to be opened and the variables copied to be
used for the above two modules.
X
0 1 4 0
1
3 2
3
2
4
Y
Open Canvas
Figure B.4. Wrap Module
Masters of Science in Engineering
Craig Wing Page B9 of B11
B.2.7. OCR and Speech engine integration
An additional module was added to the initial prototype that incorporated two smaller
“building blocks”, an optical character recognition (OCR) module and a read back
module. This added additional functionality, albeit at a very premature stage of its
development.
B.2.7.1. Optical Character Recognition (OCR) Module
The programmers did not write this module but a third party program was used.
Transym Computer Services LTD developed the OCR (TOCR) engine used [73]. The
program is a trial version that allows for 100 pages to be scanned. Hence, no license
agreements were violated nor any copyrights broken. In the future our own OCR
engine would be developed. TOCR was called by using the shell execute command
and supplying the necessary parameters to launch the program from within the main
form.
In order to use TOCR, the chosen .bmp file must be loaded then the X and Y dpi (dots
per inch) need to be specified for the program to be able to compare the characters
with those stored in its libraries. Once this has been achieved the extracted text can be
saved in a text file for further processing.
8.2.7.2. Read back Module
This module uses Microsoft Speech Application Interface Software Development Kit
(SDK) and the associated text-to-speech engine [74]. In order to develop a module
able to read the text that was converted from the picture captured from the webcam,
Microsoft Speech Application Programming Interface (SAPI) was used which allows
for use with Microsoft Windows or Windows NT operating systems [74].
The read back module allows for the computer to read any text that was entered into
the text box or any text file that is loaded into the box. The text that was extracted
from TOCR was used to read back from the captured image
B.2.8. Hardware Stands
Even though this project was essentially software based, a certain degree of hardware
needed to be implemented to allow for the VIP the best use of the available software.
A prototype was developed which would allow the user the ability to manoeuvre the
webcam relative to the viewing area. Several prototypes were developed that served
this purpose, but were based upon different philosophies
B.2.8.1. Prototype I
The first prototype’s concept was that a rigid stand would offer the best solution to
holding the webcam. Hence it incorporated two vertical beams to allow for vertical
movement and a two “cross beams” to allow for horizontal movement. The
combination of these then catered for complete movement in the two dimensional X-
Y plane. The holder was placed upright as suggested by [60], as some VIPs would
require a stand capable of viewing upright images, such as a teacher in front of a class
of students.
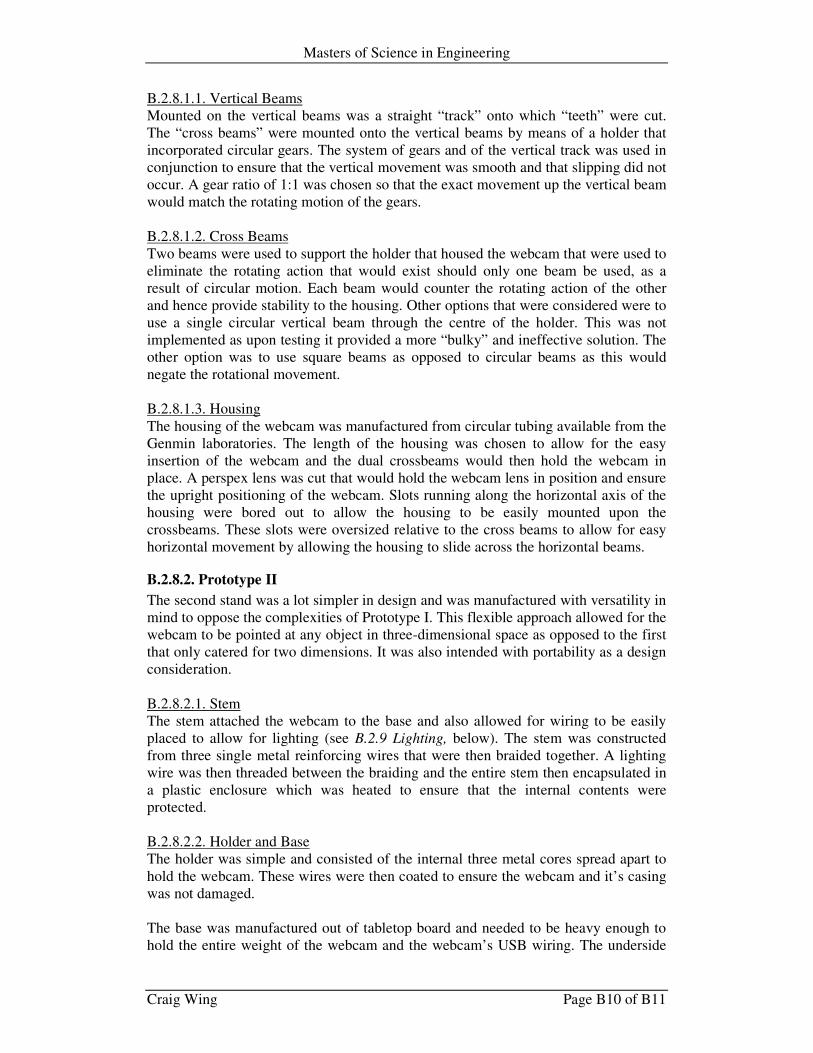
Masters of Science in Engineering
Craig Wing Page B10 of B11
B.2.8.1.1. Vertical Beams
Mounted on the vertical beams was a straight “track” onto which “teeth” were cut.
The “cross beams” were mounted onto the vertical beams by means of a holder that
incorporated circular gears. The system of gears and of the vertical track was used in
conjunction to ensure that the vertical movement was smooth and that slipping did not
occur. A gear ratio of 1:1 was chosen so that the exact movement up the vertical beam
would match the rotating motion of the gears.
B.2.8.1.2. Cross Beams
Two beams were used to support the holder that housed the webcam that were used to
eliminate the rotating action that would exist should only one beam be used, as a
result of circular motion. Each beam would counter the rotating action of the other
and hence provide stability to the housing. Other options that were considered were to
use a single circular vertical beam through the centre of the holder. This was not
implemented as upon testing it provided a more “bulky” and ineffective solution. The
other option was to use square beams as opposed to circular beams as this would
negate the rotational movement.
B.2.8.1.3. Housing
The housing of the webcam was manufactured from circular tubing available from the
Genmin laboratories. The length of the housing was chosen to allow for the easy
insertion of the webcam and the dual crossbeams would then hold the webcam in
place. A perspex lens was cut that would hold the webcam lens in position and ensure
the upright positioning of the webcam. Slots running along the horizontal axis of the
housing were bored out to allow the housing to be easily mounted upon the
crossbeams. These slots were oversized relative to the cross beams to allow for easy
horizontal movement by allowing the housing to slide across the horizontal beams.
B.2.8.2. Prototype II
The second stand was a lot simpler in design and was manufactured with versatility in
mind to oppose the complexities of Prototype I. This flexible approach allowed for the
webcam to be pointed at any object in three-dimensional space as opposed to the first
that only catered for two dimensions. It was also intended with portability as a design
consideration.
B.2.8.2.1. Stem
The stem attached the webcam to the base and also allowed for wiring to be easily
placed to allow for lighting (see B.2.9 Lighting, below). The stem was constructed
from three single metal reinforcing wires that were then braided together. A lighting
wire was then threaded between the braiding and the entire stem then encapsulated in
a plastic enclosure which was heated to ensure that the internal contents were
protected.
B.2.8.2.2. Holder and Base
The holder was simple and consisted of the internal three metal cores spread apart to
hold the webcam. These wires were then coated to ensure the webcam and it’s casing
was not damaged.
The base was manufactured out of tabletop board and needed to be heavy enough to
hold the entire weight of the webcam and the webcam’s USB wiring. The underside
Masters of Science in Engineering
Craig Wing Page B11 of B11
of the base then had holes drilled to hold the stem and lighting wire. The entire
underside was then held in place with a perspex covering.
B.2.8.3. Prototype III
A third prototype was designed and built based upon the operation of a desk lamp.
The globe holder was removed and a similar housing to that mentioned above
(B.2.8.1.3.Housing) was used to house the webcam. This configuration was then
mounted upon a base similar to the one constructed for Prototype II. The original
lamp wire was left to accommodate future lighting.
B.2.9. Counter Acting lens
As stated above, the barrel effect proved to be a problem encountered in the design of
this project. This was since the barrel effect warped the images (letters and sentences)
and caused additional unnecessary problems.
The internal lens of the Logitech Quickcam Pro 3000 is a converging lens and the
barrel effect was an extreme hindrance when the image to be magnified was placed
well within the focal length of the webcam. To reduce this focal length and possibly
eradicate the barrel effect a counter acting diverging lens with the same curvature
would need to be manufactured.
Upon consultation with a contact lens manufacturer [62], it was found, by using a
radio scope, that the internal lens was a combination of four internal lenses and not
one as previously thought. These lenses varied in the amount of power and curvature,
but could not be measured individually as the internal lens of the webcam could not
be disassembled. A lens was then manufactured and delivered with an overall
diameter (O.D) 10.5 mm and focal length along the Rx plane.
B.2.10. Lighting
Upon closer analysis of the currently available low vision aid systems [60], [65], it
was noted that all of them had a lighting system that increased the readability of text.
This was essential as it improved both the contrast and readability of the image below.
This was especially true if the material was text based.
A 45-Watt energy saving globe was attached to prototype III, but as the light source
was only originated from one side, the extra lighting caused more shadows on the
text. This could not be compensated for due to the construction of the chosen
prototype.
Masters of Science in Engineering
Craig Wing Page C1 of C11
Appendix C: Usability Inspection C.1. Usability Inspection
C.1.1. General Operation
C.1.2. GetVideo
C.1.3. Snapshot Viewer
C.1.4. Splitter Module
C.1.5. Wrap Around Module
C.1.6. Configuration Module
C.1.7 Hardware
C.1.8. Counteracting Lens
C.1.9. Lighting
C.2. Evolutionary Delivery
C.2.1. Human Machine Interface
C.2.2. Video Streaming
C.2.3. Zoom Module
C.2.4. Compensation Module
C.2.5. Hardware
C.2.6. OCR and Speech Engine integration
C.3. Product Evolution
C.3.1. Greyscale
C.3.2. High Contrast
C.3.3. Zoom Enhancement
C.3.4. Luminance Level
C.3.5. Glare Control
C.3.6. Combination of Modules
C.3.7. Capture Device
C.3.8. Minimum Specifications for Revision
Masters of Science in Engineering
Craig Wing Page C2 of C11
C.1. Usability Inspection Once the initial stage of the evolutionary process of the prototype was complete, it
became necessary to conduct a usability inspection. Throughout the design process, a
user centric approach was adopted to keep user needs in mind. Once this was
completed, a heuristic approach was chosen. This was as this was seen as the most
effective method when resources are a minimum (see above) [18]. Additionally,
specialists in the field (e.g. Optometrists from RAU and specialist at SANCB) were
willing to participate and add feedback. This coupled with their experience in the low
vision field and knowing the end users needs makes them invaluable in the usability
evaluation phase. Furthermore, the specialists from the SANCB were also partially
sighted (Macular Degeneration) that allowed them to experience the device from an
anticipated end user’s perspective.
They could along with the authors usability experience, amount to being a double
specialist [28]. The information and feedback obtained here would be used to iterate
the design to make it more usable [28], [29]. The process was repeated with
subsequent iterations and additional data obtained. What follows are the key findings
from the initial prototype.
C.1.1. General Operation
The opinions from the double specialists were comprehensive and upon further initial
evaluation with potential end users most of usability problems were located,
o The Interface involved too much user interaction, i.e. button clicking. This
detracted from the overall functionality and reduced the user centric approach.
This involved the process of initiating the camera, taking a picture, and editing
using the functions, with each process requiring locating the appropriate
module, initiating the procedure, closing the window and repeating the
sequence if desired.
o The opening and closing of appropriate files to view and process was
complicated and needed to be reviewed. This was complicated in having to
find the location of the desired file.
o Real time operation may require resources that are not available on “older”
computers.
C.1.2. GetVideo
o The image stream that was captured was not truly “real time”. A slight delay
was apparent that might be an inconvenience for VIP’s.
o The viewing area needed to be maximised, as magnification was the key
criteria for a good product.
o The method of saving files in the form of “capture0”, “capture1”, etc. was
cumbersome
o The option to save the image stream was void and should it ever be initiated
created too large a file, creating a misuse of resources.
o The use of the built in driver’s functions (brightness and contrast control) was
cumbersome and barely utilised, as it required fine adjustments to be made.
Masters of Science in Engineering
Craig Wing Page C3 of C11
C.1.3. Snapshot Viewer
o The resolution of the captured image dropped off with increased resolution.
o Even though the preview pane was useful, it occupied crucial viewing space of
the image.
C.1.4. Splitter Module
The idea was unique, but the vertical split could be complicated, as it requires a
change in mindset, whereas the horizontal split is akin to a paragraph split.
C.1.5. Wrap Around Module
Although the theoretical implementation of this module was correct, the practical
implementation was ineffective. This was that as the central portion was
“squashed” into a smaller area (half the canvas) and this distorted the viewing of
the image.
C.1.6. Configuration Module
This module needed to be evaluated and possibly re-engineered as it again
detracted from the overall appeal of the operation.
C.1.7 Hardware
C.1.7.1. Prototype I
This stand proved to be very ineffective as the complexity involved in the vertical
movement of the webcam was not fluid, because of the gearing involved. The
horizontal movement was similarly affected
C.1.7.2. Prototype II
Although this stand was suitable for most situations, it was felt that the stand was
not rigid enough and when the webcam moved it would lose focus, the holder
would typically only settle within a few seconds. This would translate into
unnecessary movement of the image and cause additional unneeded problems.
C.1.7.3. Prototype III
This Prototype proved to be the most effective as it was held in the horizontal
position that allowed for the easy placement of text beneath it. It also allowed for
writing below the webcam. The head could also be swivelled to allow the VIP to
monitor external vertical activities as recommended by [60]. The only
shortcoming for this design was its aesthetic appeal.
C.1.8. Counteracting Lens
The lens provided little effect to reduce the barrel, effect. The trade-off was that
the lens reduced the light that was available through the aperture to the internal
lens(es), which essentially compounded the lighting problem (see C.1.9. Lighting).
C.1.9. Lighting
In varying light conditions (lack or excess), the prototype performed extremely
poorly. The placing of light was crucial as an even light was needed or shadows
would be cast that would compound the problem.
Masters of Science in Engineering
Craig Wing Page C4 of C11
C.2. Evolutionary Delivery Once the first iteration of the evolutionary design was complete [10], it became
necessary to revisit the prototype operation with subsequent usability inspection
results as a guideline. Successive iterations were performed adding additional
functionality and refining existing modules. Following the usability inspection results
mentioned above, the entire process was to be redesigned. This would ensure a more
user-centric program as to fulfil the criteria of a “usable” product.
C.2.1. Human Machine Interface
The design process was re-engineered, with each module now being written as a sub-
procedure within the program as opposed to separate forms that were initiated by
button clicking. The HMI (Human-Machine Interface) was thus redesigned, in that
instead of the interface being button operated, the user was now able to access the
functionality using various mouse operations. Once the call procedure was initiated,
flags were toggled to activate the desired procedure. The following table depicts the
available operations.
Action Feature In module
Left mouse click Reset the image ImageMouseDown
Middle mouse click Grey Enable/Disable ImageMouseDown
Left mouse double click Exit Webcam capture ImageMouseDown
Right mouse double click Image Enhancement ImageMouseDown
Middle mouse double click Change split mode (H/V) ImageMouseDown
Right Mouse Click Invert Enable/Disable ImageMouseUp
Mouse wheel Zoom in/out FormMouseWheel
Mouse wheel + right button
down
Split extent change FormMouseWheel
The operation of having to save an image, then reopening it with the appropriate
module was thus negated and the entire process became smoother. In effect, the
program was initiated at start-up and all functions were accessed via mouse
commands.
C.2.2. Video Streaming
The prototype’s core components, the video streaming process, was re-engineered and
re-programmed using an alternative to DXCapture file, DSPack1 [63]. Additionally
DSPack is distributed under the (Mozilla Public License) MPL 1.1. This addressed
three areas of concern of the initial prototype, the program did no longer require as
much resources, the speed of response was improved and full screen functionality was
possible. Key factors were,
o The viewing area was maximised allowing for a full screen image to be seen.
1 DSPack is a set of Components and class to write Multimedia Applications using MS Direct
Show and DirectX technologies. DSPack is designed to work with DirectX 9 on Win9X, ME, 2000,
and Windows XP operating systems [63].
Table C.1. Mouse Functions
Masters of Science in Engineering
Craig Wing Page C5 of C11
o Instead of having to first save an image for processing, the current video frame
was passed to a buffer for further processing. This reduced the operating time
and required resources.
o The ability to record an image stream was removed, as it was inconsequential.
o Access to the built in driver’s functions was removed. This was as additional
modules were created to cater for the automatic correction of brightness and
contrast.
C.2.3. Zoom Module
Although a key component was to remove the preview pane, which was achieved; the
more pressing matter was that the clarity of the image diminished with an increase in
the zoom. This problem was found to be an issue with the input device (initially a
webcam) and not the internal workings of the program.
The image was placed at the centre of the screen and any magnification was done for
the centre of the image. Should another portion require to be magnified, the source
area needed to be repositioned in the centre under the viewing area.
C.2.4. Compensation Module
The functionality of the split module remained the same although a key difference
was that the split was now dynamic in nature (i.e. it could be modified from within the
split function, as opposed to “pre-configuring” via the configuration module).
The configuration module and wrap around module were thus rendered void and
removed.
C.2.5. Hardware
The previous stands were used as a basis for the final stand. Initially a technical
specification needed to be drafted and submitted to the external company selected to
manufacture the device. This specification was evaluated by the company consultant
and recommendations given to improve the operation, aethstetics and construction.
The basic construction was made from Aluminium with the following dimensions;
145mm height, 360mm width and 270mm depth with a weight of approximately
0.8kg. Figure 12, depicts a CAD (computer aided design) drawing that was created of
the stand.
The operation of which was that an arm was mounted above a viewing surface onto
which the material to be viewed was placed. This arm could then be moved into a
vertical position to comply with the recommendations of [60]. The stand was made to
an industrial standard and machine cut, hence it has a very “commercial” feel and is
aesthetically appealing and has been very well received [60], [65].
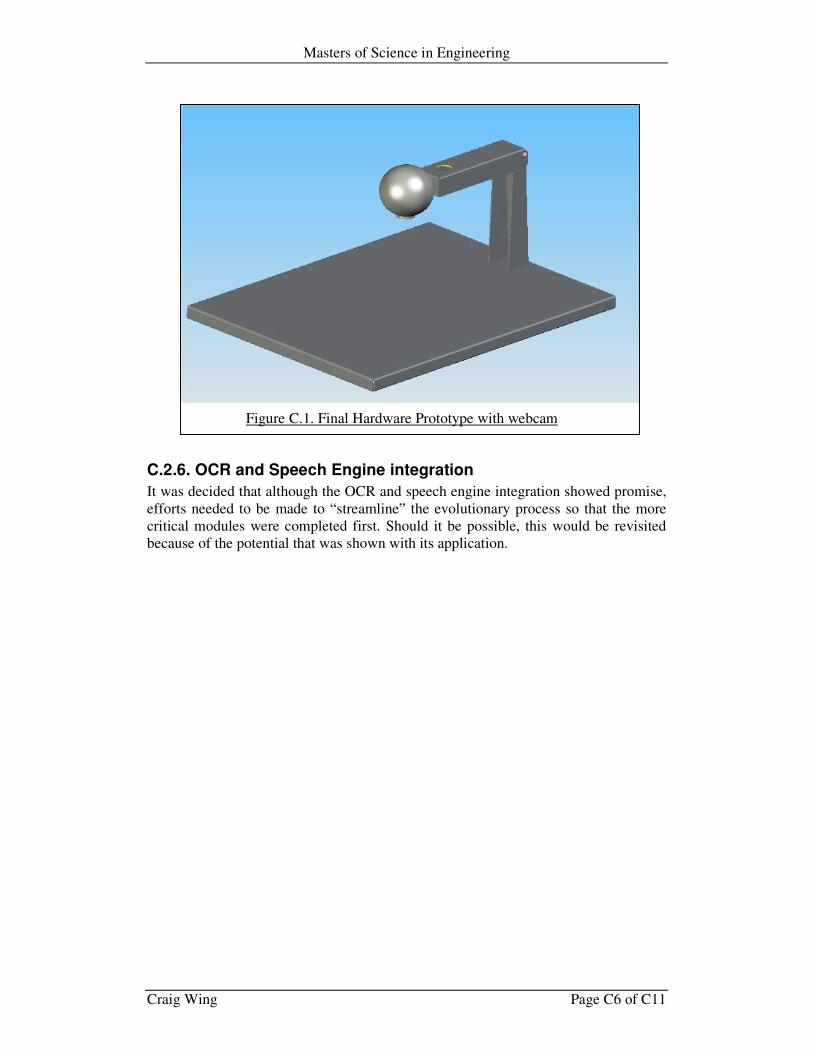
Masters of Science in Engineering
Craig Wing Page C6 of C11
C.2.6. OCR and Speech Engine integration
It was decided that although the OCR and speech engine integration showed promise,
efforts needed to be made to “streamline” the evolutionary process so that the more
critical modules were completed first. Should it be possible, this would be revisited
because of the potential that was shown with its application.
Figure C.1. Final Hardware Prototype with webcam
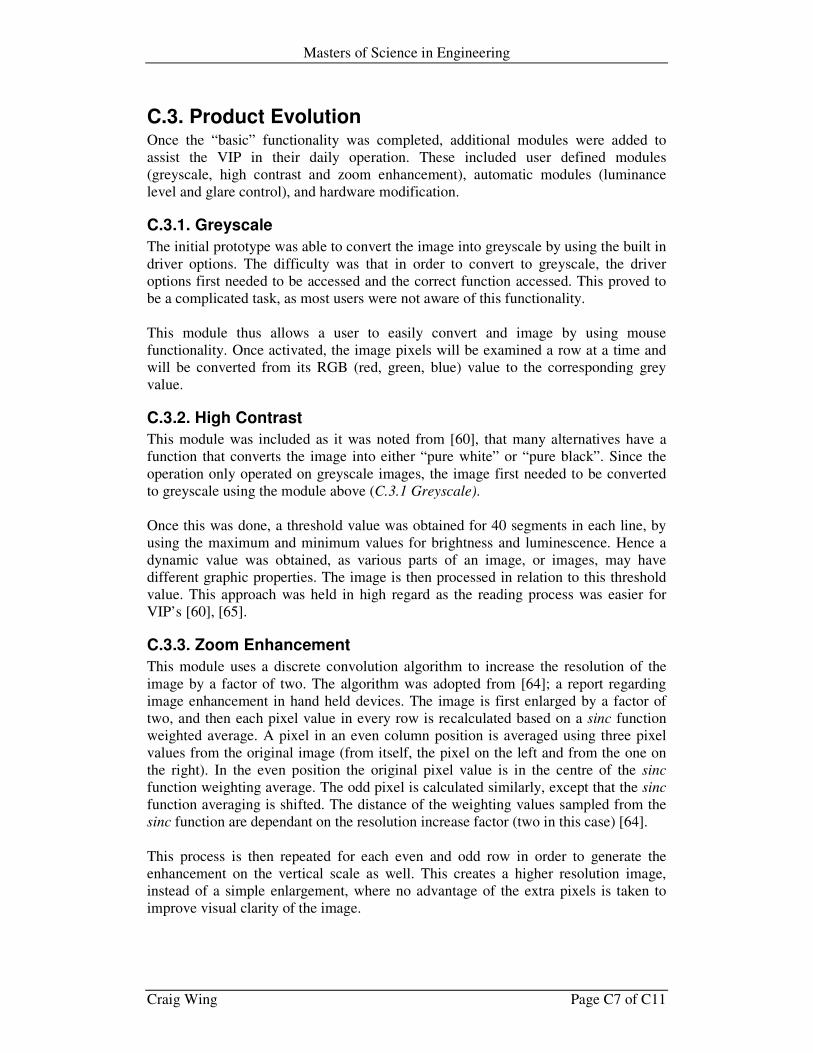
Masters of Science in Engineering
Craig Wing Page C7 of C11
C.3. Product Evolution Once the “basic” functionality was completed, additional modules were added to
assist the VIP in their daily operation. These included user defined modules
(greyscale, high contrast and zoom enhancement), automatic modules (luminance
level and glare control), and hardware modification.
C.3.1. Greyscale
The initial prototype was able to convert the image into greyscale by using the built in
driver options. The difficulty was that in order to convert to greyscale, the driver
options first needed to be accessed and the correct function accessed. This proved to
be a complicated task, as most users were not aware of this functionality.
This module thus allows a user to easily convert and image by using mouse
functionality. Once activated, the image pixels will be examined a row at a time and
will be converted from its RGB (red, green, blue) value to the corresponding grey
value.
C.3.2. High Contrast
This module was included as it was noted from [60], that many alternatives have a
function that converts the image into either “pure white” or “pure black”. Since the
operation only operated on greyscale images, the image first needed to be converted
to greyscale using the module above (C.3.1 Greyscale).
Once this was done, a threshold value was obtained for 40 segments in each line, by
using the maximum and minimum values for brightness and luminescence. Hence a
dynamic value was obtained, as various parts of an image, or images, may have
different graphic properties. The image is then processed in relation to this threshold
value. This approach was held in high regard as the reading process was easier for
VIP’s [60], [65].
C.3.3. Zoom Enhancement
This module uses a discrete convolution algorithm to increase the resolution of the
image by a factor of two. The algorithm was adopted from [64]; a report regarding
image enhancement in hand held devices. The image is first enlarged by a factor of
two, and then each pixel value in every row is recalculated based on a sinc function
weighted average. A pixel in an even column position is averaged using three pixel
values from the original image (from itself, the pixel on the left and from the one on
the right). In the even position the original pixel value is in the centre of the sinc
function weighting average. The odd pixel is calculated similarly, except that the sinc
function averaging is shifted. The distance of the weighting values sampled from the
sinc function are dependant on the resolution increase factor (two in this case) [64].
This process is then repeated for each even and odd row in order to generate the
enhancement on the vertical scale as well. This creates a higher resolution image,
instead of a simple enlargement, where no advantage of the extra pixels is taken to
improve visual clarity of the image.
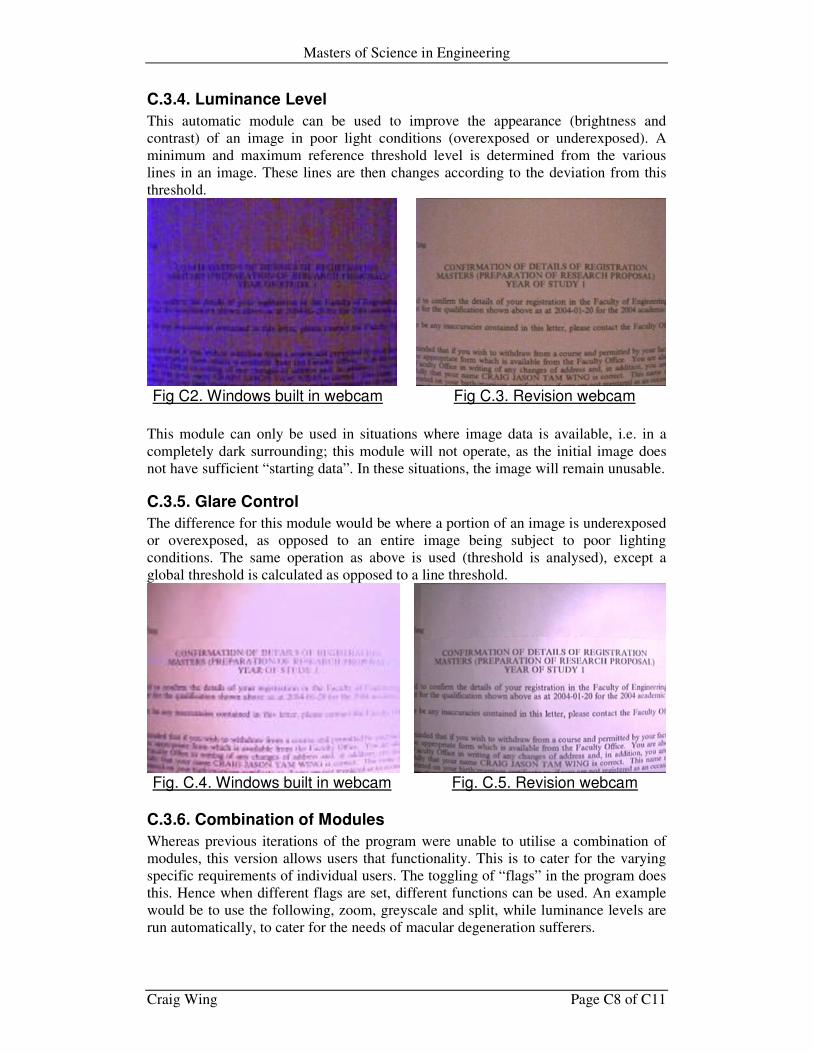
Masters of Science in Engineering
Craig Wing Page C8 of C11
C.3.4. Luminance Level
This automatic module can be used to improve the appearance (brightness and
contrast) of an image in poor light conditions (overexposed or underexposed). A
minimum and maximum reference threshold level is determined from the various
lines in an image. These lines are then changes according to the deviation from this
threshold.
This module can only be used in situations where image data is available, i.e. in a
completely dark surrounding; this module will not operate, as the initial image does
not have sufficient “starting data”. In these situations, the image will remain unusable.
C.3.5. Glare Control
The difference for this module would be where a portion of an image is underexposed
or overexposed, as opposed to an entire image being subject to poor lighting
conditions. The same operation as above is used (threshold is analysed), except a
global threshold is calculated as opposed to a line threshold.
C.3.6. Combination of Modules
Whereas previous iterations of the program were unable to utilise a combination of
modules, this version allows users that functionality. This is to cater for the varying
specific requirements of individual users. The toggling of “flags” in the program does
this. Hence when different flags are set, different functions can be used. An example
would be to use the following, zoom, greyscale and split, while luminance levels are
run automatically, to cater for the needs of macular degeneration sufferers.
Fig C2. Windows built in webcam viewer
Fig C.3. Revision webcam viewer
Fig. C.4. Windows built in webcam viewer
Fig. C.5. Revision webcam viewer
Masters of Science in Engineering
Craig Wing Page C9 of C11
C.3.7. Capture Device
One of the initial product goals defined at the onset of the project was that the input
device needed to be a low cost device. Hence, initially a webcam was used as it met
the required cost limitations. However upon consequent reviews, it was concluded
that the poor image quality was attributed to the input device, the webcam.
It was found that an inherent problem with webcams in general is that the resolution is
kept at a maximum of 640x480. It is unknown why, as it is possible to capture a still
image at a much higher resolution, the streaming resolution is kept at this maximum.
C.3.7.1. Logitech Quickcam Pro 3000
In addition to the above problem, it was noted that the Logitech Quickcam Pro 3000
exhibited severe barrelling effects (see C.3.7. Capture Device). Based upon the
usability inspection, it was decided to substitute this webcam with alternatives to
determine if a difference could be noted in the image quality.
C.3.7.2. Logitech Quickcam Pro 4000
Even though the logical progression would be to examine the performance of the
“next model up”, this replacement was enforced as it was noted that the Logitech
Quickcam Pro 3000 was discontinued and replaced with this model [66]. This
information was ascertained from one of three vendors of Logitech Devices to South
Africa [66].
The performance of the Quickcam 4000 was similar to the 3000, except that less
barrelling was found. This was extremely favourable, but the image was also more
“blurred” around the peripherals. In addition, the image was larger than for the
Quickcam 3000.
Other webcams were considered, but upon consultation [66] and examination, it was
found that the image quality was equal or less than the Logitech 4000.
C.3.7.3. Closed Circuit Television
An alternative to the webcam was a closed circuit television camera (CCTV). It was
suggested by [65] that a CCTV be used, as there are many instances where this
technology was applied with limited success. In all the previous situations, the CCTV
is connected directly to a television set via its RCA2 BNC
3 connections. However
interfacing directly with a computer would prove to be more intricate, and the CCTV
would require an external power source4.
Computers are able to accept external video connections via the S-Video, analogue
connection found on some video cards. This connection is not compliant with the
RCA connections found on CCTV cameras. Upon further consultation [67], it was
noted that CCTV’s could be connected to a computer via a dedicated card. This card
would be able to host from 6 connections upward. The processing required was
extensive and it is recommended that a Pentium IV be used to handle with the
2 Derived from the Radio Corporation of America (RCA)
3 Bayonet Neill-Cencelman (sometime incorrectly referred to as the British Naval Connector) is a type
of RF (Radio Frequency) Connector 4 Webcams derive power via the USB port, +5V supply
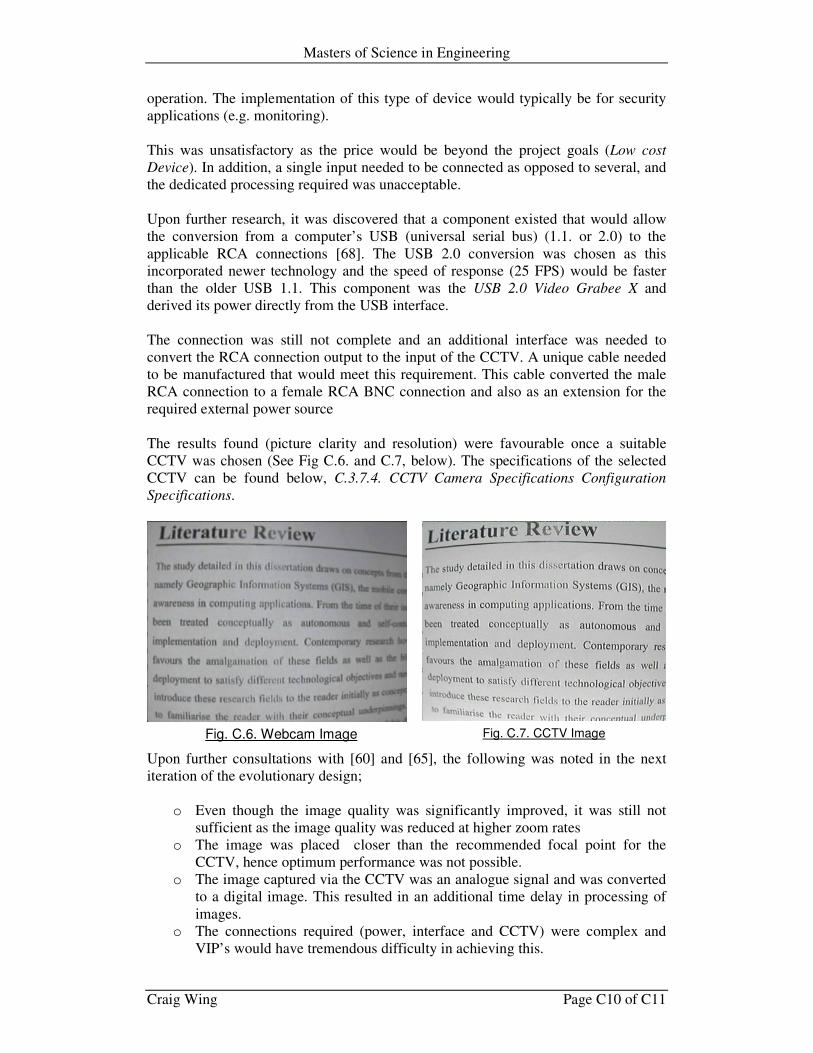
Masters of Science in Engineering
Craig Wing Page C10 of C11
operation. The implementation of this type of device would typically be for security
applications (e.g. monitoring).
This was unsatisfactory as the price would be beyond the project goals (Low cost
Device). In addition, a single input needed to be connected as opposed to several, and
the dedicated processing required was unacceptable.
Upon further research, it was discovered that a component existed that would allow
the conversion from a computer’s USB (universal serial bus) (1.1. or 2.0) to the
applicable RCA connections [68]. The USB 2.0 conversion was chosen as this
incorporated newer technology and the speed of response (25 FPS) would be faster
than the older USB 1.1. This component was the USB 2.0 Video Grabee X and
derived its power directly from the USB interface.
The connection was still not complete and an additional interface was needed to
convert the RCA connection output to the input of the CCTV. A unique cable needed
to be manufactured that would meet this requirement. This cable converted the male
RCA connection to a female RCA BNC connection and also as an extension for the
required external power source
The results found (picture clarity and resolution) were favourable once a suitable
CCTV was chosen (See Fig C.6. and C.7, below). The specifications of the selected
CCTV can be found below, C.3.7.4. CCTV Camera Specifications Configuration
Specifications.
Upon further consultations with [60] and [65], the following was noted in the next
iteration of the evolutionary design;
o Even though the image quality was significantly improved, it was still not
sufficient as the image quality was reduced at higher zoom rates
o The image was placed closer than the recommended focal point for the
CCTV, hence optimum performance was not possible.
o The image captured via the CCTV was an analogue signal and was converted
to a digital image. This resulted in an additional time delay in processing of
images.
o The connections required (power, interface and CCTV) were complex and
VIP’s would have tremendous difficulty in achieving this.
Fig. C.6. Webcam Image Fig. C.7. CCTV Image
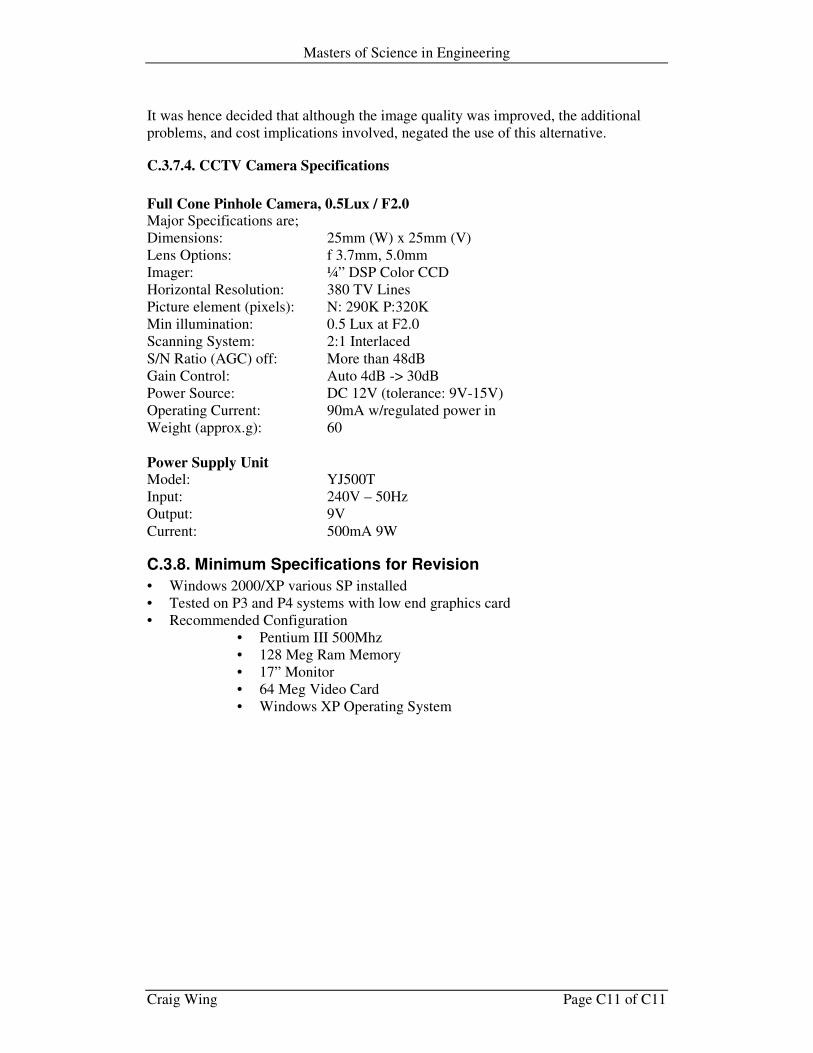
Masters of Science in Engineering
Craig Wing Page C11 of C11
It was hence decided that although the image quality was improved, the additional
problems, and cost implications involved, negated the use of this alternative.
C.3.7.4. CCTV Camera Specifications
Full Cone Pinhole Camera, 0.5Lux / F2.0 Major Specifications are;
Dimensions: 25mm (W) x 25mm (V)
Lens Options: f 3.7mm, 5.0mm
Imager: ¼” DSP Color CCD
Horizontal Resolution: 380 TV Lines
Picture element (pixels): N: 290K P:320K
Min illumination: 0.5 Lux at F2.0
Scanning System: 2:1 Interlaced
S/N Ratio (AGC) off: More than 48dB
Gain Control: Auto 4dB -> 30dB
Power Source: DC 12V (tolerance: 9V-15V)
Operating Current: 90mA w/regulated power in
Weight (approx.g): 60
Power Supply Unit Model: YJ500T
Input: 240V – 50Hz
Output: 9V
Current: 500mA 9W
C.3.8. Minimum Specifications for Revision
• Windows 2000/XP various SP installed
• Tested on P3 and P4 systems with low end graphics card
• Recommended Configuration
• Pentium III 500Mhz
• 128 Meg Ram Memory
• 17” Monitor
• 64 Meg Video Card
• Windows XP Operating System

Masters of Science in Engineering
Craig Wing Page D1 of D14
Appendix D: Usability Testing
D.1. Usability Testing
D.1.1. Goals and Concerns
D.1.2. User Participants
D.1.3. Onsite Testing
D.1.4. Pretest Questionnaire
D.1.5. Training and Orientation
D.1.6. Posttest Questionnaire
D.1.7. Testing Methodology
D.1.8 Thinking Aloud
D.1.9. Pilot Test
D.1.10. Observing Test Participants
D.2. Statistical Analysis
D.3. Data Analysis
D.3.1. Trend Analysis
D.3.2. Outliers
D.3.3. Usability Concerns
D.3.4. Program Errors and Crashes
D.3.5. Split module
D.4. Recommending Changes
D.4.1. Software
D.4.2. Hardware Stand
D.4.3. Input Device
D.4.4. Help
D.5. Conclusion
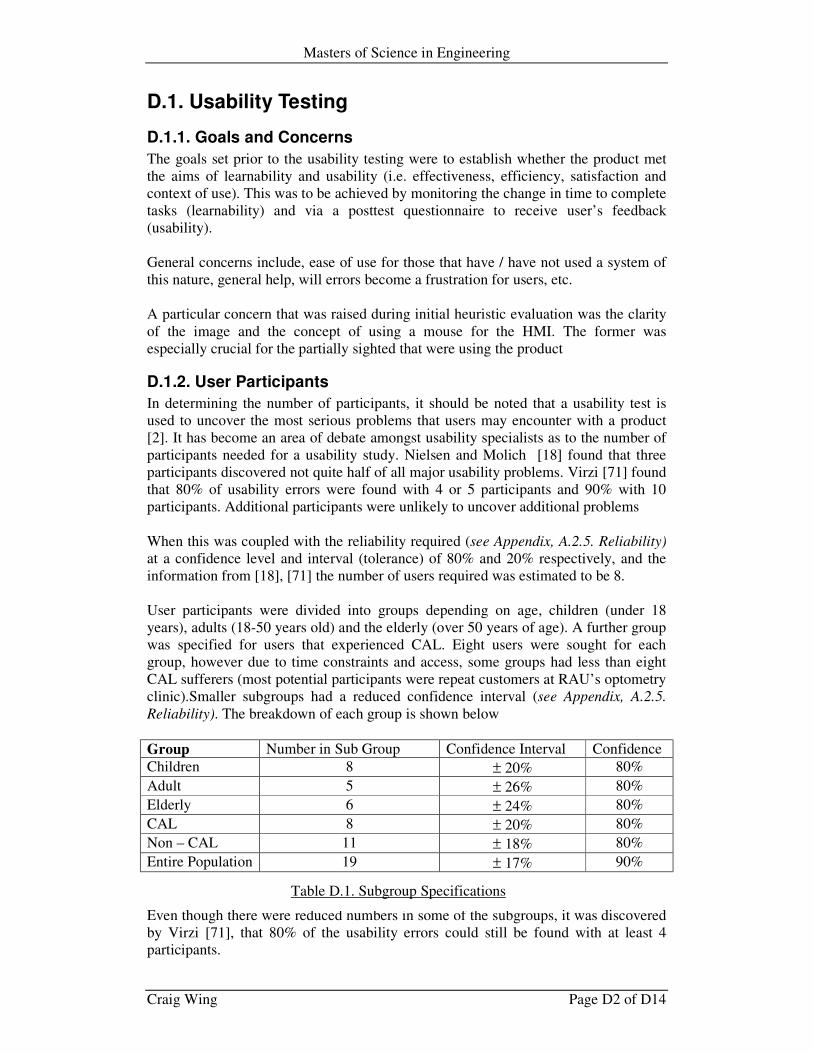
Masters of Science in Engineering
Craig Wing Page D2 of D14
D.1. Usability Testing
D.1.1. Goals and Concerns
The goals set prior to the usability testing were to establish whether the product met
the aims of learnability and usability (i.e. effectiveness, efficiency, satisfaction and
context of use). This was to be achieved by monitoring the change in time to complete
tasks (learnability) and via a posttest questionnaire to receive user’s feedback
(usability).
General concerns include, ease of use for those that have / have not used a system of
this nature, general help, will errors become a frustration for users, etc.
A particular concern that was raised during initial heuristic evaluation was the clarity
of the image and the concept of using a mouse for the HMI. The former was
especially crucial for the partially sighted that were using the product
D.1.2. User Participants
In determining the number of participants, it should be noted that a usability test is
used to uncover the most serious problems that users may encounter with a product
[2]. It has become an area of debate amongst usability specialists as to the number of
participants needed for a usability study. Nielsen and Molich [18] found that three
participants discovered not quite half of all major usability problems. Virzi [71] found
that 80% of usability errors were found with 4 or 5 participants and 90% with 10
participants. Additional participants were unlikely to uncover additional problems
When this was coupled with the reliability required (see Appendix, A.2.5. Reliability)
at a confidence level and interval (tolerance) of 80% and 20% respectively, and the
information from [18], [71] the number of users required was estimated to be 8.
User participants were divided into groups depending on age, children (under 18
years), adults (18-50 years old) and the elderly (over 50 years of age). A further group
was specified for users that experienced CAL. Eight users were sought for each
group, however due to time constraints and access, some groups had less than eight
CAL sufferers (most potential participants were repeat customers at RAU’s optometry
clinic).Smaller subgroups had a reduced confidence interval (see Appendix, A.2.5.
Reliability). The breakdown of each group is shown below
Group Number in Sub Group Confidence Interval Confidence
Children 8 ± 20% 80%
Adult 5 ± 26% 80%
Elderly 6 ± 24% 80%
CAL 8 ± 20% 80%
Non – CAL 11 ± 18% 80%
Entire Population 19 ± 17% 90%
Even though there were reduced numbers in some of the subgroups, it was discovered
by Virzi [71], that 80% of the usability errors could still be found with at least 4
participants.
Table D.1. Subgroup Specifications
Masters of Science in Engineering
Craig Wing Page D3 of D14
D.1.3. Onsite Testing
The usability test was conducted at the computer class at Sibonile Primary school1
and at RAU University, Low Vision Unit. These venues were selected as it would
allow testing to be conducted where users are most likely to use a product such as
this. In addition, it would give objective information as the test participants were
unlikely to have used other visual aids and hence their opinions would not be biased.
RAU specialises in low vision patients (CAL patients in particular) and is open to
consulting to the general public, hence the participants used here would be varied in
both their condition and general suitability to the research.
D.1.3.1. Equipment Setup
A computer was setup in the classroom that met the minimum specifications and had
a copy of the program loaded on it. It was then configured such that the user could
operate the device with minimal interference.
D.1.3.2. Material Setup
Materials needed were to be setup whereby test participants were able to use the
device and an analysis conducted. The test material included samples of text that were
to be used to determine the applicability of the functionality offered as well as printed
text on a sheet of paper to test whether users could manoeuvre objects under the
webcam such that they became visible on the computer (see Appendix E). A help page
was prepared to show the users the functionality of the device and how it could be
implemented in the program screen (See Appendix E).
D.1.4. Pretest Questionnaire
The pretest questionnaire gathered important information about the test participants
and the information that was gathered included,
o Age
o Visual status and condition,
o Number of years affected (if applicable)
o Relevant Computer experience
It was found that all had a visual impairment (e.g. partially sighed in single eye, short
sighted, myopia nystagmis), but most could not give specific details pertaining to their
condition. Most were affected from birth and all stated that they had previous
computer experience, though this is questionable.
D.1.5. Training and Orientation
A training script was prepared to ensure that all participants were given equal training
to afford them all equal “starting points” prior to the onset of the usability test. The
test was comprised of introducing the operation of the mouse, as this was the HMI.
This is especially crucial since the following situation needed to be avoided [3],
“…users will have to be trained in the use of the mouse before it is relevant to use
them as test users of a mouse-based system. Using a mouse is known to be hard for
the first several hours, and it is almost impossible to use a mouse correctly the first
few minutes. If users are not trained in the use of the mouse and other standard
1 School for the Visually impaired, based in Vereeninging. . Currently has 143 partially sighted and
blind children.
Masters of Science in Engineering
Craig Wing Page D4 of D14
interaction techniques before they are asked to test a new interface, the test will be
completely dominated by the effects of the user’s struggle with the interaction devices
and techniques, and no information will be gained as to the usability of the dialogue”
Hence users were shown the general operation of a mouse and how it could be used to
operate the interface. Special emphasis was given to the ability to single and double
click the left, right and scroll (centre) buttons. The last function was a new experience
to all, as previous mouse experience was limited to mouse’s without a scroll button.
This negatively affected the results (see D.3. Data Analysis, below).
The usability testing procedure was then explained to the participant to ensure that
they understood the purpose of the test (the prototype was tested; not them) and that
times were to be taken for them to complete certain tasks. The test would conclude
with a questionnaire (posttest questionnaire), for their opinions and comments.
It was vital that prior to the usability test that the participants were reminded that it
was not their performance that was up for evaluation, but rather the performance of
the prototype. Hence, should they at any time feel uncomfortable with the testing
process that they were allowed to terminate the testing.
D.1.6. Posttest Questionnaire
The posttest questionnaire was done in order to gather additional information about
the users experience and for them to rate the operation on a five-point scale as
recommended by [3]. Questions included information to the different modules and the
opportunity for additional comments and finally with an overall rating of the
experience.
Questions had a rating from one to five, with one the most favourable, and five the
least. A final question was asked about the overall enjoyment of the software
experience.
D.1.7. Testing Methodology
The following tasks were to be completed by the test participants. During these tasks,
times were recorded for analysis after the completion of the test.
1. Zoom on rectangle till it fills the screen
2. Zoom on sentence till you can read it
3. Invert the image on the screen
4. Convert the image to grayscale
5. Enable high contrast or split
6. Move item relative to camera in the following sequence
i. Block 1 – Top left
ii. Block 2 – Top right
iii. Block 3 – Bottom right
iv. Block 4 – Bottom Left
7. Complete the following sequence, Grayscale, Invert, zoom till block fills the
screen
8. Exit then restart
Masters of Science in Engineering
Craig Wing Page D5 of D14
The first five tasks were to examine the ease with which users could complete basic
tasks, as well as test the zooming capability. The sixth task was to determine if users
could move objects under the viewing area as they needed. The seventh task was to
determine if learnability was shown, as this task encompassed some of the operations
of the previous tasks and the last to exit and start the program again.
During the course of the usability testing it was found that certain aspects of the
usability test were not necessary. These were the high contrast or split module and
exiting from the program and restarting. These modules were hence not evaluated and
not rated during the posttest questionnaire.
The former was that the high contrast module was not offering additional
functionality as expected. Since this module essentially “doubled” the number of
pixels, it should have increased the resolution of the image, making it clearer. During
usability testing, it was found that this was not the case, and the doubling of pixels
was not apparent to most users. The split module was similarly not necessary for non-
CAL patients as they would have no need to utilise this functionality.
The latter was omitted from the test, as the concept of starting the program was the
same as any other Windows based application, i.e. double clicking on the icon.
Exiting was not necessary as it was determined that the program was to be
operational all the time.
D.1.8 Thinking Aloud
Users were to be introduced to the concept of thinking aloud by participating in an
example. First the evaluator would explain the steps involved (audibly) in making a
jam sandwich, and then the participant would follow with explaining the steps
involved in making a cup of tea. This proved useful in both allowing familiarity with
the concept of “thinking aloud” and secondly, relaxed any tensions and stress that
may have been apparent, as many users were visibly more relaxed after this exercise.
D.1.9. Pilot Test
A pilot test was run prior to the usability test to fulfil a dual purpose. Firstly, to ensure
that the equipment was operating correctly and that it was free from “bugs” and
secondly, to practise the activities that would be conducted during the usability
testing. This was completed successfully and hence no “last minute” adjustments
needed to be made.
D.1.10. Observing Test Participants
Once the test user was introduced to the device, information gathered and orientated
to thinking aloud, users were asked to complete the tasks one at a time. During the
tasks, users were allowed to use the help documentation, and measurements were
taken. The measurements taken included
o Time to complete each task
o Number of referrals to help
o Number of errors
o Number of crashed in the program
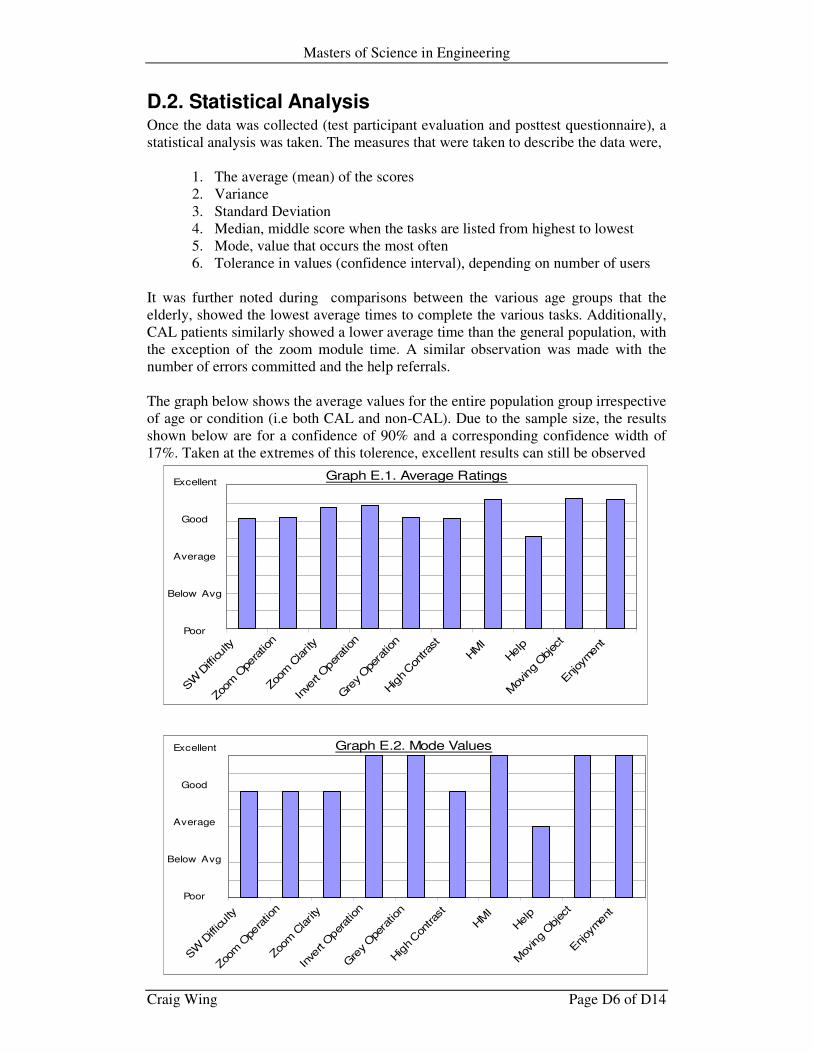
Masters of Science in Engineering
Craig Wing Page D6 of D14
Graph E.1. Average Ratings
SW
Difficulty
Zoom
Ope
ratio
n
Zoom
Clarity
Inve
rt Ope
ratio
n
Gre
y Ope
ratio
n
High Con
trast
HMI
Help
Mov
ing Objec
t
Enjoy
men
t
Excellent
Good
Average
Below Avg
Poor
D.2. Statistical Analysis Once the data was collected (test participant evaluation and posttest questionnaire), a
statistical analysis was taken. The measures that were taken to describe the data were,
1. The average (mean) of the scores
2. Variance
3. Standard Deviation
4. Median, middle score when the tasks are listed from highest to lowest
5. Mode, value that occurs the most often
6. Tolerance in values (confidence interval), depending on number of users
It was further noted during comparisons between the various age groups that the
elderly, showed the lowest average times to complete the various tasks. Additionally,
CAL patients similarly showed a lower average time than the general population, with
the exception of the zoom module time. A similar observation was made with the
number of errors committed and the help referrals.
The graph below shows the average values for the entire population group irrespective
of age or condition (i.e both CAL and non-CAL). Due to the sample size, the results
shown below are for a confidence of 90% and a corresponding confidence width of
17%. Taken at the extremes of this tolerence, excellent results can still be observed
Graph E.2. Mode Values
SW
Difficulty
Zoom
Ope
ratio
n
Zoom
Clarity
Inve
rt Ope
ratio
n
Gre
y Ope
ratio
n
High Con
trast
HMI
Help
Mov
ing Objec
t
Enjoy
men
t
Excellent
Good
Average
Below Avg
Poor
Masters of Science in Engineering
Craig Wing Page D7 of D14
D.3. Data Analysis The data collected during the usability analysis was tabulated and analyzed
(see Appendix E, for original test documents and results) The following results are
based upon the entire sampled group, i.e. children, adults, elderly and CAL combined,
with each subgroup exhibiting similar results
D.3.1. Trend Analysis
Upon further analysis of the tabulated data, a number or trends were noted. Outliers
were included in the analysis, as these numbers may be an indication of a larger
population group that may have similar experiences.
D.3.1.1. Scroll Button Operation
The users in general experienced problems with the concept of the clicking of the
scroll button (to initialize the grayscale and high contrast modules). The average times
for these functions were higher than for the other modules (zoom and invert), i.e.
28.40 sec and 22.46 sec respectively as opposed to 14.38 sec and 20.37 sec.
The concept of single and double clicking was not problematic however due to the
similarities of the times for both functions (28.40 sec and 22.46 sec). Additionally this
can be verified by the number of help referrals and errors committed for the first
instance of the scroll click.
The same cannot however be said to the scrolling and clicking of the scroll button.
The times, on average, to complete the functionality associated with the two functions
(zooming and grayscale), yielded a significant difference in times, 14.38 sec and
22.48sec.
This can be attributed to the fact that the scroll button could be rolled and clicked, and
it became evident that users were unsure of the latter functionality with the former
being more natural. This trend can be reinforced to the numerous comments and
observations that test participants were only accustomed to a mouse without the scroll
button.
D.3.1.2. Learnability
A fundamental requirement of usability is that “Usability is about learnability,
efficiency, memorability, errors, and satisfaction.” – Nielsen [3].
By analysing the statistical data, it can be seen that this requirement has been met, as
the average time to complete the scenario test, that compromised of a number of tasks
(greyscale, invert, zoom), was less than the average time to complete the individual
tasks, i.e. the average time to complete the scenario task was 43.925 sec compared to
a total time of 57.225 sec for the total addition of the individual tasks. This is
reinforced by a similar observation on the reduction of the number of errors and help
referrals.
Comments during the posttest questionnaire that using the device would lead to an
easier experience enforces that learnability has been successfully applied.
Masters of Science in Engineering
Craig Wing Page D8 of D14
D.3.2. Outliers
Outliers were found in both the test participant evaluation and the posttest
questionnaire, but were included in the overall analysis of the device.
D.3.2.1. Test Participant Evaluation
The major conclusions from the analysis of the data of the test participant evaluation,
with respect to outliers were;
o Of the eleven outliers (the two for exiting and restarting the device were not
considered as explained above), nine erred on the higher side. The remaining
two were during the high contrast or split modules evaluation.
o Of these nine, seven were from two users (user six and ten) and these were for
the scenario test and for elements of the scenario test (zoom, grayscale and
invert). This indicates that these two users experienced severe difficulty in
using the device.
D.3.2.2. Posttest Questionnaire
The major conclusions from the analysis of the data of the user ratings from the
posttest questionnaire were;
o All nine outliers were for values that were higher than the average
o 30% of the outliers were concerning the help documentation, and these users
committed more errors than the average
o User 14 gave two outliers and though this person performed extremely well
during the usability testing, also tended to give poorer results than the average
(2.8 compared to the average of 1.75)
D.3.3. Usability Concerns
The areas of concern were addressed with sufficient data such that a conclusion could
be reached (see D.1.1. Goals and Concerns, above);
D.3.3.1. Learnability
By observing the trends in the data analysis, it can be concluded that the goal of
learnability has been met (see D.3.1.2.Learnability, above). This is further verified by
the many user’s comments that the interface was excellent and that more use would
make the program operation easier.
D.3.3.2. Usability
Within the context of usability (effectiveness, efficiency, satisfaction and context of
use), by analyzing the feedback from the posttest questionnaire, we note the following
o All users met the requirements of the usability test (effectiveness), i.e. all
requested tasks were completed without major problems
o The average time to complete the individual tasks was less than half a minute
(efficiency)
o From analysis of the posttest questionnaire, an average rating of 1.78 was
given for all the tasks performed (1 being the best value). Additionally, the
modal value for all questions pertaining to the product was either a one or a
two and the overall enjoyment of the product received a 1.42 (satisfaction).
o The users were all exposed to the product in their normal working
environment (context of use)
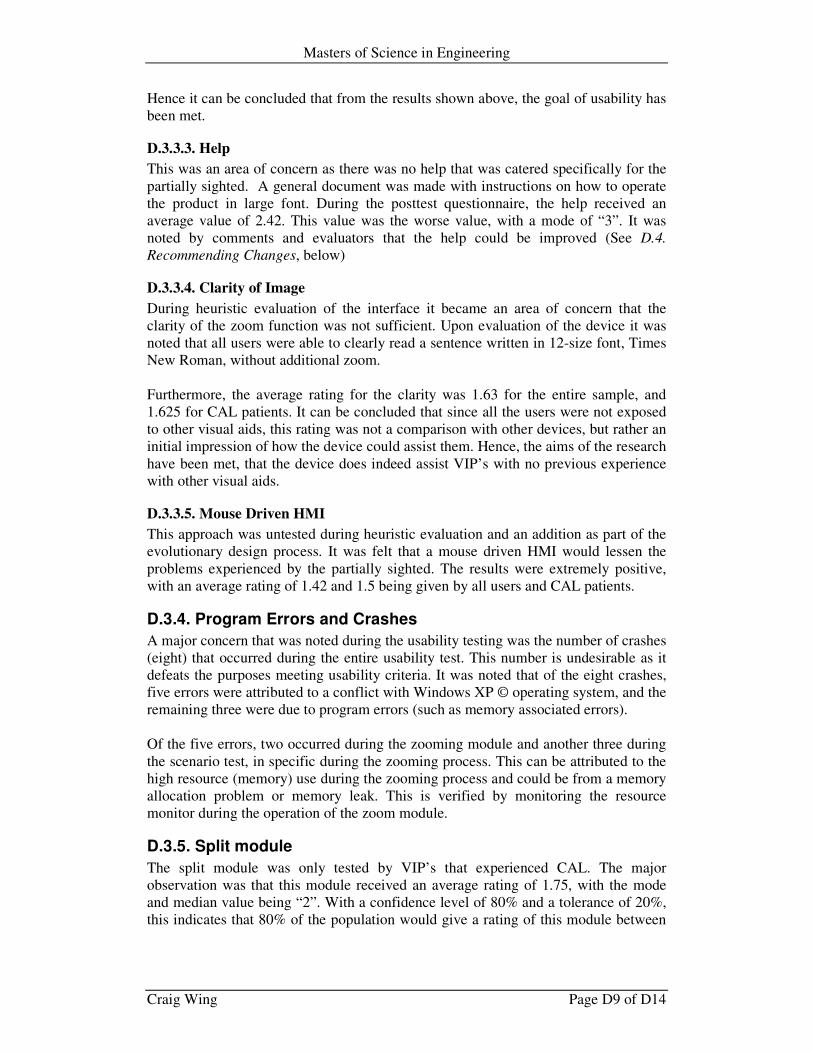
Masters of Science in Engineering
Craig Wing Page D9 of D14
Hence it can be concluded that from the results shown above, the goal of usability has
been met.
D.3.3.3. Help
This was an area of concern as there was no help that was catered specifically for the
partially sighted. A general document was made with instructions on how to operate
the product in large font. During the posttest questionnaire, the help received an
average value of 2.42. This value was the worse value, with a mode of “3”. It was
noted by comments and evaluators that the help could be improved (See D.4.
Recommending Changes, below)
D.3.3.4. Clarity of Image
During heuristic evaluation of the interface it became an area of concern that the
clarity of the zoom function was not sufficient. Upon evaluation of the device it was
noted that all users were able to clearly read a sentence written in 12-size font, Times
New Roman, without additional zoom.
Furthermore, the average rating for the clarity was 1.63 for the entire sample, and
1.625 for CAL patients. It can be concluded that since all the users were not exposed
to other visual aids, this rating was not a comparison with other devices, but rather an
initial impression of how the device could assist them. Hence, the aims of the research
have been met, that the device does indeed assist VIP’s with no previous experience
with other visual aids.
D.3.3.5. Mouse Driven HMI
This approach was untested during heuristic evaluation and an addition as part of the
evolutionary design process. It was felt that a mouse driven HMI would lessen the
problems experienced by the partially sighted. The results were extremely positive,
with an average rating of 1.42 and 1.5 being given by all users and CAL patients.
D.3.4. Program Errors and Crashes
A major concern that was noted during the usability testing was the number of crashes
(eight) that occurred during the entire usability test. This number is undesirable as it
defeats the purposes meeting usability criteria. It was noted that of the eight crashes,
five errors were attributed to a conflict with Windows XP © operating system, and the
remaining three were due to program errors (such as memory associated errors).
Of the five errors, two occurred during the zooming module and another three during
the scenario test, in specific during the zooming process. This can be attributed to the
high resource (memory) use during the zooming process and could be from a memory
allocation problem or memory leak. This is verified by monitoring the resource
monitor during the operation of the zoom module.
D.3.5. Split module
The split module was only tested by VIP’s that experienced CAL. The major
observation was that this module received an average rating of 1.75, with the mode
and median value being “2”. With a confidence level of 80% and a tolerance of 20%,
this indicates that 80% of the population would give a rating of this module between
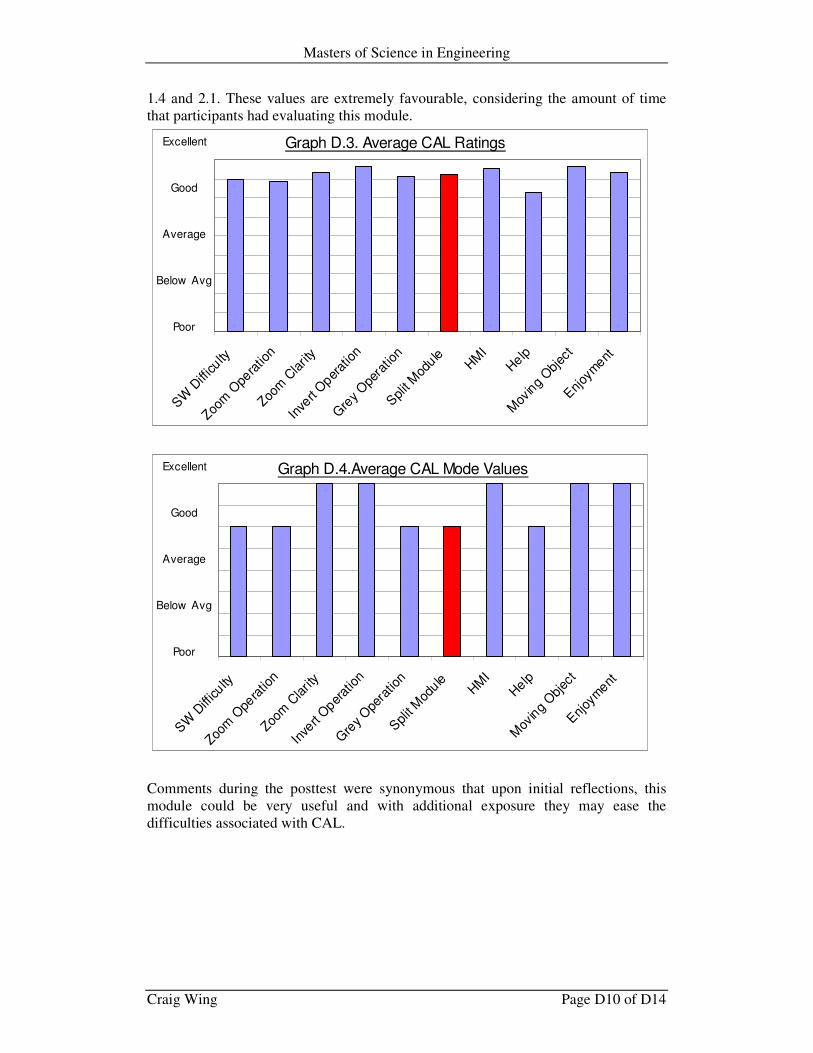
Masters of Science in Engineering
Craig Wing Page D10 of D14
Graph D.3. Average CAL Ratings
SW D
ifficu
lty
Zoom
Ope
ratio
n
Zoom
Cla
rity
Inve
rt O
perat
ion
Gre
y O
pera
tion
Split M
odule
HMI
Help
Mov
ing
Obj
ect
Enjoy
ment
Excellent
Good
Average
Below Avg
Poor
Graph D.4.Average CAL Mode Values
SW D
ifficu
lty
Zoom
Ope
ratio
n
Zoom
Clarit
y
Inve
rt Oper
atio
n
Gre
y O
pera
tion
Split
Mod
uleHM
I
Help
Mov
ing
Objec
t
Enjoy
ment
Excellent
Good
Average
Below Avg
Poor
1.4 and 2.1. These values are extremely favourable, considering the amount of time
that participants had evaluating this module.
Comments during the posttest were synonymous that upon initial reflections, this
module could be very useful and with additional exposure they may ease the
difficulties associated with CAL.
Masters of Science in Engineering
Craig Wing Page D11 of D14
D.4. Recommending Changes To complete the usability study, recommendations are required to be made to improve
the usability of the product to be implemented in subsequent iterations of the product.
D.4.1. Software
In general the software operation was favorable but there were ways in which the
usability could be improved.
D.4.1.1. Zoom Module
Although the zoom module was given unfavorable feedback from the usability
specialists in terms of the reduction of image quality with increase zoom rate, it was
found during the usability test, that test participants rated very highly the operation
and clarity of the final zoom module (1.89 and 1.63 respectively, with 1 being the best
possible rating).
It is assumed that this is because the test participants were not exposed to alternative
viewing devices as opposed to the usability specialists. This indicates that the
developed prototype may aid new sufferers, but does not compare favorably when
compared to other viewing devices. It would then still be necessary to improve the
clarity of the image to increase the number of VIP’s that this device could assist.
This could be corrected by implementing additional software image processing
techniques. One such technique that may achieve this is termed SuperResolution2.
This process has been researched on a very preliminary basis. Another method to
correct this problem would be to find an alternative to the current input device (See
D.4.3. Input Device, below).
D.4.1.2. Color Change
There were comments that different colors would be preferred to be used in the
grayscale, high contrast and split module, i.e. instead to black and white, blue and
white and the “split” placed in an image be a different color, not white. This is
because of the different ways in which VIP’s vision is affected by their individual
conditions. This can be implemented in software by pixel manipulation and should be
investigated further to determine the best color combinations. Alternatively, prior to
using these modules, the user could be prompted to their color preferences, which
would subsequently be realized.
D.4.1.3. HMI
Users and specialists alike commended the overall perception of a mouse driven
interface (user rating of 1.42). However feedback was that the operation of modules
assigned to mouse commands needed to be re-evaluated, this was reinforced by the
times and errors to compete operations using the scroll button. It is believed that
functions used more often be moved to more common mouse operations (e.g. single
and double left click) and less used modules be “mapped” to less used mouse
commands (e.g. double scroll click).
2SuperResolution is a process that takes a set of four images and combines them together to produce a
single, high-resolution image [72]
Masters of Science in Engineering
Craig Wing Page D12 of D14
D.4.1.4. Crashes
The number of crashes that were observed during the usability testing is unacceptable
as this factor alone renders the product useless and defeats the purpose of creating a
usable product. The process would be to determine the conflict between the Windows
XP© operating system and to determine if Microsoft has released updates and patches
that may correct this error, starting with the recently released service pack 2.
D.4.2. Hardware Stand
Although the hardware stand met the requirements given by heuristic evaluation and
the data analysis demonstrated that users had no difficulty in maneuvering the source
material relative to the viewing area (average rating of 1.368), a number of concerns
were raised.
D.4.2.1. Viewing Area
The eventual viewing area of the product was too small to be truly effective when
source material needed to be read from below it. An example was that the largest area
that could be read was a newspaper article with the usual column widths. Anything in
excess of that made reading problematic. This could be attributed to the change in
webcams from an initial Logitech Quickcam Pro3000, to the later Logitech Quickcam
Pro 4000. The latter introduced a larger image and reduced the viewing area.
D.4.2.2. Moving source material
Although the time taken to move images from below the webcam was favorable
(average time of 25.46 sec), it was found during observations that all participants
experienced difficulty in moving the source in a vertical or horizontal direction. This
could be overcome by incorporating an X-Y table as used by many other visual aids.
This device would allow the material to be placed upon a tray that would assist
movement in either only the vertical (Y) or horizontal (X) direction. This would
require additional hardware resources, but would alleviate this problem.
D.4.3. Input Device
In order for the product to become a more usable device, it is necessary that the input
device be re-evaluated. The input device has become the “bottleneck” in creating a
truly usable product and affects the clarity of the image, which ultimately affects the
entire operation of the product.
Subsequent iterations of the product need to investigate a low cost, high performance
device capable of incorporating a clearer image, reduction of the barrel effect and
improve the lighting, without requiring additional resources.
D.4.4. Help
It was noted during usability testing that a large portion of time used by test
participants was to find the correct command to initiate a module from the help
document. Careful consideration needs to be given to cater for VIP’s that are not able
to read text without additional aid. The text could be formatted by using different
colour combinations or by supplying an external reading aid (magnifying glass) to
read the text. An alternative could be for the help to be implemented within the
program itself and can be viewed upon a certain mouse operation.
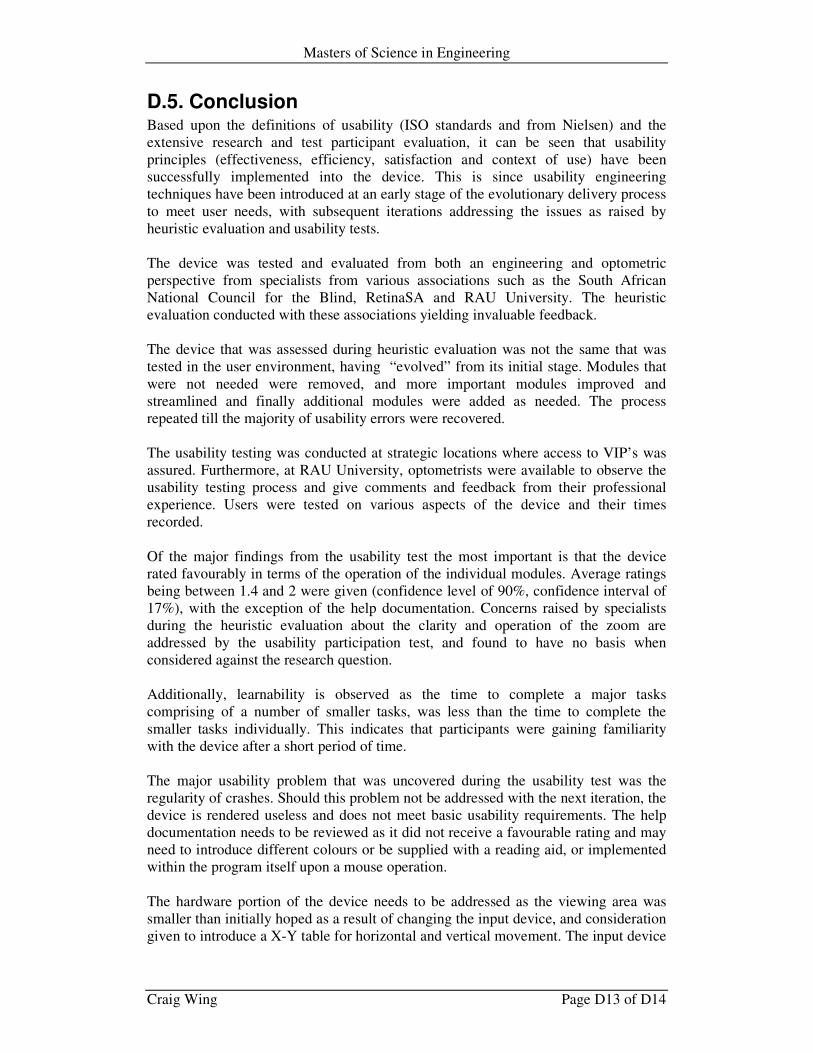
Masters of Science in Engineering
Craig Wing Page D13 of D14
D.5. Conclusion Based upon the definitions of usability (ISO standards and from Nielsen) and the
extensive research and test participant evaluation, it can be seen that usability
principles (effectiveness, efficiency, satisfaction and context of use) have been
successfully implemented into the device. This is since usability engineering
techniques have been introduced at an early stage of the evolutionary delivery process
to meet user needs, with subsequent iterations addressing the issues as raised by
heuristic evaluation and usability tests.
The device was tested and evaluated from both an engineering and optometric
perspective from specialists from various associations such as the South African
National Council for the Blind, RetinaSA and RAU University. The heuristic
evaluation conducted with these associations yielding invaluable feedback.
The device that was assessed during heuristic evaluation was not the same that was
tested in the user environment, having “evolved” from its initial stage. Modules that
were not needed were removed, and more important modules improved and
streamlined and finally additional modules were added as needed. The process
repeated till the majority of usability errors were recovered.
The usability testing was conducted at strategic locations where access to VIP’s was
assured. Furthermore, at RAU University, optometrists were available to observe the
usability testing process and give comments and feedback from their professional
experience. Users were tested on various aspects of the device and their times
recorded.
Of the major findings from the usability test the most important is that the device
rated favourably in terms of the operation of the individual modules. Average ratings
being between 1.4 and 2 were given (confidence level of 90%, confidence interval of
17%), with the exception of the help documentation. Concerns raised by specialists
during the heuristic evaluation about the clarity and operation of the zoom are
addressed by the usability participation test, and found to have no basis when
considered against the research question.
Additionally, learnability is observed as the time to complete a major tasks
comprising of a number of smaller tasks, was less than the time to complete the
smaller tasks individually. This indicates that participants were gaining familiarity
with the device after a short period of time.
The major usability problem that was uncovered during the usability test was the
regularity of crashes. Should this problem not be addressed with the next iteration, the
device is rendered useless and does not meet basic usability requirements. The help
documentation needs to be reviewed as it did not receive a favourable rating and may
need to introduce different colours or be supplied with a reading aid, or implemented
within the program itself upon a mouse operation.
The hardware portion of the device needs to be addressed as the viewing area was
smaller than initially hoped as a result of changing the input device, and consideration
given to introduce a X-Y table for horizontal and vertical movement. The input device
Masters of Science in Engineering
Craig Wing Page D14 of D14
needs to be evaluated to improve the clarity of the image to compete with other visual
aids.
The HMI implementation of a mouse driven interface was received with great
approval and user participants and evaluators alike believe that with further use it
could show additional favourable results. Additional thought needs to be given to the
operation of the individual modules with the more often used modules being
associated with easier mouse driven operations.
The “split” module, where a “gap” is inserted into the image to introduce a paragraph
break, has shown positive results and has been applauded by heuristic evaluation and
may be an additional approach to alleviate the problems faced by VIP’s. This could
lead to a different mindset and teaching approach. This is reinforced by the very
favourable rating received during the usability testing (1.75), and the numerous
comments from CAL patients that such a module, upon initial reflection, offers much
promise.
CAL patients are currently taught to read using their peripheral vision by reading
above the desired text. Using the split module would allow the user to look directly at
the text as per normal, except that the middle section of text would be moved higher
or lower to cater for their loss of central vision. This change in philosophy may ease
the adaptation for CAL patients when faced with initial vision loss, when reading and
viewing objects.
This research indicates that should a user have no prior experience with visual aids,
irrespective or vision disorder, the proposed device is beneficial in all facets including
the zoom operation and clarity. However, should the user have prior experience in
visual aids; the device does not offer the same quality in terms of image quality when
compared to other available visual aids.
Furthermore, statistics indicate that using the product, users are able to complete basic
tasks within an acceptable time and that learning of the product is implemented. The
statistics are within an 80% confidence interval and have a tolerance level of between
20 – 26% depending on the subgroup that was addressed. For the entire population
group, a 90% confidence exists, with a 17% confidence interval. Even at the extremes
of these tolerances, the data gathered indicate that this device is usable irrespective of
the condition or age of the user.
Masters of Science in Engineering
Craig Wing Page E1 of E41
Appendix E: Usability Test Documentation
Appendix E.1. Usability Test Orientation Document
Appendix E.2. Revision Commands
Appendix E.3. Block Testing Document
Appendix E.4. User Evaluation Sheets
Appendix E.5. Posttest Questionaire Sheets
Appendix E.6. Data Analysis
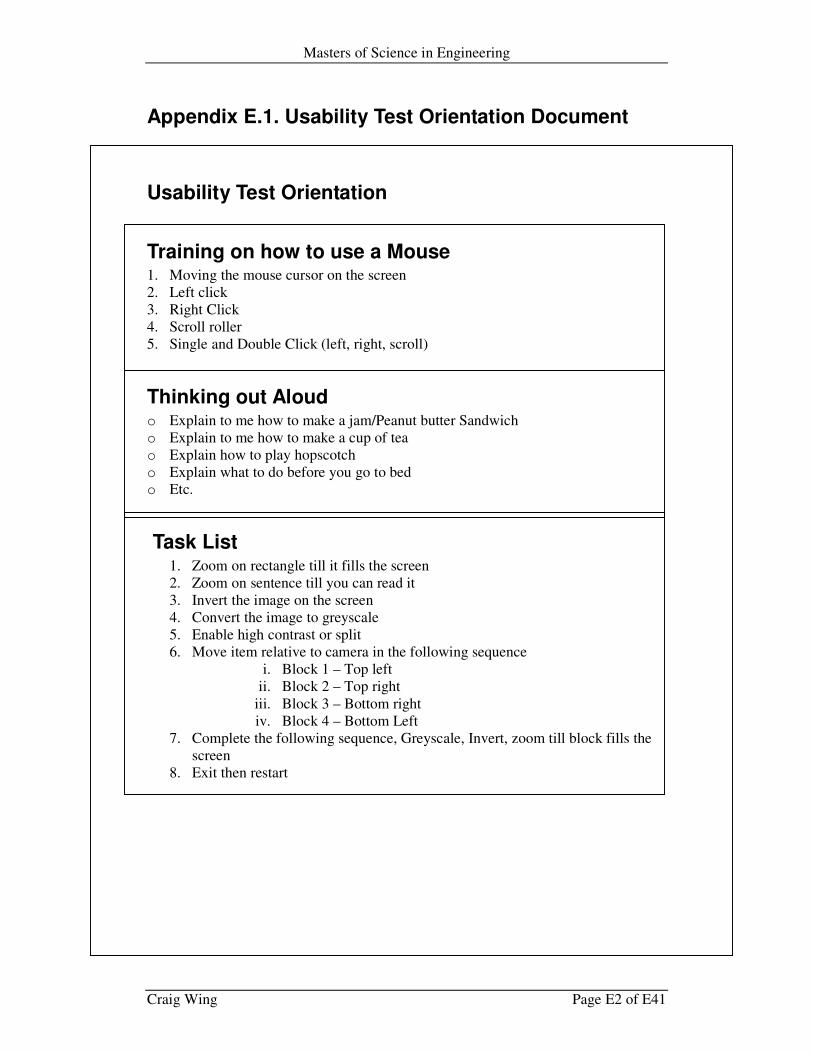
Masters of Science in Engineering
Craig Wing Page E2 of E41
Appendix E.1. Usability Test Orientation Document
Usability Test Orientation
Training on how to use a Mouse 1. Moving the mouse cursor on the screen
2. Left click
3. Right Click
4. Scroll roller
5. Single and Double Click (left, right, scroll)
Thinking out Aloud o Explain to me how to make a jam/Peanut butter Sandwich
o Explain to me how to make a cup of tea
o Explain how to play hopscotch
o Explain what to do before you go to bed
o Etc.
Task List 1. Zoom on rectangle till it fills the screen
2. Zoom on sentence till you can read it
3. Invert the image on the screen
4. Convert the image to greyscale
5. Enable high contrast or split
6. Move item relative to camera in the following sequence
i. Block 1 – Top left
ii. Block 2 – Top right
iii. Block 3 – Bottom right
iv. Block 4 – Bottom Left
7. Complete the following sequence, Greyscale, Invert, zoom till block fills the
screen
8. Exit then restart
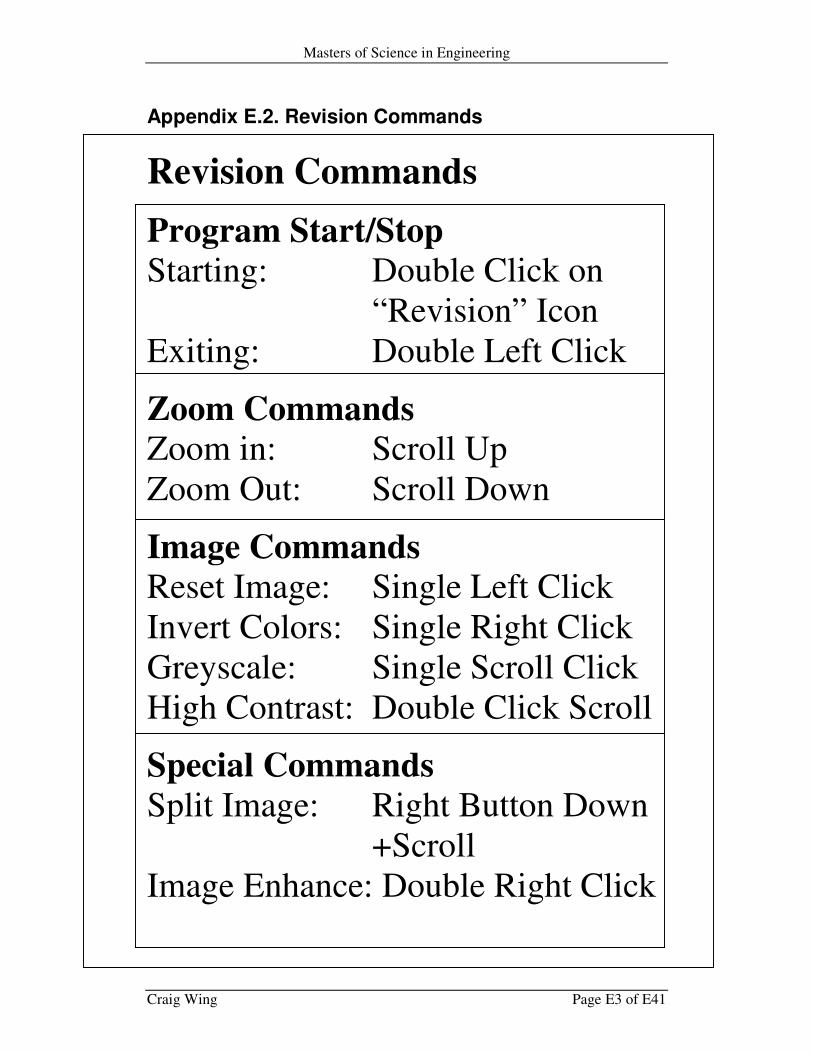
Masters of Science in Engineering
Craig Wing Page E3 of E41
Appendix E.2. Revision Commands
Revision Commands
Program Start/Stop
Starting: Double Click on
“Revision” Icon
Exiting: Double Left Click
Zoom Commands
Zoom in: Scroll Up
Zoom Out: Scroll Down
Image Commands
Reset Image: Single Left Click
Invert Colors: Single Right Click
Greyscale: Single Scroll Click
High Contrast: Double Click Scroll
Special Commands
Split Image: Right Button Down
+Scroll
Image Enhance: Double Right Click
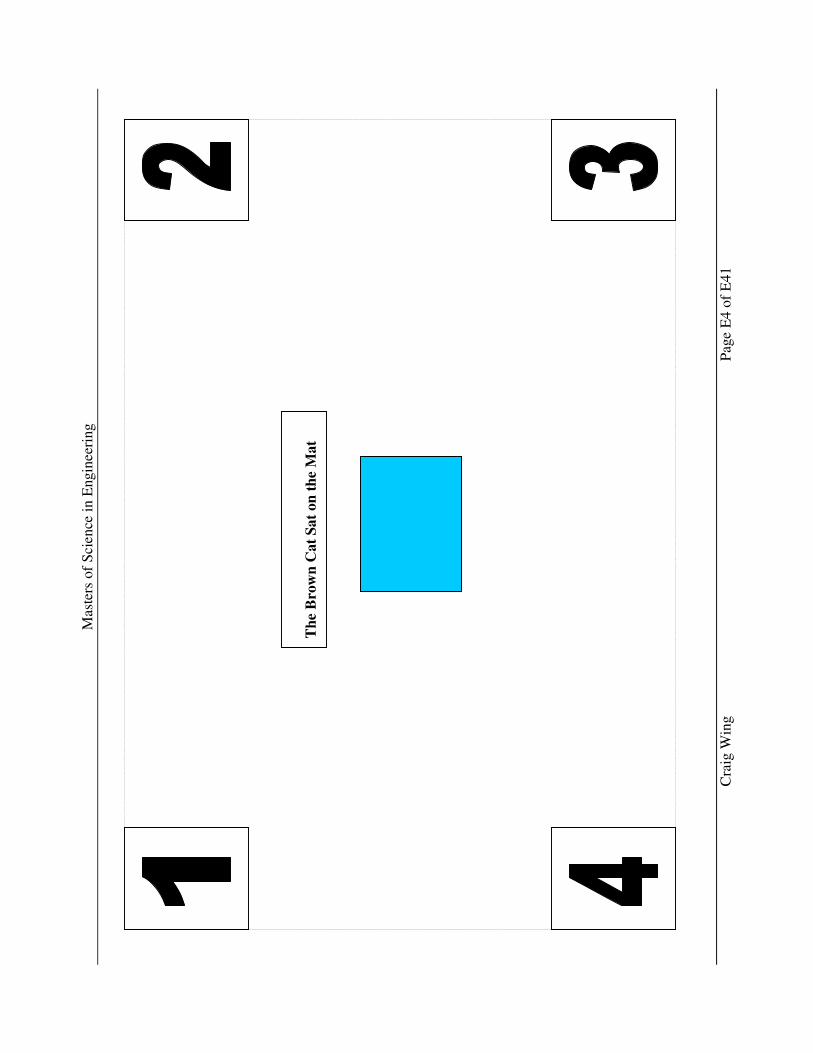
Mas
ters
of
Sci
ence
in E
ngin
eer
ing
Cra
ig W
ing
P
age E
4 o
f E
41
Th
e B
row
n C
at
Sat
on
th
e M
at
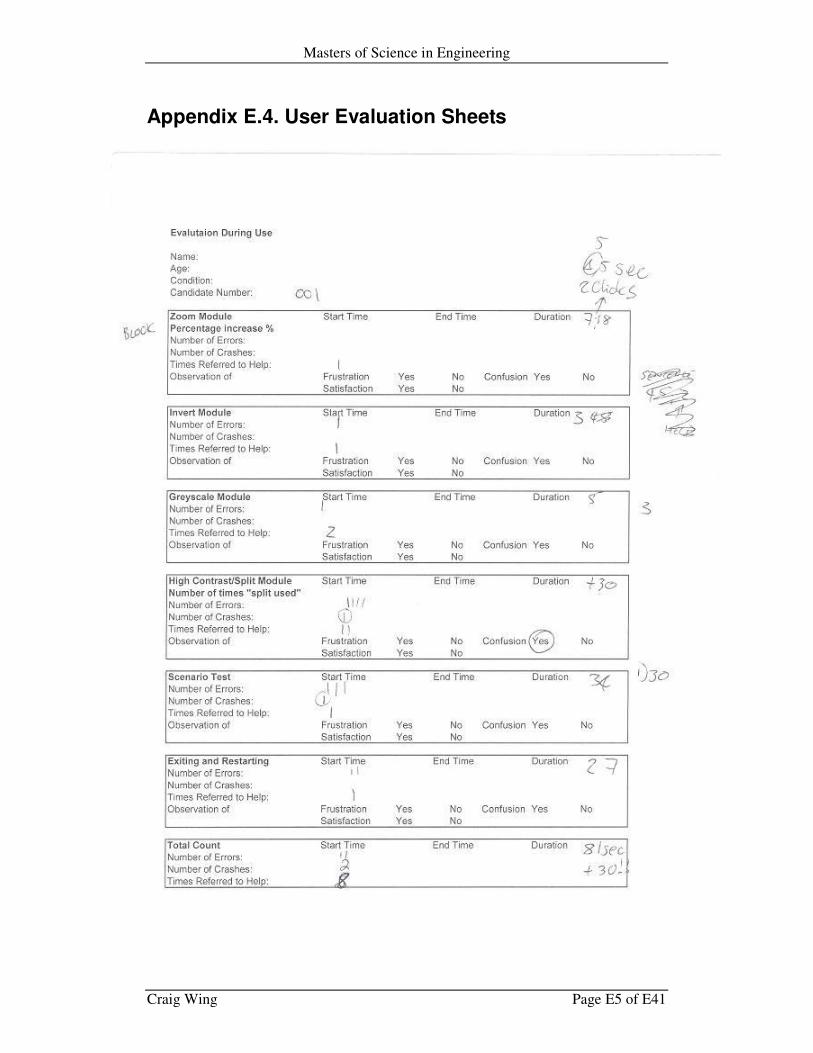
Masters of Science in Engineering
Craig Wing Page E5 of E41
Appendix E.4. User Evaluation Sheets
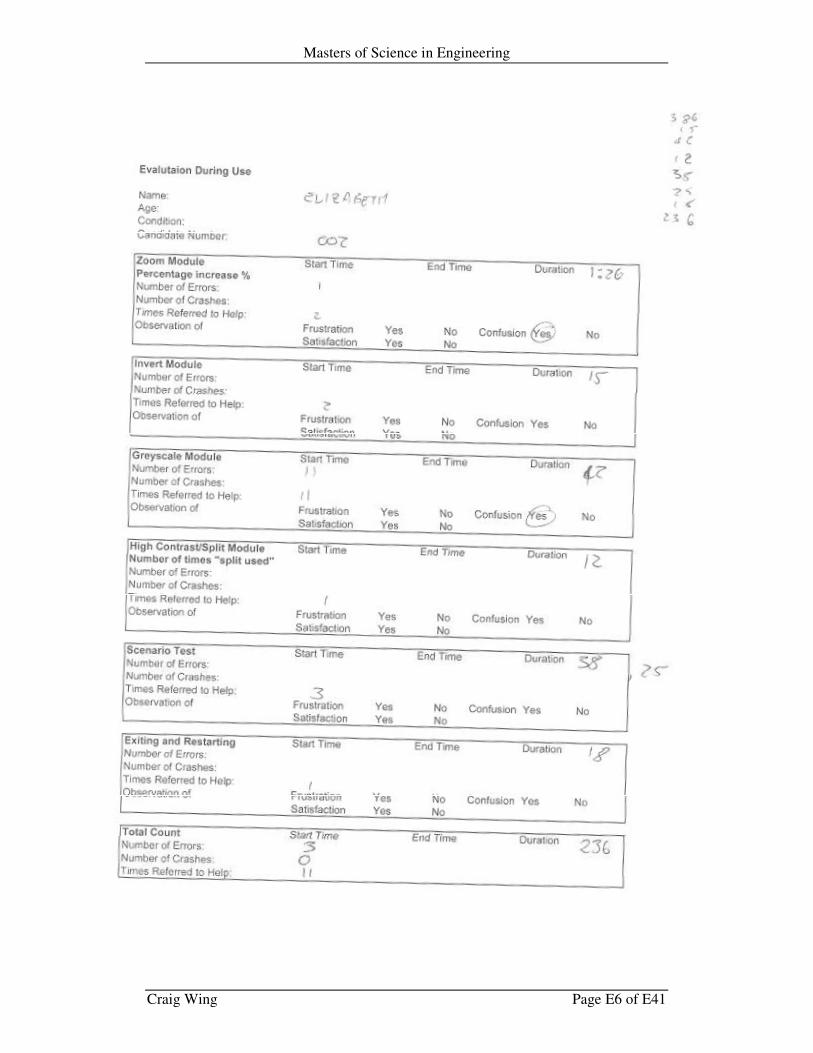
Masters of Science in Engineering
Craig Wing Page E6 of E41
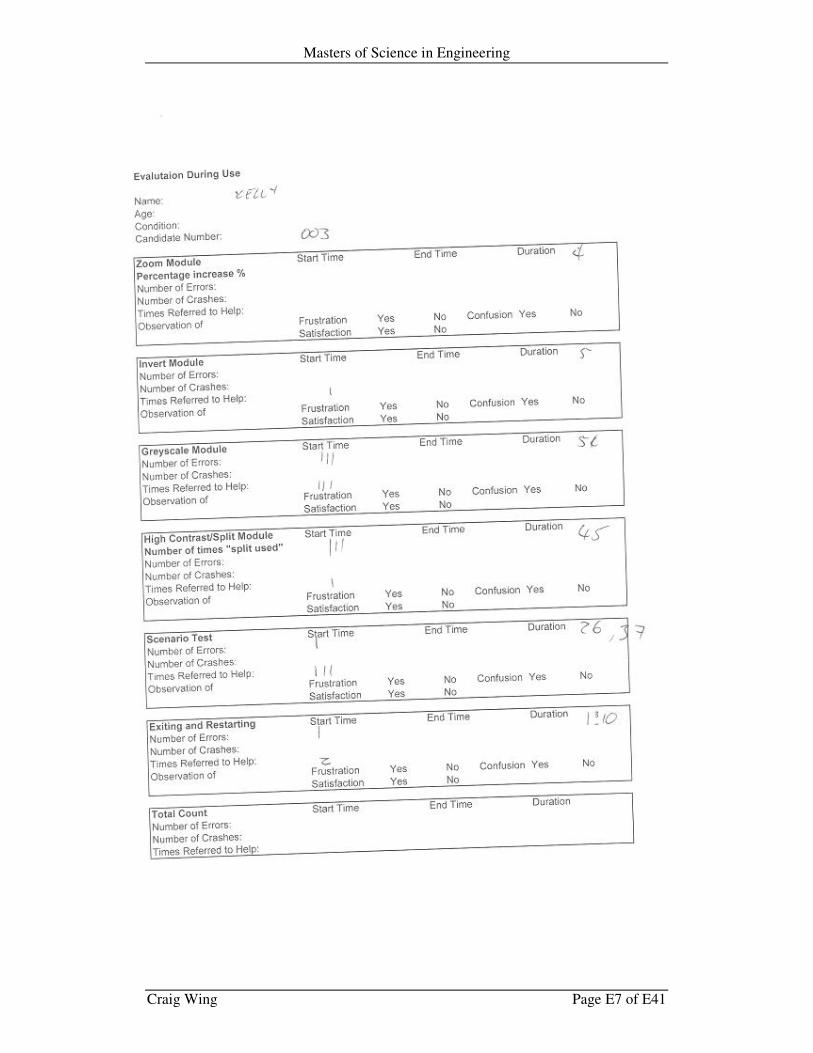
Masters of Science in Engineering
Craig Wing Page E7 of E41
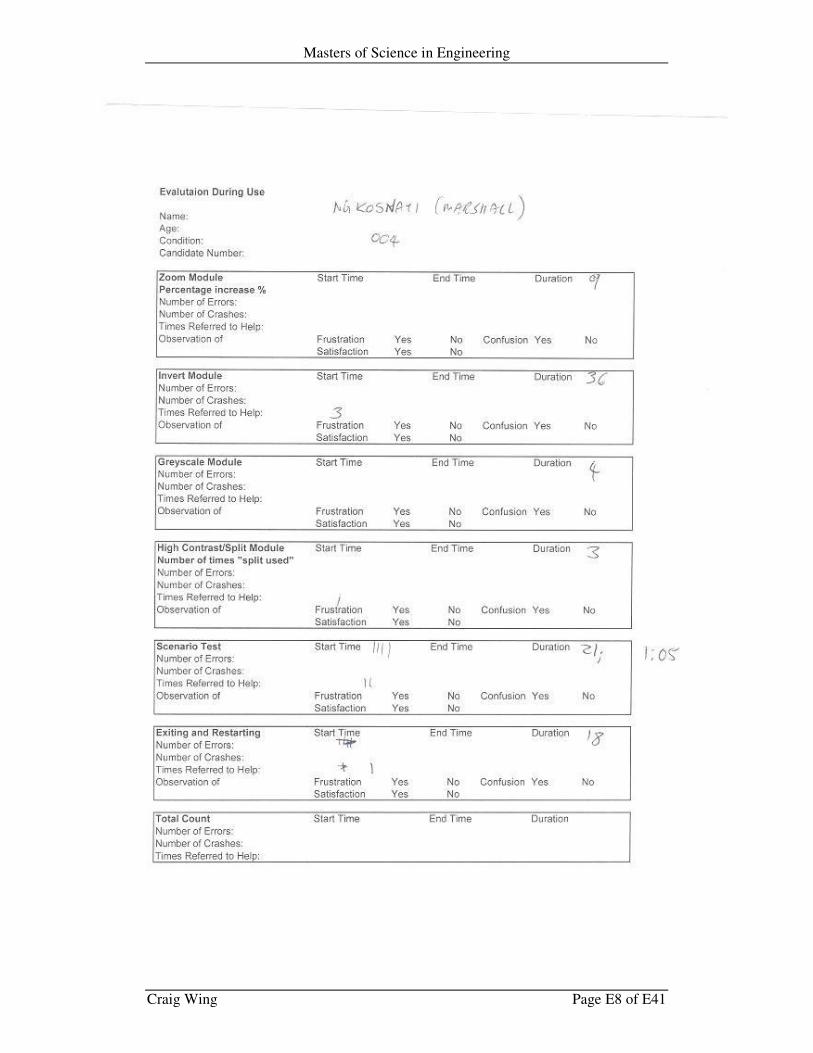
Masters of Science in Engineering
Craig Wing Page E8 of E41
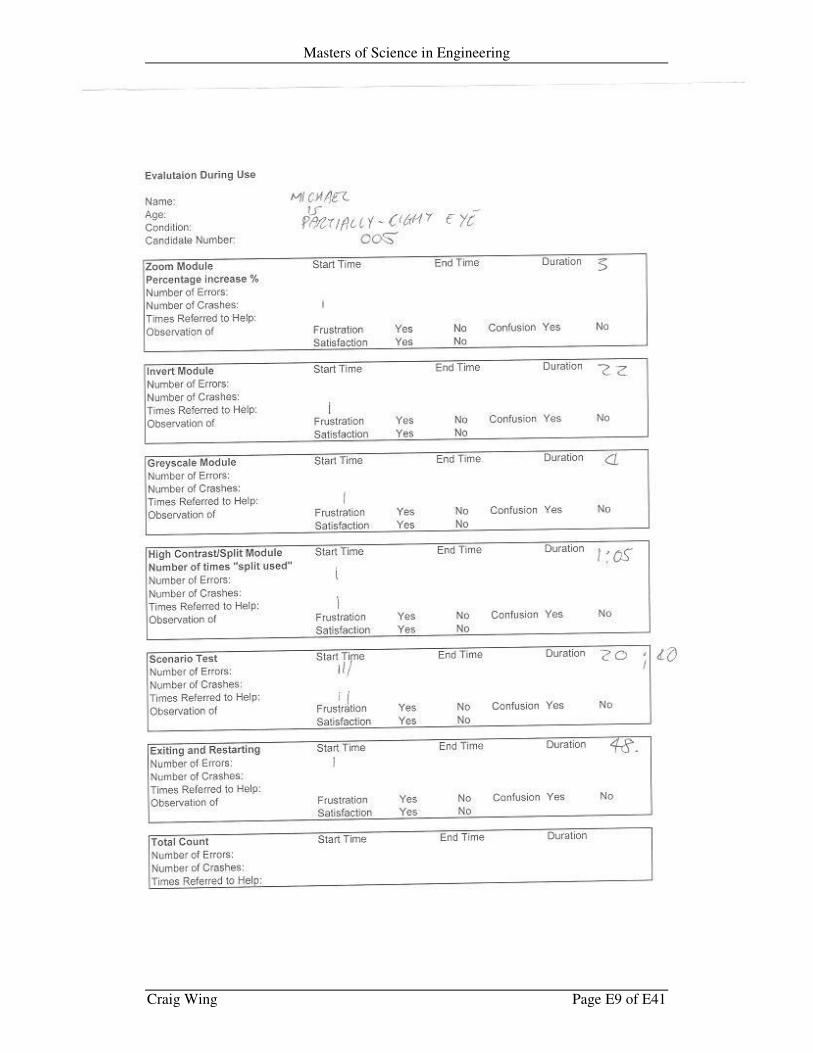
Masters of Science in Engineering
Craig Wing Page E9 of E41
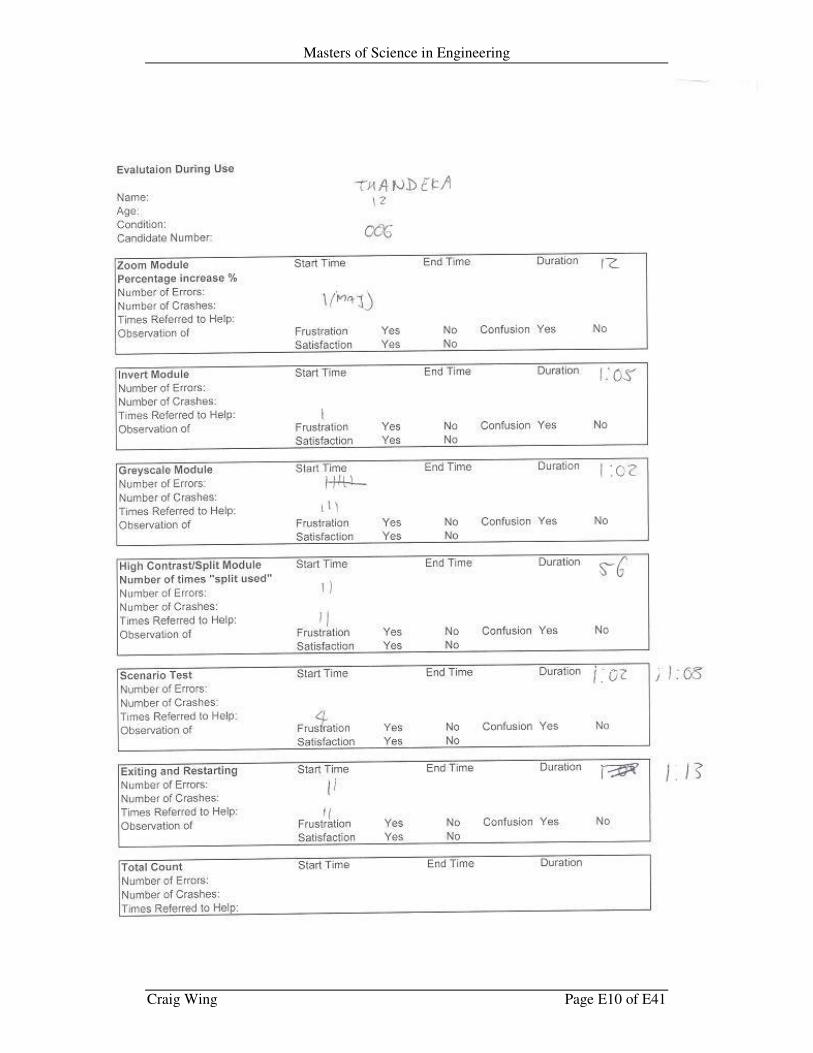
Masters of Science in Engineering
Craig Wing Page E10 of E41
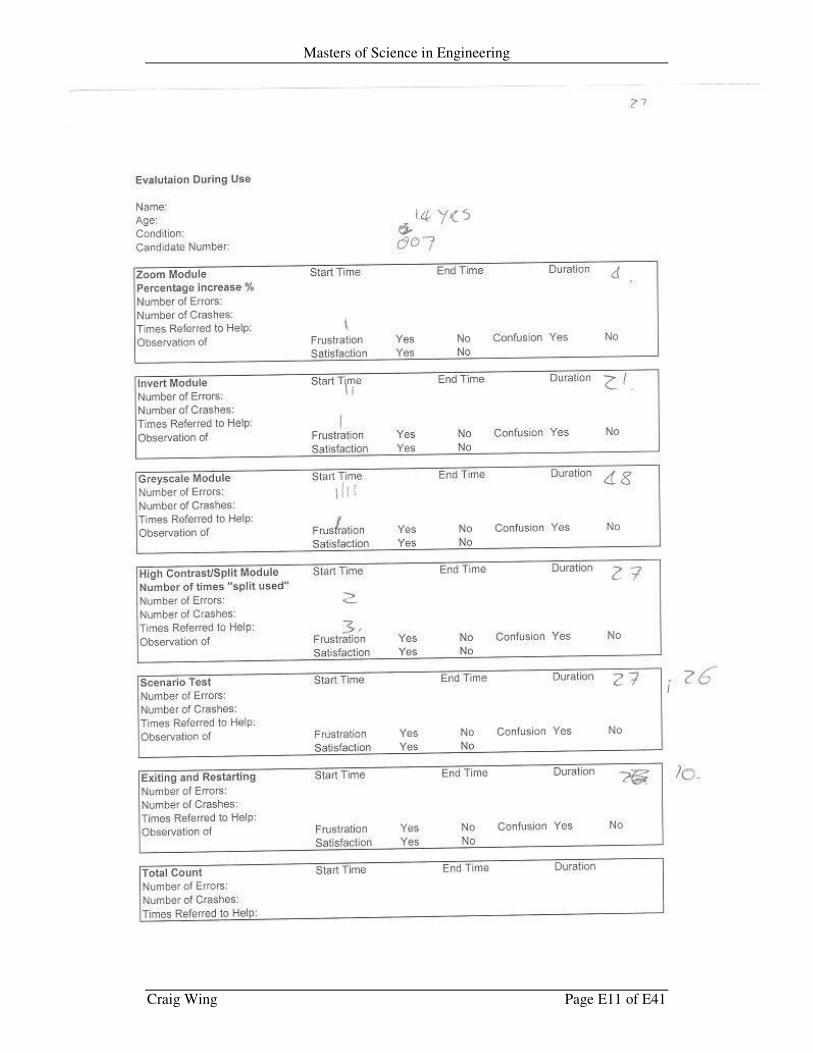
Masters of Science in Engineering
Craig Wing Page E11 of E41
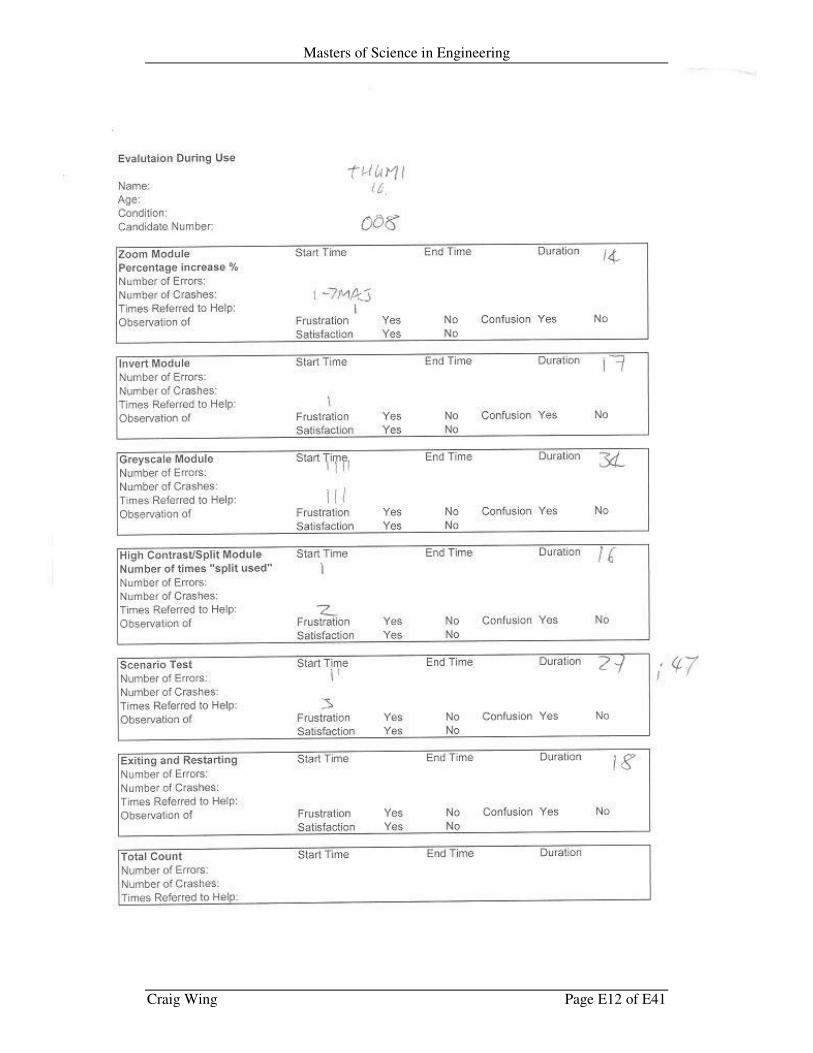
Masters of Science in Engineering
Craig Wing Page E12 of E41
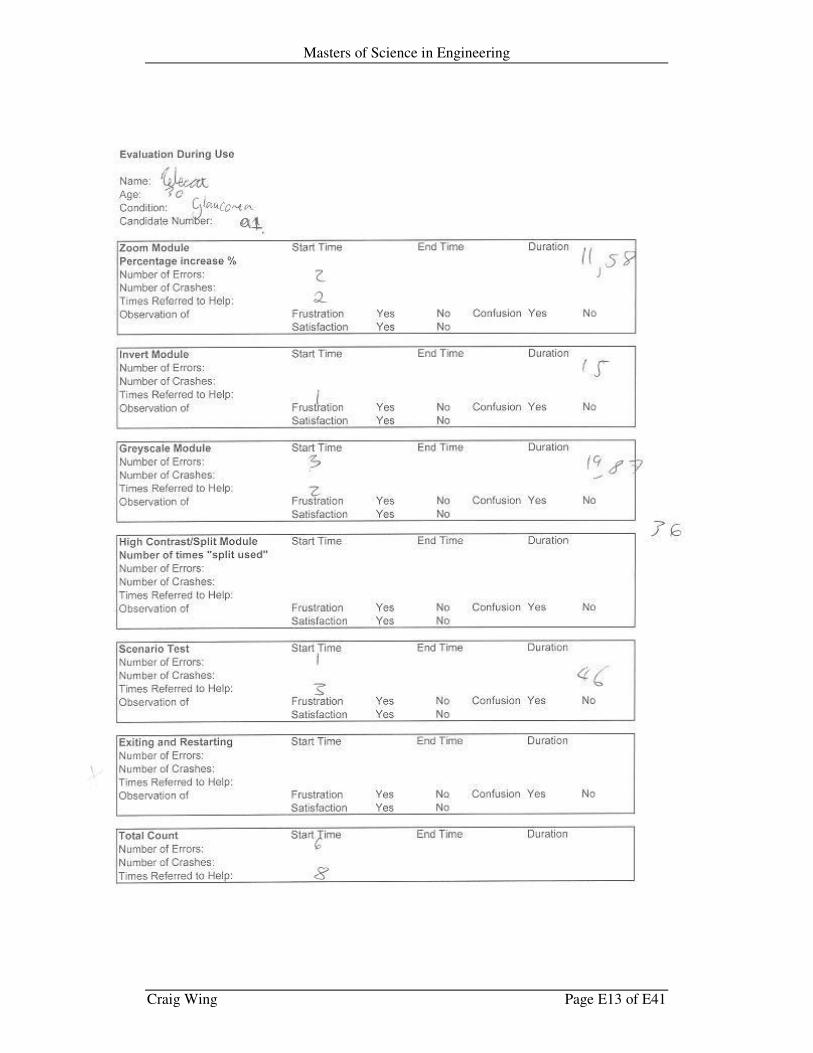
Masters of Science in Engineering
Craig Wing Page E13 of E41
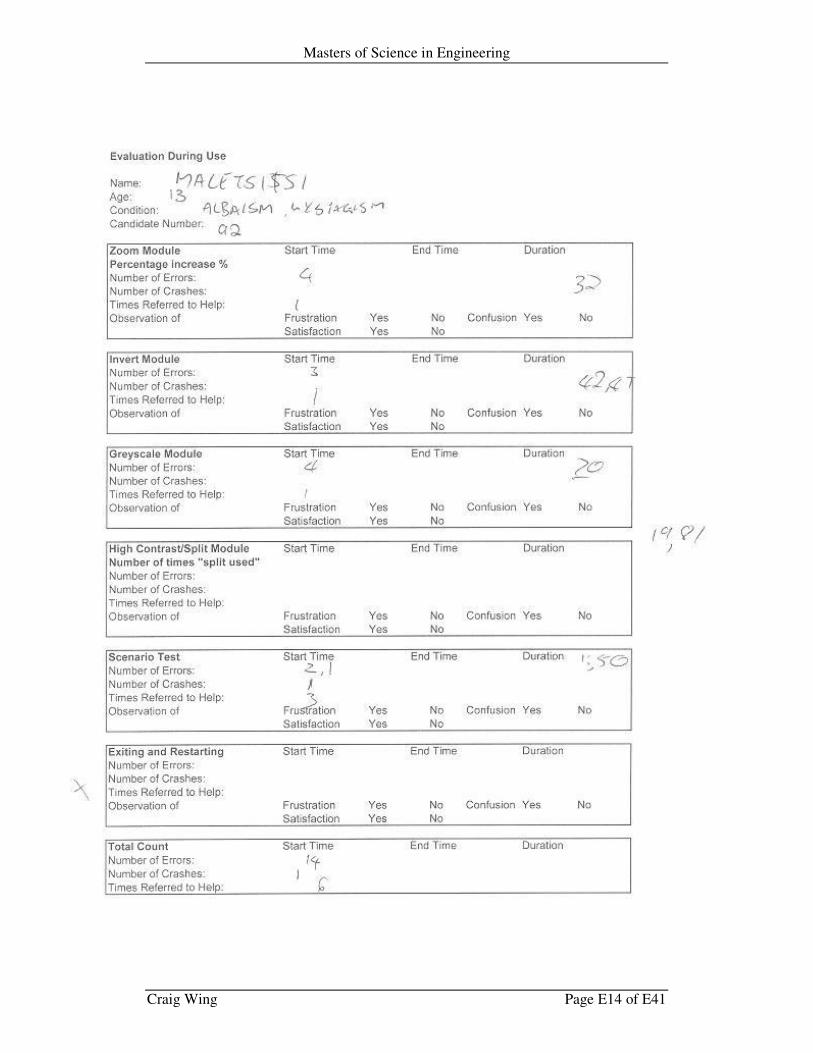
Masters of Science in Engineering
Craig Wing Page E14 of E41
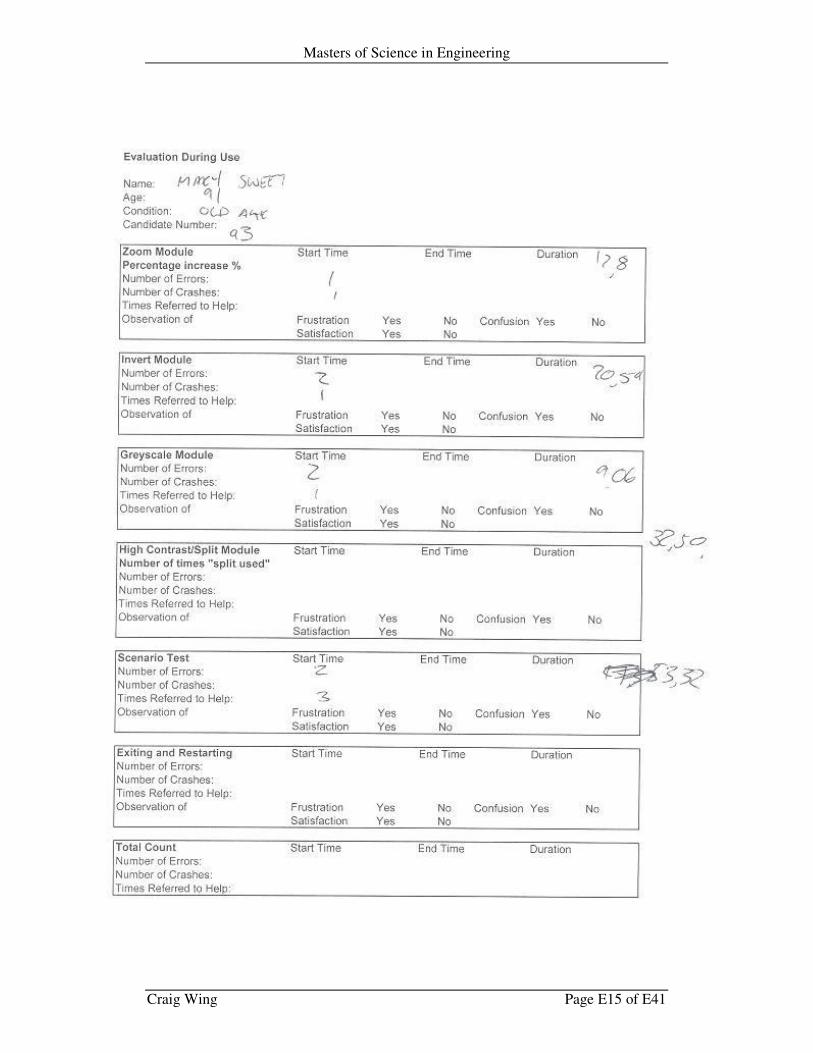
Masters of Science in Engineering
Craig Wing Page E15 of E41
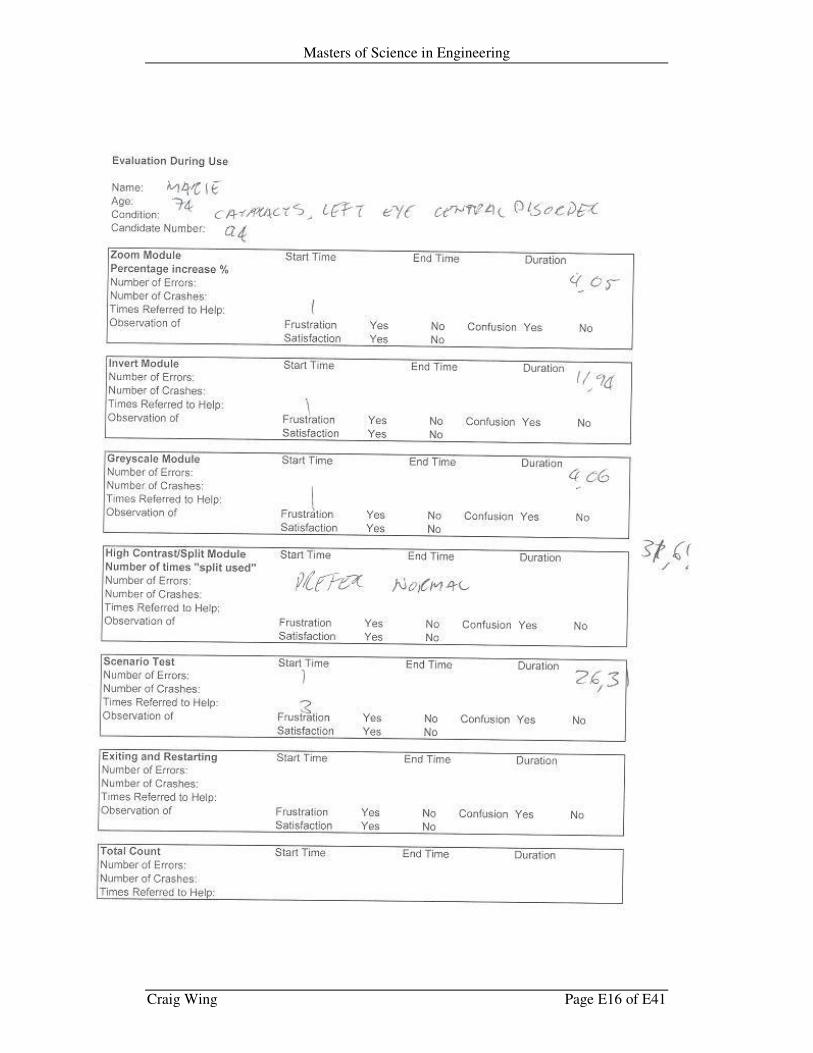
Masters of Science in Engineering
Craig Wing Page E16 of E41
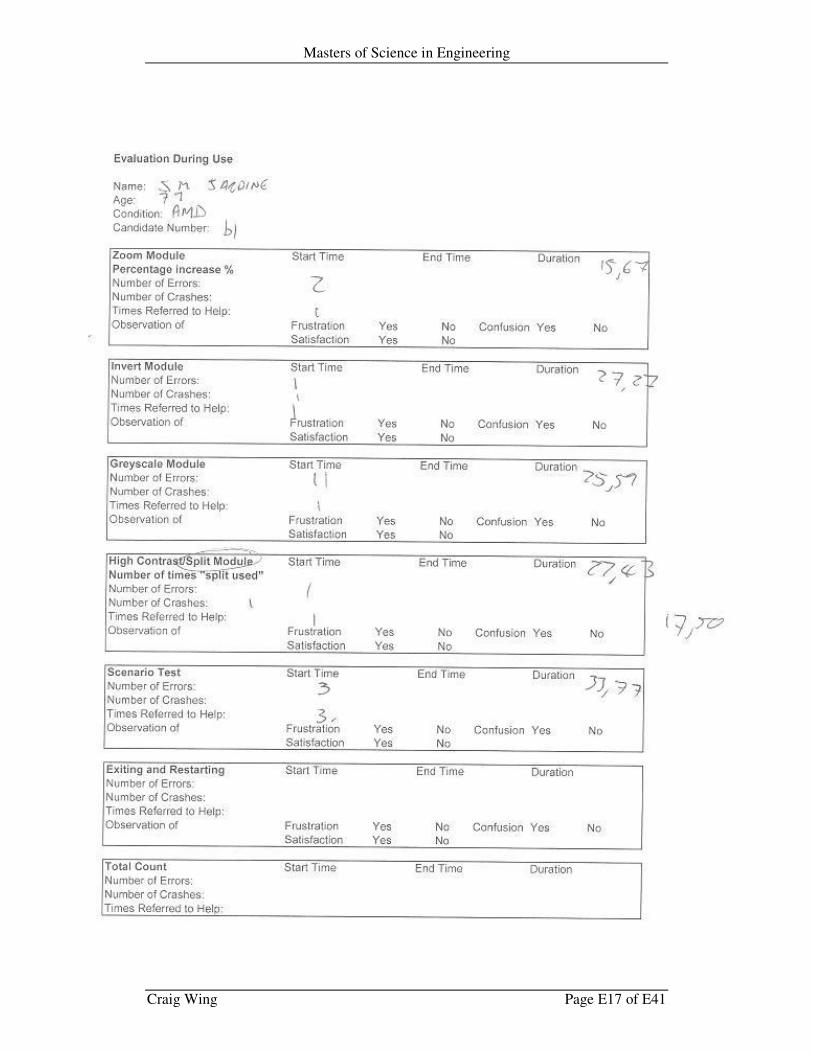
Masters of Science in Engineering
Craig Wing Page E17 of E41
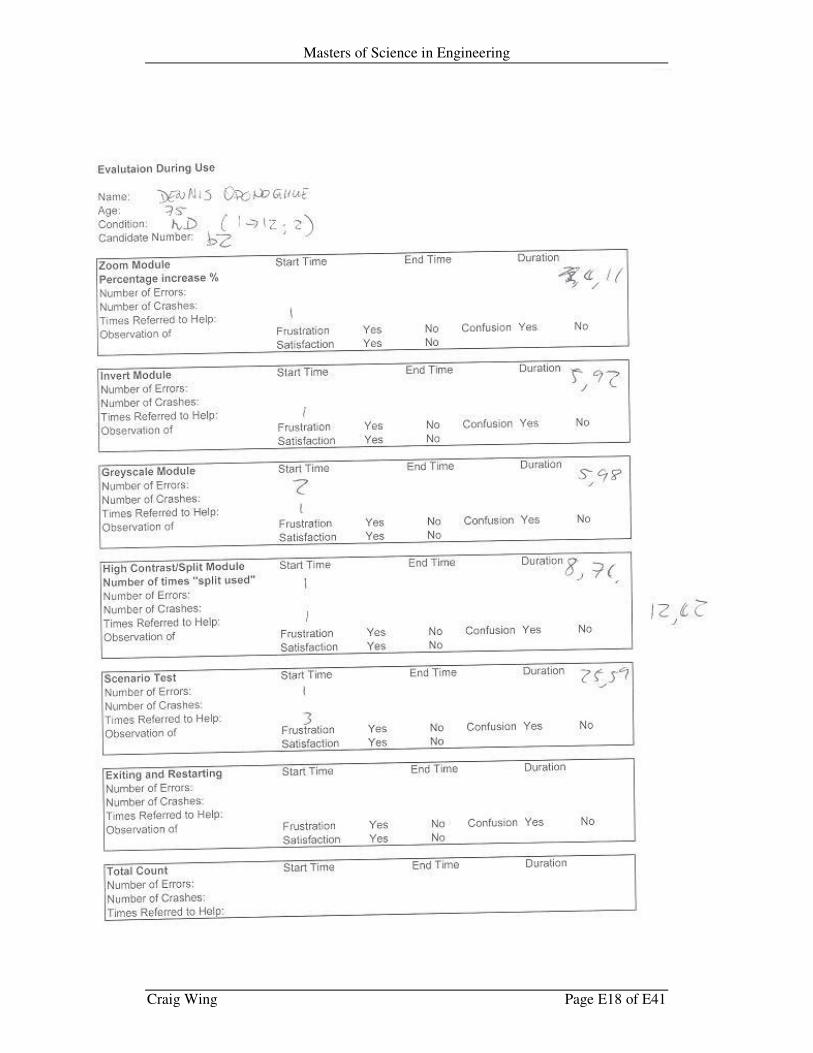
Masters of Science in Engineering
Craig Wing Page E18 of E41

Masters of Science in Engineering
Craig Wing Page E19 of E41
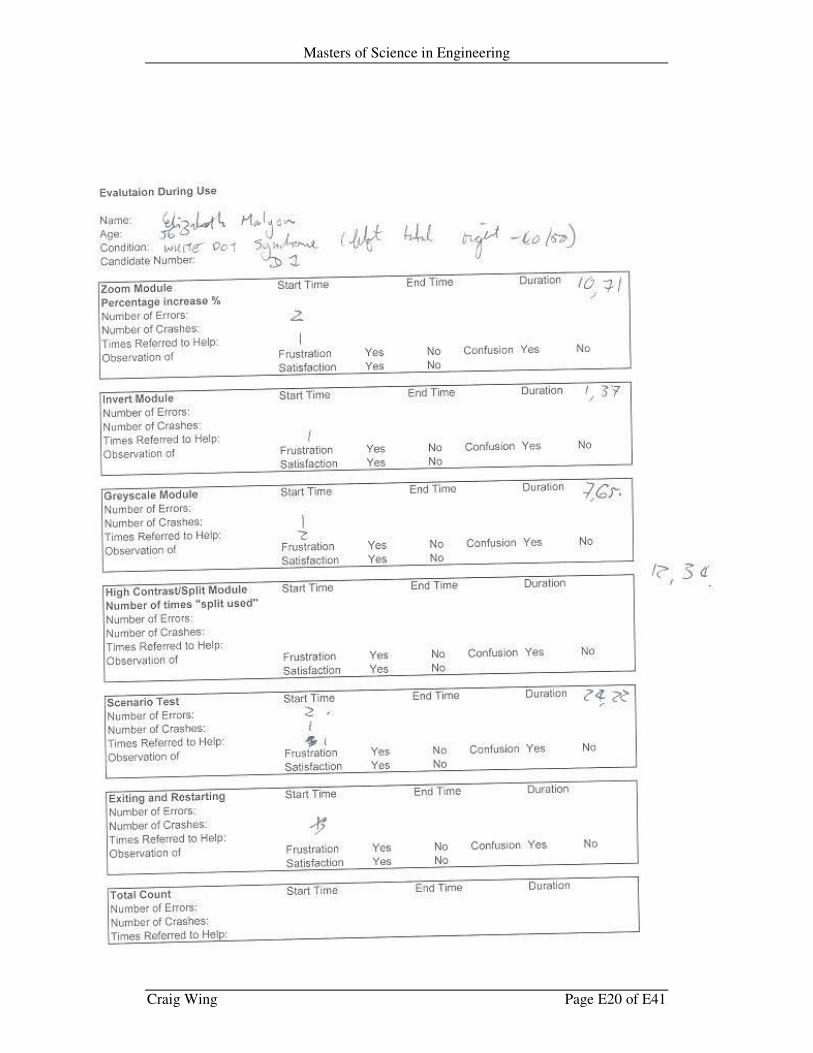
Masters of Science in Engineering
Craig Wing Page E20 of E41
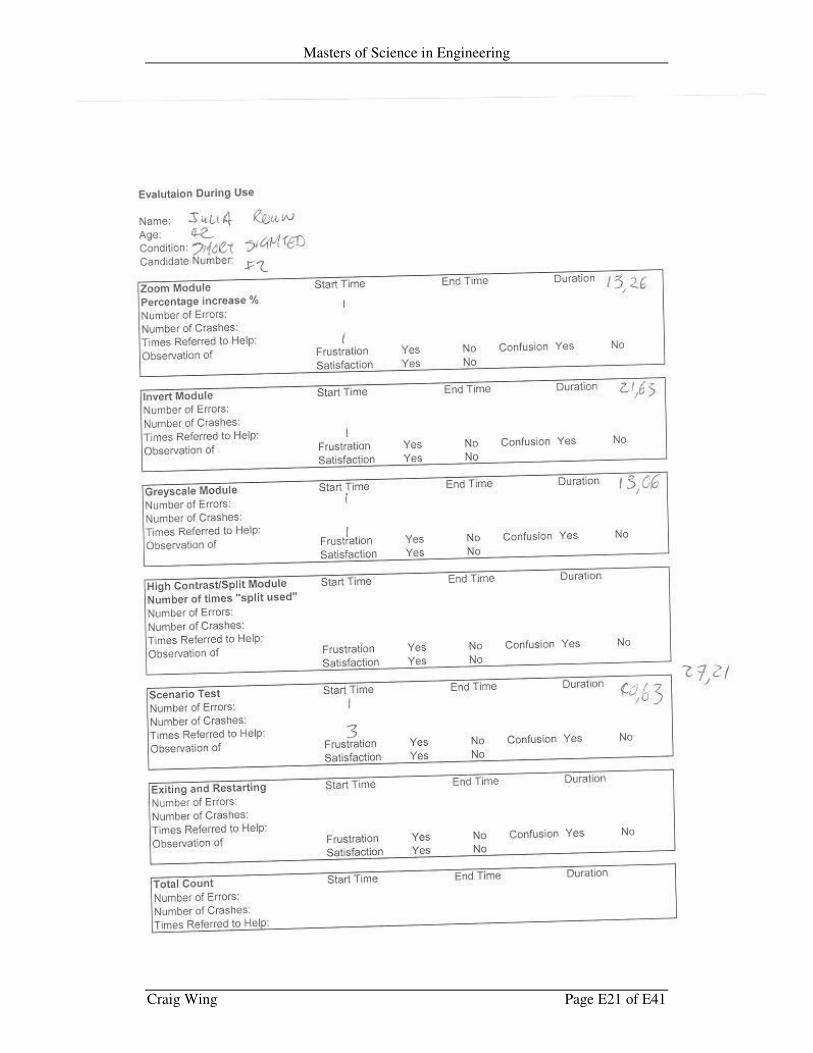
Masters of Science in Engineering
Craig Wing Page E21 of E41
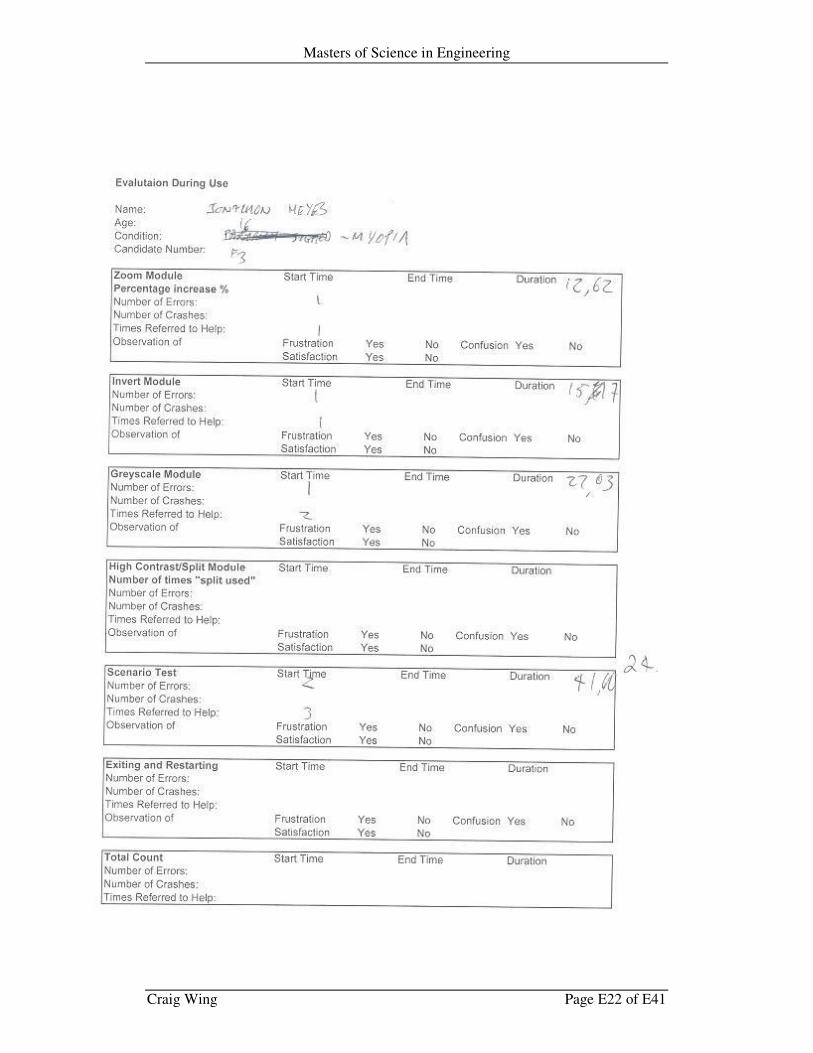
Masters of Science in Engineering
Craig Wing Page E22 of E41
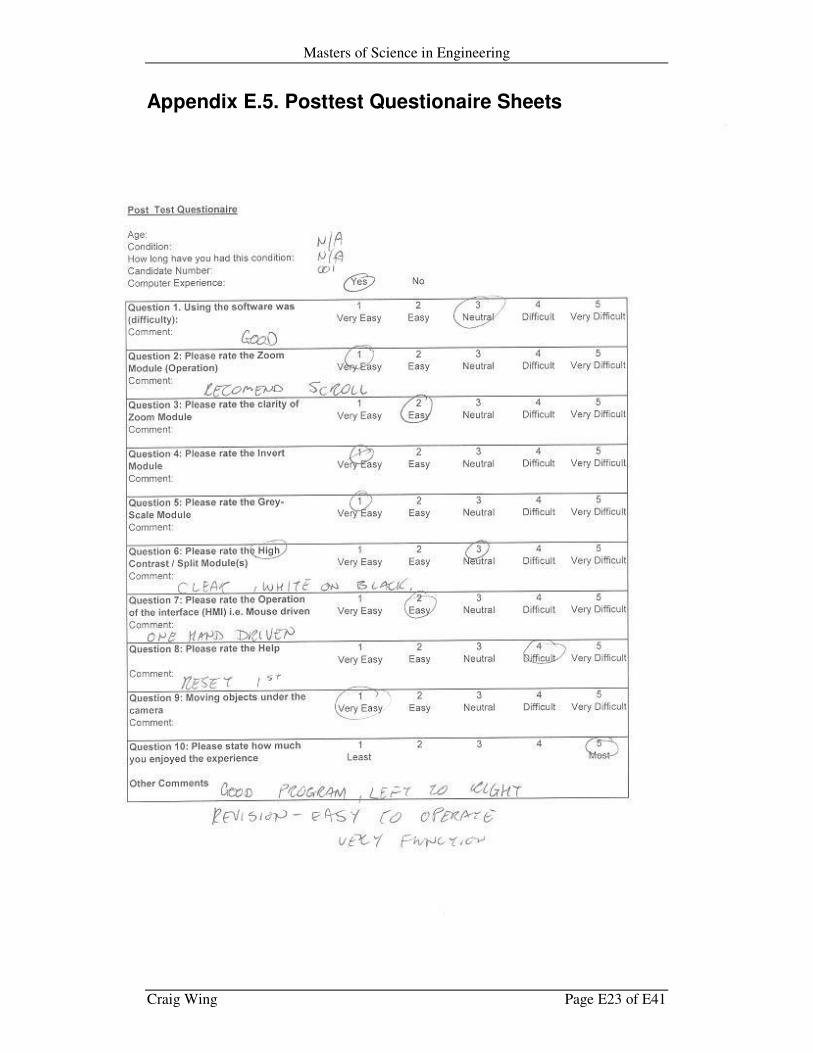
Masters of Science in Engineering
Craig Wing Page E23 of E41
Appendix E.5. Posttest Questionaire Sheets
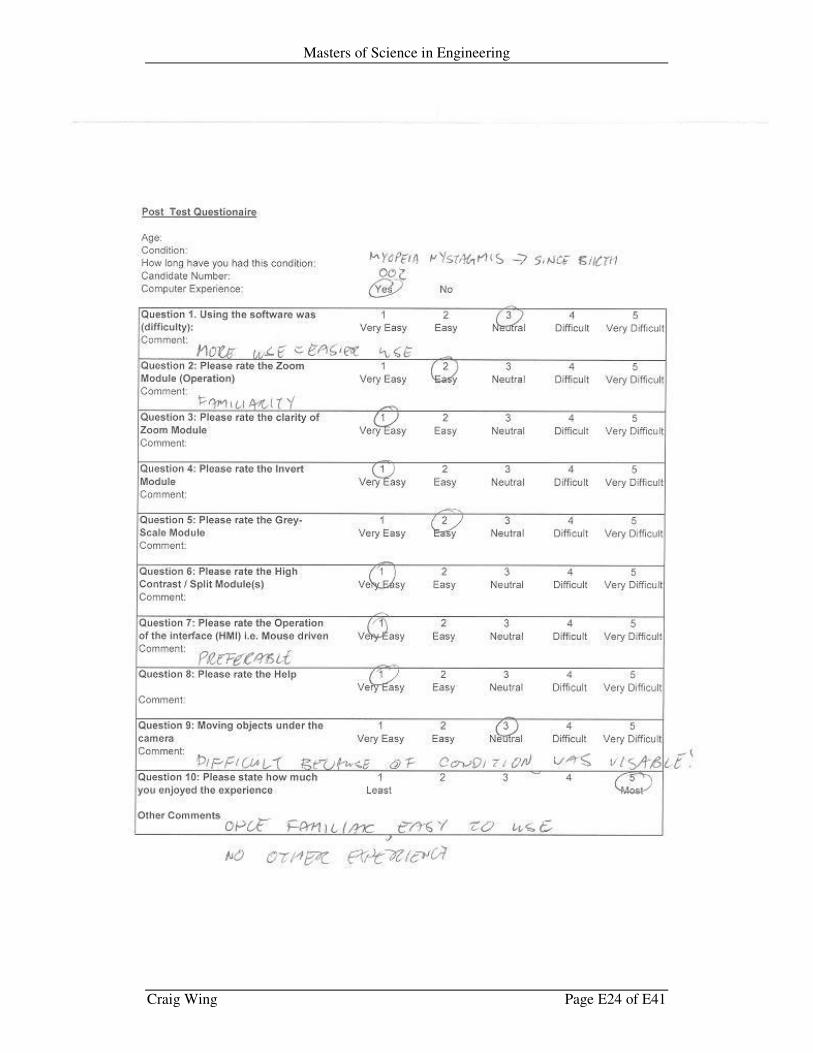
Masters of Science in Engineering
Craig Wing Page E24 of E41
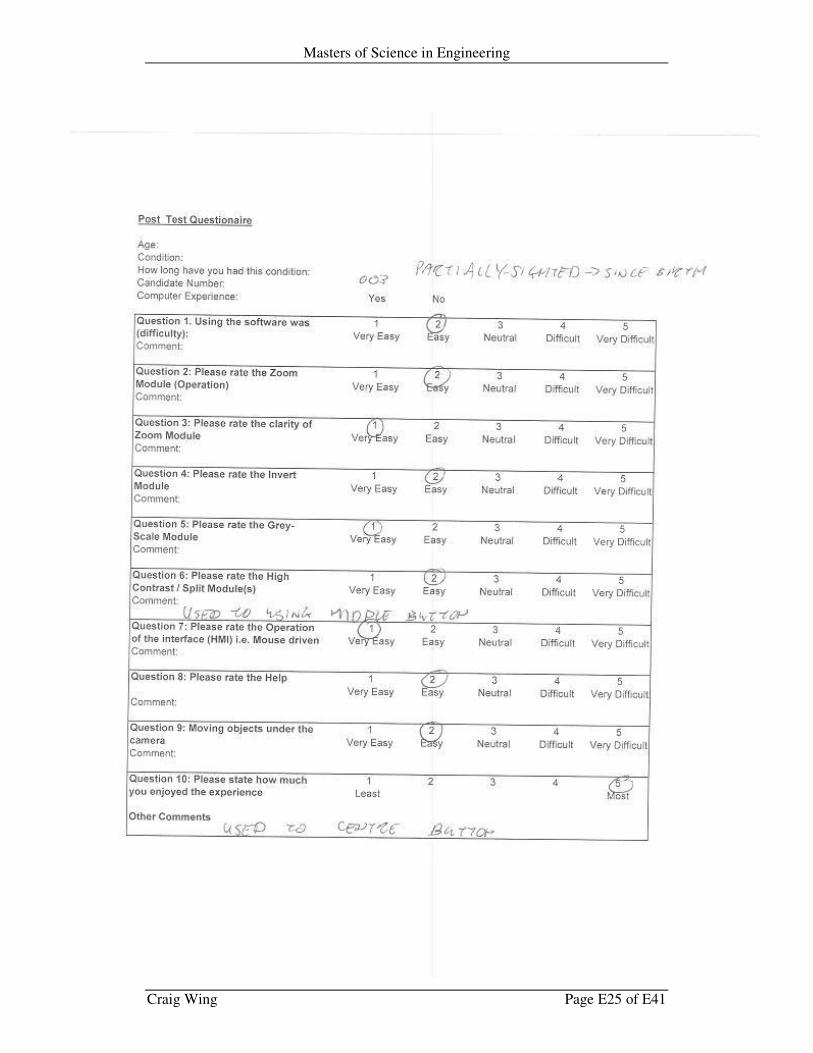
Masters of Science in Engineering
Craig Wing Page E25 of E41
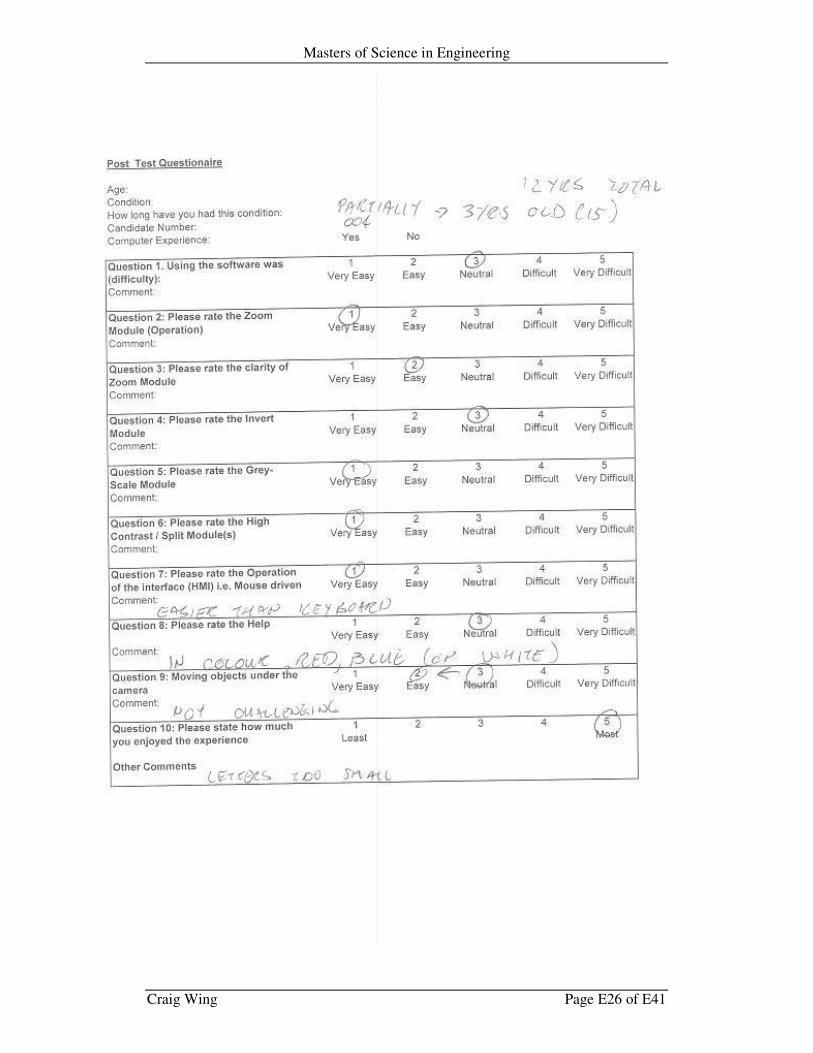
Masters of Science in Engineering
Craig Wing Page E26 of E41

Masters of Science in Engineering
Craig Wing Page E27 of E41
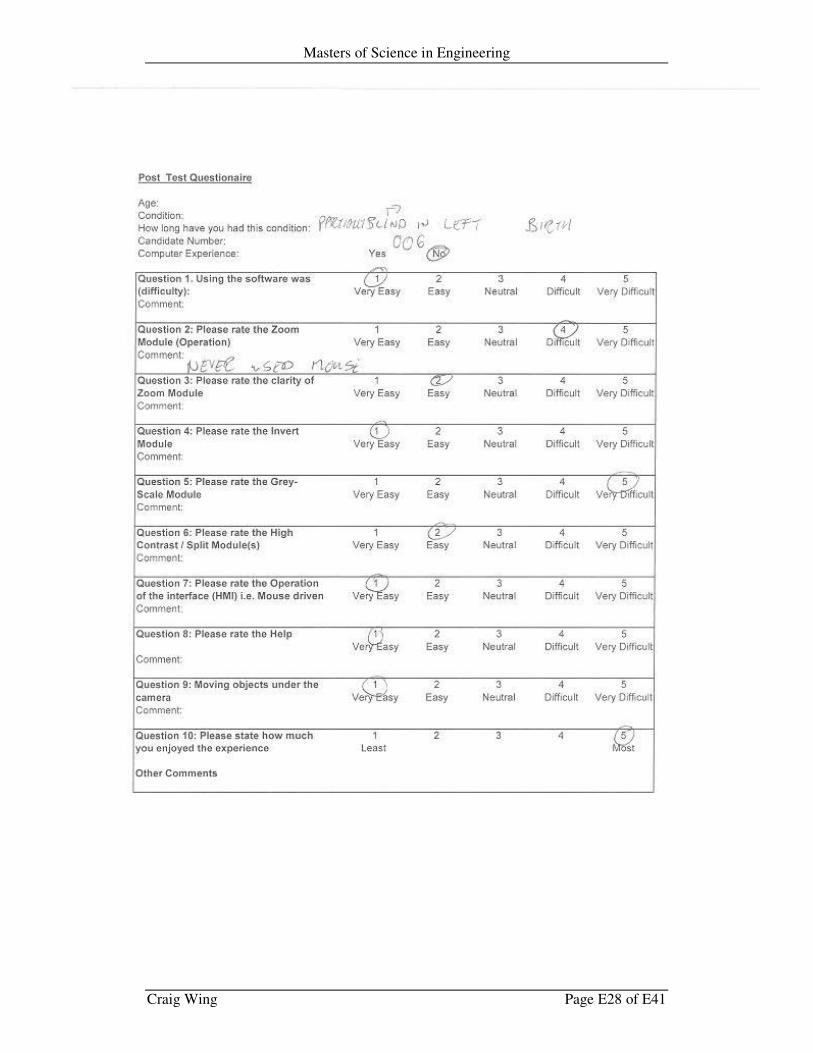
Masters of Science in Engineering
Craig Wing Page E28 of E41
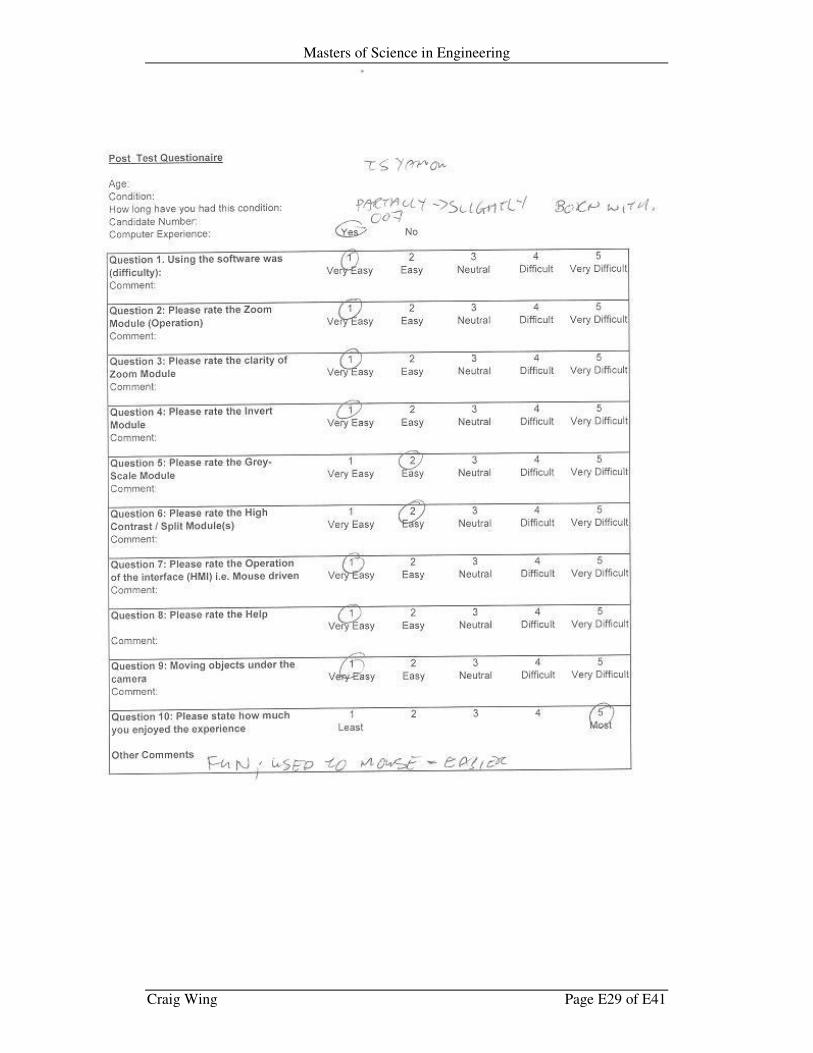
Masters of Science in Engineering
Craig Wing Page E29 of E41
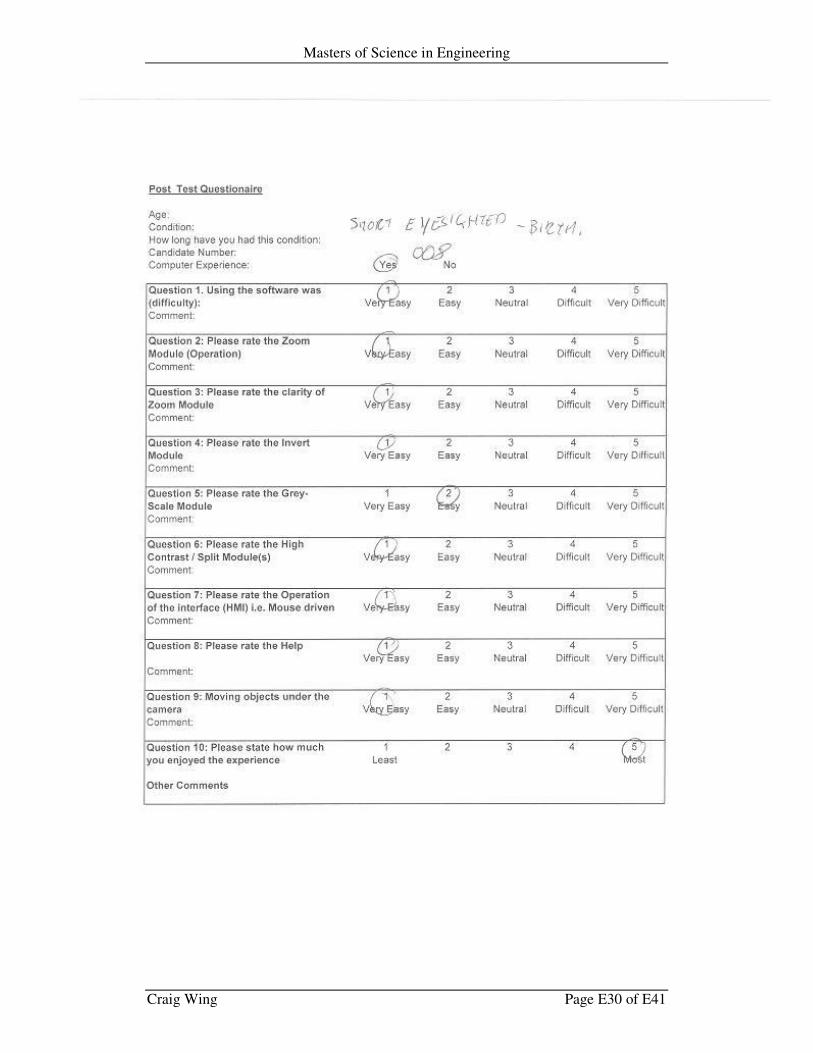
Masters of Science in Engineering
Craig Wing Page E30 of E41
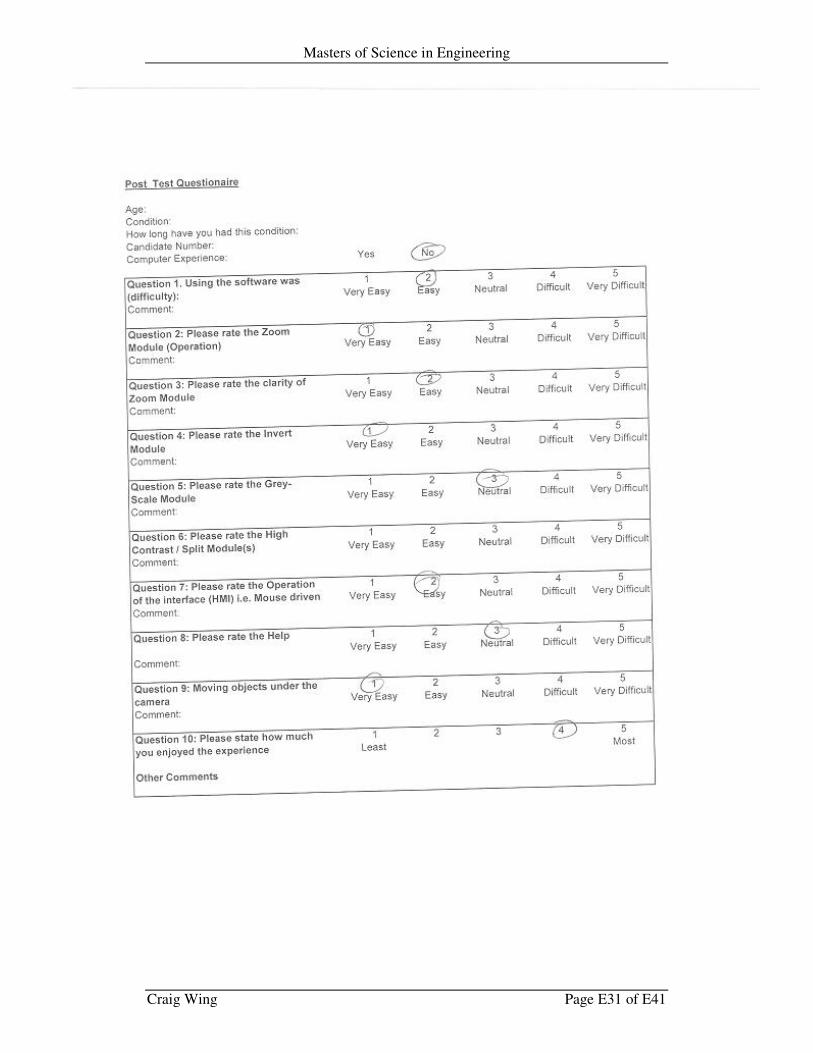
Masters of Science in Engineering
Craig Wing Page E31 of E41
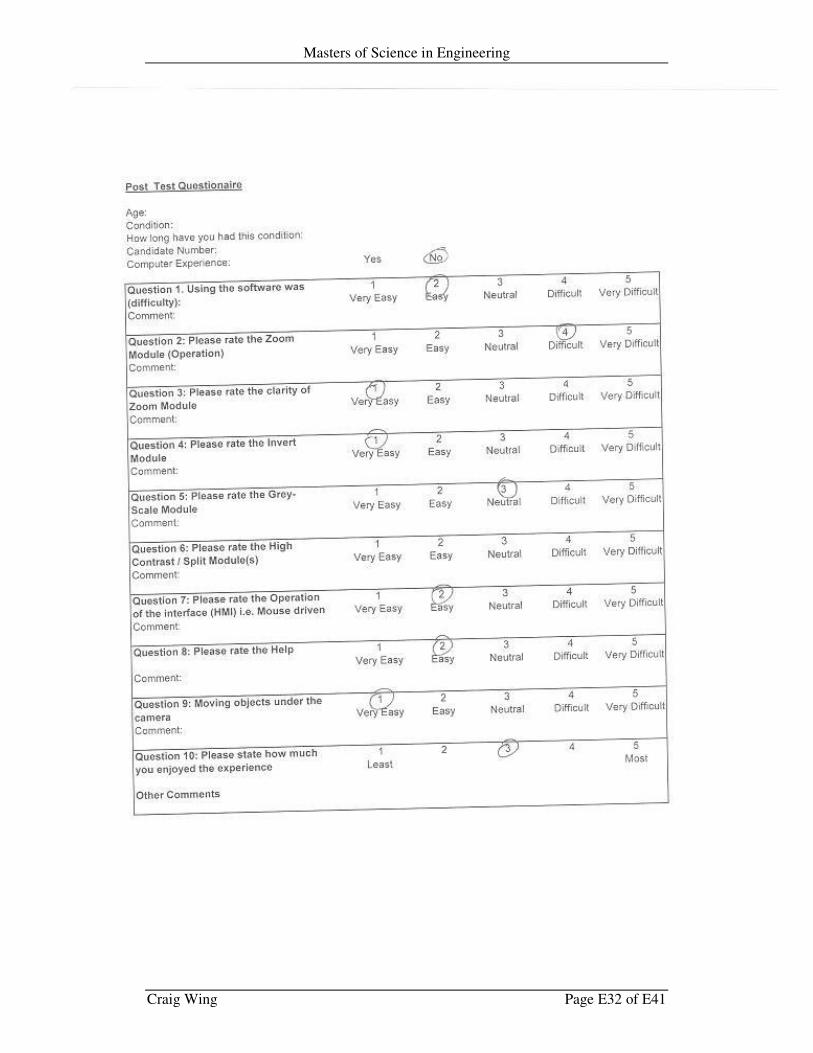
Masters of Science in Engineering
Craig Wing Page E32 of E41
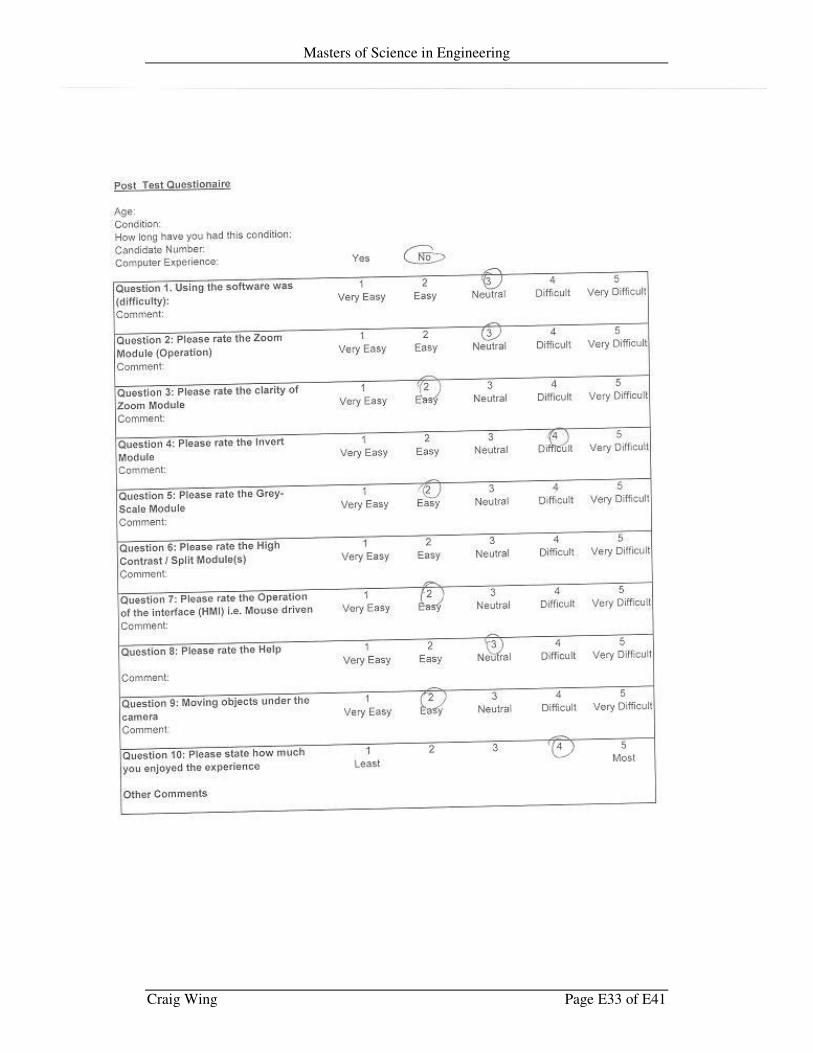
Masters of Science in Engineering
Craig Wing Page E33 of E41
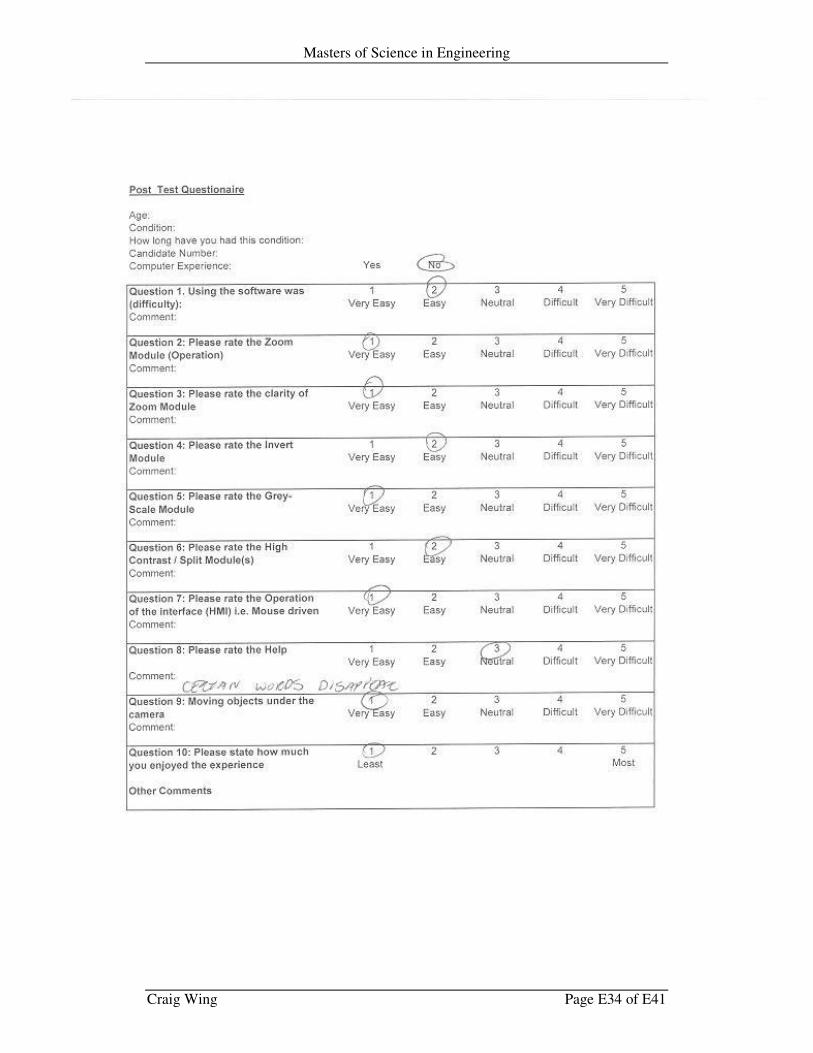
Masters of Science in Engineering
Craig Wing Page E34 of E41
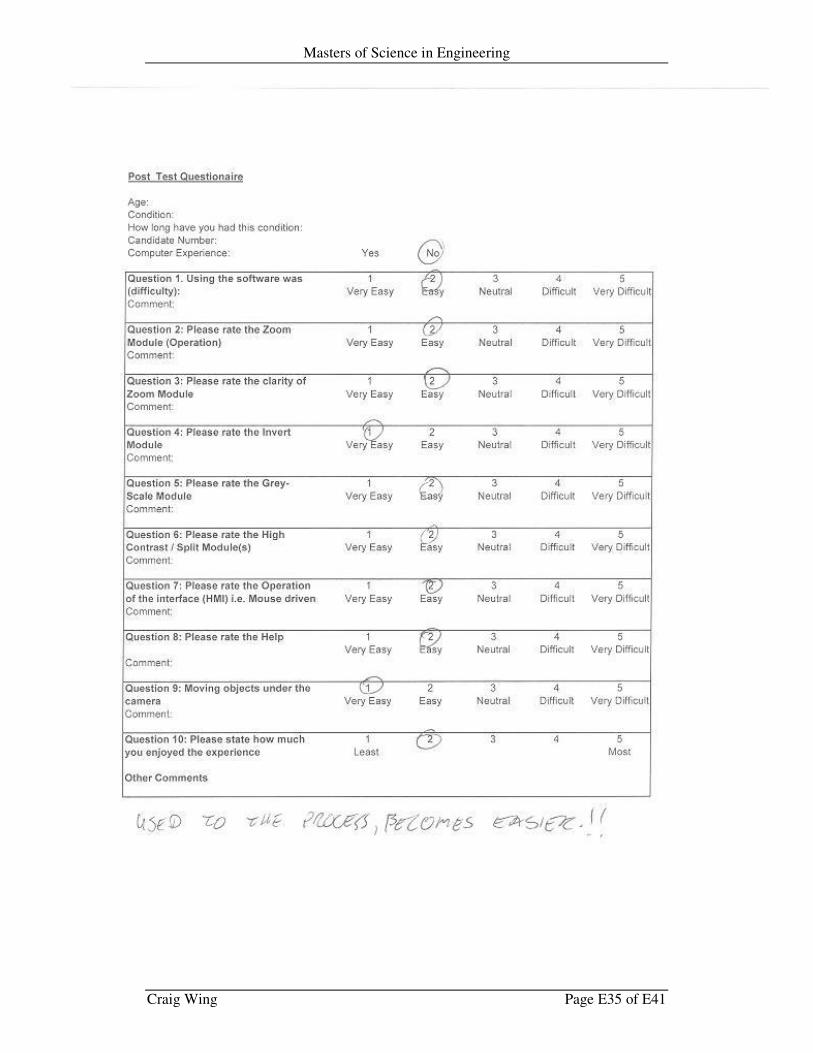
Masters of Science in Engineering
Craig Wing Page E35 of E41
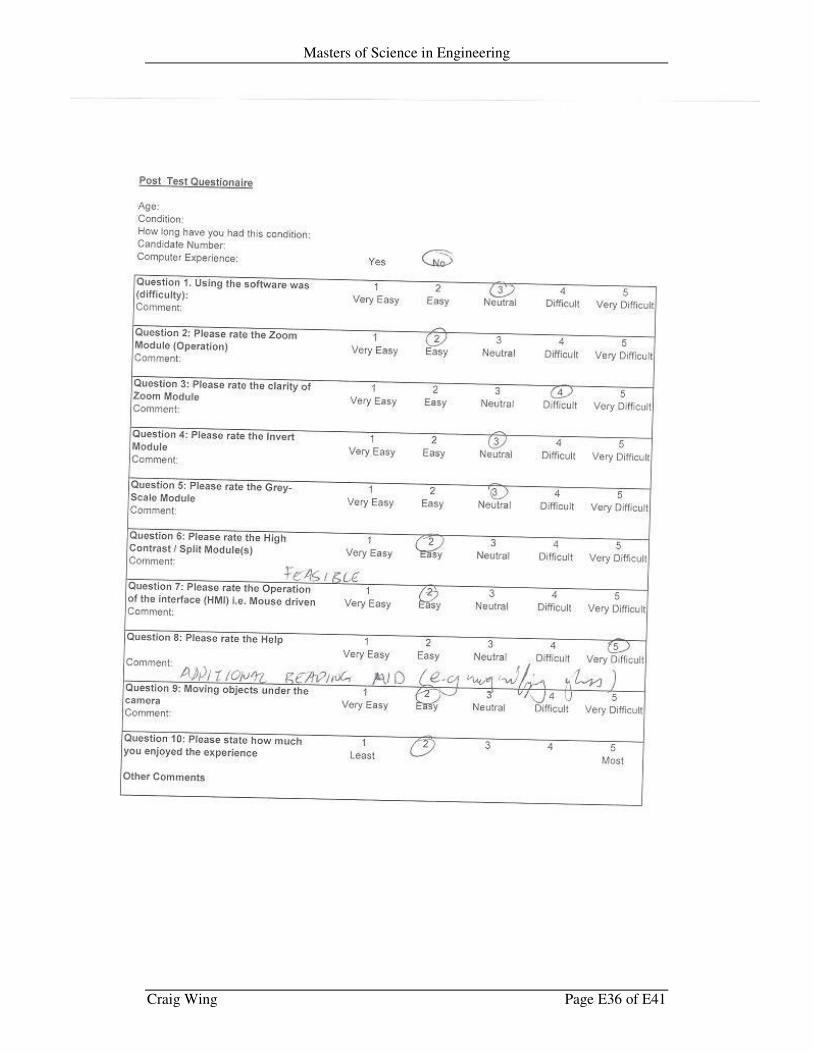
Masters of Science in Engineering
Craig Wing Page E36 of E41
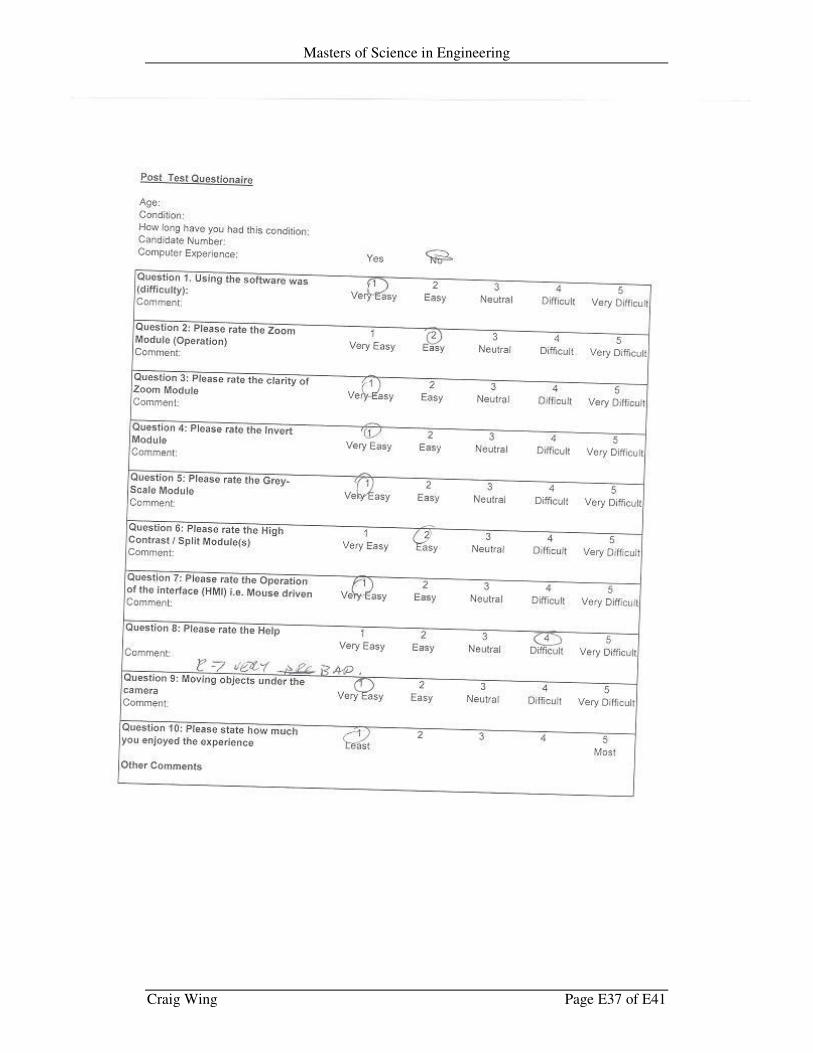
Masters of Science in Engineering
Craig Wing Page E37 of E41
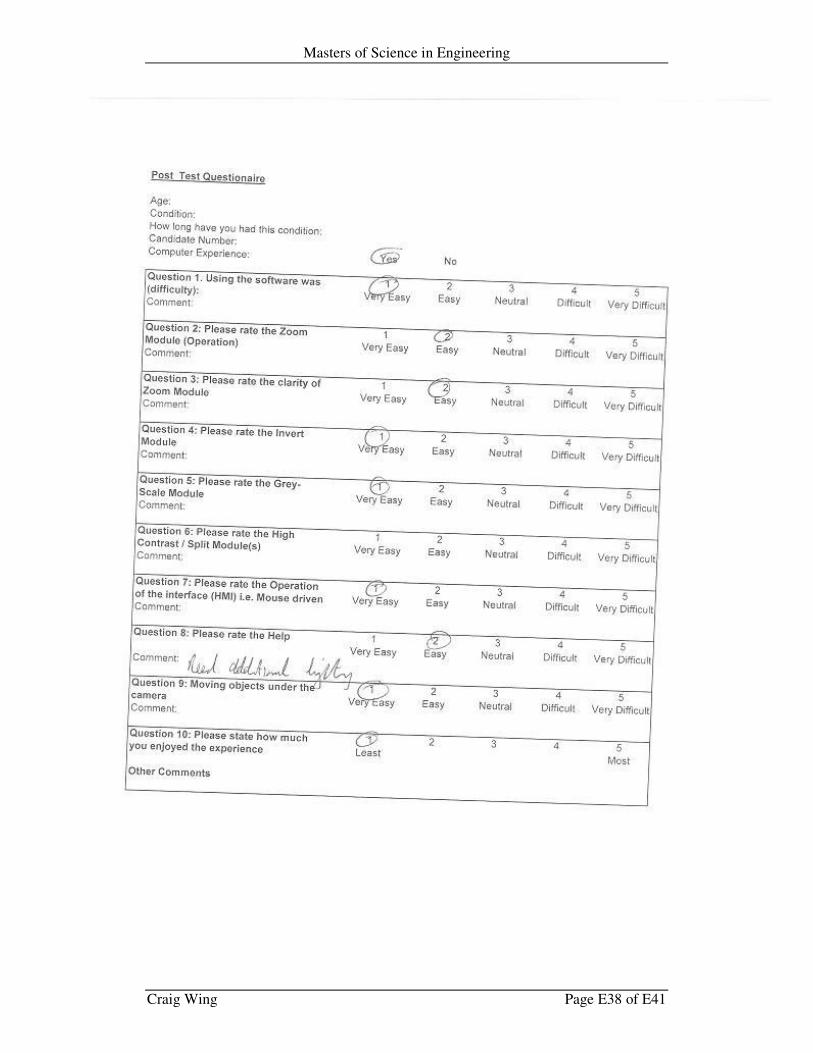
Masters of Science in Engineering
Craig Wing Page E38 of E41
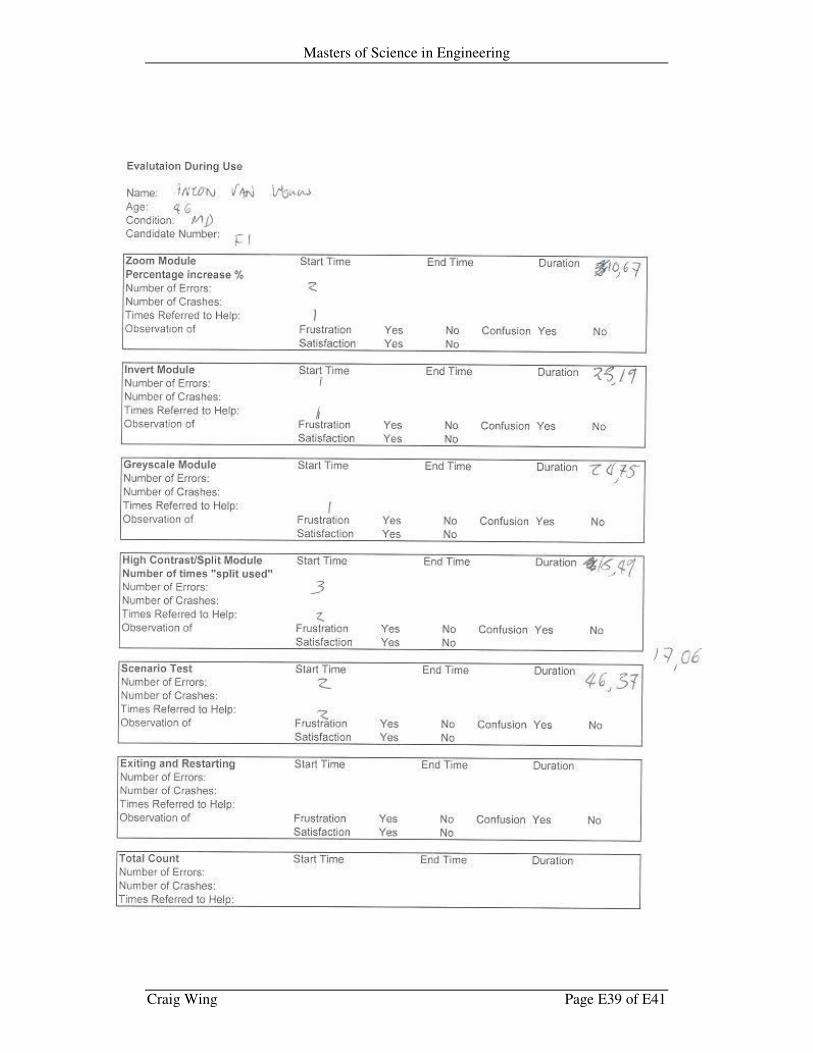
Masters of Science in Engineering
Craig Wing Page E39 of E41
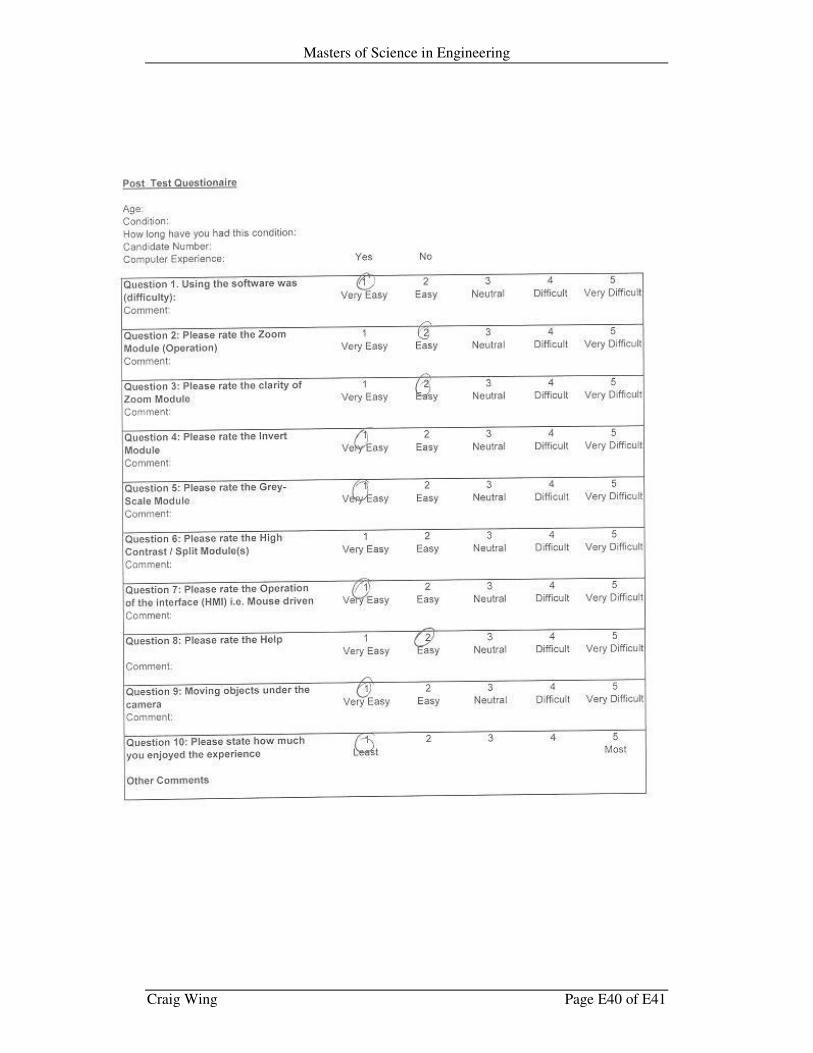
Masters of Science in Engineering
Craig Wing Page E40 of E41
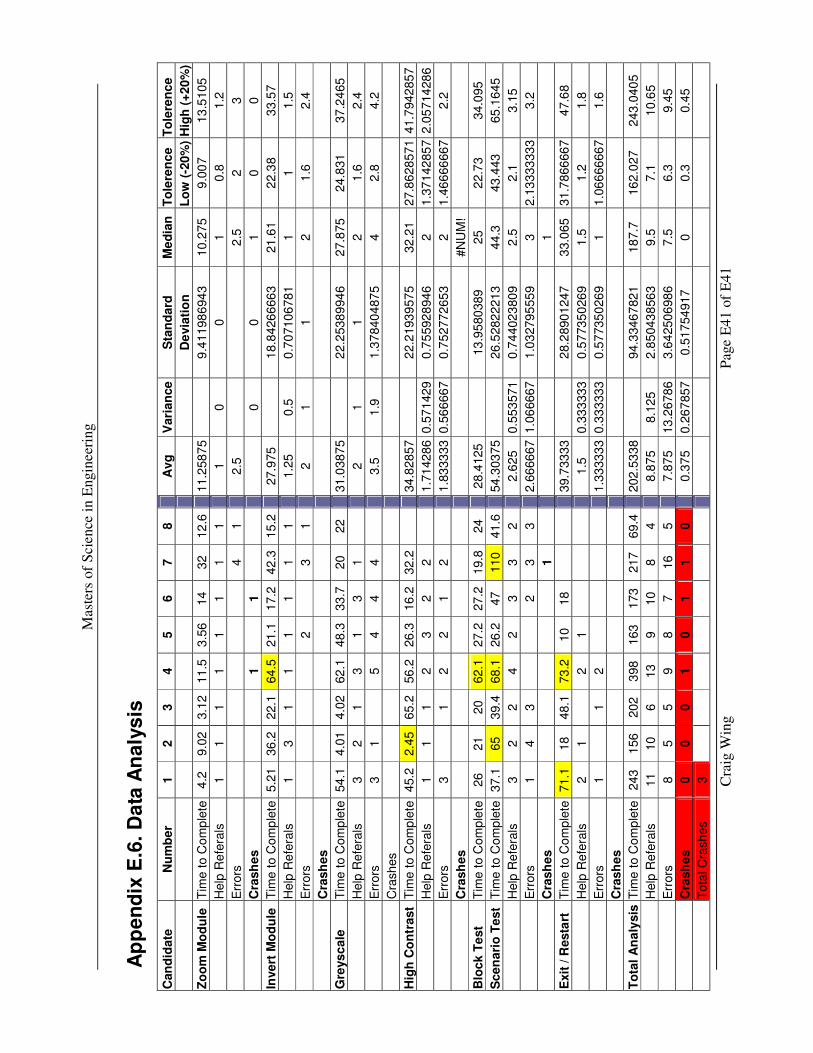
Mas
ters
of
Sci
ence
in E
ngin
eer
ing
Cra
ig W
ing
P
age E
41 o
f E
41
Ap
pe
nd
ix E
.6.
Da
ta A
na
lys
is
Can
did
ate
N
um
be
r 1
2
3
4
5
6
7
8
A
vg
V
ari
an
ce
Sta
nd
ard
M
ed
ian
T
ole
ren
ce
To
lere
nc
e
D
evia
tio
n
L
ow
(-2
0%
) H
igh
(+
20
%)
Zo
om
Mo
du
le
Tim
e t
o C
om
ple
te
4.2
9.0
2
3.1
2
11
.5
3.5
6
14
32
12
.6
11.2
58
75
9
.41
198
694
3
10.2
75
9.0
07
13
.51
05
H
elp
Re
fera
ls
1
1
1
1
1
1
1
1
1
0
0
1
0.8
1.2
E
rrors
4
1
2.5
2
.5
2
3
C
rash
es
1
1
0
0
1
0
0
Inve
rt M
od
ule
T
ime t
o C
om
ple
te
5.2
1
36
.2
22.1
64
.5
21.1
17
.2
42.3
15
.2
27.9
75
18.8
426
666
3
21
.61
2
2.3
8
33.5
7
H
elp
Re
fera
ls
1
3
1
1
1
1
1
1
1.2
5
0.5
0
.70
710
678
1
1
1
1.5
E
rrors
2
3
1
2
1
1
2
1.6
2.4
C
rash
es
Gre
ys
cale
T
ime t
o C
om
ple
te
54.1
4.0
1
4.0
2
62
.1
48.3
33
.7
20
22
31.0
38
75
2
2.2
538
994
6
27.8
75
24.8
31
37
.24
65
H
elp
Re
fera
ls
3
2
1
3
1
3
1
2
1
1
2
1.6
2.4
E
rrors
3
1
5
4
4
4
3.5
1
.9
1.3
7840
487
5
4
2.8
4.2
C
rash
es
Hig
h C
on
trast
Tim
e t
o C
om
ple
te
45.2
2.4
5
65.2
56
.2
26.3
16
.2
32.2
34.8
28
57
2
2.2
193
957
5
32
.21
27
.86
28
57
1 4
1.7
942
85
7
H
elp
Re
fera
ls
1
1
1
2
3
2
2
1.7
142
86 0.5
71
42
9
0.7
5592
894
6
2
1.3
71
42
85
7 2
.05
714
28
6
E
rrors
3
1
2
2
1
2
1.8
333
33 0.5
66
66
7
0.7
5277
265
3
2
1.4
66
66
66
7
2.2
C
rash
es
#N
UM
!
Blo
ck T
est
Tim
e t
o C
om
ple
te
26
21
20
62
.1
27.2
27
.2
19.8
24
28.4
125
13
.95
80
389
25
22.7
3
34.0
95
Sce
nari
o T
est
Tim
e t
o C
om
ple
te
37.1
65
39.4
68
.1
26.2
47
110
41
.6
54.3
03
75
2
6.5
282
221
3
44.3
43.4
43
65
.16
45
H
elp
Re
fera
ls
3
2
2
4
2
3
3
2
2.6
25
0.5
53
57
1
0.7
4402
380
9
2.5
2
.1
3.1
5
E
rrors
1
4
3
2
3
3
2.6
666
67 1.0
6666
7
1.0
3279
555
9
3
2.1
33
33
33
3
3.2
C
rash
es
1
1
Exit
/ R
esta
rt
Tim
e t
o C
om
ple
te
71.1
18
48.1
73
.2
10
18
39.7
33
33
2
8.2
890
124
7
33.0
65
31
.78
66
66
7
47.6
8
H
elp
Re
fera
ls
2
1
2
1
1.5
0.3
33
33
3
0.5
7735
026
9
1.5
1
.2
1.8
E
rrors
1
1
2
1.3
333
33 0.3
33
33
3
0.5
7735
026
9
1
1.0
66
66
66
7
1.6
C
rash
es
To
tal
An
aly
sis
Tim
e t
o C
om
ple
te
243
1
56
202
3
98
163
1
73
217
69
.4
202
.53
38
9
4.3
346
782
1
18
7.7
16
2.0
27
243.0
40
5
H
elp
Re
fera
ls
11
10
6
13
9
10
8
4
8.8
75
8.1
25
2
.85
043
856
3
9.5
7
.1
10.6
5
E
rrors
8
5
5
9
8
7
16
5
7.8
75
13
.26
78
6
3.6
4250
698
6
7.5
6
.3
9.4
5
C
rash
es
0
0
0
1
0
1
1
0
0.3
75
0.2
67
85
7
0.5
17
54
917
0
0.3
0.4
5
T
ota
l C
rash
es
3


![The Role of Usability on the Implementationteresarojano.net/system/files/articulos/The_Role_of_Usability_on_the... · [9] recognize the importance of assessing usability in educational](https://img.pdfslide.us/doc/110x75/602e584d2cec2737653c87ed/the-role-of-usability-on-the-implem-9-recognize-the-importance-of-assessing-usability.jpg)