Embed Size (px)
Citation preview
AssessingAssessing Uncertainty Uncertainty in FVS Projections in FVS Projections Using a Bootstrap Using a Bootstrap
Resampling MethodResampling Methodby
Tommy F. Gregg
Region 6 NR/FID
and
Susan Stevens Hummel
PNW Research Station
ObjectiveObjective
• Develop process for assessing Develop process for assessing uncertainty in model projections.uncertainty in model projections.
• Create a program compatible with Create a program compatible with SUPPOSE and FVS to implement the SUPPOSE and FVS to implement the process.process.

Criteria for the ProcessCriteria for the Process
•Must be statistically valid.Must be statistically valid.
•Must be feasible given current Must be feasible given current technology.technology.
“…The oldest and simplest device for misleading folks is the barefaced lie. A method that is nearly as effective and far more subtle is to report a sample estimate without any indication of its reliability…”
(Frank Freese 1967)
Why is this important?Why is this important?
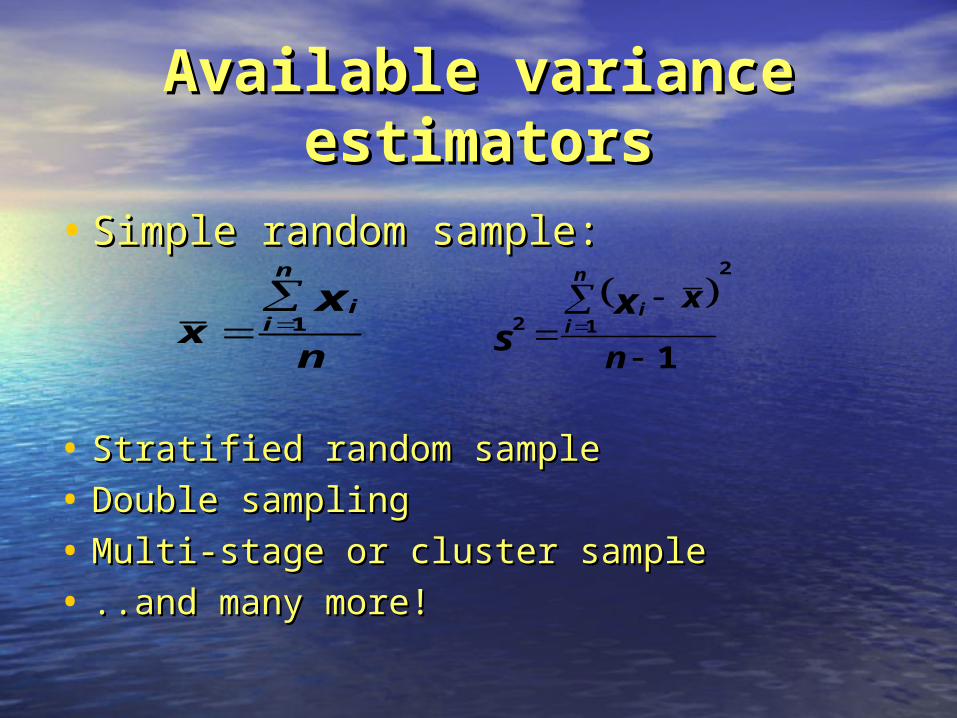
Available variance Available variance estimatorsestimators
• Simple random sample:Simple random sample:
• Stratified random sampleStratified random sample
• Double samplingDouble sampling
• Multi-stage or cluster sampleMulti-stage or cluster sample
• ..and many more!..and many more!
2
12
1
n
xn
iix
snx
n
iix
1
Problem with available Problem with available variance estimatorsvariance estimators
• They do not apply to model They do not apply to model projections over time.projections over time.
• They can not be used for making They can not be used for making inferences about model complex inferences about model complex results. results.
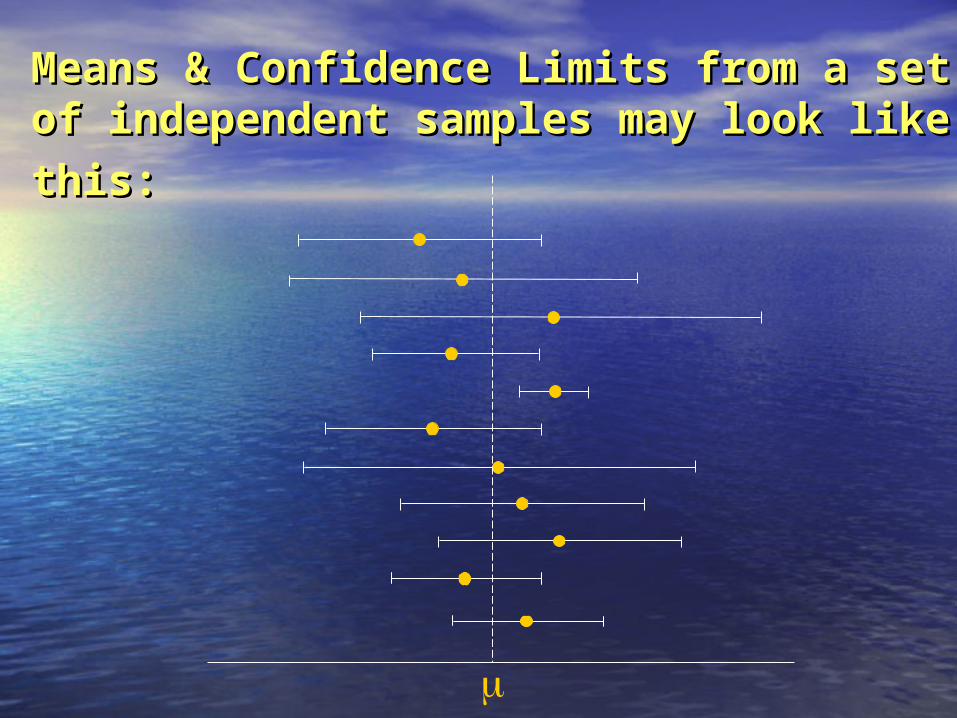
Means & Confidence Limits from a set Means & Confidence Limits from a set of independent samples may look like of independent samples may look like
this:this:
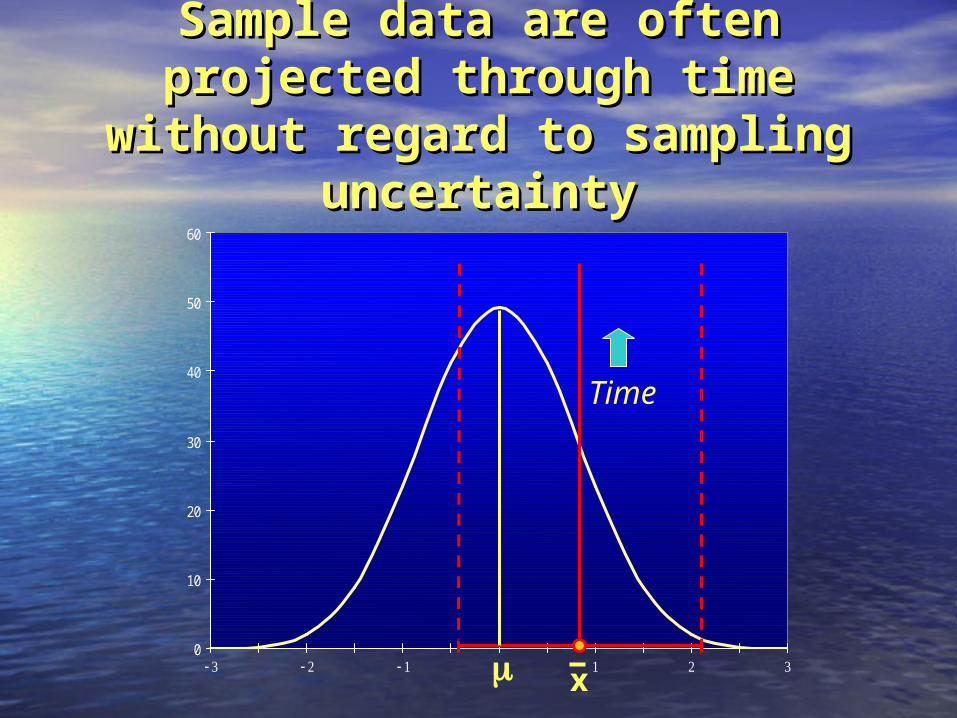
Sample data are often Sample data are often projected through time projected through time
without regard to sampling without regard to sampling uncertaintyuncertainty
0
10
20
30
40
50
60
x
Time
Bootstrap Resampling Bootstrap Resampling Method Method
• Developed in the 1980s (Efron), based on Developed in the 1980s (Efron), based on classical statistical theory from the 1930s.classical statistical theory from the 1930s.
• Computer intensive method for assessing Computer intensive method for assessing uncertainty.uncertainty.
• Used for complex problems in many Used for complex problems in many fields.fields.
Why Bootstrap Model Why Bootstrap Model Projections?Projections?
•Bootstrapping allows us to substitute computational power for classical statistical analysis.
•Bootstrapping may be the only may be the only technical method for assessing technical method for assessing uncertainty in model projections.uncertainty in model projections.
•Bootstrapping is doable. is doable.

Stand with 31 stand-exam inventory plotsStand with 31 stand-exam inventory plots
What is the Bootstrap What is the Bootstrap Resampling Method?Resampling Method?
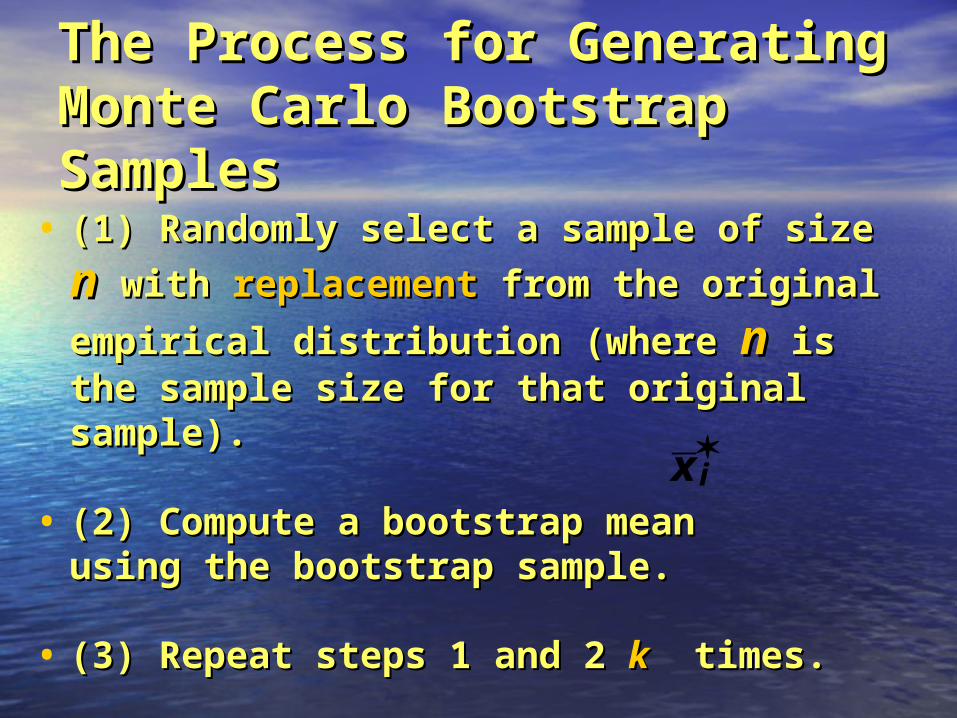
The Process for Generating The Process for Generating Monte Carlo BootstrapMonte Carlo Bootstrap SamplesSamples
• (1) Randomly select a sample of size (1) Randomly select a sample of size nn withwith replacement replacement from the original from the original
empirical distribution (where empirical distribution (where nn is the is the sample size for that original sample).sample size for that original sample).
• (2) Compute a bootstrap mean (2) Compute a bootstrap mean using the bootstrap sample.using the bootstrap sample.
• (3) Repeat steps 1 and 2 (3) Repeat steps 1 and 2 kk times. times.
x i
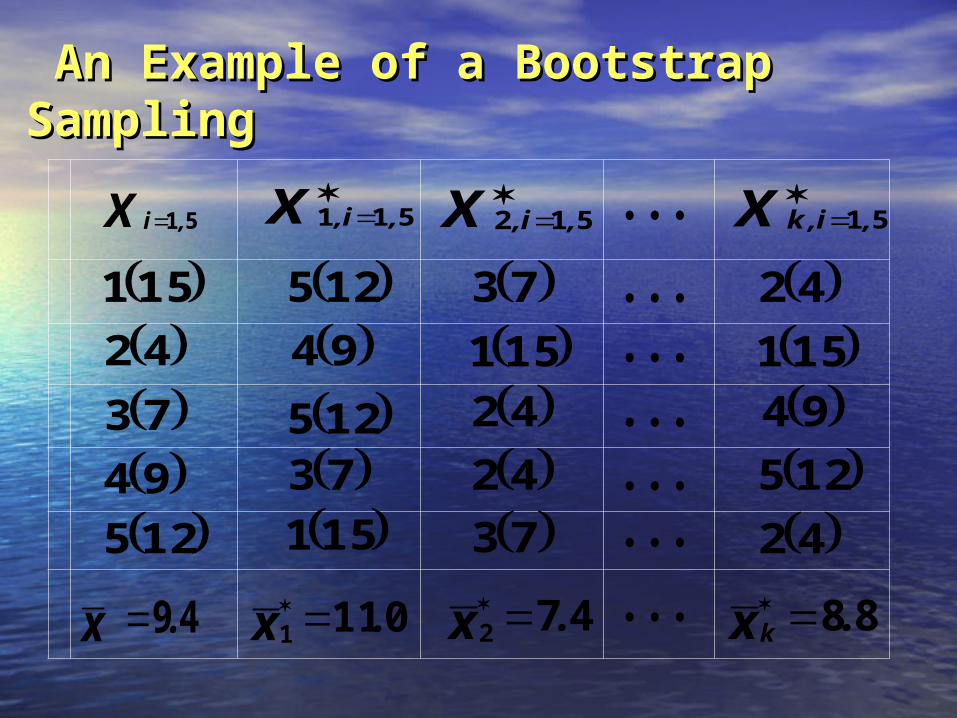
An Example of a Bootstrap An Example of a Bootstrap SamplingSampling
49.x
X ,i 51 X ,i,
511 X ,i,k
51X ,i,
512
0111 .x 472 .x 88.xk
151
42 73 94 125
125
125 125
151
151 151
42 42
42
42 73
73
73
94 94
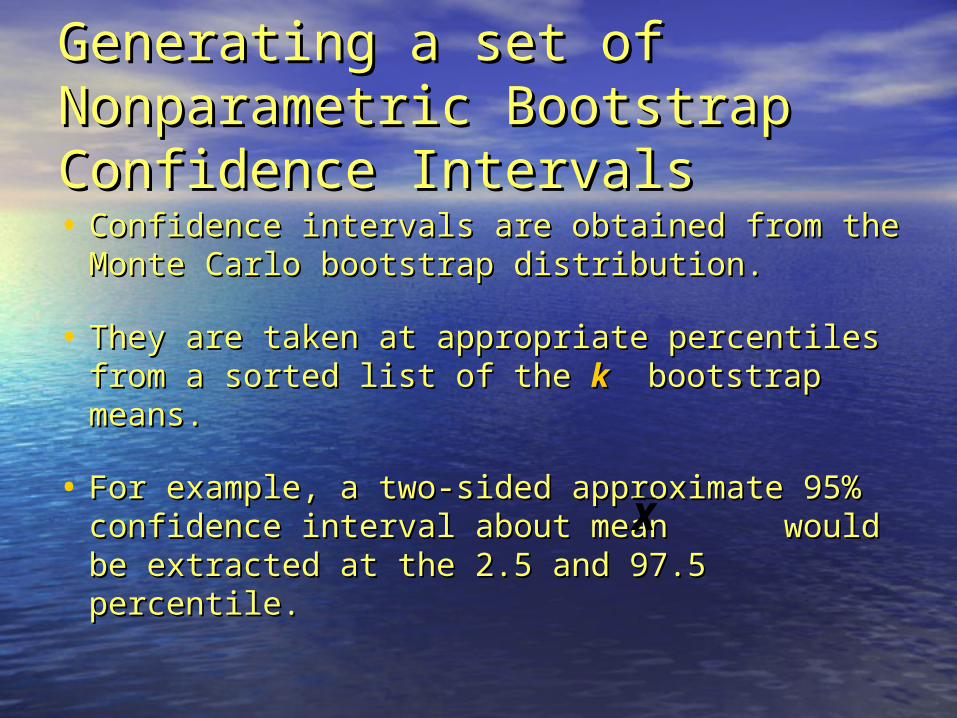
Generating a set of Generating a set of Nonparametric Bootstrap Nonparametric Bootstrap Confidence IntervalsConfidence Intervals• Confidence intervals are obtained from the Confidence intervals are obtained from the
Monte Carlo bootstrap distribution.Monte Carlo bootstrap distribution.
• They are taken at appropriate percentiles They are taken at appropriate percentiles from a sorted list of the from a sorted list of the kk bootstrap means. bootstrap means.
• For example, a two-sided approximate 95% For example, a two-sided approximate 95% confidence interval about mean would be confidence interval about mean would be extracted at the 2.5 and 97.5 percentile. extracted at the 2.5 and 97.5 percentile.
x

LIST OF 200 Sorted BootStrap Means:LIST OF 200 Sorted BootStrap Means: ( 0) ( 1) ( 2) ( 3) ( 4) ( 5) ( 6) ( 7) ( 8) ( 0) ( 1) ( 2) ( 3) ( 4) ( 5) ( 6) ( 7) ( 8)
( 9) ( 9)
0 : - 1207.0 1204.0 1191.0 1181.0 0 : - 1207.0 1204.0 1191.0 1181.0 1178.01178.0 1173.0 1159.0 1117.0 1173.0 1159.0 1117.0 1116.01116.0
10 : 1082.0 1079.0 1072.0 1071.0 1067.0 1066.0 1065.0 1056.0 1051.0 10 : 1082.0 1079.0 1072.0 1071.0 1067.0 1066.0 1065.0 1056.0 1051.0 1047.01047.0
20 : 1042.0 1040.0 1032.0 1031.0 1031.0 1030.0 1018.0 1017.0 1013.0 20 : 1042.0 1040.0 1032.0 1031.0 1031.0 1030.0 1018.0 1017.0 1013.0 1010.01010.0
30 : 1010.0 1008.0 1004.0 1003.0 995.0 994.0 992.0 985.0 984.0 30 : 1010.0 1008.0 1004.0 1003.0 995.0 994.0 992.0 985.0 984.0 983.0983.0
40 : 982.0 981.0 981.0 975.0 975.0 969.0 968.0 967.0 967.0 40 : 982.0 981.0 981.0 975.0 975.0 969.0 968.0 967.0 967.0 965.0 965.0
50 : 962.0 962.0 960.0 960.0 956.0 955.0 953.0 951.0 950.0 50 : 962.0 962.0 960.0 960.0 956.0 955.0 953.0 951.0 950.0 949.0949.0
60 : 948.0 945.0 943.0 942.0 942.0 941.0 936.0 933.0 928.0 60 : 948.0 945.0 943.0 942.0 942.0 941.0 936.0 933.0 928.0 927.0927.0
70 : 926.0 925.0 924.0 924.0 924.0 923.0 922.0 919.0 919.0 70 : 926.0 925.0 924.0 924.0 924.0 923.0 922.0 919.0 919.0 919.0919.0
80 : 917.0 916.0 913.0 913.0 911.0 905.0 899.0 898.0 898.0 80 : 917.0 916.0 913.0 913.0 911.0 905.0 899.0 898.0 898.0 896.0896.0
90 : 894.0 892.0 892.0 892.0 891.0 890.0 889.0 889.0 887.0 90 : 894.0 892.0 892.0 892.0 891.0 890.0 889.0 889.0 887.0 885.0885.0
100 : 885.0 885.0 884.0 884.0 883.0 880.0 879.0 879.0 878.0 100 : 885.0 885.0 884.0 884.0 883.0 880.0 879.0 879.0 878.0 878.0878.0
110 : 877.0 876.0 876.0 873.0 872.0 872.0 870.0 867.0 865.0 110 : 877.0 876.0 876.0 873.0 872.0 872.0 870.0 867.0 865.0 864.0864.0
120 : 863.0 861.0 858.0 858.0 857.0 855.0 854.0 853.0 852.0 120 : 863.0 861.0 858.0 858.0 857.0 855.0 854.0 853.0 852.0 852.0852.0
130 : 852.0 851.0 847.0 846.0 846.0 845.0 844.0 841.0 840.0 130 : 852.0 851.0 847.0 846.0 846.0 845.0 844.0 841.0 840.0 840.0840.0
140 : 840.0 837.0 835.0 834.0 833.0 830.0 830.0 827.0 823.0 140 : 840.0 837.0 835.0 834.0 833.0 830.0 830.0 827.0 823.0 823.0823.0
150 : 823.0 818.0 817.0 813.0 810.0 809.0 806.0 805.0 805.0 150 : 823.0 818.0 817.0 813.0 810.0 809.0 806.0 805.0 805.0 805.0805.0
160 : 803.0 801.0 800.0 799.0 796.0 795.0 789.0 781.0 778.0 160 : 803.0 801.0 800.0 799.0 796.0 795.0 789.0 781.0 778.0 777.0777.0
170 : 777.0 770.0 769.0 767.0 765.0 761.0 757.0 755.0 749.0 170 : 777.0 770.0 769.0 767.0 765.0 761.0 757.0 755.0 749.0 749.0749.0
180 : 748.0 747.0 747.0 745.0 741.0 739.0 734.0 721.0 720.0 180 : 748.0 747.0 747.0 745.0 741.0 739.0 734.0 721.0 720.0 713.0713.0
190 : 709.0 709.0 703.0 702.0 702.0 190 : 709.0 709.0 703.0 702.0 702.0 688.0688.0 680.0 670.0 654.0 680.0 670.0 654.0 623.0623.0
200 : 588.0200 : 588.0

Program Description Program Description ( FVS2Boot.exe )( FVS2Boot.exe )
• Builds bootstrap files from existing Builds bootstrap files from existing FVS input treelist files.FVS input treelist files.
• Interfaces seamlessly with Interfaces seamlessly with SUPPOSE.SUPPOSE.
• Processes FVS output:Processes FVS output:– .sum files.sum files– .out files.out files
• Displays results.Displays results.
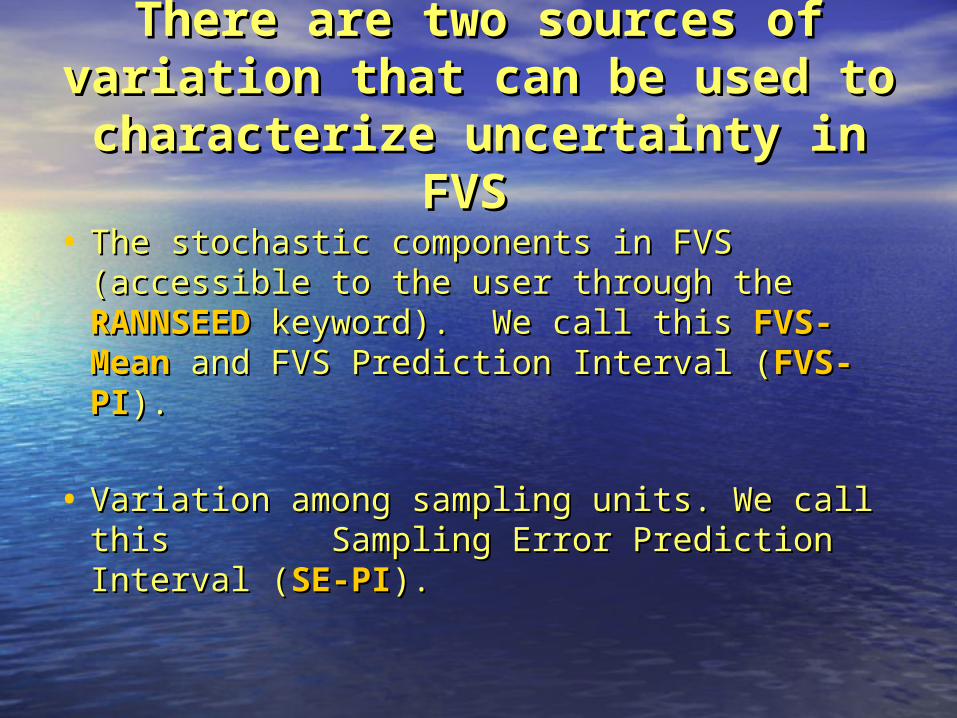
There are two sources of There are two sources of variation that can be used to variation that can be used to characterize uncertainty in characterize uncertainty in
FVS FVS • The stochastic components in FVS The stochastic components in FVS
(accessible to the user through the (accessible to the user through the RANNSEEDRANNSEED keyword). We call this keyword). We call this FVS-FVS-MeanMean and FVS Prediction Interval ( and FVS Prediction Interval (FVS-PIFVS-PI).).
• Variation among sampling units. We call Variation among sampling units. We call this Sampling Error Prediction Interval this Sampling Error Prediction Interval ((SE-PISE-PI).).

FVSBoot Main MenuFVSBoot Main Menu

Open FVS Files and Open FVS Files and DirectoriesDirectories
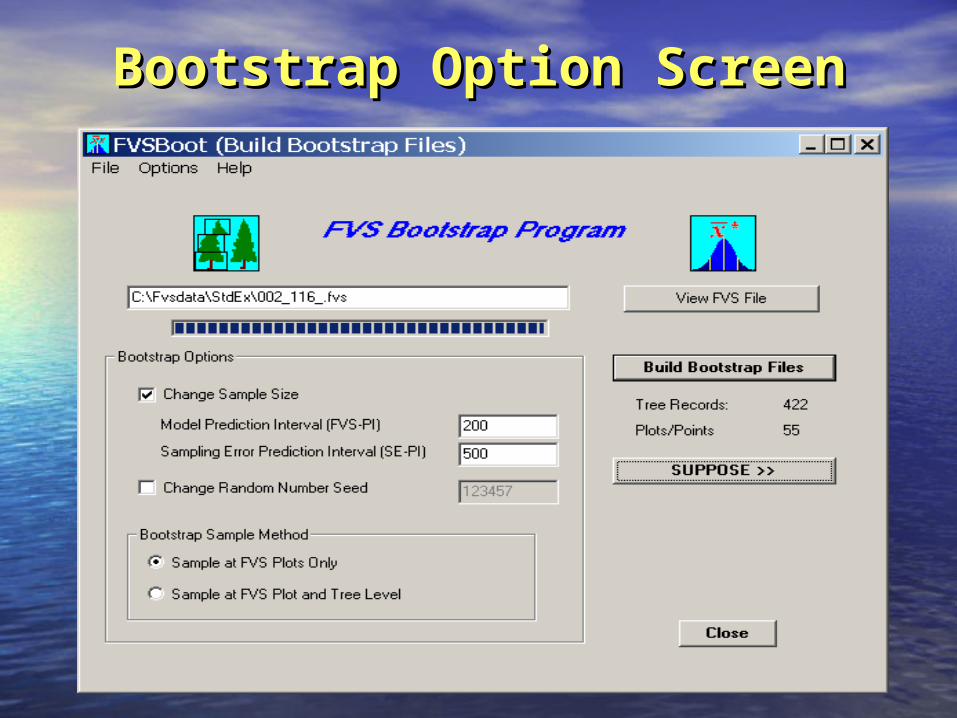
Bootstrap Option ScreenBootstrap Option Screen
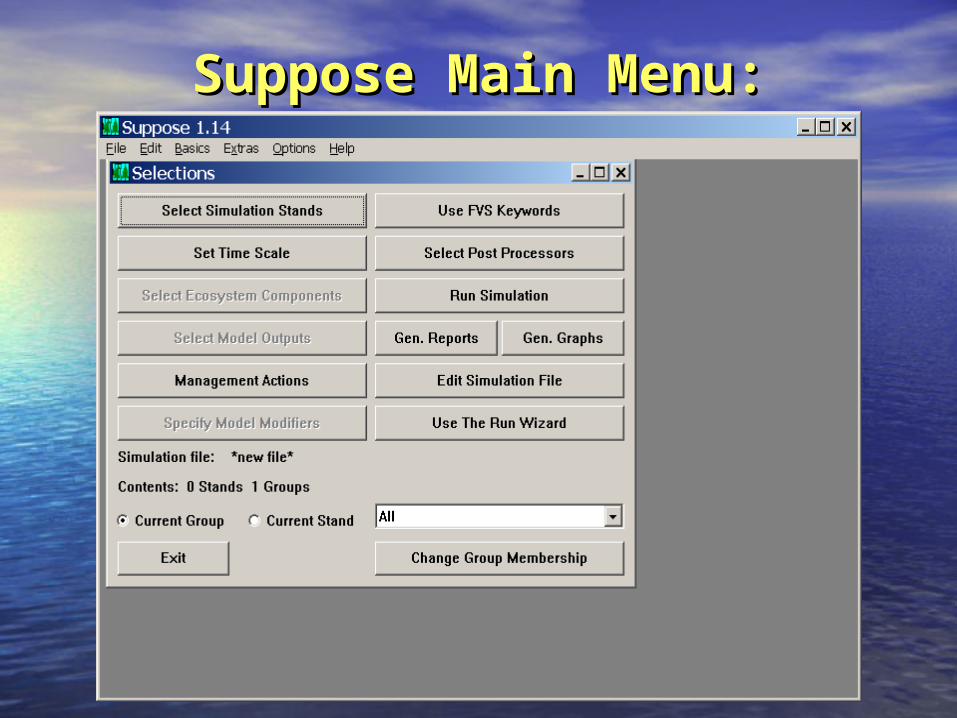
Suppose Main Menu:Suppose Main Menu:
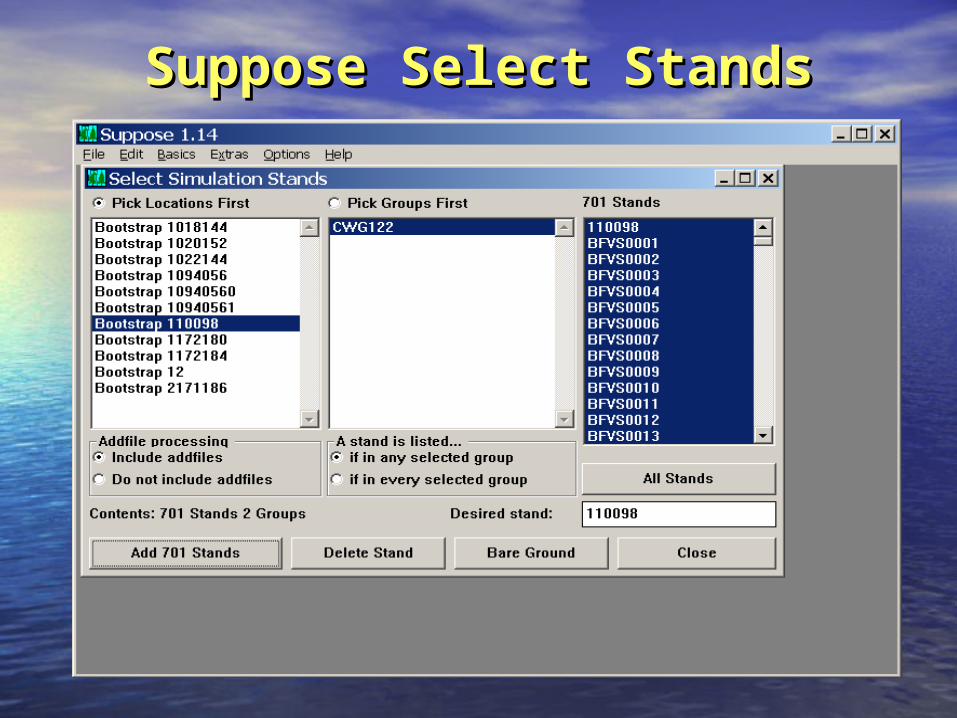
Suppose Select StandsSuppose Select Stands

Run FVS on all Bootstrap Run FVS on all Bootstrap SamplesSamples

Select FVS Variables for Select FVS Variables for DisplayDisplay

FVS Bootstrap Output FVS Bootstrap Output Screen:Screen:
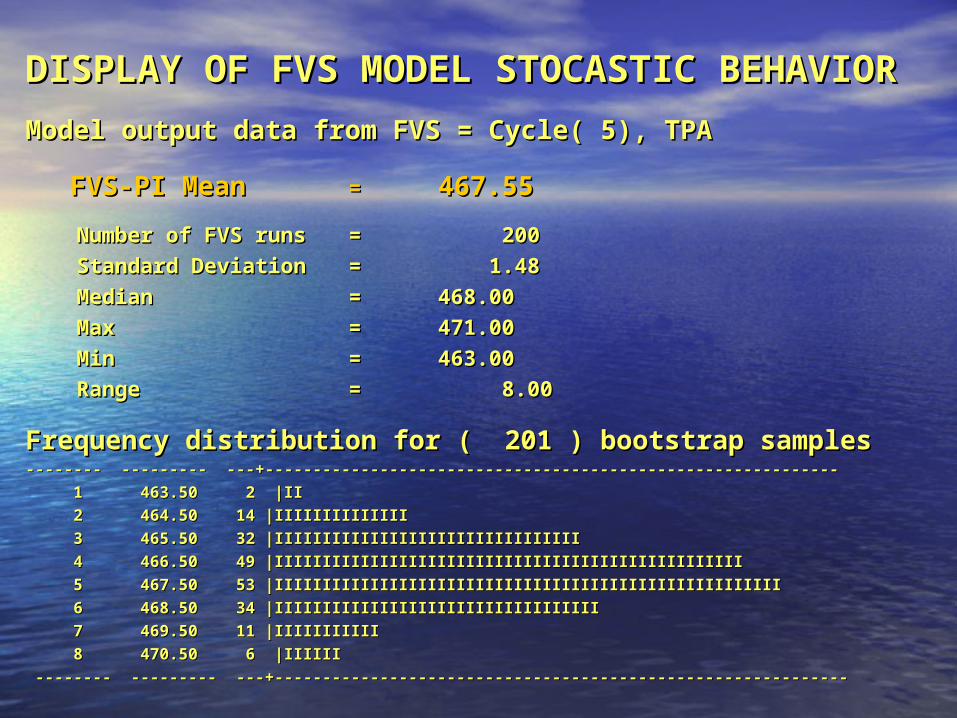
DISPLAY OF FVS MODEL STOCASTIC DISPLAY OF FVS MODEL STOCASTIC BEHAVIORBEHAVIOR
Model output data from FVS = Cycle( 5), TPAModel output data from FVS = Cycle( 5), TPA
FVS-PI MeanFVS-PI Mean = = 467.55467.55
Number of FVS runs Number of FVS runs = 200= 200
Standard Deviation Standard Deviation = 1.48= 1.48
Median Median = 468.00= 468.00
MaxMax = 471.00= 471.00
MinMin = 463.00= 463.00
RangeRange = 8.00= 8.00
Frequency distribution for ( 201 ) bootstrap samples Frequency distribution for ( 201 ) bootstrap samples -------- --------- ---+-------------------------------------------------------------------- --------- ---+------------------------------------------------------------
1 463.50 2 |II1 463.50 2 |II
2 464.50 14 |IIIIIIIIIIIIII2 464.50 14 |IIIIIIIIIIIIII
3 465.50 32 |IIIIIIIIIIIIIIIIIIIIIIIIIIIIIIII3 465.50 32 |IIIIIIIIIIIIIIIIIIIIIIIIIIIIIIII
4 466.50 49 |IIIIIIIIIIIIIIIIIIIIIIIIIIIIIIIIIIIIIIIIIIIIIIIII4 466.50 49 |IIIIIIIIIIIIIIIIIIIIIIIIIIIIIIIIIIIIIIIIIIIIIIIII
5 467.50 53 |IIIIIIIIIIIIIIIIIIIIIIIIIIIIIIIIIIIIIIIIIIIIIIIIIIIII5 467.50 53 |IIIIIIIIIIIIIIIIIIIIIIIIIIIIIIIIIIIIIIIIIIIIIIIIIIIII
6 468.50 34 |IIIIIIIIIIIIIIIIIIIIIIIIIIIIIIIIII6 468.50 34 |IIIIIIIIIIIIIIIIIIIIIIIIIIIIIIIIII
7 469.50 11 |IIIIIIIIIII7 469.50 11 |IIIIIIIIIII
8 470.50 6 |IIIIII8 470.50 6 |IIIIII
-------- --------- ---+-------------------------------------------------------------------- --------- ---+------------------------------------------------------------

FVS PREDICTION INTERVAL FVS-PI FVS PREDICTION INTERVAL FVS-PI CAUSED BY SAMPLE VARIATIONCAUSED BY SAMPLE VARIATION
Data from FVS Variable Data from FVS Variable = Cycle( 5), TPA= Cycle( 5), TPA
FVS-PI MeanFVS-PI Mean = 467.55= 467.55
Sampling Error PI:Sampling Error PI:
Number of samples Number of samples = 500 = 500
Bootstrap Mean Bootstrap Mean = 464.53= 464.53
Standard Deviation Standard Deviation = 52.86= 52.86
Bootstrap Median Bootstrap Median = 461.00= 461.00
Max outcome Max outcome = 657.00= 657.00
Min outcome Min outcome = 318.00= 318.00
Range of outcomes Range of outcomes = 339.00= 339.00
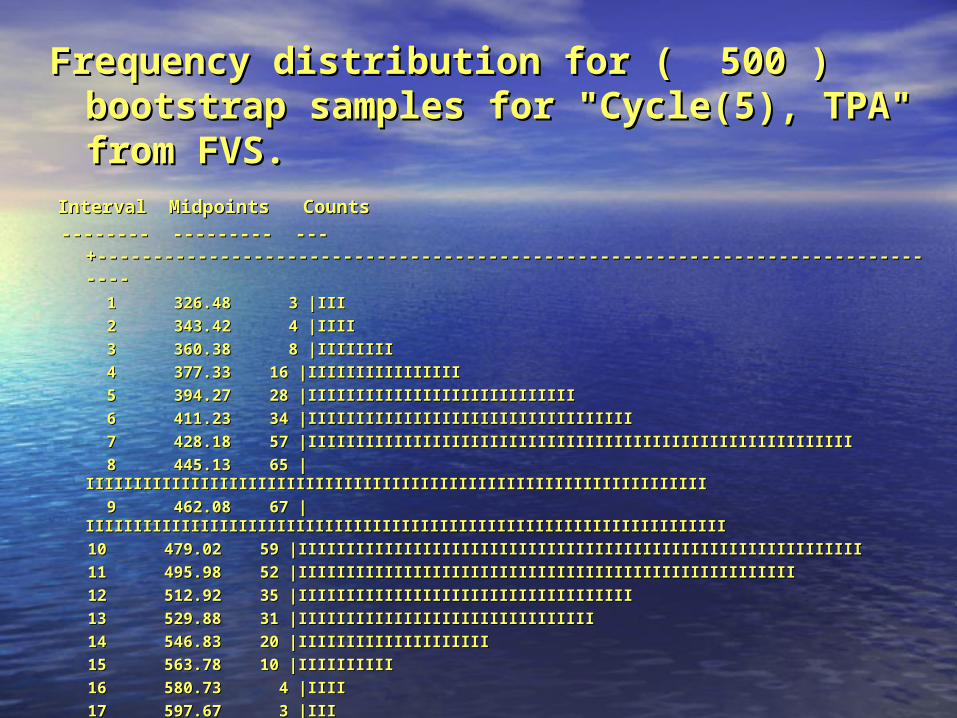
Frequency distribution for ( 500 ) Frequency distribution for ( 500 ) bootstrap samples for "Cycle(5), TPA" bootstrap samples for "Cycle(5), TPA" from FVS.from FVS.
Interval Midpoints Counts Interval Midpoints Counts
-------- --------- ---+-------------------------------------------------------------------------------------- --------- ---+------------------------------------------------------------------------------ 1 326.48 3 |III1 326.48 3 |III
2 343.42 4 |IIII2 343.42 4 |IIII
3 360.38 8 |IIIIIIII3 360.38 8 |IIIIIIII
4 377.33 16 |IIIIIIIIIIIIIIII4 377.33 16 |IIIIIIIIIIIIIIII
5 394.27 28 |IIIIIIIIIIIIIIIIIIIIIIIIIIII5 394.27 28 |IIIIIIIIIIIIIIIIIIIIIIIIIIII
6 411.23 34 |IIIIIIIIIIIIIIIIIIIIIIIIIIIIIIIIII6 411.23 34 |IIIIIIIIIIIIIIIIIIIIIIIIIIIIIIIIII
7 428.18 57 |IIIIIIIIIIIIIIIIIIIIIIIIIIIIIIIIIIIIIIIIIIIIIIIIIIIIIIIII7 428.18 57 |IIIIIIIIIIIIIIIIIIIIIIIIIIIIIIIIIIIIIIIIIIIIIIIIIIIIIIIII
8 445.13 65 |IIIIIIIIIIIIIIIIIIIIIIIIIIIIIIIIIIIIIIIIIIIIIIIIIIIIIIIIIIIIIIIII8 445.13 65 |IIIIIIIIIIIIIIIIIIIIIIIIIIIIIIIIIIIIIIIIIIIIIIIIIIIIIIIIIIIIIIIII
9 462.08 67 |IIIIIIIIIIIIIIIIIIIIIIIIIIIIIIIIIIIIIIIIIIIIIIIIIIIIIIIIIIIIIIIIIII9 462.08 67 |IIIIIIIIIIIIIIIIIIIIIIIIIIIIIIIIIIIIIIIIIIIIIIIIIIIIIIIIIIIIIIIIIII
10 479.02 59 |IIIIIIIIIIIIIIIIIIIIIIIIIIIIIIIIIIIIIIIIIIIIIIIIIIIIIIIIIII10 479.02 59 |IIIIIIIIIIIIIIIIIIIIIIIIIIIIIIIIIIIIIIIIIIIIIIIIIIIIIIIIIII
11 495.98 52 |IIIIIIIIIIIIIIIIIIIIIIIIIIIIIIIIIIIIIIIIIIIIIIIIIIII11 495.98 52 |IIIIIIIIIIIIIIIIIIIIIIIIIIIIIIIIIIIIIIIIIIIIIIIIIIII
12 512.92 35 |IIIIIIIIIIIIIIIIIIIIIIIIIIIIIIIIIII 12 512.92 35 |IIIIIIIIIIIIIIIIIIIIIIIIIIIIIIIIIII
13 529.88 31 |IIIIIIIIIIIIIIIIIIIIIIIIIIIIIII13 529.88 31 |IIIIIIIIIIIIIIIIIIIIIIIIIIIIIII
14 546.83 20 |IIIIIIIIIIIIIIIIIIII14 546.83 20 |IIIIIIIIIIIIIIIIIIII
15 563.78 10 |IIIIIIIIII15 563.78 10 |IIIIIIIIII
16 580.73 4 |IIII16 580.73 4 |IIII
17 597.67 3 |III17 597.67 3 |III
18 614.63 2 |II18 614.63 2 |II
19 631.58 0 |19 631.58 0 |
20 648.53 2 |II20 648.53 2 |II
-------- --------- ---+--------------------------------------------------------------------------------------- --------- ---+-------------------------------------------------------------------------------
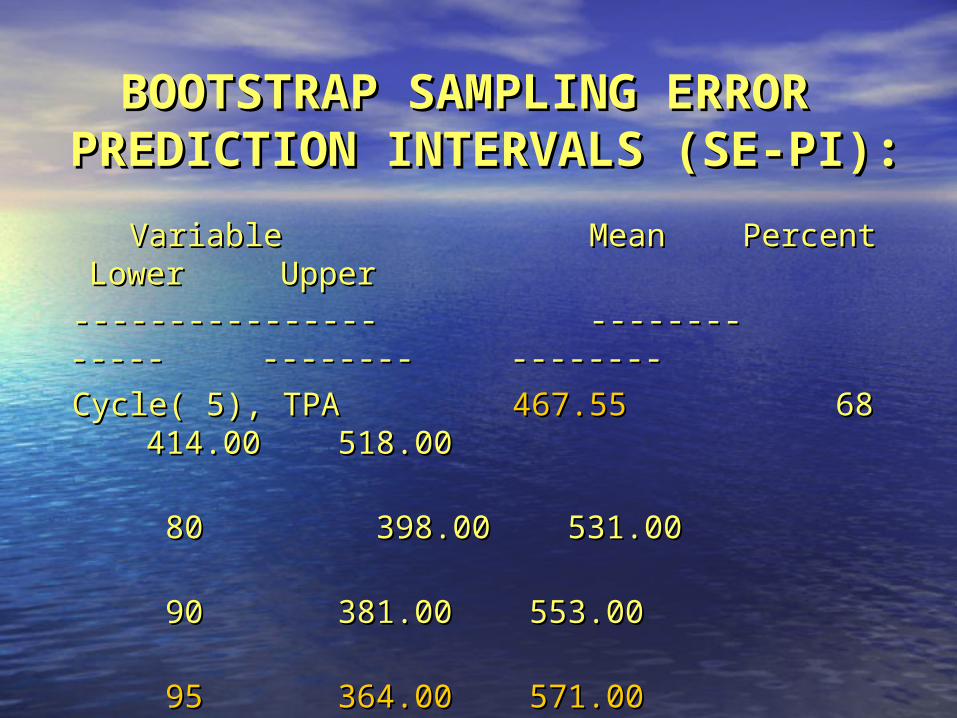
BOOTSTRAP SAMPLING ERROR BOOTSTRAP SAMPLING ERROR PREDICTION INTERVALS (SE-PREDICTION INTERVALS (SE-PI):PI):
Variable Mean Percent Lower Upper Variable Mean Percent Lower Upper
---------------- -------- ----- -------- ------------------------ -------- ----- -------- --------
Cycle( 5), TPA Cycle( 5), TPA 467.55467.55 68 414.00 68 414.00 518.00518.00
80 80 398.00 398.00 531.00531.00
90 381.00 90 381.00 553.00553.00
95 364.00 95 364.00 571.00571.00
99 329.00 99 329.00 648.00648.00
------------------------------------------------------------------------------------------------------------------------------------------