Embed Size (px)
Citation preview

Assessing Trends in Forest Parcelization andDevelopment in Minnesota:
An Itasca County Case Study
by
Joseph Mundell, Department of Forest ResourcesSteven J. Taff, Department of Applied EconomicsMichael Kilgore, Department of Forest Resources
Stephanie Snyder, USDA Forest Service, Northern Research Station
July 2007
Staff Paper Series No. 192
Department of Forest Resources
College of Food, Agricultural and Natural Resource SciencesUniversity of Minnesota
St. Paul, Minnesota
For more information about the Department of Forest Resources and its teaching, research, and outreach programs,contact the department at:
Department of Forest ResourcesUniversity of Minnesota115 Green Hall1530 Cleveland Avenue NorthSt. Paul, MN 55108-6112Ph: 612.624.3400Fax: 612.625.5212Email: [email protected]://fr.cfans.umn.edu/publications/staffpapers/index.html
The University of Minnesota is committed to the policy that all persons shall have equal access to itsprograms, facilities, and employment without regard to race, color, creed, religion, national origin, sex, age,
marital status, disability, public assistance status, veteran status, or sexual orientation.
1
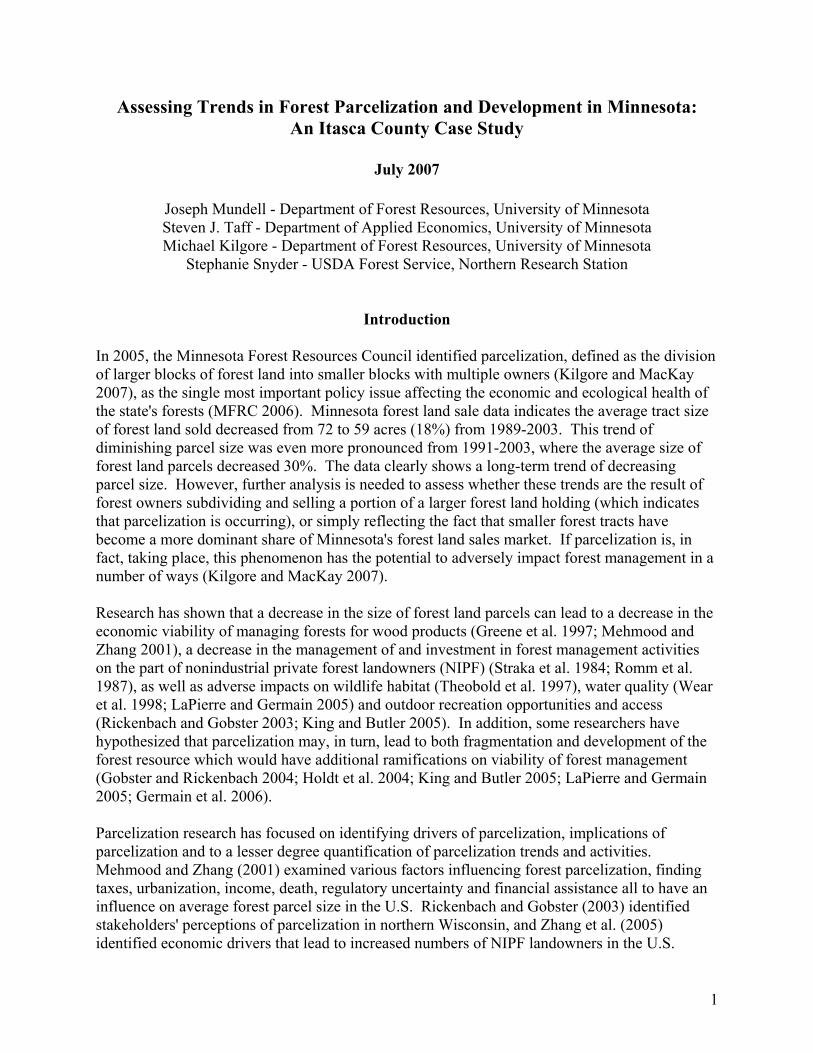
Assessing Trends in Forest Parcelization and Development in Minnesota: An Itasca County Case Study
July 2007
Joseph Mundell - Department of Forest Resources, University of Minnesota Steven J. Taff - Department of Applied Economics, University of Minnesota Michael Kilgore - Department of Forest Resources, University of Minnesota
Stephanie Snyder - USDA Forest Service, Northern Research Station
Introduction
In 2005, the Minnesota Forest Resources Council identified parcelization, defined as the division of larger blocks of forest land into smaller blocks with multiple owners (Kilgore and MacKay 2007), as the single most important policy issue affecting the economic and ecological health of the state's forests (MFRC 2006). Minnesota forest land sale data indicates the average tract size of forest land sold decreased from 72 to 59 acres (18%) from 1989-2003. This trend of diminishing parcel size was even more pronounced from 1991-2003, where the average size of forest land parcels decreased 30%. The data clearly shows a long-term trend of decreasing parcel size. However, further analysis is needed to assess whether these trends are the result of forest owners subdividing and selling a portion of a larger forest land holding (which indicates that parcelization is occurring), or simply reflecting the fact that smaller forest tracts have become a more dominant share of Minnesota's forest land sales market. If parcelization is, in fact, taking place, this phenomenon has the potential to adversely impact forest management in a number of ways (Kilgore and MacKay 2007). Research has shown that a decrease in the size of forest land parcels can lead to a decrease in the economic viability of managing forests for wood products (Greene et al. 1997; Mehmood and Zhang 2001), a decrease in the management of and investment in forest management activities on the part of nonindustrial private forest landowners (NIPF) (Straka et al. 1984; Romm et al. 1987), as well as adverse impacts on wildlife habitat (Theobold et al. 1997), water quality (Wear et al. 1998; LaPierre and Germain 2005) and outdoor recreation opportunities and access (Rickenbach and Gobster 2003; King and Butler 2005). In addition, some researchers have hypothesized that parcelization may, in turn, lead to both fragmentation and development of the forest resource which would have additional ramifications on viability of forest management (Gobster and Rickenbach 2004; Holdt et al. 2004; King and Butler 2005; LaPierre and Germain 2005; Germain et al. 2006). Parcelization research has focused on identifying drivers of parcelization, implications of parcelization and to a lesser degree quantification of parcelization trends and activities. Mehmood and Zhang (2001) examined various factors influencing forest parcelization, finding taxes, urbanization, income, death, regulatory uncertainty and financial assistance all to have an influence on average forest parcel size in the U.S. Rickenbach and Gobster (2003) identified stakeholders' perceptions of parcelization in northern Wisconsin, and Zhang et al. (2005) identified economic drivers that lead to increased numbers of NIPF landowners in the U.S.

2
Additionally, several studies have examined the potential implications of parcelization activity on wildlife (Brooks 2003) and logging (Rickenbach and Steele 2006). Most studies that quantify parcelization activity have utilized national or state level statistics to illustrate broad-scale trends in private forestland ownership and parcel size (Birch 1996; Leatherberry 2001; Butler and Leatherberry 2004; Zhang et al. 2005). For example, Greene et al. (1997) used Forest Inventory Analysis (FIA) stand data to track total acreage by stand sizes and ownership categories, an indicator of fragmentation. However, changes in FIA stand data provide limited information regarding parcelization, as forest covertype-based stand delineations are ecological units that may cross ownership boundaries. Although such studies may describe national or state-level trends, largely missing are smaller-scale, empirical estimates that quantify the extent of parcelization activity occurring within a specific geographic area (i.e., state or county). There are very few studies that empirically quantify forest parcelization trends. Drzyga and Brown (1999) digitized historical parcel maps (1970, 1980, 1999) for three counties in Michigan and estimated parcelization activity as the change in average parcel size between each time period. They used GIS software to calculate average parcel size for each of the three counties and minor civil divisions. LaPierre and Germain (2005) documented forest land parcelization rates in four counties in the New York City Watershed using visual comparisons of GIS coverage and paper maps. Germain et al. (2006) quantified parcelization in one county in central New York using digital tax map sheets. They tracked total number and area of parcels in six different acreage classes. Modern and historic tax rolls, deed books and grantee books were searched manually to analyze chain of transactions. The Center for Land Use Education at UW-Steven’s Point is in the process of quantifying long-term trends in land subdivision and parcelization at the county-level in Wisconsin (http://www.uwsp.edu/cnr/landcenter/parcelizationstudy/index.html). Ownership maps are being created in a GIS by digitizing plat books and paper maps and utilizing legal descriptions from tax assessment rolls. Changes in ownership will be tracked through time using GIS analysis. To date, we are not aware of any research that has attempted to quantify the degree and rate of parcelization using readily-available statewide real estate parcel-level data. We are also not aware of research that has linked parcelization to development activity. While national assessments and anecdotal evidence suggests forest land parcelization is occurring (i.e., the number of NIPF owners is increasing and average parcel size is decreasing), this masks parcelization activity occurring at a localized scale. Policy-makers and planners need to know where parcelization is occurring at a finer-scale resolution than average statewide parcel size before being able to fully understand drivers, implications and strategies to address this significant issue. The purpose of our study was to fill this information void; namely to empirically quantify the extent and location of forest parcelization activity within a defined geographic area over a multi-year period and to quantify the relationship between parcelization and development activity. This study explores what is happening at the local scale through a case study of Itasca County,

3
Minnesota, and sets forth a methodology for utilizing statewide real estate parcel data for examining parcelization and development activity over time.
Itasca County, Minnesota
Itasca County is a large, heavily forested county in northern Minnesota containing a variety of forest land ownership groups and patterns (public and private) and a mix of land uses. It ranks third in total forest area out of the 87 Minnesota counties with 1.36 million acres of forest land (80% of its total land area), of which 97% is classified as commercial timberland (Leatherberry et al. 1995). Of the commercial timberland, about 23% is owned by individuals, 20% by the federal government, 19% by the state, 19% by the county or municipalities, 13% by the forest industry, 5% by corporations and less than 1% by Indian groups (Leatherberry et al. 1995). Among all Minnesota counties, Itasca ranks third in individually-owned timberland, second in corporate timberland and second in industrial timberland (Leatherberry et al. 1995). Itasca County's population growth from 2000-2006 was approximately 1.7%, well below the statewide growth of 5% (U.S. Census Bureau 2007). Additionally, in 2000, Itasca had approximately 16.5 persons per square mile (U.S. Census Bureau 2007). While these figures may downplay the significance of a growing parcelization problem, research has shown that private forests have been divided into smaller parcels at rates well above those attributable to population growth alone (Samson and DeCoster 2000). Germain et al. (2006) documented parcelization in upstate New York despite a declining population, citing trends in preferences toward rural homesteads and vacation homes that act as "private green space" for their owners. Similarly, Itasca County is a popular destination for seasonal recreation and a desirable area for cabins and vacation homes, leading to an array of land development patterns and uses.

4
Figure 1. Minnesota Counties
Study Objectives
The overarching objective of this study was to test the usefulness of statewide real estate parcel data to describe and quantify the extent and magnitude of forest land parcelization and development over time in Itasca County, Minnesota. Specifically, the objectives of this research were to:
• Describe the extent to which parcelization of forest land is occurring within Itasca County.
• Characterize the nature of parcelization activity by describing “parent” and “child” owner and tract characteristics (Defined in the Data and Methods section of this paper).
• Determine the extent to which this parcelization is related to development and evaluate the temporal relationship between the two ("Development" is defined as the presence of structures such as houses on the property, and is further discussed in the Results and Discussion section of this paper).
This study was also designed to set forth a methodology for using statewide real estate parcel data for examining parcelization and development activity over time.

5
Data and Methods
For this study, we obtained the Minnesota Market Value Files (MVFs) (statewide real estate parcel data) for 1995-2006 from the Minnesota Department of Revenue. These electronic files are a complete record of all real estate in Minnesota, and contain data associated with each land parcel such as the parcel identification number (PIN), property tax classification, parcel location, parcel size ("deed acres") and estimated market value for land and buildings. MVFs prior to 1999 were not usable due to their lack of deeded acreage data associated with each parcel. To identify "forest land" parcelization activity, we selected the property tax classifications listed in Figure 2 to include in the study. While not every acre of every parcel that is included in these property tax class types is forested, we believe that when used in conjunction with the study’s parcel selection criteria listed below, the vast majority of this land base is forested. Agricultural Developed (AD) → farm with buildings (35 or more acres) Agricultural Undeveloped (AU) → farm bare land Forest Undeveloped (FU) → timber (35 or more acres), seasonal recreational
bare land, timber bare land (less than 35 acres) Other (O) → apartment (4 or more units), commercial (with
buildings), industrial (with buildings), resorts, apartment bare land, commercial bare land, industrial bare land
Residential Developed (RD) → residential (less than 4 units), seasonal recreational residential (with buildings), rural residential (farm
with buildings, less than 35 acres) Residential Undeveloped (RU) → residential bare land Figure 2. Key for Property Types used in Minnesota. Minnesota counties do not use a uniform PIN numbering system. The numbering system used by Itasca County (among others) enabled us to use PINs to track parcelization activity using the MVFs. To do so, we matched the PIN and deeded acreage variables in two successive years of MVFs to capture all parcelization activity occurring in the county over a one-year period. We identified two types of parcels: (1) new parcels (with PINs that only appeared in the second year of a two-year set); and (2) parcels that appeared in both years of a two-year set, but with different deeded acreage values in the two years. Figure 3 illustrates these parcel changes from one year’s MVF to the next. The lower parcel below Year 2 is an example of a completely new parcel with a new PIN that appeared in the second, but not the first year. The parcel on the top in the Year 2 column is an example of a parcel that existed in Year 1 but has a change in the number of deeded acres from one year to the next. Throughout this report, both types of parcels created in the second year of a two-year set will be referred to as "child parcels" (i.e., both parcels below Year 2 in Figure 3), while the original parcel from the first year (i.e., the parcel below Year 1 in Figure 3) will be referred to as a "parent parcel."

6
Figure 3. Example of a Parcel Split By identifying newly-created parcels as well as those with a change in deeded acreage from one year to the next, we were able to identify all parcel splits, as well as parcel combinations and sales of undivided interests in a parcel. A parcel split occurs when one parcel is divided into two or more parcels, each with a separate PIN (i.e., parcelization). A parcel combination occurs when two or more parcels are combined into one parcel. An undivided interest sale is when the ownership right to use and possession of a property is shared among co-owners, with no one co-owner having exclusive rights to any portion of the property (Dictionary of Business Terms 2000). Fifty acres is a common threshold used to identify parcels for which forest management is a viable activity (Thorne and Sundquist 2001; Sampson 2004). However, Itasca County assigns PINs based on a 40-acre parcel size. As a result, a large number of forested parcels in the county are approximately 40 acres, or are the result of a subdivided 40-acre parcel. Additionally, larger parcels are often assigned multiple PINs, one for each 40-acre segment. For example, 200 contiguous acres of forest land with one owner is likely identified as five adjacent 40 acre tracts, each with a unique PIN. It is important to note that, in our study, we examined the parcelization of "tax parcels," as opposed to "ownership parcels." While this study may identify a parent parcel size as 40 acres (i.e., the "tax parcel" size), the actual total ownership tract size (i.e., the "ownership parcel" size) may be much larger, as illustrated in the example above. Any "parcels" referred to in this paper are "tax parcels." We used 38.5 acres as the minimum size for the parent parcel. A 38.5 acre threshold allows for errors in area estimations for parcels that are essentially 40 acres. As an example, a 40-acre parcel that was divided into two 20-acre parcels would be identified as a split in our study. However, a 20-acre parcel that was divided into two 10-acre parcels would not. We felt that a 38.5 acre threshold was most appropriate given Itasca's parcel identification scheme, and that it reflected a reasonable cutoff for viable forest management activities. However, with alterations to the computer coding we used to capture parcelization activity, it may be possible to examine parcelization of smaller parcels (i.e., parcels below 38.5 acres). Future studies should examine parcelization given varying minimum thresholds. Prior to conducting a countywide analysis of forest parcelization activity using the previously-described procedures, the methodology was tested in one township. Each parcel split, combination and undivided interest was subsequently cross-referenced against the GIS maps

7
available on Itasca County's website to assess the accuracy of the methodology. Once we were satisfied the methodology was correctly identifying all parcel splits, the analysis procedure was repeated for the entire county. This allowed us to create a data set that identified every split, combination and undivided interest of forest land that occurred in Itasca County from 1999-2006. Next, using data from the MVFs and the GIS maps available on Itasca County's web site, specific characteristics of parcels that were subdivided were examined to identify:
• The township in which a split occurred. • The number of child parcels resulting from a parcel split. • The property type classification associated with the parcels before and after a split. • Changes in building value that accompanied a split. • The ownership of parcels resulting from a split. • The adjacency1 of the child parcels to water (lakes, streams, rivers). • The adjacency of the child parcels to public land (federal, state or county-owned land).
The data was aggregated into a series of tables and further analyzed using SAS statistical software and Microsoft Excel.
Results and Discussion
Parcel Size and Distribution of Parcels by Property Type Between 1999 and 2006, the average parcel size across all property types (of the property types we examined) (Figure 2) actually increased by 1.06 acres (Table 1; Figure 4). However, this is largely due to the elimination of Minnesota's Tree Growth Tax Law in 2001, a forest property tax law. Lands enrolled in the Tree Growth Tax Law were not previously listed on the ad valorem tax rolls, as the basis for taxation was the land’s annual timber growth value and not its estimated market value. According to Itasca County Assessor Tom Gilmore (personal communication, April 18, 2007), with the elimination of this program, more than 6,000 parcels were added to the ad valorem tax system in Itasca County alone. This explains the substantial increase in timberland class properties that occurred between 2001-2002. The influx of timberland parcels caused the percentage of parcels in the Forest Undeveloped property tax class to nearly double, increasing from 20.48% in 2001 to 40.49% in 2002 (Figure 5). In 2002-2006 (after the elimination of Tree Growth Tax Law), the average parcel size of the property types examined (Figure 2) decreased by 3.52 acres, and the average size of Forest Undeveloped parcels decreased by 1.57 acres (Table 1; Figure 4). Overall, all property types except for Agricultural Developed saw a decrease in parcel size during the study period (Table 1; Figure 4).
1 For this study, adjacency means that the parcel of interest is physically touching the feature of interest (i.e., water, public land).

8
Table 1. Average Tax Parcel Size (Acres) by Property Type AD AU FU O RD RU All Types
1999 39.79 34.79 23.92 21.30 12.93 15.86 19.33 2000 39.88 34.53 23.91 20.93 12.83 15.70 19.15 2001 39.84 34.42 23.89 21.02 12.70 15.52 19.02 2002 39.97 34.21 32.17 21.27 13.61 17.43 23.91 2003 39.97 34.09 30.64 19.36 10.92 13.99 20.85 2004 39.99 33.92 30.64 15.89 10.84 13.69 20.69 2005 40.06 33.78 30.71 15.59 10.78 13.67 20.54 2006 40.11 33.68 30.60 15.13 10.70 13.66 20.39
0
5
10
15
20
25
30
35
40
45
1999 2000 2001 2002 2003 2004 2005 2006
Aver
age
Par
cel S
ize
(acr
es)
ADAUFUORDRUall
* Note: Years 1999-2001 contain fewer parcels due to the existence of the Minnesota Tree Growth Law. A large number of parcels were added to the tax rolls in 2002 due to the elimination of this program. Figure 4. Average Tax Parcel Size by Property Type (Itasca County: 1999-2006)
9
0%
20%
40%
60%
80%
100%
1999 2000 2001 2002 2003 2004 2005 2006
RU
RD
O
FU
AUAD
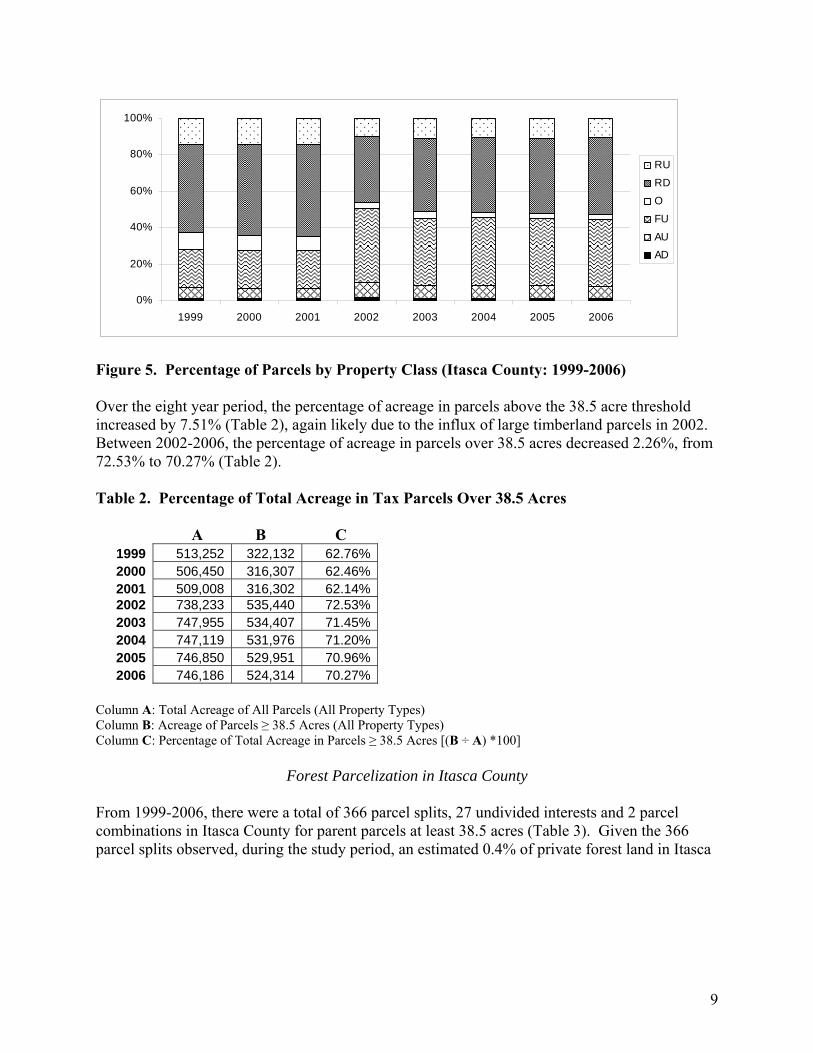
Figure 5. Percentage of Parcels by Property Class (Itasca County: 1999-2006) Over the eight year period, the percentage of acreage in parcels above the 38.5 acre threshold increased by 7.51% (Table 2), again likely due to the influx of large timberland parcels in 2002. Between 2002-2006, the percentage of acreage in parcels over 38.5 acres decreased 2.26%, from 72.53% to 70.27% (Table 2). Table 2. Percentage of Total Acreage in Tax Parcels Over 38.5 Acres A B C
1999 513,252 322,132 62.76%2000 506,450 316,307 62.46%2001 509,008 316,302 62.14%2002 738,233 535,440 72.53%2003 747,955 534,407 71.45%2004 747,119 531,976 71.20%2005 746,850 529,951 70.96%2006 746,186 524,314 70.27%
Column A: Total Acreage of All Parcels (All Property Types) Column B: Acreage of Parcels ≥ 38.5 Acres (All Property Types) Column C: Percentage of Total Acreage in Parcels ≥ 38.5 Acres [(B ÷ A) *100]
Forest Parcelization in Itasca County From 1999-2006, there were a total of 366 parcel splits, 27 undivided interests and 2 parcel combinations in Itasca County for parent parcels at least 38.5 acres (Table 3). Given the 366 parcel splits observed, during the study period, an estimated 0.4% of private forest land in Itasca

10
County was parcelized each year2. Except for a slight spike in 2001-2002, parcelization activity (i.e., number of parcel splits) was fairly constant over the study period (Figure 6). Overall, from 1999-2006, there was no statistically significant positive or negative trend in the parcelization of forested tax tracts above 38.5 acres. Table 3. Tax Parcel Splits, Undivided Interests and Combinations
Parcel Splits Undivided
InterestsParcel
Combinations1999-2000 56 0 02000-2001 38 1 02001-2002 80 1 12002-2003 48 3 02003-2004 49 2 02004-2005 50 0 12005-2006 45 20 0
Total 366 27 2
0
10
20
30
40
50
60
70
80
90
1999-2000 2000-2001 2001-2002 2002-2003 2003-2004 2004-2005 2005-2006
# of
spl
its
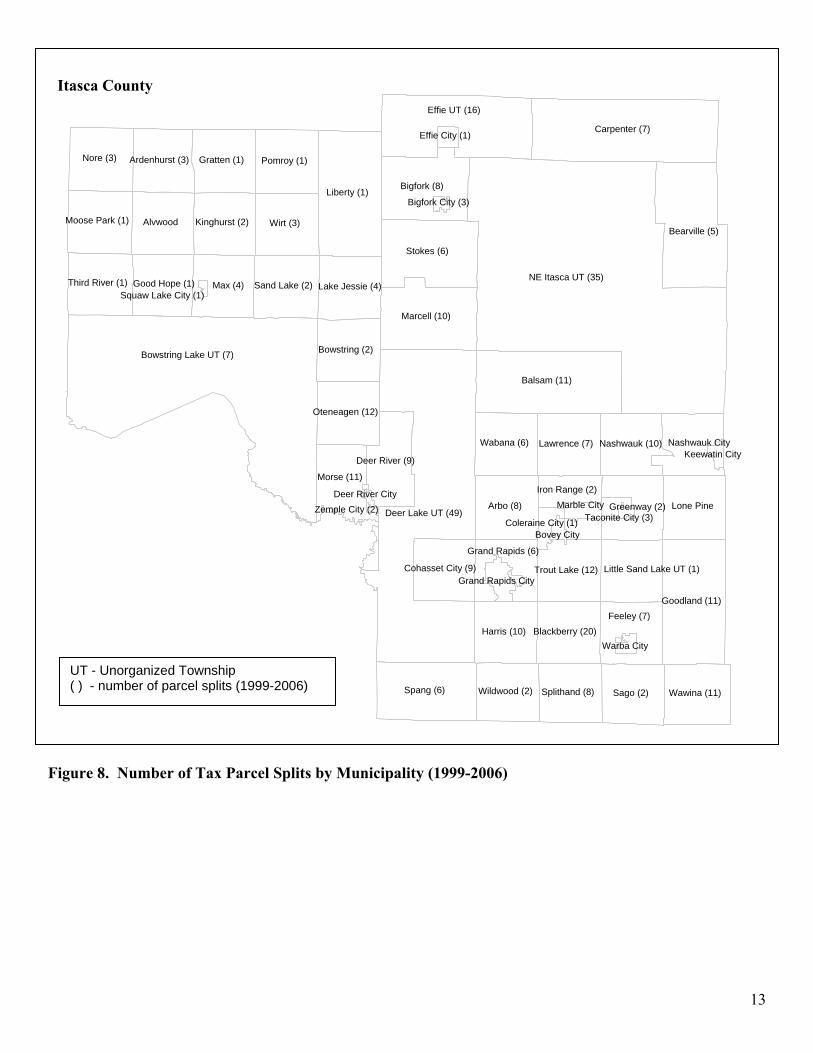
Figure 6. Itasca County Parcelization (1999-2006) During the study period, the greatest parcelization activity (per unit area) occurred in townships near Grand Rapids, the county seat (Figure 7). Blackberry Township had 20 parcel splits, while Trout Lake Township had 12 splits and Harris Township had 10 (Figure 8). There was also significant parcelization activity in Oteneagen Township (12 splits), Morse Township (11 splits), Wawina Township (11 splits) and Nashwauk Township (10 splits) (Figures 7 and 8). While unorganized townships such as Northeast Itasca and Deer Lake had large numbers of parcel
2 This figure was calculated using the following formula: [(52 splits per year) * (42 acres per split)] / 543,300 acres of private forestland in Itasca County. The acreage of private forest land is found in Minnesota's Fifth Forest Resources Inventory (Leatherberry et al., 1995).

11
splits (35 and 49 respectively), they did not have as high of rates of parcelization per unit area due to the large land area each unorganized township represents. In general, the greatest parcelization activity occurred in the southern half of Itasca County in townships near cities (i.e., Grand Rapids City, Bovey City, Coleraine City, Nashwauk City, Deer River City, Zemple City) (Figure 7). In the townships with large numbers of parcel splits, parcelization activity was fairly evenly spread throughout the study period, as opposed to occurring in only one or two sets of years (Table 4). For instance, in Blackberry Township, there were between one to five parcel splits during each set of years, resulting in 20 cumulative splits. While there was a slight spike in parcelization activity in 2001-2002 in some townships (i.e., Northeast Itasca Unorganized, Trout Lake, Oteneagen, Balsam), in general, activity was spread evenly throughout the study period.

12
Figure 7. Parcelization by Municipality: Splits per Unit Area (1999-2006)
Number of splits per square kilometer0.000 - 0.033
0.034 - 0.099
0.100 - 0.221
0.222 - 0.640
0.641 - 1.156
Itasca County
• Grand Rapids
13
Figure 8. Number of Tax Parcel Splits by Municipality (1999-2006)
NE Itasca UT (35)
Bowstring Lake UT (7)
Deer Lake UT (49)
Carpenter (7)
Liberty (1)
Balsam (11)
Effie UT (16)
Bearville (5)
Stokes (6)
Spang (6)
Bigfork (8)
Wirt (3)
Marcell (10)
Max (4)
Arbo (8)
Nore (3)
Alvwood
Sago (2)
Lone Pine
Feeley (7) Harris (10)
Pomroy (1) Gratten (1)
Morse (11)
Wabana (6)
Wawina (11)
Lawrence (7)
Kinghurst (2)
Bowstring (2)
Sand Lake (2)
Splithand (8)Wildwood (2)
Goodland (11)
Third River (1)
Deer River (9)
Ardenhurst (3)
Lake Jessie (4)
Moose Park (1)
Blackberry (20)
Nashwauk (10)
Good Hope (1)
Oteneagen (12)
Trout Lake (12)
Greenway (2)
Nashwauk City
Cohasset City (9) Little Sand Lake UT (1)
Grand Rapids (6)
Iron Range (2)
Grand Rapids City
Marble City Coleraine City (1)
Effie City (1)
Taconite City (3)
Warba City
Bovey City
Keewatin City
Bigfork City (3)
Deer River CityZemple City (2)
Squaw Lake City (1)
Itasca County
UT - Unorganized Township ( ) - number of parcel splits (1999-2006)

14
1999/2000 2000/2001 2001/2002 2002/2003 2003/2004 2004/2005 2005/2006 Total Splits
Deer Lake UT 4 3 7 13 7 11 4 49
NE Itasca UT 4 3 10 2 6 6 4 35
Blackberry 1 4 4 5 3 2 1 20
Effie UT 3 3 1 0 2 3 4 16
Trout Lake 2 0 5 0 3 1 1 12
Oteneagen 4 1 5 0 0 2 0 12
Balsam 1 0 5 1 1 0 3 11
Goodland 1 1 2 2 1 3 1 11
Morse 2 0 1 3 3 1 1 11
Wawina 5 0 2 0 1 3 0 11
Harris 0 2 1 2 0 1 4 10
Marcell 0 0 3 2 0 5 0 10
Nashwauk 2 2 3 0 0 2 1 10
Cohasset City 2 1 3 0 3 0 0 9
Deer River 1 3 1 1 1 0 2 9
Arbo 1 2 1 1 2 1 0 8
Bigfork 0 1 2 1 1 0 3 8
Splithand 5 1 1 1 0 0 0 8
Carpenter 1 1 3 0 1 0 1 7
Lawrence 2 0 2 1 2 0 0 7
Feeley 2 2 2 0 0 1 0 7
Bowstring Lake UT 1 1 0 3 1 0 1 7
Grand Rapids 2 0 3 0 0 0 1 6
Spang 2 1 0 2 0 0 1 6
Stokes 0 1 0 0 1 0 4 6
Wabana 1 0 1 0 1 3 0 6
Bearville 0 0 0 0 3 1 1 5
Lake Jessie 0 1 2 1 0 0 0 4
Max 1 0 0 0 1 1 1 4
Ardenhurst 1 0 0 0 0 1 1 3
Bigfork City 0 0 2 1 0 0 0 3
Nore 1 1 0 0 1 0 0 3
Taconite City 2 0 0 0 0 1 0 3
Wirt 0 1 0 1 1 0 0 3
Bowstring 0 0 0 2 0 0 0 2
Greenway 1 0 0 1 0 0 0 2
Iron Range 0 0 0 0 1 1 0 2
Kinghurst 0 0 0 0 2 0 0 2
Sago 0 0 1 0 0 0 1 2
Sand Lake 1 1 0 0 0 0 0 2
Wildwood 0 0 2 0 0 0 0 2
Zemple City 0 0 0 2 0 0 0 2
Coleraine City 0 0 0 0 0 0 1 1
Effie City 0 0 0 0 0 0 1 1
Good Hope 0 0 0 0 0 0 1 1
Grattan 0 0 1 0 0 0 0 1
Liberty 0 0 0 0 0 0 1 1
Little Sand Lake UT 0 0 1 0 0 0 0 1
Moose Park 0 0 1 0 0 0 0 1
Pomroy 0 1 0 0 0 0 0 1
Squaw Lake City 0 0 1 0 0 0 0 1
Third River 0 0 1 0 0 0 0 1
Table 4. Parcelization by Township in Itasca County

15
Characteristics of Parcel Splits
Parent and Child Parcels: The average number of child parcels resulting from a parcel split in Itasca County was approximately two. While there were occasional splits with up to eight child parcels, the vast majority of splits (87%) resulted in two child parcels (Figure 9).
0
50
100
150
200
250
300
350
2 3 4 5 6 8
# of child parcels
# of
spl
its
Figure 9. Number of Child Parcels Resulting from Parcel Splits (1999-2006) The average size of the parent tax parcel for the resulting splits was approximately 41 acres. However, this is to be expected, as, as previously noted, Itasca County assigns most PINs based on a 40-acre parcel size. Larger parcels are often assigned multiple PINs, one for each 40 acre segment. Again, it is important to note that this average parent parcel size refers to the parent tax parcel, not the ownership parcel. Of the 366 parcel splits, 135 had a parent parcel classified as Residential Developed, 83 had a parent parcel classified as Forest Undeveloped, 60 had a parent parcel classified as Agricultural Undeveloped and 51 had a parent parcel classified as Residential Undeveloped (Figure 10; see Figure 3 for descriptions of these property classifications). The remaining splits had parent parcels classified as Agricultural Developed or Other. Overall, approximately 46% of the splits occurred on tax parcels with existing development, while approximately 54% occurred on tax parcels consisting of undeveloped or bare land. Approximately 51% of the splits occurred on land classified as residential, 25% on land classified as agricultural and 24% on land in other classifications.

16
0
20
40
60
80
100
120
140
160
AgriculturalDeveloped
AgriculturalUndeveloped
ForestUndeveloped
Other ResidentialDeveloped
ResidentialUndeveloped
# of
spl
its
Figure 10. Property Type of Parent Parcel (Itasca County: 1999-2006) Ownership: Of the 366 parcel splits, approximately 11% had the same owner(s) for both the parent and any child parcels (Figure 11). This means that these parcel splits do not represent changes in ownership, but rather represent administrative changes in how the tax parcels are classified. Even though the property tax classification has changed, both child parcels are still held by the same owner.. Although a parcel split may represent no change in ownership, this does not imply that it is unrelated to future development activity. A parcel split from the 1999-2000 results provides an example. In 1999, the parent parcel was 40 acres and classified as timberland. In 2000, the parcel was split into a 30 acre parcel classified as residential bare land and a 10 acre parcel classified as residential (less than 4 units). The original parent parcel had no building value, but, in 2000, $45,700 of building value was added to the 10 acre residential parcel. Adjacency to Water/Public Land: Of all the parcel splits that occurred during the study period, approximately 36% had at least one child parcel that was adjacent to water, and approximately 57% had at least one child parcel that was adjacent to public land (i.e., federally-owned, state-owned or county-owned land) (Figure 11). A hedonic pricing study by Snyder et al. (2007) found that adjacency to lakes or rivers had a significant positive influence on private forest land prices in northern Minnesota, an indication of the value that owners place on such amenity features. This finding might help explain the large percentage of parcelization activity occurring near water. However, the Snyder et al. (2007) study also found a negative influence of adjacency to public land on forest land prices. The large percentage of parcel splits occurring near public land may simply be a reflection of the large amount of public land in the more rural, undeveloped, forested areas of Itasca County, rather than an indication that owners find parcels adjoining public land to have higher value or desirability than those which do not. Nearly 60% of timberland in Itasca is owned by federal, state or county government (Leatherberry et al. 1995).

17
01020304050
60708090
100
Change in BuildingValue
Same Owner Adjacent to Water Adjacent to PublicLand
% o
f spl
its
Figure 11. Characteristics of Splits (Itasca County: 1999-2006)
Parcelization and Development
Building (Development) Activity: For this study, "development" is defined as the presence of structures such as houses on the property. In order to determine if development was occurring on the child parcels identified in parcel splits, the building value in the first year of a two-year set was compared with the building value of all the resulting child parcels in the second year of the two-year set. If the total building value (of all resulting child parcels) in the second year exceeded the original building value of the parent parcel (from the first year) by at least 15%, then the split was coded as having a change in building value. However, if there was a 15% change in building value, but the total building value for each resulting child parcel remained under $5,000, then the split was coded as not having a change in building value. Similarly, this $5,000 threshold was used for parcel splits with no building value in the first year. If there existed no building for the parent parcel in the first year, but was at least $5,000 building value on any one of the child parcels in the second year, then the split was coded as having a change in building value. The 15% minimum increase in building value was used to account for changes in building appraisals, as these changes do not represent new development activity. We felt this 15% threshold would correctly account for most changes in building value due to solely to market and appraisal fluctuations. The $5,000 threshold was used to account for the construction or existence of small structures such as sheds, which we felt did not constitute noteworthy development activity. Parcelization and Development: Using this approach, approximately 27% of the 366 splits were identified as having a change in building value from the first year of a two-year set to the second (Figure 11). This means that more than one-quarter of the parcel splits resulted in the immediate presence of structures on the land, or were immediately developed to some extent.
18
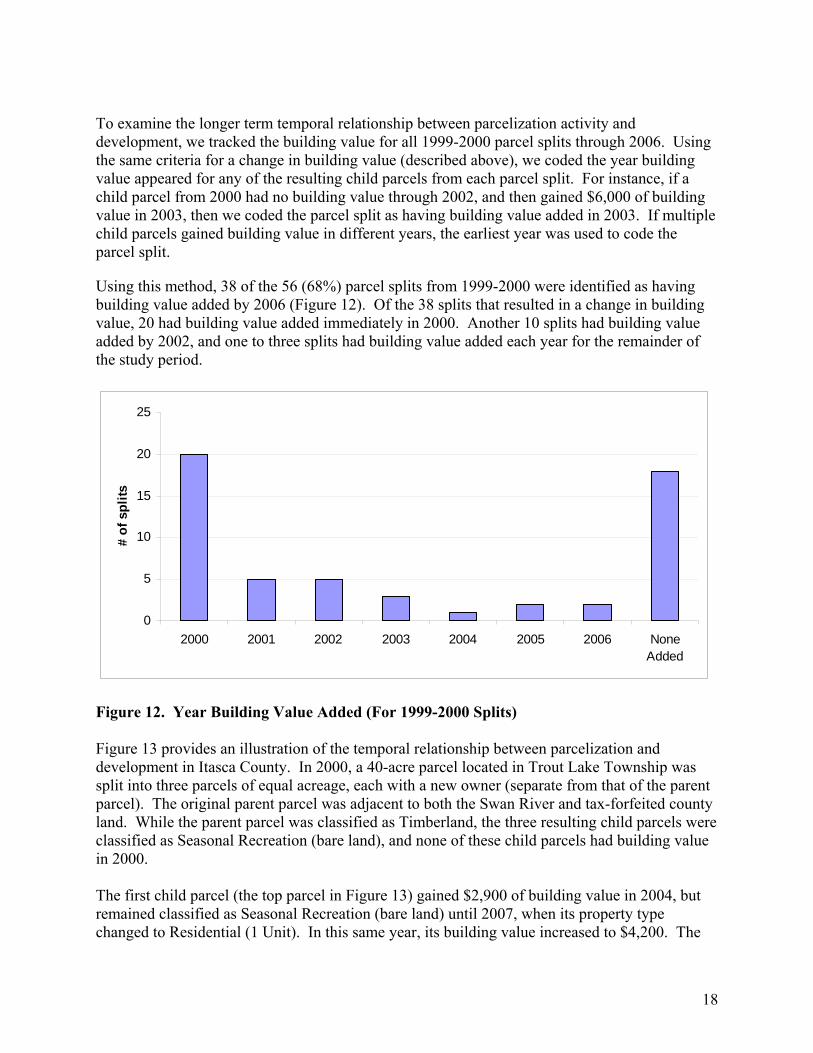
To examine the longer term temporal relationship between parcelization activity and development, we tracked the building value for all 1999-2000 parcel splits through 2006. Using the same criteria for a change in building value (described above), we coded the year building value appeared for any of the resulting child parcels from each parcel split. For instance, if a child parcel from 2000 had no building value through 2002, and then gained $6,000 of building value in 2003, then we coded the parcel split as having building value added in 2003. If multiple child parcels gained building value in different years, the earliest year was used to code the parcel split.
Using this method, 38 of the 56 (68%) parcel splits from 1999-2000 were identified as having building value added by 2006 (Figure 12). Of the 38 splits that resulted in a change in building value, 20 had building value added immediately in 2000. Another 10 splits had building value added by 2002, and one to three splits had building value added each year for the remainder of the study period.
0
5
10
15
20
25
2000 2001 2002 2003 2004 2005 2006 NoneAdded
# of
spl
its
Figure 12. Year Building Value Added (For 1999-2000 Splits) Figure 13 provides an illustration of the temporal relationship between parcelization and development in Itasca County. In 2000, a 40-acre parcel located in Trout Lake Township was split into three parcels of equal acreage, each with a new owner (separate from that of the parent parcel). The original parent parcel was adjacent to both the Swan River and tax-forfeited county land. While the parent parcel was classified as Timberland, the three resulting child parcels were classified as Seasonal Recreation (bare land), and none of these child parcels had building value in 2000. The first child parcel (the top parcel in Figure 13) gained $2,900 of building value in 2004, but remained classified as Seasonal Recreation (bare land) until 2007, when its property type changed to Residential (1 Unit). In this same year, its building value increased to $4,200. The

19
second child parcel (the middle parcel in Figure 13) remained classified as Seasonal Recreation (bare land) through 2006, and had no building value during this time. In 2007, its property classification changed to Residential (1 Unit), and it gained $10,600 of building value. The third child parcel (the bottom parcel in Figure 13) gained $6,400 of building value in 2001, and was classified as Residential (1 Unit) at this time. This parcel steadily gained building value through 2007, when its building value was reported as $24,600. Overall, during the seven years following this parcel split, all three of the resulting child parcels both gained building value3 and changed in property type classification. This example highlights the relationship between parcelization and development, and underscores the importance of tracking child parcels over time in order to fully understand this relationship. While 27% of the splits identified between 1999-2006 had an immediate change in building value (Figure 11), this is certainly not a complete reflection of the development resulting from this parcelization activity.
3 The top parcel in Figure 13 was not coded as having added building value under our system, as the building value was under $5,000.

20
Figure 13. Parcelization and Development: An Example from Trout Lake Township
Swan River Parcel Boundary
2006 1999 2000 2007
40 acres Timberland No Building Value
13.34 acres Seasonal Recreation Bare Land No Building Value
13.34 acres Seasonal Recreation Bare Land $2,900 Building Value
13.34 acres Residential 1 Unit $4,200 Building Value
13.33 acres Seasonal Recreation Bare Land No Building Value
13.33 acres Seasonal Recreation Bare Land No Building Value
13.33 acres Residential 1 Unit $10,600 Building Value
13.33 acres Seasonal Recreation Bare Land No Building Value
13.33 acres Residential 1 Unit $24,600 Building Value
13.33 acres Residential 1 Unit $8,900 Building Value
Parcel Split
- 3 Child Parcels - No Building Value
- 2 Child Parcels Have Building Value - 1 Has Changed Property Type
- All 3 Child Parcels Have Building Value - All 3 Have Changed Property Type
21
Conclusions
This study empirically quantified the extent and location of forest parcelization activity in Itasca County from 1999-2006, and examined both the immediate and extended relationship between parcelization and development activity. Unique to this study is that we documented forest land parcelization and development activity over time utilizing readily available statewide real estate parcel data. It is possible that our methodology could be replicated in other geographic areas depending on the data available and its format. For instance, the computer coding we developed to identify parcelization activity is based on how Itasca County numbers parcels, and specifically on how it codes parcel splits. This computer coding would need to be altered to fit another area's parcel identification scheme. Moreover, we utilized Minnesota Market Value Files, which provided a great deal of readily available parcel data. The availability and data contained within such files may vary by state. Lastly, much of our analysis was done using the parcel-level GIS data available via Itasca County's website. The availability and quality of this data also varies across counties. Preliminary examination of county PIN coding schemes suggests study replication is most feasible in Cook, Lake, Clearwater, Cass, and Koochiching counties. Decreasing Parcel Size: Overall, in Itasca County from 1999-2006, the average forest land parcel size and the percentage of acreage in parcels greater than 38.5 acres actually increased. However, this was due to the elimination of the Tree Growth Program, which resulted in an influx of large forest land parcels into the tax system. After the elimination of this program (from 2002-2006), the average forest land parcel size decreased by 3.52 acres and the percentage of parcels greater than 38.5 acres decreased by 2.26%. No Significant Change in Parcelization Activity: Utilizing a minimum threshold of 38.5 acres for parent parcels, we documented 366 forest land parcel splits in Itasca County from 1999-2006. During this period, except for a slight spike of activity in 2001-2002, parcelization was fairly constant from year to year. Despite widespread perceptions of rapidly increasing rates of parcelization, we observed no significant positive or negative trend in parcelization activity during the study period. It is possible that our study period falls after a previous stage of increasing activity; however, it remains that during the period and in the geographic area examined, there was no significant trend in activity. Future parcelization studies should strive for longer study periods in order to obtain a better understanding of local parcelization trends over time. 0.4% Private Forest Land Parcelized Each Year: Given the 366 parcel splits observed, during the study period, approximately 0.4% of private forest land in Itasca County was parcelized each year4. It is important to note that the method of tracking parcelization activity used in this study utilizes a 38.5 acre threshold, and does not capture parcelization activity below this threshold. A study tracking parcelization with either a higher or lower threshold, or with no threshold at all,
4 This figure was calculated using the following formula: [(52 splits per year) * (42 acres per split)] / 543,300 acres of private forestland in Itasca County. The acreage of private forest land is found in Minnesota's Fifth Forest Resources Inventory (Leatherberry et al., 1995).
22
would yield different results, and this must be considered both when designing and interpreting a parcelization study. Parcelization Occurring Near Water, Public Land and Cities: The characteristics of the parcel splits observed can provide important clues as to areas within Itasca County that are of the most immediate concern in regards to parcelization. For instance, with 36% of splits occurring adjacent to water and 57% adjacent to public land, areas directly bordering water or public land may need to be a priority for protection. Often parcels buffering public lands act as wildlife habitat and provide important ecosystem services (Groom et al. 1999) and development along shorelines can lead to water quality issues (Dillon et al. 1994; Hendry and Leggatt 1982). In these situations, forest land parcelization can have potentially detrimental effects. Overall, individual circumstances and local concerns need to be considered when setting protection priorities. In Itasca County, the heaviest parcelization activity occurred in the southern half of the county in townships near larger communities. These areas may provide a good starting point for protective measures, such as zoning regulations and conservation easements, taken by local and state legislators and conservation organizations. Parcelization Strongly Tied to Development: While the overall rate of parcelization observed in this study may seem meager, and while there was no positive or negative trend observed, the effects of the parcelization should not be viewed as inconsequential. For instance, 54% of the splits observed occurred on previously undeveloped land, and 68% of the splits from 1999-2000 had building value added within seven years after division. These numbers suggest that parcelization is intimately tied to development activity, and that this development typically occurs not long after the land is parcelized. Given the findings of this study, additional research is required to empirically quantify the extent and location of parcelization and development activity in other geographic areas of interest within northern Minnesota. The methodology set forth in this study provides a solid starting point for such research, and statewide real estate parcel data and GIS data layers offer a wealth of readily available information for analysis. Future research should also seek to understand the types of development that affect timber availability, recreational access and ecosystem services, and should examine the net effects of development on local communities, economies and local units of government.
23
References Birch, T.W. 1996. Private forestland owners in the United States, 1994. Resource Bulletin NE-134. Washington DC: USDA Forest Service, Northeastern Forest Experiment Station. Brooks, R.T. 2003. Abundance, distribution, trends and ownership patterns of early-successional forests in the northeastern United States. Forest Ecology and Management 185: 65-74. Butler, B.J., and E.C. Leatherberry. 2004. America's family forest owners. Journal of Forestry 102(7): 4-14. Dillon, P. J., Scheider, W.A., Reid, R.A., and D. S. Jeffries. 1994. Lakeshore capacity study: Part I—Test of effects of shoreline development on the trophic status of lakes. Lake Reservoir Management 8:121–129.
Drzyga, S.A., and D.G. Brown. 1999. Land parcelization and forest cover fragmentation in three forested counties in Northern Lower Michigan. In Proceedings of the Society of American Forests 1998 National Convention; 1998 September 19-23; Traverse City, MI. SAF Publ. SAF-99-01. Bethesda, MD: Society of American Foresters: 129-135.
Germain, R.H., Brazill, K., and S.V. Stehman. 2006. Forestland parcelization in Upstate New York despite economic stagnation and a declining population. National Journal of American Foresters 23(4): 280-287. Gilmore, T. 2007. E-mail from Thomas Gilmore, Itasca County Assessor, to Joseph Mundell. April 18. Gobster, P.H., and M.G. Rickenbach. 2004. Private forestland parcelization and development in Wisconsin's Northwoods: perceptions of resource-oriented stakeholders. Landscape and Urban Planning 69: 165-182. Greene, W.D., Harris, Jr., T.G., DeForest, C.E., and J. Wang. 1997. Harvesting cost implications of changes in the size of timber sales in Georgia. Southern Journal of Applied Forestry 21(4): 193-198. Groom, M., Jensen D.B., Knight, R.L., Gatewood, S., Mills L., Boyd-Heger, D., Mills, L.S., and M. E. Soule. 1999. Buffer zones: Benefits and dangers of compatible stewardship. In Continental conservation: Scientific foundations of regional reserve networks, eds. Soule, M.E. and J. Terborgh, 171–197. Washington, DC: Island Press. Hendry, G. S., and E. A. Leggatt. 1982. Some effects of shoreline cottage development on lake bacteriological water quality. Water Resources 16:1217–1222.
24
Holdt, B.M., Civco, D.L., and J.D. Hurd. 2004. Forest fragmentation due to land parcelization and subdivision: a remote sensing and GIS analysis. Proc. ASPRS Annual Conference, Denver, CO. 8 p. Kilgore, M.A., and D.G. MacKay. 2007. Trends in Minnesota’s forest land real estate market: implications for forest management. Northern Journal of Applied Forestry 24(1): 37-42. King, S.L., and B.J. Butler. 2005. Generating a forest parcelization map for Madison County, NY. Pp. 147-155. In Systems analysis in forest resources: proceedings of the 2003 symposium, eds. Bevers, M., and T.M. Barrett. General Technical Report PNW-GTR-656. Portland, OR: USDA Forest Service, Pacific Northwest Research Station. LaPierre, S., and R.H. Germain. 2005. Forestland parcelization in the New York City watershed. Journal of Forestry 103: 139-145. Leatherberry, E.C. 2001. Wisconsin private timberland owners: 1997. Research paper NC-339. St. Paul: USDA Forest Service, North Central Research Station. Leatherberry, E.C., Spencer Jr., J.S., Schmidt, T.L., and M.R. Carroll. 1995. An analysis of Minnesota's fifth forest resources inventory, 1990. Resource Bulletin NC-165. St. Paul: USDA Forest Service, North Central Forest Experiment Station. Mehmood, V.C., and D. Zhang. 2001. Forest parcelization in the United States: a study of contributing factors. Journal of Forestry 99(4): 30-34. Minnesota Forest Resources Council (MFRC). 2006. 2005 Annual report to the governor and legislature on the implementation of the Sustainable Forest Resources Act. CP-0106. Available online at http://www.frc.state.mn.us/Info/MFRCdocs/MFRC_annual_%20report_body.pdf; last accessed by staff May 2007. Rickenbach, M.G., and P.H. Gobster. 2003. Stakeholders' perceptions of parcelization in Wisconsin's Northwoods. Journal of Forestry 101(6): 18-23. Rickenbach, M.G., and T.W. Steele. 2006. Logging firms, nonindustrial private forests, and forest parcelization: evidence of firm specialization and its impact on sustainable timber supply. Canadian Journal of Forest Research 26: 186-194. Romm, J., Tuazon, R., and C. Washburn. 1987. Relating forestry investments to the characteristics of nonindustrial private forestland owners in northern California. Forest Science 33: 197-209. Sampson, N. 2004. Responses to "America's Family Forest Owners": Implications for forest production. Journal of Forestry 102(7): 12-13. Sampson, N., and L. DeCoster. 2000. Forest fragmentation: Implications for sustainable private forests. Journal of Forestry 98(3) 4-8.
25
Snyder, S.A.; Kilgore, M.A.; Hudson, R., and J. Donnay. 2007. Determinants of forest land prices in northern Minnesota: a hedonic pricing approach. Forest Science 53(1): 25-36. Straka, T.J., Wisdom, H.W., and J.E. Moak. 1984. Size of forest holding and investment behavior of nonindustrial private owners. Journal of Forestry 82: 495-496. Theobold, D.M., Miller, J.R., and N.T. Hobbs. 1997. Estimating the cumulative effects of development on wildlife habitat. Landscape and Urban Planning 39: 25-36. Thorne, S., and D. Sundquist. 2001. New Hampshire's vanishing forests: Conversion, fragmentation, and parcelization of forests in the Granite State. Concord, NH: Society for the Protection of New Hampshire's Forests. Undivided Interest. 2000. Answers.com. Dictionary of Business Terms, Barron's Educational Series, Inc. Available online at http://www.answers.com/topic/undivided-interest-1; last accessed by staff May 2007. U.S. Census Bureau. 2007. State and County QuickFacts: Itasca County, Minnesota. U.S. Department of Commerce, Bureau of the Census. Available online at http://quickfacts.census.gov/qfd/states/27/27061.html; last accessed by staff May 2007. Wear, D.N., Turner, M.G., and R.J. Naiman. 1998. Land cover along an urban-rural gradient: Implications for water quality. Ecological Applications 8(3): 619-630. Zhang, Y., Zhang, D., and J. Schelhas. 2005. Small-scale non-industrial private forest ownership in the United States: Rationale and Implications for forest management. Silva Fennica 39(3): 443-454.