Embed Size (px)
Citation preview

Assessing the Utility of a Personal Desktop Cluster
W. Feng ∗, A. Ching †, and C. Hsu ‡
Abstract
The computer workstation, introduced by Sun Microsystems in 1982, was the tool of
choice for scientists and engineers as an interactive computing environment for the devel-
opment of scientific codes. However, by the mid-1990s, the performance of workstations
began to lag behind high-end commodity PCs. This, coupled with the disappearance of
BSD-based operating systems in workstations and the emergence of Linux as an open-
source operating system for PCs, arguably led to the demise of the workstation as we
knew it.
Around the same time, computational scientists started to leverage PCs running
Linux to create a commodity-based (Beowulf) cluster that provided dedicated compute
cycles, i.e., supercomputing for the rest of us, as a cost-effective alternative to large
supercomputers, i.e., supercomputing for the few. However, as the cluster movement
has matured, with respect to cluster hardware and open-source software, these clusters
have become much more like their large-scale supercomputing brethren — a shared
datacenter resource that resides in a machine room.
Consequently, the above observations, when coupled with the ever-increasing per-
formance gap between the PC and cluster supercomputer, provide the motivation for a
personal desktop cluster workstation — a turnkey solution that provides an interactive
∗Depts. of Computer Science and Electrical & Computer Engineering, Virginia Tech. E-mail:[email protected]
†Ultra-Scale Computing Lab, Northwestern University. E-mail: [email protected]‡Computer & Computational Sciences Division, Los Alamos National Laboratory. E-mail:
1

and parallel computing environment with the approximate form factor of a Sun SPARC-
station 1 “pizza box” workstation. In this paper, we present the hardware and software
architecture of such a solution as well as its prowess as a developmental platform for par-
allel codes. In short, imagine a 12-node personal desktop cluster that achieves 14 Gflops
on Linpack but sips only 150-180 watts of power, resulting in a performance-power ratio
that is over 300% better than our test SMP platform.
Keywords: cluster, low power, desktop, supercomputer, benchmarking, perfor-
mance characterization, workstation
1 Introduction
In 1982, Sun Microsystems introduced the first workstation to the scientific computing com-
munity, one that included the TCP/IP suite, and shortly thereafter, NFS. By the late 1980s,
Sun had become the undisputed leader of the workstation market when they introduced the
Sun SPARCstation 1, rated at 12.5 MIPS and 1.4 Mflops while running at 20 MHz, for the
base price of US$9,000. The workstation’s features were so tightly integrated that they fit in
a 16” x 16” x 3” enclosure — the first “pizza box” workstation. In 1992, Sun continued its
pizza-box form factor with the introduction of the first multiprocessing desktop workstation for
scientific computing — the Sun SPARCstation 10 with dual 60-MHz SuperSPARC processors
and a 1 MByte cache. However, rather than continuing to scale up the number of processors
in the form factor of a pizza box, Sun opted to pursue 64-bit Sun UltraSPARC workstations
in the mid-1990s in order to support its scientific computing community (though the price-
performance ratio of such workstations was noticeably worse than for PCs and though there
was little demand for 64-bit systems at the time). In addition, internal forces within Sun,
who wanted to cater more to financial markets, transitioned the SunOS BSD-based operating
system to System V-based Solaris. These above decisions arguably led to the demise of the
computer workstation.
Coincidentally, the emergence of PCs as cost-effective alternatives to workstations, coupled
2

with the open-source Linux operating system (OS), led to the Beowulf commodity-clustering
movement [1], a movement that dramatically lowered the entry costs into high-performance
computing for computational scientists and provided dedicated “supercomputing for the rest
of us.” However, as this movement matured through the late 1990s and early 2000s (with
respect to commodity hardware and open-source software such as Linux, MPI, ROCKS, and
OSCAR, for example), commodity clusters became the very thing that they were purported to
be an alternative to, i.e., a shared datacenter HPC resource residing in machine room whose
use is arbitrated by a batch scheduler such as Platform Computing’s LSF, Altair’s PBS, or
IBM’s LoadLeveler. Now, over 80% of the Top500 Supercomputer List is made up of clusters
that are operated as shared datacenter HPC resources.
With the notion of “supercomputing for the rest of us” now effectively obsolete, how does
an application scientist develop a parallel code? A dual-processor SMP like the Dell PowerEdge
2650 may not be enough to debug a parallel code or to test its scalability. On the other hand,
using a shared datacenter HPC resource like a large-scale cluster can result in scheduling
conflicts or long queues, resulting in long turnaround times for the program developer. Thus,
debugging a parallel application becomes a batch process rather than an interactive one. The
solution? How about a 12-node personal desktop cluster (PDC) workstation in a pizza box
and with a power envelope of only 150-180 watts?1
Providing a PDC as a personal resource for code development — a la the Sun SPARCsta-
tion 10 — allows the application scientist to better focus on science (rather than on computer
science) by enabling the interactive development and debugging of applications with scalabil-
ity at the desktop.2 Furthermore, by having scientists develop their codes on their own PDCs,
the shared datacenter HPC cluster can reduce the number of “repeat offender” jobs that crash
and impact the operation of the shared datacenter cluster.
Though one could argue that deploying such PDCs would lead to tremendously inefficient
1For reference, a Dell PowerEdge 2650 “desktop” server with dual 2.2-GHz Intel Xeons consumes approxi-mately 217 watts.
2In addition to eliminating scheduling conflicts and long queues, a PDC provides redundancy possibilities,i.e., run your parallel code on your PDC if your shared datacenter HPC resource fails or goes down formaintenance.
3

use of compute resources, we argue that through the use of distributed-computing infras-
tructures such as Condor [5], Globus [14], and Sun Grid Engine, we can take advantage of
computing resources that would otherwise be wasted and put them to good use, i.e., “cycle
stealing.” Specifically, by having distributed-computing resources in the form of PDCs, we can
(i) leverage existing distributed HVAC and electrical infrastructure, thus obviating the need
to build exorbitant machine-cooled rooms (or even entirely new buildings); (ii) use the PDCs
as local workstations for parallel code development, testing, and evaluation, e.g., relative to
scalability; and (iii) harness excess compute cycles from idle machines (e.g., via Condor) to
create a virtual HPC cluster.
The remainder of the paper is organized as follows. Section 2 explains the origins of the
personal desktop cluster. Section 3 describes the hardware and software architecture of an
example personal desktop cluster: the Orion Multisystems DT-12. Section 4 displays the
usefulness of a personal desktop cluster in parallel code development versus a typical SMP
workstation. Section 5 concludes our work.
2 Background
How was the concept of a personal desktop cluster (PDC) workstation arrived at? Loosely
speaking, the basic ideas behind the Green Destiny cluster [4, 16, 3], i.e., Beowulf cluster
technology (such as commodity hardware, Linux, and MPI), low power consumption, and
an optimized run-time system for efficiency purposes, were cross-fertilized with the need for
a Beowulf cluster in the form factor of a pizza-box workstation. This background section
presents an anecdotal account of how Green Destiny originated and ultimately evolved into a
PDC.
2.1 Origins
Back in 2001, we observed that cluster supercomputers were making less and less efficient use
of the space that they occupied. Though the performance on our n-body galaxy formation code
4

1
10
100
1000
1.5 1 0.7 0.5 0.35 0.25 0.18 0.13 0.1 0.07
I386 – 1 watt
I486 – 2 watts
Pentium – 14 watts
Pentium Pro – 30 wattsPentium II – 35 watts
Pentium III – 35 watts
Chip Maximum
Power in watts/cm2
Surpassed
Heating Plate
Not too long to reach
Nuclear Reactor
Year
Pentium 4 – 75 watts
1985 1995 2001
Itanium – 130 watts
Figure 1: Moore’s Law for Power Consumption.
increased 2000-fold from the Cray C90 vector supercomputer (circa early 1990s) to the ASC Q
supercomputer, the performance-per-square-foot only improved by 60-fold. This has resulted
in the construction of massive datacenters with exotic cooling facilities (and even, entirely
new buildings) to house these cluster supercomputers; thus leading to an extraordinarily high
total cost of ownership.
The main reason for this inefficiency is the exponentially increasing power requirements
of compute nodes, i.e., Moore’s Law for Power Consumption (Figure 1). When nodes draw
more power, they must be spaced out and aggressively cooled. Our own empirical data as
well as unpublished empirical data from a leading vendor indicates that the failure rate of a
compute node doubles with every 10◦C (18◦F) increase in temperature, and temperature is
proportional to power density. Thus, traditional cluster supercomputers, which make up over
80% of the Top500 Supercomputer List, require exotic cooling facilities; otherwise, they would
be so unreliable (due to overheating-induced failures) that they would be unavailable for use
by the application scientist.
For example, our 128-processor Linux cluster with dual 333-MHz Intel Pentium II proces-
sors failed on a weekly basis because it could not tolerate running in an 85◦F dusty warehouse
with no cooling facilities. Additional examples can be found in Table 1 [10].
To address these issues, we started by identifying low-power building blocks to construct
5

Cluster Systems # CPUs Reliability & Availability
ASCI Q 8,192 MTBI: 6.5 hours.ASCI White 8,192 MTBF: 5 hours (2001), 40 hours (2003).NERSC Seaborg 6,656 MTBI: 14 days. MTTR: 3.3 hoursPSC Lemieux 3,016 MTBI: 9.7 hrs. Availability: 98.3%Google ~15,000 MTBI: 1.2 hrs. Availability: ~100%
MTBI: mean time between interrupts = wall clock hours / # downtime periodsMTBF: mean time between failures
MTTR: mean time to restore = downtime hours / # downtime periods
Table 1: Reliability & Availability of Large-Scale Clusters
our energy-efficient Green Destiny [4, 16, 3], a 240-processor Beowulf cluster that fit in a
telephone booth (i.e., a footprint of five square feet) and sipped only 3200 watts when running
diskless, i.e., two hair dryers, but with performance equivalent to a 172-processor Cray T3E 900
when running Linpack. Green Destiny provided reliable compute cycles with no unscheduled
failures from April 2002 to April 2004, all while sitting in an 85◦F dusty warehouse at 7,400
feet above sea level — thus illustrating its ability to be moved out of the datacenter and
into an “office space” that does not have any special cooling facilities. This transformation
from datacenter cluster to office cluster ultimately led to a subsequent transformation into a
desktop cluster, as embodied by the Orion Multisystems DT-12.
2.2 Evolution
The evolution of Green Destiny into the Orion Multisystems DT-12 cluster workstation, i.e.,
personal desktop cluster (PDC), was largely based on the convergence of four trends: (i)
the rise of cluster-based high-performance systems, (ii) the maturation of open-source cluster
software, particularly Linux and MPI, (iii) the rapid obsolescence of the traditional worksta-
tion, e.g., Sun SPARCstation 10, and (iv) the widening performance gap between PCs and
supercomputers, as shown in Figure 2.
A PDC such as the Orion Multisystems DT-12 would begin to fill in the widening gap
between PC performance and supercomputer performance, but more importantly, it would
6

Widening Gap of Opportunity for a
Personal Desktop Cluster
Figure 2: Widening Performance Gap Between PCs and Supercomputers.
provide an interactive environment for the development of parallel codes by an individual
scientist or engineer. However, in order to deliver such a tightly-integrated PDC in the form
factor of a pizza box (a la the dual-processor Sun SPARCstation 10) and ensure unprecedented
reliability, one must pay particular attention to power consumption and density. The PDC
must also be a “cluster in a box” that is fully integrated in a pizza-box enclosure so that upon
delivery, the engineer or scientist simply needs to (i) unpack the PDC, (ii) plug-in power,
monitor, keyboard, and mouse, (iii) set-up the network interface to the PDC, (iv) transfer a
program to run on the PDC, and (v) mpirun the program — all in the span of 10-15 minutes.
In summary, we believe that there exists a clear need for a highly integrated cluster work-
station (or PDC) that is optimized for the engineer (or scientist) such that it provides a scalable
desktop environment, delivers high performance within the power envelope of a standard wall
outlet, and does not require any special cooling.
3 System Architecture
The Orion DT-12, as shown in Figure 3, is a personal desktop cluster (PDC) workstation that
contains 12 individual x86 compute nodes in a 24” x 18” x 4” (or one cubic foot) pizza-box
7

Figure 3: The DT-12 Personal Desktop Cluster Workstation.
enclosure. Collectively, these nodes provide the horsepower of a small supercomputer, the
administrative ease of a single-processor computer, and the low noise, heat, and power draw
of a conventional desktop.
Inside the case is a single board composed of twelve individual nodes on a private network,
as shown in Figure 4. Each compute node contains a Transmeta Efficeon processor running the
Linux operating system, its own memory and 1 Gbit/sec Ethernet interface, and optionally,
its own hard disk drive. The nodes share a power supply, cooling system, and external 10
Gbit/sec Ethernet network connection. (The head node provides an interface to the end user.)
Booting the DT-12 amounts to depressing the single power switch, located at the upper
right of the front panel. The entire DT-12 will then automatically boot in just over a minute.
The DT-12 exports the utmost in simplicity with only one power plug, one power switch,
one monitor connection, one keyboard, and one mouse. At load, it achieves 14 Gflops on
Linpack while drawing only 185 watts of power, i.e., less than two 100-watt light bulbs. Its
theoretical peak is 28 Gflops.
3.1 Hardware
Figure 4 shows the basic DT-12 PDC layout. Node 0, known as the head node, provides
an interface to the end user and controls jobs throughout the cluster. It hosts the main
system disk and optical storage. The other nodes are known as compute nodes, nodes that
are available to the head node for parallel computing. When idle, the head node can act as a
compute node.
The DT-12 PDC plugs directly into a standard 15-A office outlet with no special cooling
8

ymotanA draoB
rellortnoc naF
hctiws EgiG trop-21
trop 2/SP
)ylno edon daeh ot(dna trop laireS
rotcennoc oediv I-IVD
)ylno edon daeh ot(
srotcennoc gnikcats EgiG01
pam edoN
yarrA DEL metsySDEL rewoP draoB eulB
Co
mp
ute
No
de
1
He
ad
No
de
(No
de
0) C
om
pu
te N
od
e 5
Co
mp
ute
No
de
4
Co
mp
ute
No
de
9
Co
mp
ute
No
de
8
Co
mp
ute
No
de
3
Co
mp
ute
No
de
2
Co
mp
ute
No
de
7
Co
mp
ute
No
de
6
Co
mp
ute
No
de
11
Co
mp
ute
No
de 1
0
lanretxe EgiG
rotcennoc krowten
0009 ytiliboM noedaR
Figure 4: The DT-12 Integrated Motherboard.
9

or power requirements. The included I/O board provides video, keyboard and mouse, serial
port, USB, and fan control. The DT-12 also provides a DVD/CD-RW and one 3.5” hard drive
on the head node. The board can accommodate one 2.5” hard disk drive per each of the other
nodes, although disk drives on compute nodes are optional.
3.1.1 Ethernet Switch Fabric
The DT-12 nodes communicate internally via a 1 Gbit/sec Ethernet (1,000 Mbits/sec) switch
fabric controlled by an integrated 12-port non-blocking switch. For stacked systems, individual
DT-12s communicate using a 10 Gbits/sec (10,000 Mbits/sec) network. These fabrics are not
directly accessible by the user. A 1 Gbit/sec Ethernet controller provides external user-level
network access via a standard RJ-45 network access port located on the back of the DT-12.
This RJ-45 port is separate and distinct from the above-mentioned 10 Gbits/sec network.
3.2 Software
The DT-12 PDC operates as a single-system image (SSI) using software developed by Orion.
This enables the cluster to appear as monolithic as possible to the user — logging into indi-
vidual compute nodes is not normally necessary. The Orion distribution accomplishes this by
providing the same Linux kernel on all nodes, via a single OS installation on the head node
that is shared among all compute nodes. Each compute node locally runs commonly used
cluster frameworks such as rsh, Sun Grid Engine, and MPICH2.
Below is a bulleted enumeration of the DT-12 PDC software environment:
• Basic Operating System
– Fedora Linux core 2
– Version 2.6.6 kernel with Orion drivers
– Single hard drive NFS-mounted on all nodes
– Head-node video system with GNOME/X-windows
10

• Development Tools and Libraries
– gcc (v. 2.95.3) reference compiler; distcc (v. 2.14) distributed compiler
– atlas (v. 3.6.0) math library; fftw (v. 2.1.5) fast fourier transform
– MPICH2 (v. 0.96p2) message passing library on TCP/IP protocol stack
• Monitoring and Control Software
– ganglia (v. 2.5.6) cluster monitor with Orion-specific extensions
3.2.1 Basic Boot Process
From the perspective of the end user, the boot process for the DT-12 PDC is simple: turn-
on the master power-supply toggle switch on the back of the case and press the front power
button. In just over a minute, all nodes are booted, and the head node prompts for a username
and password on the display.
A more detailed elaboration of the actual boot process is as follows:
1. When power is applied, the head node performs a self-test and then loads its BIOS from
a system ROM. The head node initializes memory and then loads and starts Linux.
2. The head node uses the utility bus to sequentially power-on (or reset) nodes in the
system, without waiting for the nodes to boot.
3. All nodes boot automatically, first loading LinuxBIOS to configure memory and load
the Etherboot firmware, and then loading Linux from the internal network.
3.2.2 Configuring the PDC Environment
By default, Linux loads the GNOME desktop environment, based on X-windows. This en-
vironment contains many familiar constructs, including resizable windows, a menu bar with
drop-down or pop-up menus and a visible clock, and a configurable desktop.
11

3.2.3 Disks and File Systems
Linux partitions are created with the ext3 file system on all disks by default. On boot, the
head node serves the boot image and other required file systems to the compute nodes via
etherboot and NFS. /clusterfs and its parent directory /export/home are mounted as writable
file systems on all nodes. All file systems other than /clusterfs (and the local disk file system,
/var/tmp, for nodes with a local disk) are read-only on compute nodes. The Orion software
distribution implements NFS v3 over UDP. NFS settings include 8k reads/writes over NFS
to take advantage of MTU and Linux client/server behavior. A detailed description of the
standard Orion file systems is below.
File Hierarchy: Orion systems may have various disk/node allocations. There is always
at least one hard drive available in the system, residing on the head node. Another common
layout is with one hard drive per compute node. For compute nodes with hard drives, the
first 2 GBytes on each compute node is dedicated swap space, and the rest of the space on
those drives is for /var/tmp. The Orion file hierarchy has been designed with the intent of
allowing applications to work as efficiently as possible on any disk layout without modifying
the application or its configuration and to be compliant with relevant industry standards. The
Orion File Hierarchy Standard (FHS) is in conformance with the Linux Filesystem Standard
2.3 (http://www.pathname.com/fhs/).
Head-Node File-System Layout: Node 0 controls the system hard drive, which is required
on all Orion workstations. This drive contains system software for all nodes in the cluster as
well as a standard Linux directory tree (/usr, /etc, and so on).
Compute Node Layout: Each compute node has an FHS-compliant tree, with some
branches of the tree NFS-mounted from the head node, some branches mounted from a local
disk (if there is one), and others in RAMDisk. Note that all locally mounted Linux file system
directories are NFS-exported by the head node and mounted by compute nodes automatically.
Virtual File Systems: Virtual file systems manage and enhance the ability of NFS to
share data across all nodes simultaneously and in a coordinated manner. Their focus is on
12

performance and parallel access. Orion includes the open-source parallel virtual file system
PVFS2 in the standard software distribution.
4 Experiments and Discussion
In the previous section, we have described how the hardware and software architecture of the
Orion Multisystems DT-12 platform was designed to provide a scalable development tool. In
this section, we will compare scalability and overall performance of the DT-12 to the most
common development platform used today: a SMP workstation/server.
We chose this comparison due to several reasons. First and foremost, as discussed earlier
in our paper, as large-scale clusters have become shared resources, programmers have turned
to parallel code development on SMP-based platforms. A SMP machine can fit on one’s desk
without the need for special wall outlets or cooling facilities. Second, the DT-12 has similar
dimensions to typical SMP machines and uses a similar amount of power.
Our case study of an SMP workstation involves the Dell PowerEdge 2650, a dual processor
2U chassis machine. The Dell PowerEdge 2650 can be configured depending on a customer’s
needs. It is powered by dual Xeon processors between 2.0 GHz and 3.2 GHz each. There
are six memory slots available to each carry a up to a 2 GByte PC266 ECC DDR SDRAM
chip for a maximum RAM configuration of 12 GBytes. Five SCSI hard disk drive slots can
be filled with up to 146 GBytes Ultra320 SCSI disks for a total of 730 GBytes. The network
interface consists of two 1 Gbit/sec NICs.
Our PowerEdge 2650 was configured with dual 2.2 GHz Xeon processors, 1.5 GBytes of
RAM, and a Fujitsu 18.4 GByte 15000 RPM U160 SCSI drive. Each Xeon processor used
hyper-threading for a total of 4 virtual processors. A quick comparison of the DT-12 and the
PowerEdge 2650 in Table 2 illustrates some of the key hardware differences between the two
developmental platforms. The dimensions of the two platforms are nearly identical and the
maximum power draws are comparable.
We ran numerous experiments to support our claim that a personal desktop cluster work-
13

Platform Orion Multisystems DT-12 Dell PowerEdge 2650Dimensions 24(W) x 18(D) x 4(H) (in) 19(W) x 26(D) x 3.5(H) (in)
1 cubic foot ∼ 1.02 cubic feetMax Power 185.3 Watts 217.0 WattsProcessors 12 - 1.2 GHz Efficeon Processors 2 - 2.2 GHz Xeon ProcessorsMemory 1 GByte/Processor 1.5 GBytesNetwork 1 Gbit/sec NIC/Processor 2 - 1 Gbit/sec NICInterfacesStorage 80 GByte 5400 RPM IDE (Head) 18.4 GByte 15000 RPM SCSI drive
20 GByte 4200 RPM IDE (Other)
Table 2: Experimental Hardware Configuration
Platform Orion Multisystems DT-12 Dell PowerEdge 2650SPECint2000 526 792SPECfp2000 358 726
Table 3: SPEC CPU2000 Base Results
station, such as the Orion Multisystems DT-12, provides a more suitable development platform
for parallel codes versus the typical SMP workstation. In addition, we also provide some pure
performance comparisons to show that while the DT-12 is a scalable development platform,
it also provides good overall performance for small parallel application runs.
Our benchmarks include SPEC CPU2000, HPL, NAS-MPI, STREAMS-MPI, ttcp, bonnie,
and mpi-io-test. We interleave our pure performance tests with our scalability tests in our
experiments, as they are organized by computer subsystem (processor, memory, network, and
I/O).
4.1 CPU Performance
To get a feel of the performance of an Efficeon processor used in the DT-12, we began our
experiments with the SPEC CPU2000 benchmarks [12] using the latest Intel compiler (version
8.1) with the baseline optimization options -O3 -xW -ipo. Our base results, shown in Table
3, using the DT-12 were 526 for SPECint2000 and 358 for SPECfp2000. The results have not
been submitted to SPEC and are therefore unofficial. However, our tests were executed with
14

Platform Orion Multisystems DT-12 Dell PowerEdge 2650Ops/sec 14.17 Gflops 5.1 Gflops
Table 4: HPL Results
all of the rules necessary for qualifying for the official SPEC benchmarks. In our comparison,
we used the base published numbers from SPEC for the PowerEdge 2650.
According to the SPEC measurements, the integer performance of a 1.2-GHz Efficeon pro-
cessor is roughly equivalent to a 1.5-GHz Pentium 4 (which between a 515 to 534). However,
the floating-point performance of the Efficeon processor does not keep up with the 1.5-GHz
Pentium 4 (which between a 543 to 549 compared to the Efficeon’s 358). Instead, the Efficeon
is about the performance of a 1.0-GHz Pentium III in SPECfs2000. Notice that while the
CPU2000 test is mostly processor dependent, it also depends on the system memory architec-
ture and compiler. Hence, this comparison may somewhat boost the performance of Efficeon
as it has a large cache size (1 MByte).
Our next test, HPL [6], is a software package that is regarded as a freely available im-
plementation of the High Performance Computing Linpack Benchmark. It solves a (random)
dense linear system in double precision (64-bits) arithmetic on distributed-memory computers.
Using HPL requires an MPI 1.1 compliant implementation and either the Basic Linear
Algebra Subprograms (BLAS) or the Vector Signal Image Processing Library (VSIPL). Gen-
erally, HPL is considered scalable with respect to the number of processors used during testing
since its overall performance is mostly attributed to the system’s CPU.
Our HPL results in Table 4 indicate that the overall linear equation solving performance
of the DT-12 is nearly three times that of the PowerEdge 2650. Since the DT-12 has 12
processors compared to the 2 processors in the PowerEdge 2650, we can infer that a 2.2
GHz Xeon processor performs slightly more than twice as fast as a 1.2 GHz Efficeon in this
application.
In our final CPU test, we ran experiments using the NAS Parallel Benchmarks (NPB) [8].
We used the latest version, 3.2, of the NPB (specifically NPB3.2-MPI).
15

Class B WorkloadDT-12 PowerEdge 2650
4 8 9 12 4 8 9 12
FT 354.70 649.08 I/O I/O I/O I/OMG 605.56 1203.56 283.09 346.66SP 365.94 703.20 208.64 214.50LU 681.74 1466.66 374.46 417.98BT 1029.67 2018.45 814.64 858.07IS 21.15 32.97 29.45 28.33EP 14.72 29.52 33.26 44.29 17.22 17.28 17.53 17.78CG 172.96 357.51 72.13 191.24
Table 5: NAS Parallel Benchmarks Class B
Class A WorkloadDT-12 PowerEdge 2650
1 4 8 9 12 1 4 8 9 12
FT 143.29 287.84 543.37 286.14 361.20 347.42MG 97.42 359.49 1180.40 324.11 273.49 313.86SP 98.95 319.74 458.26 188.12 213.08 194.59LU 179.12 779.28 1521.10 325.47 419.88 419.46BT 268.56 946.81 1472.29 540.76 810.68 841.85IS 11.23 17.41 19.10 24.34 30.75 28.93EP 3.46 13.80 27.52 31.23 41.11 4.87 17.18 17.61 17.61 17.47CG 70.27 260.61 526.59 283.42 249.97 221.15
Table 6: NAS Parallel Benchmarks Class A
NPB2.4 consists of 5 kernels and 3 simulated application benchmarks (NPB3.2 adds in
a new benchmark called DT which we did not test). Together they mimic the computation
and data movement characteristics of large-scale computational fluid dynamics (CFD) appli-
cations. NPB is based on Fortran and uses the MPI standard. All of the tests were written in
Fortran except for the IS benchmark. These implementations, which are intended to be run
with little or no tuning, approximate the performance that a typical user can expect from a
portable parallel program in a distributed memory computing system.
We obtained the results in Table 5 and Table 6 from the class B and class A workload
respectively. Due to process restrictions in some of the tests, we could only get results for
certain numbers of processes. For example, SP and BT require that the number of processors
16

Test Operation Bytes/Iteration Floating Point Operations/IterationCOPY a(i) = b(i) 16 0SCALE a(i) = q*b(i) 16 1SUM a(i) = a(i)+b(i) 24 1TRIAD a(i) = b(i)+q*c(i) 24 2
Table 7: Various STREAM tests
0
2000
4000
6000
8000
10000
12000
0 2 4 6 8 10 12
Agg
rega
te b
andw
idth
(M
Byt
es/s
ec)
Processes
(a)
Orion - Max ScaleOrion - Max CopyOrion - Max Add
Orion - Max Triad
800
900
1000
1100
1200
1300
1400
1500
0 2 4 6 8 10 12
Agg
rega
te b
andw
idth
(M
Byt
es/s
ec)
Processes
(b)
Dell - Max ScaleDell - Max CopyDell - Max Add
Dell - Max Triad
Figure 5: STREAMS-MPI achieves expected linear speedup for the DT-12 (a), unlink thePowerEdge 2650 (b).
be a square of an integer, therefore we have results from 1, 4, and 9 processors.
In general, as the number of processes used scales up, the DT-12 scales nearly linearly
in the LU, BT, EP, and CG tests. The FT, MG, SP, and IS tests do scale to some degree
on the DT-12, although not linearly. However, some of these tests are dependent on system
components besides the processor and therefore are not expected to scale linearly.
In comparison, the PowerEdge 2650 does not achieve linear scalability on any of the 8 NPB
tests and would provide poor feedback on demonstrating whether a parallel code is achieving
an expected linear speedup.
4.2 Memory Performance
Developed at the University of Virginia, the STREAM benchmark [13] measures the sustain-
able memory bandwidth and the corresponding computation rate for simple vector kernels.
The STREAM benchmark has four different components which are summarized in Table 7.
17

We used the MPI version of STREAM in order to test the scalability of the memory
subsystem. Each test was compiled with MPICH2 [7] and run three times with the best run
used in our results. In our results in Figure 5a, the DT-12 achieves linear scalability while the
PowerEdge 2650 in Figure 5b struggles to get any speedup. While it is a two-way SMP and
each processor has hyper-threading (thereby having 4 virtual processors), we hardly even see
a speedup between 1 to 4 processors on the PowerEdge 2650.
4.3 Network Performance
Our tests of the internal networks of the machines were limited to the DT-12. Testing the
network bandwidth between processors of the PowerEdge 2650 would only measure the per-
formance of the system bus speed and memory instead of the true network performance. A
scalable network in a personal desktop cluster is important tool in parallel algorithm devel-
opment.
We begin measuring the network performance of the DT-12 using the NetPIPE benchmark
[11]. NetPIPE is a protocol independent performance tool that performs simple ping-pong
tests, bouncing messages of increasing size between two processes across a network. Each data
point involves many ping-pong tests to provide an accurate timing.
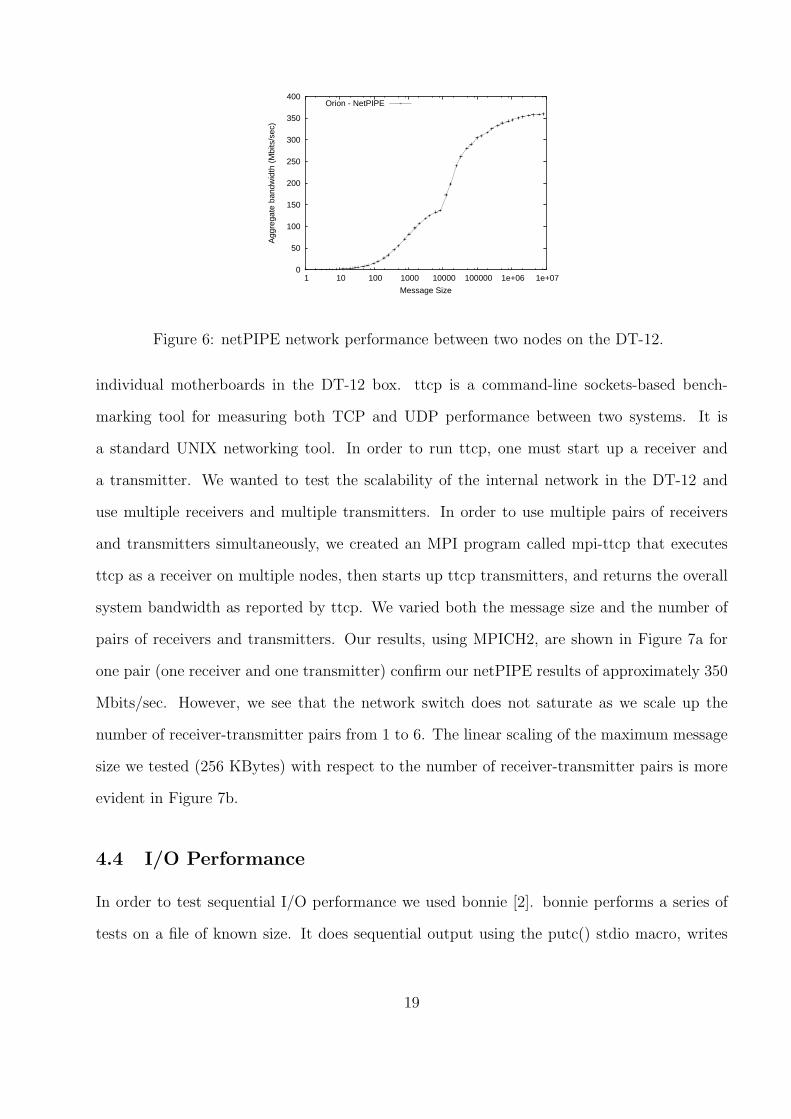
Figure 6 depicts the NetPIPE’s latency/bandwidth test for various setting (the figures
only show the bandwidth with respect to different message sizes). When running NetPIPE,
the DT-12 used MPICH2 for communication.
The saturated bandwidth for DT-12 is only about 350 Mbits/sec. This number is much
lower than expected given that the motherboards inside the DT-12 are connected through the
1 Gbit/sec Ethernet. The manufacturer, Orion Multisystems, has informed us that the PCI
bus scheduling algorithm, a lower performing mobile computing southbridge, and the 32-bit
33 MHz PCI bus all contribute to reducing maximum network bandwidth between nodes to
our measured network saturated performance of about 350 Mbits/sec.
Our second network test, ttcp, validates the 350 Mbits/sec communication link between
18
0
50
100
150
200
250
300
350
400
1 10 100 1000 10000 100000 1e+06 1e+07A
ggre
gate
ban
dwid
th (
Mbi
ts/s
ec)
Message Size
Orion - NetPIPE
Figure 6: netPIPE network performance between two nodes on the DT-12.
individual motherboards in the DT-12 box. ttcp is a command-line sockets-based bench-
marking tool for measuring both TCP and UDP performance between two systems. It is
a standard UNIX networking tool. In order to run ttcp, one must start up a receiver and
a transmitter. We wanted to test the scalability of the internal network in the DT-12 and
use multiple receivers and multiple transmitters. In order to use multiple pairs of receivers
and transmitters simultaneously, we created an MPI program called mpi-ttcp that executes
ttcp as a receiver on multiple nodes, then starts up ttcp transmitters, and returns the overall
system bandwidth as reported by ttcp. We varied both the message size and the number of
pairs of receivers and transmitters. Our results, using MPICH2, are shown in Figure 7a for
one pair (one receiver and one transmitter) confirm our netPIPE results of approximately 350
Mbits/sec. However, we see that the network switch does not saturate as we scale up the
number of receiver-transmitter pairs from 1 to 6. The linear scaling of the maximum message
size we tested (256 KBytes) with respect to the number of receiver-transmitter pairs is more
evident in Figure 7b.
4.4 I/O Performance
In order to test sequential I/O performance we used bonnie [2]. bonnie performs a series of
tests on a file of known size. It does sequential output using the putc() stdio macro, writes
19

0
500
1000
1500
2000
2500
1 10 100 1000 10000 100000 1e+06
Agg
rega
te b
andw
idth
(M
bits
/sec
)
Message Size
(a)
1 pair 2 pairs3 pairs4 pairs5 pairs6 pairs
200
400
600
800
1000
1200
1400
1600
1800
2000
2200
1 2 3 4 5 6
Agg
rega
te b
andw
idth
(M
bits
/sec
)
Number of Pairs
(b)
256 KBytes Message Size
Figure 7: Internal network scalability of the DT-12 is linear for various message sizes (a).Even at the our largest message test size (256 KBytes), network bandwidth remains scalable(b).
0
5000
10000
15000
20000
25000
30000
35000
40000
45000
50000
55000
I/O b
andw
idth
(K
Byt
es/s
ec)
(a)
Orion NFS CharOrion Ext3 Char
Dell Ext3 CharOrion NFS BlockOrion Ext3 Block
Dell Ext3 BlockOrion NFS RewriteOrion Ext3 Rewrite
Dell Ext3 Rewrite
10000
15000
20000
25000
30000
35000
40000
45000
50000
I/O b
andw
idth
(K
Byt
es/s
ec)
(b)
Orion NFS CharOrion Ext3 Char
Dell Ext3 CharOrion NFS BlockOrion Ext3 Block
Dell Ext3 Block
Figure 8: Results from bonnie for sequential output (a) and sequential input (b).
20

blocks using the write() command, and rewrites blocks of size 16 KBytes (reads the blocks
into memory, dirties them, and writes them back). It does sequential input using getc() and
the read() command. The test results can be significantly affected by the amount of system
memory available since writes are buffered on most file systems. Both of our test platforms
were using ext3, which certainly buffers write requests whenever memory is available. We
used the largest file size possible on the local file system (2047 MBytes) in our tests. Since
this is a sequential I/O test, the DT-12 can only use a single processor and a single memory (1
GByte) for file system buffering. The PowerEdge 2650 has both its processors available and
1.5 GBytes of memory for I/O buffering. Since the file size is 2047 MBytes, more of the file
I/O can be buffered for the PowerEdge 2650, resulting in higher I/O performance (because it
is mostly writing to memory and not to the actual hard disk). For the Orion DT-12, we test
I/O access to the a node’s local storage through ext3 and to remote storage on another node
using NFS. On the PowerEdge 2650, testing NFS performance doesn’t make sense as both
processors have access to their local disks.
The results for sequential output and sequential input are shown in Figure 8. As expected,
there are certain cases, for instance the block write and the block read, that are much higher for
the PowerEdge 2650 due to the increased buffering capabilities from having more memory per
processor. When bonnie rewrites data through NFS on the DT-12, we see that its performance
really suffers due to fetching data over the network and rewriting it.
Our scalable I/O test was a common parallel I/O test from PVFS2 test suite called mpi-
io-test. mpi-io-test simply writes 16 MBytes per processor into a shared file and reads it
back through the MPICH2 ROMIO [15] interface. We setup the PVFS2 file system [9], a
next-generation parallel file system for Linux clusters, on the nodes to attain the high possible
bandwidth. For the Orion platform, we configured all 12 nodes as I/O servers, with one node
doubling as the metadata server. For the PowerEdge 2650 platform, we configured 2 processes
as I/O servers, with one doubling as the metadata server.
Our results, shown in Figure 9, indicate the scalability of the Orion DT-12. As we scaled
up the number of processors, we see close to linear speedup in I/O bandwidth for the DT-12.
21

0
200
400
600
800
1000
1200
1400
1600
1800
2000
0 2 4 6 8 10 12A
ggre
gate
ban
dwid
th (
MB
its/s
ec)
Processes
Orion - ReadOrion - Write
Dell - ReadDell - Write
Figure 9: Results from mpi-io-test for both read and write.
Cluster CPU Cluster Memory HPL Perf. PowerHPL Perf/PowerName Topology (GB) (GFlops) (W) (MFlops/W)
PowerEdge 2.2 GHz Intel 1 × 2P 1.50 5.1 217.0 23.502650 Xeon
1.2 GHzDT-12 Transmeta 12 × 1P 12.00 13.80 185.3 74.47
Efficeon
Table 8: Performance, Power, and Performance/Power for our development platforms
However, the PowerEdge 2650 I/O bandwidth is pretty constant between 1 and 12 processes.
A personal desktop cluster, such as the DT-12, is very capable for parallel I/O development
(i.e. writing parallel codes that use MPI-IO).
4.5 Power Efficiency
A personal desktop cluster must not have special power requirements (i.e. should be able to
be plugged into a normal wall socket). We evaluated the power consumption of the DT-12
versus the PowerEdge 2650 using the HPL benchmark. In order to measure the system’s
power consumption, we used a Yokogawa digital power meter that was plugged into the same
power strip as the system. The power meter continuously samples the instantaneous wattage
at a rate of 50 kHz and delivers the readings to the profiling computing.
The results of HPL running with the power meter plugged in are shown in Table 8. With
22

regard to power consuming components, the DT-12 has 12 processors, 12 GBytes of memory,
12 hard disks and an internal network compared to the PowerEdge’s 2 processors, 1.5 GBytes
of memory, a single disk and no internal network. Surprisingly, despite having many more
power consuming components, the Transmeta Efficeon processors of the DT-12 are very power
efficient, and enable the DT-12 to actually consume slightly less power than the PowerEdge
2650. The DT-12 also provides a Performance/Power ratio that is over three times more
efficient than the PowerEdge 2650. Both platforms are well under the maximum wattage used
in normal wall sockets.
5 Conclusion
We have discussed the evolution of the personal desktop cluster and evaluated its performance
as a scalable platform for parallel code development. Our experiments have clearly shown
that a personal desktop cluster is a much more useful tool for parallel code development
and running parallel applications than a SMP workstation. Most of our experiments using
the DT-12 demonstrated linear scalability with regards to processors, memory, network, and
I/O. The PowerEdge 2650, our SMP case study, did not fare as well, achieving limited or no
scalability as we increased the parallelism of our experiments.
The Orion Multisystems DT-12, our case study, is simple to use and can be running multi-
process MPI jobs in minutes out of the box. The DT-12 is a useful tool for developers that
consumes less power than a typical SMP workstation while occupying about the same amount
of desktop space. We expect that personal desktop clusters, such as the DT-12, will rise in
popularity to fill the widening performance gap between PCs and supercomputers in the near
future.
23

References
[1] D. J. Becker, T. Sterling, D. Savarese, J. E. Dorband, U. A. Ranawake, and C. V.
Packer. BEOWULF: A parallel workstation for scientific computation. In Proc. of the
1995 International Conference on Parallel Processing (ICPP), pages 11–14, August 1995.
[2] Bonnie home page. http://www.textuality.com/bonnie/.
[3] W. Feng. Making a case for efficient supercomputing. ACM Queue, 1(7):54–64, October
2003.
[4] W. Feng, M. Warren, and E. Weigle. The bladed beowulf: A cost-effective alternative to
traditional beowulfs. In Proc. of the IEEE Int’l Conf. on Cluster Computing, September
2002.
[5] I. Foster and C. Kesselman. Globus: A metacomputing infrastructure toolkit. The
International Journal of Supercomputer Applications and High Performance Computing,
11(2):115–128, Summer 1997.
[6] Hpl home page. http://www.netlib.org/benchmark/hpl/.
[7] Mpich2 home page. http://www-unix.mcs.anl.gov/mpi/mpich2/.
[8] Nas parallel benchmarks home page. http://www.nas.nasa.gov/Software/NPB/.
[9] Pvfs2 home page. http://www.pvfs.org/pvfs2/.
[10] D. Reed. High-end computing: The challenge of scale. Director’s Colloquium, May 2004.
[11] Q. Snell, A. Mikler, and J. Gustafson. Netpipe: A network protocol independent perfor-
mace evaluator, 1996.
[12] Spec cpu2000 home page. http://www.spec.org/osg/cpu2000/.
[13] Sustainable memory bandwidth in current high performance computers.
tt http://www.cs.virginia.edu/stream/ref.html.
24

[14] D. Thain, T. Tannenbaum, and M. Livny. Condor and the Grid. In F. Berman, G. Fox,
and T. Hey, editors, Grid Computing: Making the Global Infrastructure a Reality. John
Wiley & Sons, Inc., December 2002.
[15] Rajeev Thakur, William Gropp, and Ewing Lusk. On implementing MPI-IO portably
and with high performance. In Proceedings of the Sixth Workshop on Input/Output in
Parallel and Distributed Systems, pages 23–32, 1999.
[16] M. Warren, E. Weigle, and W. Feng. High-density computing: A 240-processor beowulf
in one cubic meter. In Proc. of SC2002: High-Performance Networking & Computing
Conf., November 2002.
25


![SCANNING TUTORIAL - PARSONS SSCE · SCANNING TUTORIAL. open EPSON scan utility on desktop. select Professional Mode. ... OptiTex Adobe Acrobat Distiller X] Adobe …](https://img.pdfslide.us/doc/110x75/5b7704017f8b9a515a8c24df/scanning-tutorial-parsons-ssce-scanning-tutorial-open-epson-scan-utility.jpg)