Embed Size (px)
Citation preview
RPS Research into Design: Supporting Multiple Facets of Product Development “icord2009-chap” 2004/12/27 152
7ASSESSING THE STRUCTURALCRASHWORTHINESS OF ATHREE-WHEELER PASSENGERVEHICLE
K. M. Srikanth∗ and Raghu V. Prakash†
∗Member R&D, (Body & Chassis), TVS Motor Company Ltd, Harita, Hosur 635 109.E-mail: [email protected]†Associate Professor Department of Mechanical Engineering, Indian Institute of Technology-Madras,Chennai 600 036. E-mail: [email protected]
Over the last few decades, three wheelers, popularly termed as auto rickshaws, are gaining popularity in thecommuting world due to the driving conditions prevailing all over the world. With the traffic increasing everyyear, esp. in developing countries like India, the proportion of three wheelers on the road is also increasing, inview of their maneuverability, easy drive through narrow lanes and operating cost considerations. Moreover,as the average speed of travel of these vehicles increases, but at the same time, the design objective is for alow cost, light weight and high payload, and greater acceleration capacity three wheelers, makes a concern forsafety. Other than some basic safety features, three wheelers are not evaluated for crash worthiness. It may benoted that the crash regulations were mostly for car segment, and as such the regulation for a three wheeler isnot in existence.
Primarily, the crashworthiness has been studied by testing, supported by analytical methods that con-sider simple linear strength of material. Crash worthiness experimentation is very expensive; but, with theadvancement of computer hardware and software, several analytical design capabilities have evolved, provid-ing engineers with a variety of tools to design modern vehicle structures that can meet the growing customerdemands for better crashworthiness performance. The scope of this paper is to assess the structural crashwor-thiness of a three wheeler passenger auto rickshaw, considering the frontal and rear impact collision usingHyper worksTM, Hyper crashTM and RadiossTM .
1. INTRODUCTIONThe need for crash simulations with high degrees of accuracy and robustness is becoming increas-ingly important for use in parametric studies and early design analysis. The numerical simulation alsoenables new design concepts to be evaluated where there is a need to establish an optimum designwith an interaction between materials and structural forms. In order to reduce the new product devel-opment time, it is necessary to apply non-linear finite element (FE) analysis to design and evaluate thecrashworthiness of the final product.
With the increase in traffic every year, the proportion of three wheelers on road is also gettingincreased. Figure 1 shows the data on road accident deaths by type of vehicles (percentage share), ofwhich three-wheeler accidents contributes up to five percentage of the overall road accident deaths.
Vehicle Crashworthiness: Crashworthiness is the ability of the vehicle to protect the occupant duringan impact. At present, most of the vehicle bodies are built primarily with stamped steel panels andjoined by welding and fastening techniques. Vehicle structures, apart from providing protection to theoccupants, also control the crash deceleration pulse to a level below the upper limit of human tolerance.A crash deceleration pulse (Energy absorption) with an early peak in time and a gradual decay is morebeneficial for protection of a restrained occupant. Generally, vehicle collisions are classified as frontal,side and rear impact, with majority of injuries due to frontal impact, followed by rear impact and sideimpact.
152
RPS Research into Design: Supporting Multiple Facets of Product Development “icord2009-chap” 2004/12/27 153
Assessing the Structural Crashworthiness of a Three-wheeler Passenger Vehicle 153
Figure 1. Road accidents by type of vehicle.1
2. SURVEY ON VEHICLE IMPACTTo cope with the increasing demands of the customer, the modern auto rickshaws are driven at higherspeed and hence safety is a concern, as accidents can be fatal. In reality, vehicle collisions are uniquedynamic events where the vehicle may collide with another vehicle of similar or different shape,stiffness and mass; or it may collide with another stationary object. Some of the three wheeler autorickshaws collisions are classified and shown below
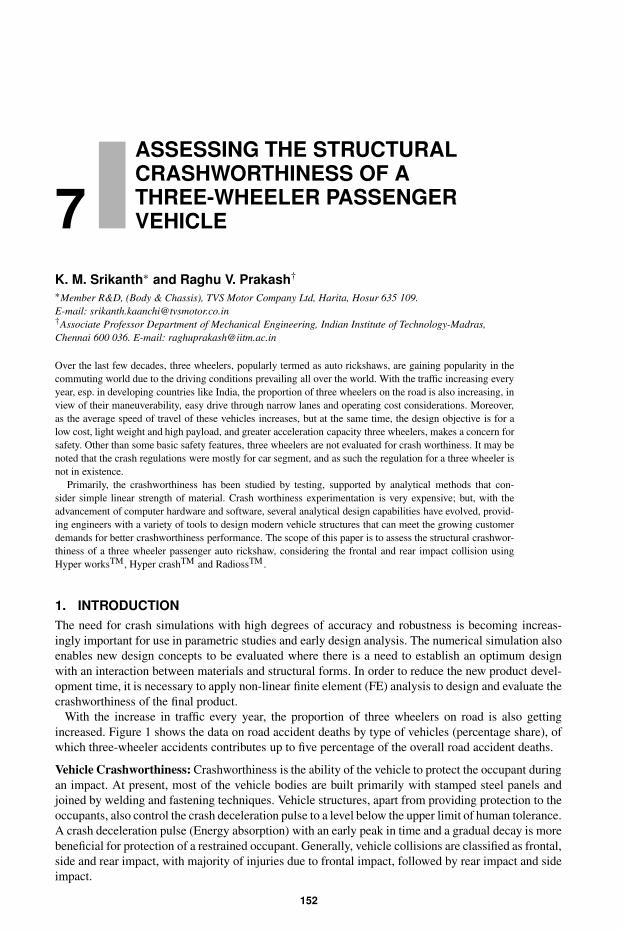
Frontal Collision: A frontal collision is one where the front ends of two vehicles hit each other. Thishas the potential for the highest crash energy. In the case shown in Figure 2, the vehicle is hit throughits front wheel steering system.
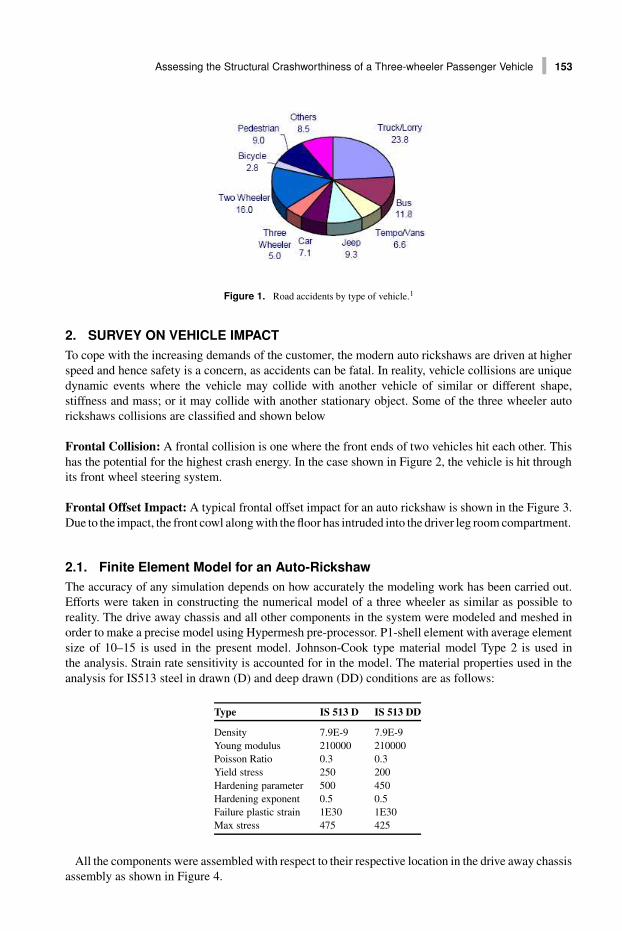
Frontal Offset Impact: A typical frontal offset impact for an auto rickshaw is shown in the Figure 3.Due to the impact, the front cowl along with the floor has intruded into the driver leg room compartment.
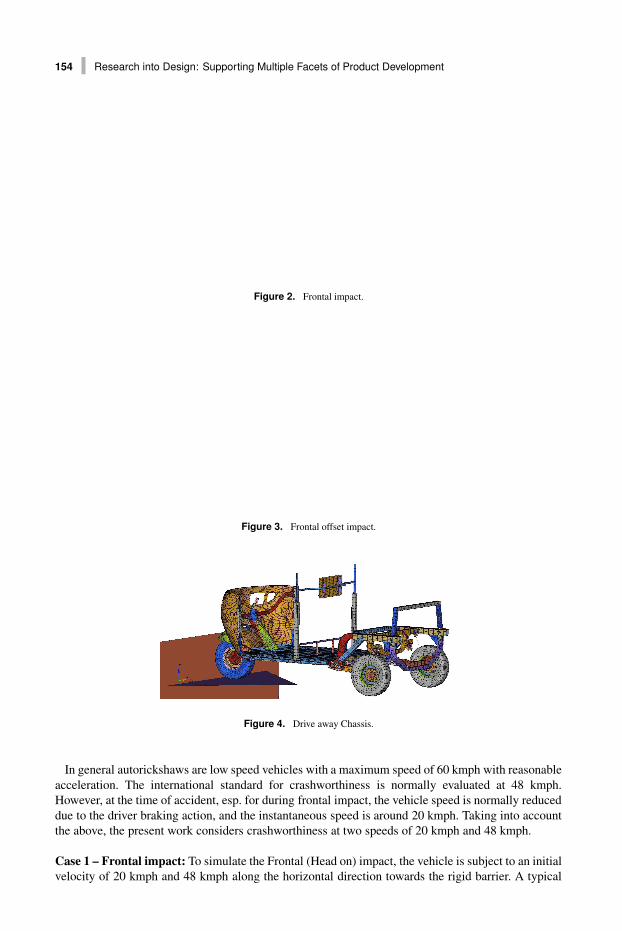
2.1. Finite Element Model for an Auto-RickshawThe accuracy of any simulation depends on how accurately the modeling work has been carried out.Efforts were taken in constructing the numerical model of a three wheeler as similar as possible toreality. The drive away chassis and all other components in the system were modeled and meshed inorder to make a precise model using Hypermesh pre-processor. P1-shell element with average elementsize of 10–15 is used in the present model. Johnson-Cook type material model Type 2 is used inthe analysis. Strain rate sensitivity is accounted for in the model. The material properties used in theanalysis for IS513 steel in drawn (D) and deep drawn (DD) conditions are as follows:
Type IS 513 D IS 513 DD
Density 7.9E-9 7.9E-9Young modulus 210000 210000Poisson Ratio 0.3 0.3Yield stress 250 200Hardening parameter 500 450Hardening exponent 0.5 0.5Failure plastic strain 1E30 1E30Max stress 475 425
All the components were assembled with respect to their respective location in the drive away chassisassembly as shown in Figure 4.
RPS Research into Design: Supporting Multiple Facets of Product Development “icord2009-chap” 2004/12/27 154
154 Research into Design: Supporting Multiple Facets of Product Development
Figure 2. Frontal impact.
Figure 3. Frontal offset impact.
Figure 4. Drive away Chassis.
In general autorickshaws are low speed vehicles with a maximum speed of 60 kmph with reasonableacceleration. The international standard for crashworthiness is normally evaluated at 48 kmph.However, at the time of accident, esp. for during frontal impact, the vehicle speed is normally reduceddue to the driver braking action, and the instantaneous speed is around 20 kmph. Taking into accountthe above, the present work considers crashworthiness at two speeds of 20 kmph and 48 kmph.
Case 1 – Frontal impact: To simulate the Frontal (Head on) impact, the vehicle is subject to an initialvelocity of 20 kmph and 48 kmph along the horizontal direction towards the rigid barrier. A typical
RPS Research into Design: Supporting Multiple Facets of Product Development “icord2009-chap” 2004/12/27 155
Assessing the Structural Crashworthiness of a Three-wheeler Passenger Vehicle 155
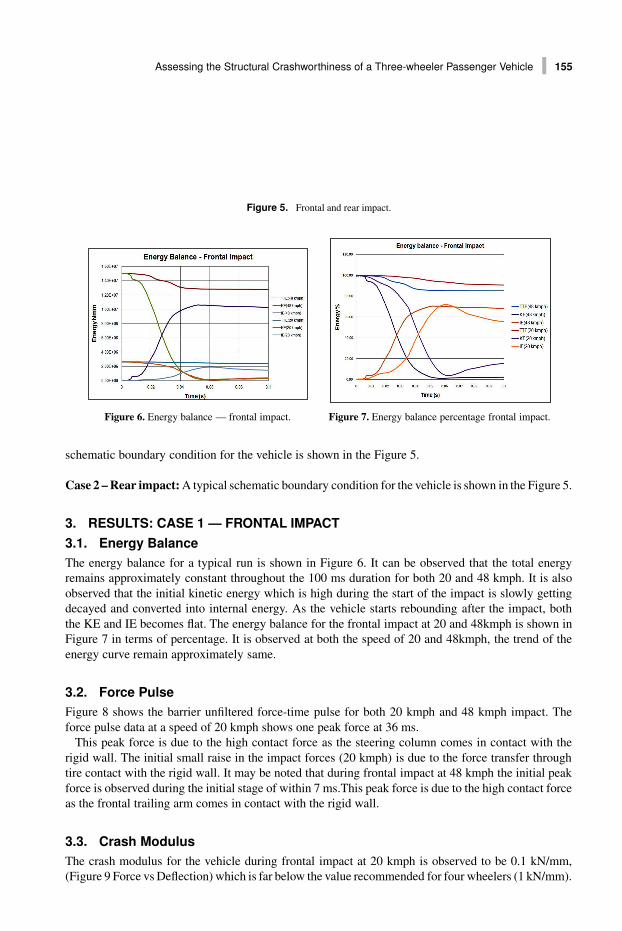
Figure 5. Frontal and rear impact.
Figure 6. Energy balance — frontal impact. Figure 7. Energy balance percentage frontal impact.
schematic boundary condition for the vehicle is shown in the Figure 5.
Case 2 – Rear impact: A typical schematic boundary condition for the vehicle is shown in the Figure 5.
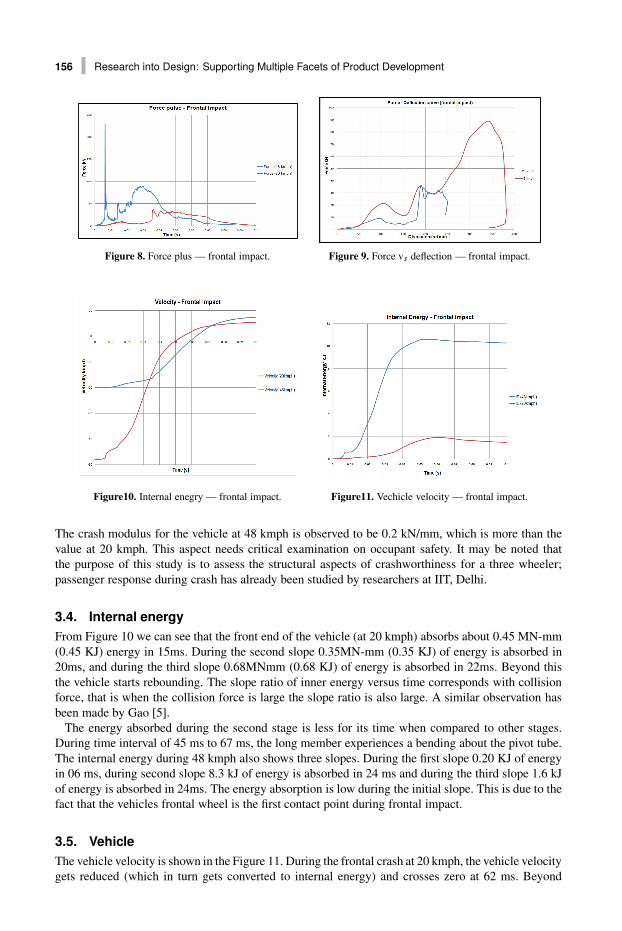
3. RESULTS: CASE 1 — FRONTAL IMPACT3.1. Energy BalanceThe energy balance for a typical run is shown in Figure 6. It can be observed that the total energyremains approximately constant throughout the 100 ms duration for both 20 and 48 kmph. It is alsoobserved that the initial kinetic energy which is high during the start of the impact is slowly gettingdecayed and converted into internal energy. As the vehicle starts rebounding after the impact, boththe KE and IE becomes flat. The energy balance for the frontal impact at 20 and 48kmph is shown inFigure 7 in terms of percentage. It is observed at both the speed of 20 and 48kmph, the trend of theenergy curve remain approximately same.
3.2. Force PulseFigure 8 shows the barrier unfiltered force-time pulse for both 20 kmph and 48 kmph impact. Theforce pulse data at a speed of 20 kmph shows one peak force at 36 ms.
This peak force is due to the high contact force as the steering column comes in contact with therigid wall. The initial small raise in the impact forces (20 kmph) is due to the force transfer throughtire contact with the rigid wall. It may be noted that during frontal impact at 48 kmph the initial peakforce is observed during the initial stage of within 7 ms.This peak force is due to the high contact forceas the frontal trailing arm comes in contact with the rigid wall.
3.3. Crash ModulusThe crash modulus for the vehicle during frontal impact at 20 kmph is observed to be 0.1 kN/mm,(Figure 9 Force vs Deflection) which is far below the value recommended for four wheelers (1 kN/mm).
RPS Research into Design: Supporting Multiple Facets of Product Development “icord2009-chap” 2004/12/27 156
156 Research into Design: Supporting Multiple Facets of Product Development
Figure 8. Force plus — frontal impact. Figure 9. Force vs deflection — frontal impact.
Figure10. Internal enegry — frontal impact. Figure11. Vechicle velocity — frontal impact.
The crash modulus for the vehicle at 48 kmph is observed to be 0.2 kN/mm, which is more than thevalue at 20 kmph. This aspect needs critical examination on occupant safety. It may be noted thatthe purpose of this study is to assess the structural aspects of crashworthiness for a three wheeler;passenger response during crash has already been studied by researchers at IIT, Delhi.
3.4. Internal energyFrom Figure 10 we can see that the front end of the vehicle (at 20 kmph) absorbs about 0.45 MN-mm(0.45 KJ) energy in 15ms. During the second slope 0.35MN-mm (0.35 KJ) of energy is absorbed in20ms, and during the third slope 0.68MNmm (0.68 KJ) of energy is absorbed in 22ms. Beyond thisthe vehicle starts rebounding. The slope ratio of inner energy versus time corresponds with collisionforce, that is when the collision force is large the slope ratio is also large. A similar observation hasbeen made by Gao [5].
The energy absorbed during the second stage is less for its time when compared to other stages.During time interval of 45 ms to 67 ms, the long member experiences a bending about the pivot tube.The internal energy during 48 kmph also shows three slopes. During the first slope 0.20 KJ of energyin 06 ms, during second slope 8.3 kJ of energy is absorbed in 24 ms and during the third slope 1.6 kJof energy is absorbed in 24ms. The energy absorption is low during the initial slope. This is due to thefact that the vehicles frontal wheel is the first contact point during frontal impact.
3.5. VehicleThe vehicle velocity is shown in the Figure 11. During the frontal crash at 20 kmph, the vehicle velocitygets reduced (which in turn gets converted to internal energy) and crosses zero at 62 ms. Beyond
RPS Research into Design: Supporting Multiple Facets of Product Development “icord2009-chap” 2004/12/27 157
Assessing the Structural Crashworthiness of a Three-wheeler Passenger Vehicle 157
this, the vehicle starts rebounding from the rigid wall. The coefficient of restitution is calculated to be0.36. During the vehicle velocity of 48 kmph the velocity gets reduced and crosses zero at 54 ms. Thecoefficient of restitution is calculated to be 0.11, which shows that at higher speed there is an increasein the vehicles inelastic behavior.
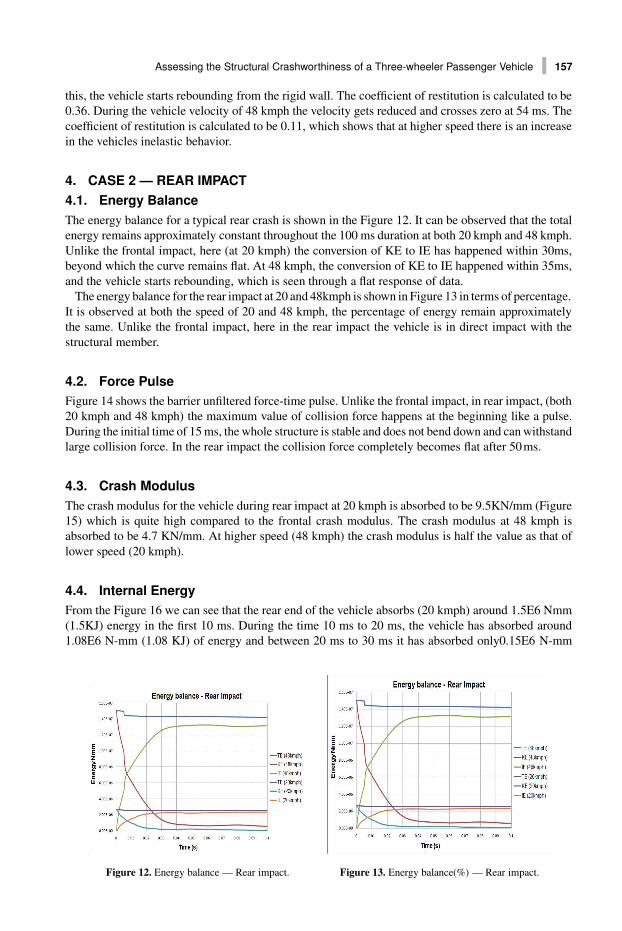
4. CASE 2 — REAR IMPACT4.1. Energy BalanceThe energy balance for a typical rear crash is shown in the Figure 12. It can be observed that the totalenergy remains approximately constant throughout the 100 ms duration at both 20 kmph and 48 kmph.Unlike the frontal impact, here (at 20 kmph) the conversion of KE to IE has happened within 30ms,beyond which the curve remains flat. At 48 kmph, the conversion of KE to IE happened within 35ms,and the vehicle starts rebounding, which is seen through a flat response of data.
The energy balance for the rear impact at 20 and 48kmph is shown in Figure 13 in terms of percentage.It is observed at both the speed of 20 and 48 kmph, the percentage of energy remain approximatelythe same. Unlike the frontal impact, here in the rear impact the vehicle is in direct impact with thestructural member.
4.2. Force PulseFigure 14 shows the barrier unfiltered force-time pulse. Unlike the frontal impact, in rear impact, (both20 kmph and 48 kmph) the maximum value of collision force happens at the beginning like a pulse.During the initial time of 15 ms, the whole structure is stable and does not bend down and can withstandlarge collision force. In the rear impact the collision force completely becomes flat after 50 ms.
4.3. Crash ModulusThe crash modulus for the vehicle during rear impact at 20 kmph is absorbed to be 9.5KN/mm (Figure15) which is quite high compared to the frontal crash modulus. The crash modulus at 48 kmph isabsorbed to be 4.7 KN/mm. At higher speed (48 kmph) the crash modulus is half the value as that oflower speed (20 kmph).
4.4. Internal EnergyFrom the Figure 16 we can see that the rear end of the vehicle absorbs (20 kmph) around 1.5E6 Nmm(1.5KJ) energy in the first 10 ms. During the time 10 ms to 20 ms, the vehicle has absorbed around1.08E6 N-mm (1.08 KJ) of energy and between 20 ms to 30 ms it has absorbed only0.15E6 N-mm
Figure 12. Energy balance — Rear impact. Figure 13. Energy balance(%) — Rear impact.
RPS Research into Design: Supporting Multiple Facets of Product Development “icord2009-chap” 2004/12/27 158
158 Research into Design: Supporting Multiple Facets of Product Development
(0.15 KJ) of energy. As such the whole vehicle has absorbed about 2.25E6 N-mm (2.25KJ) of energy.The slope ratio of inner energy versus time corresponds with collision force, that is when the collisionforce is large the slope ratio is also large [5]. The internal energy during 48 kmph also shows threeslopes. During the first slope 5 KJ of energy in 05 ms, during second slope 5.5 kJ of energy is absorbedin 21 ms and during the third slope 0.5 kJ of energy is absorbed in 12 ms. The energy absorption islow during the third slope. This is due to the fact that after 35 ms the vehicle becomes unstable due tobending.
4.5. Vehicle VelocityThe vehicles velocity is shown in the Figure 17. During the rear crash, the vehicle velocity gets reduced(which in turn gets converted to internal energy) and crosses zero at approximately 30 ms. Beyondthis the vehicle starts rebounding from the rigid wall. The coefficient of restitution is calculated to be0.1. During the vehicle velocity of 48 kmph the velocity gets reduced and crosses zero at 36 ms. Thecoefficient of restitution is calculated to be 0.17.
5. RESULTS: FRONTAL IMPACT1. The frontal crash modulus is only 1/10th of the crash modulus for a mid size car segment at 20
kmph. The crash modulus is double at speed of 48 kmph
Figure 14. Force plus rear impact. Figure 15. Force vs deflection — rear impact.
Figure 16. Internal energy — rear impact. Figure 17. Velocity — rear impact.
RPS Research into Design: Supporting Multiple Facets of Product Development “icord2009-chap” 2004/12/27 159
Assessing the Structural Crashworthiness of a Three-wheeler Passenger Vehicle 159
2. Unlike cars, there is no front bumper for the auto rickshaws and hence no frontal energy absorb-ing member. This can be improved either by having foam filling in between cowl bottom andreinforcement (closed section) or having a corrugated section inside the long members.
3. To improve the crash worthiness, the initial slope of the force curve has to be high, which in turngets reflected in the crash modulus
4. The initial force transition has to be increased by providing an energy absorbing zone.5. The coefficient of restitution for frontal impact is more when compared to rear impact.
5.1. Rear Impact1. The rear crash modulus is much higher than frontal crash.2. The initial slope is high thereby higher force is absorbed3. The coefficient of restitution for rear impact is having good inelastic collision when compared to
front impact.
6. FUTURE WORKThe present work evaluated the crash behavior of a three wheeler drive away chassis by dynamicanalysis
• This work can be extended to evaluate the crash behavior for the whole vehicle, including wind-shield assembly, cabin assembly and soft top assembly i.e. lumped mass analysis can be made toset of independent parts.
• To assess the safety of the vehicle due to fuel tank leakage during rear impact.• Effect of HAZ (Heat affected zone) due to welding in the crash behavior.• To verify these results with data obtained from actual testing.
ACKNOWLEDGEMENTSThe first author would like to thank Dr. Jabez Dhinakar, Mr. M. Kannan and Mr. Arokia Jeyaraj ofTVS Motors for the help and support extended during the project work.
REFERENCES[1] Dinesh Mohan,: November : 2006, Simba india priority workshop – IIT Delhi[2] www.http://ncrb.nic.in/ADSI2006/Suicides06.pdf[3] S Kokkulaa et al: 2006, Offset impact behaviour of bumper beam–longitudinal systems: numerical simulations,
International Journal of Crash 11(4), pp. 317–336.[4] Y-C Liu and M L Day,: 2006, Simplified modelling of thin-walled box section beam, International Journal of
Crash, 11(3), pp. 263–272.[5] G. J. Gao and H Q Tian,: 2007, Train’s crashworthiness design and collision analysis, International Journal of
Crash, 12(1), pp. 21–28.