Embed Size (px)
Citation preview
Assessing the Productivity of the UK Retail Sector
Oxford Institute of Retail Management Templeton College, University of Oxford
April 2004
Assessing the Productivity of the UK Retail Sector
2
Contents
The Research Team ...........................................................................................................4 1.0 Executive Summary ...........................................................................................................5 2.0 Introduction ...................................................................................................................... 12 2.1 What is a retail format? ..................................................................................... 16 2.2 Designing a retail proposition........................................................................... 18 3.0 The aggregate approach to measuring retail productivity ................................... 22 3.1 What do existing studies say about retail productivity? ........................... 22 3.2 Understanding the limitations of the top down approach......................... 33 3.2.1 The problems of measuring aggregate retail output ................................ 34 3.2.3 Separability of material inputs and other inputs ...................................... 39 3.3 Alternatives to the aggregate approach: measuring retail
productivity at the micro-level ............................................................................ 40 3.4 Concluding remarks ............................................................................................ 43 4.0 The retailer’s approach to measuring productivity and performance. .............. 45 4.1 Retail Key Performance Indicators ................................................................. 45 4.2 Evidence from corporate data .......................................................................... 54 4.2.1 Employee productivity..................................................................................... 55 4.2.2 Space productivity............................................................................................ 58 4.2.3 Asset productivity............................................................................................. 61 4.2.4 Financial productivity ..................................................................................... 61 4.2.5 Ranking performance....................................................................................... 63 4.3 Concluding remarks ............................................................................................ 66 5.0 Structural and environmental explanations for differential productivity ......... 68 5.1 Structural explanations...................................................................................... 69 5.1.1 Differences in country propositions and corporate structure ................ 69 5.1.2 Process differences – the example of ICT ................................................... 74 5.2 Environmental explanations ............................................................................. 78 5.2.1 Labour costs....................................................................................................... 79 5.2.2 Space, Planning and Property ....................................................................... 82
Assessing the Productivity of the UK Retail Sector
3
5.3 Concluding remarks ............................................................................................ 90 6.0 Areas for Action............................................................................................................... 91 6.1 Regulatory issues................................................................................................. 91 6.2 Recommendations................................................................................................ 92 Annexe 1: Collaborating individuals and organisations ............................................... 103 Annexe 2: Additional commentary on aspects of
aggregate economic analysis of retail productivity ........................................ 104 Annexe 3: Retail Productivity: a bibliography.................................................................. 107
Assessing the Productivity of the UK Retail Sector
4
The Research Team The hybrid nature of this research is reflected in the range of contributors to it. The core Templeton College team (Dmitry Dragun, Elizabeth Howard and Jonathan Reynolds) is especially grateful to Paul Ormerod and Bridget Rosewell at Volterra Consulting and Paula Payton of the US-based Retail Industry Leaders’ Association (formerly the International Mass Retail Association). Particular acknowledgements for their assistance and comments on earlier drafts are also due to the RSG productivity sub-group and to the following individuals: Alan Bevan, Jonathan Haskell, Véronique Mallaret, Christopher Moir, Leigh Sparks, and those identified in annexe 1 of the report.
Assessing the Productivity of the UK Retail Sector
5
1.0 Executive Summary Introduction 1.1 Several recent comparative studies have shown a labour productivity gap in
respect of UK retailing when compared with other countries, notably France and the US. We were asked to identify, through an overview of existing data and related research, the extent to which retail productivity in the UK compares to global competitors and to attempt to reach a consensus on the factors that determine retail productivity, whilst highlighting common performance measures for retailers and Government to use in measuring future productivity trends. This is a valuable exercise in itself, whatever our conclusions. It is not unreasonable to assume that any sector has opportunities to improve its own productivity by learning from elsewhere.
1.2 Our proposal to undertake this study noted the tension that exists between the
economic approaches to measuring productivity and the metrics used by retail practitioners to assess the efficiency and effectiveness of their firms. We therefore combined an assessment of the ‘top-down’ studies of productivity with an assessment of the key productivity and performance indicators used by retailers. Our methods included a review of published studies; interviews with industry participants in the UK and a small number of leading retailers in the USA; and an analysis of a specially created database of the performance of over 200 US, UK and French retail companies.
1.3 Section 2 of this report provides a short introduction by examining some of the
issues which underlie the difficulties in assessing retail productivity, by examining the nature of retailing and retail propositions. Section 3 first looks at the main previous studies of UK retail productivity and the differences among them, and then considers more broadly the difficulties of identifying and measuring retail output. Section 4 uses the evidence from our interviews to discuss the retailers’ approach to measurement, including the difficulties associated with it. We then conduct our own comparative analysis of UK, French and US retailers. Section 5 deals with structural and environmental differences between the UK and other countries which affect productivity. Finally, Section 6 sets out our recommendations for action.
1.4 UK retailing is an important sector employing over 3 million people and
contributing over 74 billion Euros in value added annually. But culture, history and perhaps sheer accident mean that each country will exhibit a different set of retail propositions. Retail employment in the UK is relatively high, particularly of part-timers, and the number of shops relatively low compared with other EU countries or the USA. The largest UK companies are smaller than the largest global competitors. There are also fewer very small shops and firms than in most EU countries. UK retailing has relatively fewer hypermarket, category killer or discount format stores, but more variety stores, superstores and supermarkets
Assessing the Productivity of the UK Retail Sector
6
than our comparators. The lack of a deep discounting sector in UK food retailing or similar discount or price focused, large format, propositions in other sectors is especially noteworthy. The existence of these differences does not necessarily mean that UK retailing is structurally deficient, however. There may be no ‘right’ structure towards which retailing in every country inevitably converges. This is an important conclusion in respect of retail productivity.
1.5 The concept of output lies at the heart of any productivity analysis. But retail
output includes a large service element, with considerable scope for trade-offs between the different elements that comprise different retail formats, propositions or brands. Many UK consumers have been seen to express preferences for higher service formats, over those which emphasise price based on simple efficiencies. Retailers anywhere must be effective in achieving their chosen consumer satisfaction goals whilst seeking to be as efficient as the achievement of such goals will allow. Industry participants and commentators therefore see retail productivity as essentially a consumer-mediated phenomenon.
The aggregate approach to measuring retail productivity
1.6 Assessing productivity is not a precise science, and there are conceptual as well
as statistical difficulties. Productivity, typically, is measured in terms of labour productivity, as gross value added per worker or per worker hour. Several recent aggregate economic studies have concluded to a greater or lesser extent that on this basis overall average labour productivity is lower in the UK than, notably, in France and the US (paras 3.6-3.8). There are particular difficulties in measuring both labour inputs and total outputs in retailing (paras 3.9-3.10). For example, it is not clear whether current productivity estimates are equally reliable or unreliable across countries, though the UK figures on hours worked in retailing are particularly dubious because of the high level of self-assessed part-time working (paras 3.11, 3.12) and the timing of data capture (para 3.13). All of the estimates are sensitive to changes in method of calculation and the data used (para 3.14). Most assessments of UK retail productivity focus on labour, not on total factor productivity, and therefore take little account of the different forms of UK retailing and the different combinations of land and capital inputs (para 3.21). Differences in labour productivity can be explained in part by differences in the use of other such inputs. When these have been considered, UK food retailing (for example) emerges in some ways as productive as other countries (para 3.23), but such an approach also highlights ways in which the UK sector may be disadvantaged in its less productive use of some capital, such as investment in information and communications technology (ICT) (paras 3.25-3.27).
1.7 The most worthwhile estimates of both TFP and labour productivity are those
that are able to overcome problems of definition and measurement of both outputs and inputs. However, these are particularly challenging in the context of cross-country comparisons of the retail trades (para 3.28). Reviewing existing
Assessing the Productivity of the UK Retail Sector
7
aggregate studies of retail productivity leads us to finding, not that retailing is substantially less productive than in other countries, but that there are problems with the estimates (sec 3.2).
1.8 For these reasons we conclude that it is most unwise to attempt to draw definite
conclusions from the top-down analyses conducted so far. But can we explain away all the apparent gap in retail productivity in terms of statistical problems? Our view is that, based on the available evidence to date, we do not know. It is one thing to review the estimates of productivity made by others; it is entirely another (in terms of time, effort and cost) to create wholly new estimates from scratch. In the time allocated to the preparation of this report such additional work was precluded. However, we did find that very detailed comparisons of individual firms, whilst not without their difficulties, provide a much sounder methodological basis for examining the relative efficiency of retailing in different countries (sec 3.3).
The retailer’s approach to measuring productivity and performance
1.9 Retailers themselves use a variety of measures to track both their efficiency and
performance. The common thread in our interviews was that productivity is intensely specific to the particular circumstances of the sector, product category and the choices made in terms of brand positioning (para 4.5). The notion of ‘average productivity’ is rejected, but a range of Key Performance Indicators (KPIs) are identified and their strength and weaknesses discussed (paras 4.7-4.23). Some differences in US retailers’ use of measures emerge, particularly in relation to the utilisation of capital (para 4.9) and there is a wide variation in the relative importance accorded particular KPIs by sector (para 4.16). Because the UK industry reports particular interest in the intangibles of service quality and format, the lack of UK or other international equivalents to the American Customer Satisfaction Index is instructive (paras 4.23-4.25).
1.10 Using published corporate data we made our own analysis of relative UK retail
efficiency and performance, by focusing on an aggregate analysis of the larger, publicly-quoted companies in the UK, France and US which account for a significant proportion of retailing in each country. (We were unable to extract comparative data of a similar quality for the ‘tail’ of smaller retail businesses in either the UK, US or in France.) We used measures of employee productivity, space productivity, asset productivity and financial productivity. The evidence from this analysis is mixed, and there are problems with the nature and comparability of the data available, but these sources provide a somewhat richer and fuller picture of comparative retail efficiency and performance. Our work confirms that UK retailers appear to lag behind foreign equivalents in terms of the sales productivity of their employees (para 4.31). But with regard to employees’ profit-based productivity (measured in terms of operating profit and net profit), the performance gap is perceptibly less significant (para 4.31). Moreover, it appears that this gap has narrowed dramatically in recent years (2002-2003). Our inability to make comparable full-time equivalent or hours
Assessing the Productivity of the UK Retail Sector
8
worked calculations using this data will work to depress UK labour productivity reported here because of the higher proportion of part-timers in the sector (para 4.32). UK retailers perform particularly well with regard to sales density, profit density and cash flow density, which points to a very efficient control of space, regarded as world class by their peers (para 4.36). But UK retailing lags the US in terms of asset turnover (para 4.39) and whilst it has performed well historically in terms of Return on Capital Employed (ROCE), this lead appears to have been lost recently (para 4.40). We suggest that a combination of structural differences, higher ICT, building and land costs as well as lag effects in realising returns on capital employed may have contributed to this reduction in financial productivity (para 4.41).
Structural and environmental explanations for differential productivity
1.11 Section Five deals with a series of issues which influence the performance of UK
retailing, and which must be taken into account in assessing whether there may be room for improvements. It goes without saying that whether or not there is a gap with other countries, productivity growth is desirable and retailers themselves are seeking this. We have already suggested that every country will has a distinctive set of retail propositions so that in the UK as elsewhere, firms tend to make different trade-offs between labour productivity and other factors. Such differences may prove remarkably resilient (para 5.8). Corporate structures also affect performance: the UK has a less concentrated structure than France, though not the USA (para 5.12). The largest UK firms do not have the scale, and therefore buying power, of the largest elsewhere (para 5.13). We were unable to analyse the small firm sector in the same degree of detail as the large firm sector, but we are able to suggest that that it cannot necessarily be a larger ‘tail’ of small retail firms per se which might help to explain any UK retail productivity gap (para 5.14).
1.12 We found some evidence that there is less ability to generally exploit
technological innovation in the UK, as well as to evaluate and implement IT projects (para 5.19). In part, this is due to a legacy of preoccupation with in-house, home-grown systems (para 5.20). Although UK supply chains are perceived as very efficient, there are new opportunities in RFID technology to make gains (paras 5.21-5.30).
1.13 The common perception is that there are significant differences in the efficiency
and performance of UK retailing, compared to that in other countries, which may be attributed to differences in the regulatory environment, and that de-regulation or change in regulation of some nature will produce gains in efficiency (para 5.31). These perceptions need close scrutiny since their characteristics may be complex and their effects on productivity uncertain or contradictory (para 5.33). For example, it may be partly as the result of greater regulation rather than less that France exhibits higher labour productivity than the UK or the US – through higher costs of employment and less flexible policies in areas such as training and promotion (paras 5.35-5.36). However, in the comparatively
Assessing the Productivity of the UK Retail Sector
9
deregulated environment of the US, retailers we interviewed saw fewer barriers to enhancing labour productivity (para 5.42). Inter-country data comparability issues nevertheless mean the final significance of differences in labour costs and flexibilities are uncertain.
1.14 The most profound difference between US and UK retailing, however, is in the
property environment, however, and the efficient servicing of that environment (sec 5.2.2). The UK is of course physically smaller than the US. The retail property environment, with a more limited supply of land and floor space and congested and high cost transport, is different in the UK from other countries and results in higher costs and perhaps less flexibility (paras 5.45-5.49). There are also continuing concerns about the inflexibility of UK commercial leasing arrangements, despite moves to reform (para 5.50). All European countries restrict to some degree the development of large stores (para 5.52). Store development regulations in the US are far less restrictive than in any EU country (para 5.52) but the commercial consequences of such regulations have to be offset against other goals. The potential lack of economies of scale related to store size are therefore important in the UK, but the relationship between scale and efficiency is not linear (para 5.55). Higher congestion and logistics costs accrue to retailers operating within the UK than to those in France or the US (paras 5.58-5.59).
1.15 The cumulative effects of these structural and environmental differences is to
produce retail business models in the UK that exhibit relatively high costs and a focus on high value products and services; these differences must be taken into account in assessing efficiency on an international basis.
Recommendations and conclusions
1.16 Of course, whether or not retailing in the UK is, for whatever reason, more or
less productive in any particular respect than in other countries, there are no grounds for complacency. Even the most successful leading players should always be seeking ways to become more efficient within the context of their customer offer and the competitive and regulatory environments within which they trade. We found that a complex and evolving mix of urban characteristics, consumer preferences and competitive rivalries influence the structure and performance of UK retailing. To recommend trying to engineer an improvement in retail productivity in the UK by creating a very different structure through (for example) regulation would be to enter upon broad social policy issues which would go well beyond our brief. (Other RSG studies are dealing with regulation and costs of compliance.)
1.17 We recommend action in five areas. All of our recommendations are to
government. Larger retailers may read this report and be encouraged by its publication or by government to take various actions (para 6.5). Likewise, it is in our opinion inappropriate to use our findings in this report to make recommendations directly to smaller retailers (para 6.6). Our recommendations
Assessing the Productivity of the UK Retail Sector
10
are to government about what might be realistically achieved for small retailers are therefore also to government, which needs to find a way to communicate them appropriately.
1.18 First, the most important recommendation is to improve data collection on and
analysis of the retail industry (para 6.8.1). Our research raised questions about the aggregate statistics we have, and also showed that different kinds of information would be helpful in improving the dialogue between retailers and government. Retailing is undoubtedly a major sector of the UK economy, yet there is considerable uncertainty about, for example, the significance of the non-labour factors' contributions to the generation of retail output. In particular, more attention might be given to, for example, the relevance of differences in supply of land and associated marked variations in retail occupancy costs between countries, and to the nature and importance of capital investment in the sector.
1.19 We suggest improving data standards, collection and release by
- undertaking detailed research into how far the observed gap in the retail sector's labour productivity is due to kinds of measurement problems set out in this report and how far it reflects genuine inefficiencies in the UK retail trades;
- the extension of firm level analyses by National Statistics and at the national level by OECD;
- more integration and harmonisation of existing official and unofficial data sources relevant to retailing;
- work towards the development of more meaningful disaggregation of the industry;
- exploring the potential for developing metrics which can be shared between retailers and government.
1.20 Second, we recommend developing new and useful measures of performance
(para 6.8.2) through:
- the evaluation of measures used by US retailers within the UK’ - the development of an integrated consumer satisfaction measure.
1.21 Third, we consider that driving performance improvements could be effected
through encouraging benchmarking and promoting standards (para 6.8.3), in particular:
- through broader and more universal satisfaction measures; - by finding mechanisms for benchmarking ICT investments.
1.22 In relation to smaller retailers, we recommend (para 6.8.4):
- filling the gap which exists for smaller retailers for benchmarking, particularly by extending the release of local information from national
Assessing the Productivity of the UK Retail Sector
11
bodies and encouraging local organisations to develop appropriate indices;
- investigating the possibility of extending systems and processes available to large retailers, perhaps through ECR.
1.23 Finally, we recommend some action to investigate training for retail management
internationally, especially in the US (para 6.8.5). 1.24 There should be consultation on these recommendations. At this stage we have
not made an assessment of the detailed cost of their implementation and this work should be part of the consultation process.
Assessing the Productivity of the UK Retail Sector
12
2.0 Introduction 2.1 This study arises from differing perceptions of the comparative productivity of
the UK retailing sector in relation to retailing in other markets: notably elsewhere in Western Europe and in the US. Discussion of “retail productivity” in general terms conceals the real tension that exists between economic approaches to the measurement of productivity within the retail sector - themselves potentially problematic whether at macro or at the firm level - and the metrics commonly used by retail practitioners to demonstrate the efficiency and effectiveness of their firms to internal and external stakeholders, notably investors. This report seeks to reflect a complex and ambiguous problem: the definition, measurement and analysis of “retail productivity” in ways that are relevant and meaningful to the various interested parties involved. It is therefore, a hybrid, multi-layered study, seeking to integrate different perspectives towards the measurement of comparative productivity and performance.
2.2 In terms of method, the study combines a critical assessment of existing ‘top-
down’ studies of productivity, with an assessment of the utility of key productivity and performance indicators employed by retailers. This is undertaken by a mixture of interviews with industry participants in the UK, including the leading retailers and retail analysts, a small number of interviews with a small number of leading retail CEOs and CFOs in the US, alongside a specially created database of the performance of over 200 US, UK and French retail companies between 1999-2003, representing both a wide spectrum of multiple retailing in each country and that for which corporate data was available.
2.3 The tension described above is not peculiar to retailing. The recent Work
Foundation study into productivity and performance made it clear that “the productivity debate in the UK has fragmented into disciplinary and lobbying silos”. It observed the narrowness of the technical debate on productivity and noted that “any study that is going to make a contribution that addresses .. wider economic issues has to take a broader approach to productivity”1. We agree. Retailing contributes to UK economy, society and environment in many ways, not all of which are measurable in productivity terms, and indeed it may be necessary to see the various contributions as involving a series of trade-offs.
“There is constant tension between the abstract model of efficiency and what is actually attractive to the customer.” (UK retailer) “High productivity is a necessary but not sufficient condition for high efficiency, as individual productive factors may not be combined in an optimal manner. Similarly, high efficiency is a necessary but not sufficient condition for
1 The Work Foundation. The Missing Link: From Productivity to Performance, October 2003, p. 9
Assessing the Productivity of the UK Retail Sector
13
high effectiveness, as the efficient combination may be directed to less than optimal goals.”2
2.4 Retailing, however, also provides additional hurdles to straightforward international comparison. Retail distribution belongs to a sector of the economy often considered ‘hard’ or ‘impossible to measure’ by economists using broad output-to-input ratio techniques. Of course, retailing is not alone in this, with the recent IMF mission to the UK concluding that “measurement problems likely understate the improvements in quality of public services on a national accounts basis.”3 Availability of appropriate data on retailing at all and, when available, data of consistent and comparable kinds is problematic. One of the consequences of these hurdles is a relative lack of attention paid to retailing, and to services more generally by economic analysts and policymakers, because other sectors provide for relatively greater certainty in measurement.
2.5 What are the functions of a retailer? In analytical terms, what do retailers
actually do that allows them to earn, or a least hope to earn, a net profit? Like any sector, retailing has its own particular characteristics relevant to efficiency and effectiveness and a necessary preamble to our work is to summarise these characteristics, since they form the backdrop to our main analysis.
2.6 Historically, retailers were regarded as mere ciphers in the distribution channel,
working as intermediaries just to enable the flow of goods and services between suppliers and consumers. Very little value was added, save perhaps through additional convenience to the end consumer. At heart, retailers do two things: (a) provide readily identifiable locations where final consumers enter into the transactions by which they acquire goods and services; and (b) facilitate and encourage such transactions by providing variable support services, including displays, stocks, cash and credit facilities. Then it became clearer that in practice, retailers were able to become much more active agents in their own right within the value chain than had perhaps been realised or suggested.
2.7 Concentration of retail ownership encouraged growth in buyer power, the
growth of new ranges – including own brands – and the development of new formats in new locations. From the point of view of the marketer, retailers are now closer to the consumer than supplier companies. This has two implications. First, retailers are better placed to gather information on the behaviour of consumers and customers than organisations further back in the supply chain. Second, this data-gathering puts them in a better position to communicate effectively with consumers and to develop winning strategies in their markets.
2.8 Indeed, the flows of people, goods and money through the retail supply chain
make the sector’s businesses some of the most influential corporate players in the economies of developed countries. In 1999, for example, European retail trade generated sales of €1,518bn; contributed €292.5bn in value added and
2 Goodman, C.S., ‘Comment: On Output Measures of Retail Performance’, Journal of Retailing, 1985. 61(3): p. 77-82. 3 IMF, United Kingdom—2003 Article IV Consultation. Concluding Statement of the IMF Mission, 2003, para 11.
Assessing the Productivity of the UK Retail Sector
14
employed 12.4mn people4. Indeed, retailing contributed 39% of value added in the EC-15 countries, compared to 30% by manufacturing. It is a continuing source of curiosity therefore that manufacturing still attracts a disproportionately high amount of attention in measurement, analysis and policy terms.
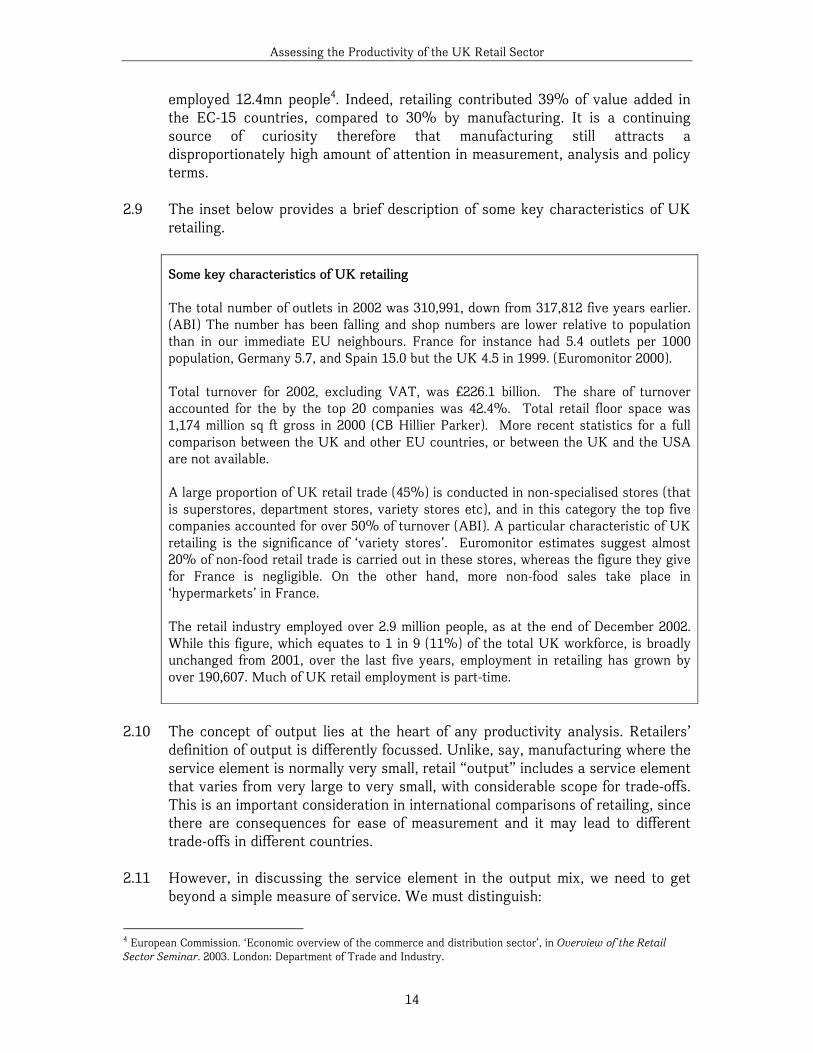
2.9 The inset below provides a brief description of some key characteristics of UK
retailing.
Some key characteristics of UK retailing The total number of outlets in 2002 was 310,991, down from 317,812 five years earlier. (ABI) The number has been falling and shop numbers are lower relative to population than in our immediate EU neighbours. France for instance had 5.4 outlets per 1000 population, Germany 5.7, and Spain 15.0 but the UK 4.5 in 1999. (Euromonitor 2000). Total turnover for 2002, excluding VAT, was £226.1 billion. The share of turnover accounted for the by the top 20 companies was 42.4%. Total retail floor space was 1,174 million sq ft gross in 2000 (CB Hillier Parker). More recent statistics for a full comparison between the UK and other EU countries, or between the UK and the USA are not available. A large proportion of UK retail trade (45%) is conducted in non-specialised stores (that is superstores, department stores, variety stores etc), and in this category the top five companies accounted for over 50% of turnover (ABI). A particular characteristic of UK retailing is the significance of ‘variety stores’. Euromonitor estimates suggest almost 20% of non-food retail trade is carried out in these stores, whereas the figure they give for France is negligible. On the other hand, more non-food sales take place in ‘hypermarkets’ in France. The retail industry employed over 2.9 million people, as at the end of December 2002. While this figure, which equates to 1 in 9 (11%) of the total UK workforce, is broadly unchanged from 2001, over the last five years, employment in retailing has grown by over 190,607. Much of UK retail employment is part-time.
2.10 The concept of output lies at the heart of any productivity analysis. Retailers’
definition of output is differently focussed. Unlike, say, manufacturing where the service element is normally very small, retail “output” includes a service element that varies from very large to very small, with considerable scope for trade-offs. This is an important consideration in international comparisons of retailing, since there are consequences for ease of measurement and it may lead to different trade-offs in different countries.
2.11 However, in discussing the service element in the output mix, we need to get
beyond a simple measure of service. We must distinguish:
4 European Commission. ‘Economic overview of the commerce and distribution sector’, in Overview of the Retail Sector Seminar. 2003. London: Department of Trade and Industry.
Assessing the Productivity of the UK Retail Sector
15
• Outputs which are broadly concerned with the levels and quality of service
provided by labour inputs. (Crudely, we can interpret this as meaning more help on the shop floor.) These are likely to be captured by economic analyses of labour productivity, provided that such studies do adequately and comparably measure the quality of labour employed, rather than just its quantity.
• Outputs which are about more than the goods provided, and not just ‘service’, but are summed up in the retail ‘proposition’ or offer which consumers choose to pay for. (We can interpret this as the retail format.) These outputs are unlikely to be captured by conventional productivity analyses and the mix of propositions they generate is likely to differ country by country.
• Contributions to society and the environment, such as maintenance of the existing urban fabric. (These can be seen as unmeasured externalities to the retail system.) As externalities, these factors are also outside the scope of conventional productivity analyses.
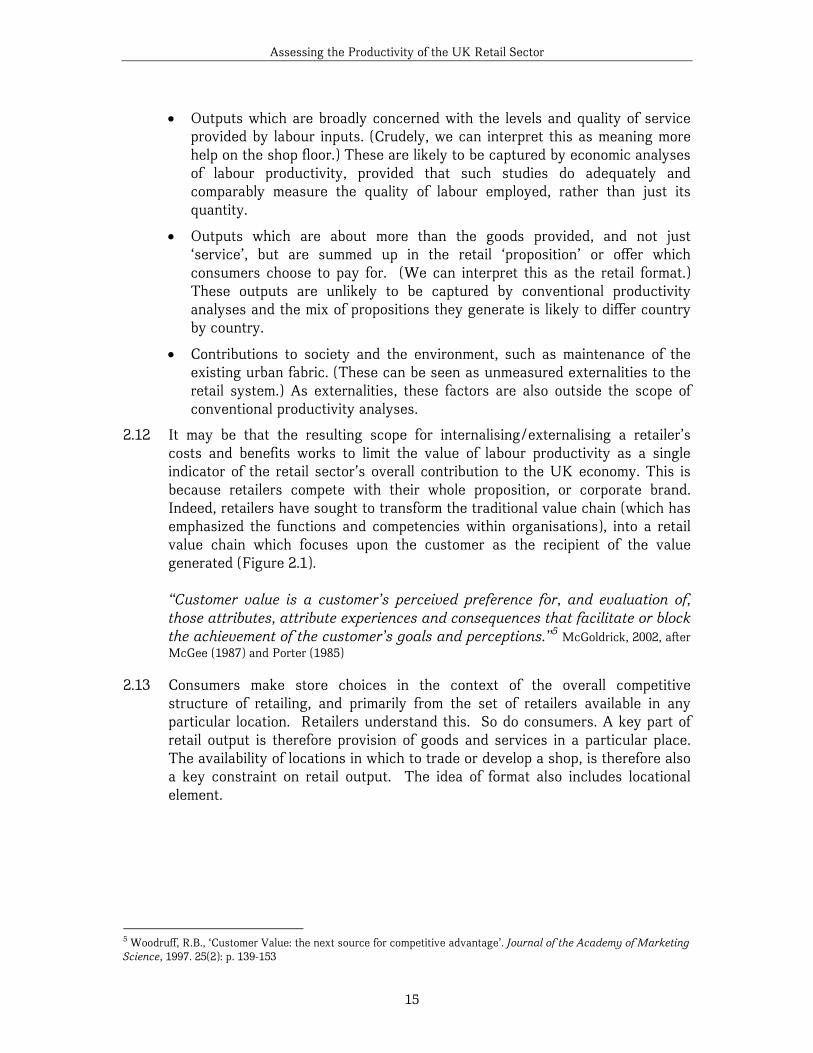
2.12 It may be that the resulting scope for internalising/externalising a retailer’s costs and benefits works to limit the value of labour productivity as a single indicator of the retail sector’s overall contribution to the UK economy. This is because retailers compete with their whole proposition, or corporate brand. Indeed, retailers have sought to transform the traditional value chain (which has emphasized the functions and competencies within organisations), into a retail value chain which focuses upon the customer as the recipient of the value generated (Figure 2.1).
“Customer value is a customer’s perceived preference for, and evaluation of, those attributes, attribute experiences and consequences that facilitate or block the achievement of the customer’s goals and perceptions.”5 McGoldrick, 2002, after McGee (1987) and Porter (1985)
2.13 Consumers make store choices in the context of the overall competitive
structure of retailing, and primarily from the set of retailers available in any particular location. Retailers understand this. So do consumers. A key part of retail output is therefore provision of goods and services in a particular place. The availability of locations in which to trade or develop a shop, is therefore also a key constraint on retail output. The idea of format also includes locational element.
5 Woodruff, R.B., ‘Customer Value: the next source for competitive advantage’. Journal of the Academy of Marketing Science, 1997. 25(2): p. 139-153
Assessing the Productivity of the UK Retail Sector
16
2.1 What is a retail format?
2.14 There is no single definition of retail format – the term is used both in a generic sense and also to describe the specific offer of a particular retailer. It has been suggested that retailing as a sector lacks a single common basis for classification6. For example, Retail Intelligence gives the following definition of department stores:
“Stores selling a wide range of goods including significant proportions of clothing and household goods, usually on several floors within one building, with sales area over 2,000 sq. m and at least 25 sales employees.”7
2.15 This definition could be supplemented by a number of other descriptions, listed
for example on the website of the International Association of Department Stores (www.iads.org). An equally representative array of definitions exists for other retail formats such as discounters, superstores, variety stores, and power centres. With regard to discounters, the following characteristics are common for this type of retail operation:
• Emphasis on cost control • Low prices • Tight range management • No-frills approach to store design and presentation • Low level of customer service.8
6 Brown, S., ‘Retail classification: a theoretical note’. Quarterly Review of Marketing, 1986(Winter): p. 12-16. 7 Retail Intelligence, Department stores in Europe. 2000, Retail Intelligence: London. 8 Humphries, G., ‘Prospects for food discounters and warehouse clubs: growth or decline?’ 1995, Pearson: London; Food Marketing Institute et al, Alternative store formats. FMI: Washington
Figure 2.1 The retail value chain
Source: McGoldrick (2000)
Assessing the Productivity of the UK Retail Sector
17
2.16 Based in part on such characteristics, the Institute for Grocery Distribution, for example, defines a discounter as:
“A retailer that offers a tightly controlled range, at low prices, from premises which are basic by design. The company culture emphasises rigorous cost control, and the principal marketing tool is price.”
2.17 In fashion retailing, for example, there is less discussion of format per se –
instead the customer positioning, price/value message and store interiors are commonly used to indicate the format inclination.
2.18 A range of definitions often exists for format categories with confusing results.
Wal-Mart, for example, has been variously described as a discount department store operator, hypermarket, and power centre. While all these descriptions are likely to bear some semblance to reality, an all-embracing, clear-cut definition of each retail format remains elusive. Many contemporary retailers, Wal-Mart included, typically comprise elements acquired during the drive for value-adding opportunities outside their traditional domains. (All the various definitions of Wal-Mart tend to focus upon general merchandiser, but in fact the company is also the biggest grocery retailer in the US.) In addition, the boundaries between the traditional formats are becoming blurred, for example, Carrefour’s MAGALI format combines the features of the open market and boutique-type environment, all within the traditional – but modified – hypermarket setting.
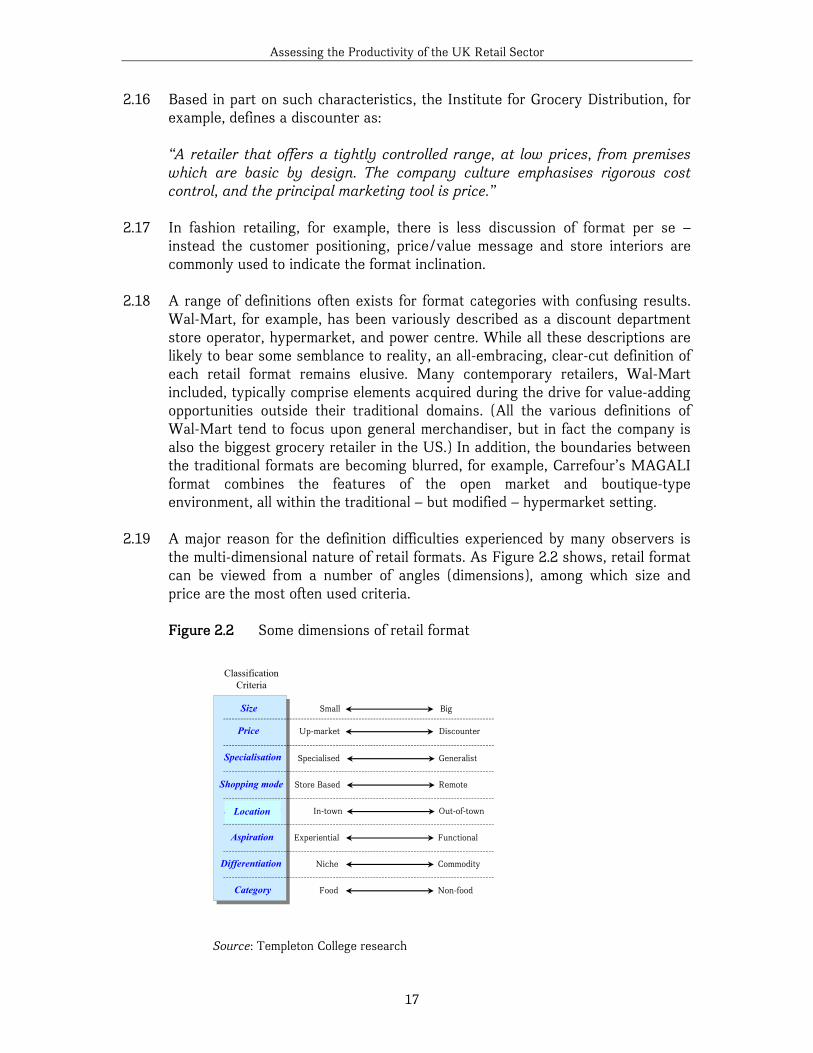
2.19 A major reason for the definition difficulties experienced by many observers is
the multi-dimensional nature of retail formats. As Figure 2.2 shows, retail format can be viewed from a number of angles (dimensions), among which size and price are the most often used criteria.
Figure 2.2 Some dimensions of retail format
Source: Templeton College research
Store Based Remote
ClassificationCriteria
Size Small Big
Specialisation Specialised Generalist
Price Up-market Discounter
Shopping mode
Free standing In-town Out-of-town
Aspiration Experiential Functional
Differentiation Niche Commodity
Category Food Non-food
Location
Assessing the Productivity of the UK Retail Sector
18
2.20 Figure 2.2 demonstrates the challenge of classifying retailers according to the
dimensions defined – in order to be meaningful any classification should be based on a multitude of interacting and overlapping characteristics. Supermarket operators, for example, are often perceived as the easiest to classify since they have been one of the most familiar retail formats around and appear to lend themselves readily to analysis. This, however, may not be an easy task, as the example of Tesco shows. This company operates five distinct retail formats in the UK (Extra, Superstore, Metro, Express and tesco.com), of which Superstore is the company’s contemporary core format. The other concepts are relatively new and exhibit different range and service characteristics. Abroad, Tesco’s Lotus ‘hypermarkets’ in Thailand and Homeplus ‘department discount‘ stores in South Korea can hardly be fitted into any of the existing retail formats. How would one then define Tesco? At this stage, the only suitable classification might be a rather unconvincing ‘multi-format grocery operator’. In terms of productivity, expecting Tesco’s Metro format to meet the same productivity targets as, say, its superstore format (let alone the South Korean store format) would be unrealistic: we are comparing apples and pears.
2.21 A generic definition of a retail format, if attempted, might run along the following
lines:
“The combination of the spatial and business characteristics describing the customer proposition, brand image, product market positioning and strategic choices of a retailer with respect to a multitude of dimensions”
2.22 On the basis of this universal definition, the retail format is best viewed as a
multi-dimensional phenomenon particular to each company. From the point of view of productivity, every format will exhibit a distinctive mix of trade-offs of efficiency against effectiveness in relation to the kinds of dimensions in Figure 2.2, which may or may not conform to the optimum efficiency.
2.23 Format is important in assessing productivity because of the relationship with
business model. The discount formats which are so significant in the USA, mean not simply that retailers aim to sell lower priced goods: rather it is that the business model is different. There are wide variations of course, but in general this model relies on minimizing complexity, costs and services in no-frills stores, limiting ranges, and maximising stock turn. Labour inputs are minimised; store property costs are likely to be low. Alternative models rely, for example, on driving sales through range and choice of product with added services, in different, probably more expensive, locations and stores. Labour inputs, and other costs, are likely to be higher. Gross margin is likely to be higher and stock turn lower. We will return to this issue in Section Four.
2.2 Designing a retail proposition
Assessing the Productivity of the UK Retail Sector
19
2.24 Designing a retail proposition that satisfies shoppers’ perceived needs can be as much an art as a science for a retailer. Each such offer requires positioning in relation to the offers of other retailers to establish a differential advantage. Retailers conventionally must choose from the list of store choice criteria seen by consumers as important, to determine how they wish to compete. We can distinguish between order-winning criteria and order-qualifying criteria.9 Qualifiers are those criteria that a company must meet for a consumer to even consider it as a possible choice. However providing or attaining these criteria does not win orders. Winners comprise the criterion, or criteria, against which consumers will make the final choice. Strength in both winning and qualifying criteria build switching barriers and generate loyal customers.
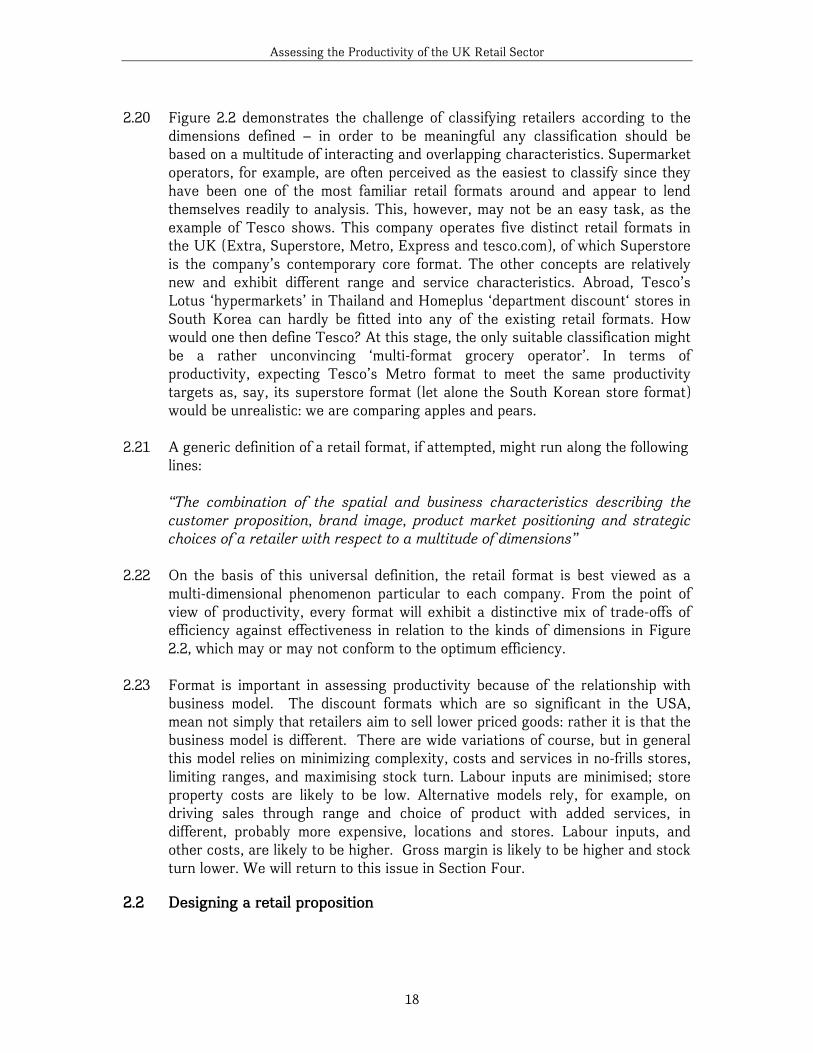
2.25 Figure 2.3 provides insights into UK grocery shopping behaviour and
distinguishes between the most important factor in store selection and those factors which are important but not critical. In this context, for example, more shoppers find the ‘one stop shop’ criterion a winning one than price alone, although price is a significant qualifier and, for a smaller group of consumers, a key winning criterion in its own right. Convenience is the only other criterion to attract a greater than 10% appeal as a main factor in store choice. This example suggests that there may be three key positioning dimensions in the market available to UK grocery retailers: a ‘full service’ range one-stop shop; a low price offer; and a convenience offer. Each relevant to certain customer segments at certain times; each offering different benefits and services for customers for the same basket of goods. Of course, this matches very closely what we know about how this sector is presently structured.
9 Hill, T., (ed.) (2000). Manufacturing Strategy. Macmillan, London.
Figure 2.3 Store choice criteria, grocery shopping
Source: Competition Commission, 2000.
Assessing the Productivity of the UK Retail Sector
20
“It’s a different shopping model, isn’t it? The nature of retail food competition in this country [UK] reminds me a little bit of what happens in evolution in the natural sphere, in a sense that you look at these curious beasts and wonder why they evolved in that way. The answer is that you don’t have the abstract model of saying that the customers want the lowest price – instead what the customers want is a combination of price and services… We are choosing where we think our customers want the balance – between price and value – to be struck.” (Retailer)
2.26 One of the key trade-offs in developing compelling strategic positioning is
therefore that between price and a bundle of non-price factors, of which level of service may be one factor. Identifying how competitors are positioned in relation to these two sets of factors can be a starting point in determining gaps in the existing market. For example, in the case of the consumer’s selection of a clothing retailer, customer surveys have shown that non-price consumer choice differentiators include: a wide range of sizes, good stock availability, clothes that are 'a bit different', a wide range of colour ways and sizes, good changing areas and more helpful staff. Whilst there has been a growing market in the UK for discounted clothing, these non-price factors still remain important for many consumers.
2.27 Determining the correct trade-off is a dynamic game between competitors where
only long-term growth in market share and profitability can provide evidence for the success of any positioning strategy.
2.28 The kinds of choices that have to be made are similar for a retailer in any
market; but the trade-off between efficiency and customer appeal will be different between countries, and - within countries - between and within categories. These will be important considerations in explaining any gap in aggregate retail productivity between countries. Our interviews with industry participants in the UK, including the leading retailers and retail analysts, confirmed this perception:
“[Our] business is customer focussed, it is not a production line, this means that the balance between service and efficiency has to be achieved depending on the desired country service levels. These service levels differ across countries depending on their cultural differences and history. In South Korea, our stores have a much higher number of people in selling positions across the shop floor, which reflects the shopping patterns there. We could not replicate the far lower number of people in countries such as Thailand, Poland or the UK. This can have a big impact on performance and is another reason why cross-country comparisons have not been carried out on a regular basis.” (UK retailer)
2.29 The consequences for the measurement of efficiency and performance were
expressed by one of the UK’s leading fashion retailers:
Assessing the Productivity of the UK Retail Sector
21
“Isn’t efficiency (and productivity) all wrapped up in your brand positioning and therefore not really something for anyone to comment on? If French Connection wants to sell higher-priced things and spends lots of money on advertising – that’s one brand positioning. If we are a value retailer – that’s another brand positioning. Then perhaps it makes sense to disaggregate very simply by looking at higher-priced brands separately from value-priced brands? That might help to see whether selling more things at lower prices generates more efficiency than selling fewer things at higher prices.” (clothing retailer)
2.30 As a consequence, it is not at all clear that all retailers share in the ‘productivity
gap’ that national aggregate studies of the UK economy have found. And even if the sector as a whole or in part does (and makes a major contribution to the overall gap between the UK and the US, France and Germany, as has been suggested), neither is it at present altogether clear whether this is for statistical, structural or business environmental reasons.
2.31 This report tackles each of these issues in turn. In Section 3 it examines
critically the conventional, aggregate approach to measuring retail productivity and considers to what extent alternative microeconomic approaches may provide better statistical rigour as well as more practical policy-relevant conclusions. In Section 4 it explores the language and terminology employed by retailers in assessing efficiency and productivity at the firm and store level, and discusses how these performance indicators compare internationally.
2.32 But getting away from issues of measurement, in Section 5, this report
recognises that whether a productivity gap exists or not, there are structural and business environmental differences which may contribute to the differential scale and character of retail business performance between countries.
2.33 Yet, however satisfactory such explanations may be, they are not grounds for
complacency by UK retailers, where even the most successful leading firms demonstrate continuing efforts to become more efficient within the market and cultural context provided by the UK. Finally, Section 6 of the report therefore considers areas for action by identifying measures in common that might allow all parties to monitor efficiency and performance of UK retailing more effectively, and makes some specific recommendations for ways in which retail productivity in the UK can be better understood and improved.
Assessing the Productivity of the UK Retail Sector
22
3.0 The aggregate approach to measuring retail productivity
3.1 What do existing studies say about retail productivity? 3.1 There is considerable policy interest in the productivity of the UK economy,
both at the overall level and the level of individual sectors, including services – both public and private. Analysis of labour productivity in retailing has been undertaken as part of this more general interest, with results for retailing often decomposed from an aggregate level.
3.2 Typically, productivity is measured in terms of labour productivity: that is to say
the output generated for every unit of labour input. Usually output is defined as gross value added and labour input as either per worker or per worker hour. Increasingly this interest has focused on comparisons of the levels of productivity in the same sectors in different G7 countries. There is also interest in how the level of productivity changes over time within the UK and across countries.
3.3 Several recent studies have made cross country comparisons of retail sector
productivity. All have concluded, to a greater or lesser extent, that overall average labour productivity in the UK retail trades, when expressed in a common currency, is lower than in other major G7 countries, notably than that in France and the US.
3.4 The same studies have also assessed the extent to which the size of the labour
productivity gap has changed because of differential growth rates. Whilst differing in degree, all agree that whilst the labour productivity gap between retailing in the UK and US narrowed in the early part of the 1990s, it widened significantly in the latter part of the decade. Three major studies are of particular relevance to this report:
• that by the McKinsey Global Institute (“McKinsey”)10 which carried out
a special decomposition of both labour and total factor productivity in the food retail sector;
• that by the National Institute for Economic and Social Research (“NIESR”)11 which focused on labour productivity, and
• a more recent study by the Groningen Growth & Development Centre and the Conference Board (“Groningen”)12 which focused upon labour productivity and the particular role of information and communications technology (ICT) in influencing differential productivity growth.
10 McKinsey Global Institute, Driving Productivity and Growth in the UK Economy. October 1998, McKinsey 11 O'Mahony, M. and W. de Boer, Britain's relative productivity performance: updates to 1999. 2002, NIESR. 12 Van Ark, B., R. Inklaar, and R.H. McGuckin, "Changing Gear". Productivity, ICT and Service Industries: Europe and the United States. 2002, The Conference Board: Washington.
Assessing the Productivity of the UK Retail Sector
23
There have also been a number of more recent, more focused analyses of US/UK retail productivity. All suggest that, to varying extents, there are labour productivity shortfalls between the aggregate performance of UK retailers and equivalent productivity in France and the US.
“our study suggests that UK retailers are not distinguished by their labour productivity: they achieve only 75% of the benchmark set by France.”13 “the US is very far ahead [in terms of labour productivity] of the European countries in retail and repairing ..”14
3.5 In this section we describe and comment on the findings of these studies and
make some preliminary observations on any statistical or methodological issues that affect how these findings might be regarded and interpreted. More detailed explanation for any differential productivity between countries is reserved for Section 5 of the report.
3.6 In general terms, our initial observation is that all these studies work with
relatively standard methodologies, are broadly careful and meticulous in their technical approach, as befits their origins, but are hampered by the fragility of the international data environment in the area of comparative productivity which leads to the need to make some often heroic assumptions. We give some examples of this below. Further, these studies are first and foremost aggregate comparisons of productivity between national economies. Commentary on retailing often comprises a small component of the overall analysis. The decomposition of such ‘top-down’ analysis to the sectoral level, and particularly for a sector with which, as we have already begun to suggest, so many conceptual difficulties are associated is challenging to say the least. It is therefore perhaps not surprising that problems arising at an aggregate level produce still more surprising results at a more detailed service industry level. For example, the estimates produced by one study suggest that labour productivity in hotels and catering is 82% higher in France than in the UK, and around 40% higher than in the US.15 This is seriously hard to believe. Retailing in both France and the US is suggested to be 60% more productive. Since retailing styles are utterly different in these countries, this is not entirely surprising.
3.7 The estimates in the table below and later tables in this section are not directly
comparable because the authors use different definitions, time periods and means of converting estimates of labour productivity in national currencies into a single one. We should say at the outset that none of the differences of approach necessarily challenge the finding of there being a productivity gap between retailing in the UK and France and US, but they cast doubt on its scale and character.
13 McKinsey Global Institute, op. cit., p.3. 14 O'Mahony, M. and W. de Boer, op. cit., p.37 15 O'Mahony, M. and W. de Boer, op. cit., p.38
Assessing the Productivity of the UK Retail Sector
24
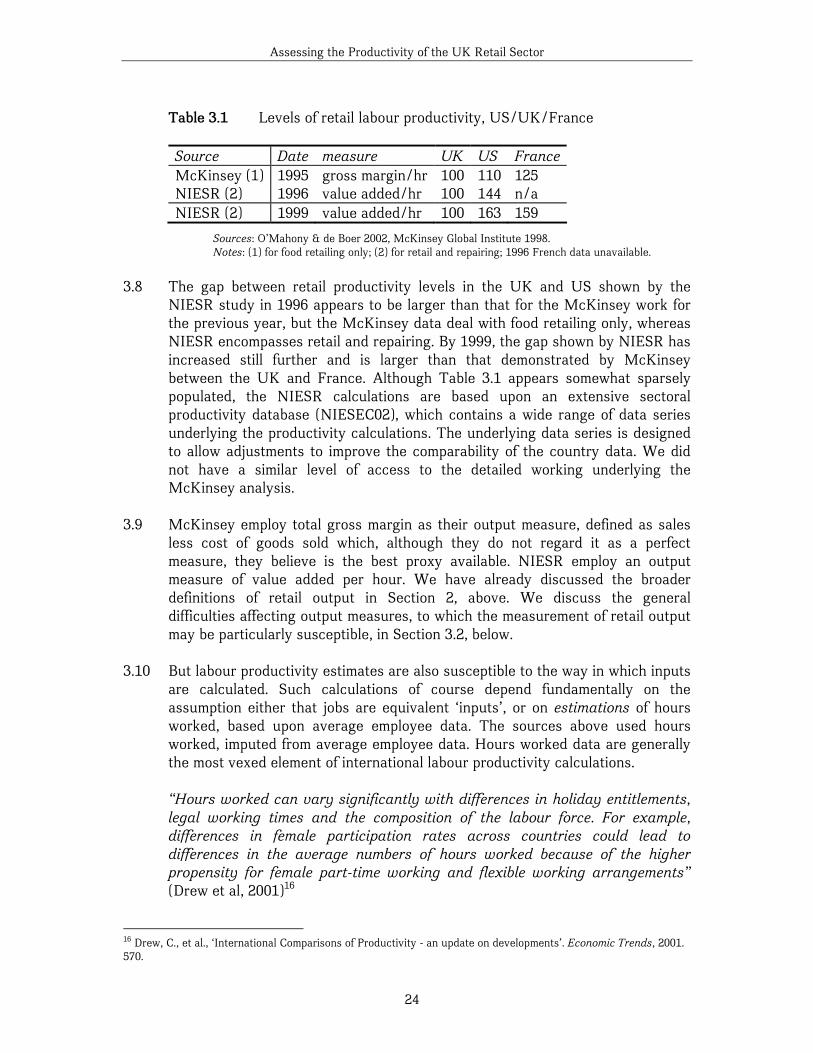
Table 3.1 Levels of retail labour productivity, US/UK/France
Source Date measure UK US FranceMcKinsey (1) 1995 gross margin/hr 100 110 125 NIESR (2) 1996 value added/hr 100 144 n/a NIESR (2) 1999 value added/hr 100 163 159
Sources: O’Mahony & de Boer 2002, McKinsey Global Institute 1998. Notes: (1) for food retailing only; (2) for retail and repairing; 1996 French data unavailable.
3.8 The gap between retail productivity levels in the UK and US shown by the
NIESR study in 1996 appears to be larger than that for the McKinsey work for the previous year, but the McKinsey data deal with food retailing only, whereas NIESR encompasses retail and repairing. By 1999, the gap shown by NIESR has increased still further and is larger than that demonstrated by McKinsey between the UK and France. Although Table 3.1 appears somewhat sparsely populated, the NIESR calculations are based upon an extensive sectoral productivity database (NIESEC02), which contains a wide range of data series underlying the productivity calculations. The underlying data series is designed to allow adjustments to improve the comparability of the country data. We did not have a similar level of access to the detailed working underlying the McKinsey analysis.
3.9 McKinsey employ total gross margin as their output measure, defined as sales
less cost of goods sold which, although they do not regard it as a perfect measure, they believe is the best proxy available. NIESR employ an output measure of value added per hour. We have already discussed the broader definitions of retail output in Section 2, above. We discuss the general difficulties affecting output measures, to which the measurement of retail output may be particularly susceptible, in Section 3.2, below.
3.10 But labour productivity estimates are also susceptible to the way in which inputs
are calculated. Such calculations of course depend fundamentally on the assumption either that jobs are equivalent ‘inputs’, or on estimations of hours worked, based upon average employee data. The sources above used hours worked, imputed from average employee data. Hours worked data are generally the most vexed element of international labour productivity calculations.
“Hours worked can vary significantly with differences in holiday entitlements, legal working times and the composition of the labour force. For example, differences in female participation rates across countries could lead to differences in the average numbers of hours worked because of the higher propensity for female part-time working and flexible working arrangements” (Drew et al, 2001)16
16 Drew, C., et al., ‘International Comparisons of Productivity - an update on developments’. Economic Trends, 2001. 570.
Assessing the Productivity of the UK Retail Sector
25
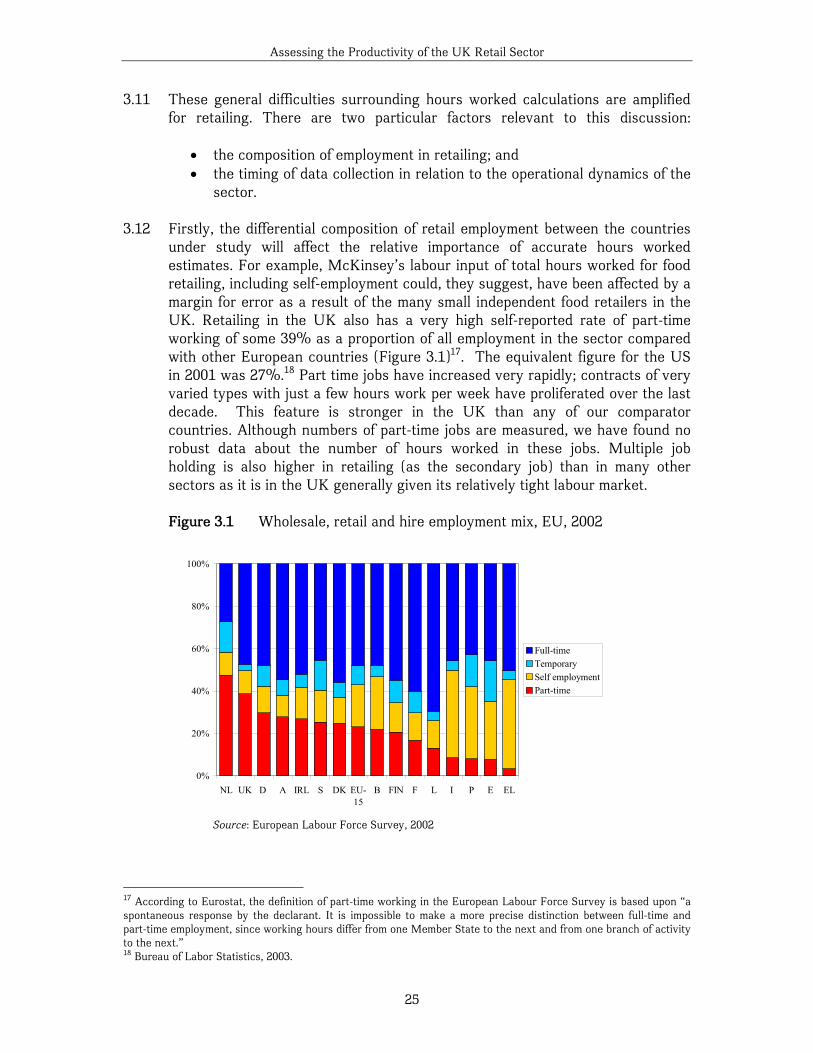
3.11 These general difficulties surrounding hours worked calculations are amplified for retailing. There are two particular factors relevant to this discussion:
• the composition of employment in retailing; and • the timing of data collection in relation to the operational dynamics of the
sector.
3.12 Firstly, the differential composition of retail employment between the countries under study will affect the relative importance of accurate hours worked estimates. For example, McKinsey’s labour input of total hours worked for food retailing, including self-employment could, they suggest, have been affected by a margin for error as a result of the many small independent food retailers in the UK. Retailing in the UK also has a very high self-reported rate of part-time working of some 39% as a proportion of all employment in the sector compared with other European countries (Figure 3.1)17. The equivalent figure for the US in 2001 was 27%.18 Part time jobs have increased very rapidly; contracts of very varied types with just a few hours work per week have proliferated over the last decade. This feature is stronger in the UK than any of our comparator countries. Although numbers of part-time jobs are measured, we have found no robust data about the number of hours worked in these jobs. Multiple job holding is also higher in retailing (as the secondary job) than in many other sectors as it is in the UK generally given its relatively tight labour market.
Figure 3.1 Wholesale, retail and hire employment mix, EU, 2002
0%
20%
40%
60%
80%
100%
NL UK D A IRL S DK EU-15
B FIN F L I P E EL
Full-timeTemporarySelf employmentPart-time
Source: European Labour Force Survey, 2002
17 According to Eurostat, the definition of part-time working in the European Labour Force Survey is based upon “a spontaneous response by the declarant. It is impossible to make a more precise distinction between full-time and part-time employment, since working hours differ from one Member State to the next and from one branch of activity to the next.” 18 Bureau of Labor Statistics, 2003.
Assessing the Productivity of the UK Retail Sector
26
3.12 McKinsey estimated that the propensity to employ a higher number of lower value added workers in UK retailing (temporary or very part-time casual staff) might account for some 15 percentage points of the difference between French and UK labour productivity levels. We examine some of the structural reasons that might explain this in Section 5, but if the measurement of this component of labour input is inadequate and/or different between countries, then there may be statistical concerns also.
3.13 Secondly, the timing of data capture on average employees by sector is
particularly problematic for retailing. European Labour Force Survey data tend only to cover the Spring of each year (March-May). The UK Labour Force survey during the period in question gathered data at different points in the year. One recent smaller study using micro data took retailers’ average employee numbers in the peak business month of December as an input to a comparison of manufacturing-service sector productivity19. This is hardly representative of average employment in the sector and will, of course, artificially depress labour productivity levels. Any errors made or international inconsistencies in adjustments for these kinds of timing factors are likely to be magnified in sectors like retailing, where there is strong seasonality.
3.14 One final example demonstrates the sensitivity of analyses of this kind to small
changes in method. The use of Purchasing Power Parity (PPP) estimates from the OECD is a conventional approach to developing robust international comparisons of productivity. The NIESR study updates its previous work by using 1996 estimates instead of the 1993 ones used in an earlier piece of work. These estimates are taken as read. However, the measure of output depends crucially on these comparisons. A different basket of goods will lead to a different set of weights and different price deflators. It is becoming increasingly evident that this is important.
3.15 The UK recently introduced a new method of using deflators – providing an
annual update of weights, rather than a quinquennial one. This has had the effect of increasing the growth rate over long periods of time. Statistics have thus suddenly closed at least part of the productivity gap. Even though the effect may be small, it should remind us of the importance of recognising that these are all statistics, subject to error and methodological impacts.
3.16 The McKinsey study was sufficiently concerned that the use of the OECD food
PPPs would not fully reflect country differences in service levels that the researchers undertook a cross-check using a basket of goods purchased at similar stores in the US, UK and France. This was used to construct a bespoke PPP, which produced similar results to the OECD method.
19 Barnes, M. ‘Manufacturing and Services in the UK: How do they compare?’ in ONS/DTI Productivity Workshop. 2002.
Assessing the Productivity of the UK Retail Sector
27
3.17 When we turn to rates of growth in retail labour productivity internationally, we see retailing at the heart of the overall productivity gap between the US and UK demonstrated by the macro-economic studies:
“the US showed rapid productivity expansion in retail and wholesale trades and securities, which account for much of the overall US-EU gap in productivity growth since 1995.”20
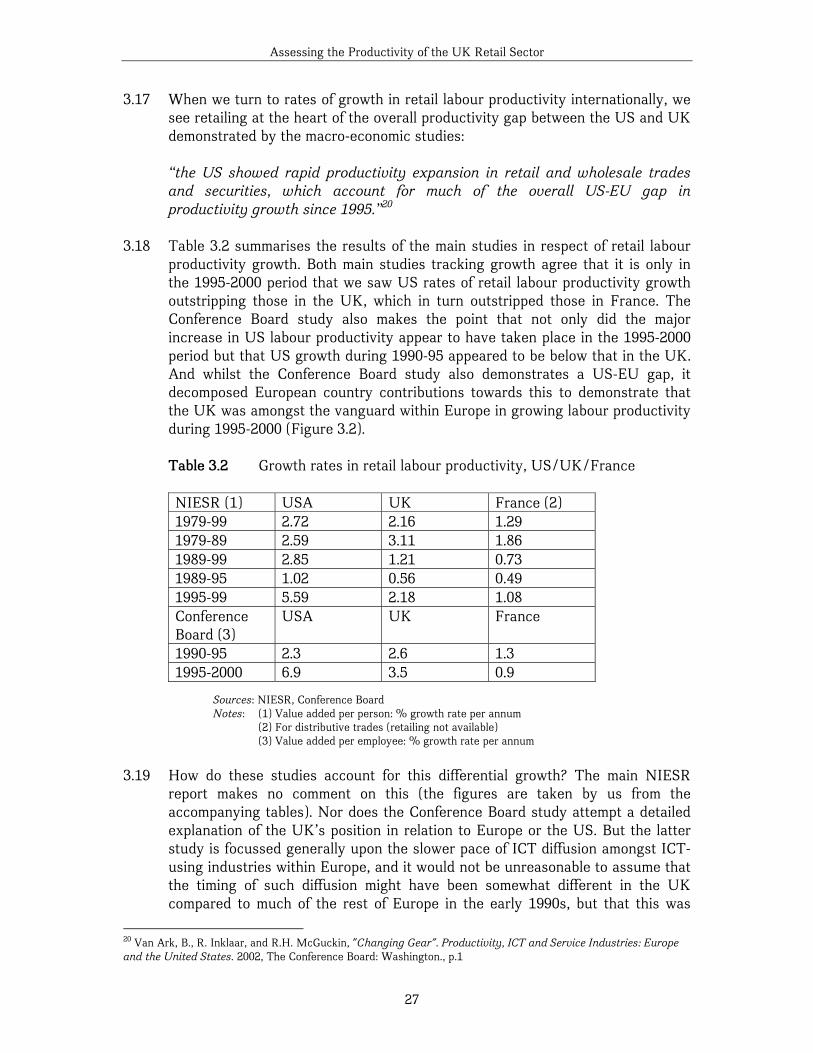
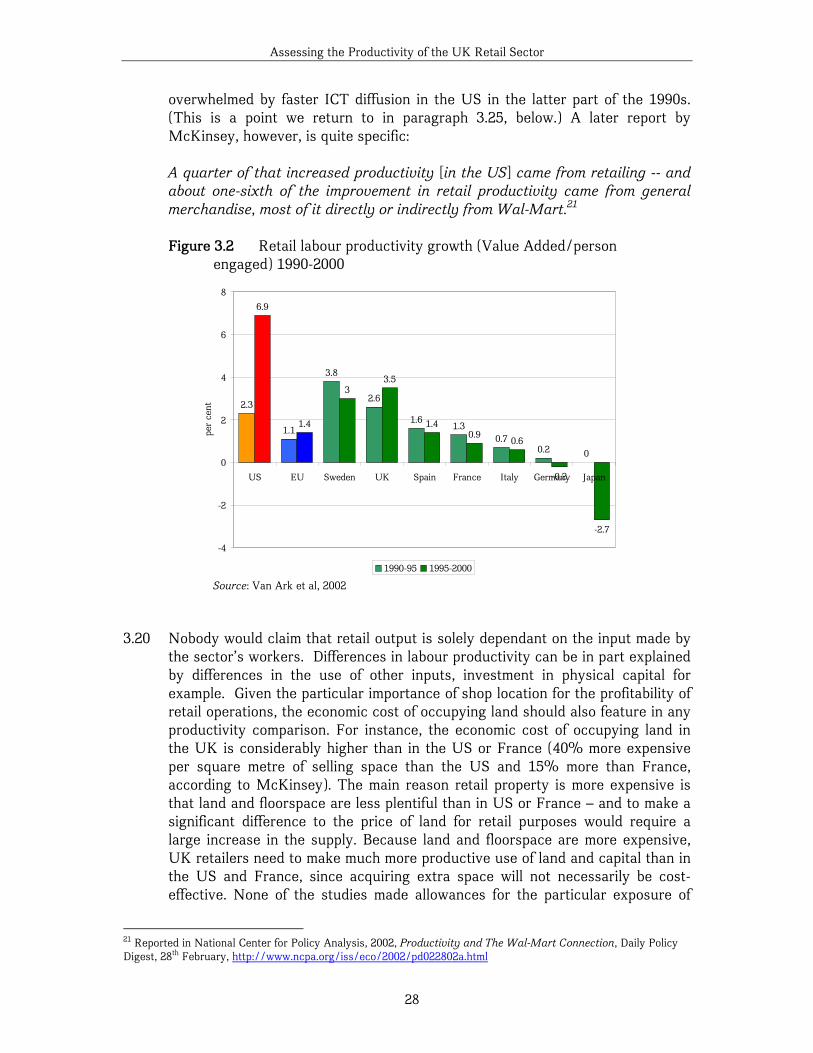
3.18 Table 3.2 summarises the results of the main studies in respect of retail labour productivity growth. Both main studies tracking growth agree that it is only in the 1995-2000 period that we saw US rates of retail labour productivity growth outstripping those in the UK, which in turn outstripped those in France. The Conference Board study also makes the point that not only did the major increase in US labour productivity appear to have taken place in the 1995-2000 period but that US growth during 1990-95 appeared to be below that in the UK. And whilst the Conference Board study also demonstrates a US-EU gap, it decomposed European country contributions towards this to demonstrate that the UK was amongst the vanguard within Europe in growing labour productivity during 1995-2000 (Figure 3.2).
Table 3.2 Growth rates in retail labour productivity, US/UK/France
NIESR (1) USA UK France (2) 1979-99 2.72 2.16 1.29 1979-89 2.59 3.11 1.86 1989-99 2.85 1.21 0.73 1989-95 1.02 0.56 0.49 1995-99 5.59 2.18 1.08 Conference Board (3)
USA UK France
1990-95 2.3 2.6 1.3 1995-2000 6.9 3.5 0.9
Sources: NIESR, Conference Board Notes: (1) Value added per person: % growth rate per annum
(2) For distributive trades (retailing not available) (3) Value added per employee: % growth rate per annum
3.19 How do these studies account for this differential growth? The main NIESR
report makes no comment on this (the figures are taken by us from the accompanying tables). Nor does the Conference Board study attempt a detailed explanation of the UK’s position in relation to Europe or the US. But the latter study is focussed generally upon the slower pace of ICT diffusion amongst ICT-using industries within Europe, and it would not be unreasonable to assume that the timing of such diffusion might have been somewhat different in the UK compared to much of the rest of Europe in the early 1990s, but that this was
20 Van Ark, B., R. Inklaar, and R.H. McGuckin, "Changing Gear". Productivity, ICT and Service Industries: Europe and the United States. 2002, The Conference Board: Washington., p.1
Assessing the Productivity of the UK Retail Sector
28
overwhelmed by faster ICT diffusion in the US in the latter part of the 1990s. (This is a point we return to in paragraph 3.25, below.) A later report by McKinsey, however, is quite specific:
A quarter of that increased productivity [in the US] came from retailing -- and about one-sixth of the improvement in retail productivity came from general merchandise, most of it directly or indirectly from Wal-Mart.21
Figure 3.2 Retail labour productivity growth (Value Added/person engaged) 1990-2000
2.3
1.1
3.8
2.6
1.61.3
0.70.2 0
6.9
1.4
33.5
1.40.9
0.6
-0.2
-2.7
-4
-2
0
2
4
6
8
US EU Sweden UK Spain France Italy Germany Japan
per
cent
1990-95 1995-2000 Source: Van Ark et al, 2002
3.20 Nobody would claim that retail output is solely dependant on the input made by
the sector’s workers. Differences in labour productivity can be in part explained by differences in the use of other inputs, investment in physical capital for example. Given the particular importance of shop location for the profitability of retail operations, the economic cost of occupying land should also feature in any productivity comparison. For instance, the economic cost of occupying land in the UK is considerably higher than in the US or France (40% more expensive per square metre of selling space than the US and 15% more than France, according to McKinsey). The main reason retail property is more expensive is that land and floorspace are less plentiful than in US or France – and to make a significant difference to the price of land for retail purposes would require a large increase in the supply. Because land and floorspace are more expensive, UK retailers need to make much more productive use of land and capital than in the US and France, since acquiring extra space will not necessarily be cost-effective. None of the studies made allowances for the particular exposure of
21 Reported in National Center for Policy Analysis, 2002, Productivity and The Wal-Mart Connection, Daily Policy Digest, 28th February, http://www.ncpa.org/iss/eco/2002/pd022802a.html
Assessing the Productivity of the UK Retail Sector
29
UK retailing to higher land costs in calculating benchmark levels of labour productivity in the sector, but the McKinsey study estimated that smaller grocery store sizes (a logical outcome of differential land costs) contributed some five percentage points of difference in labour productivity between the US and the UK.
3.21 It is also approaching a statement of the obvious to say that the retail trades are
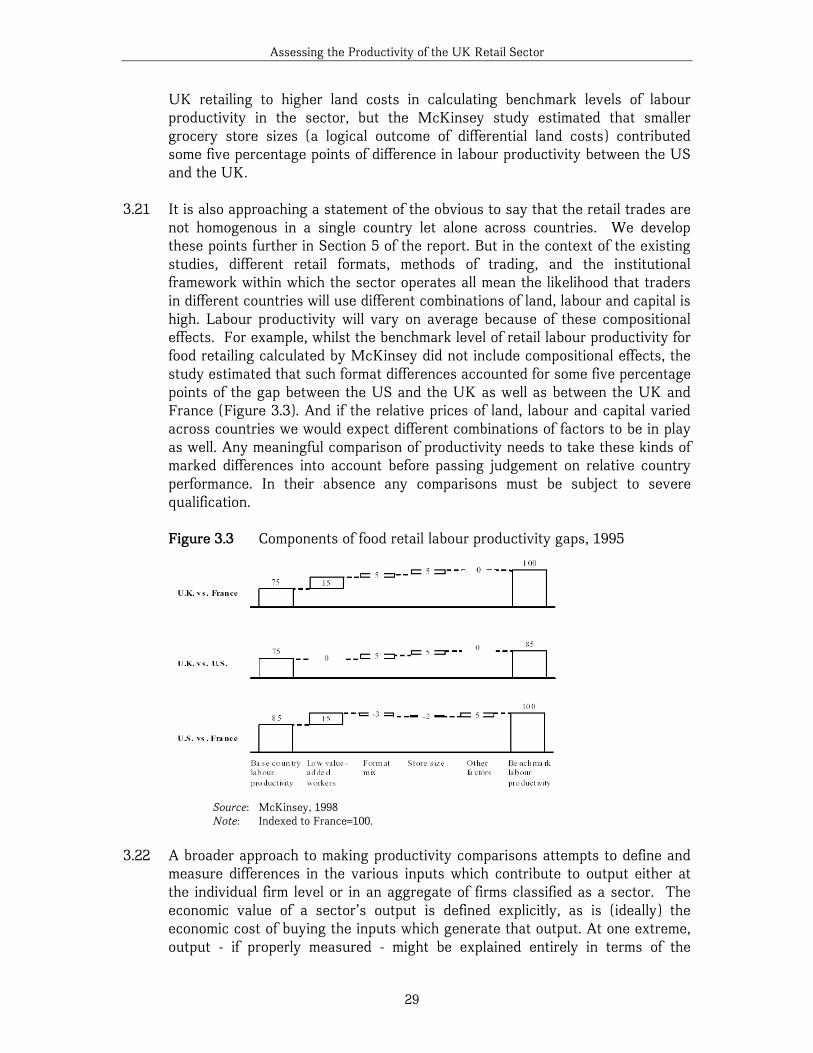
not homogenous in a single country let alone across countries. We develop these points further in Section 5 of the report. But in the context of the existing studies, different retail formats, methods of trading, and the institutional framework within which the sector operates all mean the likelihood that traders in different countries will use different combinations of land, labour and capital is high. Labour productivity will vary on average because of these compositional effects. For example, whilst the benchmark level of retail labour productivity for food retailing calculated by McKinsey did not include compositional effects, the study estimated that such format differences accounted for some five percentage points of the gap between the US and the UK as well as between the UK and France (Figure 3.3). And if the relative prices of land, labour and capital varied across countries we would expect different combinations of factors to be in play as well. Any meaningful comparison of productivity needs to take these kinds of marked differences into account before passing judgement on relative country performance. In their absence any comparisons must be subject to severe qualification.
Figure 3.3 Components of food retail labour productivity gaps, 1995
Source: McKinsey, 1998 Note: Indexed to France=100.
3.22 A broader approach to making productivity comparisons attempts to define and
measure differences in the various inputs which contribute to output either at the individual firm level or in an aggregate of firms classified as a sector. The economic value of a sector’s output is defined explicitly, as is (ideally) the economic cost of buying the inputs which generate that output. At one extreme, output - if properly measured - might be explained entirely in terms of the
Assessing the Productivity of the UK Retail Sector
30
capital, labour and land inputs used to add value to the purchase of materials. Again the cost of resource inputs should ideally be properly measured to reflect their true economic cost. If the value of the sector output exceeds the economic costs of the sector’s inputs, then the explanation of output must also rest on something else as well as resource inputs. This something else is caught by the catch all phrase of total factor productivity (TFP)
3.23 This is an attractive alternative for measuring the efficiency of a sector for which
we know the international variability of factor costs is high. Indeed, in conceptual terms TFP is a superior measure of productivity to labour productivity alone. However, it is also a technically and statistically more challenging alternative to measuring productivity than focusing on labour alone, and for this reason it is not surprising that few studies have sought to take this approach. The study by the McKinsey Global Institute was one exception and one which examined both labour and total factor productivity within food retailing. Whilst it was critical of the levels of the UK’s labour productivity during the early 1990s, it praised performance in TFP terms.
“Our study suggests that UK [food] retailers are not distinguished by their labour productivity: they achieve only 75% of the benchmark set by France. But in terms of total factor productivity - labour and capital productivity combined – the United Kingdom sets the global standard jointly with France.”22
McKinsey’s analysis used total gross margin per square metre of selling space as the proxy for capital inputs in their study and this metric provides 40% of the TFP calculation.
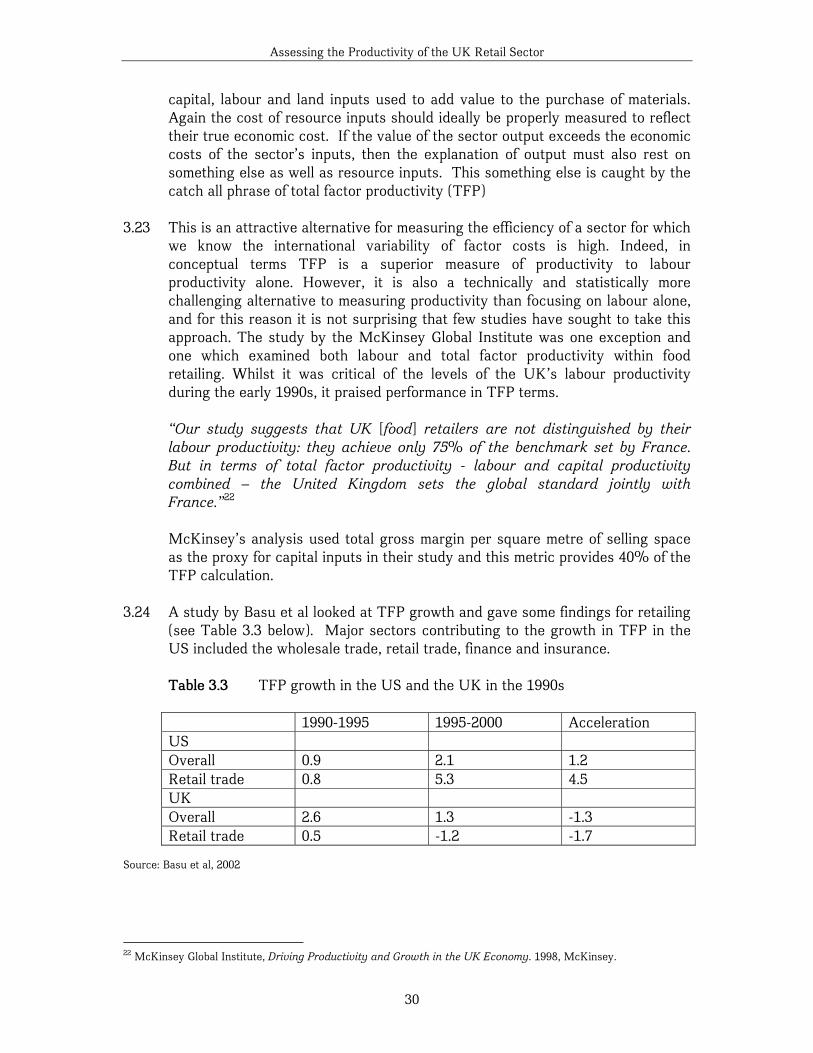
3.24 A study by Basu et al looked at TFP growth and gave some findings for retailing
(see Table 3.3 below). Major sectors contributing to the growth in TFP in the US included the wholesale trade, retail trade, finance and insurance.
Table 3.3 TFP growth in the US and the UK in the 1990s
1990-1995 1995-2000 Acceleration US Overall 0.9 2.1 1.2 Retail trade 0.8 5.3 4.5 UK Overall 2.6 1.3 -1.3 Retail trade 0.5 -1.2 -1.7
Source: Basu et al, 2002
22 McKinsey Global Institute, Driving Productivity and Growth in the UK Economy. 1998, McKinsey.
Assessing the Productivity of the UK Retail Sector
31
Their results are rather puzzling, as others have pointed out:
“.. the absolute numbers for UK TFP growth in .. retail for the second half of the 1990s are puzzling. Can it be that TFP growth was actually negative in the UK during that period? [Using OECD data] for wholesale and retail trade together gives a growth rate of real value added of 3.2% a year, a growth rate for employment of 1.0%, so a rate of labor productivity growth of 2.2%. .. This suggests an unusually high rate of capital accumulation during the period, capital which was not used very productively.”23
Basu et al argue that lower TFP may be a result of investments in ICT leading to the diversion of resources to reorganisation and learning. They also noted that US ICT prices fall faster than UK ones, so that the UK’s ICT and capital investment costs will grow more rapidly for otherwise similar kinds of investments, with a correspondingly differential effect upon productivity. Given that retailing is an intensive ICT-using service, we might expect the differential to be considerably higher for the sector.
3.25 We have already observed that one of the major features of US economic
growth in the last few years has been an extraordinary growth in labour productivity, following an earlier period of relatively slower growth. This most recent spurt has apparently been unaccompanied by any capital deepening. The underlying long-run trend of US productivity growth is currently running at about 2.8 per cent a year, fully double the pre-1995 growth rate. Major recent productivity gains have been focussed on services, especially retailing. Explaining the resolution of this apparent paradox is one of the key components in explaining any apparent gap in productivity growth between the US and Europe, since we know that capital substitution for labour has an important effect on productivity and ICT-using firms, notably retailers, have made significant ICT investments in both regions.
3.26 Recent analysis has shed light on the reasons for this apparent ‘productivity
paradox’, often called the ‘Solow paradox’24. There appear to be several possible explanations:
• inconsistencies that result from different national approaches to the
measurement of ICT investments25, 26
23 Blanchard, O. ‘Comments on "The case of missing productivity growth; or, why has productivity accelerated in the United States but not the United Kingdom" by Basu et al.’ in NBER Macroeconomics Conference. 2003. 24 Named after economist Robert Solow, who remarked that computers could be found everywhere other than in the productivity statistics. 25 Triplett, J.E., ‘Economic Statistics, the New Economy, and the Productivity Slowdown’. in Business Economics. 1999, National Association of Business Economics. p. 13. 26 Pilat, D. ‘International comparisons of productivity - key findings and measurement issues’. in ONS/DTI Productivity Workshop. 2002.
Assessing the Productivity of the UK Retail Sector
32
(“The difference in estimation processes are significant.”27 Software investment may be categorised and accounted for in different ways - as ‘consultancy’, for example. Countries have different methods for estimating the amount of own-account software: one recent US productivity study was constrained to multiply by a factor of 3 the official nominal level of software investment, for example.28 Finally, the ways in which software licenses are treated – especially in relation to the notion of ownership – is problematic.)
• the relative ‘invisibility’ of such investment (ICT investment is an iceberg - with a visible part that is measured by the statisticians, but a hidden part under water consisting of "intangible" productivity-yielding activities. These include: reorganising and reinventing business practices, such as outsourcing, and both formal and informal training.29)
• the time taken for the benefits of ICT investment to emerge30 (It is argued that many productivity studies are flawed because they assume that ICT impact takes place instantly at the point of production. The benefits are arriving years after the money has been spent. In some cases, the potential link between ICT capital expenditure and the outcome in terms of Total Factor Productivity may be a “long and variable lag of between 5 and 15 years”,31 and indeed may be different in countries where it can be introduced more efficiently because of a more modern, consistent or extensive store network (see paragraph 3.24).)
3.27 One broad consequence of this may have been to have under-estimated US
productivity gains in ICT-using services in the 1990-95 period and to have over-estimated it during 1995-2000; and correspondingly to have under-estimated ICT-using services growth in Europe, particularly the UK.
3.28 The most worthwhile estimates of both TFP and labour productivity are those
that are able to overcome problems of definition and measurement of both outputs and inputs. However, these are particularly challenging in the context of cross-country comparisons of the retail trades. We conclude overall that these problems are such that any results obtained must be treated with considerable caution.
27 Pilat, D., (op cit) 28 Basu, S., et al., ‘The Case of the Missing Productivity Growth: Or, Does Information Technology Explain why Productivity Accelerated in the US but not the UK?’ NBER Working Paper No. w10010, 2003. 29 Brynjolfsson, E.H., Lorin M. Shinkyu Yang, ‘Intangible Assets: Computers and Organizational Capital’., in Brookings Papers on Economic Activity. 2002, Brookings Institution Press. p. 137. 30 Anon, ‘The new "new economy" - American productivity - America's extraordinary gains in productivity.’ The Economist, 2003(13 September). 31 Basu, S., et al., (op cit)
Assessing the Productivity of the UK Retail Sector
33
3.2 Understanding the limitations of the top down approach 3.29 We now turn to a more wide-ranging critique. We agree with others who have
written extensively on this topic:
“Despite major efforts by national statistical offices and international organisations, data problems still limit the possibility of comparing growth performances across countries and sectors, as well as over time. Comparability problems have always affected international analyses of growth performances but are particularly relevant at present because of the different pace and comprehensiveness with which different countries have adopted new measurement techniques in their national accounts. In addition, the growing emphasis on growth in quality instead of growth in quantity and the large share of hard to measure services in total output are some of the factors adding to these measurement problems.” 32 “We cannot be sure how much of the differences we observe are the result of inadequate measurement of services output and differences across countries in measurement methodology” (van Ark, 2002). Essentially, the total factor productivity levels in country i relative to the UK are calculated33 as follows:
ln TFPi,uk = ln Qi,uk - α ln Li,uk – (1 - α) ln Ki,uk (1)
where the symbol ln denotes natural logs, Q is total value added in country i relative to the UK (real output), L is relative labour input in the two countries, K is relative capital stocks in the two countries, and α is the share of labour in value added averaged across the two countries.
3.30 The same approach is used in comparing the same industry, such as retailing, in
two countries. In this case, the Q, L and K refer to the aggregate industry levels of output, labour and capital, rather than to the national aggregates.
3.31 The difficulties with the approach arise in a number of ways. Equation (1) may
appear scientific, but it conceals many assumptions, each of which may or may not be a reasonable approximation to reality. The key ones are as follows:
• problems of measuring aggregate output, labour and capital
This is particularly relevant to retailing. The heading further sub-divides into a number of separate issues, none of which are at all trivial. We therefore turn to this question first, in section 3.2.1 below.
32 Scarpetta, S., et al., Economic Growth in the OECD Area: Recent trends at the aggregate and sectoral level, 2000, OECD 33 See, for example, M. O’Mahoney and W. de Boer, ‘Britain’s relative productivity performance: updates to 1999’, NIESR, 2002
Assessing the Productivity of the UK Retail Sector
34
• separability of material inputs and other inputs
The approach assumes that it is feasible to separate the input of two potentially measurable inputs, labour and capital, from other inputs such as how efficiently a given stock of capital and labour is used. We discuss this in section 3.2.2 below.
Three further, but more general, econometric issues frame our discussion. They lie outside our direct remit and we therefore address them in more detail in Annexe 2:
• the mathematical specification of the production function
Underpinning the growth accounting method is the neo-classical theory of economic growth34. This theory postulates that the level of aggregate output depends upon the input levels of aggregate labour and aggregate capital, and the state of technology. These are assumed to be connected in a particular mathematical way. The specification which is used is open to question.
• the assumption that all factors in the production process are paid their
marginal product
It is this assumption which enables L to be multiplied by α in (1) and K by (1 - α). Economic theory itself has shown that the assumption that factors are necessarily paid their marginal product is not true35. The issue then becomes how far this assumption is violated in practice.
• the scientific validity of the theory of economic growth which underpins
growth accounting
Finally, we note that the empirical success of this theory in explaining what has actually happened in terms of economic growth is questionable, to say the least.
3.2.1 The problems of measuring aggregate retail output 3.32 We focus on this particular issue because it is of great relevance to the retail
sector. The measurement of output in (1) requires adjusting current price estimates by the rate of inflation to obtain estimates of real output. There is strong evidence that the rate of inflation is substantially over-estimated in official data, and hence the growth in real output is substantially under-
34 The seminal article is R M Solow, ‘A contribution to the theory of economic growth’, Review of Economic Studies, 23, 101-108, 1956 35 For example, the definitive neo-classical work on capital by Bliss concludes that ‘there is no support from the theory of general equilibrium that an input to production will be cheaper in an economy where more of it is available’. See C.J. Bliss, Capital Theory and the Distribution of Income, Elsevier North-Holland, 1975.
Assessing the Productivity of the UK Retail Sector
35
estimated. A substantial proportion of these effects arise from the technological revolution in retailing in recent years.
3.33 In the UK, the Office for National Statistics devotes great attention to the
difficulties involved with measuring output. Similar official bodies in other countries exist. But none of them would claim that their measures were perfect.
3.34 Imagine, for example, a single store whose range of goods, prices, level of capital
input and value added are absolutely identical in every respect in two particular periods of time which are being compared. The quality of the labour force is also identical. The only difference is that in one period, the level of staffing on the tills is, say, only half that of the other. Using equation (1), it is obvious that when the store employs more labour, it has lower total factor productivity. A higher level of labour input is used to produce what is, by one assumption, the same level of value added, and by another (ie that the ‘output’ inclusive of service has increased), a higher level of value-added.
3.35 Yet there is clearly a difference in the offer which the store makes in the two
periods. In one, customers are more likely to have to waste their time queuing at the till. The store which employs more labour is making a better offer to the customer, but it is measured as having lower total factor productivity.
3.36 Of course, if customers value speedy till service sufficiently, once the store uses
more labour it may attract more custom and raise its overall level of value added. But if its competitors respond by increasing their staffing levels at the till, this comparative advantage may disappear. The industry as a whole sells a better quality ‘output’ (ie product + service) to the consumer, but its TFP has fallen.
3.37 This example is by no means a purely imaginary construct. Something very
similar to this occurred when the UK food superstore retailers introduced Sunday trading. There was an increase in convenience for the customers. But the amount of labour used increased, and the effect on total sales was very difficult to discern, so TFP – had it been calculated using (1) – would have fallen. In Australia, measured retail productivity declined when shopping hours were extended - the extra convenience was not taken into account in the statistics36.
3.38 We can think of the above example as a particular case of the more general
concept of a change in quality of an existing product. This in turn is simply one of a number of factors which have made the measurement of retail output and productivity increasingly problematic at the aggregate level.
3.39 Many of the difficulties with the usual economic analyses arise from the problem
of measuring inflation. This is needed in order to convert nominal values on, say, output, into real values. Theoretically, the price level should be measured
36 Quiggin, J., (2003), ‘Walmart and Productivity’, weblog, August 21.
Assessing the Productivity of the UK Retail Sector
36
using a cost-of-living index (COLI)37. A COLI is based on the minimum levels of income needed to reach a given utility level at two different time periods, given the prices and goods available in the economy. A formal mathematical definition is given in, for example, Hausmann.
3.40 We must emphasise that bodies such as the ONS are aware of these problems.
However, their responses to date can be shown by economic theory to lead to substantial over-estimates of the rate of inflation, and hence to under-estimates of the growth in real output.
The issues are:
• substitution by consumers between more and less expensive products • price dispersion • the introduction of new products • quality change in existing products • shifts in shopping patterns to lower priced stores (so-called outlet bias).
Substitution bias
3.41 This is straightforward to define. The standard way of measuring inflation takes
a particular basket of goods chosen to be representative of consumer spending at some point in time. The cost of purchasing this same basket of goods in a different period is then calculated. The two costs are then compared.
3.42 There are important issues of index number theory involved in this, which need
not concern us in detail. In principle, the effect of consumer substitution behaviour can be taken into account using a particular index approach38. However, this requires knowledge of consumer expenditure weights in both periods. The ONS does update the weights which it uses, but there is inevitably a time lag involved so that the most recent weights are not used.
3.43 The substitution problem arises because the use of a fixed basket of goods does
not take into account the fact that consumers will shift away from goods that have become relatively expensive to those which have become relatively cheaper. (And of course is further complicated by the international variability in basket composition.)
3.44 A fairly substantial literature exists on this question, but it is probably the least
important of the problems which arise in the measurement of inflation. Calculations of the potential size of this bias suggest that official estimates over-
37 See, for example, M.Boskin et.al. Toward a more accurate measure of the cost of living, Final Report to the Senate Finance Committee, 1996, K. Abraham, J. Greenlees and B. Moulton, ‘Working to improve the consumer price index’, Journal of Economic Perspectives, 12, 27-36, 1998, J.E. Tripplett, ‘Should the cost of living index provide the conceptual framework for a consumer price index?’, Economic Journal, 111, F311-335, 2001 and J Hausmann, ‘Sources of bias and solutions to bias in the consumer price index’, Journal of Economic Perspectives, 17, 23-44, 2003. 38 Diewert, W.E. ‘Exact and superlative index numbers’, Econometrica, 114-145, 1976.
Assessing the Productivity of the UK Retail Sector
37
state the rise in the COLI by about 0.3 per cent a year in the US39 and around 0.1 per cent in the UK40.
Price dispersion
3.45 In retailing, for example, the producers (ie retailers) have lump sum costs of
staying in operation which they must distribute over consumers. Consumers have fixed costs associated with visiting any given retailer. So the retailer must offer a basket of goods which justifies the trip by the consumer. Given the heterogeneous nature of consumers, the natural outcome is intertemporal and interstore price dispersion.
3.46 This is formalised in economic theory with the concept of Ramsey pricing41. In a
competitive market with a homogenous commodity, price should be set equal to marginal cost. In this case, prices reflect resource cost. Prices no longer reflect marginal cost. Instead, product differentiation is used to allocate portions of fixed and other costs in ways which takes account of the price elasticities of demand.
3.47 Technological advances have made product differentiation and price dispersion
much more feasible and easy to implement. 3.48 The impact of this is estimated to be substantial. For example, in the United
States the official estimate of the Consumer Price Index has been calculated to over-state the rate of inflation in food retailing by 1.4 percentage points in each year from 1978 to 199642. In turn, this implies considerable under-estimates of real output in the sector.
The introduction of new products
3.49 Many new products increase consumer welfare substantially. The approach
used to calculate the increases follows standard economic principles. Once sufficient data on the new product exist, a demand curve can be estimated. An exact estimate of the gain to consumer welfare can then be made, but the informational requirements are strong43. A lower bound calculation can be made which only requires an estimate of the own price elasticity of demand of the product.44
39 Shapiro, M. and D. Wilcock, ‘Alternative strategies for aggregating prices in the CPI’, Federal Reserve Bank of St Louis Review, 79, 113-125, 1997. 40 Blow, L. and I. Crawford, ‘The cost of living with the RPI: substitution bias in the UK RPI’, Economic Journal, 111, F357-382, 2001. 41 Bliss, C.J. ‘A theory of retail pricing’, Journal of Industrial Economics, 36, 375-392, 1988. 42 Nakamura, L.I. ‘The measurement of retail output and the retail revolution’, Canadian Journal of Economics, 32, 408-425, 1999. 43 Hausmann, J. ‘Exact consumer’s surplus and deadweight loss’, American Economic Review, 71, 662-676, 1981. 44 See, for example, J Hausmann, ‘Cellular telephone, new products and the CPI’, Journal of Business and Economics Statistics, 17, 188-194, 1999.
Assessing the Productivity of the UK Retail Sector
38
3.50 A number of studies have been carried out in the United States which show that new products such as the minivan or even Apple Cinnamon Cheerios provide large welfare benefits to consumers45.
3.51 There is typically a long time lag before new products enter into the calculation
of the price level in official statistics, and even then no adjustment is made for the consumer gains which it provides relative to previously existing goods. Quality change in existing products
3.52 The increase in consumer welfare can be measured in the same way as with the
introduction of new products or, in the case of retailing, new shops or new shop formats offering new ranges or services. Again, official methods of calculating the price level do not make sufficient allowance for the gain in consumer welfare. This is another source of over-estimation of inflation:
“present methods probably still fail to capture many important quality improvements occurring in these [service] industries”46
Outlet bias
3.53 This is particularly important in retailing, where some countries have seen
dramatic shifts in consumer purchasing habits over the past ten or twenty years. 3.54 We have not been able to find a reference which quantifies the gain to consumer
welfare of shifts in retail outlets, but in principle it seems that these could be substantial. In the United States, for example, the official data gradually rotate products sold in the calculation of the Consumer Price Index. However, when a given product sold at a department store is rotated out of the index and the same product sold at, say, Wal-Mart is introduced in its place, the official procedure treats these as different goods and not as a reduction in the price of the same good.
3.55 The problems we have noted above are problems with the measurements in the
economic analyses as they are normally conducted. Some retailers recognise these problems in their own estimates of efficiency and seek to allow for them:
“In monitoring store operations efficiency, we are most interested in unit productivity metrics. Sales dollar productivity is less meaningful because unit price fluctuations can influence this number. Unit prices can increase due to product mix, pricing decisions, good/better/best offering decisions, and/or or overall macro-economic conditions. Isolating productivity analysis to units per payroll hour provides more clarity around store operations efficiency.” (US non-food retailer)
45 See the references in J Hausmann, op.cit, 2003. 46 Gullickson, W. and M.J. Harper, ‘Bias in aggregate productivity trends revisited.’ Monthly Labor Review, 2002(March): p. 32-40.
Assessing the Productivity of the UK Retail Sector
39
3.56 There are further problems with the measurement of retail output which are
more conceptual – and of course involve consequent measurement problems. What customers gain from retailers and what retailers provide is a total ‘offer’ which includes tangible and non-tangible items. The ‘offer’ of a retailer is frequently defined or encapsulated as its ‘format’. For example, the ‘output’ of a high class fashion retailer with a few outlets in major city centres selling a single exclusive brand of clothing is not the same as the output of a discount, warehouse style clothing retailer with a large number of stores in edge-of-town locations. It is not different in quantity, it is different in kind.
3.2.3 Separability of material inputs and other inputs 3.57 Conceptually, it is quite clear that there are indeed distinct effects from different
kinds of input. A firm may make more or less efficient use of its workforce and its equipment. The issue is how easy it is to make this separation in practice. More precisely, it is how robust the conclusions are to different ways of making the separation. Certainly, the early empirical work carried out using growth accounting arrived at very different results, depending on how the separation was made.
3.58 Consider a practical illustration. A retailer has the problem of trying to minimise
the transport costs involved in supplying its stores. This can be a difficult mathematical problem. There is a large amount of capital tied up in this, such as the cost of the lorries, the distribution centres and so on. Imagine now that the retailer acquires a piece of mathematical software which enables a more efficient solution to the problem to be implemented. The cost of the software, relative to the rest of the capital involved, is completely trivial. The value of the capital input has risen, but by a trivially small amount.
3.59 How is this to be accounted for? Does it add to the size of the capital stock? Or
should the gain in efficiency be attributed to ‘other inputs’ and hence appear in total factor productivity? Reasonable people could arrive at different judgements here, and there is no unequivocally correct answer. But the practical implications of the choice are non-trivial.
3.60 Another example is the introduction of word processing software. This has
enabled managers to type first (or even complete) drafts of documents themselves, and has made particular support skills redundant. No firm now has a typing pool. In principle, this enables the firm to produce the same level of output with a smaller labour force. The capital stock has risen, but again by an amount which is entirely trivial relative to the size of the capital stock before the software was introduced. Again, how is this to be accounted for? And, again, it is clear that there is no single correct answer. We can see the contribution of this factor to the difficulties of measuring capital stock more generally within retailing, by examining the ways in which investments in information and
Assessing the Productivity of the UK Retail Sector
40
communications technology (ICT) have been measured by statisticians and employed by retailers.
3.3 Alternatives to the aggregate approach: measuring retail productivity at the micro-level
3.61 More recently, economists and statisticians have taken to using firm-level data
in an attempt to understand aspects of the retail productivity ‘problem’ that appear in top-down approaches. However, the quality and quality of information available to measure firm or establishment productivity in the retail sector is much poorer than in manufacturing47. Both the US Census Bureau and the UK ONS have been aware of the deficiency in the data environment at the firm level for some time. Most studies have focused upon labour productivity, but in the UK figures before 1998 are more unreliable. Early studies in this area appear promising, but some findings conflict and there is much work to be done. For example, despite increasing concentration in many countries, the retail sector is one dominated by small firms: some 64% of retail firms in the UK in 2001 employed fewer than 10 people48. Survey data is generally less reliable than for sectors with a greater proportion of large reporting units; estimation and grossing- up procedures are also less reliable. Conversion of average employee numbers to FTE equivalents is also somewhat vexed, in a similar way to top-down studies.
3.62 With these caveats, the availability of firm level data allows the calculation of
productivity and its decomposition by size of business and by sector. No internationally comparable data is available, but preliminary UK data provides food for thought. Figures 3.4 and 3.5 show Gross Value Added productivity by size of business for all retailing (SIC 52) and non-specialised stores (SIC 521). Both figures indicate that, in general terms, the largest retailers are more productive than the smaller. In the case of non-specialised retailing (where we find both large supermarket companies and general merchandisers) this is also the case, although the pattern amongst the smaller businesses is not as clear.
47 Doms, M., R. Jarmin, and S. Klimek. ‘IT Investment and Firm Performance in US Retail Trade’. in OECD Workshop on Firm Level Statistics. 2001: OECD. 48 Office of National Statistics, Annual Business Inquiry 2001.
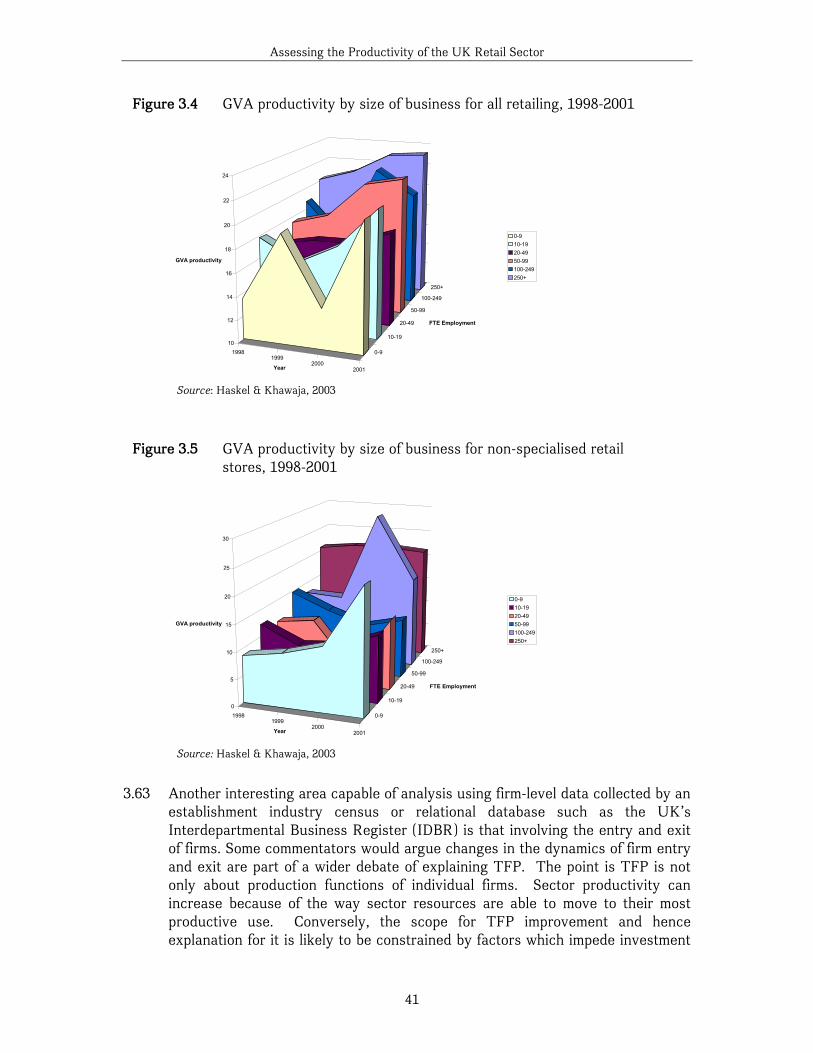
Assessing the Productivity of the UK Retail Sector
41
3.63 Another interesting area capable of analysis using firm-level data collected by an
establishment industry census or relational database such as the UK’s Interdepartmental Business Register (IDBR) is that involving the entry and exit of firms. Some commentators would argue changes in the dynamics of firm entry and exit are part of a wider debate of explaining TFP. The point is TFP is not only about production functions of individual firms. Sector productivity can increase because of the way sector resources are able to move to their most productive use. Conversely, the scope for TFP improvement and hence explanation for it is likely to be constrained by factors which impede investment
Figure 3.5 GVA productivity by size of business for non-specialised retail stores, 1998-2001
19981999
20002001
0-9
10-19
20-49
50-99
100-249
250+
0
5
10
15
20
25
30
GVA productivity
Year
FTE Employment
0-910-1920-4950-99100-249250+
Source: Haskel & Khawaja, 2003
Figure 3.4 GVA productivity by size of business for all retailing, 1998-2001
19981999
20002001
0-9
10-19
20-49
50-99
100-249
250+
10
12
14
16
18
20
22
24
GVA productivity
Year
FTE Employment
0-910-1920-4950-99100-249250+
Source: Haskel & Khawaja, 2003
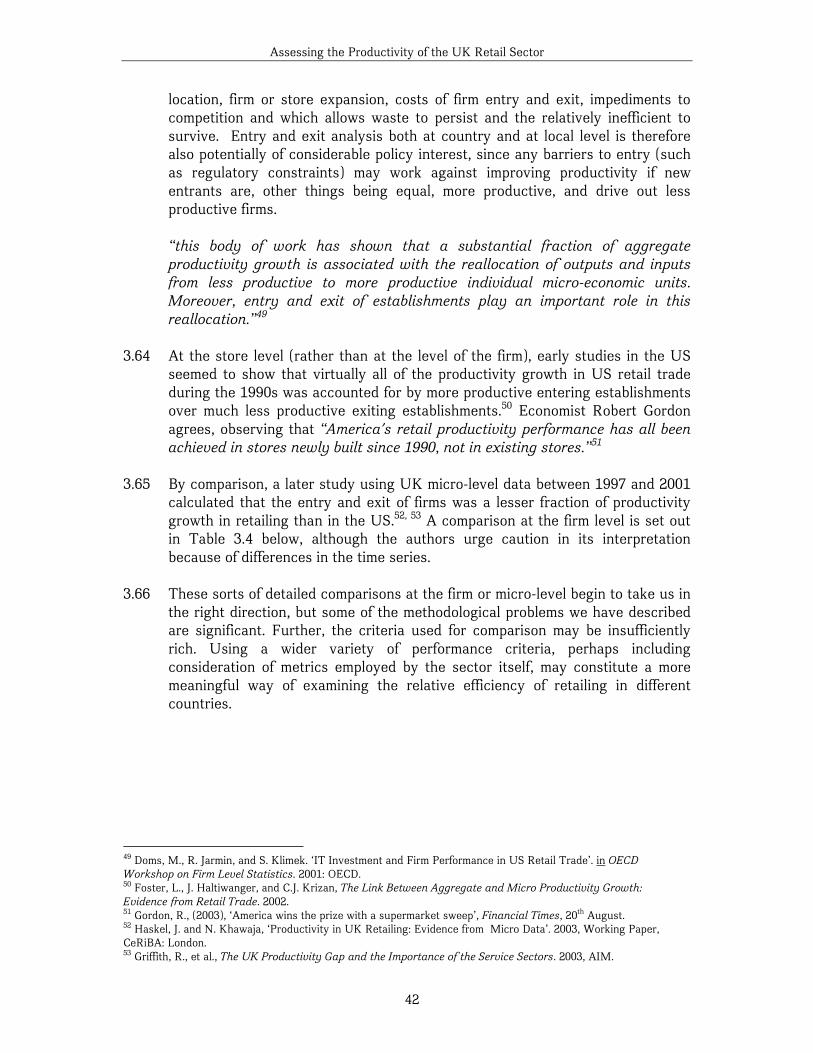
Assessing the Productivity of the UK Retail Sector
42
location, firm or store expansion, costs of firm entry and exit, impediments to competition and which allows waste to persist and the relatively inefficient to survive. Entry and exit analysis both at country and at local level is therefore also potentially of considerable policy interest, since any barriers to entry (such as regulatory constraints) may work against improving productivity if new entrants are, other things being equal, more productive, and drive out less productive firms.
“this body of work has shown that a substantial fraction of aggregate productivity growth is associated with the reallocation of outputs and inputs from less productive to more productive individual micro-economic units. Moreover, entry and exit of establishments play an important role in this reallocation.”49
3.64 At the store level (rather than at the level of the firm), early studies in the US
seemed to show that virtually all of the productivity growth in US retail trade during the 1990s was accounted for by more productive entering establishments over much less productive exiting establishments.50 Economist Robert Gordon agrees, observing that “America's retail productivity performance has all been achieved in stores newly built since 1990, not in existing stores.”51
3.65 By comparison, a later study using UK micro-level data between 1997 and 2001
calculated that the entry and exit of firms was a lesser fraction of productivity growth in retailing than in the US.52, 53 A comparison at the firm level is set out in Table 3.4 below, although the authors urge caution in its interpretation because of differences in the time series.
3.66 These sorts of detailed comparisons at the firm or micro-level begin to take us in
the right direction, but some of the methodological problems we have described are significant. Further, the criteria used for comparison may be insufficiently rich. Using a wider variety of performance criteria, perhaps including consideration of metrics employed by the sector itself, may constitute a more meaningful way of examining the relative efficiency of retailing in different countries.
49 Doms, M., R. Jarmin, and S. Klimek. ‘IT Investment and Firm Performance in US Retail Trade’. in OECD Workshop on Firm Level Statistics. 2001: OECD. 50 Foster, L., J. Haltiwanger, and C.J. Krizan, The Link Between Aggregate and Micro Productivity Growth: Evidence from Retail Trade. 2002. 51 Gordon, R., (2003), ‘America wins the prize with a supermarket sweep’, Financial Times, 20th August. 52 Haskel, J. and N. Khawaja, ‘Productivity in UK Retailing: Evidence from Micro Data’. 2003, Working Paper, CeRiBA: London. 53 Griffith, R., et al., The UK Productivity Gap and the Importance of the Service Sectors. 2003, AIM.
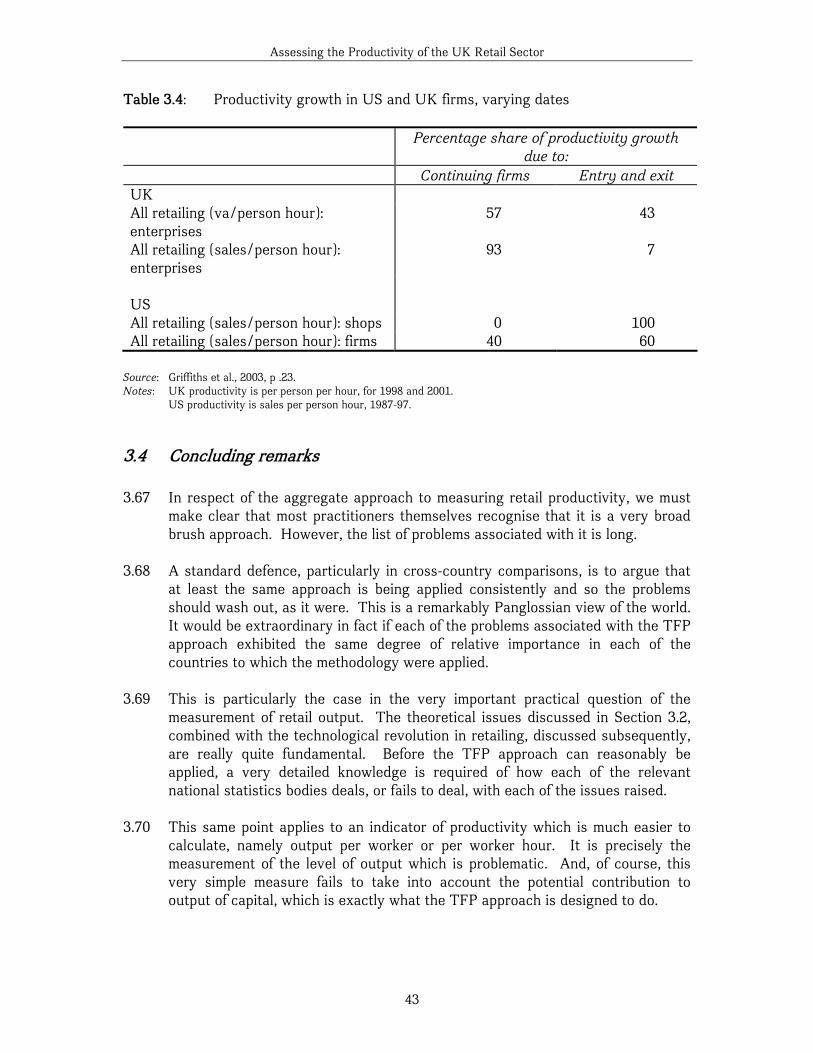
Assessing the Productivity of the UK Retail Sector
43
Table 3.4: Productivity growth in US and UK firms, varying dates Percentage share of productivity growth
due to: Continuing firms Entry and exit UK All retailing (va/person hour): enterprises
57 43
All retailing (sales/person hour): enterprises
93 7
US All retailing (sales/person hour): shops 0 100 All retailing (sales/person hour): firms 40 60
Source: Griffiths et al., 2003, p .23. Notes: UK productivity is per person per hour, for 1998 and 2001.
US productivity is sales per person hour, 1987-97.
3.4 Concluding remarks 3.67 In respect of the aggregate approach to measuring retail productivity, we must
make clear that most practitioners themselves recognise that it is a very broad brush approach. However, the list of problems associated with it is long.
3.68 A standard defence, particularly in cross-country comparisons, is to argue that
at least the same approach is being applied consistently and so the problems should wash out, as it were. This is a remarkably Panglossian view of the world. It would be extraordinary in fact if each of the problems associated with the TFP approach exhibited the same degree of relative importance in each of the countries to which the methodology were applied.
3.69 This is particularly the case in the very important practical question of the
measurement of retail output. The theoretical issues discussed in Section 3.2, combined with the technological revolution in retailing, discussed subsequently, are really quite fundamental. Before the TFP approach can reasonably be applied, a very detailed knowledge is required of how each of the relevant national statistics bodies deals, or fails to deal, with each of the issues raised.
3.70 This same point applies to an indicator of productivity which is much easier to
calculate, namely output per worker or per worker hour. It is precisely the measurement of the level of output which is problematic. And, of course, this very simple measure fails to take into account the potential contribution to output of capital, which is exactly what the TFP approach is designed to do.
Assessing the Productivity of the UK Retail Sector
44
3.71 These difficulties of definition and measurement are relevant to comparisons of levels of productivity across countries. They apply as much to labour productivity as they do TFP. But they pose a question which neither we nor anybody else thus far has been able to answer. This is whether the qualification which needs to be given to any estimates of retail sector productivity measured by either labour productivity or TFP, applies equally across countries. In the absence of such an assessment it cannot be said whether current estimates of labour productivity are more or less equally unreliable nor the degree of their unreliability. They do therefore need to be treated with considerable care.
3.72 Do the estimates of retail trade productivity across countries require so much
qualification in their interpretation that the numbers are meaningless? This has to be a judgement assessed against the broad magnitude of the differences. As a measure of relative economic efficiency, comparisons of TFP are preferred over comparisons of labour productivity alone. The striking feature about the estimates of labour productivity and TFP is the difference in the UK ranking they portray. On the preferred measure of TFP, the UK emerges according to McKinsey as productive as its major G7 comparator. If the productivity of two countries, or two industries in different countries, were very different, the crude, broad brush approaches of output per worker or TFP would almost certainly reveal a substantial gap. But what is at issue is not whether retailing in, say, France has double the retail labour productivity level of the UK. Rather, it is claimed that the gap may be of the order of 20 per cent54. The problems associated with the aggregate approach are such that it is difficult to argue that such a conclusion is reliable and indeed could even be within a putative margin for error. Certainly, it would be most unwise to attempt to draw firm policy implications from the analysis.
3.73 Very detailed comparisons of individual firms, or even individual stores, using a
variety of performance criteria, may well form a much sounder methodological basis for examining the relative efficiency of retailers in different countries. Early work in this area using establishment data (the Annual Respondents Database in the UK and the 1992 and 1997 Census of Retail in the US) shows considerable promise, but the international comparative dimension of this work is presently underdeveloped and the results insufficiently robust to draw firm conclusions or to drive policy.
54 McKinsey Global Institute, Driving Productivity and Growth in the UK Economy. October 1998, McKinsey.
Assessing the Productivity of the UK Retail Sector
45
4.0 The retailer’s approach to measuring productivity and performance.
4.1 Retailers are of course not unmindful of the need to manage the productivity and
efficiency of their businesses. However, much of the language and many of the indicators they use are very different from those employed in economic analysis.
4.2 The larger, publicly-quoted retailers tend to eschew aggregate economic
approaches to the measurement of productivity, in favour of firm-level financial or operating measures and benchmarks that are meaningful to those who monitor the performance of their businesses – investors and shareholders – and which are more amenable to comparison and control. Also, whilst smaller and unquoted retailers have fewer stakeholders to convince, they similarly rely upon a relatively common set of operating and performance ratios, with trade associations and small business advisory services recommending the use of industry performance figures as benchmarks.
4.3 In this section of the report, we seek to summarise the kinds of measures that
leading UK retailers use on a day-to-day basis to track both their efficiency and performance. We also take the opportunity of assessing how publicly-quoted UK retailers perform on an international comparative basis using published efficiency indicators. This is done in aggregate and by means of a selection of matching studies. As in Section 3, we take the opportunity critically to review the appropriateness and reliability of the international comparative data collected by retail firms themselves. Such international corporate analysis is not without its own methodological difficulties, but it provides an additional dimension and a richer context for our subsequent discussion of structural and environmental explanations for any differences in performance.
4.4 As part of the study, we conducted 20 interviews with industry participants in
the UK, including the leading retailers and retail analysts. We also conducted a small number of interviews with several leading retail CEOs and CFOs in the US.
4.1 Retail Key Performance Indicators 4.5 Retailers are of course entitled to a view on the relevance of productivity as seen
by economists. A majority of retailers interviewed see the top-down economic notions of productivity – labour, capital and total factor – as not being particularly useful in practice. This should not surprise us. The major reason is that the aggregated view of productivity as espoused by economic theory does not help retailers gain practical insights into their own efficiency or, ultimately, effectiveness as organisations or as a sector, given the difficulties we have already discussed in terms of international comparability. In the opinion of one respondent, productivity research is “so mired in theory that it has lost the
Assessing the Productivity of the UK Retail Sector
46
plot” (non-food retailer). Most retailers’ preference, instead, is to manage the productivity of the various elements of business – labour and space in particular – via cost controls, which then allows for further aggregation of the relevant information into financial performance metrics. Often, balanced scorecards and their equivalents are used to drive the internal understanding of the business and operating improvements. One question for this chapter is whether some of the problems of the aggregate approach discussed in the previous section are common to retailers' own definition and measurement of productivity. We argue that the care needed at the aggregate level in interpreting the data available also applies to care at the level of the individual firm.
4.6 UK retailers, almost without exception, define productivity as achievement of
integrated targets in the following areas:
- Sales - Product range - Service levels - Availability - Customer satisfaction (price-value-service-convenience components) - Employee contribution (often measured in terms of labour turnover) - Operating & financial performance.
Further, financial performance metrics are communicated to the various stakeholder groups and serve as the foundation for assessment of the retailers’ success. It is important to realise that the UK retailers are very operationally focussed in their measurement of retail productivity, although admittedly the managerial emphasis and relative importance of specific measures may not be uniform across the individual companies.
“Productivity [in retailing], ultimately, is the balance between the social side – training and so on – and the financial side. These both should go hand in glove. If you train people better, you should get more sales through. The third element is IT – using the efficient systems, in stores in particular, transaction processing and so on” (UK non-food retailer) This statement suggests productivity is about the skills of the labour force, use of technology and how the two are combined. Economists, we suggest, could happily agree with this.
4.7 A multitude of Key Performance Indicators (KPIs) are used by UK retailers, but
a set of some 21 commonly-employed indicators recurred in our discussions, although their relative importance varied by category and size of retailer. The level of detail in measurement terms compared to top-down aggregate studies is striking. Those related to efficiency can be broadly summarised in the areas of labour, space and capital. (Space and capital KPIs are separately identified below, since this is how retailers think of them, although we recognise that in economic terms, space KPIs can be considered as a subset of capital measures.)
Assessing the Productivity of the UK Retail Sector
47
Labour KPIs
- Labour cost budgets (weekly/monthly) for each store - Overall labour costs (including as percentage of sales) - Sales/profit per employee - Sales/profit per hour worked - Gross margin return on labour (GMOL) - Units sold per hour worked - Till throughput (Items per hour going through the checkout till) - Efficiency ratio (the ratio of hours required to run the store
efficiently according to the model, to the actual hours used) - Staff turnover - Various customer satisfaction measures
Space KPIs
- Sales/profit density (sometimes in units per square foot) - Stock availability (closely relates to and determines space
productivity) - Ratio of selling vs. non-selling space - Linear density (in an experimental stage for many) - Trading intensity, or balance of customer traffic, and physical
limitations of stores
Sometimes, no measures of space efficiency are used. Instead, the emphasis is put on reaching the optimal configuration of the selling space among the categories. Capital KPIs
- ROCE and its variations - Economic profit or EVA - Payback period - DCF-based (Discounted Cash Flow) metrics - Cost of maintaining the capital base (store base) - Depreciation as percentage of sales
4.8 While we do not suggest that these 21 commonly-employed KPIs that we have identified as being used by retailers are suitable for simple application as exhaustive measures of retail productivity, we certainly do believe that they capture important aspects of productivity from the viewpoint of the agents responsible for bottom-up productivity improvements. What most have in common is that both the input (labour space and capital) and the output generated by the use of that input are often measured very indirectly. Whilst it would be helpful to know why change in the costs of occupancy as a percent of
Assessing the Productivity of the UK Retail Sector
48
gross margin, for example, the lack of availability and inconsistency of such data in corporate accounts precludes such a discussion.
4.9 The view of UK retailing from outside, from its US best-in-class peers, supports
much of this perception. The choice of KPIs is not dissimilar, especially in the areas of labour and space - although the choice of KPIs also reflects some of the different priorities of US retailers towards their investors to that in the UK. Amongst the larger US retailers there is much greater emphasis on overall utilization of capital.
“the emphasis in the UK is on gross margins and ratios, not on overall utilisation. .. Our stock market is definitely different from the UK’s. Our market primarily looks at growth and utilisation of capital. In my opinion, the UK’s market fundamentally looks at operating margins, with much less emphasis on growth. Because of our growth orientation, even with slimmer operating margins, if a US company’s growth line is there, the hope is that future operating margins will improve.” (US retailer)
4.10 This is one of the reasons that a number of US businesses find Economic Value
Added (EVA55) to be an attractive measure of capital effectiveness. Some companies apply EVA to space utilisation, considering the capital cost of rent and fixtures and deducting this from the gross margin contributed by the space to arrive at a true economic profit. This is what we might call ‘fractional’ EVA, or the EVA attributed to a particular factor of retail production. Essentially, this comprises the gross margin contribution from the space, as one of the factors of the retail process. This is an analytical approach that is not commonly practiced in the UK, but it might be applied for analytical purposes and would be worth further investigation. Some US firms incentivise their management based upon EVA targets. Some other measures mentioned more regularly in the US and not in the UK included return on inventory and return on advertising.
4.11 The importance of EVA in the context of retail productivity relates of course to
the fact that EVA reflects the ultimate economic profit of a company. After the providers of capital (both equity and debt) have been paid in full, the remaining economic profit is the reflection of the company’s ability to add value beyond the cost of capital. Potentially, EVA per unit of labour or EVA per square foot could be used as a summary measure of productivity, although care would be needed because of variation in hours worked, in part because of double counting on the cost of labour or space and in part because of the possibility of the measure being seen as under rewarding workers or landowners.
4.12 There are a number of difficulties with EVA, however. Firstly, it is not, strictly
speaking, a measure of output in the same sense as gross margin or net profit margin, (although it seems to us that it is nevertheless a useful way for a retailer to think about his/her company performance). Instead, EVA is the net added value, with the imputed, risk-adjusted capital charge explicitly subtracted from
55 EVA = NOPAT – Capital Employed x Cost of Capital, where NOPAT is Net Operating Profit After Taxes.
Assessing the Productivity of the UK Retail Sector
49
the cash flow (NOPAT) generated by the business. Thus, EVA is not particularly compatible with the measures of gross value added aggregated using top-down, macroeconomic methods. Further, whilst EVA tends to be thought of in terms of a reward to an individual firm, as a risk adjusted measure it could be easily aggregated to a sectoral level.
4.13 Secondly, EVA-based measures do not allow the bottom-up aggregation of
corporate data through to the macro-level. This is impossible because the cost of capital (and hence the imputed capital charge) are very different across companies and sectors. To attempt to calculate the aggregated EVA for the retail industry, for example, would be a complex and potentially unhelpful exercise simply because the resultant value of EVA will hide the different levels of risk under which the companies operate. Such ‘risk equalisation’ is incorrect, and thus EVA calculations can only properly be used for stand-alone assessments of individual companies. Thirdly, varying accounting and corporate reporting procedures across countries make it very problematic to arrive at consistently comparable EVA estimates for different countries. These are, in short, the reasons we do not necessarily recommend the use of EVA or similar measures of net added value derived from corporate performance data in this study: it has its flaws like any other measure.
4.14 Economic profit indicators were felt by many retailers to be good measures for
periodic self-control of the business, yet they were less suitable as practical business monitoring tools. The main reason is the practical difficulties associated with identifying divisional performance based on economic profit measures. This, also, has been a traditional criticism of the various value-added metrics discussed in the academic and practitioner literature. Much as the concept of economic value added (EVA) is an elegant and undisputable construct, it is nevertheless often less applicable in practice. In particular, the inter-divisional allocation of capital and its cost, together with transfer pricing, have complicated many attempts to introduce EVA at the divisional level. UK retailers, it appears, are well aware of the limitations of the EVA-type metrics, and thus are necessarily more practically focused on managing the elements of productivity that have the biggest potential impact. Nevertheless, we did detect a significant interest on part of retailers to know the ‘true’ profitability of their operations, or what is usually called ‘economic profit’. For example, a number of retailers interviewed charged market-based rents on their freehold properties, to arrive at the imputed capital charge and thus, at the better evaluation of the overall economic result. We might nevertheless ask why, if EVA is so problematic in practice, do US retailers make use of it? We found that each business plays by its own book. EVA, although intuitively appealing, is hard to apply consistently.
4.15 The 21 KPIs listed above are widely used by retailers, though with some
significant variances and modifications derived from the particular needs of their businesses. There is a clear distinction between the operating, day-to-day metrics of productivity and strategic, financial reporting measures. For current operations, the retailers we surveyed used total sales growth and like-for-like
Assessing the Productivity of the UK Retail Sector
50
(LFL) growth as the most important indicators. Progression of gross margin was also important, but it can often only be measured quarterly or yearly. This is mainly due to the fact that many elements of the gross margin (e.g. trade promotions, supplier funding, stop-loss provisions) can only be reliably measured on slightly longer timescales than are operationally convenient. Gross margin is an inherently imprecise metric, if measured on a daily basis. This is mainly due to the nature of retail business and the uncertain occurrence of some expenses. Thus, gross margin is not a tool of operating management and its role as a short-term business monitoring tool is relatively limited, although longer-term monitoring may be more useful.
4.16 We found that there was a wide variation in the usage and importance of
particular KPIs by sub-sector or category. Some retailers, especially fashion-driven companies in the clothing segment, did not attach much consideration to space usage or employee productivity. Instead, the overriding goal was to generate sales enough to justify the significant capex incurred on securing the prime-rate locations that such retailers felt were paramount to their success. In contrast, home improvement retailers in the study were much more focused on space utilisation, employee productivity and profit density. Yet another category, big grocery retailers, seem to be striving to be the best in every respect, thus the emphasis is pretty much on everything that could potentially bring a productivity boost.
4.17 The common thread found throughout the analysis of the retailers interviewed,
is the need to translate the big, ‘macro’ picture into the nitty-gritty of managing the specific elements that have an impact upon productivity in the practical context of operating a business.
4.18 For example, the monitoring of the sales / profit per employee numbers is often
undertaken by focusing on sales budgets per store as well as employee numbers. Likewise, sales densities are mostly regulated via control of the ‘sales budget’. Interestingly, space utilisation, although seen as crucial to the financial well-being of a particular retailer, was often viewed as a more important factor in driving or explaining footfall to stores than in boosting overall productivity.
4.19 On the basis of the differential importance particular retailers attach to various
KPIs, we find it hard to suggest, without moves towards standardisation, a uniformly applicable set of retail KPIs that might comprise, say, five core metrics. Even space productivity measures, usually monitored very carefully by every UK retailer, can nevertheless mean different things to different retailers. For example, one apparel retailer interviewed suggested that measures of the linear space utilisation (taking the vertical dimension into account) were particularly relevant in the business56. Yet another retailer in a similar line of business expressed no such view. Likewise, financial productivity measures are
56 This means taking into consideration square footage in relation to height. For example, two fixtures having the same horizontal footage of 10 feet, may have different height: one, 6 feet, the other - 7 feet. Hence the linear space will be 60 ‘linear feet’ in one case vs. 70 feet in the other.
Assessing the Productivity of the UK Retail Sector
51
not uniformly applied and interpreted. For example, the financial hurdle rates could either be based on a single corporate rate uniformly applied throughout the company, or be differentiated according to the type of investment earmarked for financing.
4.20 Furthermore, retailers own perceptions of what is important for their businesses
are changing. For example, sales density is significant measure for a majority of retailers. Yet there is also a feeling that focusing on sales densities is not particularly helpful in the context of the rapidly changing customer tastes and preferences. Monitoring of sales densities, however important, is not sufficient for tracking consumer demand.
4.21 Profit density measures evoked mixed feelings among retailers. On the one hand,
there is a feeling that profit density is important in controlling profitability at the company level, although we believe that profit density is only meaningful at the level of a whole store. On the other hand, the simple comparison of the gross margin densities on various products can be very misleading due to the multitude of overlaying rebates, and variations in costs of services, warranties, distribution and delivery. Hence the true profitability – the product net margin - is very hard to calculate, especially on the store level, although a net margin for a store could be imputed across all goods sold. The issue then is allocation of overhead including a de facto charge for occupancy. However, the model that links the ‘true profit margin’ with sales and profit density does not yet exist.
4.22 If we are to argue that retailing is a distinctive industry because of its particular
concerns with the intangibles of service quality and format, a very important finding is the lack of definitive measures of effectiveness: for measuring customer satisfaction with the proposition. It might be argued that if a format is ineffective, then customers will vote with their feet, but whilst many UK retailers have their own ways of measuring levels of satisfaction – through surveys, mystery shoppers and the like – there is nowhere near the degree of consensus in this area compared with the range of efficiency measures in use.
“In all, there are six different metrics to measure customer satisfaction.”
(UK food retailer) 4.23 Some of the US retailers we spoke to seem to have addressed this question more
scientifically:
“In sales, we conduct several evaluations of every associate weekly that measures the effectiveness of their sales presentation and its adherence to company standards. These evaluations are scored and store management is held accountable both to financial results and behavioural results.” (US retailer)
4.24 Also in the US, a third-party organisation founded in 1994 – the American
Customer Satisfaction Index (ACSI) - tracks levels of satisfaction by sector and
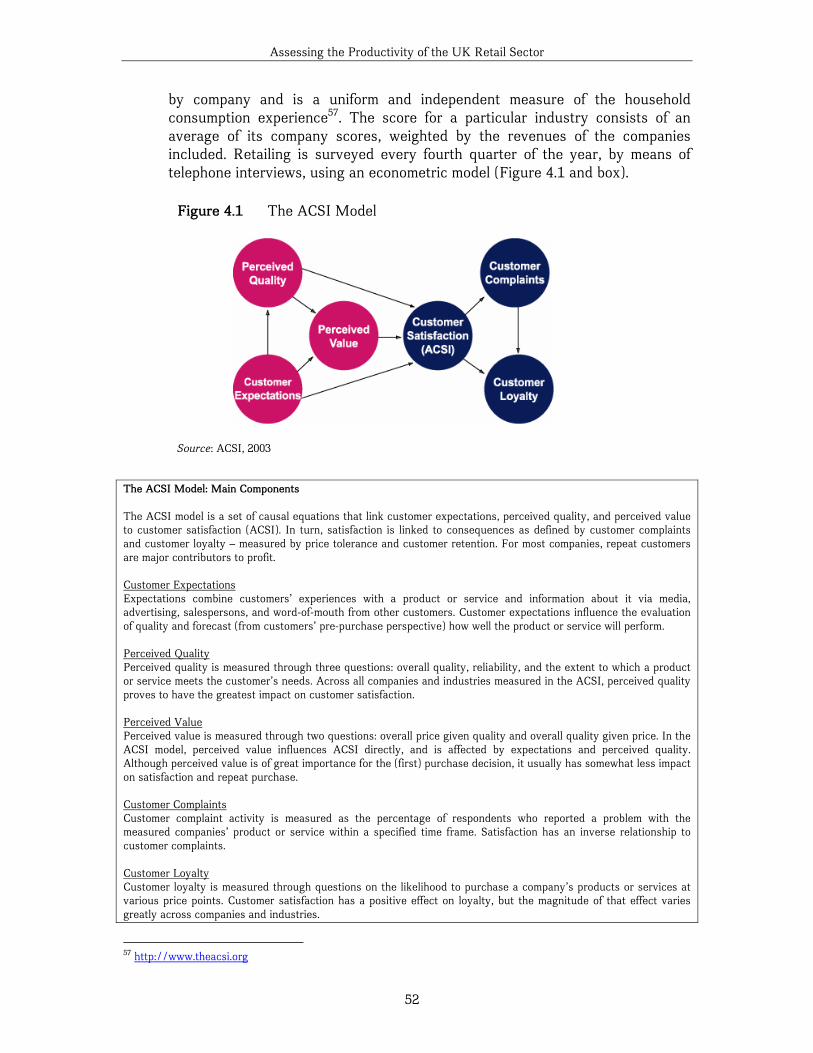
Assessing the Productivity of the UK Retail Sector
52
by company and is a uniform and independent measure of the household consumption experience57. The score for a particular industry consists of an average of its company scores, weighted by the revenues of the companies included. Retailing is surveyed every fourth quarter of the year, by means of telephone interviews, using an econometric model (Figure 4.1 and box).
The ACSI Model: Main Components The ACSI model is a set of causal equations that link customer expectations, perceived quality, and perceived value to customer satisfaction (ACSI). In turn, satisfaction is linked to consequences as defined by customer complaints and customer loyalty – measured by price tolerance and customer retention. For most companies, repeat customers are major contributors to profit. Customer Expectations Expectations combine customers’ experiences with a product or service and information about it via media, advertising, salespersons, and word-of-mouth from other customers. Customer expectations influence the evaluation of quality and forecast (from customers’ pre-purchase perspective) how well the product or service will perform. Perceived Quality Perceived quality is measured through three questions: overall quality, reliability, and the extent to which a product or service meets the customer’s needs. Across all companies and industries measured in the ACSI, perceived quality proves to have the greatest impact on customer satisfaction. Perceived Value Perceived value is measured through two questions: overall price given quality and overall quality given price. In the ACSI model, perceived value influences ACSI directly, and is affected by expectations and perceived quality. Although perceived value is of great importance for the (first) purchase decision, it usually has somewhat less impact on satisfaction and repeat purchase. Customer Complaints Customer complaint activity is measured as the percentage of respondents who reported a problem with the measured companies’ product or service within a specified time frame. Satisfaction has an inverse relationship to customer complaints. Customer Loyalty Customer loyalty is measured through questions on the likelihood to purchase a company’s products or services at various price points. Customer satisfaction has a positive effect on loyalty, but the magnitude of that effect varies greatly across companies and industries.
57 http://www.theacsi.org
Figure 4.1 The ACSI Model
Source: ACSI, 2003
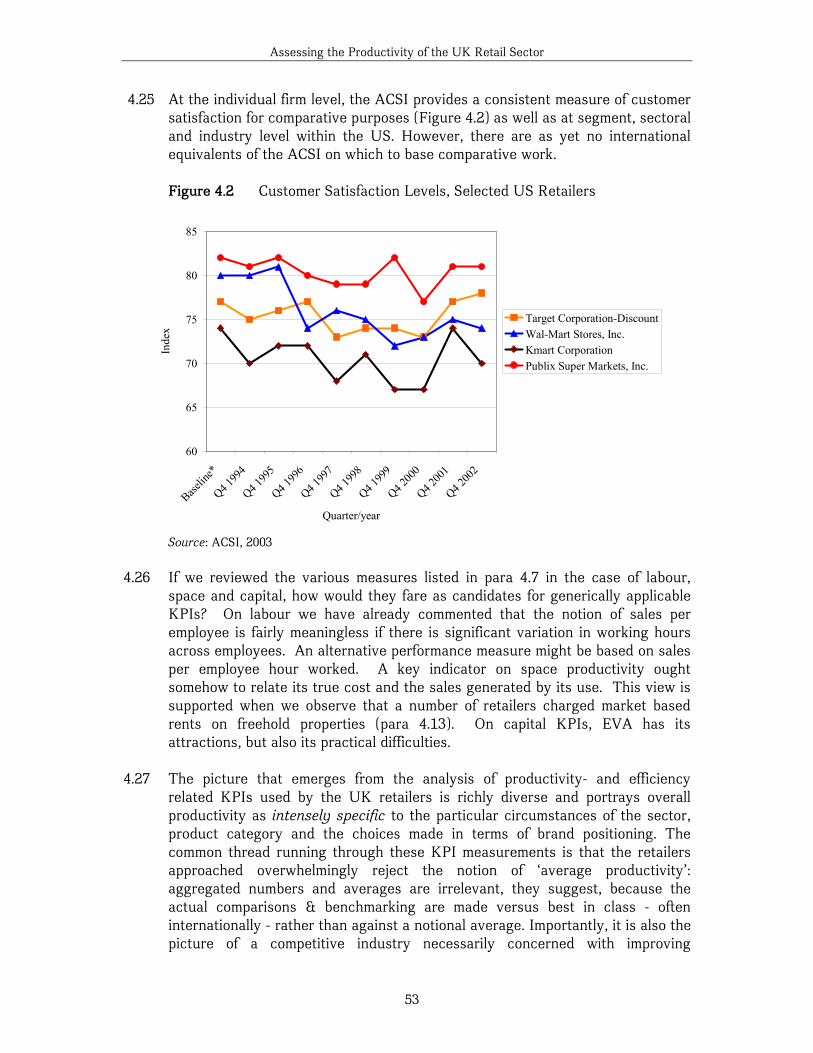
Assessing the Productivity of the UK Retail Sector
53
4.25 At the individual firm level, the ACSI provides a consistent measure of customer satisfaction for comparative purposes (Figure 4.2) as well as at segment, sectoral and industry level within the US. However, there are as yet no international equivalents of the ACSI on which to base comparative work.
Figure 4.2 Customer Satisfaction Levels, Selected US Retailers
60
65
70
75
80
85
Baselin
e*
Q4 199
4
Q4 199
5
Q4 199
6
Q4 199
7
Q4 199
8
Q4 199
9
Q4 200
0
Q4 200
1
Q4 200
2
Quarter/year
Inde
x
Target Corporation-DiscountWal-Mart Stores, Inc.Kmart CorporationPublix Super Markets, Inc.
Source: ACSI, 2003
4.26 If we reviewed the various measures listed in para 4.7 in the case of labour,
space and capital, how would they fare as candidates for generically applicable KPIs? On labour we have already commented that the notion of sales per employee is fairly meaningless if there is significant variation in working hours across employees. An alternative performance measure might be based on sales per employee hour worked. A key indicator on space productivity ought somehow to relate its true cost and the sales generated by its use. This view is supported when we observe that a number of retailers charged market based rents on freehold properties (para 4.13). On capital KPIs, EVA has its attractions, but also its practical difficulties.
4.27 The picture that emerges from the analysis of productivity- and efficiency
related KPIs used by the UK retailers is richly diverse and portrays overall productivity as intensely specific to the particular circumstances of the sector, product category and the choices made in terms of brand positioning. The common thread running through these KPI measurements is that the retailers approached overwhelmingly reject the notion of ‘average productivity’: aggregated numbers and averages are irrelevant, they suggest, because the actual comparisons & benchmarking are made versus best in class - often internationally - rather than against a notional average. Importantly, it is also the picture of a competitive industry necessarily concerned with improving
Assessing the Productivity of the UK Retail Sector
54
productivity as a matter of survival, not choice. We were struck by the extent to which efficiency and the link to performance was at the forefront of thinking of each retailer interviewed. As the Finance Director of a leading grocery retailer put it:
“Running a retail business, quite frankly, is a pretty remorseless grind. Every year you look, and every year you try to find some productivity savings to try to drive the mandated (inflation-linked) salary increases and combat general cost inflation right across the business.” (grocery retailer)
4.2 Evidence from corporate data 4.28 How well do retailers perform on an international comparative basis using their
own published efficiency and performance indicators? We have chosen to examine a sample of US, UK and French retailers, representing both a wide spectrum of multiple retailing in each country and for which corporate data was available. For the UK, the sample included 92 retailers who represented 64% of the total retail sales in the UK in 2001 (excluding cars, spare parts and foodservice); for the US, the samples consisted of 96 retailers, (37% of the total US retail turnover in 2001); and for France, 13 retailers, (72% of combined retail sales in 2001). For the French retailers, data in a format suitable for comparisons was available for the last two years only. Although we fully recognise the limitations of the company data-based analysis, we nevertheless firmly believe that such analysis should supplement the top-down approaches to measuring retail productivity. Without verification by the ‘hard’ data from the shop floor as presented by the retail companies themselves, a review of retail productivity risks becoming too abstract and difficult practically to communicate to the varied audiences for whom this report is intended. The following analysis is, however, constrained by the availability and significant variation in standards of the underlying corporate data.
4.29 Methodologically, efficiency or productivity in retailing can be disaggregated in
terms of:
- Employee productivity, - Space productivity, - Asset productivity, and - Financial productivity
4.30 The following sub-sections provide the evidence on comparative performance of
UK retailers versus their foreign counterparts according to the type of productivity measured.
Assessing the Productivity of the UK Retail Sector
55
4.2.1 Employee productivity 4.31 The following three figures provide an illustration of the relative efficiency of
UK retailers with regards to the utilisation of labour. The analysis is of a poorer quality in this area than in others because of the assumptions required and the caveats that apply here are not dissimilar to those in terms of the aggregate economic analysis. An immediate observation from the figures might be that UK retail employees are less productive than their French (significantly) and American (less significantly) counterparts. The efficiency gap is especially noticeable with regards to sales productivity: the average retail employee in France has generated sales of nearly $235,000 of OECD PPP equivalent, versus $156,000 in the US and $152,000 in the UK.
4.32 A word of caution is immediately in order: the average numbers of employees
were normalised in order to provide a consistent basis for comparison Specifically, retailers in the US do not report full-time equivalent (FTE) numbers; nor do they report the average numbers employed during the year at the end of the financial year – instead, only the actual numbers are reported at the year end. Therefore, US employee numbers were averaged for better comparison. More importantly, employee numbers took no account of the mix of the labour force in relation to full-time versus part-time employees. We know from our discussion in the previous Section that the UK employs proportionally more part-timers than the US and considerably more than France. Not converting to FTE equivalents will depress UK labour productivity in this analysis, but we cannot say to what extent.
4.33 With regards to profit-based productivity (measured in terms of operating profit
and net profit), the performance gap is perceptibly less significant. Moreover, it appears that in recent years (2002-2003) this gap has narrowed dramatically. On the whole, we view data findings from aggregated corporate sources as inconclusive in relation to labour productivity for largely the same reasons as in Section 3. On the one hand, UK retailers appear to lag behind foreign equivalents in terms of sales productivity. On the other hand, the comparative gap may exist simply due to imperfections in data availability, methodology and measurement.
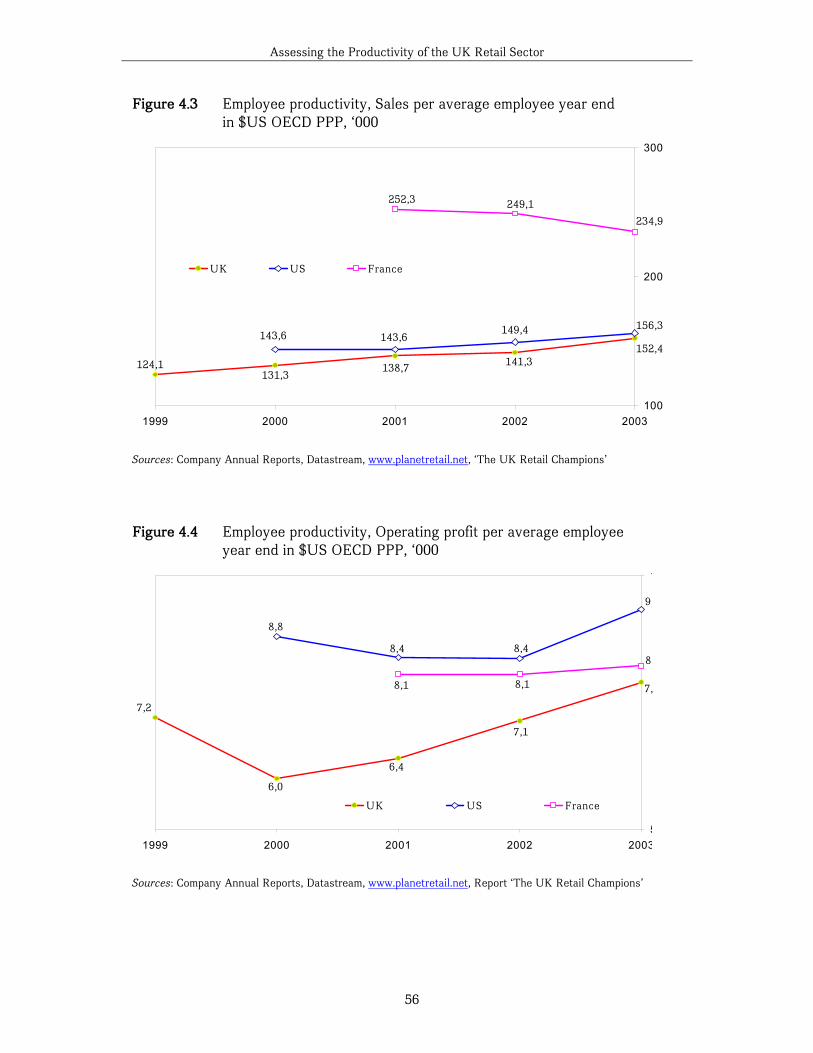
Assessing the Productivity of the UK Retail Sector
56
Figure 4.4 Employee productivity, Operating profit per average employee year end in $US OECD PPP, ‘000
7,2
6,0
6,4
7,1
7,
8,8
8,4 8,4
9,
8,1 8,1
8,
5
1
20032002200120001999
UK US France
Sources: Company Annual Reports, Datastream, www.planetretail.net, Report ‘The UK Retail Champions’
Figure 4.3 Employee productivity, Sales per average employee year end in $US OECD PPP, ‘000
124,1131,3
138,7 141,3152,4
143,6 143,6149,4 156,3
252,3 249,1
234,9
100
200
300
20032002200120001999
UK US France
Sources: Company Annual Reports, Datastream, www.planetretail.net, ‘The UK Retail Champions’
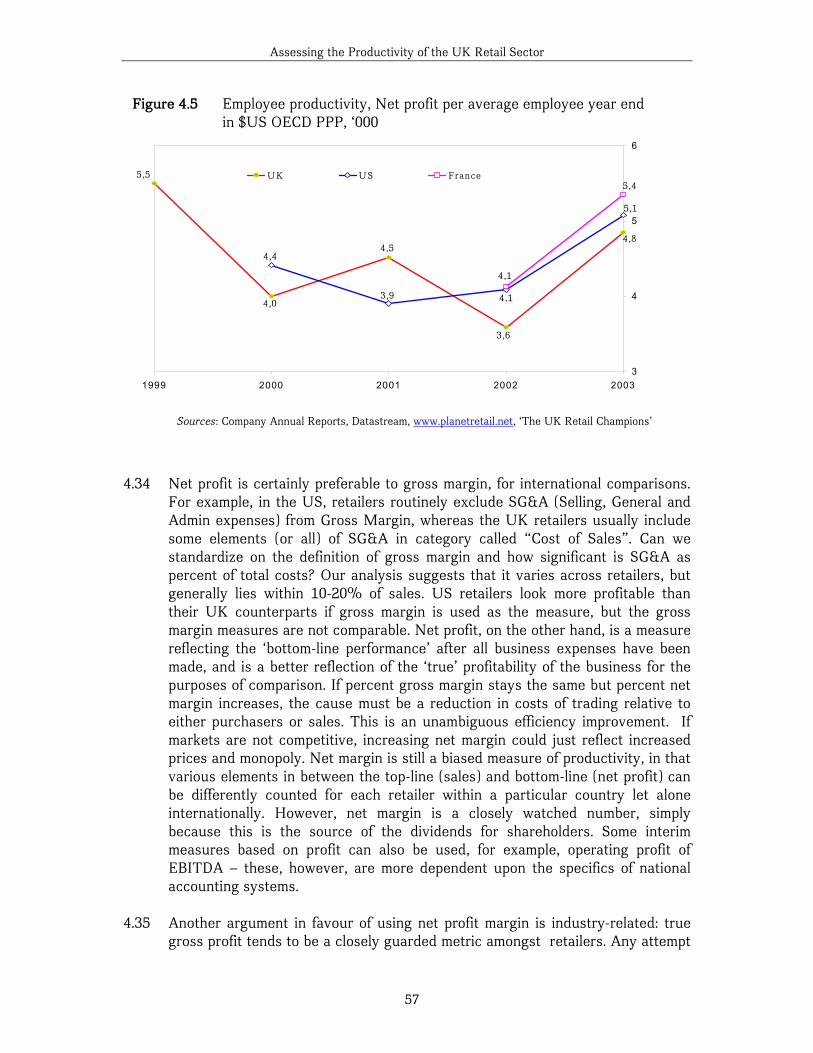
Assessing the Productivity of the UK Retail Sector
57
4.34 Net profit is certainly preferable to gross margin, for international comparisons.
For example, in the US, retailers routinely exclude SG&A (Selling, General and Admin expenses) from Gross Margin, whereas the UK retailers usually include some elements (or all) of SG&A in category called “Cost of Sales”. Can we standardize on the definition of gross margin and how significant is SG&A as percent of total costs? Our analysis suggests that it varies across retailers, but generally lies within 10-20% of sales. US retailers look more profitable than their UK counterparts if gross margin is used as the measure, but the gross margin measures are not comparable. Net profit, on the other hand, is a measure reflecting the ‘bottom-line performance’ after all business expenses have been made, and is a better reflection of the ‘true’ profitability of the business for the purposes of comparison. If percent gross margin stays the same but percent net margin increases, the cause must be a reduction in costs of trading relative to either purchasers or sales. This is an unambiguous efficiency improvement. If markets are not competitive, increasing net margin could just reflect increased prices and monopoly. Net margin is still a biased measure of productivity, in that various elements in between the top-line (sales) and bottom-line (net profit) can be differently counted for each retailer within a particular country let alone internationally. However, net margin is a closely watched number, simply because this is the source of the dividends for shareholders. Some interim measures based on profit can also be used, for example, operating profit of EBITDA – these, however, are more dependent upon the specifics of national accounting systems.
4.35 Another argument in favour of using net profit margin is industry-related: true
gross profit tends to be a closely guarded metric amongst retailers. Any attempt
Figure 4.5 Employee productivity, Net profit per average employee year end in $US OECD PPP, ‘000
5,5
4,0
4,5
3,6
4,8
4,4
3,9 4,1
5,1
4,1
5,4
3
4
5
6
20032002200120001999
UK US France
Sources: Company Annual Reports, Datastream, www.planetretail.net, ‘The UK Retail Champions’
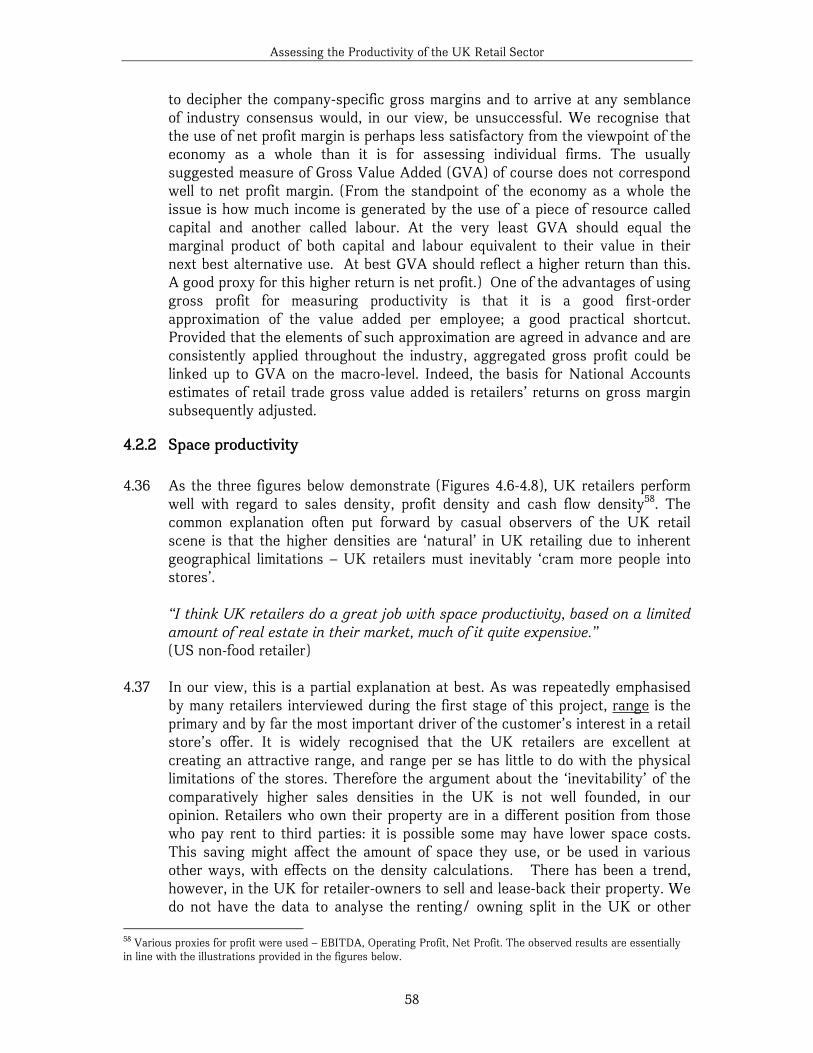
Assessing the Productivity of the UK Retail Sector
58
to decipher the company-specific gross margins and to arrive at any semblance of industry consensus would, in our view, be unsuccessful. We recognise that the use of net profit margin is perhaps less satisfactory from the viewpoint of the economy as a whole than it is for assessing individual firms. The usually suggested measure of Gross Value Added (GVA) of course does not correspond well to net profit margin. (From the standpoint of the economy as a whole the issue is how much income is generated by the use of a piece of resource called capital and another called labour. At the very least GVA should equal the marginal product of both capital and labour equivalent to their value in their next best alternative use. At best GVA should reflect a higher return than this. A good proxy for this higher return is net profit.) One of the advantages of using gross profit for measuring productivity is that it is a good first-order approximation of the value added per employee; a good practical shortcut. Provided that the elements of such approximation are agreed in advance and are consistently applied throughout the industry, aggregated gross profit could be linked up to GVA on the macro-level. Indeed, the basis for National Accounts estimates of retail trade gross value added is retailers’ returns on gross margin subsequently adjusted.
4.2.2 Space productivity
4.36 As the three figures below demonstrate (Figures 4.6-4.8), UK retailers perform well with regard to sales density, profit density and cash flow density58. The common explanation often put forward by casual observers of the UK retail scene is that the higher densities are ‘natural’ in UK retailing due to inherent geographical limitations – UK retailers must inevitably ‘cram more people into stores’.
“I think UK retailers do a great job with space productivity, based on a limited amount of real estate in their market, much of it quite expensive.” (US non-food retailer)
4.37 In our view, this is a partial explanation at best. As was repeatedly emphasised
by many retailers interviewed during the first stage of this project, range is the primary and by far the most important driver of the customer’s interest in a retail store’s offer. It is widely recognised that the UK retailers are excellent at creating an attractive range, and range per se has little to do with the physical limitations of the stores. Therefore the argument about the ‘inevitability’ of the comparatively higher sales densities in the UK is not well founded, in our opinion. Retailers who own their property are in a different position from those who pay rent to third parties: it is possible some may have lower space costs. This saving might affect the amount of space they use, or be used in various other ways, with effects on the density calculations. There has been a trend, however, in the UK for retailer-owners to sell and lease-back their property. We do not have the data to analyse the renting/ owning split in the UK or other
58 Various proxies for profit were used – EBITDA, Operating Profit, Net Profit. The observed results are essentially in line with the illustrations provided in the figures below.
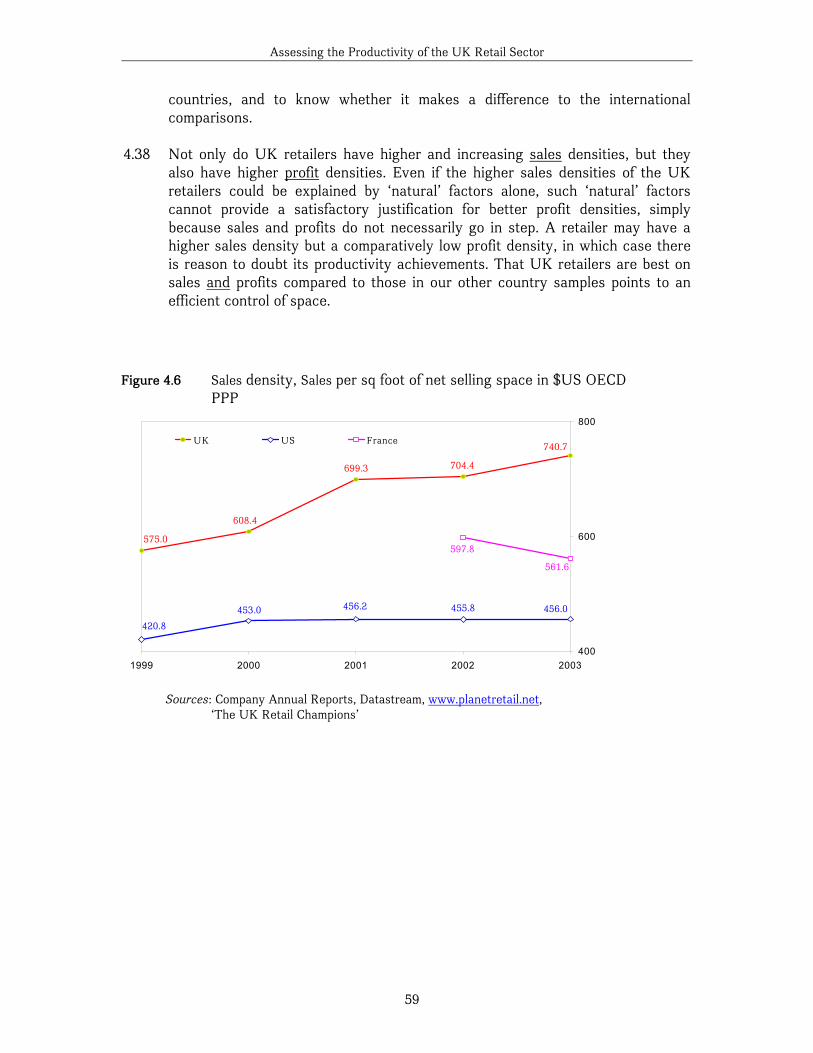
Assessing the Productivity of the UK Retail Sector
59
countries, and to know whether it makes a difference to the international comparisons.
4.38 Not only do UK retailers have higher and increasing sales densities, but they
also have higher profit densities. Even if the higher sales densities of the UK retailers could be explained by ‘natural’ factors alone, such ‘natural’ factors cannot provide a satisfactory justification for better profit densities, simply because sales and profits do not necessarily go in step. A retailer may have a higher sales density but a comparatively low profit density, in which case there is reason to doubt its productivity achievements. That UK retailers are best on sales and profits compared to those in our other country samples points to an efficient control of space.
Figure 4.6 Sales density, Sales per sq foot of net selling space in $US OECD PPP
575.0
608.4
699.3 704.4
740.7
420.8
453.0 456.2 455.8 456.0
597.8
561.6
400
600
800
20032002200120001999
UK US France
Sources: Company Annual Reports, Datastream, www.planetretail.net, ‘The UK Retail Champions’
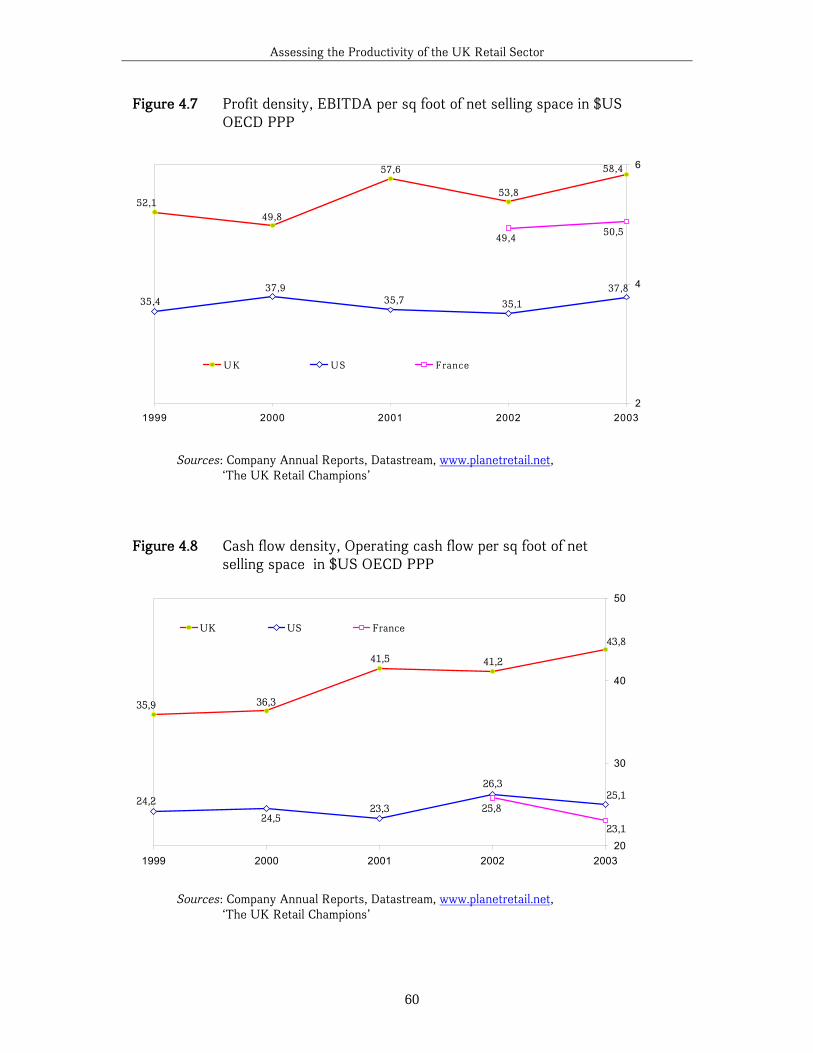
Assessing the Productivity of the UK Retail Sector
60
Figure 4.7 Profit density, EBITDA per sq foot of net selling space in $US OECD PPP
52,149,8
57,6
53,8
58,4
35,437,9
35,7 35,1
37,8
49,4 50,5
2
4
6
20032002200120001999
UK US France
Sources: Company Annual Reports, Datastream, www.planetretail.net,
‘The UK Retail Champions’
Figure 4.8 Cash flow density, Operating cash flow per sq foot of net selling space in $US OECD PPP
35,9 36,3
41,5 41,2
43,8
24,2
24,523,3
26,325,1
25,8
23,1
20
30
40
50
20032002200120001999
UK US France
Sources: Company Annual Reports, Datastream, www.planetretail.net, ‘The UK Retail Champions’
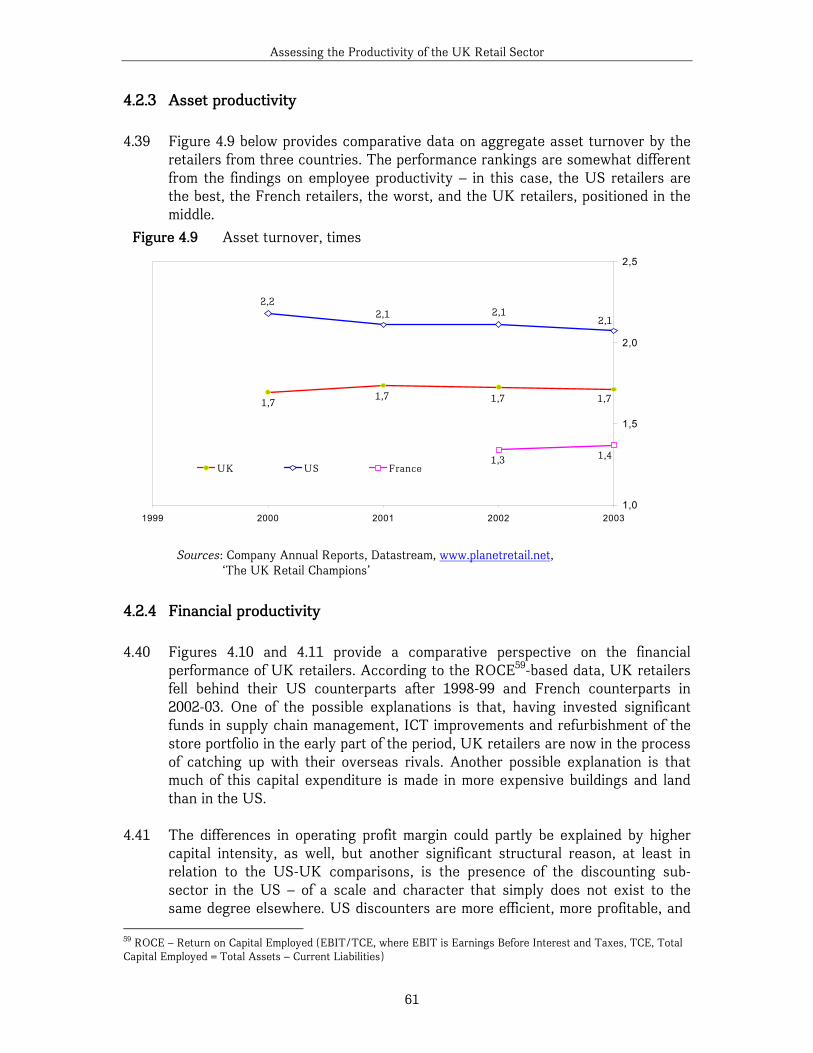
Assessing the Productivity of the UK Retail Sector
61
4.2.3 Asset productivity
4.39 Figure 4.9 below provides comparative data on aggregate asset turnover by the retailers from three countries. The performance rankings are somewhat different from the findings on employee productivity – in this case, the US retailers are the best, the French retailers, the worst, and the UK retailers, positioned in the middle.
4.2.4 Financial productivity 4.40 Figures 4.10 and 4.11 provide a comparative perspective on the financial
performance of UK retailers. According to the ROCE59-based data, UK retailers fell behind their US counterparts after 1998-99 and French counterparts in 2002-03. One of the possible explanations is that, having invested significant funds in supply chain management, ICT improvements and refurbishment of the store portfolio in the early part of the period, UK retailers are now in the process of catching up with their overseas rivals. Another possible explanation is that much of this capital expenditure is made in more expensive buildings and land than in the US.
4.41 The differences in operating profit margin could partly be explained by higher
capital intensity, as well, but another significant structural reason, at least in relation to the US-UK comparisons, is the presence of the discounting sub-sector in the US – of a scale and character that simply does not exist to the same degree elsewhere. US discounters are more efficient, more profitable, and
59 ROCE – Return on Capital Employed (EBIT/TCE, where EBIT is Earnings Before Interest and Taxes, TCE, Total Capital Employed = Total Assets – Current Liabilities)
Figure 4.9 Asset turnover, times
1,71,71,71,7
2,12,12,1
2,2
1,41,3
1,0
1,5
2,0
2,5
20032002200120001999
UK US France
Sources: Company Annual Reports, Datastream, www.planetretail.net, ‘The UK Retail Champions’
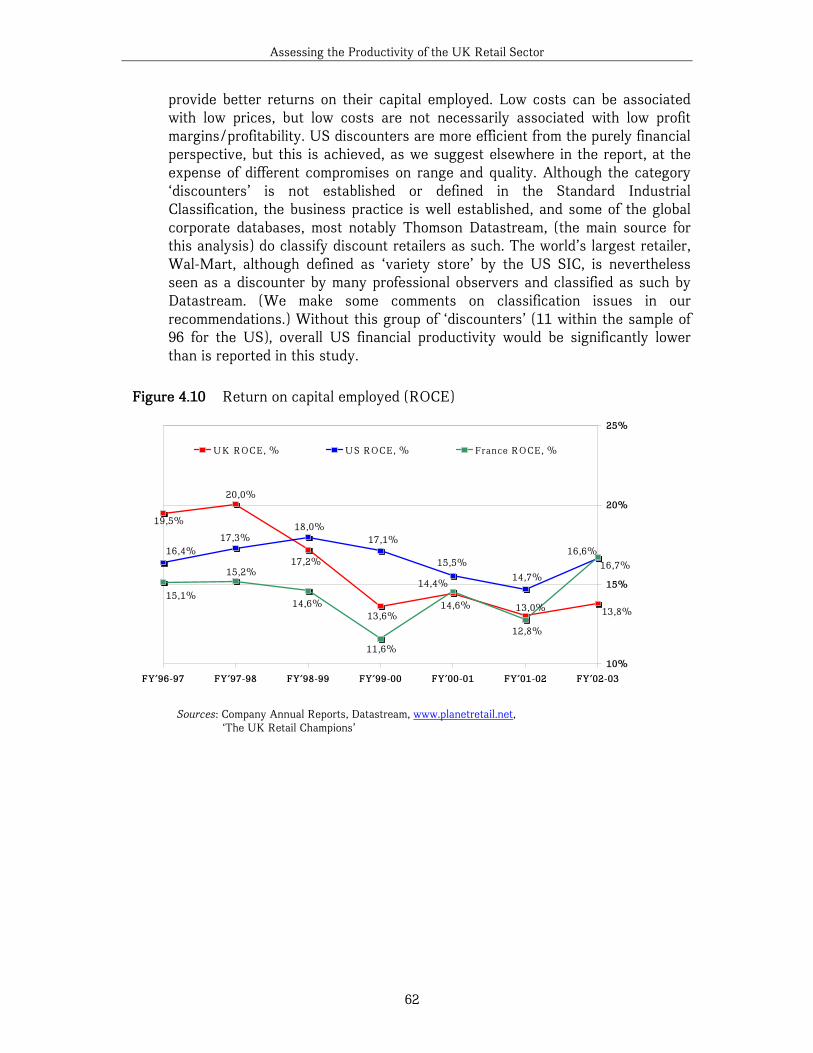
Assessing the Productivity of the UK Retail Sector
62
provide better returns on their capital employed. Low costs can be associated with low prices, but low costs are not necessarily associated with low profit margins/profitability. US discounters are more efficient from the purely financial perspective, but this is achieved, as we suggest elsewhere in the report, at the expense of different compromises on range and quality. Although the category ‘discounters’ is not established or defined in the Standard Industrial Classification, the business practice is well established, and some of the global corporate databases, most notably Thomson Datastream, (the main source for this analysis) do classify discount retailers as such. The world’s largest retailer, Wal-Mart, although defined as ‘variety store’ by the US SIC, is nevertheless seen as a discounter by many professional observers and classified as such by Datastream. (We make some comments on classification issues in our recommendations.) Without this group of ‘discounters’ (11 within the sample of 96 for the US), overall US financial productivity would be significantly lower than is reported in this study.
Figure 4.10 Return on capital employed (ROCE)
13,8%13,0%
14,4%
13,6%
17,2%
20,0%
19,5%
16,4%17,3%
18,0%17,1%
15,5%14,7%
16,6%
15,1%
15,2%
14,6%
12,8%
14,6%
11,6%
16,7%
10%
15%
20%
25%
FY'02-03FY'01-02FY'00-01FY'99-00FY'98-99FY'97-98FY'96-97
UK ROCE, % US ROCE, % France ROCE, %
Sources: Company Annual Reports, Datastream, www.planetretail.net, ‘The UK Retail Champions’
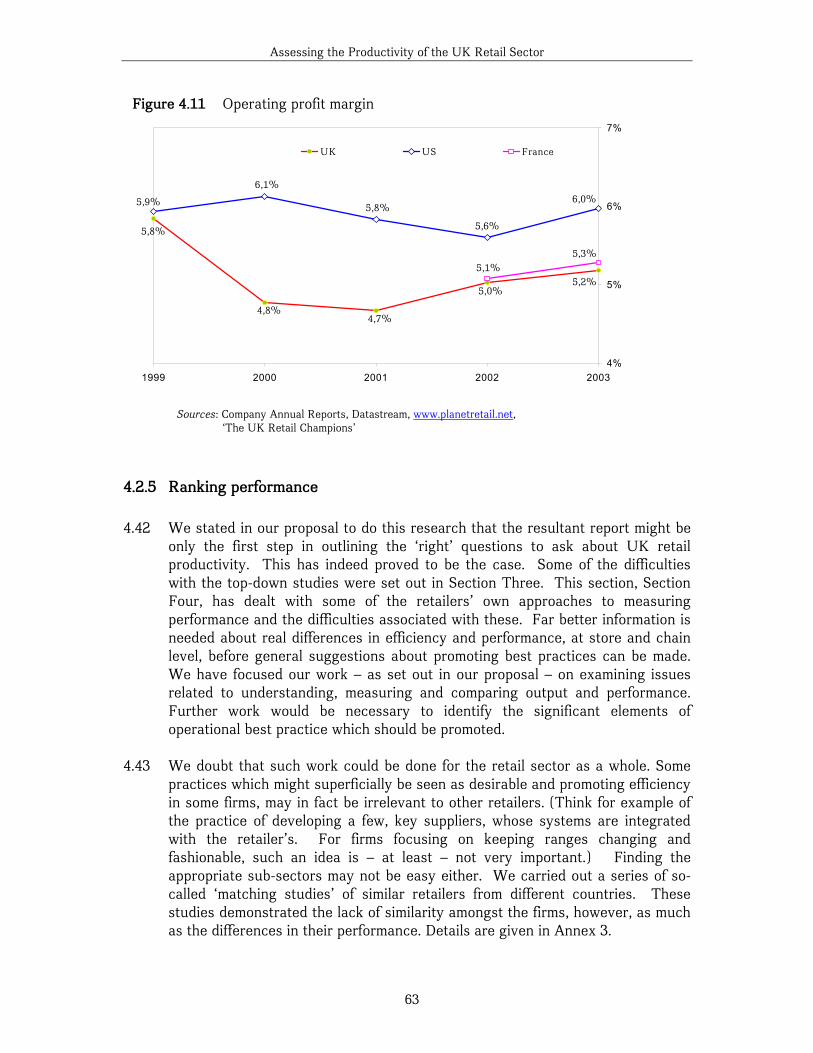
Assessing the Productivity of the UK Retail Sector
63
4.2.5 Ranking performance 4.42 We stated in our proposal to do this research that the resultant report might be
only the first step in outlining the ‘right’ questions to ask about UK retail productivity. This has indeed proved to be the case. Some of the difficulties with the top-down studies were set out in Section Three. This section, Section Four, has dealt with some of the retailers’ own approaches to measuring performance and the difficulties associated with these. Far better information is needed about real differences in efficiency and performance, at store and chain level, before general suggestions about promoting best practices can be made. We have focused our work – as set out in our proposal – on examining issues related to understanding, measuring and comparing output and performance. Further work would be necessary to identify the significant elements of operational best practice which should be promoted.
4.43 We doubt that such work could be done for the retail sector as a whole. Some
practices which might superficially be seen as desirable and promoting efficiency in some firms, may in fact be irrelevant to other retailers. (Think for example of the practice of developing a few, key suppliers, whose systems are integrated with the retailer’s. For firms focusing on keeping ranges changing and fashionable, such an idea is – at least – not very important.) Finding the appropriate sub-sectors may not be easy either. We carried out a series of so-called ‘matching studies’ of similar retailers from different countries. These studies demonstrated the lack of similarity amongst the firms, however, as much as the differences in their performance. Details are given in Annex 3.
Figure 4.11 Operating profit margin
5,8%
4,8%4,7%
5,0%5,2%
5,9%
6,1%
5,8%
5,6%
6,0%
5,1%5,3%
4%
5%
6%
7%
20032002200120001999
UK US France
Sources: Company Annual Reports, Datastream, www.planetretail.net, ‘The UK Retail Champions’
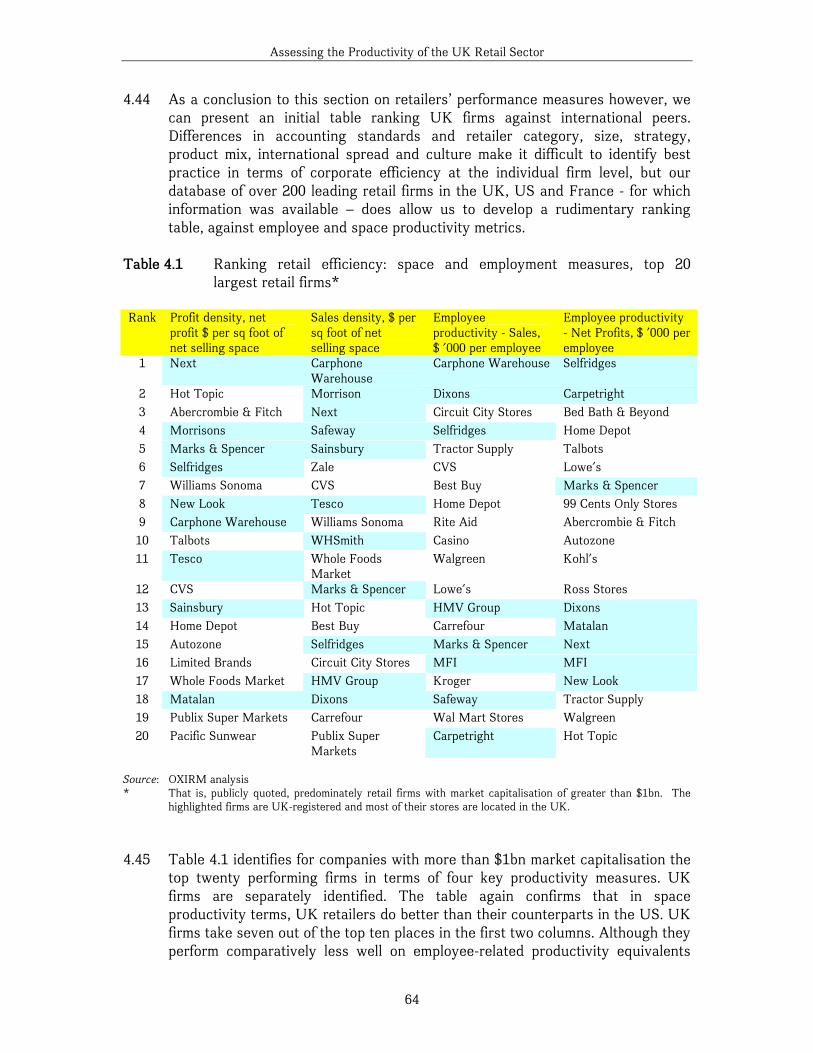
Assessing the Productivity of the UK Retail Sector
64
4.44 As a conclusion to this section on retailers’ performance measures however, we can present an initial table ranking UK firms against international peers. Differences in accounting standards and retailer category, size, strategy, product mix, international spread and culture make it difficult to identify best practice in terms of corporate efficiency at the individual firm level, but our database of over 200 leading retail firms in the UK, US and France - for which information was available – does allow us to develop a rudimentary ranking table, against employee and space productivity metrics.
Table 4.1 Ranking retail efficiency: space and employment measures, top 20 largest retail firms* Rank Profit density, net
profit $ per sq foot of net selling space
Sales density, $ per sq foot of net selling space
Employee productivity - Sales, $ '000 per employee
Employee productivity - Net Profits, $ '000 per employee
1 Next Carphone Warehouse
Carphone Warehouse Selfridges
2 Hot Topic Morrison Dixons Carpetright 3 Abercrombie & Fitch Next Circuit City Stores Bed Bath & Beyond 4 Morrisons Safeway Selfridges Home Depot 5 Marks & Spencer Sainsbury Tractor Supply Talbots 6 Selfridges Zale CVS Lowe's 7 Williams Sonoma CVS Best Buy Marks & Spencer 8 New Look Tesco Home Depot 99 Cents Only Stores 9 Carphone Warehouse Williams Sonoma Rite Aid Abercrombie & Fitch 10 Talbots WHSmith Casino Autozone 11 Tesco Whole Foods
Market Walgreen Kohl's
12 CVS Marks & Spencer Lowe's Ross Stores 13 Sainsbury Hot Topic HMV Group Dixons 14 Home Depot Best Buy Carrefour Matalan 15 Autozone Selfridges Marks & Spencer Next 16 Limited Brands Circuit City Stores MFI MFI 17 Whole Foods Market HMV Group Kroger New Look 18 Matalan Dixons Safeway Tractor Supply 19 Publix Super Markets Carrefour Wal Mart Stores Walgreen 20 Pacific Sunwear Publix Super
Markets Carpetright Hot Topic
Source: OXIRM analysis * That is, publicly quoted, predominately retail firms with market capitalisation of greater than $1bn. The
highlighted firms are UK-registered and most of their stores are located in the UK.
4.45 Table 4.1 identifies for companies with more than $1bn market capitalisation the
top twenty performing firms in terms of four key productivity measures. UK firms are separately identified. The table again confirms that in space productivity terms, UK retailers do better than their counterparts in the US. UK firms take seven out of the top ten places in the first two columns. Although they perform comparatively less well on employee-related productivity equivalents
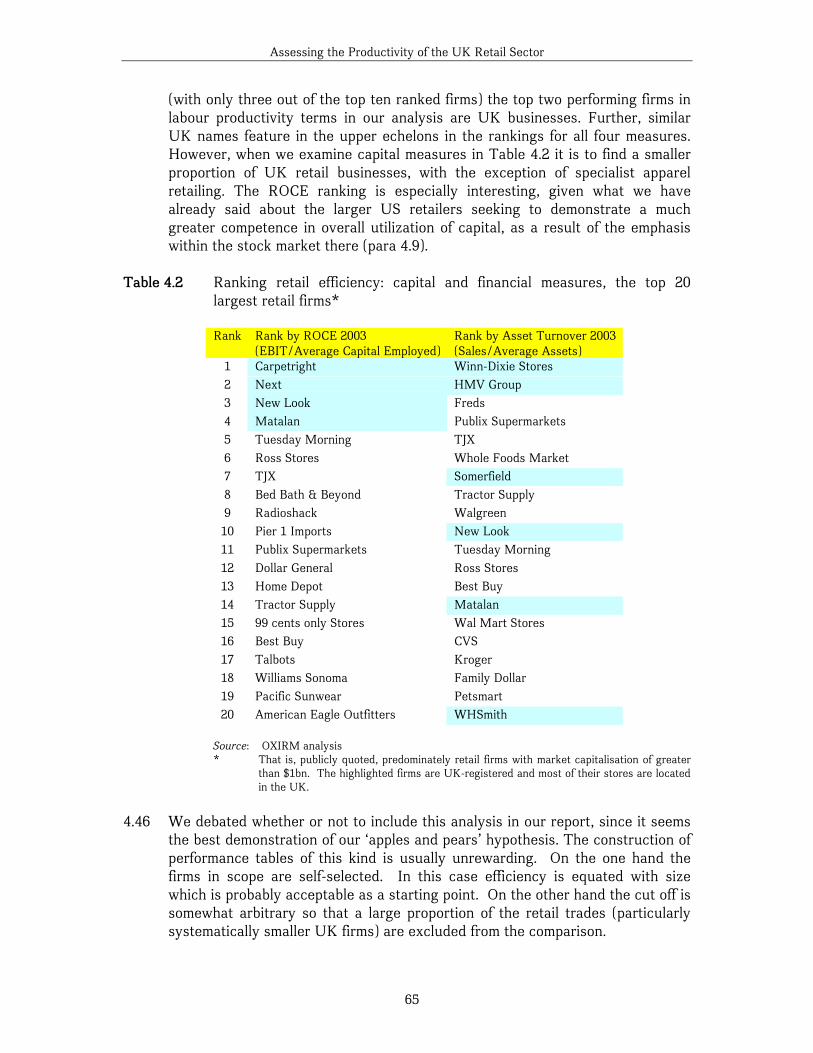
Assessing the Productivity of the UK Retail Sector
65
(with only three out of the top ten ranked firms) the top two performing firms in labour productivity terms in our analysis are UK businesses. Further, similar UK names feature in the upper echelons in the rankings for all four measures. However, when we examine capital measures in Table 4.2 it is to find a smaller proportion of UK retail businesses, with the exception of specialist apparel retailing. The ROCE ranking is especially interesting, given what we have already said about the larger US retailers seeking to demonstrate a much greater competence in overall utilization of capital, as a result of the emphasis within the stock market there (para 4.9).
Table 4.2 Ranking retail efficiency: capital and financial measures, the top 20
largest retail firms*
Rank Rank by ROCE 2003 (EBIT/Average Capital Employed)
Rank by Asset Turnover 2003 (Sales/Average Assets)
1 Carpetright Winn-Dixie Stores 2 Next HMV Group 3 New Look Freds 4 Matalan Publix Supermarkets 5 Tuesday Morning TJX 6 Ross Stores Whole Foods Market 7 TJX Somerfield 8 Bed Bath & Beyond Tractor Supply 9 Radioshack Walgreen 10 Pier 1 Imports New Look 11 Publix Supermarkets Tuesday Morning 12 Dollar General Ross Stores 13 Home Depot Best Buy 14 Tractor Supply Matalan 15 99 cents only Stores Wal Mart Stores 16 Best Buy CVS 17 Talbots Kroger 18 Williams Sonoma Family Dollar 19 Pacific Sunwear Petsmart 20 American Eagle Outfitters WHSmith
Source: OXIRM analysis * That is, publicly quoted, predominately retail firms with market capitalisation of greater
than $1bn. The highlighted firms are UK-registered and most of their stores are located in the UK.
4.46 We debated whether or not to include this analysis in our report, since it seems
the best demonstration of our ‘apples and pears’ hypothesis. The construction of performance tables of this kind is usually unrewarding. On the one hand the firms in scope are self-selected. In this case efficiency is equated with size which is probably acceptable as a starting point. On the other hand the cut off is somewhat arbitrary so that a large proportion of the retail trades (particularly systematically smaller UK firms) are excluded from the comparison.
Assessing the Productivity of the UK Retail Sector
66
4.47 We have not been able to identify any operational best practices which clearly distinguish the best performers from laggards. It is clear that each good performer succeeds with a specific combination of product range, store size and style, location, strategy, as well as operation. There are variations in the latter of course but it is not these which explain the prime differences, such as they are, between the performance of UK retailers and those in other countries.
4.48 The corporate data used in this, and in the previous part of the study show that
only on one ‘pure’ productivity metric - sales / profit employee productivity - does UK productivity clearly and consistently lag that of our sample of firms in the US and France. However, we have already pointed out the methodological difficulties with the corporate employment data, which are not dissimilar to the problems faced by economists conducting aggregate analysis of retail labour productivity. Disaggregated by category, even this relatively narrow conclusion does not hold as our unpublished preliminary analysis shows that some of the sub-sectors of the UK retail business, apparel & accessories and department stores in particular are demonstrably better than their foreign equivalents. Some of the productivity achievements of UK retailing, specifically sales/profit densities, are dramatically better than those in the US and France and thus counter-balance lower employee productivity in the UK.
“In the UK, there is emphasis on great utilisation of space – probably the world’s best – less efficient usage of labour – though not bad.” (US non-food retailer)
4.3 Concluding remarks 4.49 Examination of reported corporate data approximating to macro-economic
indicators of productivity as well as data drawn from a wider context of efficiency and performance metrics provides a much richer and fuller picture of international retailing than that depicted in section 3. In particular, such analysis highlights the advantageous position in relation to some efficiency and performance variables of UK retailing – particularly in relation to space utilisation. In the lagging indicators – relating to sales and profit per employee – whilst an aggregate underperformance by UK retailing appears to hold true, when such indicators are decomposed by segment or by leading company, through a matching study, the lag does not hold consistently.
4.50 Our analysis of published corporate data is clearly biased towards larger
publicly-quoted companies, although our sample comprises significant proportions of retail trade in the three countries under examination. We have nevertheless been unable to extract comparative data of a similar quality for the ‘tail’ of smaller retail businesses in either the UK, US or in France. This is a significant weakness in our understanding of retail productivity and one that we specifically address in our recommendations.
Assessing the Productivity of the UK Retail Sector
67
4.51 Part of the remit for this study asked us to identify the best measures of productivity for monitoring the future efficiency and performance of retailing. We have demonstrated that there is potentially ample information about how retailers measure the efficiency and performance of their businesses. These are the best measures for all to use, as these are the measures that retailers use directly to drive their businesses. Macro-economic analyses of total factor productivity are of no practical help or interest to retailers, since such analyses transmit no information which indicates where action might be taken. From the interviews conducted with a variety of retailers, the consensus emerged that no single measure of productivity is sufficient to capture the efficiency of input utilisation in retailing, but there is broad agreement over what the list of measures looks like (see para 4.7). We observe that this information is not generally available to government, and certainly not in any standardised form. There is no requirement to publish, for example, sales density information, and there is no ‘accounting standard’ or data standard for a wide range of metrics relevant to productivity.
4.52 The best measures are probably those which retailers understand and to which
they can respond. This is particularly important if government is interested in helping smaller firms. A simple benchmark of appropriate statistics would be helpful. We observe that large retailers can and do constantly benchmark against competitors, nationally and to some extent internationally, where information is available. But we also note that smaller retailers do not have the resource or perhaps even the inclination to do so, nor are there obvious benchmark companies/sectors for them to look at.
4.53 The best summary measures are those which both carry a substantial amount of
information and do not involve radically extended work for firms to produce them. The measures used in Table 4.1 convey the essence of the comparisons we explored in this section, and we recommend these as a starting point. In our opinion they are the measures with most relevance to international comparisons and where data is generally already collected. Data standards need further discussion however, for instance for measurement of selling space. We discussed earlier the major problem in interpreting labour productivity data, when part time working is so prevalent. New requirements to calculate and report ‘full time equivalent employees’ might be a major burden on businesses. For this reason a ratio of labour costs to profit or sales might be preferred.
Assessing the Productivity of the UK Retail Sector
68
5.0 Structural and environmental explanations for differential productivity
5.1 We have demonstrated that there may be difficulties with simple measures both
of labour and total factor productivity for international comparative purposes. Whatever the nature and scale of these difficulties, it is not unreasonable to think that there may well nevertheless be genuine differences in terms of retail productivity between countries. A range of factors will be important in explaining the relative performance of the retail sector in different countries. Some of these may arise from structural variations between markets. This includes the composition of the sector in terms of size and format of businesses, and the positioning choices retailers make, which are themselves inextricably linked to the product/service output mix demanded by consumers. There may be also be differences as a consequence of dissimilar regulatory environments within which retail businesses operate and over which they have much less direct control.
5.2 Culture, history and perhaps sheer accident mean that each country will exhibit
a different set of retail propositions. Consumer expectations about retail propositions vary, influenced by history and circumstance. Such differences persist and are hard to erode. It might be reasonable to expect convergence in retail environments internationally, but we have constantly been impressed by the enthusiasm expressed by retailers from outside the UK for certain features of UK retailing (high quality environments for mass food retailing; few multi-storey fashion stores; the persistence of high quality department store chains) – features which impose costs on retail firms, but are expected by UK consumers and are attractive to visitors.
5.3 A further constraint on convergence lies in the nature of retail competition itself.
What we see is the absence of cross border competition stemming from the supply of a retail service originating in one country to a customer in another. There is cross border competition but it comes in the form of direct foreign investment and linked to it different retail methods. But unlike manufacturing, a low cost trader in the US cannot easily exploit this low cost advantage by selling at a low price to a customer say in the UK. And in terms of the inward foreign direct investor they face the same choices of how to combine land and labour and prices, as a domestic supplier. In the absence of significant cross border trade in the provision of retail services one of the principal environmental factors that might bring about international convergence of productivity differences (international competition) cannot exist in an conventional way. Therefore, pressure to improve the productivity of retail firms comes largely from competition within their own domestic markets.
5.4 Secondly, regulatory environments limit propositions in certain ways. For
example, shorter trading hours in Germany mean consumers have to accept shorter hour propositions – which are ‘efficient’ in labour productivity terms, but
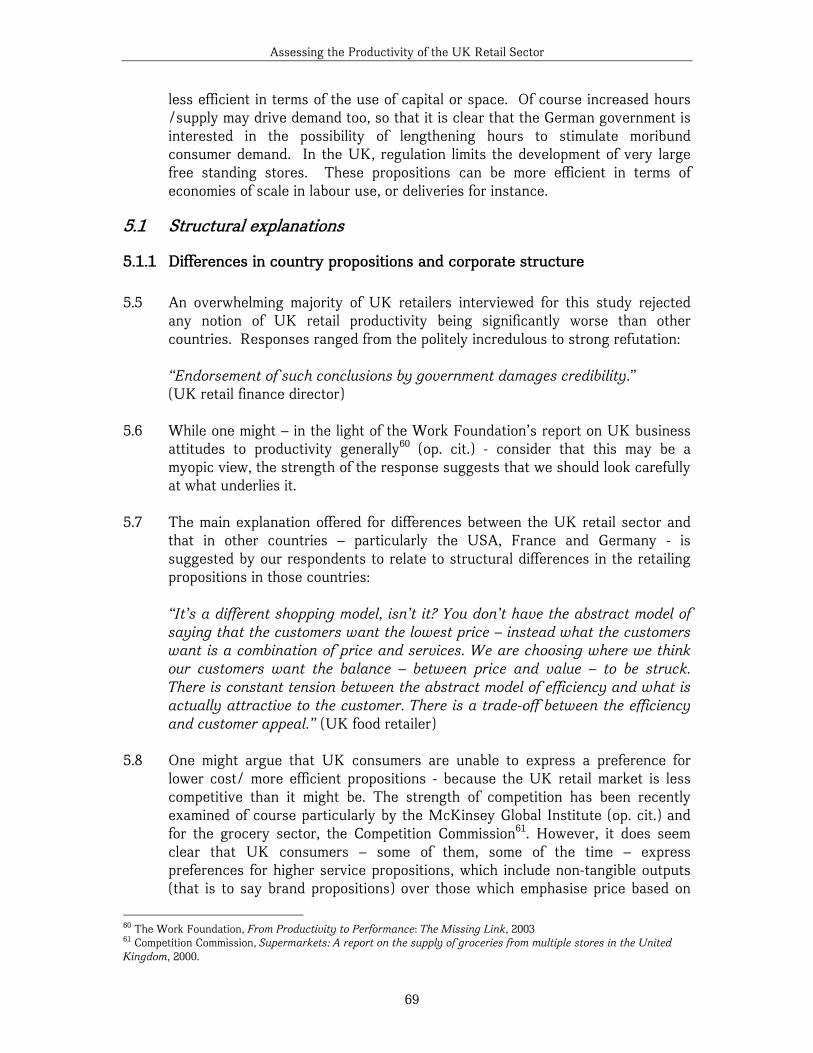
Assessing the Productivity of the UK Retail Sector
69
less efficient in terms of the use of capital or space. Of course increased hours /supply may drive demand too, so that it is clear that the German government is interested in the possibility of lengthening hours to stimulate moribund consumer demand. In the UK, regulation limits the development of very large free standing stores. These propositions can be more efficient in terms of economies of scale in labour use, or deliveries for instance.
5.1 Structural explanations
5.1.1 Differences in country propositions and corporate structure 5.5 An overwhelming majority of UK retailers interviewed for this study rejected
any notion of UK retail productivity being significantly worse than other countries. Responses ranged from the politely incredulous to strong refutation:
“Endorsement of such conclusions by government damages credibility.” (UK retail finance director)
5.6 While one might – in the light of the Work Foundation’s report on UK business
attitudes to productivity generally60 (op. cit.) - consider that this may be a myopic view, the strength of the response suggests that we should look carefully at what underlies it.
5.7 The main explanation offered for differences between the UK retail sector and
that in other countries – particularly the USA, France and Germany - is suggested by our respondents to relate to structural differences in the retailing propositions in those countries:
“It’s a different shopping model, isn’t it? You don’t have the abstract model of saying that the customers want the lowest price – instead what the customers want is a combination of price and services. We are choosing where we think our customers want the balance – between price and value – to be struck. There is constant tension between the abstract model of efficiency and what is actually attractive to the customer. There is a trade-off between the efficiency and customer appeal.” (UK food retailer)
5.8 One might argue that UK consumers are unable to express a preference for
lower cost/ more efficient propositions - because the UK retail market is less competitive than it might be. The strength of competition has been recently examined of course particularly by the McKinsey Global Institute (op. cit.) and for the grocery sector, the Competition Commission61. However, it does seem clear that UK consumers – some of them, some of the time – express preferences for higher service propositions, which include non-tangible outputs (that is to say brand propositions) over those which emphasise price based on
60 The Work Foundation, From Productivity to Performance: The Missing Link, 2003 61 Competition Commission, Supermarkets: A report on the supply of groceries from multiple stores in the United Kingdom, 2000.
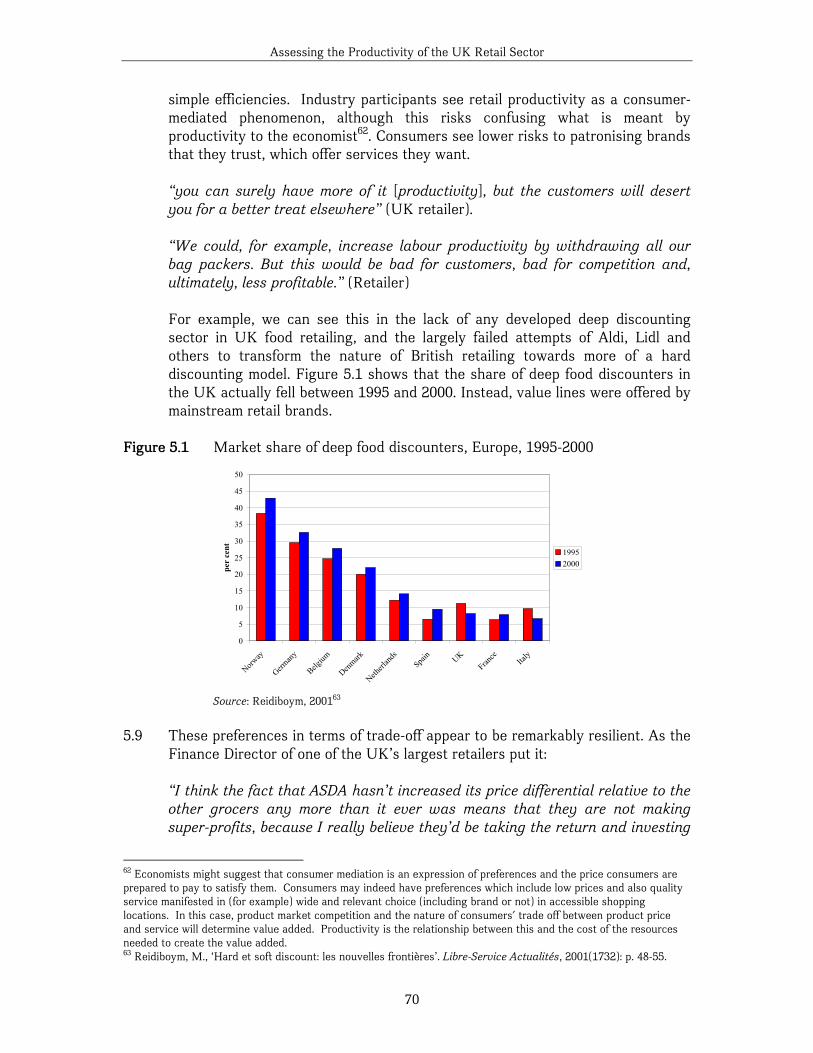
Assessing the Productivity of the UK Retail Sector
70
simple efficiencies. Industry participants see retail productivity as a consumer-mediated phenomenon, although this risks confusing what is meant by productivity to the economist62. Consumers see lower risks to patronising brands that they trust, which offer services they want.
“you can surely have more of it [productivity], but the customers will desert you for a better treat elsewhere” (UK retailer). “We could, for example, increase labour productivity by withdrawing all our bag packers. But this would be bad for customers, bad for competition and, ultimately, less profitable.” (Retailer) For example, we can see this in the lack of any developed deep discounting sector in UK food retailing, and the largely failed attempts of Aldi, Lidl and others to transform the nature of British retailing towards more of a hard discounting model. Figure 5.1 shows that the share of deep food discounters in the UK actually fell between 1995 and 2000. Instead, value lines were offered by mainstream retail brands.
Figure 5.1 Market share of deep food discounters, Europe, 1995-2000
Source: Reidiboym, 200163
5.9 These preferences in terms of trade-off appear to be remarkably resilient. As the
Finance Director of one of the UK’s largest retailers put it:
“I think the fact that ASDA hasn’t increased its price differential relative to the other grocers any more than it ever was means that they are not making super-profits, because I really believe they’d be taking the return and investing
62 Economists might suggest that consumer mediation is an expression of preferences and the price consumers are prepared to pay to satisfy them. Consumers may indeed have preferences which include low prices and also quality service manifested in (for example) wide and relevant choice (including brand or not) in accessible shopping locations. In this case, product market competition and the nature of consumers' trade off between product price and service will determine value added. Productivity is the relationship between this and the cost of the resources needed to create the value added. 63 Reidiboym, M., ‘Hard et soft discount: les nouvelles frontières’. Libre-Service Actualités, 2001(1732): p. 48-55.
0
5
10
15
20
25
30
35
40
45
50
Norway
German
y
Belgium
Denmark
Netherl
ands
Spain UK
France Ita
ly
per
cent 1995
2000
Assessing the Productivity of the UK Retail Sector
71
everything else in price to make themselves even more competitive. And it doesn’t seem to be happening as much as it could be – which makes me think that when ASDA came in they thought they’d be able to drive more efficiencies out. And it just hasn’t happened.” (UK retailer)
5.10 Retailers remarked that the US retail landscape is very different from that in the
UK:
“We do things differently here” (UK food retailer)
“In the last 15 years, American food retailing hasn’t moved on. Whenever I come to the shop in the US, it’s urhhh, it’s dirty. We [British retailers] eat them [the US retailers] for breakfast. The only reason why they may have higher returns is that the quality of service and of places is so low.” (UK general retailer)
5.11 What measures might we use to express the differences between these
differently perceived structures? Examining corporate structure is certainly one approach we can usefully take.
5.12 Despite significant consolidation activity in the US, it is European countries that
show the highest levels of concentration. A frequently used measure of market structure, the Herfindahl-Hirschman Index (HHI), now stands at 519 for the European retail sector, an increase of 28% from the level observed five years ago.64 The HHI for all suppliers including the top five retailers, in France is 1,619, which compares with 1,216 for Germany and 1,256 for the UK. In sectoral terms, the five largest French grocery retailers increased their market share from 61 to 83% in just six years65 Nor should we forget that large companies dominate many of the specialist non-food retail trades too - although by their nature levels of turnover are generally smaller. In the UK, three companies accounted for 26.4% of clothing sales in 2001 and fully 82% in DIY. Italy, so long a preserve of small firms and small retailers within the EU is changing too: the presence of Carrefour and Auchan in the country has helped increase the number of hypermarkets to over 400 in 2000 – a fourfold increase in ten years66.
5.13 The largest European retailers, on average, are smaller than their North
American counterparts in market capitalisation terms, but larger than their
64 The Herfindahl-Herschman Index (HHI) is a measure of market structure frequently used by competition authorities and reflects the market shares of all firms in the market, even the smallest. Unlike, say, a four-firm concentration ratio, the HHI reflects both the market shares of the top four firms and the composition of the market outside the top four firms. If two or three retailers have a very large market share, this is reflected in a higher HHI than if five retailers have similar market shares, even though the aggregate share for the top five retailers is similar. In its Guidelines on Market Investigation References in 2003, the UK Competition Commission observed: "In its guidelines, the OFT states that it is likely to regard any market with a HHI in excess of 1,800 as highly concentrated, and any market with a HHI in excess of 1,000 as concentrated. Where it uses the HHI, the Commission will have regard to the threshold levels set out above, but only as one factor in its wider assessment of competition." (para 3.11). 65 Bell, R.C., ‘Food Retailing in France’. European Retail Digest, 2001(30): p. 27 66 Mintel Retail Intelligence, Food Retailing in Europe - Italy. 2002.
Assessing the Productivity of the UK Retail Sector
72
Japanese and Asian peers (Figure 5.2.) The biggest UK retailers in sales turnover are smaller than the top USA firms, and indeed smaller than several continental European competitors (Table 5.1). Simple as this finding might appear, it signifies substantial potential performance differences in retailing.67 McKinsey Global Institute’s 2002 study considered changes in the productivity in the retail sector in the United States in the 1995-99 period, particularly the general merchandise sector. Scale played a role at the firm level in explaining differences, due in part to the continued emergence of supercentres, but, at the chain level, it suggested that the cost advantages of scale and increasing negotiating power with suppliers, as well as efficiency in logistics, were also major factors. Most obviously, scale advantage in buying – global purchasing power perhaps – has become more and more significant in retailing.68 The largest firms have buying power which smaller ones are unable to match, with consequences for price and competitive strength. However, while buyer power might well, and probably does, have a significant impact on retail "price and competitive strength", it can only have a marginal effect on productivity (for example by means of associated scale effects on the costs of handling the greater throughput and storage of goods, or efficiencies in administration). Nevertheless, the largest UK retailers still do not have the scale of the largest elsewhere in, for example, areas like ICT purchase. Explanations lie at last partly in the limited size of the domestic market, combined with the slowness to develop substantial overseas businesses until recently.
Table 5.1 Largest retailers 2002 Country of origin Company Net sales 2002 (m US$) USA Wal-Mart 244,524 France Carrefour 64,774 Netherlands Ahold 59,267 USA Kroger 51,267 Germany Metro Group 48,561 USA Target 43,917 UK Tesco 39,521 USA Costco 37,993 USA Albertsons 35,626 Germany Rewe 35,276 Germany Aldi 33,713 USA JCPenney 32,347 USA Safeway (USA) 32,100 France ITM 31,572 USA Kmart 30,762 USA Walgreens 28,681 Japan Ito-Yokado 27,238 Germany Edeka 27,082 France Auchan 25,976 UK Sainsbury 25,964 Source: M+M Planet Retail
67 Dragun, D., ‘Stuck in the Middle--or in the Muddle?: Europe's leading retailers in the global value landscape’. in European Retail Digest. 2003, Templeton College. p. 1. 68 Dawson, J. ‘Retailing at century end: some challenges for management and research’. International Review of Retail, Distribution and Consumer Research. April 2000, p 119-148.
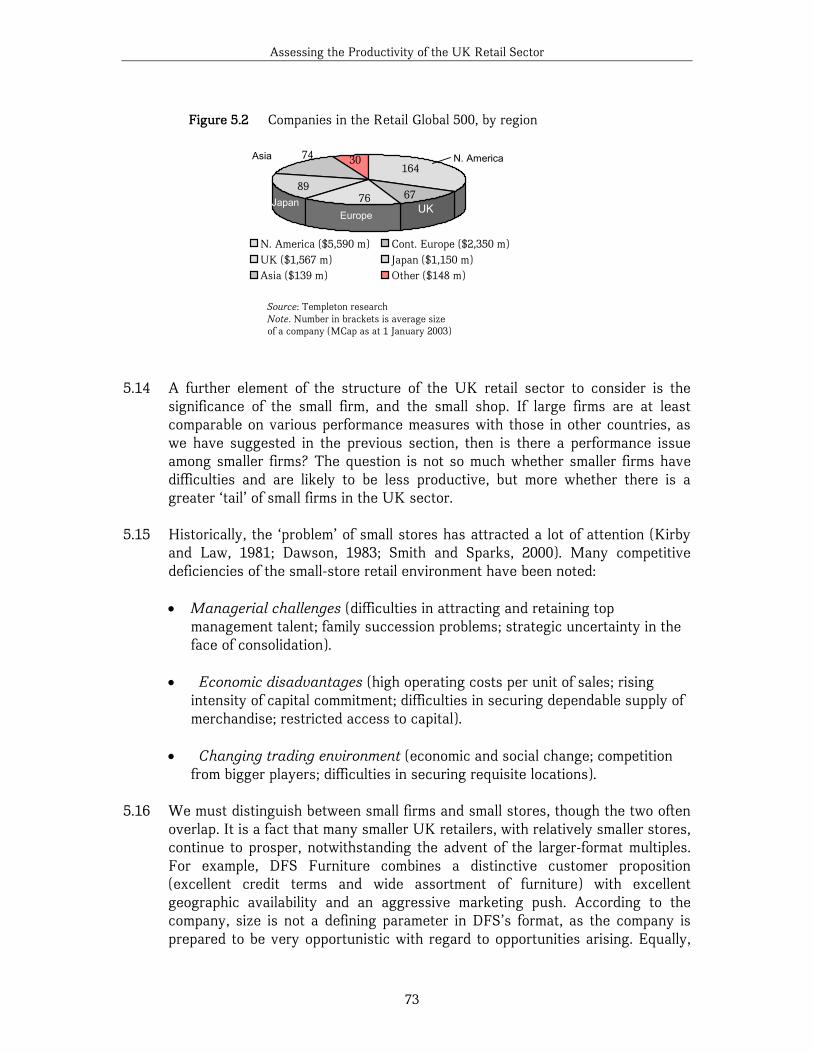
Assessing the Productivity of the UK Retail Sector
73
5.14 A further element of the structure of the UK retail sector to consider is the
significance of the small firm, and the small shop. If large firms are at least comparable on various performance measures with those in other countries, as we have suggested in the previous section, then is there a performance issue among smaller firms? The question is not so much whether smaller firms have difficulties and are likely to be less productive, but more whether there is a greater ‘tail’ of small firms in the UK sector.
5.15 Historically, the ‘problem’ of small stores has attracted a lot of attention (Kirby
and Law, 1981; Dawson, 1983; Smith and Sparks, 2000). Many competitive deficiencies of the small-store retail environment have been noted:
• Managerial challenges (difficulties in attracting and retaining top
management talent; family succession problems; strategic uncertainty in the face of consolidation).
• Economic disadvantages (high operating costs per unit of sales; rising
intensity of capital commitment; difficulties in securing dependable supply of merchandise; restricted access to capital).
• Changing trading environment (economic and social change; competition
from bigger players; difficulties in securing requisite locations). 5.16 We must distinguish between small firms and small stores, though the two often
overlap. It is a fact that many smaller UK retailers, with relatively smaller stores, continue to prosper, notwithstanding the advent of the larger-format multiples. For example, DFS Furniture combines a distinctive customer proposition (excellent credit terms and wide assortment of furniture) with excellent geographic availability and an aggressive marketing push. According to the company, size is not a defining parameter in DFS’s format, as the company is prepared to be very opportunistic with regard to opportunities arising. Equally,
Figure 5.2 Companies in the Retail Global 500, by region
74
8967
164
N. America ($5,590 m) Cont. Europe ($2,350 m)UK ($1,567 m) Japan ($1,150 m)Asia ($139 m) Other ($148 m)
N. America
EuropeJapan
Asia
UK76
30
Source: Templeton research Note. Number in brackets is average size of a company (MCap as at 1 January 2003)
Assessing the Productivity of the UK Retail Sector
74
Ted Baker strives to provide a fashion brand experience in an unusual format of ‘fashion warehouse’ in Covent Garden in London.
5.17 It is surprisingly difficult to make proper comparisons of the structure of the
sector in different countries. We have referred to data deficiencies elsewhere. We are unable to provide a rigorous detailed macro-level comparison of various size firms and various sized stores, across Europe or between the UK and the USA, although some general observations are possible.
5.18 US Census data for 1997 suggest that 26% retail sales are accounted for by
single unit enterprises. UK data for 1994 from the Retail Inquiry show about 23% of total retail turnover in businesses with a single outlet. While this says almost nothing about efficiency within the two sets of firms, we can see at least that the size of the two sectors is similar, so that it cannot necessarily be a larger ‘tail’ of firms per se which explains any UK retail productivity gap. Much further work would be necessary to compare the actual performance of the two small firm sectors.
5.1.2 Process differences – the example of ICT
“Aging technology investment and aging stores are the primary limitations to productivity” (US retailer)
5.19 Apart from noting the absence of any regulatory constraints as barriers from this
US observation, using technology more cleverly, particularly in relation to space, would appear to be one area where there are some noticeably common concerns between the US and UK, but where the McKinsey Global Institute argues (for example) that differential ability to implement technological innovation divides the two retail markets69. The retailers we interviewed agreed:
“The companies I looked at in the UK tended to have the in-house IT departments because it was seen as being a key competitive advantage. In the US, the systems companies tend to develop retail company systems more generally which then every retailer took up. It would appear that the internal IT capacity was not seen by US retailers as the key competitive advantage – hence everyone became efficient at the same rate. In the UK, on the contrary, retailers had to replace their systems at different speeds and thus have different systems capabilities and they retain in-house IT systems – which may be extremely costly.” (UK non-food retailer) “A clear evaluation of your IT projects is critical. There must be a clearly stated, well defined payback, which exceeds your cost of capital. A disciplined and consistent payback analysis is probably the single most important practice to increase efficiency. I think companies tend to make investments, but then
69 National Center for Policy Analysis, 2002, Productivity and The Wal-Mart Connection, Daily Policy Digest, 28th February, http://www.ncpa.org/iss/eco/2002/pd022802a.html
Assessing the Productivity of the UK Retail Sector
75
don’t actually follow through on whether or not the investment had payback equivalent to what was projected at the time the investment was made.” (US retailer)
5.20 If these observations are generalisable, then retailers may need to use
Information and Communications Technology (ICT) more cleverly in the UK. As one UK Finance Director put it, “IT got cheaper, and the physical assets got dearer.” Therefore the economics would now seem to be in favour of IT development, but as one US retailer warns:
“Investing in today’s technology is often much less expensive than technology of even 2-3 years ago, but you need to forestall IT decisions as long as possible, recognising that technology seems to always fall in price. The depreciation of aging technology investments seems to hit your income statement at an alarming rate and you can frankly buy the same technology for much less.” (US non-food retailer)
But some UK retailers have much to do: “We celebrated our 30-year anniversary this year, and so did our systems. It means that the system is capacity-constrained, things that you do are not particularly sexy, and also you cannot do many things we want to do. So we are gradually moving onto more off-the-shelf software packages. So we have to ask our IT providers to modify their software packages to account for various different new variables. But then the costs of licenses for these packages are absolutely enormous. In the long-run, you hope that it will be cheaper to buy the systems externally, but there are also the risks.” (UK non-food retailer)
5.21 Nevertheless, within particular segments, there has been an international, industry-wide approach. For example, the grocery retail industry has approached sector-level improvements in supply chain efficiency via the ECR (efficient consumer response) movement. The programmes began in the grocery industry but have influenced other sectors. The Kurt Salmon report70 on ECR in the US grocery industry kindled interest in the savings which might be produced by collaboration across the supply chain. It was followed by a European report71, a series of conferences, and the setting up of the ECR association.
“ECR is a grocery industry strategy in which distributors and suppliers are working closely together to bring better value to the grocery consumer. By jointly focusing on the efficiency of the total grocery supply system, rather than the efficiency of individual components, they are reducing total system costs, inventories and physical assets while improving the consumer’s choice of high quality, fresh grocery products.” (KSA 1993)
70 Kurt Salmon Associates, Efficient Consumer Response: Enhancing Consumer Value in the Grocery Industry. 1993, American Meat Institute, Food Marketing Institute, Grocery Manufacturers of America, National Food Brokers Association, Uniform Code Council. 71 Coca-Cola Retailing Research Group Europe, Supplier-Retailer Collaboration in Supply Chain Management. 1994.
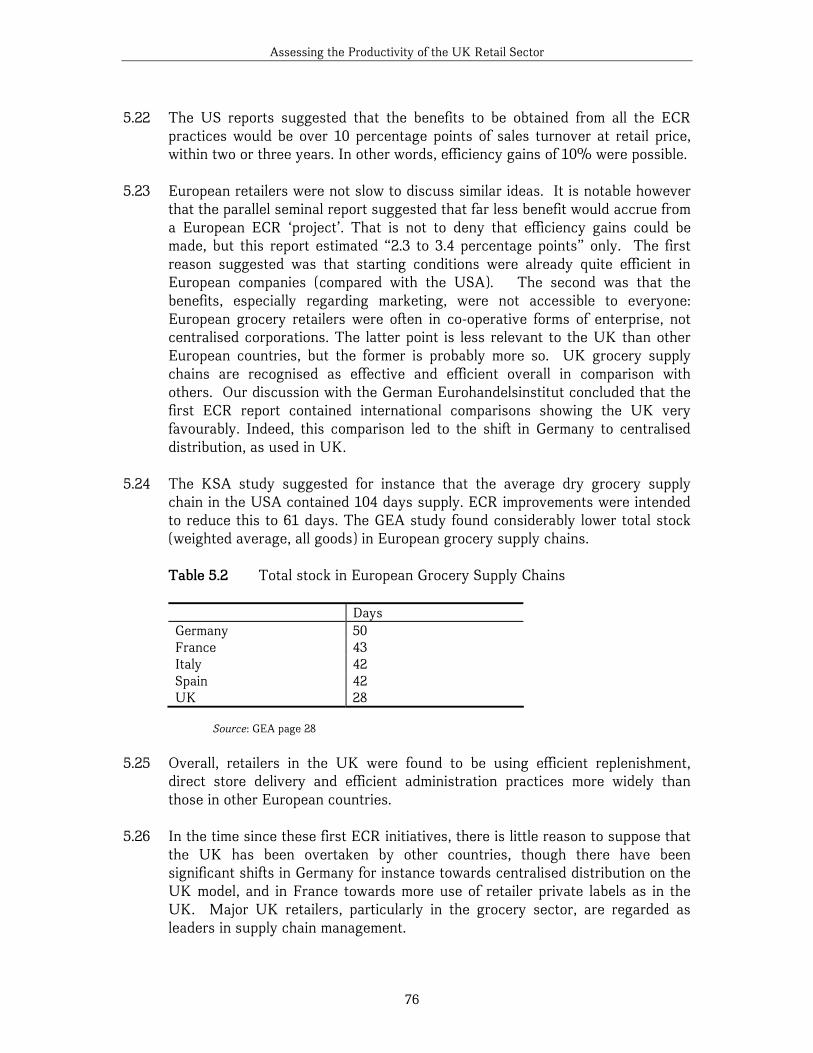
Assessing the Productivity of the UK Retail Sector
76
5.22 The US reports suggested that the benefits to be obtained from all the ECR
practices would be over 10 percentage points of sales turnover at retail price, within two or three years. In other words, efficiency gains of 10% were possible.
5.23 European retailers were not slow to discuss similar ideas. It is notable however
that the parallel seminal report suggested that far less benefit would accrue from a European ECR ‘project’. That is not to deny that efficiency gains could be made, but this report estimated “2.3 to 3.4 percentage points” only. The first reason suggested was that starting conditions were already quite efficient in European companies (compared with the USA). The second was that the benefits, especially regarding marketing, were not accessible to everyone: European grocery retailers were often in co-operative forms of enterprise, not centralised corporations. The latter point is less relevant to the UK than other European countries, but the former is probably more so. UK grocery supply chains are recognised as effective and efficient overall in comparison with others. Our discussion with the German Eurohandelsinstitut concluded that the first ECR report contained international comparisons showing the UK very favourably. Indeed, this comparison led to the shift in Germany to centralised distribution, as used in UK.
5.24 The KSA study suggested for instance that the average dry grocery supply
chain in the USA contained 104 days supply. ECR improvements were intended to reduce this to 61 days. The GEA study found considerably lower total stock (weighted average, all goods) in European grocery supply chains.
Table 5.2 Total stock in European Grocery Supply Chains
Days Germany 50 France 43 Italy 42 Spain 42 UK 28
Source: GEA page 28
5.25 Overall, retailers in the UK were found to be using efficient replenishment,
direct store delivery and efficient administration practices more widely than those in other European countries.
5.26 In the time since these first ECR initiatives, there is little reason to suppose that
the UK has been overtaken by other countries, though there have been significant shifts in Germany for instance towards centralised distribution on the UK model, and in France towards more use of retailer private labels as in the UK. Major UK retailers, particularly in the grocery sector, are regarded as leaders in supply chain management.
Assessing the Productivity of the UK Retail Sector
77
5.27 The scope for increasing efficiency through ICT is constantly reviewed by retailers. Looking forward, RFID (Radio Frequency IDentification) is seen by many retailers and commentators as the forthcoming single most important driver of future productivity in retailing. Tesco and Marks and Spencer have engaged in piloting, and the application of RFID in the Metro Group’s Future Store Initiative in Rheinberg has attracted some admiration. But it was not until Wal-Mart announced its intention in June 2003 to require RFID-compliant pallets and cases from its 100 biggest suppliers to its distribution centres by January 2005, that the technology appeared more clearly on retailers’ and suppliers’ agendas. Wal-Mart shipped over 2.5bn cases through its distribution centres in the US during one six-month period last year; the scope for further improvements in supply chain efficiency is considerable.
5.28 Passive RFID tags, presently costing between 10 and 50 cents, broadcast a data
stream when scanned by a radio signal from up to 5 metres away; more expensive tags are battery-powered and transmit without having to be ‘woken’. Upstream applications, within the supply chain, provide a lower risk RFID entry point for retailers, but the real innovation occurs downstream, at the individual consumer product level. RFID is potentially applicable to entities ranging from cats to cars and from banknotes to milk bottles.72
“One of the biggest specific opportunities [for improving efficiency] is RFID. The next structural change in the UK retailing is likely to come from this direction – by reducing involvement in stock management. RFID technology will radically improve retailers’ ability to trace items at every stage in the supply chain thereby increasing the stock accuracy radically. (UK retailer)
5.29 For retailing, RFID is a classic example of a potentially disruptive technology.73 In terms of productivity, there are two points to be made here. The first is that ICT innovations like RFID require significant upfront investment and payback periods, in terms of productivity gains, may be in the order of the 5-15 years identified in studies of ICT investment and productivity (see paragraph 3.26); the speed of payback for individual firms being a consequence of their skills in ICT project management and implementation. Secondly, it is clear that an innovation like RFID is not country-specific in its effects (with pioneering retailers in the US, UK and Germany planning similarly serious investments), but the adoption of the technology by a single firm which has a dominant position in any one country market (such as Wal-Mart in the US) might be sufficient to differentially improve the productivity of the sector as a whole in that country. As competitors adopt these innovations, overall productivity is further enhanced:
“take out wholesale and retail trade and finance, take out Wal-Mart and Land's End, and the U.S.-E.U. productivity differential post-1995 goes away.”74
72 Reynolds, J., ‘Who's Afraid of RFID?’ BRC Solutions, 2003. September. 73 Clayton Christenson and Richard Tedlow of Harvard Business School define disruptive technologies as innovations that change the economics of an industry (even if they may not be initially profitable innovations). 74 De Long, Brad, The Industry-Level Shape of Productivity Growth in the 1990s, http://www.j-bradford-delong.net/movable_type/archives/000948.html, 2002
Assessing the Productivity of the UK Retail Sector
78
5.30 There is scope here for government to help in promoting tagging standards and
supporting infrastructure; a suggestion we make in our recommendations, in section 6 below.
5.2 Environmental explanations 5.31 There is abundant popular perception that environmental conditions, including
regulation, differentially affect the operation and efficiency of retailing between countries.
“Compliance issues have the biggest impact on the efficiency and cost of our business.” (medium-sized UK retailer)
5.32 There are two questions that should concern us here:
• are there key differences in the efficiency and performance of UK retailing, as compared to that in other countries, which may be attributed to differences in the regulatory environment?
• would de-regulation, or change in regulation of some nature, produce gains in efficiency?
The commonly-held view is that there are differences and that deregulation would produce gains in efficiency:
“in many European industries regulations and structural impediments in product and labour markets limit the opportunities to invest in ICT. Examples of product market restrictions include limits on shop opening hours, and transport regulations that make it difficult for manufacturers and wholesalers to supply customers frequently.75
5.33 In addition, many of these costs will have indirect effects upon retail
productivity. (For example, estimates suggest that the United States loses roughly 2 percent of its gross national product to congestion and that the United Kingdom loses about 5 percent - which will create differential costs for retailers and manufacturers in those countries.)76 Other regulations may have more complex effects. Relaxing trading hours restrictions might reduce labour efficiency, but would increase the efficient use of capital, because of longer trading time from a fixed store. But the overall impact on productivity is uncertain. However, we frame our discussion around those environmental explanations which more directly affect the efficiency of use of both labour and space. In addressing these questions, we are further conscious that another
75 Van Ark, B., R. Inklaar, and R.H. McGuckin, "Changing Gear". Productivity, ICT and Service Industries: Europe and the United States. 2002, The Conference Board: Washington. 76 MacKenzie, J.J., R.C. Dower, and D.T. Chen, The Going Rate: What It Really Costs to Drive. 1992, World Resources Institute: Washington, D. C.
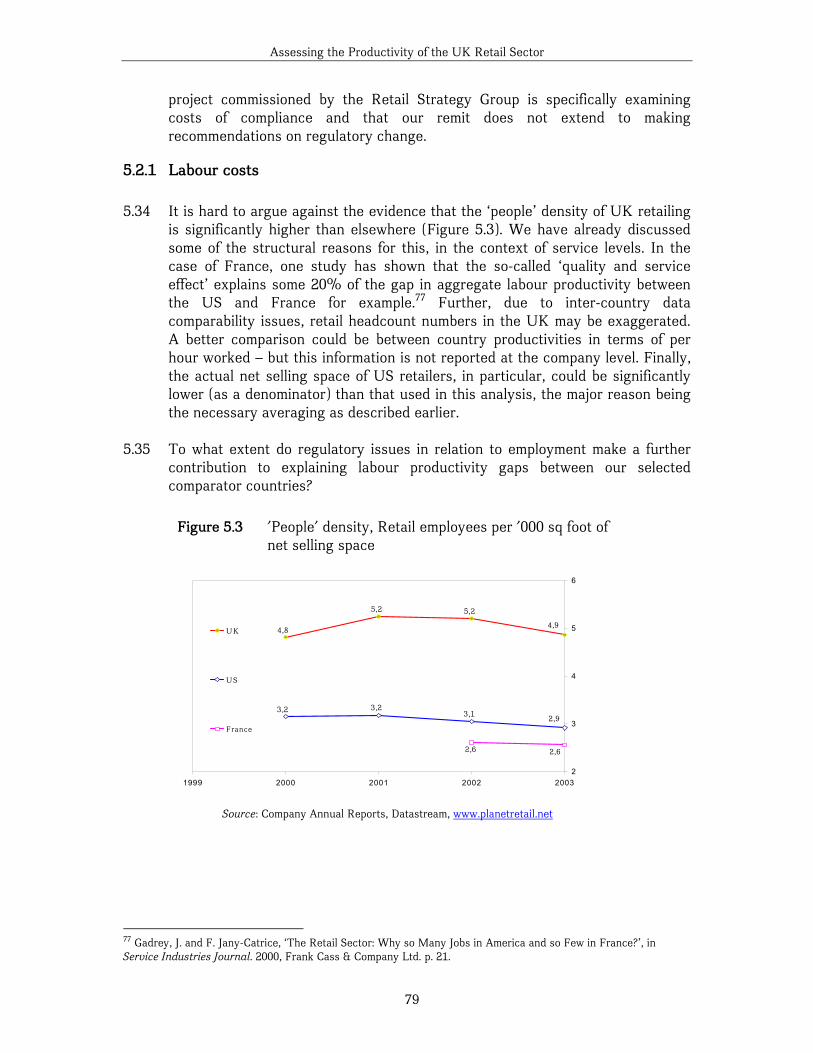
Assessing the Productivity of the UK Retail Sector
79
project commissioned by the Retail Strategy Group is specifically examining costs of compliance and that our remit does not extend to making recommendations on regulatory change.
5.2.1 Labour costs 5.34 It is hard to argue against the evidence that the ‘people’ density of UK retailing
is significantly higher than elsewhere (Figure 5.3). We have already discussed some of the structural reasons for this, in the context of service levels. In the case of France, one study has shown that the so-called ‘quality and service effect’ explains some 20% of the gap in aggregate labour productivity between the US and France for example.77 Further, due to inter-country data comparability issues, retail headcount numbers in the UK may be exaggerated. A better comparison could be between country productivities in terms of per hour worked – but this information is not reported at the company level. Finally, the actual net selling space of US retailers, in particular, could be significantly lower (as a denominator) than that used in this analysis, the major reason being the necessary averaging as described earlier.
5.35 To what extent do regulatory issues in relation to employment make a further
contribution to explaining labour productivity gaps between our selected comparator countries?
77 Gadrey, J. and F. Jany-Catrice, ‘The Retail Sector: Why so Many Jobs in America and so Few in France?’, in Service Industries Journal. 2000, Frank Cass & Company Ltd. p. 21.
Figure 5.3 'People' density, Retail employees per '000 sq foot of net selling space
4,8
5,2 5,2
4,9
3,2 3,23,1 2,9
2,6 2,6
2
3
4
5
6
20032002200120001999
UK
US
France
Source: Company Annual Reports, Datastream, www.planetretail.net
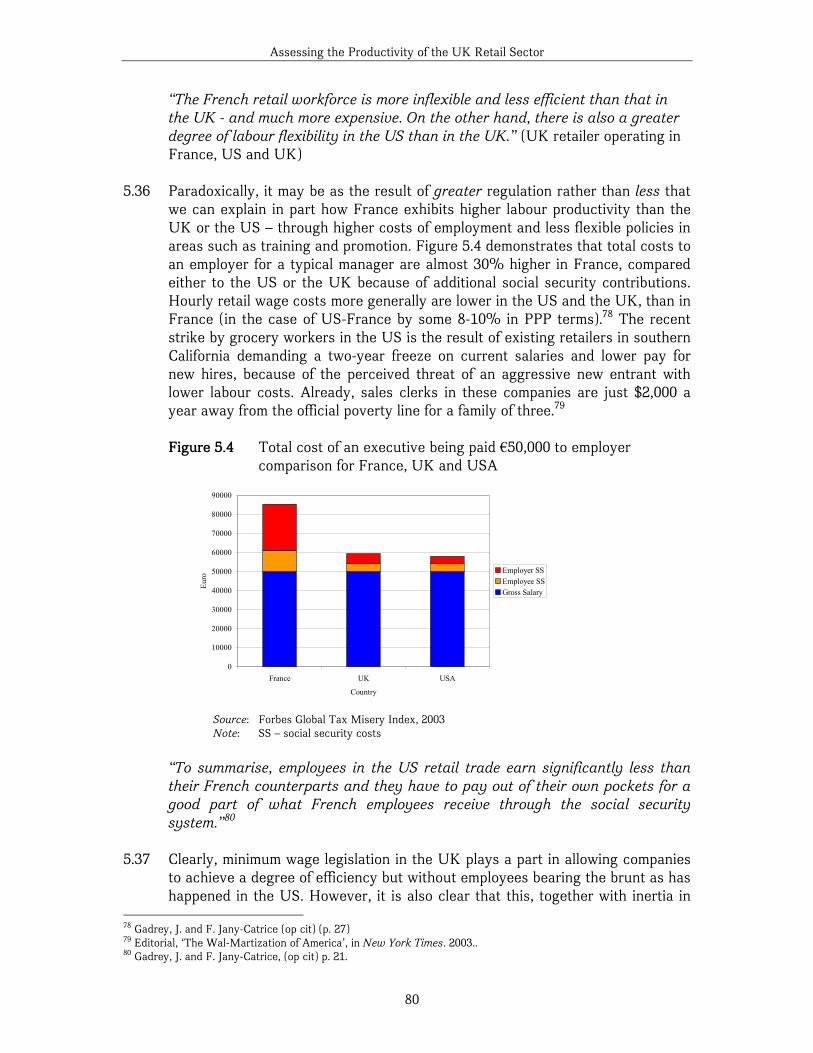
Assessing the Productivity of the UK Retail Sector
80
“The French retail workforce is more inflexible and less efficient than that in the UK - and much more expensive. On the other hand, there is also a greater degree of labour flexibility in the US than in the UK.” (UK retailer operating in France, US and UK)
5.36 Paradoxically, it may be as the result of greater regulation rather than less that
we can explain in part how France exhibits higher labour productivity than the UK or the US – through higher costs of employment and less flexible policies in areas such as training and promotion. Figure 5.4 demonstrates that total costs to an employer for a typical manager are almost 30% higher in France, compared either to the US or the UK because of additional social security contributions. Hourly retail wage costs more generally are lower in the US and the UK, than in France (in the case of US-France by some 8-10% in PPP terms).78 The recent strike by grocery workers in the US is the result of existing retailers in southern California demanding a two-year freeze on current salaries and lower pay for new hires, because of the perceived threat of an aggressive new entrant with lower labour costs. Already, sales clerks in these companies are just $2,000 a year away from the official poverty line for a family of three.79
Figure 5.4 Total cost of an executive being paid €50,000 to employer
comparison for France, UK and USA
Source: Forbes Global Tax Misery Index, 2003 Note: SS – social security costs
“To summarise, employees in the US retail trade earn significantly less than their French counterparts and they have to pay out of their own pockets for a good part of what French employees receive through the social security system.”80
5.37 Clearly, minimum wage legislation in the UK plays a part in allowing companies to achieve a degree of efficiency but without employees bearing the brunt as has happened in the US. However, it is also clear that this, together with inertia in
78 Gadrey, J. and F. Jany-Catrice (op cit) (p. 27) 79 Editorial, ‘The Wal-Martization of America’, in New York Times. 2003.. 80 Gadrey, J. and F. Jany-Catrice, (op cit) p. 21.
0
10000
20000
30000
40000
50000
60000
70000
80000
90000
France UK USA
Country
Euro
Employer SSEmployee SSGross Salary
Assessing the Productivity of the UK Retail Sector
81
differential wage levels can result in unsatisfactory outcomes for the sector, particularly given its historically poor image:
“I was out visiting stores last week, and to get a cleaner we were having to pay 50% more than we are paying to people who work in our stores as ordinary store staff. We couldn’t advertise for the cleaner on the front window of that store and had to do it on another store where the wage rate was slightly higher, because if people saw it, they’d go ballistic. It’s just a sign of how all this has gone a little bit silly, really.”(UK non-food retailer)
5.38 The additional per employee costs of employing labour in France also means that French retailers will staff stores somewhat differently from their US and UK competitors; fewer part-time and casual workers will be used and more full-timers. This necessarily reduces the flexibility with which French retailers can deploy their human resources in response to perceived customer demand and the operational requirements of the business, despite leading to greater labour productivity. It might nevertheless be useful better to understand the characteristics and consequences of French retailers’ use of labour.
5.39 Other human resource areas also differentially affect the ability of retailers in
different countries to use staff efficiently or control total costs related to labour.
“There are substantial differences in approaches to staff training & progression, which is much more rigorous and formal in France and Germany than in the UK.” (UK retailer)
“If I look back over the last five years and look where I added cost to the business, HR would be such an area. To minimise our risks in terms of industrial tribunals, employee grievances, the whole area of ensuring that we treat people well, we added eight people to handle these issues for our business.” (medium-sized non-food UK retailer)
5.40 Retailing’s image as an employer in the UK nevertheless appears to have improved over the past two decades. Graduate employment in UK retailing was 3.3% of the workforce in 1988, but had grown 102% to 6.5% in 1998 (the overall workforce grew just 3% during the same period); +175,000 graduates in the UK in 1998.81 Whilst difficulties in attracting more highly skilled new entrants persist, the professionalisation of the industry continues:
“In 2002, there were nearly 200,000 new jobs in the sector, 33% of them at managerial/supervisory level. Retailing provides a regular source of vacancies for graduates. Whereas graduate vacancies overall declined by 4% from 2001 to 2002, retail vacancies for graduates increased by 20%.” (Consortium of Retail Teaching Companies (CORTCO) figures)
81 Mason, G., ‘High Skills Utilisation Under Mass Higher Education: graduate employment in service industries in Britain’. Journal of Education and Work, 2002. 15(4).
Assessing the Productivity of the UK Retail Sector
82
“mainstream graduates(recruited through formal entry programmes) have been taken on in increasing numbers to fill positions requiring high levels of analytical ability, generic skills and, in many cases, technical knowledge. In part this reflects increased competitive pressures to improve efficiency and responsiveness to changing markets along with the spread of project-working and other changes in work organisation which benefit from high levels of information-processing, communication and other generic skills.”82
5.41 We have no detailed comparative figures for the US, but some anecdotal
insights provide an indication of activities in the largest companies. Whilst all US store managers at Home Depot, the world’s second largest retailer, are college graduates and the company committed to 19mn hours of training in 2002-03, the industry as a whole managed only five places in the Employers of Choice Top 100 for 2003 – and, with the exception of Wal-Mart at #9, all in the bottom half of the table.83
5.42 In the comparatively deregulated environment of the US, retailers we
interviewed see fewer barriers to enhancing labour productivity, although some exist: “Our primary constraints to realizing ever increasing labor productivity are related to costs - specifically, the rapid rise in the cost of health insurance. In the US, this is rising at a factor many times greater that the rate of inflation and there is no sign of this slowing.” (US retailer).
5.2.2 Space, Planning and Property 5.43 Retailing performance is critically dependent on ‘location, location, location’.
Setting aside questions of e-commerce, retailing is an inherently local activity: its essence is local distribution. The property environment therefore is a key influence on performance. The locations, sizes and kinds of shop premises available, the sizes and natures of shopping centres, the nature of ease of accessibility to centres and to shops are key influences on performance.84
5.44 There are three broad ways in which the property environment may inhibit
improved performance. First is by constraining competition through rigidities in the system: both entry to and exit from the market may be restrained. (Section 3 drew attention to the importance of entry and exit both of firms and of new outlets to increasing productivity in US retailing.) The second is through actual supply: sub-optimal size, shape, location and condition inhibit performance – particularly logistical performance. A lack of large store premises prevents retailers benefiting from economies of scale. One may certainly draw attention to the fact that much UK (and other European) retailing takes place in historic
82 Mason, G., (op cit) 83 http://www.employersofchoice.com/rankings.asp?page=1 84 Guy, C.M., The Retail Development Process. 1994, London: Routledge.
Assessing the Productivity of the UK Retail Sector
83
buildings and town centres: the relatively young age of US shop property must be an efficiency advantage. Thirdly, the cost of property may be high.
5.45 The most profound difference between US retailing and UK retailing is in the
property environment:
“Retail development in America has tended to be a fairly low-cost, rather risky and disorganised part of the urban economy. Shops and centres frequently fail through competitive pressures….and public policy makers show little concern over this process. In Britain, a planning system which in any case restricts land for new development has been further used by existing interests (commercial and financial) to limit the volume and location of new retail development. Retail development is thus high-cost, secure and organised, a state of affairs regulated by market forces as much as by public interest.. We conclude therefore that contrasts in urban retail structure between the two countries reflect underlying societal characteristics...” (Guy & Lord 1991)85
5.46 Retail property costs are generally accepted to be higher in the UK than in
France and the USA – our comparator countries. Many published rental comparisons are not as helpful as they might be in assessing this difference, as they tend to focus on capital cities rather than the market as a whole. A careful piece of work by Guy and Lord compared the retail structure of two similar cities in detail.86 Their study showed a total amount of retail floorspace in the US city of Charlotte more than twice as great as in Cardiff (Table 5.3). Top retail rents in the latter were six times those in the former. More recent work by Deutsche Bank showed comparative land costs for specific grocery retailers. US costs were given as $500 per sq metre or below; those for continental European firms were below, often substantially below, $1,500. UK retailers all showed costs of over $2,50087.
5.47 The UK is a small country and land and floorspace are more expensive because
less plentiful than in France or the UK. Supply is generally constrained and it should be noted that land values in general are high and retail land prices are probably underpinned by values for alternative uses. Our interviews with retailers for this study showed that they are particularly concerned about the costs, and the rising costs, of property.
“If we had the same inflation for the selling prices as we do for the rents, then DVD would probably cost £4K” (UK non-food retailer)
“Rising rents is a big cost problem due to the inflexible nature and time lags between the changing market conditions and what the company has to pay in rent.” (UK non-food retailer)
85 Guy, C.M. and J.D. Lord, ‘Comparative retail structure of British and American Cities’. International Review of Retail, Distribution and Consumer Research, 1991. 1(4): p. 391-453 86 Guy, C.M. and J.D. Lord, ‘Transformation and the City Centre’, in Retail Change: Contemporary Issues, R.D.F. Bromley and C.J. Thomas, Editors. 1993, UCL Press: London. 87 Deutsche Bank Research, Global Food Retailing part 1. 1999, Deutsche Bank: London.
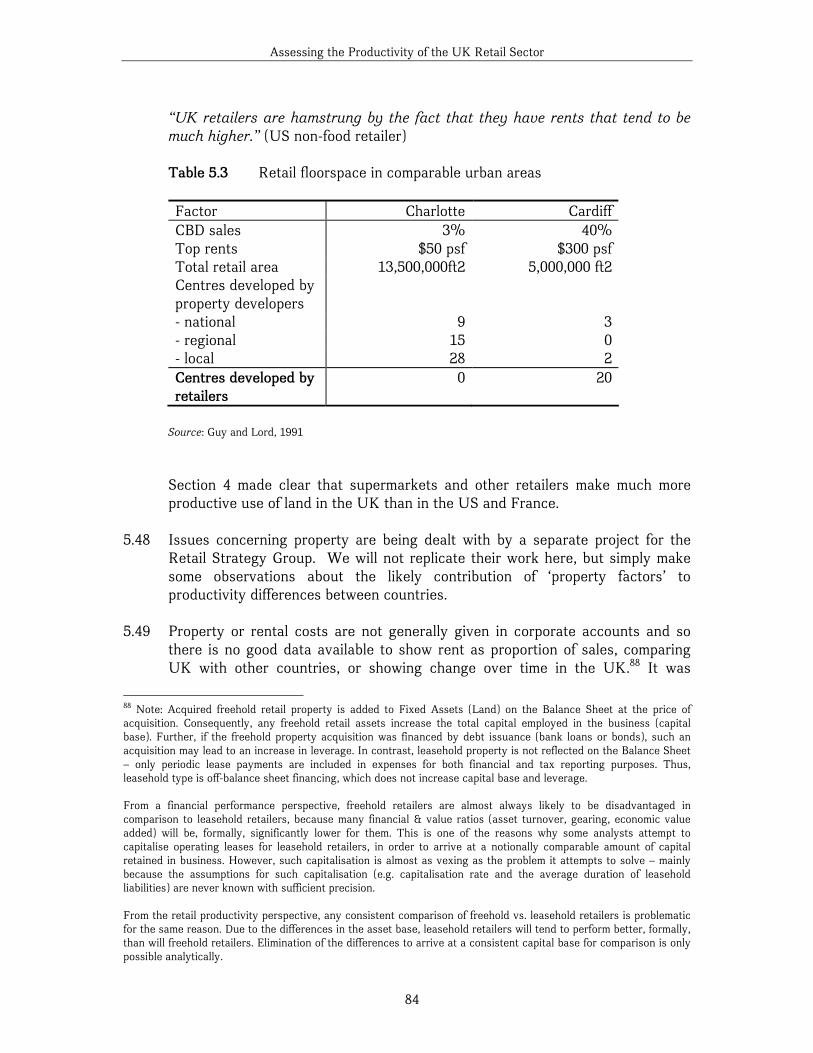
Assessing the Productivity of the UK Retail Sector
84
“UK retailers are hamstrung by the fact that they have rents that tend to be much higher.” (US non-food retailer) Table 5.3 Retail floorspace in comparable urban areas
Factor Charlotte Cardiff CBD sales 3% 40% Top rents $50 psf $300 psf Total retail area 13,500,000ft2 5,000,000 ft2 Centres developed by property developers
- national 9 3 - regional 15 0 - local 28 2 Centres developed by retailers
0 20
Source: Guy and Lord, 1991
Section 4 made clear that supermarkets and other retailers make much more productive use of land in the UK than in the US and France.
5.48 Issues concerning property are being dealt with by a separate project for the
Retail Strategy Group. We will not replicate their work here, but simply make some observations about the likely contribution of ‘property factors’ to productivity differences between countries.
5.49 Property or rental costs are not generally given in corporate accounts and so
there is no good data available to show rent as proportion of sales, comparing UK with other countries, or showing change over time in the UK.88 It was
88 Note: Acquired freehold retail property is added to Fixed Assets (Land) on the Balance Sheet at the price of acquisition. Consequently, any freehold retail assets increase the total capital employed in the business (capital base). Further, if the freehold property acquisition was financed by debt issuance (bank loans or bonds), such an acquisition may lead to an increase in leverage. In contrast, leasehold property is not reflected on the Balance Sheet – only periodic lease payments are included in expenses for both financial and tax reporting purposes. Thus, leasehold type is off-balance sheet financing, which does not increase capital base and leverage. From a financial performance perspective, freehold retailers are almost always likely to be disadvantaged in comparison to leasehold retailers, because many financial & value ratios (asset turnover, gearing, economic value added) will be, formally, significantly lower for them. This is one of the reasons why some analysts attempt to capitalise operating leases for leasehold retailers, in order to arrive at a notionally comparable amount of capital retained in business. However, such capitalisation is almost as vexing as the problem it attempts to solve – mainly because the assumptions for such capitalisation (e.g. capitalisation rate and the average duration of leasehold liabilities) are never known with sufficient precision. From the retail productivity perspective, any consistent comparison of freehold vs. leasehold retailers is problematic for the same reason. Due to the differences in the asset base, leasehold retailers will tend to perform better, formally, than will freehold retailers. Elimination of the differences to arrive at a consistent capital base for comparison is only possible analytically.
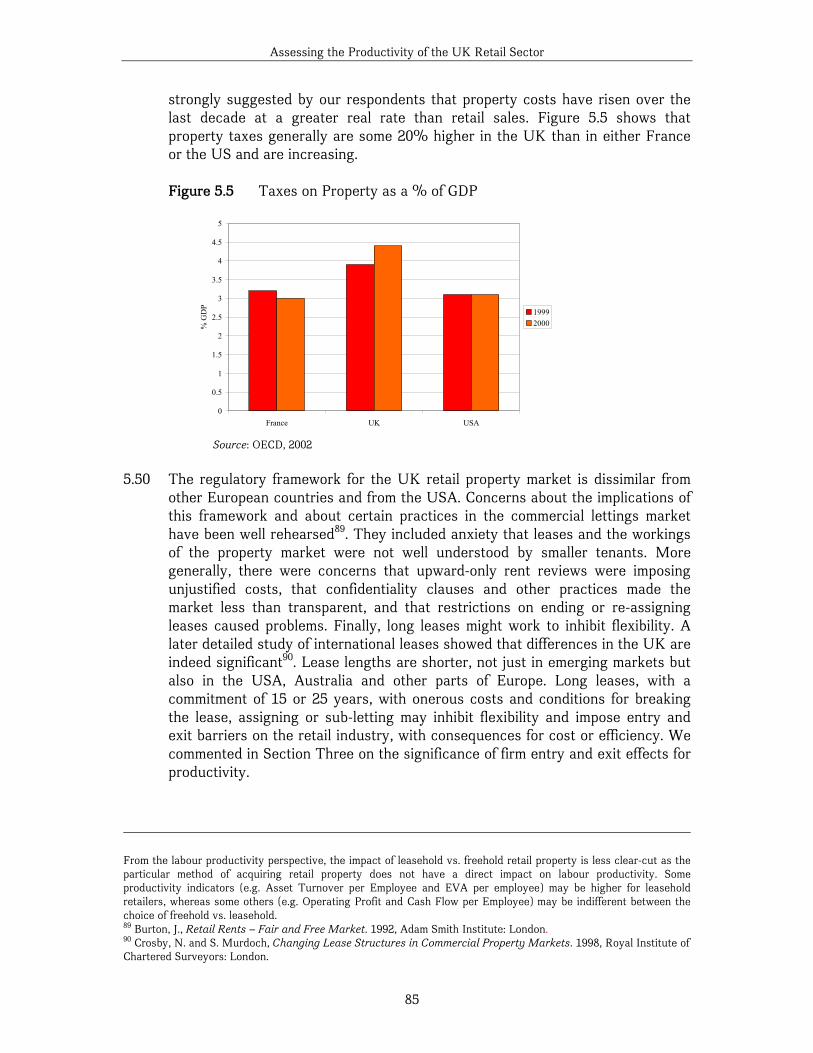
Assessing the Productivity of the UK Retail Sector
85
strongly suggested by our respondents that property costs have risen over the last decade at a greater real rate than retail sales. Figure 5.5 shows that property taxes generally are some 20% higher in the UK than in either France or the US and are increasing.
Figure 5.5 Taxes on Property as a % of GDP
Source: OECD, 2002
5.50 The regulatory framework for the UK retail property market is dissimilar from
other European countries and from the USA. Concerns about the implications of this framework and about certain practices in the commercial lettings market have been well rehearsed89. They included anxiety that leases and the workings of the property market were not well understood by smaller tenants. More generally, there were concerns that upward-only rent reviews were imposing unjustified costs, that confidentiality clauses and other practices made the market less than transparent, and that restrictions on ending or re-assigning leases caused problems. Finally, long leases might work to inhibit flexibility. A later detailed study of international leases showed that differences in the UK are indeed significant90. Lease lengths are shorter, not just in emerging markets but also in the USA, Australia and other parts of Europe. Long leases, with a commitment of 15 or 25 years, with onerous costs and conditions for breaking the lease, assigning or sub-letting may inhibit flexibility and impose entry and exit barriers on the retail industry, with consequences for cost or efficiency. We commented in Section Three on the significance of firm entry and exit effects for productivity.
From the labour productivity perspective, the impact of leasehold vs. freehold retail property is less clear-cut as the particular method of acquiring retail property does not have a direct impact on labour productivity. Some productivity indicators (e.g. Asset Turnover per Employee and EVA per employee) may be higher for leasehold retailers, whereas some others (e.g. Operating Profit and Cash Flow per Employee) may be indifferent between the choice of freehold vs. leasehold. 89 Burton, J., Retail Rents – Fair and Free Market. 1992, Adam Smith Institute: London. 90 Crosby, N. and S. Murdoch, Changing Lease Structures in Commercial Property Markets. 1998, Royal Institute of Chartered Surveyors: London.
0
0.5
1
1.5
2
2.5
3
3.5
4
4.5
5
France UK USA
% G
DP
19992000
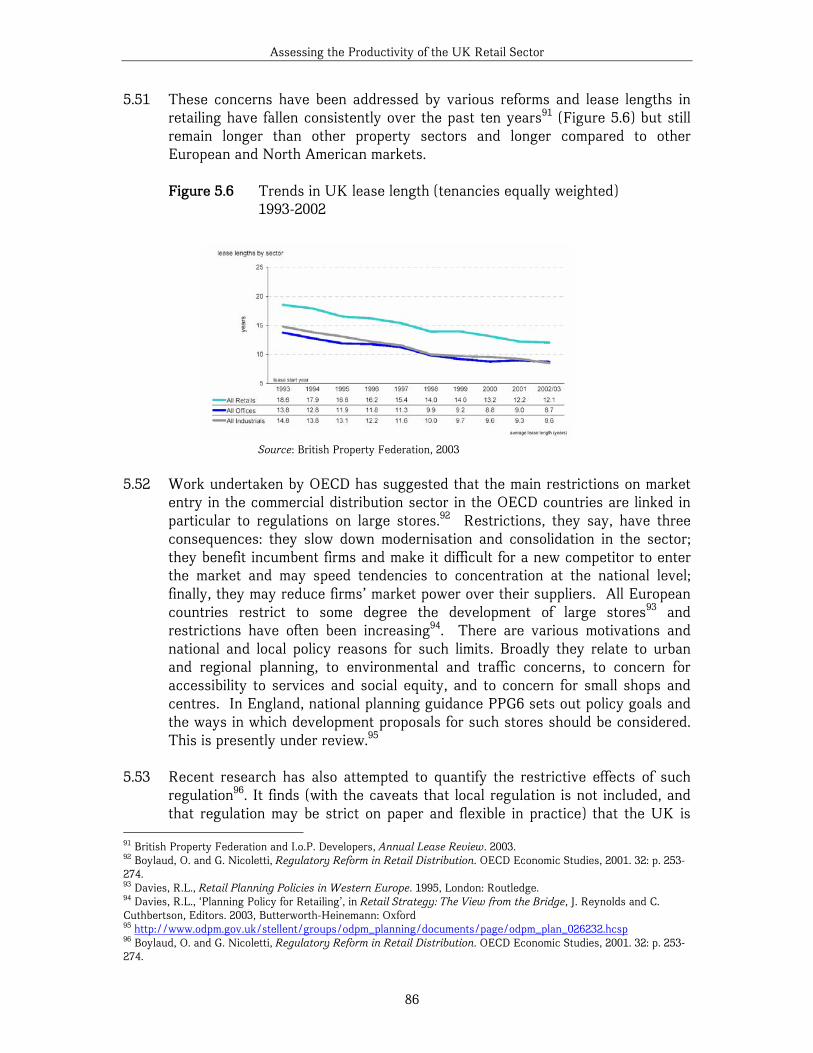
Assessing the Productivity of the UK Retail Sector
86
5.51 These concerns have been addressed by various reforms and lease lengths in retailing have fallen consistently over the past ten years91 (Figure 5.6) but still remain longer than other property sectors and longer compared to other European and North American markets. Figure 5.6 Trends in UK lease length (tenancies equally weighted)
1993-2002
Source: British Property Federation, 2003
5.52 Work undertaken by OECD has suggested that the main restrictions on market
entry in the commercial distribution sector in the OECD countries are linked in particular to regulations on large stores.92 Restrictions, they say, have three consequences: they slow down modernisation and consolidation in the sector; they benefit incumbent firms and make it difficult for a new competitor to enter the market and may speed tendencies to concentration at the national level; finally, they may reduce firms’ market power over their suppliers. All European countries restrict to some degree the development of large stores93 and restrictions have often been increasing94. There are various motivations and national and local policy reasons for such limits. Broadly they relate to urban and regional planning, to environmental and traffic concerns, to concern for accessibility to services and social equity, and to concern for small shops and centres. In England, national planning guidance PPG6 sets out policy goals and the ways in which development proposals for such stores should be considered. This is presently under review.95
5.53 Recent research has also attempted to quantify the restrictive effects of such
regulation96. It finds (with the caveats that local regulation is not included, and that regulation may be strict on paper and flexible in practice) that the UK is
91 British Property Federation and I.o.P. Developers, Annual Lease Review. 2003. 92 Boylaud, O. and G. Nicoletti, Regulatory Reform in Retail Distribution. OECD Economic Studies, 2001. 32: p. 253-274. 93 Davies, R.L., Retail Planning Policies in Western Europe. 1995, London: Routledge. 94 Davies, R.L., ‘Planning Policy for Retailing’, in Retail Strategy: The View from the Bridge, J. Reynolds and C. Cuthbertson, Editors. 2003, Butterworth-Heinemann: Oxford 95 http://www.odpm.gov.uk/stellent/groups/odpm_planning/documents/page/odpm_plan_026232.hcsp 96 Boylaud, O. and G. Nicoletti, Regulatory Reform in Retail Distribution. OECD Economic Studies, 2001. 32: p. 253-274.
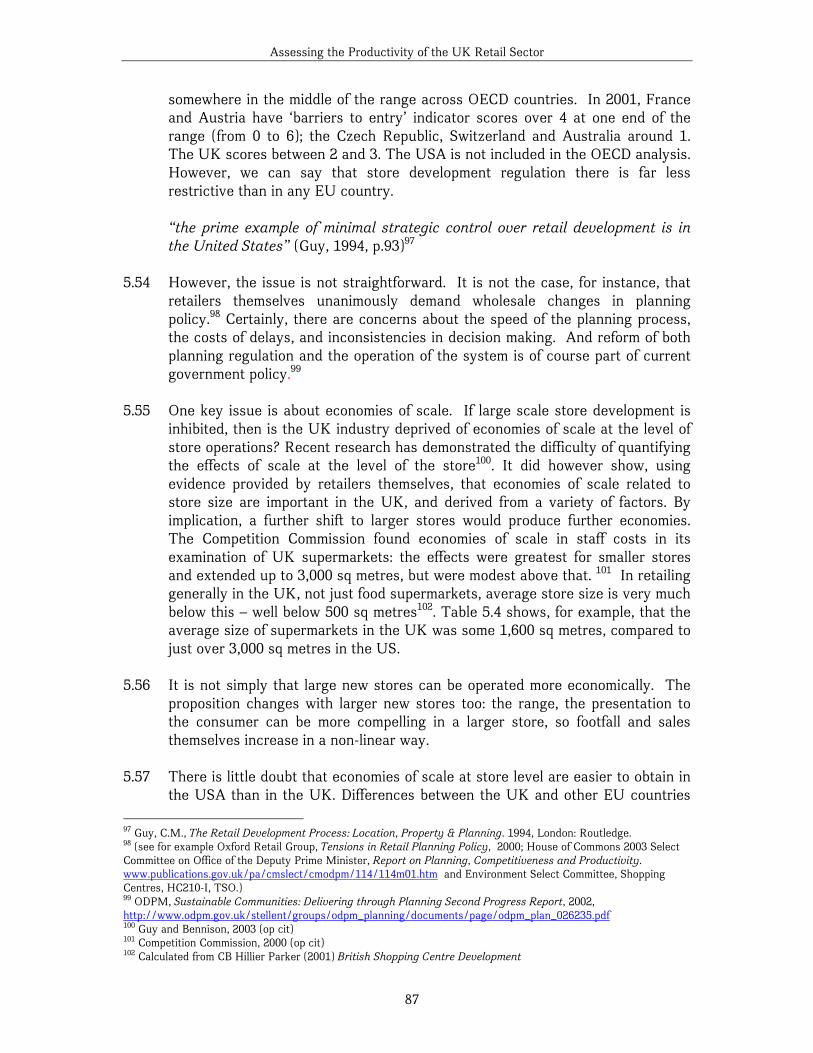
Assessing the Productivity of the UK Retail Sector
87
somewhere in the middle of the range across OECD countries. In 2001, France and Austria have ‘barriers to entry’ indicator scores over 4 at one end of the range (from 0 to 6); the Czech Republic, Switzerland and Australia around 1. The UK scores between 2 and 3. The USA is not included in the OECD analysis. However, we can say that store development regulation there is far less restrictive than in any EU country.
“the prime example of minimal strategic control over retail development is in the United States” (Guy, 1994, p.93)97
5.54 However, the issue is not straightforward. It is not the case, for instance, that
retailers themselves unanimously demand wholesale changes in planning policy.98 Certainly, there are concerns about the speed of the planning process, the costs of delays, and inconsistencies in decision making. And reform of both planning regulation and the operation of the system is of course part of current government policy.99
5.55 One key issue is about economies of scale. If large scale store development is
inhibited, then is the UK industry deprived of economies of scale at the level of store operations? Recent research has demonstrated the difficulty of quantifying the effects of scale at the level of the store100. It did however show, using evidence provided by retailers themselves, that economies of scale related to store size are important in the UK, and derived from a variety of factors. By implication, a further shift to larger stores would produce further economies. The Competition Commission found economies of scale in staff costs in its examination of UK supermarkets: the effects were greatest for smaller stores and extended up to 3,000 sq metres, but were modest above that. 101 In retailing generally in the UK, not just food supermarkets, average store size is very much below this – well below 500 sq metres102. Table 5.4 shows, for example, that the average size of supermarkets in the UK was some 1,600 sq metres, compared to just over 3,000 sq metres in the US.
5.56 It is not simply that large new stores can be operated more economically. The
proposition changes with larger new stores too: the range, the presentation to the consumer can be more compelling in a larger store, so footfall and sales themselves increase in a non-linear way.
5.57 There is little doubt that economies of scale at store level are easier to obtain in
the USA than in the UK. Differences between the UK and other EU countries 97 Guy, C.M., The Retail Development Process: Location, Property & Planning. 1994, London: Routledge. 98 (see for example Oxford Retail Group, Tensions in Retail Planning Policy, 2000; House of Commons 2003 Select Committee on Office of the Deputy Prime Minister, Report on Planning, Competitiveness and Productivity. www.publications.gov.uk/pa/cmslect/cmodpm/114/114m01.htm and Environment Select Committee, Shopping Centres, HC210-I, TSO.) 99 ODPM, Sustainable Communities: Delivering through Planning Second Progress Report, 2002, http://www.odpm.gov.uk/stellent/groups/odpm_planning/documents/page/odpm_plan_026235.pdf 100 Guy and Bennison, 2003 (op cit) 101 Competition Commission, 2000 (op cit) 102 Calculated from CB Hillier Parker (2001) British Shopping Centre Development
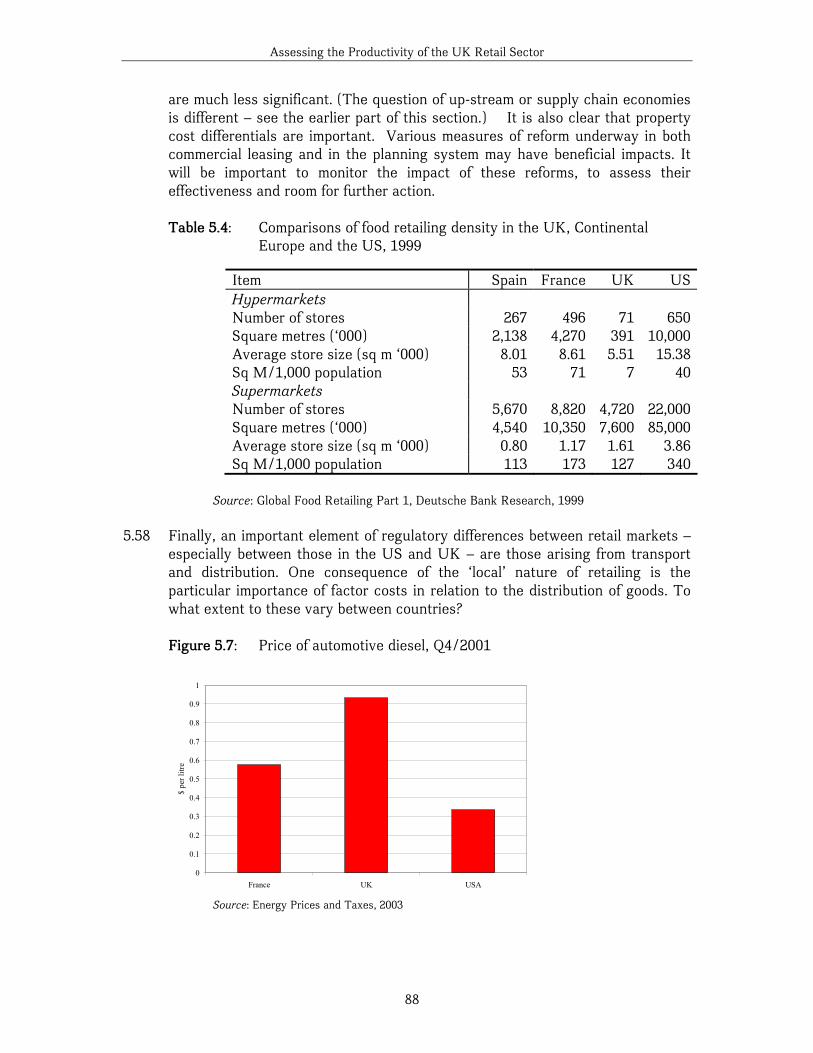
Assessing the Productivity of the UK Retail Sector
88
are much less significant. (The question of up-stream or supply chain economies is different – see the earlier part of this section.) It is also clear that property cost differentials are important. Various measures of reform underway in both commercial leasing and in the planning system may have beneficial impacts. It will be important to monitor the impact of these reforms, to assess their effectiveness and room for further action.
Table 5.4: Comparisons of food retailing density in the UK, Continental
Europe and the US, 1999
Source: Global Food Retailing Part 1, Deutsche Bank Research, 1999 5.58 Finally, an important element of regulatory differences between retail markets –
especially between those in the US and UK – are those arising from transport and distribution. One consequence of the ‘local’ nature of retailing is the particular importance of factor costs in relation to the distribution of goods. To what extent to these vary between countries?
Figure 5.7: Price of automotive diesel, Q4/2001
0
0.1
0.2
0.3
0.4
0.5
0.6
0.7
0.8
0.9
1
France UK USA
$ pe
r litr
e
Source: Energy Prices and Taxes, 2003
Item Spain France UK USHypermarkets Number of stores 267 496 71 650Square metres (‘000) 2,138 4,270 391 10,000Average store size (sq m ‘000) 8.01 8.61 5.51 15.38Sq M/1,000 population 53 71 7 40Supermarkets Number of stores 5,670 8,820 4,720 22,000Square metres (‘000) 4,540 10,350 7,600 85,000Average store size (sq m ‘000) 0.80 1.17 1.61 3.86Sq M/1,000 population 113 173 127 340
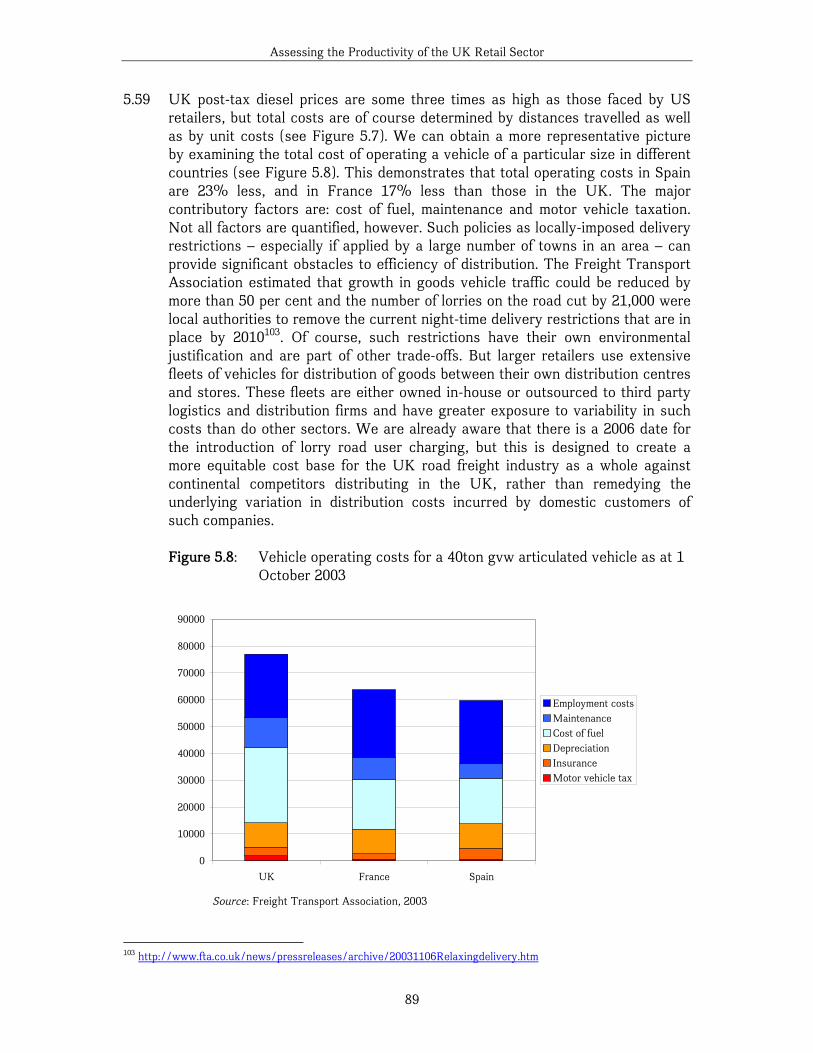
Assessing the Productivity of the UK Retail Sector
89
5.59 UK post-tax diesel prices are some three times as high as those faced by US retailers, but total costs are of course determined by distances travelled as well as by unit costs (see Figure 5.7). We can obtain a more representative picture by examining the total cost of operating a vehicle of a particular size in different countries (see Figure 5.8). This demonstrates that total operating costs in Spain are 23% less, and in France 17% less than those in the UK. The major contributory factors are: cost of fuel, maintenance and motor vehicle taxation. Not all factors are quantified, however. Such policies as locally-imposed delivery restrictions – especially if applied by a large number of towns in an area – can provide significant obstacles to efficiency of distribution. The Freight Transport Association estimated that growth in goods vehicle traffic could be reduced by more than 50 per cent and the number of lorries on the road cut by 21,000 were local authorities to remove the current night-time delivery restrictions that are in place by 2010103. Of course, such restrictions have their own environmental justification and are part of other trade-offs. But larger retailers use extensive fleets of vehicles for distribution of goods between their own distribution centres and stores. These fleets are either owned in-house or outsourced to third party logistics and distribution firms and have greater exposure to variability in such costs than do other sectors. We are already aware that there is a 2006 date for the introduction of lorry road user charging, but this is designed to create a more equitable cost base for the UK road freight industry as a whole against continental competitors distributing in the UK, rather than remedying the underlying variation in distribution costs incurred by domestic customers of such companies.
Figure 5.8: Vehicle operating costs for a 40ton gvw articulated vehicle as at 1
October 2003
0
10000
20000
30000
40000
50000
60000
70000
80000
90000
UK France Spain
Employment costsMaintenanceCost of fuelDepreciationInsuranceMotor vehicle tax
Source: Freight Transport Association, 2003
103 http://www.fta.co.uk/news/pressreleases/archive/20031106Relaxingdelivery.htm
Assessing the Productivity of the UK Retail Sector
90
5.60 We do not believe that further analysis will produce obvious recommendations for additional reforms which would improve retail productivity in the UK. The question is not a technical one about what kind of action might have an effect, but rather a policy one, about the kinds of urban and regional environment, the kinds of town and city centres, that the UK wishes to have and, as such, is beyond the remit of this report.
5.3 Concluding remarks 5.61 From the limited data that are available, we can nevertheless argue that UK
retailing has a significantly different structure and operating environment from other countries (specifically from that in the US and France). The most important characteristics are in terms of:
o Differential positioning (leading to a greater focus in the UK upon non-measured, non-price outputs)
o Corporate structure (large/small companies; concentration)
o Different emphasis and focus to business processes (the example of ICT development and implementation)
o Store sizes (fewer large stores leading to fewer economies of scale compared to the US)
o Enduring higher costs in property; differential treatment of property costs in company accounts (the natural scarcity of land, the historically high price of all property; the retail specific factor of trading within the existing urban fabric; leading to less opportunity to develop new/free standing development, for physical, cultural and institutional reasons)
o Higher costs of transport and logistics (within a congested UK urban/transport infrastructure)
o Higher costs of employment compared to the US (but not to France)
5.62 This structure and operating environment exists, and persists, for various
reasons. These include the different preferences expressed by consumers; the differential evolution of retail businesses; and, of course, the differential effects of regulation.
5.63 The combination of all these factors imposes costs on retailers, particularly
those relating to land and property that may not be incurred in other countries. It explains, at least in part, the rather different business models that UK retailers tend to operate compared with US or French firms. Such business models, with relatively high costs and a focus on high value products and services must be taken into account in assessing efficiency.
Assessing the Productivity of the UK Retail Sector
91
6.0 Areas for Action 6.1 Whether or not retailing in the UK is less productive in labour or total factor
terms than that in other countries it is difficult to draw policy recommendations from looking at sector productivity statistics alone. We think there is an important distinction to be drawn here between "contribution" and "causality". It is a fact that labour productivity in the UK is relatively low. It is also a fact that retail is one of the main users of labour in the UK. Therefore it follows that retail may well exhibit low labour productivity and could be expected to contribute relatively heavily to the UK's overall low labour productivity. The word "contribution" might be correct. However, there is nothing necessarily causal implied. That is, there is no reason to believe that the policy implication (if it exists) lies in retail. The policy implication might lie in the wider labour market. Simply because retailing uses a lot of labour that it looks less productive than other sectors, it by no means follows that retail is making less valuable use of each element of labour than any other business.
6.2 However, such assertions are not grounds for complacency. Even the most
successful of the leading players are continually striving for ways to become more efficient within the context of their customer offer and the competitive and regulatory environments. If any problem lies in the ‘tail’ of smaller and medium-sized companies then this, too, is of interest.
6.1 Regulatory issues 6.3 Our conclusion here is best expressed in terms of ‘the price we pay’ for the
structure and environment we have. Section Five of our report spelled out in detail some of the potential consequences for productivity of the differential environments within which retailing trades around the world. For example, we observed the lack of progress over the years in reforming the UK retail leasing system – it actually suits many players, and major change might undermine some fundamental workings of the UK investment market. We also noted the effects of barriers to entry/exit to/from UK retailing: it has costs, but also benefits in serving the planning and environmental aims of local, regional and central government (as likely to be expressed for example in the forthcoming PPS6).
6.4 Our work has moved beyond the simplistic idea that regulation is a brake on
retail productivity, to recognition that a complex mix of urban characteristics, consumer preferences and competitive rivalries, influence the structure and performance of retailing. Further, this project has not involved a detailed micro level analysis of the efficiency and effectiveness of the operation of the myriad of regulations which affect retailers. (Other sub-groups within the RSG are investigating issues such as costs of compliance.) We therefore cannot recommend, as some sort of technical output of our analysis, a different
Assessing the Productivity of the UK Retail Sector
92
structure of regulation. To do so would be to enter upon broad social policy issues which go beyond our brief. (To do so, for example, might lead us to propose that consumers would prefer a different set of retail outputs - not simply ‘more’ retail output. Or that it would be desirable to limit the hours of opening of retail stores to encourage shoppers to shop more efficiently.) This study is already sufficiently far-ranging.
6.2 Recommendations 6.5 Our recommendations derive from all three parts of our study: the aggregate
economic investigation, the firm level analysis, and the retailer interviews. All of our recommendations are to government. Larger retailers may read this report and be encouraged by its publication or by government to take various actions. Large scale retailers in the UK include many regarded as world-class by their peers. That is not to say that improvements in performance are not possible: far from it; and we have already discussed a number of areas where well-regarded retailers from the US see opportunities for improvement – for example in the area of the monitoring of the utilisation of labour. Large firms have the resources to monitor many aspects of internal performance, to benchmark against relevant competitors, and to search for new ideas.
6.6 Likewise, it is in our opinion futile to make recommendations directly to smaller
retailers – this report is not the right way to reach them. Recommendations for the retail SME sector have often assumed that smaller and independent retailers are eager consumers of information and advice from the government and education sectors. Recent research has shown that this is not always the case. Firstly, many of those running small retail businesses have done so for lifestyle rather than purely commercial reasons; secondly, with the focus on the immediate needs of their businesses, such firms see government attempts to help as “too structured, bureaucratic or time-consuming”. The kinds of communication used can also be seen as inappropriate and remote to small businesses. Therefore, our recommendations are to government about what might be realistically achieved for small retailers, and government needs to find a way to communicate this appropriately.
6.7 For each of our areas for action, we try to consider a range of the benefits that
we expect to accrue to stakeholders from the action, as well as outlining the kinds of challenges that might be experienced in any implementation, where appropriate. However, at this stage, we do not make any detailed assessment of the likely costs of implementation. The consultation process on this report will likely pick up many of these issues.
6.8. Our recommendations to government fall into five broad categories:
• Improving data standards, data collection and data release
• Developing new and useful measures of performance
Assessing the Productivity of the UK Retail Sector
93
• Driving performance by encouraging benchmarking
• Initiatives concerned with the performance of smaller retailers
• Skills and training considerations
6.8.1. Improving data standards / data collection / data release
The single most important recommendation is to improve data collection on and analysis of the retail industry. Our research has raised questions about the aggregate statistics we have about the industry’s performance. It has also shown that different kinds of information would be more helpful in understanding the industry and improve the dialogue between government and retailers. Far less effort is given by national statistics agencies to data collection and analysis of the service industries generally than to the much smaller manufacturing sector. Within services, UK retailing – with one or two exceptions - has suffered long term degradation in the coverage and insight of available official data. Compare today’s ONS offering with earlier offerings of the now defunct SDA25 Retailing Inquiry or the thirty-year dead Census of Distribution. The UK has no Census of Retailing to match the five-yearly Economic Census in the US, for example, which surveys all retail firms with more than one outlet. Official UK data on retailing should be benchmarked more consistently and frequently against the sources and methods used on an international basis. We are aware of international workshops on firm-level data and on productivity statistics generally, but nothing dealing explicitly with services, or retailing:
“For such a crucial sector of the economy, detailed mapping of the sector is .. far from easy… ONS should undertake an urgent review of the quality and quantity of retail data produced officially”104
Indeed, our international analysis of retailing has been hampered by the lack of comparable structural data from the UK. UK data is noticeable by its almost entire absence from an otherwise authoritative guide to the European distributive trades by Eurostat105. This imbalance should be redressed.
The heterogeneity of retail output, and the variety of ways it is generated, pose significant challenges of both definition and measurement. Problems of measuring output are added to by difficulties of defining and measuring the inputs that generate that retail output. This is true whether the focus is on the labour productivity of the retail trades overall or on the wider measure of productivity known as Total Factor Productivity (TFP), that accounts for capital, land and organisational inputs into retail output as well as labour. These difficulties of measuring retail sector productivity are spelled out in some detail in section 3. This section concludes that there are major
104 Institute for Retail Studies, Competitive Analysis of the Retail Sector in the UK. 2003, University of Stirling: Stirling. 105 Hubertus, J., Distributive Trade Statistics. 2002, Eurostat: Brussels.
Assessing the Productivity of the UK Retail Sector
94
reservations about the validity of aggregate economic analysis of retail productivity and the conclusions that might be drawn from this. It is clear that the results of any cross country comparison of retail sector productivity need to be treated with care.
This in turn, raises a fundamental issue: retailing is undoubtedly a major sector of the UK economy, yet its overall relative productivity is clearly open to question. There is uncertainty especially about the significance of the non-labour factors' contributions to the generation of retail output. In particular, more attention might, for example, be given to the relevance of differences in supply of land and associated marked variations in retail occupancy costs across countries, and to the importance of capital investment. Redressing this involves:
- The recognition (by both government and retailers) of the limitations of
aggregate economic analysis of retail productivity
- Undertaking detailed research into how far the observed gap in the retail sector's labour productivity is due to kinds of measurement problems set out in this report and how far it reflects genuine inefficiencies in the UK retail trades.
Whether we like it or not, macro-economic approaches to measuring productivity reflect the dominant analytical paradigm, informing policy and debate in government. But we have demonstrated that measurement issues in relation to services and retailing in particular complicate the analysis of productivity growth of this sector at the international level. One of our recommendations, therefore, is that work should continue better to understand the issues involved in international comparisons of aggregate measures of retail productivity, but that this should be in the context that whilst labour productivity is a reasonable indicator of national performance, it is a very poor measure of sector performance, particularly of retailing. Labour measures of productivity are likely to be highly misleading unless seen in the wider context of total factor productivity and national environments. This view is shared outside the UK: “A need continues to exist for further scrutiny of the procedures for measuring price, output and quality trends in ever-changing industries in both the service and technology sectors”106 The bibliography attached to this report demonstrates some forty years of academic debate over some of the issues we have discussed. Recent developments – such as the ICT ‘productivity paradox’ - have served to add fuel to the fire.
106 Gullickson, W. and M.J. Harper, ‘Bias in aggregate productivity trends revisited’. Monthly Labor Review, 2002(March): p. 32-40.
Assessing the Productivity of the UK Retail Sector
95
- The extension of firm level analyses in retailing by National Statistics and at the national level by OECD
It is also clear, however, that more useful insights are to be gained by examining efficiency and performance at the firm level, most immediately through more extensive analysis of the Annual Respondents Database (ARD), which we feel has been under-utilised. We therefore recommend further extension of the analyses of establishment and firm performance at the micro level from the manufacturing sector to retailing. There is considerable scope. In their recent preliminary analysis of retail productivity in the UK, Haskel & Khawaja comment: “we are not aware of any micro level studies of the entire sector before”107 This seems remarkable to us, given the recent growth in interest in retail productivity at the policy level. The benefits of additional analysis could be to add considerably to our knowledge of where any gaps in productivity might fall, but we must also recognise some of the difficulties of working with this data, not least because it is derived from several sources. There are three of particular note:
o Not all IDBR data is from local units or shops, but from reporting units.
o Turnover and employment is differentially reported by ABI and IDBR’s sources; in addition the reporting of ABI employee data in December - not an appropriate point for measuring retail employment - and the lack of a full-time/part-time split, fails fully to reflect the changing employment structure of the sector. And
o Some small firms on the IDBR do not have business structure coding. By comparison, to take one example, the US Economic Census for 2002 asked its questions of retailers for the first quarter of 2002 (rather than during the busiest trading quarter of the year), requested data on leased employees (an important consideration in productivity calculations for large firms which outsource elements of their employment) and requested turnover data separately on e-commerce sales (recognising the blurring effect of channel mix).108 The census also seeks to understand establishment activities in more detail (examining where warehousing and consulting takes place, for example). - More integration and harmonisation of existing official and unofficial data
sources relevant to retailing.
107 Haskel, J. and N. Khawaja, Productivity in UK Retailing: Evidence from Micro Data. 2003, Working Paper, CeRiBA: London. 108 See, for example, http://help.econ.census.gov/2002forms/rt44802.pdf
Assessing the Productivity of the UK Retail Sector
96
There is already some evidence that, working within resource and data availability constraints, government departments and agencies have been able to make more out of what data is available through judicious integration exercises. ARD is one such initiative. In relation to retailing in particular, we also applaud the long-running project by ODPM to harmonise town centre statistics for policy purposes in which retailing figures as a major space user. The main aim of this work is to provide accurate retail information for planners, retailers and local authorities regarding employment and floorspace in town centre areas. The main information requirements were for data on floorspace, employment and turnover of retail outlets for town and other shopping centres. Following a pilot study in London, boundaries and statistics for Areas of Town Centre Activity for England and Wales will be produced later in 2004.109 But this study will have taken eight years to come to fruition and is a reflection both of the difficulty of the task and the lack of priority accorded to it. It also only reflects the current policy concerns of government in relation to spatial aspects of retailing, rather than seeking explicitly to measure the sector as a whole, or in part. We wonder where else there is scope within the official data environment for ‘making more with less’. But we think it important that ODPM should continue to work with ONS and retailers on collecting the required retail data at store level, in order to provide more accurate information on retail activity through ODPM's town centre statistics project.
Outwith the official sphere, there is certainly the scope for government sponsorship or endorsement of unofficial sources of data relevant to retail performance. Confidence indicators, pedestrian footfall and traffic information might be examples of this. Whilst there is also probably scope for government to take a view on the merits of different indicators of financial or business performance used by the retail sector to benchmark its own performance, we do not think that this would necessarily be welcomed by the sector.
- Further work towards the development of more meaningful statistical
disaggregation of the retail industry.
“Establishing classifications and developing concepts of output for retail and wholesale trade pose many difficulties.” 110 Standard industrial classification is not sufficiently discriminating as a way of defining critical differences among types of retailers. Paradoxically, this is partly because of the increasing need for such classifications to be upwardly and internationally compatible with standards such as NACE and the UN’s ISIC, which need to be capable of application to a wide range of economies. The necessary compromises can even affect apparently similar regions. This is not a domestic problem. For example, the development of NAICS111 in the mid 1990s in respect of retailing had to note that:
109 http://www.odpm.gov.uk/stellent/groups/odpm_planning/documents/page/odpm_plan_607875.hcsp 110 Economic Classification Policy Committee, Services Classifications. 1994, U.S. Department of Commerce, Bureau of Economic Analysis: Washington, DC. 111 North American Industrial Classification System
Assessing the Productivity of the UK Retail Sector
97
“in the cases of the Retail Trade sector and the Wholesale Trade sector, the three statistical agencies [Canada, Mexico and the US] have agreed that only the boundaries of the sectors will be made comparable internationally at the present time”112 This in itself was a step forward, since previously the three countries had different and inconsistent boundaries between retail trade and manufacturing and between parts of the distributive trades, let alone its detailed composition. But lack of resources and other priorities have prevented further harmonization. Developments in the business of retailing, in the UK and indeed in other countries, include strong trends towards different retail formats and propositions, where old product–format links have been superceded. In particular there are a variety of different large scale specialists (such as ‘category killers’) and a variety of large scale ‘non-specialised’ formats, (such as general merchandisers). Both consumers and retailers differentiate kinds of retailing as much by format as by product. Consequently, whilst the ABI provides a cross-classification of SIC against product, this may not go far enough in representing the ways in which retailers and consumers characterise the industry. “Official data essentially follow a ‘line of trade’ typology, and this approach pervades most of the reviews of the sector produced by consultancy and market research agencies. Although driven by the confines of data collection and presentation, any analysis of the sector should recognise that there is now a fundamental blurring of the ‘retail sector’ in both horizontal (e.g. product line) and vertical (e.g. channel activity) dimensions.”113
- Exploring the potential for developing shared integrated efficiency and
performance metrics capable of effective communication (accounting standards, as it were)
Whilst, as we have said, these recommendations are for government, it is the case that our research has revealed some significant commonalities of approach by leading retailers in the UK and US in relation to efficiency and performance metrics, but different accounting standards provide barriers to comparability. If retailers feel that their comparative productivity merits are being undersold internationally by government, based on conclusions from aggregate economic approaches to productivity, perhaps there is merit in seeking jointly to produce a set of aggregate metrics which might allow more effective comparisons to be made. We note that international comparative analysis based on corporate data is equally fraught, however:
112 NAICS Committee, Proposed New Industry Structure for Retail Trade and Wholesale Trade. 1995, US Department of Commerce. 113 Institute for Retail Studies, (op cit)
Assessing the Productivity of the UK Retail Sector
98
“The only area we can compare across countries with total confidence is in the checkout operation. The operation is almost identical across countries apart from fiscal differences that make the transaction time differ depending on the process in place.” (International retailer) If there are any grounds for developing comparable indicators, this will involve industry bodies, accounting standards bodies, and retailers.
6.8.2 Developing new and useful measures of performance
- The evaluation of efficiency and performance measures used by US retailers within the UK
Our interviews with a selection of US retailers convinced us that some of the leading businesses have an extraordinarily rigorous and wide-ranging enterprise performance philosophy, certainly on a par with the best of UK retailing, but many of these (such as the capital productivity measure EVA) are linked to the differential expectations of investors in the US as against the UK: “Our stock market is definitely different from the UK’s. Our market primarily looks at growth and utilisation of capital. The UK’s market fundamentally looks at operating margins, with much less emphasis on growth.” (US retailer)
Metrics are promulgated accordingly. Nevertheless, it appears to us that there is scope for consideration of measures like gross margin return on labour, return on inventory and return on advertising, where US retailers feel there is scope for improvement in the UK. And in the area of labour productivity, our anecdotal conclusion is that US retailers have taken a more technocratic approach to the management of labour:
“to achieve labor efficiency goals, a labor management system is essential. Properly installed, this software takes a monthly sales projection with other inputs – employee availability, employee wages, weekly sales weights, sales by day, hour and department, among other inputs – and outputs a working schedule for every employee at every shift that optimally matches store labor to customer traffic, while precisely meeting your labor budget.” (US retailer)
- The development of an integrated consumer satisfaction measure (as is available
in the US – ACSI – and Germany). One area where retailers struggle and balanced scorecards can founder, is to do with measuring customer satisfaction. A UK equivalent to the American Customer Service Index is an attractive idea. Retailers, government, industry bodies and academia would need to come together to design, fund and establish it. Two advantages accrue to the development of such a measure: it provides an estimate of the service and satisfaction outputs which are not otherwise
Assessing the Productivity of the UK Retail Sector
99
captured in the traditional measures; and it would not represent a further burden to business, since it requires no reporting by retailers.
6.8.3. Driving performance by encouraging benchmarking and promoting standards
- Larger/all retailers can use better (broader and more universal) customer satisfaction measures. Some retailers use them, but the individual investment to gain enough good information is large: pooled resources to help fund a gold standard ACSI type survey would allow more effective use of resources. Performance benchmarking (which in turn drives performance improvement) in this area should be encouraged.
- Develop mechanisms for benchmarking retail ICT investments
Our discussion in sections 2 and 5 demonstrate that certain US retailers’ ability to release the value of ICT investments more quickly and to a greater degree than some UK retailers. This might explain some of the productivity differences not accounted for by difficulties with the aggregate estimates. (And seems to be a difficulty affecting not just some UK retail firms but service firms in the public and private sectors as a whole)114 The evidence that is available suggests that not all UK retailers have been able to assimilate and operationalise the benefits of ICT investment. The emergence of new means of improving process efficiency, such as RFID, also provides scope for government to promote tagging standards and any supporting infrastructure
6.8.4. Initiatives concerned with performance of smaller retailers
Although our report had little specifically to say about smaller retailers in the context of productivity, this omission was not deliberate. The timescale in which the research was conducted, and the paucity of reliable data on such businesses, worked against the development of any robust analysis. Nevertheless, the firm-level analysis in Section 3.3 did allude (however ambiguously) to size-related differences in labour productivity; and our discussion of structural differences in retailing between countries in Section 5.1.1 summarised a set of particular efficiency- and performance-related issues shared by the sector. Our recommendations are cast with these comments in mind:
- Small retailers lack useful data for benchmarking.
A particular problem for smaller retailers is lack of appropriate benchmarking information. One way larger retailers drive performance improvements in their businesses is by internal comparison. IT–enabled performance management has made a huge impact on some firms. When data can be collected, analysed and
114 Sauer, C. and Cuthbertson, C. (2003) The State of IT Project Management in the UK 2002 - 2003. Computer Weekly Website, Oxford: Templeton College.
Assessing the Productivity of the UK Retail Sector
100
distributed showing performance store by store, product by product, hour or day by day, a firm has a powerful performance improvement weapon. Small firms may lack the IT capacity, but also of course simply do not have the internal comparators. They arguably have more need of external benchmarks. Virtually none are available. It is little use to a small retailer to know the sales per square metre of Tesco or Next. We recommend the development of a small number of efficiency metrics of relevance to smaller retailers. Evidence from this and earlier studies suggests that these measures should be few and straightforward, centring upon financial performance.
- The extension of local information release from national bodies.
National level sales and confidence information (e.g. the CBI Monitor, the BRC sales monitor) have limited use for smaller retailers. Local barometers would be more meaningful. Some managed shopping centres demonstrate good practice in this, issuing daily or weekly footfall measures and sometimes sales measures, against which individual enterprises can assess performance. Town centres rarely do such things (of course lacking the landlord tenant relationship). TCMs (town centre managers) are appearing in greater numbers, and best practice in some towns includes the collection and distribution of useful performance related information. Footfall and traffic information is the most readily obtainable. We believe that the benefits of this kind of ‘soft’ co-ordination and integration could be considerable. There could be useful ‘spin-offs’ in this direction from the implementation of the Areas of Town Centre Activities project, discussed earlier. - Bring benefits of appropriate systems and processes available to larger
retailers to smaller enterprises. From our research, making and recouping investment in ICT appears to be a differentiating factor in whether or not productivity growth can be accelerated in retailing. The benefits of investment in appropriate ICT systems and processes rarely trickle down to smaller retail firms. One example of this might be ECR (see para 5.20). ECR UK is currently managed by the IGD, with support from e-centre (formerly ANA). A specific small firm initiative might be encouraged. ECR Europe plans a project on SMEs, managed by ECR Greece. A specific UK project however should be considered. We recommend consultation with IGD.
We are conscious of not wishing to increase the burden of government on smaller retailers. This is not solely a retail preoccupation, but as so many small businesses are retail ones, this is significant. We have not investigated this specifically in our research. An anecdotal estimate of the cost of bureaucracy for independent retailers is some £23mn per annum, or the equivalent of £10 per week per store115. We know that Government is already working to reduce the
115 According to Independent Retail News magazine.
Assessing the Productivity of the UK Retail Sector
101
burden and we also know that recommendations for more data collection and analysis must not conflict with reducing costs of compliance for small retail businesses.
6.8.5. Skills and training
A recent report116 focused on skills in food retailing, noted that the industry has long had an image problem and is not seen as ‘first choice’ of employer by many. The ‘image’ problem is well known and indeed is a problem shared with our comparator countries. We have seen no evidence that the UK is particularly better or worse off than other developed countries in this respect, although the skills of entry level staff continues to cause concern. It is clear that ‘people issues’ are a constraint on improving performance in UK retailing. Our interview respondents emphasised this quite consistently. They also pointed out how much performance at store level can be affected by store management.
“We consistently find that the better-run stores are the ones that generate better margins and better customer satisfaction.” (UK non-food retailer)
Our study has not investigated the human resource policies, training activities or recruitment carried out by retailers, other than in the context of labour costs in Section 5.2.1, or the skills levels of employees. Nonetheless retailers will find it more difficult than it need be to implement best practice – whether from outside the UK or not – if inhibited in their ability to attract good people, or if their investment in training is insufficient. We note the finding in the Berger report that food retailers across Europe are failing to adopt best practice HR strategies and processes. Skillsmart was set up by the British Retail Consortium in 2002 as one of five pilot sector Skills Councils to replace national training organisations. It has made progress in its first year of operation but clearly has much to do.117 The work being done by this organisation should be further supported and encouraged. In particular, we note its recent trialling of People Data Benchmarking118, which includes data on employee effectiveness. It seems to us that greater insight into the international comparability of retail labour skills and training might be productive:
We therefore recommend:
- That an industry body investigate training for retail management
internationally, especially in the US: kinds, courses and amounts.
Our interviewees noted that training and development is more formal in France and Germany (although this may not equate to higher quality) We believe that relatively more retail-focused higher and further education courses are available
116 Coca-Cola Retailing Research Group Europe, A Leadership People Strategy for Food Retailers, 2003, Roland Berger 117 http://www.skillsmart.com/uploads/Annual%20Report.pdf 118 http://www.skillsmart.com/uploads/People%20Data%20Benchmarking.pdf

Assessing the Productivity of the UK Retail Sector
102
in the USA than in the UK and anecdotal evidence suggests that the leading US retailers spend more on development programmes for staff and managers than the UK. The situation should be investigated. We would expect that the largest retailers are able to organise and provide sophisticated training of their own at all levels. It is the medium size and small firms which have least available to them.
Assessing the Productivity of the UK Retail Sector
103
Annexe 1: Collaborating individuals and organisations We are grateful to the following individuals and organisations in particular for their support and involvement in this study Argos Asda Group plc British Retail Consortium British Shops & Stores Association Centre for Research into Business Activity Deutsche Bank Dixons Group plc Eurohandelsinstitut HEC Kingfisher Marks and Spencer MFI Furniture Morrisons National Statistics Office New Look Next OECD Oxford, Swindon and Gloucester Co-operative Society Retail International Leaders’ Association member companies Safeway Sainsbury Selfridges Ted Baker Tesco Waitrose WHSmith Wilkinson
Assessing the Productivity of the UK Retail Sector
104
Annexe 2: Additional commentary on aspects of aggregate economic analysis of retail productivity The mathematical specification of the production function Much of the work on TFP assumes a particular kind of production function. For example, O’Mahoney and de Boer (ref 7) use what is known as the Cobb-Douglas production function: Q = keβtLαK1-α (2) This relationship can be transformed very simply to give equation (1). This particular formulation is widely used in economics, but it is not at all clear that output at the aggregate level is actually described by this relationship. In principle, the production technology of a particular economic unit, whether a firm or an industry, at any given time can be described. This would tell us the maximum output which could be produced with different combinations of inputs. But such a task would involve an immense amount of detail. Economic theory needs to make absolutely dramatic simplifications in order to be able to carry out tractable analysis, and (2) is one such simplification. Simplification itself is not necessarily a problem. All theories are approximations to reality. The question is whether this is a good one. The three most important points with (2) in this context are probably as follows. First, each individual input operates under diminishing returns. In other words, each additional per cent of labour or capital which is inputted leads to a less than one per cent increase in output. More importantly, the effect of increasing both capital and labour by one unit is to increase output by just one unit. The specification of (2) excludes the possibility of economies of scope or scale. If both are operating optimally, the only difference between, say, Tesco and the corner shop is that the former uses more capital and labour. Tesco is simply a scaled up version of the corner shop, and derives no benefits purely from being large. Second, (2) describes the macro-relationship but tells us nothing about the micro-relationships which obtain at the firm level. If each individual firm, say, operates according to (2), then it is easy to show that (2) will not describe the aggregate production function119. Third, it is often claimed that (2) fits the aggregate data reasonably well. But it is not clear what such a fit shows. As long as factor shares are reasonably constant, for example, - which is the case – an aggregate Cobb-Douglas production function will fit
119 for example, P.Ormerod ‘The short-run demand for and supply of labour in the UK’, thesis presented for the degree of M.Phil in the University of Oxford, 1973
Assessing the Productivity of the UK Retail Sector
105
the data well even though the underlying technical relationships are not consistent with the existence of any aggregate production function120. Further, if the growth of output, capital and labour all follow approximately exponential trends over time, the exponents on L and K in (2) can be interpreted as the outcome of the differential growth rates in Q, L, and K instead of the elasticities of output with respect to the inputs.121 The assumption that all factors in the production process are paid their marginal product This topic was a matter of fierce debate in economic theory in the 1950s and 1960s122. The relevant point here is that the debate ended with theoretical agreement. The exponents on L and K in (2) cannot be assumed to reflect the marginal products of capital and labour. In practice, it may well be that relative scarcities are the empirically dominant determinant of relative prices123. But the theoretical result means that there is uncertainty about the value of α which is used in (1) The scientific validity of the theory of economic growth which underpins growth accounting This is a very substantial topic in its own right, and it is not within the scope of this project to enter into details. Even within the conventional neo-classical framework, for example, there are two rival accounts. First, the theory which underpins (1) and has the production function described by (2). Second, the so-called ‘post-neoclassical endogenous’ growth theory124. This retains the same functional form of the production function, with the important addition that economies of scale are postulated which are external to the process of production within the firm itself. The empirical identification of such externalities has proved problematic, and it is not clear that this more modern version of the standard neo-classical growth model offers a more satisfactory account of growth than the simpler, original version. A major empirical problem for the model is its implication that output per head converges across countries in the long-run. This has so obviously not happened at all, that the concept of conditional convergence has been developed. According to this extension of the theory, growth in output per worker depends not just on capital per worker and technology, but on a wide range of factors such as the political and cultural
120 F Fisher, ‘Aggregate production functions and the explanation of wages: a simulation experiment’, Review of Economics and Statistics, 53, 305-325, 1971 121 P. Ormerod, (op cit) 122 key references are P. Sraffa, The production of commodities by means of commodities, Cambridge University Press, 1960, P.A. Samuelson, ‘Parable and realism in capital theory: the surrogate production function’, Review of Economic Studies, 29, 193-206, 1962 , P.A. Samuelson, ‘A summing up’, Quarterly Journal of Economics, 80, 568-583, 1966 123 referred to as the ‘93% scarcity value theory’ in A.J. Cohen, ‘Samuelson and the 93% scarcity theory of value’, in The Dynamics of the Wealth of Nations: Essays in Honour of Luigi Pasinetti, M Baranzini and GC Harcourt, eds., Macmillan, 1993 124 see, for example, N.G.Mankiw, D.Romer and D.N.Weil,, ‘A Contribution to the Empirics of Economic Growth’, Quarterly Journal of Economics, 408-437, 1992
Assessing the Productivity of the UK Retail Sector
106
system in which the economy operates. This concept implies that convergence will take place within countries which have similar political and cultural backgrounds, but not necessarily otherwise125. However, even across the individual states of the United States, convergence in per capita income has by no means been complete and substantial inter-state differences exist and persist126. There are other points which can be made on this topic, but the relevant point to demonstrate here is precisely that the scientific validity of the theory is by no means assured. Indeed, a sceptic can find much evidence in the literature which suggests that the theory is rejected empirically.
125 see, for example, R.E.Hall and C.I.Jones, ‘Why do some countries produce so much more output per worker than others?’, Quarterly Journal of Economics, 83-116, 1999 126 G. Andrew Bernat, ‘Convergence in state per capita income’, Survey of Current Business, June, 36-48, 2001 and F Caselli and W J Coleman II, ‘The US structural transformation and regional convergence: a reinterpretation’, Journal of Political Economy, 109, 584-616, 2001
Assessing the Productivity of the UK Retail Sector
107
Annexe 3: Retail Productivity: a bibliography 1. Achabal, D.D. and S.H. McIntyre, Guest Editorial: Information Technology is Reshaping
Retailing., in Journal of Retailing. 1987, Elsevier Science Publishing Company, Inc. p. 321.
2. Achabal, D.D., S.H. McIntyre, and J.M. Heineke, Issues and Perspectives on Retail Productivity. Journal of Retailing, 1984. 60(3): p. 107-127.
3. Achabal, D.D., S.H. McIntyre, and J.M. Heineke, Comment: Productivity Measurement and the Output of Retailing. Journal of Retailing, 1985. 61(3): p. 83-88.
4. Alderson, W., A FORMULA FOR MEASURING PRODUCTIVITY IN DISTRIBUTION., in Journal of Marketing. 1948, American Marketing Association. p. 442.
5. Anderson, J., Boom or Bust, Productivity Is King., in Chain Store Age. 2001, Lebhar - Friedman Inc. p. 76.
6. Anon, Food Retailing., in McKinsey Quarterly. 1998, McKinsey & Company, Inc. p. 54.
7. Anon, Faster retail productivity growth in second half of 1990s. Monthly Labor Review, 2002.
8. Anon, Managing the Store-Development Process., in Chain Store Age. 2002, Lebhar - Friedman Inc. p. 2B.
9. Anon, The new "new economy" - American productivity - America's extraordinary gains in productivity. The Economist, 2003(13 September).
10. Anwar, S.T. and M.A. Taku, Productivity and efficiency in the Japanese distribution system., in Journal of World Trade. 1993, Aspen Publishers Inc. p. 83.
11. Arndt, J. and L. Olsen, A Research Note on Economies of Scale in Retailing. Swedish Journal of Economics, 1975: p. 207-221.
12. Athanassopoulos, A.D., Optimization models for assessing marketing efficiency in multi-branch organizations., in International Review of Retail, Distribution & Consumer Research. 1998, Routledge, Ltd.
13. Ballow, J.J., R.J. Thomas, and G. Roos, Future value: the $7 trillion challenge. Outlook: the journal of high-performance business, 2004(1).
14. Barcet, A., The Development of Tertiary Services in the Economy, Labour Market and Employment., in Service Industries Journal. 1988, Frank Cass & Company Ltd. p. 39.
15. Baret, C., J. Gadrey, and C. Gallouj, France, Germany, Great Britain: The Organization of Working Time in Large Retail Food Stores., in European Journal of Industrial Relations. 1999, Sage Publications, Ltd. p. 27.
16. Barnes, M. The Sources of Productivity Growth: Micro-level Evidence for the OECD. in ONS/DTI Productivity Workshop. 2002.
17. Barnes, M. Manufacturing and Services in the UK: How do they compare? in ONS/DTI Productivity Workshop. 2002.
18. Basu, S., et al., The Case of the Missing Productivty Growth: Or, Does Information Technology Explain why Productivity Accelerated in the US but not the UK? NBER Working Paper No. w10010, 2003.
19. Bell, R.C., Food Retailing in France. European Retail Digest, 2001(30): p. 27.
20. Bernadet, S., et al., Le Commerce en 2002. INSEE Premiere, 2003. 897.
21. Berry, J.-B., Hypermarches et grand commerce specialise: seduire et fideliser sa clientele par l'innovation. INSEE Premiere, 2003. 891.
22. Biscourp, P., et al., Les entreprises et la baisse du prix des ordinateurs. Economie et Statistique, 2002. 355-356: p. 3-20.
Assessing the Productivity of the UK Retail Sector
108
23. Blanchard, O. Comments on "The case of missing productivity growth; or, why has productivity accelerated in the United States but not the United Kingdom" by Basu et al. in NBER Macroeconomics Conference. 2003.
24. Bonamy, J. and N. May, Service and employment relationships., in Service Industries Journal. 1997, Frank Cass & Company Ltd. p. 544.
25. Boylaud, O., Regulatory Reform in Road Freight and Retail Distribution. 2000, OECD.
26. Boylaud, O. and G. Nicoletti, Regulatory Reform in Retail Distribution. OECD Economic Studies, 2001. 32: p. 253-274.
27. British Property Federation and I.o.P. Developers, Annual Lease Review. 2003.
28. Broadbridge, A., Retail managers: their work stressors and coping strategies., in Journal of Retailing & Consumer Services. 2002. p. 173.
29. Broersma, L., R.H. McGuckin, and M.P. Timmer, THE IMPACT OF COMPUTERS ON PRODUCTIVITY IN THE TRADE SECTOR: EXPLORATIONS WITH DUTCH MICRODATA., in De Economist (Kluwer). 2003. p. 53.
30. Brown, S., Retail classification: a theoretical note. Quarterly Review of Marketing, 1986(Winter): p. 12-16.
31. Bruce, G.D. and C.M. Bonjean, Self-Actualization Among Retail Sales Personnel., in Journal of Retailing. 1969, Elsevier Science Publishing Company, Inc. p. 73.
32. Brynjolfsson, E.H., Lorin M. Shinkyu Yang, Intangible Assets: Computers and Organizational Capital., in Brookings Papers on Economic Activity. 2002, Brookings Institution Press. p. 137.
33. Bucklin, L.P., BUYING PRODUCTIVITY, ORGANIZATION STRUCTURE, AND MIS TECHNOLOGY IN GENERAL MERCHANDISE STORES., in Research in Marketing. 1986. p. 273.
34. Bultez, A. and L. Parsons, Channel productivity: in the small and in the large., in International Journal of Research in Marketing. 1998. p. 383.
35. Burnham, E.A., THE INFLUENCE OF SIZE OF BUSINESS ON DEPARTMENT STORE OPERATING RESULTS., in Harvard Business Review. 1938, Harvard Business School Publication Corp. p. 211.
36. Burnham, E.A., EMPLOYEE PRODUCTIVITY IN DEPARTMENT STORES., in Harvard Business Review. 1949, Harvard Business School Publication Corp. p. 480.
37. Burt, S. and L. Sparks, Structural change in grocery retailing in Great Britain: a discount reorientation?, in International Review of Retail, Distribution & Consumer Research. 1994, Routledge, Ltd. p. 195.
38. Burt, S. and L. Sparks, Performance in food retailing: A cross-national consideration and comparison of retail margins., in British Journal of Management. 1997, Blackwell Publishing Limited. p. 133.
39. Burt, S.L. and L. Sparks, Branding Experiences: Corporate Branding in Retail., in Corporate Reputation Review. 2002, Henry Stewart Publications. p. 193.
40. Burt, S.L. and L. Sparks, Power and Competition in the UK Retail Grocery Market., in British Journal of Management. 2003, Blackwell Publishing Limited. p. 237-254.
41. Burton, J., Retail Rents – Fair and Free Market. 1992, Adam Smith Institute: London.
42. Chain-Store Age, Managing the Store-Development Process., in Chain Store Age. 2002, Lebhar - Friedman Inc. p. 2B.
43. Clarkin, J., Beating Goliath., in Business & Economic Review. 1998, Division of Research. p. 15.
44. Coca-Cola Retailing Research Group Europe, Supplier-Retailer Collaboration in Supply Chain Management. 1994, GEA CONSULENTI ASSOCIATI DI GESTIONE AZIENDALE.
Assessing the Productivity of the UK Retail Sector
109
45. Comish, N.H., RETAIL STORE OPERATING RESULTS AS GUIDES FOR SMALL MERCHANTS., in Journal of Marketing. 1946, American Marketing Association. p. 62.
46. Cox, R., THE MEANING AND MEASUREMENT OF PRODUCTIVITY IN DISTRIBUTION., in Journal of Marketing. 1948, American Marketing Association. p. 433.
47. Crafts, N. and M. O'Mahony, A perspective on UK productivity performance. Fiscal Studies., 2001. 22(3): p. 271-307.
48. Criscuolo, C. and J. Haskel. Innovations and Productivity Growth in the UK. in ONS/DTI Retail Productivity Workshop. 2002.
49. Crosby, N. and S. Murdoch, Changing Lease Structures in Commercial Property Markets. 1998, Royal Institute of Chartered Surveyors: London.
50. Daffin, C. and E. Lau. Labour Productivity Measures from the Annual Business Inquiry. in ONS/DTI Productivity Workshop. 2002.
51. Daffin, C. and E. Lau, Labour Productivity Measures from the Annual Business Inquiry.
52. Daffin, C., G. Reed, and P. Vaze, Labour productivity measures for the non-production industries. Economic Trends, 2002. 579.
53. Davies, R.L., Retail Planning Policies in Western Europe. 1995, London: Routledge.
54. Davies, R.L., Planning Policy for Retailing, in Retail Strategy; The View from the Bridge, J. Reynolds and C. Cuthbertson, Editors. 2003, Butterworth-Heinemann: Oxford.
55. Dawson, J., Innovation, New Commerce and European Retailing: The next five years., in European Retail Digest. 2001, Templeton College. p. 13.
56. Dawson, J.A. and D.A. Kirby, Shop Size and Productivity in British Retailing in the 1960s., in European Journal of Marketing. 1977, Emerald. p. 262.
57. DeLong, J.B., Productivity Growth in the2000s. 2002.
58. Deutsche Bank Research, Global Food Retailing part 1. 1999, Deutsche Bank: London.
59. Doms, M., R. Jarmin, and S. Klimek. IT Investment and Firm Performance in US Retail Trade. in OECD Workshop on Firm Level Statistics. 2001: OECD.
60. Donthu, N. and B. Yoo, Retail productivity assessment using data envelopment analysis., in Journal of Retailing. 1998, Elsevier Science Publishing Company, Inc. p. 88.
61. Doody, A.F. and W.R. Davidson, Growing Strength in Small Retailing., in Harvard Business Review. 1964, Harvard Business School Publication Corp. p. 69.
62. Doutt, J.T., Productivity In Fast-Food Retailing., in American Journal of Small Business. 1977, Entrepreneurship Theory & Practice. p. 50.
63. Doutt, J.T., Comparative Productivity Performance in Fast-Food Retail Distribution., in Journal of Retailing. 1984, Elsevier Science Publishing Company, Inc. p. 98.
64. Dragun, D., Stuck in the Middle--or in the Muddle?: Europe's leading retailers in the global value landscape., in European Retail Digest. 2003, Templeton College. p. 1.
65. Drew, C., et al., International Comparisons of Productivity - an update on developments. Economic Trends, 2001. 570.
66. Drew, S. and R. Pike, Experimental Monthly Index of Services. Economic Trends, 2002. 583.
67. Droms, W.G., C.W. Miller, and G.A. Lacerte, A Financial Profile Of Small Retailing Firms., in American Journal of Small Business. 1979, Entrepreneurship Theory & Practice. p. 42.
68. Dubelaar, C., M. Bhargava, and D. Ferrarin, Measuring retail productivity What really matters?, in Journal of Business Research. 2002. p. 417.
69. Economic Classification Policy Committee, Services Classifications. 1994, U.S. Department of Commerce, Bureau of Economic Analysis: Washington, DC.
Assessing the Productivity of the UK Retail Sector
110
70. Editorial, The Wal-Martization of America, in New York Times. 2003.
71. European Commission. Economic overview of the commerce and distribution sector. in Overview of the Retail Sector Seminar. 2003. London: Department of Trade and Industry.
72. Fenton, T., et al., Methodology of the experimental monthly index of services. 2003.
73. Fiorito, S.S. and R.W. LaForge, A Marketing Strategy Analysis of Small Retailers., in American Journal of Small Business. 1986, Entrepreneurship Theory & Practice. p. 7.
74. Forward, R., Twenty Trends for 2010: Retailing in an Age of Uncertainty. 2003, Retail Forward Inc.
75. Foster, L., J. Haltiwanger, and C.J. Krizan, Aggregate Productivity Growth: Lessons from Microeconomic Evidence. 1998.
76. Foster, L., J. Haltiwanger, and C.J. Krizan, The Link Between Aggregate and Micro Productivity Growth: Evidence from Retail Trade. 2002.
77. Fuchs, V.R., A STATISTICAL ANALYSIS OF PRODUCTIVITY IN SELECTED SERVICE INDUSTRIES IN THE UNITED STATES, 1939-63., in Review of Income & Wealth. 1966, Blackwell Publishing Limited. p. 211.
78. Gadrey, J., The embeddedness of service `products' in value systems., in Journal of Socio-Economics. 1994, Elsevier Science Publishing Company, Inc. p. 261.
79. Gadrey, J. and F. Jany-Catrice, The Retail Sector: Why so Many Jobs in America and so Few in France?, in Service Industries Journal. 2000, Frank Cass & Company Ltd. p. 21.
80. Gadrey, J., F. Jany-Catrice, and T. Ribault, Levels and systems of employment in the Japanese retail trade: a comparison with France., in Cambridge Journal of Economics. 2001, Oxford University Press / UK.
81. George, K.D. and T. Ward, PRODUCTIVITY GROWTH IN THE RETAIL TRADE., in Oxford Bulletin of Economics & Statistics. 1973, Blackwell Publishing Limited. p. 31.
82. Gestrin, M., The Globalisation of Retail: On Your Marks …. European Retail Digest, 2000(26): p. 6.
83. Gonzalez, L., L'incidence du recours a l'interim sur la mesure de la productivite du travail des brances industrielles. Economie et Statistique, 2002. 357-358: p. 103-137.
84. Good, W.S., Productivity in the Retail Grocery Trade., in Journal of Retailing. 1984, Elsevier Science Publishing Company, Inc. p. 81.
85. Goodman, C.S., Comment: On Output Measures of Retail Performance. Journal of Retailing, 1985. 61(3): p. 77-82.
86. Grether, E.T., Distribution's Place in the American Economy since 1969/Retail Trading in Britain 1850-1950/Productivity in the Distributive Trade in Europe (Book). in American Economic Review. 1956, American Economic Association. p. 1020.
87. Griffith, R., et al., The UK Productivity Gap and the Importance of the Service Sectors. 2003, AIM.
88. Gullickson, W. and M.J. Harper, Bias in aggregate productivity trends revisited. Monthly Labor Review, 2002(March): p. 32-40.
89. Guy, C.M., The Retail Development Process. 1994, London: Routledge.
90. Guy, C.M., The Retail Development Process: Location, Property & Planning. 1994, London: Routledge.
91. Guy, C.M. and J.D. Lord, Comparative retail structure of British and American Cities. International Review of Retail, Distribution and Consumer Research, 1991. 1(4): p. 391-453.
92. Guy, C.M. and J.D. Lord, Transformation and the City Centre, in Retail Change: Contemporary Issues, R.D.F. Bromley and C.J. Thomas, Editors. 1993, UCL Press: London.
Assessing the Productivity of the UK Retail Sector
111
93. Hall, M. and C. Winsten, THE PATTERN OF VARIATION OF RETAIL MARGINS., in Bulletin of the Oxford University Institute of Economics & Statistics. 1963, Blackwell Publishing Limited. p. 283.
94. Haltiwanger, J., R. Jarmin, and T. Schank, Productivity, Investment in ICT and Market Experimentation: Micro Evidence from Germany and the U.S. 2003, Center for Economic Studies.
95. Hardy, K.G. and A.J. Magrath, Buying groups: clout for small businesses., in Harvard Business Review. 1987, Harvard Business School Publication Corp. p. 16.
96. Harley, E. and J. Owen, International Comparisons of Productivity and Wages. Economic Trends, 1998(January).
97. Haskel, J. and N. Khawaja, Productivity in UK Retailing: Evidence from Micro Data. 2003, CeRiBA: London.
98. Haskel, J. and S. Pereira. Skills and productivity in the UK using matched firm and worker data. in ONS/DTI Productivity Workshop. 2002.
99. Hogg, S., D. Medway, and G. Warnaby, Business improvement districts: an opportunity for SME retailing., in International Journal of Retail & Distribution Management. 2003, Emerald. p. 466.
100. Hubertus, J., Distributive Trade Statistics. 2002, Eurostat: Brussels.
101. Hughes, M.A. and R.R. Serpkenci, Comments on 'Labor Productivity in Retailing', in Journal of Marketing. 1985, American Marketing Association.
102. Humphries, G., Prospects for food discounters and warehouse clubs: growth or decline? 1995, Pearson: London.
103. Ingene, C.A., Labor Productivity in Retailing., in Journal of Marketing. 1982, American Marketing Association.
104. Ingene, C.A., Productivity and Functional Shifting in Spatial Retailing: Private and Social Perspectives., in Journal of Retailing. 1984, Elsevier Science Publishing Company, Inc. p. 15.
105. Ingene, C.A., Labor Productivity in Retailing: What Do We Know and How Do We Know It?, in Journal of Marketing. 1985, American Marketing Association.
106. Ingene, C.A. and R.F. Lusch, A MODEL OF RETAIL STRUCTURE., in Research in Marketing. 1981. p. 101.
107. Ingene, C.A. and R.F. Lusch, Estimation of a department store production function., in International Journal of Physical Distribution & Logistics Management. 1999, Emerald. p. 453.
108. INSEE, Image Economiques des Entreprises et des Groupes au 1 janvier 2001. 2003, INSEE: Paris.
109. Institute for Retail Studies, Competitive Analysis of the Retail Sector in the UK. 2003, University of Stirling: Striling.
110. Johnson, B.C., Retail: the Wal-Mart effect., in McKinsey Quarterly. 2002, McKinsey & Company, Inc. p. 40.
111. Kamakura, W.A. and T. Lenartowicz, Productivity assessment of multiple retail outlets., in Journal of Retailing. 1996, Elsevier Science Publishing Company, Inc. p. 333.
112. Kay, J., Economics in Action, in Financial Times. 2003.
113. Kean, R., et al., Effects of community characteristics, business environment, and competitive strategies on rural... in Journal of Small Business Management. 1998, Blackwell Publishing Limited. p. 45.
114. Keh, H.T., The classification of distribution channel output: a review., in International Review of Retail, Distribution & Consumer Research. 1997, Routledge, Ltd. p. 145.
Assessing the Productivity of the UK Retail Sector
112
115. Keh, H.T. and S. Chu, Retail productivity and scale economies at the firm level: a DEA approach., in Omega (Oxford). 2003. p. 75.
116. Kent, T., C. Dennis, and S. Tanton, An evaluation of mentoring for SME retailers., in International Journal of Retail & Distribution Management. 2003, Emerald. p. 440.
117. Klimek, S.D., R.S. Jarmin, and M.E. Doms, IT Investment and Firm Performance in U.S. Retail Trade. 2002.
118. Konopa, L.J., An Analysis of Some Changes in Retailing Productivity Between 1948 and 1963., in Journal of Retailing. 1968, Elsevier Science Publishing Company, Inc. p. 57.
119. Koretz, G., Productivity: A Retail Link. Business Week, 2002.
120. Kurt Salmon Associates, Efficient Consumer Response: Enhancing Consumer Value in theGrocery Industry,. 1993, American Meat Institute, Food Marketing Institute, Grocery Manufacturers ofAmerica, National Food Brokers Association, Uniform Code Council.
121. Kuwahara, H., Concentration and productivity in the retail trade in Japan., in International Review of Retail, Distribution & Consumer Research. 1997, Routledge, Ltd. p. 109.
122. Lau, E. and P. Vaze. Accounting growth: capital, skills and output. in OST/DTI Productivity Workshop. 2002.
123. Lee, D.R., Labor Market Dynamics in the U.S. Food Sector., in American Journal of Agricultural Economics. 1988, Blackwell Publishing Limited. p. 90.
124. Lee, J. and J. Runge, ADOPTION OF INFORMATION TECHNOLOGY IN SMALL BUSINESS: TESTING DRIVERS OF ADOPTION FOR ENTREPRENEURS., in Journal of Computer Information Systems. 2001, International Association for Computer Information Systems. p. 44.
125. LeHew, M.L.A. and A.E. Fairhurst, US shopping mall attributes: an exploratory investigation of their relationship to retail productivity., in International Journal of Retail & Distribution Management. 2000, Emerald. p. 261.
126. Lembersky, M.R., Enhancing point-of-sale productivity and satisfaction in retail stores., in European Journal of Operational Research. 1991. p. 325.
127. Lemmink, J. and J. Mattsson, Warmth during non-productive retail encounters: the hidden side of productivity., in International Journal of Research in Marketing. 1998. p. 505.
128. London Economics, Rip-Off Britain. Myths and Realities. 2000, British Retail Consortium: London.
129. Lusch, R.F. and S.Y. Moon, An Exploratory Analysis of the Correlates of Labor Productivity in Retialing., in Journal of Retailing. 1984, Elsevier Science Publishing Company, Inc. p. 37.
130. Lusch, R.F. and R.R. Serpkenci, Personal differences, job tension, job outcomes, and store... in Journal of Marketing. 1990, American Marketing Association. p. 85.
131. MacKenzie, J.J., R.C. Dower, and D.T. Chen, The Going Rate: What It Really Costs to Drive. 1992, World Resources Institute: Washington, D. C.
132. Mark, J.A., Measuring productivity in service industries., in Monthly Labor Review. 1982, Department of Labor. p. 3.
133. Mason, G., High Skills Utilisation Under Mass Higher Education: graduate employment in service industries in Britain. Journal of Education and Work, 2002. 15(4).
134. Masurel, E. and R. Janszen, The relationship between SME cooperation and market concentration: Evidence from small retailers... in Journal of Small Business Management. 1998, Blackwell Publishing Limited. p. 68.
135. McAnally, A.P., INVESTMENT AND PRODUCTIVITY IN RETAILING., in Journal of Industrial Economics. 1966, Blackwell Publishing Limited. p. 1.
136. McGoldrick, P., Retail Marketing. 2002, Maidenhead: McGraw Hill.
Assessing the Productivity of the UK Retail Sector
113
137. McGoldrick, P., Retail Marketing. 2002, London: McGraw-Hill.
138. McKinsey Global Institute, Driving Productivity and Growth in the UK Economy. 1998, McKinsey.
139. Miller, N.J., et al., Community and managerial predictors of performance in small rural US retail and service firms., in Journal of Retailing & Consumer Services. 2003. p. 215.
140. Mintel Retail Intelligence, Food Retailing in Europe - Italy. 2002.
141. Morrison, A. and C. Lashley, A Franchise: A Resource-Rich Small Service Firm?, in Service Industries Journal. 2003, Frank Cass & Company Ltd. p. 135-149.
142. NAICS Committee, Proposed New Industry Structure for Retail Trade and Wholesale Trade. 1995, US Department of Commerce.
143. Nakamura, L.I., The measurement of retail output and the retail revolution., in Canadian Journal of Economics. 1999, Blackwell Publishing Limited. p. 408.
144. National Statistics, International Comparisons of Productivity. Economic Trends, 2001. 577.
145. National Statistics, GDP: Measuring the UK's economic activity. 2002.
146. National Statistics, Productivity 2nd quarter 2003. 2003.
147. National Statistics, International Comparisons of Productivity: Little Change in UK Performance. 2003.
148. National Statistics, Productivity: Making international comparisons. 2003.
149. Nooteboom, B., Costs, margins and competition: Causes of structural change in retailing., in International Journal of Research in Marketing. 1986. p. 233.
150. OECD, The Service Economy. 2000.
151. OECD, ASSESSING BARRIERS TO TRADE IN SERVICES: RETAIL TRADE SERVICES. 2000.
152. O'Mahony, M. and W. de Boer, Britain's relative productivity performance: updates to 1999. 2002, NIESR.
153. Parker, C., T. Anthony-Winter, and D. Tabernacle, Learning by stealth: introducing smaller retailers to the benefits of training and education in Barnet., in International Journal of Retail & Distribution Management. 2003, Emerald. p. 470.
154. Pilat, D., Labour productivity levels in OECD countries - Estimates for manufacturing and selected service sector. 1996.
155. Pilat, D., Regulation and Performance in the Distribution Sector. 1997.
156. Pilat, D. International comparisons of productivity - key findings and measurement issues. in ONS/DTI Productivity Workshop. 2002.
157. Pilat, D., F. Lee, and B. Van Ark, PRODUCTION AND USE OF ICT: A SECTORAL PERSPECTIVE ON PRODUCTIVITY GROWTH IN THE OECD AREA., in OECD Economic Studies. 2002, Organisation for Economic Cooperation & Development. p. 47-78.
158. Ratchford, B.T., Has the productivity of retail food stores really declined?, in Journal of Retailing. 2003, Elsevier Science Publishing Company, Inc. p. 171.
159. Ratchford, B.T. and J.R. Brown, A STUDY OF PRODUCTIVITY CHANGES IN FOOD RETAILING., in Marketing Science. 1985, INFORMS: Institute for Operations Research. p. 292.
160. Ratchford, B.T. and G.T. Stoops, A Model and Measurement Approach For Studying Retail Productivity., in Journal of Retailing. 1988, Elsevier Science Publishing Company, Inc. p. 233.
161. Ratchford, B.T. and G.T. Stoops, An Econometric Model of a Retail Firm., in Managerial & Decision Economics. 1992. p. 223.
Assessing the Productivity of the UK Retail Sector
114
162. Reardon, J. and R. Hasty, The effect of information technology on productivity in... in Journal of Retailing. 1996, Elsevier Science Publishing Company, Inc. p. 445.
163. Reardon, J. and I. Vida, Measuring retail productivity: monetary vs physical input measures., in International Review of Retail, Distribution & Consumer Research. 1998, Routledge, Ltd.
164. Reidiboym, M., Hard et soft discount: les nouvelles frontieres. Libre-Service Actualites, 2001(1732): p. 48-55.
165. Reinartz, W.J. and V. Kumar, Store-, Market-, and Consumer-Characteristics: The Drivers of Store Performance., in Marketing Letters. 1999. p. 5.
166. Retail Intelligence, Department stores in Europe. 2000, Retail Intelligence: London.
167. Reynolds, J., The Case for Better Retail Planning Statistics. 1987, Oxford Institute of Retail Management: Oxford.
168. Reynolds, J., Who's Afraid of RFID? BRC Solutions, 2003. September.
169. Samiee, S., Productivity Planning and Strategy in Retailing., in California Management Review. 1990, California Management Review. p. 54.
170. Santos-Requejo, L. and O. Gonzalez-Benito, Economic Success Factors in Spanish Small Retail Businesses. An Analysis Based on Sector-Relative Definitions., in Small Business Economics. 2000. p. 209.
171. Scarpetta, S., et al., ECONOMIC GROWTH IN THE OECD AREA: RECENT TRENDS AT THE AGGREGATE AND SECTORAL LEVEL. 2000.
172. Scarpetta, S. and T. Tressel, Productivity and Convergence in a Panel of OECD Industries : Do Regulations and Institutions Matter? 2002.
173. Seguin, S., Le grand commerce specialise s'affirme face aux hypermarches. Economie et Statistique, 2001. 344: p. 109-129.
174. Silvestro, R. and S. Cross, Applying the service profit chain in a retail environment., in International Journal of Service Industry Management. 2000, Emerald. p. 244.
175. Sim, L.L., Restructuring the small-scale retail sector in Singapore., in International Journal of Retail & Distribution Management. 1999, Emerald. p. 83.
176. Smith, A.D. and D.M.W.N. Hitchens, Productivity in the distributive trades: a comparison of Britain, America and Germany. National Institute of Economic and Social Research Occasional Paper. 1985, Cambridge: Cambridge University Press.
177. Smith, M.J. and A.D. Bayehi, Do ergonomics improvements increase computer workers' productivity?: an intervention study in a call centre., in Ergonomics. 2003, Taylor & Francis Ltd. p. 3.
178. Steiner, R.L., MARKETING PRODUCTIVITY IN CONSUMER GOODS INDUSTRIES--A Vertical Perspective., in Journal of Marketing. 1978, American Marketing Association.
179. Takeuchi, H. and L.P. Bucklin, Productivity in Retailing: Retail Structure and Public Policy., in Journal of Retailing. 1977, Elsevier Science Publishing Company, Inc. p. 35.
180. ten Raa, T. and R. Schettkat, The Growth of Service Industries: The Paradox of Exploding Costs and Persistent Demand. 2001: Edward Elgar. 240.
181. The Work Foundation, From Productivity to Performance: The Missing Link. 2003, The Work Foundation.
182. Thurik, A.R., Labour Productivity, Economies of Scale and Opening Time in Large Retail Establishments., in Service Industries Journal. 1984, Frank Cass & Company Ltd. p. 19.
183. Thurik, A.R. and A.J.M. Kleijweg, PROCYCLICAL RETAIL LABOUR PRODUCTIVITY., in Bulletin of Economic Research. 1986, Blackwell Publishing Limited. p. 169.
Assessing the Productivity of the UK Retail Sector
115
184. Thurik, R. and P. Kooiman, Research Note: Modelling Retail Floorspace Productivity., in Journal of Retailing. 1986, Elsevier Science Publishing Company, Inc. p. 431.
185. Thurik, R. and N. Van Der Wijst, Part-Time Labor in Retailing., in Journal of Retailing. 1984, Elsevier Science Publishing Company, Inc. p. 62.
186. Tilley, R.P.R. and R. Hicks, ECONOMIES OF SCALE IN SUPERMARKETS., in Journal of Industrial Economics. 1970, Blackwell Publishing Limited. p. 1.
187. Triplett, J.E., Economic Statistics, the New Economy, and the Productivity Slowdown., in Business Economics. 1999, National Association of Business Economics. p. 13.
188. Tucker, K.A., ECONOMIES OF SCALE IN RETAILING: A NOTE., in Journal of Industrial Economics. 1972, Blackwell Publishing Limited. p. 291.
189. Van Ark, B., R. Inklaar, and R.H. McGuckin, "Changing Gear". Productivity, ICT and Service Industries: Europe and the United States. 2002, The Conference Board: Washington.
190. Van Ark, B. and E. Monnikhof, Productivity in services: An international comparative perspective., in Canadian Journal of Economics. 1999, Blackwell Publishing Limited. p. 471.
191. Waldorf, W.H., LABOR PRODUCTIVITY IN FOOD WHOLESALING AND RETAILING, 1929-1958., in Review of Economics & Statistics. 1966, MIT Press. p. 88.
192. Walton, R., International comparisons of profitability. Economic Trends, 2000. 554.
193. Watkin, D.G., TOWARD A COMPETITIVE ADVANTAGE: A FOCUS STRATEGY FOR SMALL RETAILERS., in Journal of Small Business Management. 1986, Blackwell Publishing Limited. p. 9.
194. Watson, R.H., L.C. Lockley, and S.H. Britt, Communications., in Journal of Marketing. 1951, American Marketing Association. p. 479.
195. Weliwita, S.M.A. and S.E. Miller, The Production Structure of Food Retailing in the United States: An Initial Inquiry., in Agribusiness. 1992. p. 121.
196. Welsh, R., et al., The challenge to c-stores: Edinburgh South Asian responses., in International Journal of Retail & Distribution Management. 2003, Emerald. p. 408.
197. Woodruff, R.B., Customer Value: the next source for competitive advantage. Journal of the Academy of Marketing Science, 1997. 25(2): p. 139-153.